Cities with the Highest Percentage of Immigrants from Northern Africa in Minnesota
RELATED REPORTS & OPTIONS
Northern Africa
Minnesota
Compare Cities
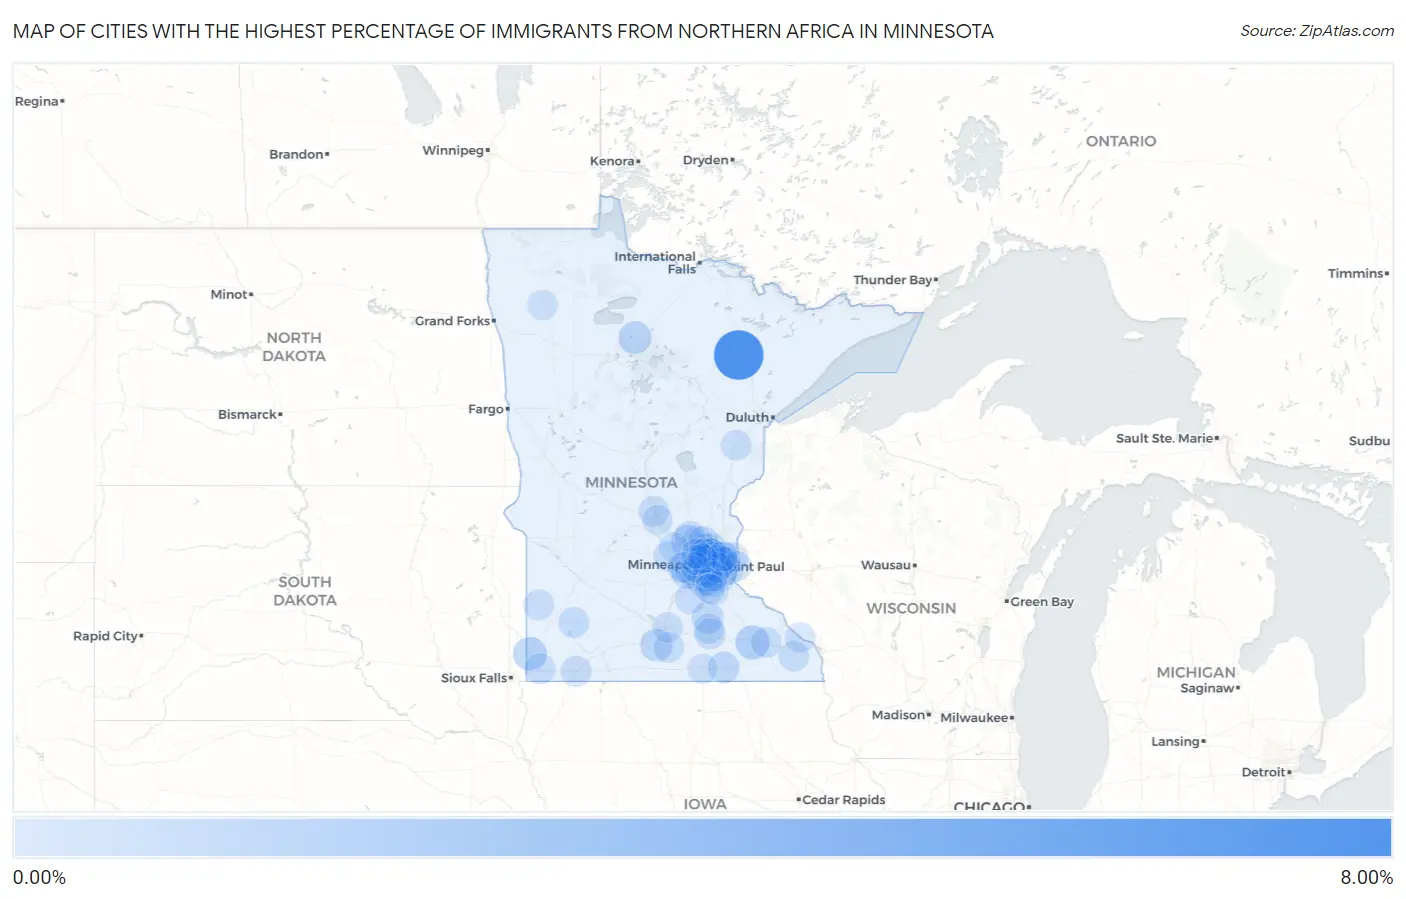
Map of Cities with the Highest Percentage of Immigrants from Northern Africa in Minnesota
0.00%
8.00%
Cities with the Highest Percentage of Immigrants from Northern Africa in Minnesota
| City | Northern Africa | vs State | vs National | |
| 1. | Kinney | 6.99% | 0.11%(+6.88)#-1 | 0.13%(+6.87)#0 |
| 2. | Hilltop | 2.89% | 0.11%(+2.77)#36 | 0.13%(+2.76)#822 |
| 3. | Rochester | 1.34% | 0.11%(+1.22)#37 | 0.13%(+1.21)#823 |
| 4. | Jasper | 1.19% | 0.11%(+1.07)#38 | 0.13%(+1.06)#824 |
| 5. | Otsego | 0.90% | 0.11%(+0.785)#39 | 0.13%(+0.772)#825 |
| 6. | Blackduck | 0.89% | 0.11%(+0.774)#40 | 0.13%(+0.761)#826 |
| 7. | Fridley | 0.88% | 0.11%(+0.770)#43 | 0.13%(+0.757)#1,119 |
| 8. | Vernon Center | 0.83% | 0.11%(+0.714)#44 | 0.13%(+0.701)#1,120 |
| 9. | New Hope | 0.65% | 0.11%(+0.533)#45 | 0.13%(+0.520)#1,121 |
| 10. | Faribault | 0.61% | 0.11%(+0.496)#46 | 0.13%(+0.483)#1,122 |
| 11. | Eden Prairie | 0.59% | 0.11%(+0.478)#47 | 0.13%(+0.465)#1,123 |
| 12. | Austin | 0.55% | 0.11%(+0.440)#48 | 0.13%(+0.427)#1,124 |
| 13. | Edina | 0.51% | 0.11%(+0.400)#49 | 0.13%(+0.387)#1,213 |
| 14. | Falcon Heights | 0.50% | 0.11%(+0.382)#50 | 0.13%(+0.370)#1,214 |
| 15. | Columbia Heights | 0.45% | 0.11%(+0.334)#51 | 0.13%(+0.322)#1,215 |
| 16. | Vadnais Heights | 0.39% | 0.11%(+0.274)#52 | 0.13%(+0.261)#1,216 |
| 17. | Bloomington | 0.35% | 0.11%(+0.234)#53 | 0.13%(+0.221)#1,217 |
| 18. | Blaine | 0.34% | 0.11%(+0.228)#54 | 0.13%(+0.215)#1,218 |
| 19. | South St Paul | 0.32% | 0.11%(+0.201)#55 | 0.13%(+0.188)#1,219 |
| 20. | Tracy | 0.30% | 0.11%(+0.184)#56 | 0.13%(+0.172)#1,220 |
| 21. | Luverne | 0.29% | 0.11%(+0.170)#57 | 0.13%(+0.158)#1,221 |
| 22. | Waverly | 0.28% | 0.11%(+0.163)#58 | 0.13%(+0.150)#1,222 |
| 23. | Worthington | 0.27% | 0.11%(+0.160)#59 | 0.13%(+0.147)#1,223 |
| 24. | Spring Lake Park | 0.27% | 0.11%(+0.158)#60 | 0.13%(+0.145)#1,224 |
| 25. | Owatonna | 0.25% | 0.11%(+0.135)#61 | 0.13%(+0.123)#1,225 |
| 26. | Mound | 0.23% | 0.11%(+0.112)#62 | 0.13%(+0.099)#1,226 |
| 27. | Rushford | 0.22% | 0.11%(+0.106)#63 | 0.13%(+0.093)#1,227 |
| 28. | Sartell | 0.21% | 0.11%(+0.092)#64 | 0.13%(+0.079)#1,228 |
| 29. | Coon Rapids | 0.20% | 0.11%(+0.088)#65 | 0.13%(+0.075)#1,229 |
| 30. | Maplewood | 0.20% | 0.11%(+0.086)#66 | 0.13%(+0.073)#1,230 |
| 31. | Eyota | 0.19% | 0.11%(+0.077)#67 | 0.13%(+0.064)#1,231 |
| 32. | Savage | 0.19% | 0.11%(+0.076)#68 | 0.13%(+0.064)#1,232 |
| 33. | Moose Lake | 0.18% | 0.11%(+0.068)#69 | 0.13%(+0.055)#1,233 |
| 34. | Mapleton | 0.18% | 0.11%(+0.065)#70 | 0.13%(+0.052)#1,234 |
| 35. | Inver Grove Heights | 0.18% | 0.11%(+0.062)#71 | 0.13%(+0.049)#1,235 |
| 36. | New Prague | 0.17% | 0.11%(+0.057)#72 | 0.13%(+0.044)#1,236 |
| 37. | Ivanhoe | 0.17% | 0.11%(+0.053)#73 | 0.13%(+0.041)#1,237 |
| 38. | Woodbury | 0.17% | 0.11%(+0.052)#74 | 0.13%(+0.039)#1,238 |
| 39. | Shoreview | 0.16% | 0.11%(+0.049)#75 | 0.13%(+0.036)#1,239 |
| 40. | Mahtomedi | 0.16% | 0.11%(+0.046)#76 | 0.13%(+0.034)#1,240 |
| 41. | New Brighton | 0.16% | 0.11%(+0.041)#77 | 0.13%(+0.028)#1,241 |
| 42. | Minneapolis | 0.15% | 0.11%(+0.036)#78 | 0.13%(+0.023)#1,242 |
| 43. | Stillwater | 0.15% | 0.11%(+0.035)#79 | 0.13%(+0.023)#1,243 |
| 44. | Ramsey | 0.14% | 0.11%(+0.029)#80 | 0.13%(+0.017)#1,244 |
| 45. | Little Canada | 0.14% | 0.11%(+0.026)#81 | 0.13%(+0.014)#1,245 |
| 46. | Andover | 0.13% | 0.11%(+0.020)#82 | 0.13%(+0.007)#1,246 |
| 47. | Oakdale | 0.13% | 0.11%(+0.014)#83 | 0.13%(+0.001)#1,247 |
| 48. | Burnsville | 0.13% | 0.11%(+0.013)#84 | 0.13%(+0.001)#1,248 |
| 49. | Lakeland | 0.12% | 0.11%(+0.007)#85 | 0.13%(-0.005)#1,249 |
| 50. | Minnetrista | 0.12% | 0.11%(+0.005)#86 | 0.13%(-0.008)#1,250 |
| 51. | Robbinsdale | 0.12% | 0.11%(+0.003)#87 | 0.13%(-0.010)#1,251 |
| 52. | Victoria | 0.11% | 0.11%(-0.002)#88 | 0.13%(-0.015)#1,252 |
| 53. | Brooklyn Center | 0.11% | 0.11%(-0.009)#89 | 0.13%(-0.022)#1,253 |
| 54. | North St Paul | 0.10% | 0.11%(-0.010)#90 | 0.13%(-0.023)#1,254 |
| 55. | Farmington | 0.10% | 0.11%(-0.013)#91 | 0.13%(-0.025)#1,255 |
| 56. | St Paul | 0.097% | 0.11%(-0.017)#92 | 0.13%(-0.030)#1,256 |
| 57. | Elk River | 0.093% | 0.11%(-0.022)#93 | 0.13%(-0.035)#1,257 |
| 58. | Brooklyn Park | 0.089% | 0.11%(-0.025)#94 | 0.13%(-0.038)#1,258 |
| 59. | Mounds View | 0.084% | 0.11%(-0.031)#95 | 0.13%(-0.043)#1,259 |
| 60. | Mankato | 0.083% | 0.11%(-0.031)#96 | 0.13%(-0.044)#1,260 |
| 61. | Medford | 0.079% | 0.11%(-0.035)#97 | 0.13%(-0.048)#1,261 |
| 62. | Shorewood | 0.078% | 0.11%(-0.037)#98 | 0.13%(-0.050)#1,262 |
| 63. | Richfield | 0.071% | 0.11%(-0.044)#99 | 0.13%(-0.057)#1,263 |
| 64. | St Cloud | 0.064% | 0.11%(-0.051)#100 | 0.13%(-0.064)#1,264 |
| 65. | Winona | 0.061% | 0.11%(-0.053)#101 | 0.13%(-0.066)#1,265 |
| 66. | Minnetonka | 0.050% | 0.11%(-0.064)#102 | 0.13%(-0.077)#1,266 |
| 67. | Apple Valley | 0.050% | 0.11%(-0.064)#103 | 0.13%(-0.077)#1,267 |
| 68. | Plymouth | 0.036% | 0.11%(-0.078)#104 | 0.13%(-0.091)#1,268 |
| 69. | Eagan | 0.032% | 0.11%(-0.082)#105 | 0.13%(-0.095)#1,269 |
| 70. | Crystal | 0.030% | 0.11%(-0.084)#106 | 0.13%(-0.097)#1,270 |
| 71. | Buffalo | 0.025% | 0.11%(-0.090)#107 | 0.13%(-0.103)#1,271 |
| 72. | Maple Grove | 0.023% | 0.11%(-0.092)#108 | 0.13%(-0.105)#1,272 |
| 73. | Thief River Falls | 0.023% | 0.11%(-0.092)#109 | 0.13%(-0.105)#1,273 |
| 74. | Albert Lea | 0.022% | 0.11%(-0.093)#110 | 0.13%(-0.106)#1,274 |
| 75. | Lakeville | 0.017% | 0.11%(-0.098)#111 | 0.13%(-0.110)#1,275 |
| 76. | White Bear Lake | 0.0082% | 0.11%(-0.106)#112 | 0.13%(-0.119)#1,276 |
Common Questions
What are the Top 10 Cities with the Highest Percentage of Immigrants from Northern Africa in Minnesota?
Top 10 Cities with the Highest Percentage of Immigrants from Northern Africa in Minnesota are:
What city has the Highest Percentage of Immigrants from Northern Africa in Minnesota?
Kinney has the Highest Percentage of Immigrants from Northern Africa in Minnesota with 6.99%.
What is the Percentage of Immigrants from Northern Africa in the State of Minnesota?
Percentage of Immigrants from Northern Africa in Minnesota is 0.11%.
What is the Percentage of Immigrants from Northern Africa in the United States?
Percentage of Immigrants from Northern Africa in the United States is 0.13%.