Cities with the Highest Percentage of Immigrants from Northern Africa in Connecticut
RELATED REPORTS & OPTIONS
Northern Africa
Connecticut
Compare Cities
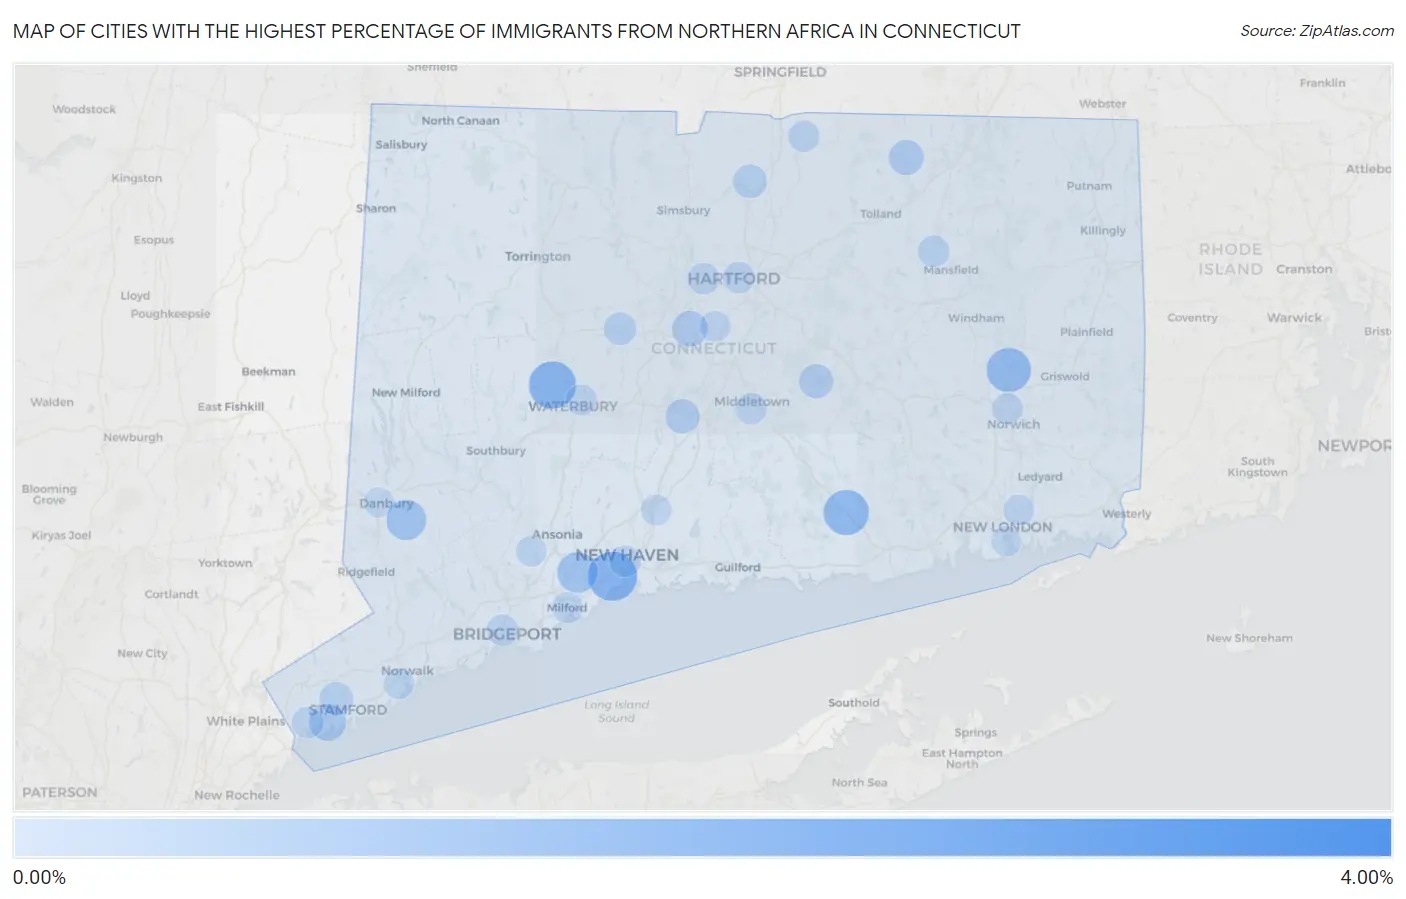
Map of Cities with the Highest Percentage of Immigrants from Northern Africa in Connecticut
0.00%
4.00%
Cities with the Highest Percentage of Immigrants from Northern Africa in Connecticut
| City | Northern Africa | vs State | vs National | |
| 1. | Old Hill | 3.26% | 0.15%(+3.11)#-1 | 0.13%(+3.13)#0 |
| 2. | Rock Ridge | 2.87% | 0.15%(+2.72)#0 | 0.13%(+2.74)#1 |
| 3. | East | 1.58% | 0.15%(+1.43)#1 | 0.13%(+1.45)#2 |
| 4. | West Haven | 1.55% | 0.15%(+1.40)#2 | 0.13%(+1.42)#3 |
| 5. | Oakville | 1.38% | 0.15%(+1.24)#3 | 0.13%(+1.26)#4 |
| 6. | Deep River Center | 1.22% | 0.15%(+1.07)#4 | 0.13%(+1.09)#5 |
| 7. | Baltic | 1.13% | 0.15%(+0.982)#5 | 0.13%(+1.00)#6 |
| 8. | Orange | 0.84% | 0.15%(+0.688)#6 | 0.13%(+0.709)#450 |
| 9. | Bethel | 0.81% | 0.15%(+0.657)#7 | 0.13%(+0.678)#451 |
| 10. | Riverside | 0.53% | 0.15%(+0.380)#8 | 0.13%(+0.400)#452 |
| 11. | Naugatuck Borough | 0.49% | 0.15%(+0.341)#9 | 0.13%(+0.362)#453 |
| 12. | New Britain | 0.46% | 0.15%(+0.313)#10 | 0.13%(+0.333)#454 |
| 13. | Stafford Springs | 0.41% | 0.15%(+0.261)#11 | 0.13%(+0.282)#455 |
| 14. | Lake Pocotopaug | 0.34% | 0.15%(+0.188)#12 | 0.13%(+0.209)#456 |
| 15. | Meriden | 0.33% | 0.15%(+0.180)#13 | 0.13%(+0.201)#457 |
| 16. | Windsor Locks | 0.29% | 0.15%(+0.146)#14 | 0.13%(+0.167)#458 |
| 17. | Stamford | 0.29% | 0.15%(+0.141)#17 | 0.13%(+0.161)#1,078 |
| 18. | Bristol | 0.21% | 0.15%(+0.060)#18 | 0.13%(+0.081)#1,079 |
| 19. | Staples | 0.17% | 0.15%(+0.018)#19 | 0.13%(+0.039)#1,080 |
| 20. | Storrs | 0.14% | 0.15%(-0.012)#20 | 0.13%(+0.009)#1,081 |
| 21. | Greenwich | 0.14% | 0.15%(-0.013)#21 | 0.13%(+0.008)#1,082 |
| 22. | Greens Farms | 0.13% | 0.15%(-0.017)#22 | 0.13%(+0.004)#1,083 |
| 23. | New Haven | 0.12% | 0.15%(-0.027)#23 | 0.13%(-0.006)#1,084 |
| 24. | Hazardville | 0.11% | 0.15%(-0.034)#24 | 0.13%(-0.013)#1,085 |
| 25. | Hartford | 0.11% | 0.15%(-0.035)#25 | 0.13%(-0.014)#1,086 |
| 26. | West Hartford | 0.11% | 0.15%(-0.037)#26 | 0.13%(-0.017)#1,087 |
| 27. | Middletown | 0.11% | 0.15%(-0.042)#27 | 0.13%(-0.021)#1,088 |
| 28. | Bridgeport | 0.10% | 0.15%(-0.045)#28 | 0.13%(-0.024)#1,089 |
| 29. | Norwich | 0.090% | 0.15%(-0.058)#29 | 0.13%(-0.038)#1,090 |
| 30. | Milford City Balance | 0.085% | 0.15%(-0.063)#30 | 0.13%(-0.043)#1,091 |
| 31. | Northford | 0.081% | 0.15%(-0.067)#31 | 0.13%(-0.047)#1,092 |
| 32. | North Haven | 0.070% | 0.15%(-0.078)#32 | 0.13%(-0.057)#1,093 |
| 33. | Waterbury | 0.067% | 0.15%(-0.081)#33 | 0.13%(-0.060)#1,094 |
| 34. | Newington | 0.059% | 0.15%(-0.089)#34 | 0.13%(-0.068)#1,095 |
| 35. | Conning Towers Nautilus Park | 0.048% | 0.15%(-0.100)#35 | 0.13%(-0.079)#1,096 |
| 36. | Norwalk | 0.047% | 0.15%(-0.101)#36 | 0.13%(-0.080)#1,097 |
| 37. | Shelton | 0.041% | 0.15%(-0.107)#37 | 0.13%(-0.086)#1,098 |
| 38. | New London | 0.018% | 0.15%(-0.130)#38 | 0.13%(-0.109)#1,099 |
| 39. | Danbury | 0.0093% | 0.15%(-0.139)#39 | 0.13%(-0.118)#1,100 |
1
2Common Questions
What are the Top 10 Cities with the Highest Percentage of Immigrants from Northern Africa in Connecticut?
Top 10 Cities with the Highest Percentage of Immigrants from Northern Africa in Connecticut are:
#1
1.55%
#2
1.38%
#3
1.22%
#4
1.13%
#5
0.84%
#6
0.81%
#7
0.53%
#8
0.46%
#9
0.41%
#10
0.34%
What city has the Highest Percentage of Immigrants from Northern Africa in Connecticut?
West Haven has the Highest Percentage of Immigrants from Northern Africa in Connecticut with 1.55%.
What is the Percentage of Immigrants from Northern Africa in the State of Connecticut?
Percentage of Immigrants from Northern Africa in Connecticut is 0.15%.
What is the Percentage of Immigrants from Northern Africa in the United States?
Percentage of Immigrants from Northern Africa in the United States is 0.13%.