Cities with the Highest Percentage of Population Employed in Food Preparation & Serving in Hawaii
RELATED REPORTS & OPTIONS
Food Preparation & Serving
Hawaii
Compare Cities
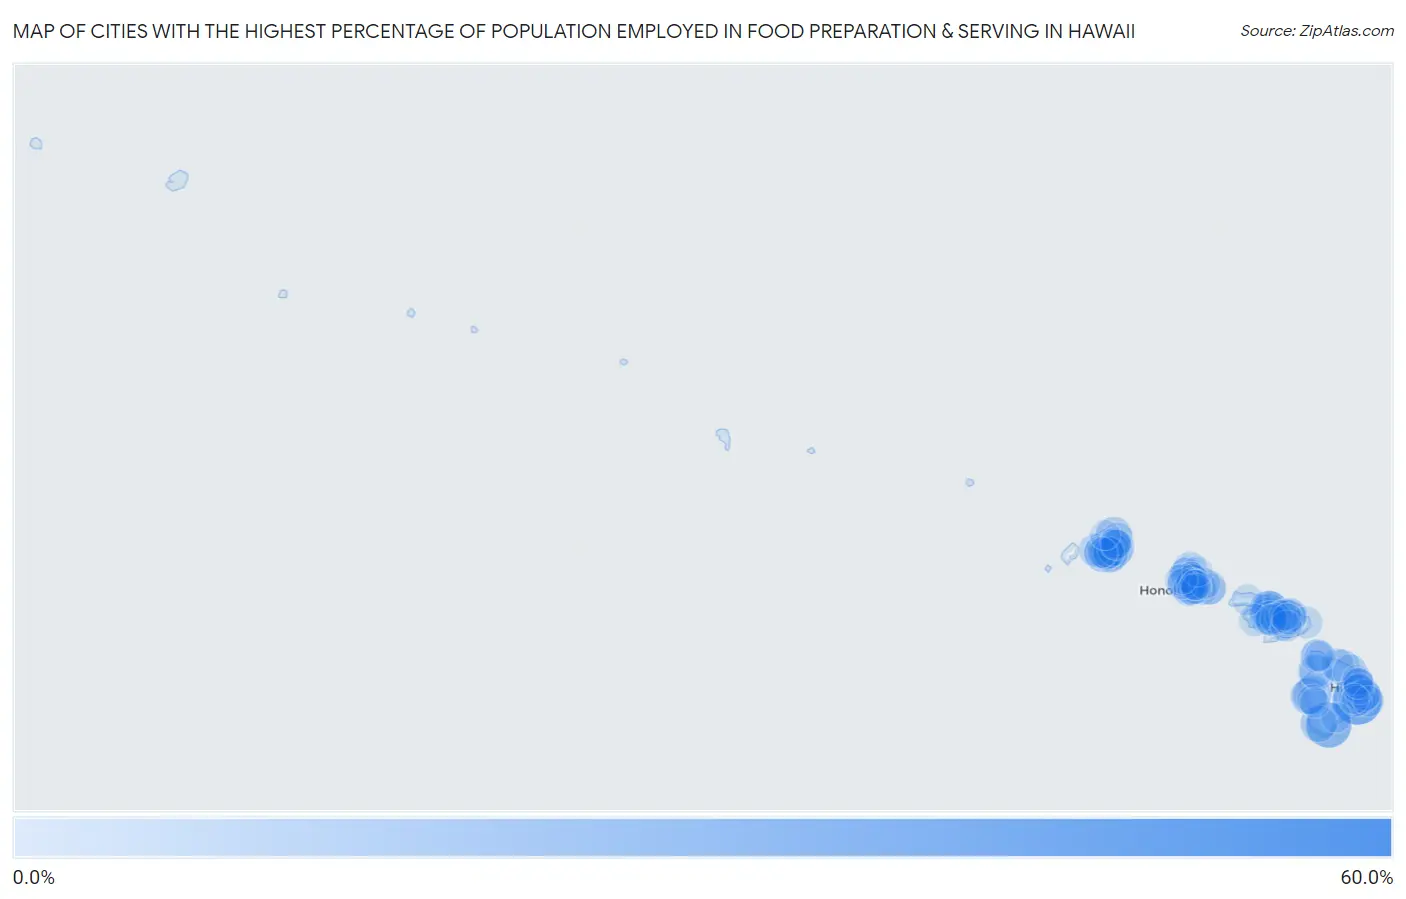
Map of Cities with the Highest Percentage of Population Employed in Food Preparation & Serving in Hawaii
0.0%
60.0%
Cities with the Highest Percentage of Population Employed in Food Preparation & Serving in Hawaii
| City | % Employed | vs State | vs National | |
| 1. | Tiki Gardens | 53.8% | 7.7%(+46.1)#1 | 5.3%(+48.6)#93 |
| 2. | Eden Roc | 36.8% | 7.7%(+29.1)#2 | 5.3%(+31.5)#224 |
| 3. | Waiohinu | 29.9% | 7.7%(+22.1)#3 | 5.3%(+24.6)#351 |
| 4. | Royal Hawaiian Estates | 19.4% | 7.7%(+11.7)#4 | 5.3%(+14.1)#909 |
| 5. | Napili Honokowai | 19.3% | 7.7%(+11.6)#5 | 5.3%(+14.0)#916 |
| 6. | Honalo | 18.1% | 7.7%(+10.3)#6 | 5.3%(+12.8)#1,058 |
| 7. | Lahaina | 17.5% | 7.7%(+9.82)#7 | 5.3%(+12.3)#1,122 |
| 8. | Hawaiian Ocean View | 15.7% | 7.7%(+7.94)#8 | 5.3%(+10.4)#1,478 |
| 9. | Eleele | 15.6% | 7.7%(+7.88)#9 | 5.3%(+10.3)#1,491 |
| 10. | Waimea Cdp Kauai County | 15.2% | 7.7%(+7.43)#10 | 5.3%(+9.87)#1,583 |
| 11. | Kilauea | 15.1% | 7.7%(+7.34)#11 | 5.3%(+9.77)#1,609 |
| 12. | Kahaluu Keauhou | 14.9% | 7.7%(+7.23)#12 | 5.3%(+9.66)#1,653 |
| 13. | Haliimaile | 14.8% | 7.7%(+7.11)#13 | 5.3%(+9.55)#1,678 |
| 14. | Hanamaulu | 14.6% | 7.7%(+6.87)#14 | 5.3%(+9.31)#1,738 |
| 15. | Paauilo | 14.2% | 7.7%(+6.51)#15 | 5.3%(+8.94)#1,851 |
| 16. | Lihue | 13.7% | 7.7%(+6.03)#16 | 5.3%(+8.46)#1,986 |
| 17. | Mahinahina | 13.4% | 7.7%(+5.71)#17 | 5.3%(+8.14)#2,089 |
| 18. | Waikoloa Village | 13.3% | 7.7%(+5.59)#18 | 5.3%(+8.03)#2,137 |
| 19. | Kapalua | 13.3% | 7.7%(+5.54)#19 | 5.3%(+7.97)#2,154 |
| 20. | Koloa | 13.3% | 7.7%(+5.53)#20 | 5.3%(+7.97)#2,157 |
| 21. | Poipu | 13.2% | 7.7%(+5.49)#21 | 5.3%(+7.93)#2,172 |
| 22. | Waimanalo | 12.4% | 7.7%(+4.66)#22 | 5.3%(+7.09)#2,572 |
| 23. | Makawao | 11.9% | 7.7%(+4.18)#23 | 5.3%(+6.62)#2,827 |
| 24. | Lawai | 11.9% | 7.7%(+4.13)#24 | 5.3%(+6.57)#2,851 |
| 25. | Puako | 11.8% | 7.7%(+4.04)#25 | 5.3%(+6.48)#2,891 |
| 26. | Kaiminani | 11.7% | 7.7%(+4.00)#26 | 5.3%(+6.44)#2,927 |
| 27. | Laupahoehoe | 11.4% | 7.7%(+3.67)#27 | 5.3%(+6.11)#3,135 |
| 28. | Kihei | 11.4% | 7.7%(+3.66)#28 | 5.3%(+6.09)#3,147 |
| 29. | Pupukea | 11.4% | 7.7%(+3.65)#29 | 5.3%(+6.08)#3,150 |
| 30. | Waiahole-Waikane | 11.4% | 7.7%(+3.65)#30 | 5.3%(+6.08)#3,151 |
| 31. | Wainaku | 11.2% | 7.7%(+3.44)#31 | 5.3%(+5.88)#3,287 |
| 32. | Kalaheo | 11.1% | 7.7%(+3.42)#32 | 5.3%(+5.86)#3,292 |
| 33. | Kailua Cdp Hawaii County | 11.0% | 7.7%(+3.28)#33 | 5.3%(+5.71)#3,395 |
| 34. | Haiku Pauwela | 11.0% | 7.7%(+3.25)#34 | 5.3%(+5.69)#3,411 |
| 35. | Fern Acres | 10.9% | 7.7%(+3.21)#35 | 5.3%(+5.64)#3,426 |
| 36. | Wahiawa | 10.3% | 7.7%(+2.63)#36 | 5.3%(+5.06)#3,832 |
| 37. | Orchidlands Estates | 10.0% | 7.7%(+2.32)#37 | 5.3%(+4.75)#4,067 |
| 38. | Waikoloa Beach Resort | 10.0% | 7.7%(+2.28)#38 | 5.3%(+4.71)#4,093 |
| 39. | Launiupoko | 10.0% | 7.7%(+2.28)#39 | 5.3%(+4.71)#4,094 |
| 40. | Honokaa | 9.9% | 7.7%(+2.18)#40 | 5.3%(+4.62)#4,189 |
| 41. | Nanakuli | 9.6% | 7.7%(+1.84)#41 | 5.3%(+4.27)#4,481 |
| 42. | Haleiwa | 9.5% | 7.7%(+1.83)#42 | 5.3%(+4.26)#4,496 |
| 43. | Kekaha | 9.3% | 7.7%(+1.58)#43 | 5.3%(+4.01)#4,749 |
| 44. | Urban Honolulu | 9.2% | 7.7%(+1.47)#44 | 5.3%(+3.91)#4,843 |
| 45. | Hawi | 9.1% | 7.7%(+1.42)#45 | 5.3%(+3.85)#4,903 |
| 46. | Anahola | 8.9% | 7.7%(+1.17)#46 | 5.3%(+3.61)#5,201 |
| 47. | Waipio Acres | 8.8% | 7.7%(+1.11)#47 | 5.3%(+3.55)#5,269 |
| 48. | Waimea Cdp Hawaii County | 8.7% | 7.7%(+0.943)#48 | 5.3%(+3.38)#5,478 |
| 49. | Ewa Villages | 8.6% | 7.7%(+0.909)#49 | 5.3%(+3.34)#5,511 |
| 50. | Waialua | 8.5% | 7.7%(+0.822)#50 | 5.3%(+3.26)#5,609 |
| 51. | Ewa Gentry | 8.5% | 7.7%(+0.785)#51 | 5.3%(+3.22)#5,652 |
| 52. | Lanai City | 8.5% | 7.7%(+0.732)#52 | 5.3%(+3.17)#5,718 |
| 53. | Kapaau | 8.4% | 7.7%(+0.637)#53 | 5.3%(+3.07)#5,834 |
| 54. | Waipahu | 8.3% | 7.7%(+0.613)#54 | 5.3%(+3.05)#5,854 |
| 55. | Hana | 8.3% | 7.7%(+0.588)#55 | 5.3%(+3.02)#5,926 |
| 56. | Kalaeloa | 8.2% | 7.7%(+0.521)#56 | 5.3%(+2.95)#6,008 |
| 57. | Kahului | 8.1% | 7.7%(+0.379)#57 | 5.3%(+2.81)#6,202 |
| 58. | Kaumakani | 8.0% | 7.7%(+0.275)#58 | 5.3%(+2.71)#6,351 |
| 59. | Waikapu | 7.9% | 7.7%(+0.229)#59 | 5.3%(+2.66)#6,415 |
| 60. | Olowalu | 7.8% | 7.7%(+0.123)#60 | 5.3%(+2.56)#6,600 |
| 61. | Puhi | 7.8% | 7.7%(+0.045)#61 | 5.3%(+2.48)#6,717 |
| 62. | Waimanalo Beach | 7.3% | 7.7%(-0.371)#62 | 5.3%(+2.06)#7,375 |
| 63. | Kapaa | 7.1% | 7.7%(-0.585)#63 | 5.3%(+1.85)#7,761 |
| 64. | Hawaiian Paradise Park | 7.0% | 7.7%(-0.712)#64 | 5.3%(+1.72)#7,993 |
| 65. | Keokea | 6.9% | 7.7%(-0.780)#65 | 5.3%(+1.65)#8,113 |
| 66. | Whitmore Village | 6.9% | 7.7%(-0.791)#66 | 5.3%(+1.64)#8,130 |
| 67. | Kaloko | 6.9% | 7.7%(-0.799)#67 | 5.3%(+1.63)#8,139 |
| 68. | Mililani Mauka | 6.9% | 7.7%(-0.858)#68 | 5.3%(+1.58)#8,262 |
| 69. | Wailua Homesteads | 6.8% | 7.7%(-0.875)#69 | 5.3%(+1.56)#8,302 |
| 70. | Paia | 6.8% | 7.7%(-0.884)#70 | 5.3%(+1.55)#8,322 |
| 71. | Kualapuu | 6.8% | 7.7%(-0.908)#71 | 5.3%(+1.53)#8,377 |
| 72. | Waipio | 6.8% | 7.7%(-0.950)#72 | 5.3%(+1.48)#8,465 |
| 73. | Papaikou | 6.7% | 7.7%(-1.07)#73 | 5.3%(+1.37)#8,739 |
| 74. | Omao | 6.6% | 7.7%(-1.17)#74 | 5.3%(+1.27)#8,956 |
| 75. | Royal Kunia | 6.5% | 7.7%(-1.19)#75 | 5.3%(+1.24)#9,019 |
| 76. | Halaula | 6.4% | 7.7%(-1.29)#76 | 5.3%(+1.15)#9,260 |
| 77. | Makaha | 6.4% | 7.7%(-1.32)#77 | 5.3%(+1.11)#9,339 |
| 78. | Iroquois Point | 6.2% | 7.7%(-1.54)#78 | 5.3%(+0.897)#9,839 |
| 79. | Ewa Beach | 6.2% | 7.7%(-1.55)#79 | 5.3%(+0.885)#9,868 |
| 80. | Maili | 6.2% | 7.7%(-1.57)#80 | 5.3%(+0.869)#9,914 |
| 81. | Captain Cook | 6.2% | 7.7%(-1.57)#81 | 5.3%(+0.866)#9,933 |
| 82. | Kaneohe | 6.1% | 7.7%(-1.58)#82 | 5.3%(+0.857)#9,957 |
| 83. | Waimalu | 6.1% | 7.7%(-1.59)#83 | 5.3%(+0.848)#9,982 |
| 84. | Pepeekeo | 6.1% | 7.7%(-1.62)#84 | 5.3%(+0.817)#10,071 |
| 85. | Fern Forest | 6.1% | 7.7%(-1.65)#85 | 5.3%(+0.785)#10,140 |
| 86. | Pukalani | 6.0% | 7.7%(-1.72)#86 | 5.3%(+0.718)#10,326 |
| 87. | Hilo | 6.0% | 7.7%(-1.77)#87 | 5.3%(+0.668)#10,447 |
| 88. | Kaneohe Base | 5.9% | 7.7%(-1.77)#88 | 5.3%(+0.660)#10,468 |
| 89. | Leilani Estates | 5.9% | 7.7%(-1.77)#89 | 5.3%(+0.660)#10,469 |
| 90. | Paukaa | 5.9% | 7.7%(-1.79)#90 | 5.3%(+0.643)#10,502 |
| 91. | Wailua | 5.8% | 7.7%(-1.91)#91 | 5.3%(+0.526)#10,778 |
| 92. | Hauula | 5.7% | 7.7%(-2.00)#92 | 5.3%(+0.430)#11,030 |
| 93. | Hickam Housing | 5.7% | 7.7%(-2.05)#93 | 5.3%(+0.388)#11,167 |
| 94. | Makaha Valley | 5.6% | 7.7%(-2.16)#94 | 5.3%(+0.270)#11,501 |
| 95. | Hanapepe | 5.6% | 7.7%(-2.17)#95 | 5.3%(+0.265)#11,518 |
| 96. | Mountain View | 5.5% | 7.7%(-2.18)#96 | 5.3%(+0.257)#11,540 |
| 97. | Pahala | 5.5% | 7.7%(-2.26)#97 | 5.3%(+0.178)#11,717 |
| 98. | Wainiha | 5.5% | 7.7%(-2.27)#98 | 5.3%(+0.168)#11,743 |
| 99. | Pearl City | 5.4% | 7.7%(-2.35)#99 | 5.3%(+0.088)#11,951 |
| 100. | Honaunau Napoopoo | 5.3% | 7.7%(-2.39)#100 | 5.3%(+0.042)#12,088 |
1
2Common Questions
What are the Top 10 Cities with the Highest Percentage of Population Employed in Food Preparation & Serving in Hawaii?
Top 10 Cities with the Highest Percentage of Population Employed in Food Preparation & Serving in Hawaii are:
#1
36.8%
#2
29.9%
#3
19.3%
#4
18.1%
#5
17.5%
#6
15.7%
#7
15.6%
#8
15.1%
#9
14.9%
#10
14.8%
What city has the Highest Percentage of Population Employed in Food Preparation & Serving in Hawaii?
Eden Roc has the Highest Percentage of Population Employed in Food Preparation & Serving in Hawaii with 36.8%.
What is the Percentage of Population Employed in Food Preparation & Serving in the State of Hawaii?
Percentage of Population Employed in Food Preparation & Serving in Hawaii is 7.7%.
What is the Percentage of Population Employed in Food Preparation & Serving in the United States?
Percentage of Population Employed in Food Preparation & Serving in the United States is 5.3%.