Cities with the Highest Percentage of Population Employed in Food Preparation & Serving in Ohio
RELATED REPORTS & OPTIONS
Food Preparation & Serving
Ohio
Compare Cities
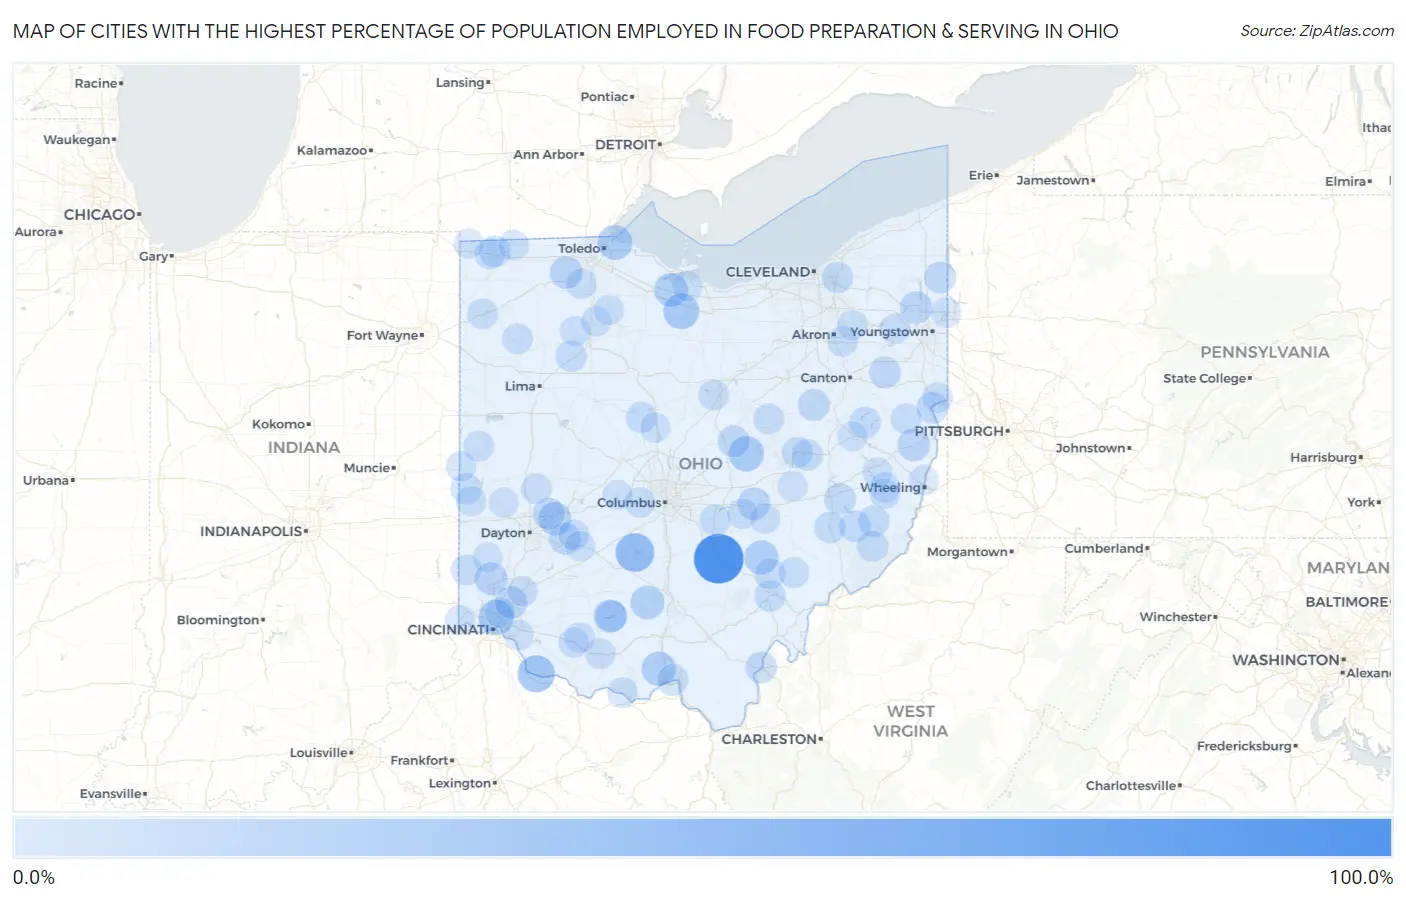
Map of Cities with the Highest Percentage of Population Employed in Food Preparation & Serving in Ohio
0.0%
100.0%
Cities with the Highest Percentage of Population Employed in Food Preparation & Serving in Ohio
| City | % Employed | vs State | vs National | |
| 1. | Rockbridge | 100.0% | 5.6%(+94.4)#1 | 5.3%(+94.7)#14 |
| 2. | Pancoastburg | 50.0% | 5.6%(+44.4)#2 | 5.3%(+44.7)#110 |
| 3. | Chilo | 42.9% | 5.6%(+37.3)#3 | 5.3%(+37.6)#161 |
| 4. | Flat Rock | 36.9% | 5.6%(+31.3)#4 | 5.3%(+31.6)#222 |
| 5. | West Logan | 35.8% | 5.6%(+30.2)#5 | 5.3%(+30.6)#239 |
| 6. | Bladensburg | 35.3% | 5.6%(+29.7)#6 | 5.3%(+30.0)#247 |
| 7. | Elmwood Place | 34.6% | 5.6%(+29.0)#7 | 5.3%(+29.3)#261 |
| 8. | Harbor View | 32.8% | 5.6%(+27.2)#8 | 5.3%(+27.5)#287 |
| 9. | Hemlock | 30.4% | 5.6%(+24.8)#9 | 5.3%(+25.1)#337 |
| 10. | Mcdermott | 30.2% | 5.6%(+24.6)#10 | 5.3%(+24.9)#340 |
| 11. | Bourneville | 29.0% | 5.6%(+23.4)#11 | 5.3%(+23.7)#373 |
| 12. | Vickery | 28.7% | 5.6%(+23.1)#12 | 5.3%(+23.4)#376 |
| 13. | Holiday Valley | 26.9% | 5.6%(+21.3)#13 | 5.3%(+21.6)#436 |
| 14. | Rocky Fork Point | 26.4% | 5.6%(+20.8)#14 | 5.3%(+21.1)#453 |
| 15. | New Haven Cdp Huron County | 25.2% | 5.6%(+19.6)#15 | 5.3%(+19.9)#494 |
| 16. | Williamsdale | 24.7% | 5.6%(+19.1)#16 | 5.3%(+19.4)#518 |
| 17. | Neapolis | 24.3% | 5.6%(+18.7)#17 | 5.3%(+19.0)#539 |
| 18. | Bloomingdale | 23.3% | 5.6%(+17.7)#18 | 5.3%(+18.0)#601 |
| 19. | Brecon | 23.2% | 5.6%(+17.6)#19 | 5.3%(+17.9)#604 |
| 20. | Gratiot | 23.1% | 5.6%(+17.5)#20 | 5.3%(+17.8)#608 |
| 21. | Morgandale | 22.9% | 5.6%(+17.3)#21 | 5.3%(+17.6)#623 |
| 22. | Winesburg | 21.0% | 5.6%(+15.4)#22 | 5.3%(+15.7)#736 |
| 23. | Wilberforce | 20.9% | 5.6%(+15.3)#23 | 5.3%(+15.6)#746 |
| 24. | Kinsman Center | 20.9% | 5.6%(+15.3)#24 | 5.3%(+15.6)#749 |
| 25. | Gambier | 20.3% | 5.6%(+14.7)#25 | 5.3%(+15.0)#805 |
| 26. | Wellsville | 20.2% | 5.6%(+14.6)#26 | 5.3%(+14.9)#821 |
| 27. | Homeworth | 20.1% | 5.6%(+14.5)#27 | 5.3%(+14.8)#830 |
| 28. | Crystal Lakes | 19.9% | 5.6%(+14.3)#28 | 5.3%(+14.6)#858 |
| 29. | Kanauga | 19.7% | 5.6%(+14.1)#29 | 5.3%(+14.4)#873 |
| 30. | Bass Lake | 19.6% | 5.6%(+14.0)#30 | 5.3%(+14.4)#880 |
| 31. | Kunkle | 19.5% | 5.6%(+13.9)#31 | 5.3%(+14.2)#888 |
| 32. | Summerfield | 19.4% | 5.6%(+13.7)#32 | 5.3%(+14.1)#912 |
| 33. | Miltonsburg | 19.0% | 5.6%(+13.4)#33 | 5.3%(+13.8)#940 |
| 34. | New Boston | 18.9% | 5.6%(+13.3)#34 | 5.3%(+13.6)#961 |
| 35. | Sherrodsville | 18.8% | 5.6%(+13.2)#35 | 5.3%(+13.5)#967 |
| 36. | Lore City | 18.8% | 5.6%(+13.1)#36 | 5.3%(+13.5)#970 |
| 37. | New Springfield | 18.7% | 5.6%(+13.1)#37 | 5.3%(+13.4)#986 |
| 38. | Belle Valley | 18.6% | 5.6%(+13.0)#38 | 5.3%(+13.3)#1,001 |
| 39. | Highland Holiday | 18.4% | 5.6%(+12.8)#39 | 5.3%(+13.2)#1,013 |
| 40. | Woodmere | 18.3% | 5.6%(+12.7)#40 | 5.3%(+13.0)#1,033 |
| 41. | West Lafayette | 17.9% | 5.6%(+12.3)#41 | 5.3%(+12.6)#1,078 |
| 42. | Mount Cory | 17.8% | 5.6%(+12.2)#42 | 5.3%(+12.5)#1,092 |
| 43. | Thurston | 17.6% | 5.6%(+11.9)#43 | 5.3%(+12.3)#1,120 |
| 44. | Graysville | 17.4% | 5.6%(+11.8)#44 | 5.3%(+12.1)#1,155 |
| 45. | Athens | 17.4% | 5.6%(+11.8)#45 | 5.3%(+12.1)#1,163 |
| 46. | Palestine | 17.2% | 5.6%(+11.6)#46 | 5.3%(+11.9)#1,177 |
| 47. | Roseland | 16.8% | 5.6%(+11.2)#47 | 5.3%(+11.5)#1,231 |
| 48. | Green Camp | 16.7% | 5.6%(+11.1)#48 | 5.3%(+11.5)#1,237 |
| 49. | Canal Lewisville | 16.7% | 5.6%(+11.1)#49 | 5.3%(+11.4)#1,251 |
| 50. | Oxford | 16.6% | 5.6%(+11.0)#50 | 5.3%(+11.3)#1,280 |
| 51. | Bergholz | 16.5% | 5.6%(+10.9)#51 | 5.3%(+11.2)#1,294 |
| 52. | Jacksonville | 16.4% | 5.6%(+10.8)#52 | 5.3%(+11.2)#1,303 |
| 53. | Seaman | 16.3% | 5.6%(+10.7)#53 | 5.3%(+11.1)#1,324 |
| 54. | Chesterhill | 16.2% | 5.6%(+10.6)#54 | 5.3%(+10.9)#1,350 |
| 55. | Dupont | 16.1% | 5.6%(+10.5)#55 | 5.3%(+10.8)#1,378 |
| 56. | Cedarville | 15.9% | 5.6%(+10.3)#56 | 5.3%(+10.6)#1,419 |
| 57. | Tontogany | 15.6% | 5.6%(+10.0)#57 | 5.3%(+10.4)#1,482 |
| 58. | Cecil | 15.6% | 5.6%(+10.0)#58 | 5.3%(+10.3)#1,488 |
| 59. | Casstown | 15.5% | 5.6%(+9.88)#59 | 5.3%(+10.2)#1,509 |
| 60. | Lake Darby | 15.5% | 5.6%(+9.87)#60 | 5.3%(+10.2)#1,513 |
| 61. | Glenmont | 15.4% | 5.6%(+9.78)#61 | 5.3%(+10.1)#1,530 |
| 62. | New Weston | 15.4% | 5.6%(+9.78)#62 | 5.3%(+10.1)#1,536 |
| 63. | Holiday City | 15.4% | 5.6%(+9.78)#63 | 5.3%(+10.1)#1,539 |
| 64. | Lexington | 15.3% | 5.6%(+9.73)#64 | 5.3%(+10.1)#1,546 |
| 65. | Sawyerwood | 15.3% | 5.6%(+9.69)#65 | 5.3%(+10.0)#1,557 |
| 66. | Glenmoor | 15.2% | 5.6%(+9.56)#66 | 5.3%(+9.88)#1,582 |
| 67. | Craig Beach | 15.1% | 5.6%(+9.45)#67 | 5.3%(+9.77)#1,611 |
| 68. | Kent | 15.0% | 5.6%(+9.42)#68 | 5.3%(+9.74)#1,621 |
| 69. | Massieville | 15.0% | 5.6%(+9.39)#69 | 5.3%(+9.71)#1,628 |
| 70. | Glenford | 15.0% | 5.6%(+9.39)#70 | 5.3%(+9.71)#1,630 |
| 71. | Morristown | 15.0% | 5.6%(+9.35)#71 | 5.3%(+9.67)#1,650 |
| 72. | Kings Mills | 14.7% | 5.6%(+9.14)#72 | 5.3%(+9.46)#1,701 |
| 73. | Hamburg | 14.4% | 5.6%(+8.81)#73 | 5.3%(+9.13)#1,787 |
| 74. | Fayette | 14.4% | 5.6%(+8.78)#74 | 5.3%(+9.10)#1,798 |
| 75. | East Fultonham | 14.3% | 5.6%(+8.68)#75 | 5.3%(+9.00)#1,821 |
| 76. | Rome Stout | 14.3% | 5.6%(+8.68)#76 | 5.3%(+9.00)#1,832 |
| 77. | Mowrystown | 14.2% | 5.6%(+8.61)#77 | 5.3%(+8.93)#1,854 |
| 78. | Mccomb | 14.1% | 5.6%(+8.51)#78 | 5.3%(+8.83)#1,876 |
| 79. | Sardinia | 14.1% | 5.6%(+8.46)#79 | 5.3%(+8.78)#1,895 |
| 80. | New Madison | 14.1% | 5.6%(+8.45)#80 | 5.3%(+8.77)#1,900 |
| 81. | Bairdstown | 14.0% | 5.6%(+8.43)#81 | 5.3%(+8.75)#1,906 |
| 82. | Union City | 14.0% | 5.6%(+8.42)#82 | 5.3%(+8.74)#1,911 |
| 83. | Bethesda | 13.9% | 5.6%(+8.29)#83 | 5.3%(+8.61)#1,939 |
| 84. | West Millgrove | 13.8% | 5.6%(+8.24)#84 | 5.3%(+8.56)#1,958 |
| 85. | Jamestown | 13.7% | 5.6%(+8.05)#85 | 5.3%(+8.37)#2,017 |
| 86. | Castalia | 13.6% | 5.6%(+8.01)#86 | 5.3%(+8.33)#2,032 |
| 87. | West Hill | 13.6% | 5.6%(+7.98)#87 | 5.3%(+8.30)#2,039 |
| 88. | Arlington Heights | 13.6% | 5.6%(+7.96)#88 | 5.3%(+8.28)#2,047 |
| 89. | West Elkton | 13.6% | 5.6%(+7.95)#89 | 5.3%(+8.27)#2,051 |
| 90. | Plumwood | 13.5% | 5.6%(+7.94)#90 | 5.3%(+8.26)#2,053 |
| 91. | Withamsville | 13.5% | 5.6%(+7.94)#91 | 5.3%(+8.26)#2,055 |
| 92. | Uhrichsville | 13.4% | 5.6%(+7.81)#92 | 5.3%(+8.13)#2,097 |
| 93. | Martins Ferry | 13.3% | 5.6%(+7.74)#93 | 5.3%(+8.06)#2,120 |
| 94. | Nettle Lake | 13.3% | 5.6%(+7.69)#94 | 5.3%(+8.01)#2,140 |
| 95. | Waldo | 13.3% | 5.6%(+7.65)#95 | 5.3%(+7.97)#2,155 |
| 96. | Holloway | 13.2% | 5.6%(+7.64)#96 | 5.3%(+7.96)#2,162 |
| 97. | Adamsville | 13.2% | 5.6%(+7.61)#97 | 5.3%(+7.93)#2,171 |
| 98. | Newport Cdp Shelby County | 13.2% | 5.6%(+7.58)#98 | 5.3%(+7.90)#2,193 |
| 99. | Potsdam | 13.0% | 5.6%(+7.44)#99 | 5.3%(+7.76)#2,236 |
| 100. | Elizabethtown | 13.0% | 5.6%(+7.44)#100 | 5.3%(+7.76)#2,237 |
Common Questions
What are the Top 10 Cities with the Highest Percentage of Population Employed in Food Preparation & Serving in Ohio?
Top 10 Cities with the Highest Percentage of Population Employed in Food Preparation & Serving in Ohio are:
#1
100.0%
#2
50.0%
#3
42.9%
#4
36.9%
#5
35.3%
#6
34.6%
#7
32.8%
#8
30.4%
#9
30.2%
#10
29.0%
What city has the Highest Percentage of Population Employed in Food Preparation & Serving in Ohio?
Rockbridge has the Highest Percentage of Population Employed in Food Preparation & Serving in Ohio with 100.0%.
What is the Percentage of Population Employed in Food Preparation & Serving in the State of Ohio?
Percentage of Population Employed in Food Preparation & Serving in Ohio is 5.6%.
What is the Percentage of Population Employed in Food Preparation & Serving in the United States?
Percentage of Population Employed in Food Preparation & Serving in the United States is 5.3%.