Cities with the Lowest Unemployment Rate Amomg Youth Under the Age of 25 in Tennessee
RELATED REPORTS & OPTIONS
Lowest Unemployment | Youth < 25
Tennessee
Compare Cities
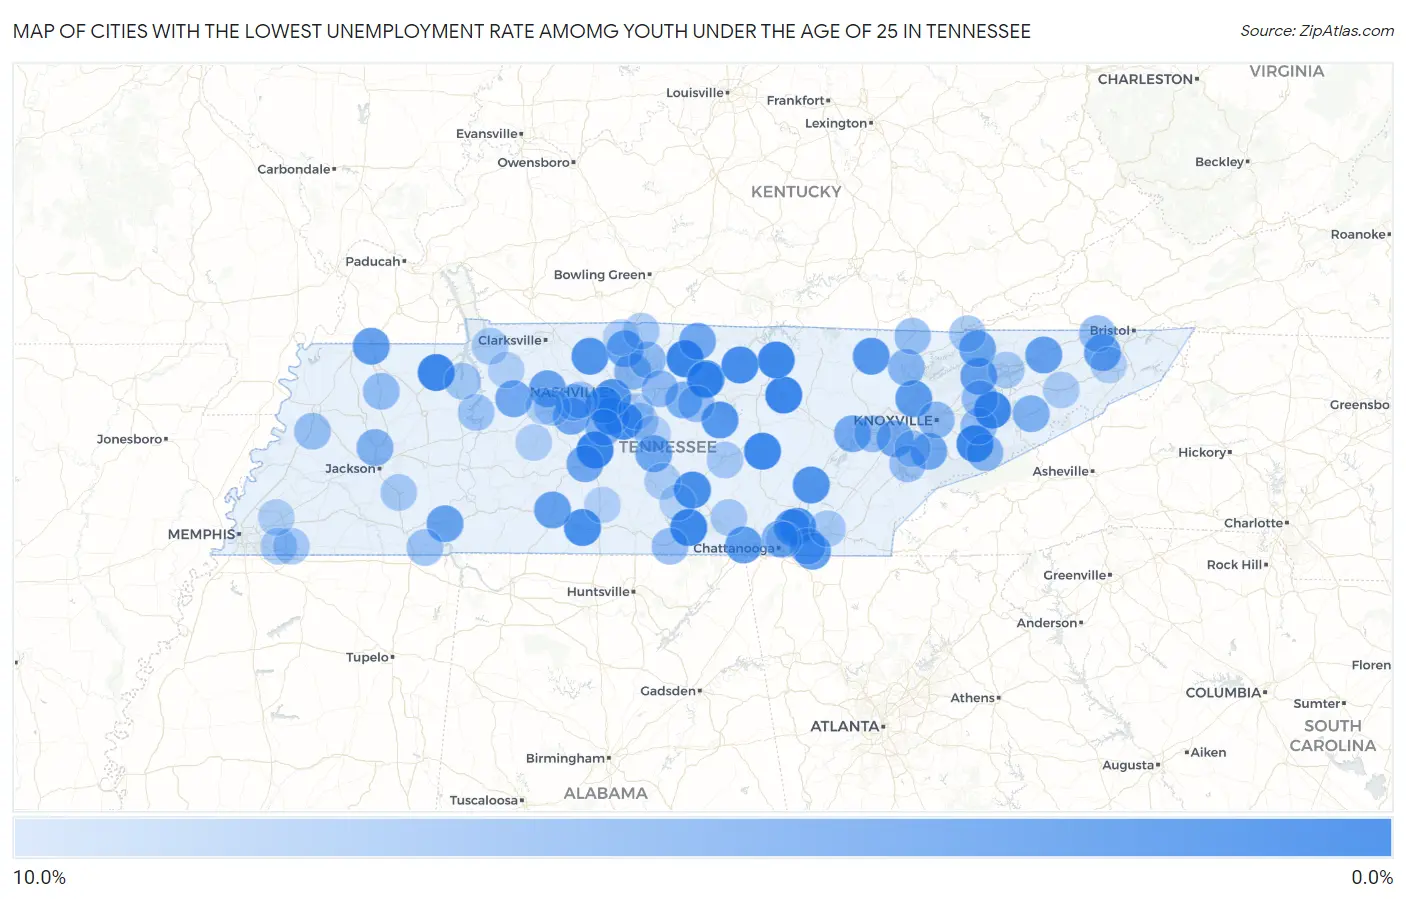
Map of Cities with the Lowest Unemployment Rate Amomg Youth Under the Age of 25 in Tennessee
10.0%
0.0%
Cities with the Lowest Unemployment Rate Amomg Youth Under the Age of 25 in Tennessee
| City | Youth Unemployment | vs State | vs National | |
| 1. | Spring Hill | 1.0% | 10.5%(-9.50)#1 | 10.9%(-9.90)#117 |
| 2. | Hartsville Trousdale County | 1.1% | 10.5%(-9.40)#2 | 10.9%(-9.80)#147 |
| 3. | Monterey | 1.2% | 10.5%(-9.30)#3 | 10.9%(-9.70)#179 |
| 4. | Paris | 1.3% | 10.5%(-9.20)#4 | 10.9%(-9.60)#192 |
| 5. | Winchester | 1.4% | 10.5%(-9.10)#5 | 10.9%(-9.50)#220 |
| 6. | Pigeon Forge | 1.4% | 10.5%(-9.10)#6 | 10.9%(-9.50)#224 |
| 7. | Livingston | 1.4% | 10.5%(-9.10)#7 | 10.9%(-9.50)#228 |
| 8. | Dandridge | 1.5% | 10.5%(-9.00)#8 | 10.9%(-9.40)#256 |
| 9. | Spencer | 1.5% | 10.5%(-9.00)#9 | 10.9%(-9.40)#265 |
| 10. | Nolensville | 1.7% | 10.5%(-8.80)#10 | 10.9%(-9.20)#312 |
| 11. | Carthage | 1.8% | 10.5%(-8.70)#11 | 10.9%(-9.10)#382 |
| 12. | Gainesboro | 1.8% | 10.5%(-8.70)#12 | 10.9%(-9.10)#394 |
| 13. | Pulaski | 2.0% | 10.5%(-8.50)#13 | 10.9%(-8.90)#448 |
| 14. | Brentwood | 2.1% | 10.5%(-8.40)#14 | 10.9%(-8.80)#482 |
| 15. | Manchester | 2.1% | 10.5%(-8.40)#15 | 10.9%(-8.80)#488 |
| 16. | Dayton | 2.5% | 10.5%(-8.00)#16 | 10.9%(-8.40)#714 |
| 17. | Coopertown | 2.5% | 10.5%(-8.00)#17 | 10.9%(-8.40)#718 |
| 18. | Lakesite | 2.6% | 10.5%(-7.90)#18 | 10.9%(-8.30)#804 |
| 19. | Berry Hill | 2.6% | 10.5%(-7.90)#19 | 10.9%(-8.30)#808 |
| 20. | Smithville | 2.8% | 10.5%(-7.70)#20 | 10.9%(-8.10)#922 |
| 21. | Huntsville | 2.8% | 10.5%(-7.70)#21 | 10.9%(-8.10)#935 |
| 22. | Forest Hills | 3.0% | 10.5%(-7.50)#22 | 10.9%(-7.90)#1,034 |
| 23. | Middle Valley | 3.2% | 10.5%(-7.30)#23 | 10.9%(-7.70)#1,165 |
| 24. | Clinton | 3.2% | 10.5%(-7.30)#24 | 10.9%(-7.70)#1,167 |
| 25. | Apison | 3.2% | 10.5%(-7.30)#25 | 10.9%(-7.70)#1,182 |
| 26. | South Fulton | 3.3% | 10.5%(-7.20)#26 | 10.9%(-7.60)#1,258 |
| 27. | Jasper | 3.4% | 10.5%(-7.10)#27 | 10.9%(-7.50)#1,322 |
| 28. | Biltmore | 3.5% | 10.5%(-7.00)#28 | 10.9%(-7.40)#1,388 |
| 29. | Rogersville | 3.7% | 10.5%(-6.80)#29 | 10.9%(-7.20)#1,498 |
| 30. | Spurgeon | 3.7% | 10.5%(-6.80)#30 | 10.9%(-7.20)#1,500 |
| 31. | Rutledge | 3.7% | 10.5%(-6.80)#31 | 10.9%(-7.20)#1,521 |
| 32. | Ethridge | 3.7% | 10.5%(-6.80)#32 | 10.9%(-7.20)#1,532 |
| 33. | White House | 3.8% | 10.5%(-6.70)#33 | 10.9%(-7.10)#1,552 |
| 34. | Savannah | 3.8% | 10.5%(-6.70)#34 | 10.9%(-7.10)#1,567 |
| 35. | Charlotte | 3.8% | 10.5%(-6.70)#35 | 10.9%(-7.10)#1,590 |
| 36. | Tazewell | 3.9% | 10.5%(-6.60)#36 | 10.9%(-7.00)#1,648 |
| 37. | Maryville | 4.1% | 10.5%(-6.40)#37 | 10.9%(-6.80)#1,754 |
| 38. | Christiana | 4.1% | 10.5%(-6.40)#38 | 10.9%(-6.80)#1,782 |
| 39. | Lafayette | 4.2% | 10.5%(-6.30)#39 | 10.9%(-6.70)#1,843 |
| 40. | Mcewen | 4.2% | 10.5%(-6.30)#40 | 10.9%(-6.70)#1,865 |
| 41. | Columbia | 4.3% | 10.5%(-6.20)#41 | 10.9%(-6.60)#1,885 |
| 42. | Fairview | 4.3% | 10.5%(-6.20)#42 | 10.9%(-6.60)#1,900 |
| 43. | Lenoir City | 4.4% | 10.5%(-6.10)#43 | 10.9%(-6.50)#1,969 |
| 44. | Rockwood | 4.5% | 10.5%(-6.00)#44 | 10.9%(-6.40)#2,056 |
| 45. | Watertown | 4.8% | 10.5%(-5.70)#45 | 10.9%(-6.10)#2,312 |
| 46. | Collegedale | 4.9% | 10.5%(-5.60)#46 | 10.9%(-6.00)#2,348 |
| 47. | Parrottsville | 5.1% | 10.5%(-5.40)#47 | 10.9%(-5.80)#2,523 |
| 48. | Franklin | 5.2% | 10.5%(-5.30)#48 | 10.9%(-5.70)#2,529 |
| 49. | Red Bank | 5.2% | 10.5%(-5.30)#49 | 10.9%(-5.70)#2,547 |
| 50. | Three Way | 5.2% | 10.5%(-5.30)#50 | 10.9%(-5.70)#2,584 |
| 51. | Hendersonville | 5.4% | 10.5%(-5.10)#51 | 10.9%(-5.50)#2,691 |
| 52. | South Carthage | 5.4% | 10.5%(-5.10)#52 | 10.9%(-5.50)#2,748 |
| 53. | Jacksboro | 5.5% | 10.5%(-5.00)#53 | 10.9%(-5.40)#2,814 |
| 54. | Gatlinburg | 5.6% | 10.5%(-4.90)#54 | 10.9%(-5.30)#2,888 |
| 55. | Knoxville | 5.9% | 10.5%(-4.60)#55 | 10.9%(-5.00)#3,088 |
| 56. | Gallatin | 5.9% | 10.5%(-4.60)#56 | 10.9%(-5.00)#3,094 |
| 57. | Lebanon | 6.0% | 10.5%(-4.50)#57 | 10.9%(-4.90)#3,164 |
| 58. | Kingston Springs | 6.0% | 10.5%(-4.50)#58 | 10.9%(-4.90)#3,215 |
| 59. | Sevierville | 6.1% | 10.5%(-4.40)#59 | 10.9%(-4.80)#3,273 |
| 60. | New Market | 6.1% | 10.5%(-4.40)#60 | 10.9%(-4.80)#3,310 |
| 61. | Bloomingdale | 6.2% | 10.5%(-4.30)#61 | 10.9%(-4.70)#3,361 |
| 62. | Greenfield | 6.2% | 10.5%(-4.30)#62 | 10.9%(-4.70)#3,379 |
| 63. | Huntland | 6.3% | 10.5%(-4.20)#63 | 10.9%(-4.60)#3,480 |
| 64. | Alexandria | 6.3% | 10.5%(-4.20)#64 | 10.9%(-4.60)#3,483 |
| 65. | Kingston | 6.4% | 10.5%(-4.10)#65 | 10.9%(-4.50)#3,532 |
| 66. | Halls | 6.4% | 10.5%(-4.10)#66 | 10.9%(-4.50)#3,553 |
| 67. | Jellico | 6.4% | 10.5%(-4.10)#67 | 10.9%(-4.50)#3,555 |
| 68. | Powell | 6.5% | 10.5%(-4.00)#68 | 10.9%(-4.40)#3,600 |
| 69. | Greenback | 6.5% | 10.5%(-4.00)#69 | 10.9%(-4.40)#3,629 |
| 70. | Michie | 6.6% | 10.5%(-3.90)#70 | 10.9%(-4.30)#3,720 |
| 71. | New Johnsonville | 6.7% | 10.5%(-3.80)#71 | 10.9%(-4.20)#3,785 |
| 72. | Pegram | 6.8% | 10.5%(-3.70)#72 | 10.9%(-4.10)#3,856 |
| 73. | Harrogate | 7.0% | 10.5%(-3.50)#73 | 10.9%(-3.90)#3,992 |
| 74. | Friendsville | 7.1% | 10.5%(-3.40)#74 | 10.9%(-3.80)#4,067 |
| 75. | Big Sandy | 7.1% | 10.5%(-3.40)#75 | 10.9%(-3.80)#4,080 |
| 76. | Cleveland | 7.2% | 10.5%(-3.30)#76 | 10.9%(-3.70)#4,108 |
| 77. | Portland | 7.2% | 10.5%(-3.30)#77 | 10.9%(-3.70)#4,128 |
| 78. | Lynchburg | 7.2% | 10.5%(-3.30)#78 | 10.9%(-3.70)#4,142 |
| 79. | Henderson | 7.2% | 10.5%(-3.30)#79 | 10.9%(-3.70)#4,143 |
| 80. | Tracy City | 7.2% | 10.5%(-3.30)#80 | 10.9%(-3.70)#4,161 |
| 81. | Smyrna | 7.3% | 10.5%(-3.20)#81 | 10.9%(-3.60)#4,178 |
| 82. | Collierville | 7.3% | 10.5%(-3.20)#82 | 10.9%(-3.60)#4,179 |
| 83. | Mcminnville | 7.3% | 10.5%(-3.20)#83 | 10.9%(-3.60)#4,205 |
| 84. | Bean Station | 7.3% | 10.5%(-3.20)#84 | 10.9%(-3.60)#4,230 |
| 85. | Piperton | 7.3% | 10.5%(-3.20)#85 | 10.9%(-3.60)#4,237 |
| 86. | Dover | 7.4% | 10.5%(-3.10)#86 | 10.9%(-3.50)#4,305 |
| 87. | Greeneville | 7.5% | 10.5%(-3.00)#87 | 10.9%(-3.40)#4,352 |
| 88. | Burns | 7.6% | 10.5%(-2.90)#88 | 10.9%(-3.30)#4,458 |
| 89. | Wartrace | 7.6% | 10.5%(-2.90)#89 | 10.9%(-3.30)#4,477 |
| 90. | Lakeland | 7.7% | 10.5%(-2.80)#90 | 10.9%(-3.20)#4,544 |
| 91. | Centerville | 7.7% | 10.5%(-2.80)#91 | 10.9%(-3.20)#4,561 |
| 92. | Erin | 7.8% | 10.5%(-2.70)#92 | 10.9%(-3.10)#4,645 |
| 93. | Johnson City | 7.9% | 10.5%(-2.60)#93 | 10.9%(-3.00)#4,660 |
| 94. | La Vergne | 7.9% | 10.5%(-2.60)#94 | 10.9%(-3.00)#4,663 |
| 95. | Murfreesboro | 8.0% | 10.5%(-2.50)#95 | 10.9%(-2.90)#4,740 |
| 96. | Dickson | 8.0% | 10.5%(-2.50)#96 | 10.9%(-2.90)#4,761 |
| 97. | Cross Plains | 8.0% | 10.5%(-2.50)#97 | 10.9%(-2.90)#4,785 |
| 98. | Cornersville | 8.0% | 10.5%(-2.50)#98 | 10.9%(-2.90)#4,786 |
| 99. | Tullahoma | 8.1% | 10.5%(-2.40)#99 | 10.9%(-2.80)#4,816 |
| 100. | Chattanooga | 8.2% | 10.5%(-2.30)#100 | 10.9%(-2.70)#4,881 |
Common Questions
What are the Top 10 Cities with the Lowest Unemployment Rate Amomg Youth Under the Age of 25 in Tennessee?
Top 10 Cities with the Lowest Unemployment Rate Amomg Youth Under the Age of 25 in Tennessee are:
#1
1.0%
#2
1.1%
#3
1.2%
#4
1.3%
#5
1.4%
#6
1.4%
#7
1.4%
#8
1.5%
#9
1.5%
#10
1.7%
What city has the Lowest Unemployment Rate Amomg Youth Under the Age of 25 in Tennessee?
Spring Hill has the Lowest Unemployment Rate Amomg Youth Under the Age of 25 in Tennessee with 1.0%.
What is the Unemployment Rate Amomg Youth Under the Age of 25 in the State of Tennessee?
Unemployment Rate Amomg Youth Under the Age of 25 in Tennessee is 10.5%.
What is the Unemployment Rate Amomg Youth Under the Age of 25 in the United States?
Unemployment Rate Amomg Youth Under the Age of 25 in the United States is 10.9%.