Groesbeck, TX
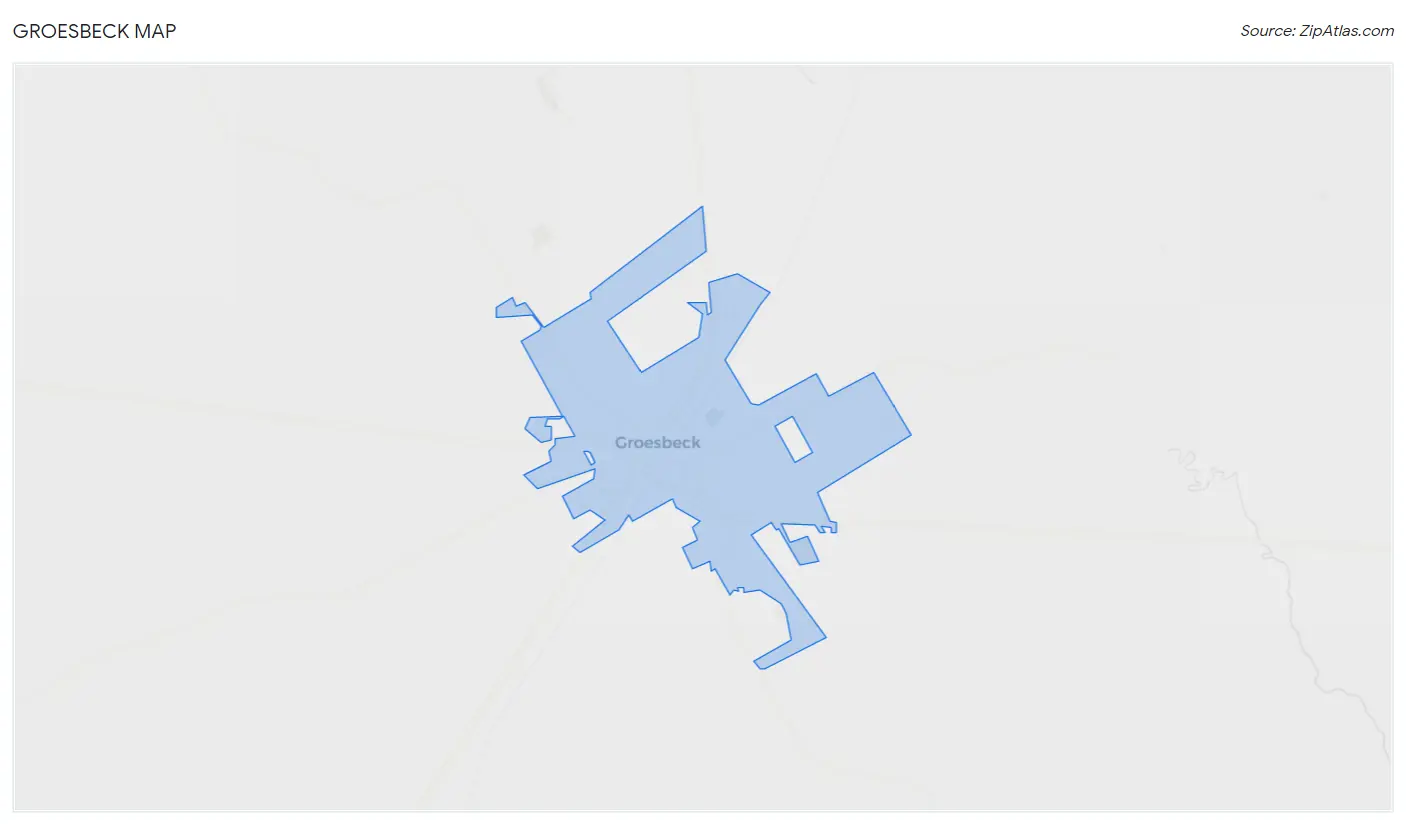
Groesbeck Map
Groesbeck Overview
3,661
TOTAL POPULATION
1,992
MALE POPULATION
1,669
FEMALE POPULATION
119.35
MALES / 100 FEMALES
83.79
FEMALES / 100 MALES
38.9
MEDIAN AGE
3.2
AVG FAMILY SIZE
2.5
AVG HOUSEHOLD SIZE
$29,195
PER CAPITA INCOME
$58,759
AVG FAMILY INCOME
$47,500
AVG HOUSEHOLD INCOME
31.0%
WAGE / INCOME GAP [ % ]
69.0¢/ $1
WAGE / INCOME GAP [ $ ]
0.46
INEQUALITY / GINI INDEX
1,421
LABOR FORCE [ PEOPLE ]
48.6%
PERCENT IN LABOR FORCE
1.0%
UNEMPLOYMENT RATE
Groesbeck Zip Codes
Groesbeck Area Codes
Race in Groesbeck
The most populous races in Groesbeck are White / Caucasian (1,833 | 50.1%), Black / African American (1,173 | 32.0%), and Hispanic or Latino (773 | 21.1%).
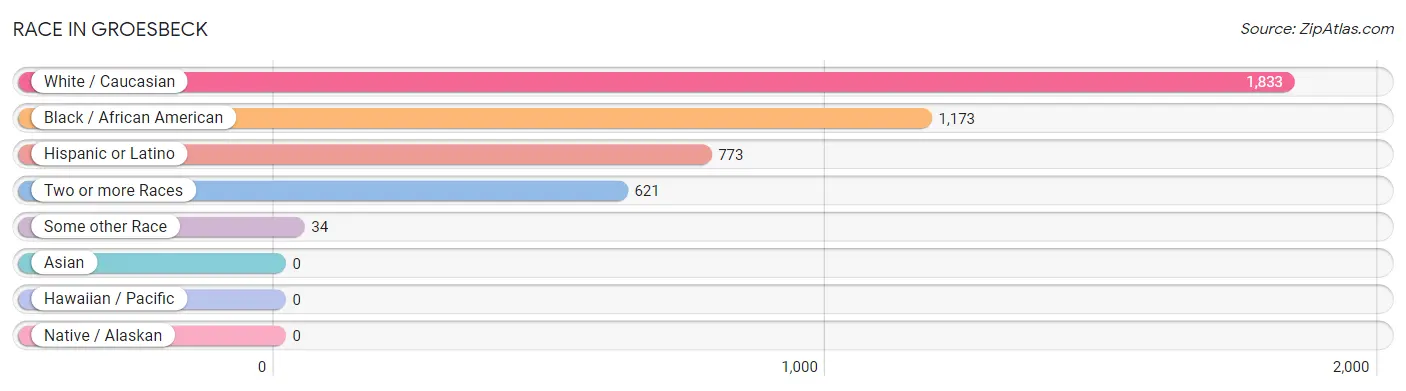
| Race | # Population | % Population |
| Asian | 0 | 0.0% |
| Black / African American | 1,173 | 32.0% |
| Hawaiian / Pacific | 0 | 0.0% |
| Hispanic or Latino | 773 | 21.1% |
| Native / Alaskan | 0 | 0.0% |
| White / Caucasian | 1,833 | 50.1% |
| Two or more Races | 621 | 17.0% |
| Some other Race | 34 | 0.9% |
| Total | 3,661 | 100.0% |
Ancestry in Groesbeck
The most populous ancestries reported in Groesbeck are Mexican (695 | 19.0%), Irish (372 | 10.2%), German (272 | 7.4%), English (161 | 4.4%), and American (122 | 3.3%), together accounting for 44.3% of all Groesbeck residents.
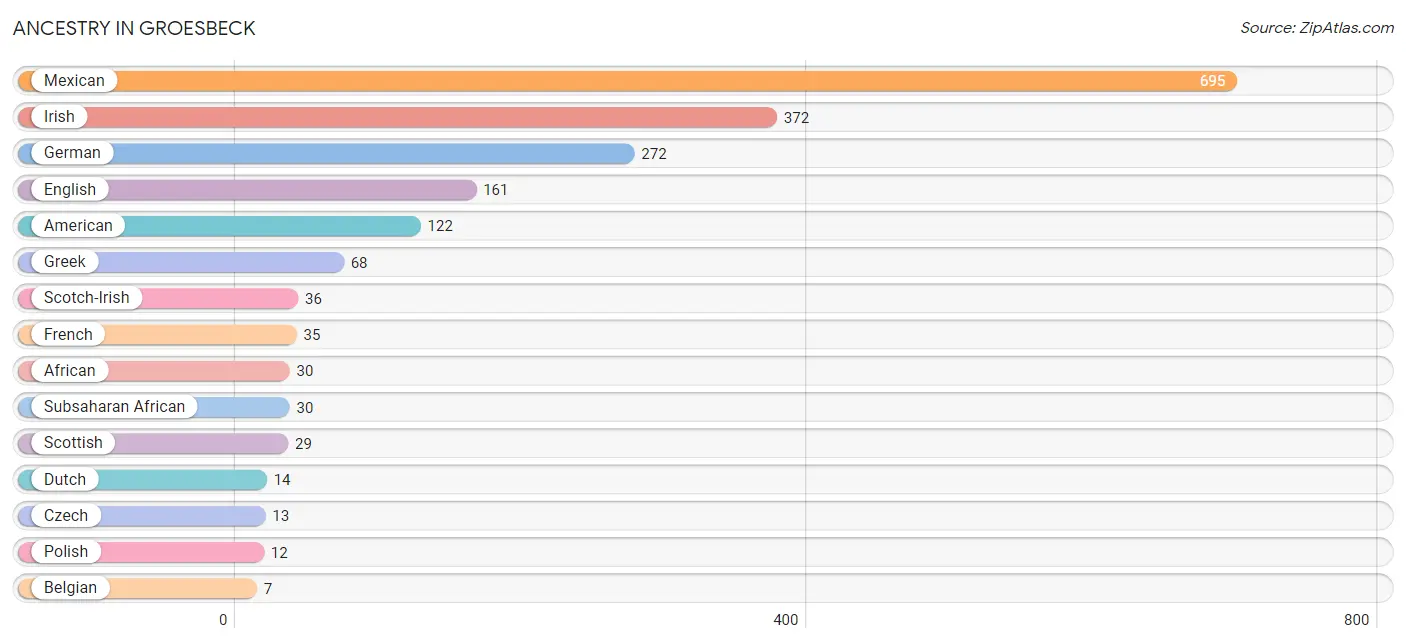
| Ancestry | # Population | % Population |
| African | 30 | 0.8% |
| American | 122 | 3.3% |
| Belgian | 7 | 0.2% |
| Czech | 13 | 0.4% |
| Dutch | 14 | 0.4% |
| English | 161 | 4.4% |
| French | 35 | 1.0% |
| German | 272 | 7.4% |
| Greek | 68 | 1.9% |
| Irish | 372 | 10.2% |
| Mexican | 695 | 19.0% |
| Mexican American Indian | 4 | 0.1% |
| Polish | 12 | 0.3% |
| Scotch-Irish | 36 | 1.0% |
| Scottish | 29 | 0.8% |
| Subsaharan African | 30 | 0.8% |
| Swedish | 4 | 0.1% | View All 17 Rows |
Immigrants in Groesbeck
The most numerous immigrant groups reported in Groesbeck came from Latin America (282 | 7.7%), Central America (269 | 7.3%), Mexico (269 | 7.3%), Europe (34 | 0.9%), and Greece (34 | 0.9%), together accounting for 24.3% of all Groesbeck residents.
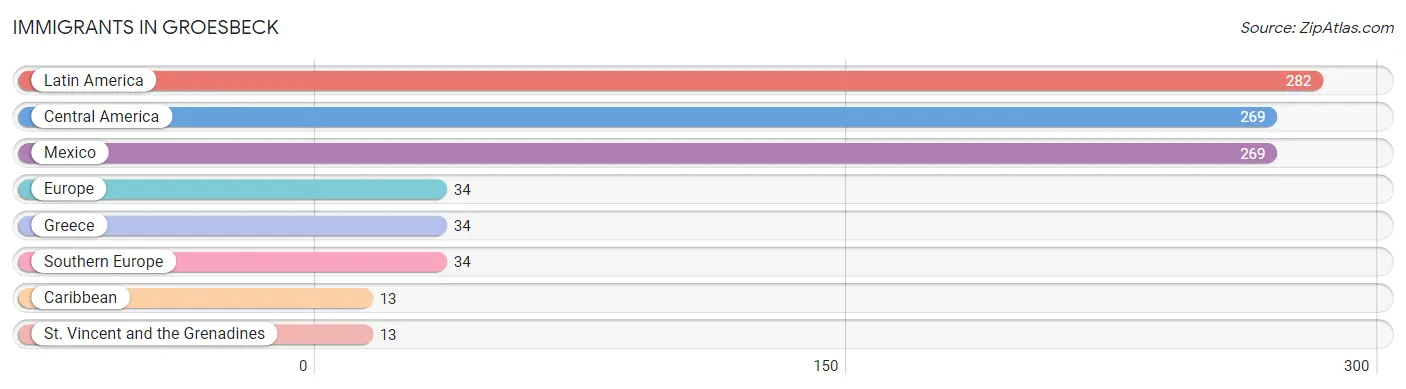
| Immigration Origin | # Population | % Population |
| Caribbean | 13 | 0.4% |
| Central America | 269 | 7.3% |
| Europe | 34 | 0.9% |
| Greece | 34 | 0.9% |
| Latin America | 282 | 7.7% |
| Mexico | 269 | 7.3% |
| Southern Europe | 34 | 0.9% |
| St. Vincent and the Grenadines | 13 | 0.4% | View All 8 Rows |
Sex and Age in Groesbeck
Sex and Age in Groesbeck
The most populous age groups in Groesbeck are 40 to 44 Years (223 | 11.2%) for men and 65 to 69 Years (229 | 13.7%) for women.

| Age Bracket | Male | Female |
| Under 5 Years | 93 (4.7%) | 99 (5.9%) |
| 5 to 9 Years | 93 (4.7%) | 113 (6.8%) |
| 10 to 14 Years | 128 (6.4%) | 160 (9.6%) |
| 15 to 19 Years | 103 (5.2%) | 49 (2.9%) |
| 20 to 24 Years | 164 (8.2%) | 50 (3.0%) |
| 25 to 29 Years | 172 (8.6%) | 97 (5.8%) |
| 30 to 34 Years | 164 (8.2%) | 174 (10.4%) |
| 35 to 39 Years | 161 (8.1%) | 113 (6.8%) |
| 40 to 44 Years | 223 (11.2%) | 3 (0.2%) |
| 45 to 49 Years | 145 (7.3%) | 166 (10.0%) |
| 50 to 54 Years | 104 (5.2%) | 65 (3.9%) |
| 55 to 59 Years | 82 (4.1%) | 106 (6.4%) |
| 60 to 64 Years | 188 (9.4%) | 47 (2.8%) |
| 65 to 69 Years | 44 (2.2%) | 229 (13.7%) |
| 70 to 74 Years | 9 (0.4%) | 28 (1.7%) |
| 75 to 79 Years | 55 (2.8%) | 59 (3.5%) |
| 80 to 84 Years | 13 (0.6%) | 57 (3.4%) |
| 85 Years and over | 51 (2.6%) | 54 (3.2%) |
| Total | 1,992 (100.0%) | 1,669 (100.0%) |
Families and Households in Groesbeck
Median Family Size in Groesbeck
The median family size in Groesbeck is 3.20 persons per family, with married-couple families (337 | 39.7%) accounting for the largest median family size of 3.75 persons per family. On the other hand, single male/father families (119 | 14.0%) represent the smallest median family size with 1.97 persons per family.
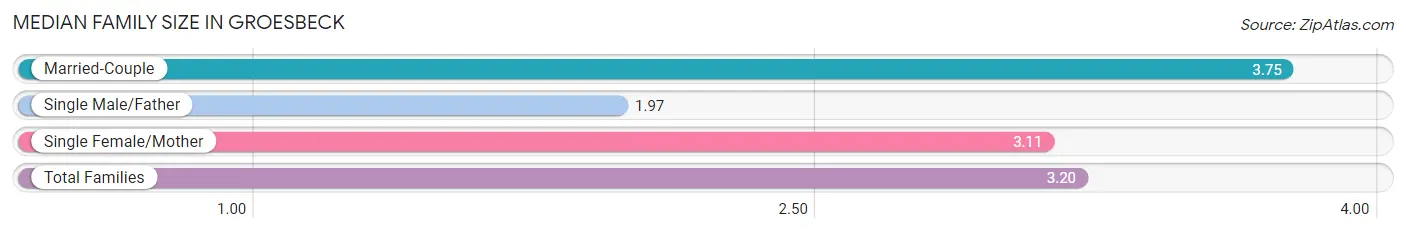
| Family Type | # Families | Family Size |
| Married-Couple | 337 (39.7%) | 3.75 |
| Single Male/Father | 119 (14.0%) | 1.97 |
| Single Female/Mother | 394 (46.4%) | 3.11 |
| Total Families | 850 (100.0%) | 3.20 |
Median Household Size in Groesbeck
The median household size in Groesbeck is 2.55 persons per household, with married-couple households (337 | 26.0%) accounting for the largest median household size of 3.79 persons per household. non-family households (446 | 34.4%) represent the smallest median household size with 1.17 persons per household.
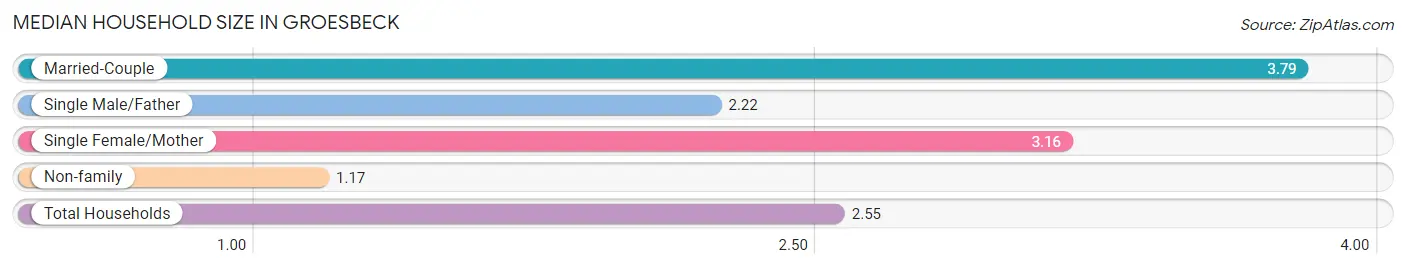
| Household Type | # Households | Household Size |
| Married-Couple | 337 (26.0%) | 3.79 |
| Single Male/Father | 119 (9.2%) | 2.22 |
| Single Female/Mother | 394 (30.4%) | 3.16 |
| Non-family | 446 (34.4%) | 1.17 |
| Total Households | 1,296 (100.0%) | 2.55 |
Household Size by Marriage Status in Groesbeck
Out of a total of 1,296 households in Groesbeck, 850 (65.6%) are family households, while 446 (34.4%) are nonfamily households. The most numerous type of family households are 2-person households, comprising 294, and the most common type of nonfamily households are 1-person households, comprising 402.
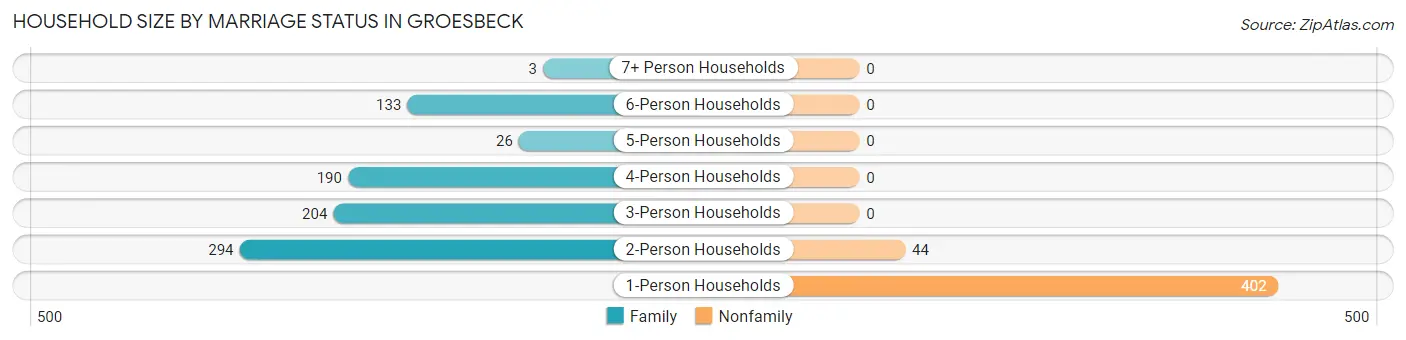
| Household Size | Family Households | Nonfamily Households |
| 1-Person Households | - | 402 (31.0%) |
| 2-Person Households | 294 (22.7%) | 44 (3.4%) |
| 3-Person Households | 204 (15.7%) | 0 (0.0%) |
| 4-Person Households | 190 (14.7%) | 0 (0.0%) |
| 5-Person Households | 26 (2.0%) | 0 (0.0%) |
| 6-Person Households | 133 (10.3%) | 0 (0.0%) |
| 7+ Person Households | 3 (0.2%) | 0 (0.0%) |
| Total | 850 (65.6%) | 446 (34.4%) |
Female Fertility in Groesbeck
Fertility by Age in Groesbeck
Average fertility rate in Groesbeck is 259.0 births per 1,000 women. Women in the age bracket of 20 to 34 years have the highest fertility rate with 526.0 births per 1,000 women. Women in the age bracket of 20 to 34 years acount for 100.0% of all women with births.
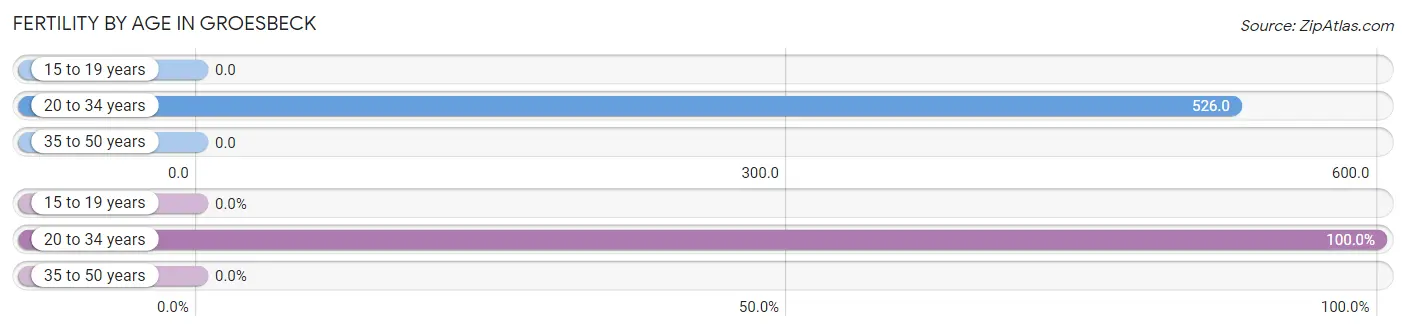
| Age Bracket | Women with Births | Births / 1,000 Women |
| 15 to 19 years | 0 (0.0%) | 0.0 |
| 20 to 34 years | 169 (100.0%) | 526.0 |
| 35 to 50 years | 0 (0.0%) | 0.0 |
| Total | 169 (100.0%) | 259.0 |
Fertility by Age by Marriage Status in Groesbeck
3.6% of women with births (169) in Groesbeck are married. The highest percentage of unmarried women with births falls into 20 to 34 years age bracket with 96.5% of them unmarried at the time of birth, while the lowest percentage of unmarried women with births belong to 20 to 34 years age bracket with 96.5% of them unmarried.
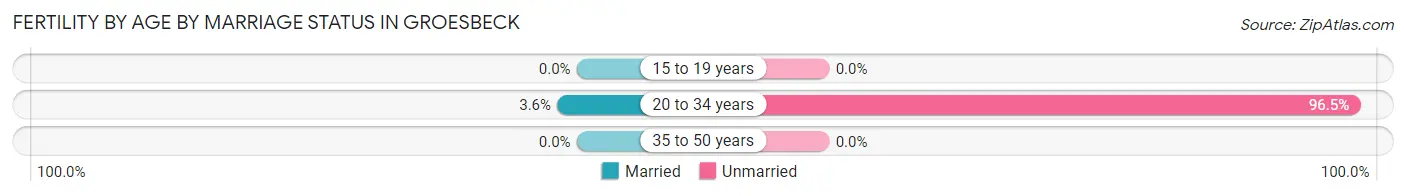
| Age Bracket | Married | Unmarried |
| 15 to 19 years | 0 (0.0%) | 0 (0.0%) |
| 20 to 34 years | 6 (3.5%) | 163 (96.5%) |
| 35 to 50 years | 0 (0.0%) | 0 (0.0%) |
| Total | 6 (3.5%) | 163 (96.5%) |
Fertility by Education in Groesbeck
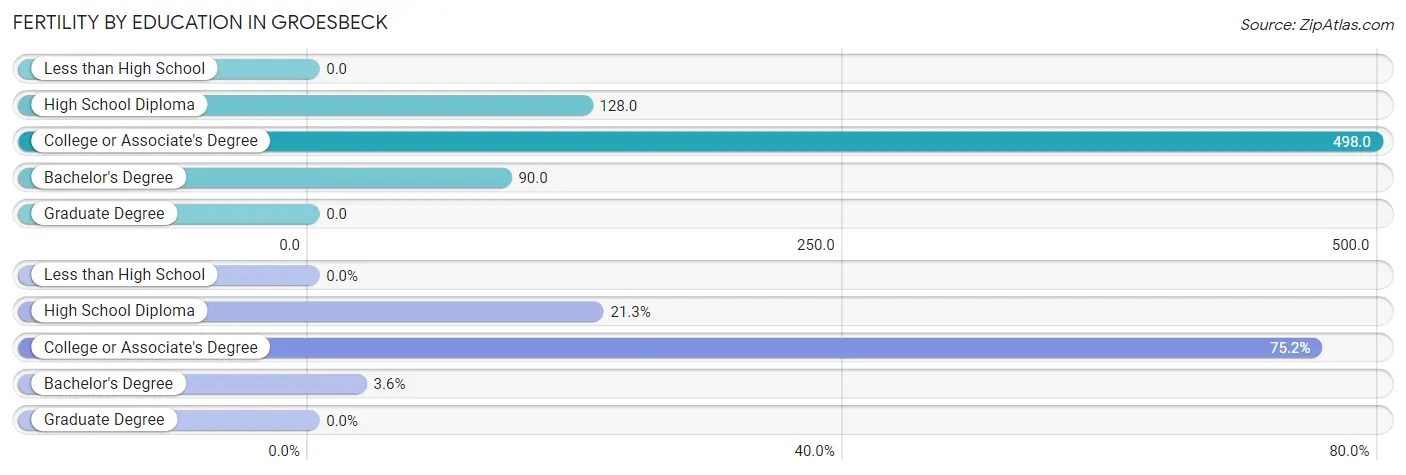
| Educational Attainment | Women with Births | Births / 1,000 Women |
| Less than High School | 0 (0.0%) | 0.0 |
| High School Diploma | 36 (21.3%) | 128.0 |
| College or Associate's Degree | 127 (75.1%) | 498.0 |
| Bachelor's Degree | 6 (3.5%) | 90.0 |
| Graduate Degree | 0 (0.0%) | 0.0 |
| Total | 169 (100.0%) | 259.0 |
Fertility by Education by Marriage Status in Groesbeck
96.5% of women with births in Groesbeck are unmarried. Women with the educational attainment of bachelor's degree are most likely to be married with 100.0% of them married at childbirth, while women with the educational attainment of high school diploma are least likely to be married with 100.0% of them unmarried at childbirth.

| Educational Attainment | Married | Unmarried |
| Less than High School | 0 (0.0%) | 0 (0.0%) |
| High School Diploma | 0 (0.0%) | 36 (100.0%) |
| College or Associate's Degree | 0 (0.0%) | 127 (100.0%) |
| Bachelor's Degree | 6 (100.0%) | 0 (0.0%) |
| Graduate Degree | 0 (0.0%) | 0 (0.0%) |
| Total | 6 (3.5%) | 163 (96.5%) |
Income in Groesbeck
Income Overview in Groesbeck
Per Capita Income in Groesbeck is $29,195, while median incomes of families and households are $58,759 and $47,500 respectively.
| Characteristic | Number | Measure |
| Per Capita Income | 3,661 | $29,195 |
| Median Family Income | 850 | $58,759 |
| Mean Family Income | 850 | $88,687 |
| Median Household Income | 1,296 | $47,500 |
| Mean Household Income | 1,296 | $74,045 |
| Income Deficit | 850 | $0 |
| Wage / Income Gap (%) | 3,661 | 31.04% |
| Wage / Income Gap ($) | 3,661 | 68.96¢ per $1 |
| Gini / Inequality Index | 3,661 | 0.46 |
Earnings by Sex in Groesbeck
Average Earnings in Groesbeck are $32,328, $45,304 for men and $31,241 for women, a difference of 31.0%.
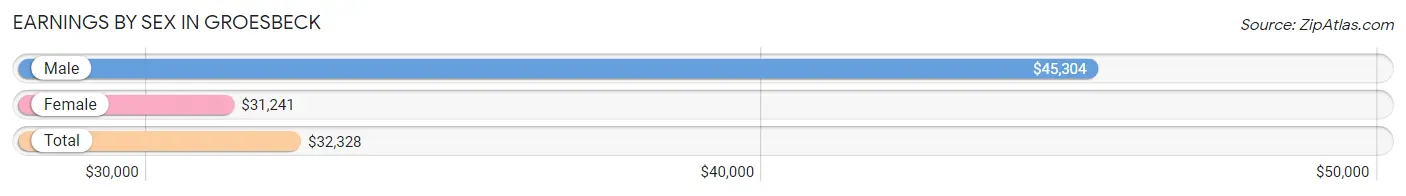
| Sex | Number | Average Earnings |
| Male | 904 (55.4%) | $45,304 |
| Female | 729 (44.6%) | $31,241 |
| Total | 1,633 (100.0%) | $32,328 |
Earnings by Sex by Income Bracket in Groesbeck
The most common earnings brackets in Groesbeck are $55,000 to $64,999 for men (157 | 17.4%) and $30,000 to $34,999 for women (167 | 22.9%).
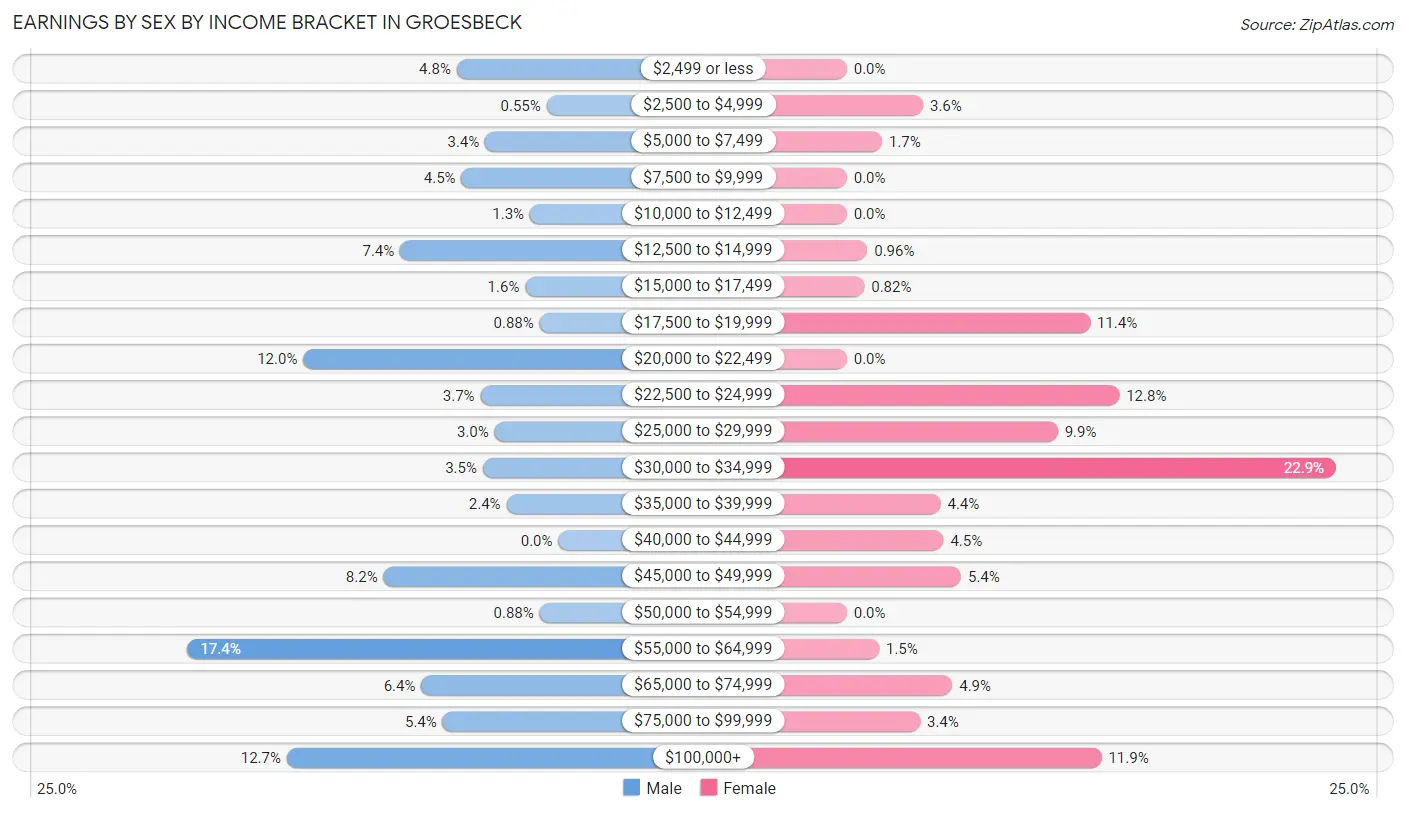
| Income | Male | Female |
| $2,499 or less | 43 (4.8%) | 0 (0.0%) |
| $2,500 to $4,999 | 5 (0.5%) | 26 (3.6%) |
| $5,000 to $7,499 | 31 (3.4%) | 12 (1.7%) |
| $7,500 to $9,999 | 41 (4.5%) | 0 (0.0%) |
| $10,000 to $12,499 | 12 (1.3%) | 0 (0.0%) |
| $12,500 to $14,999 | 67 (7.4%) | 7 (1.0%) |
| $15,000 to $17,499 | 14 (1.5%) | 6 (0.8%) |
| $17,500 to $19,999 | 8 (0.9%) | 83 (11.4%) |
| $20,000 to $22,499 | 108 (11.9%) | 0 (0.0%) |
| $22,500 to $24,999 | 33 (3.6%) | 93 (12.8%) |
| $25,000 to $29,999 | 27 (3.0%) | 72 (9.9%) |
| $30,000 to $34,999 | 32 (3.5%) | 167 (22.9%) |
| $35,000 to $39,999 | 22 (2.4%) | 32 (4.4%) |
| $40,000 to $44,999 | 0 (0.0%) | 33 (4.5%) |
| $45,000 to $49,999 | 74 (8.2%) | 39 (5.3%) |
| $50,000 to $54,999 | 8 (0.9%) | 0 (0.0%) |
| $55,000 to $64,999 | 157 (17.4%) | 11 (1.5%) |
| $65,000 to $74,999 | 58 (6.4%) | 36 (4.9%) |
| $75,000 to $99,999 | 49 (5.4%) | 25 (3.4%) |
| $100,000+ | 115 (12.7%) | 87 (11.9%) |
| Total | 904 (100.0%) | 729 (100.0%) |
Earnings by Sex by Educational Attainment in Groesbeck
Average earnings in Groesbeck are $50,469 for men and $31,449 for women, a difference of 37.7%. Men with an educational attainment of graduate degree enjoy the highest average annual earnings of $145,000, while those with college or associate's degree education earn the least with $47,132. Women with an educational attainment of graduate degree earn the most with the average annual earnings of $77,143, while those with high school diploma education have the smallest earnings of $24,009.
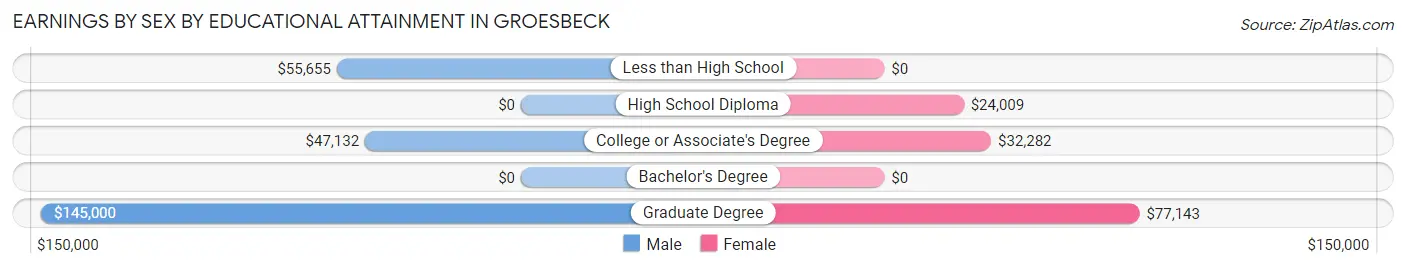
| Educational Attainment | Male Income | Female Income |
| Less than High School | $55,655 | $0 |
| High School Diploma | - | - |
| College or Associate's Degree | $47,132 | $32,282 |
| Bachelor's Degree | - | - |
| Graduate Degree | $145,000 | $77,143 |
| Total | $50,469 | $31,449 |
Family Income in Groesbeck
Family Income Brackets in Groesbeck
According to the Groesbeck family income data, there are 226 families falling into the $50,000 to $74,999 income range, which is the most common income bracket and makes up 26.6% of all families.
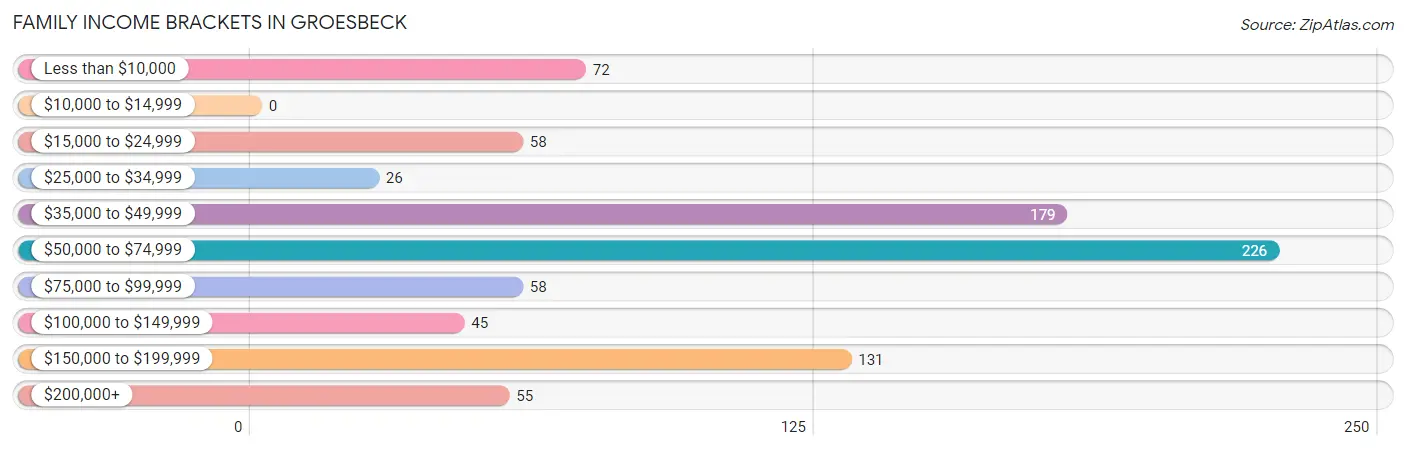
| Income Bracket | # Families | % Families |
| Less than $10,000 | 72 | 8.5% |
| $10,000 to $14,999 | 0 | 0.0% |
| $15,000 to $24,999 | 58 | 6.8% |
| $25,000 to $34,999 | 26 | 3.1% |
| $35,000 to $49,999 | 179 | 21.1% |
| $50,000 to $74,999 | 226 | 26.6% |
| $75,000 to $99,999 | 58 | 6.8% |
| $100,000 to $149,999 | 45 | 5.3% |
| $150,000 to $199,999 | 131 | 15.4% |
| $200,000+ | 55 | 6.5% |
Family Income by Famaliy Size in Groesbeck
6-person families (133 | 15.7%) account for the highest median family income in Groesbeck with $190,712 per family, while 5-person families (25 | 2.9%) have the highest median income of $32,153 per family member.
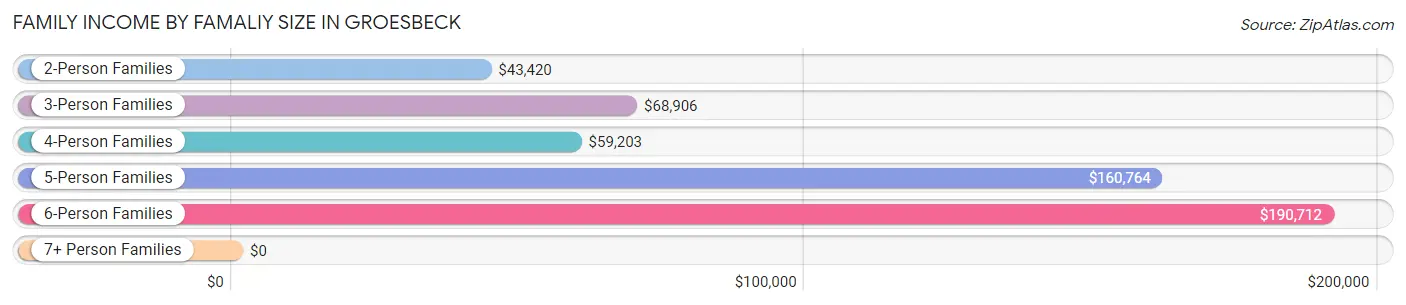
| Income Bracket | # Families | Median Income |
| 2-Person Families | 360 (42.3%) | $43,420 |
| 3-Person Families | 145 (17.1%) | $68,906 |
| 4-Person Families | 187 (22.0%) | $59,203 |
| 5-Person Families | 25 (2.9%) | $160,764 |
| 6-Person Families | 133 (15.7%) | $190,712 |
| 7+ Person Families | 0 (0.0%) | $0 |
| Total | 850 (100.0%) | $58,759 |
Family Income by Number of Earners in Groesbeck
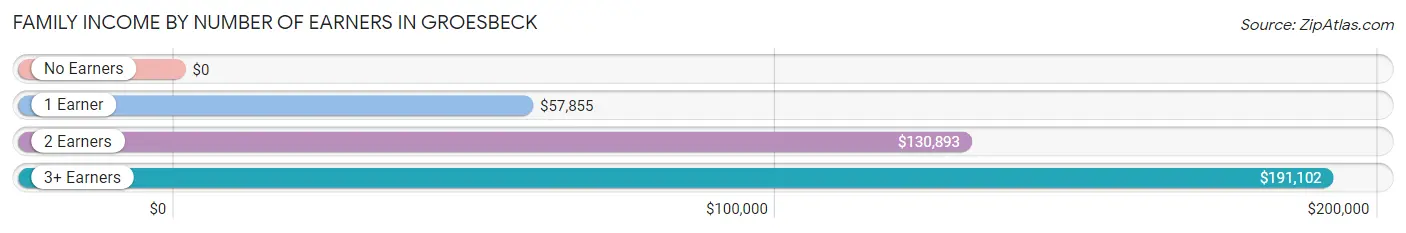
| Number of Earners | # Families | Median Income |
| No Earners | 181 (21.3%) | $0 |
| 1 Earner | 408 (48.0%) | $57,855 |
| 2 Earners | 157 (18.5%) | $130,893 |
| 3+ Earners | 104 (12.2%) | $191,102 |
| Total | 850 (100.0%) | $58,759 |
Household Income in Groesbeck
Household Income Brackets in Groesbeck
With 264 households falling in the category, the $50,000 to $74,999 income range is the most frequent in Groesbeck, accounting for 20.4% of all households. In contrast, only 53 households (4.1%) fall into the $10,000 to $14,999 income bracket, making it the least populous group.
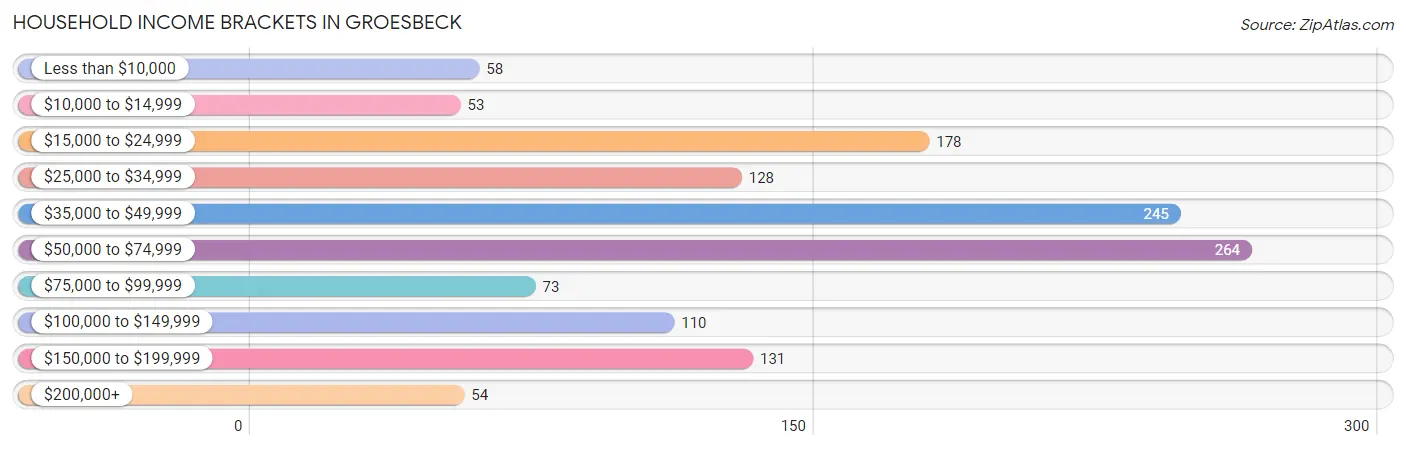
| Income Bracket | # Households | % Households |
| Less than $10,000 | 58 | 4.5% |
| $10,000 to $14,999 | 53 | 4.1% |
| $15,000 to $24,999 | 178 | 13.7% |
| $25,000 to $34,999 | 128 | 9.9% |
| $35,000 to $49,999 | 245 | 18.9% |
| $50,000 to $74,999 | 264 | 20.4% |
| $75,000 to $99,999 | 73 | 5.6% |
| $100,000 to $149,999 | 110 | 8.5% |
| $150,000 to $199,999 | 131 | 10.1% |
| $200,000+ | 54 | 4.2% |
Household Income by Householder Age in Groesbeck
The median household income in Groesbeck is $47,500, with the highest median household income of $71,094 found in the 65+ years age bracket for the primary householder. A total of 339 households (26.2%) fall into this category.
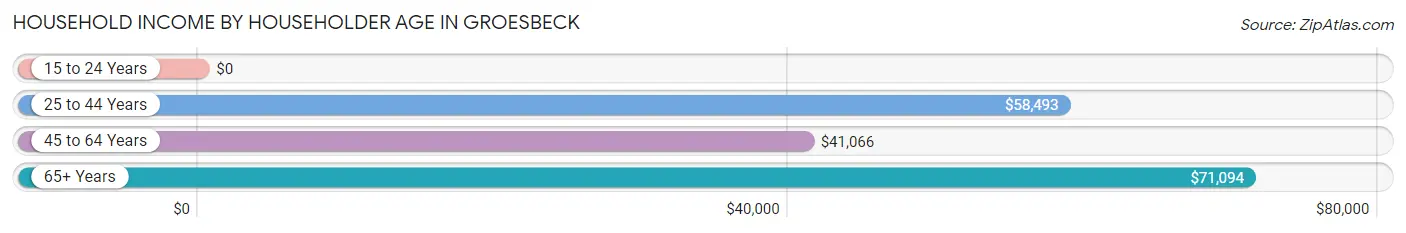
| Income Bracket | # Households | Median Income |
| 15 to 24 Years | 0 (0.0%) | $0 |
| 25 to 44 Years | 472 (36.4%) | $58,493 |
| 45 to 64 Years | 485 (37.4%) | $41,066 |
| 65+ Years | 339 (26.2%) | $71,094 |
| Total | 1,296 (100.0%) | $47,500 |
Poverty in Groesbeck
Income Below Poverty by Sex and Age in Groesbeck
With 14.3% poverty level for males and 11.4% for females among the residents of Groesbeck, 18 to 24 year old males and 5 year old females are the most vulnerable to poverty, with 57 males (41.0%) and 23 females (100.0%) in their respective age groups living below the poverty level.
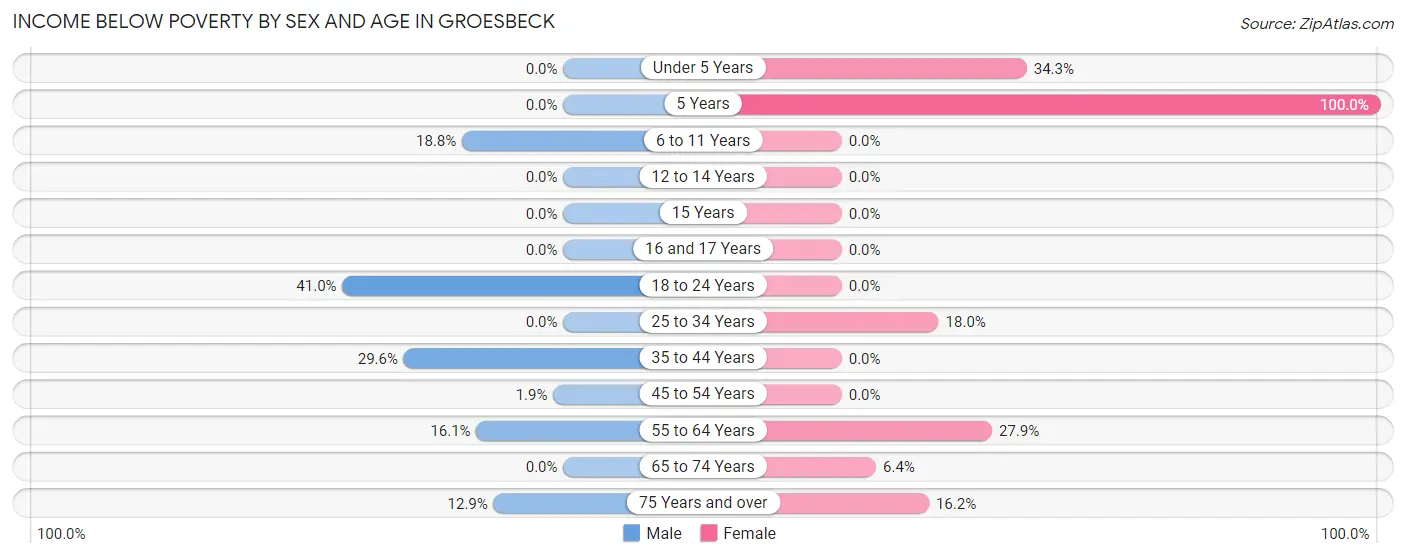
| Age Bracket | Male | Female |
| Under 5 Years | 0 (0.0%) | 34 (34.3%) |
| 5 Years | 0 (0.0%) | 23 (100.0%) |
| 6 to 11 Years | 31 (18.8%) | 0 (0.0%) |
| 12 to 14 Years | 0 (0.0%) | 0 (0.0%) |
| 15 Years | 0 (0.0%) | 0 (0.0%) |
| 16 and 17 Years | 0 (0.0%) | 0 (0.0%) |
| 18 to 24 Years | 57 (41.0%) | 0 (0.0%) |
| 25 to 34 Years | 0 (0.0%) | 48 (18.0%) |
| 35 to 44 Years | 101 (29.6%) | 0 (0.0%) |
| 45 to 54 Years | 4 (1.9%) | 0 (0.0%) |
| 55 to 64 Years | 40 (16.1%) | 41 (27.9%) |
| 65 to 74 Years | 0 (0.0%) | 16 (6.4%) |
| 75 Years and over | 11 (12.9%) | 22 (16.2%) |
| Total | 244 (14.3%) | 184 (11.4%) |
Income Above Poverty by Sex and Age in Groesbeck
According to the poverty statistics in Groesbeck, males aged under 5 years and females aged 6 to 11 years are the age groups that are most secure financially, with 100.0% of males and 100.0% of females in these age groups living above the poverty line.
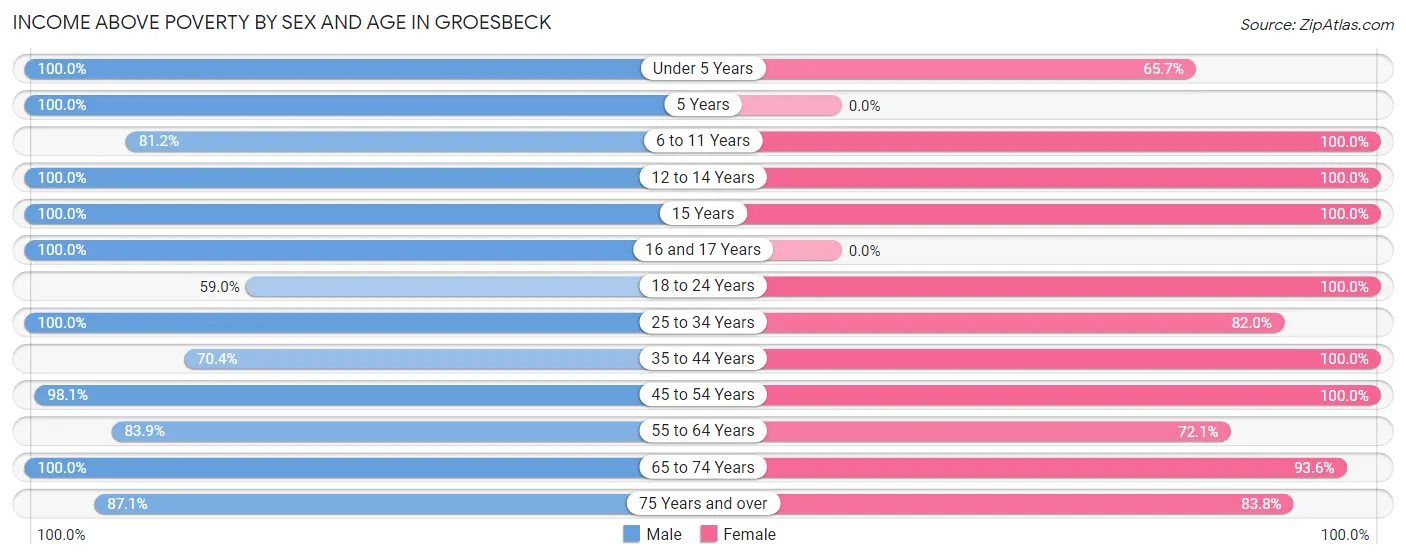
| Age Bracket | Male | Female |
| Under 5 Years | 93 (100.0%) | 65 (65.7%) |
| 5 Years | 18 (100.0%) | 0 (0.0%) |
| 6 to 11 Years | 134 (81.2%) | 112 (100.0%) |
| 12 to 14 Years | 38 (100.0%) | 138 (100.0%) |
| 15 Years | 13 (100.0%) | 38 (100.0%) |
| 16 and 17 Years | 66 (100.0%) | 0 (0.0%) |
| 18 to 24 Years | 82 (59.0%) | 61 (100.0%) |
| 25 to 34 Years | 239 (100.0%) | 219 (82.0%) |
| 35 to 44 Years | 240 (70.4%) | 116 (100.0%) |
| 45 to 54 Years | 211 (98.1%) | 227 (100.0%) |
| 55 to 64 Years | 208 (83.9%) | 106 (72.1%) |
| 65 to 74 Years | 41 (100.0%) | 235 (93.6%) |
| 75 Years and over | 74 (87.1%) | 114 (83.8%) |
| Total | 1,457 (85.7%) | 1,431 (88.6%) |
Income Below Poverty Among Married-Couple Families in Groesbeck
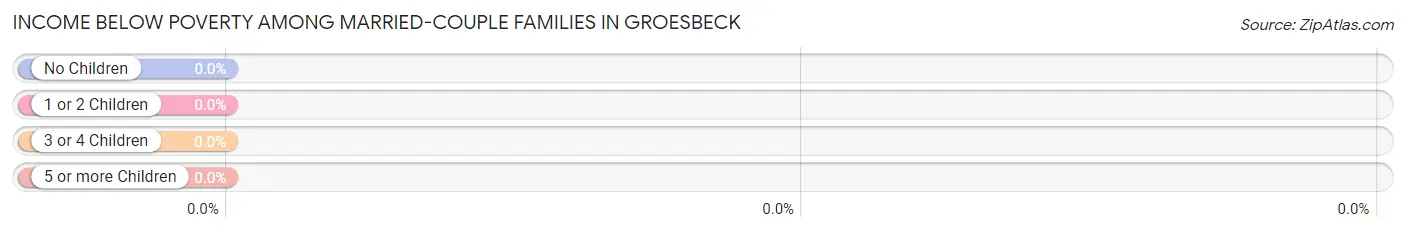
| Children | Above Poverty | Below Poverty |
| No Children | 162 (100.0%) | 0 (0.0%) |
| 1 or 2 Children | 135 (100.0%) | 0 (0.0%) |
| 3 or 4 Children | 40 (100.0%) | 0 (0.0%) |
| 5 or more Children | 0 (0.0%) | 0 (0.0%) |
| Total | 337 (100.0%) | 0 (0.0%) |
Income Below Poverty Among Single-Parent Households in Groesbeck
According to the poverty data in Groesbeck, 60.5% or 72 single-father households and 12.9% or 51 single-mother households are living below the poverty line. Among single-father households, those with 1 or 2 children have the highest poverty rate, with 60 households (100.0%) experiencing poverty. Likewise, among single-mother households, those with 1 or 2 children have the highest poverty rate, with 36 households (22.2%) falling below the poverty line.
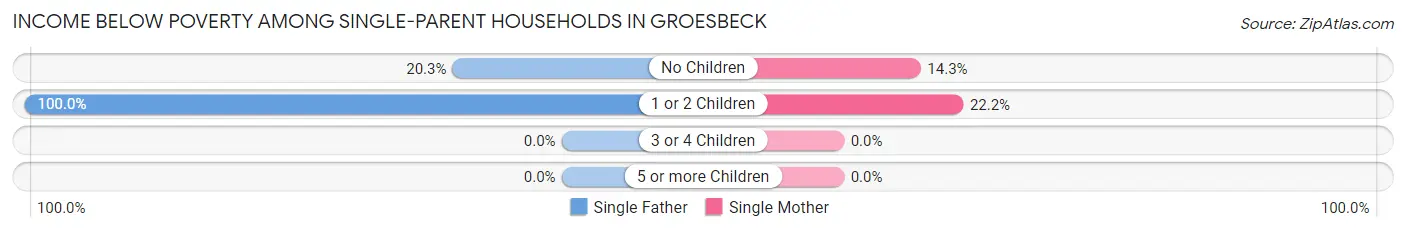
| Children | Single Father | Single Mother |
| No Children | 12 (20.3%) | 15 (14.3%) |
| 1 or 2 Children | 60 (100.0%) | 36 (22.2%) |
| 3 or 4 Children | 0 (0.0%) | 0 (0.0%) |
| 5 or more Children | 0 (0.0%) | 0 (0.0%) |
| Total | 72 (60.5%) | 51 (12.9%) |
Income Below Poverty Among Married-Couple vs Single-Parent Households in Groesbeck
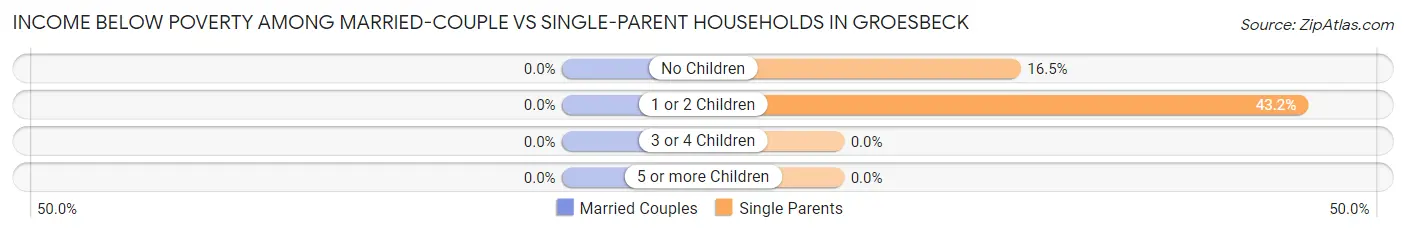
| Children | Married-Couple Families | Single-Parent Households |
| No Children | 0 (0.0%) | 27 (16.5%) |
| 1 or 2 Children | 0 (0.0%) | 96 (43.2%) |
| 3 or 4 Children | 0 (0.0%) | 0 (0.0%) |
| 5 or more Children | 0 (0.0%) | 0 (0.0%) |
| Total | 0 (0.0%) | 123 (24.0%) |
Employment Characteristics in Groesbeck
Employment by Class of Employer in Groesbeck
Among the 1,406 employed individuals in Groesbeck, private company employees (942 | 67.0%), state government employees (229 | 16.3%), and local government employees (113 | 8.0%) make up the most common classes of employment.
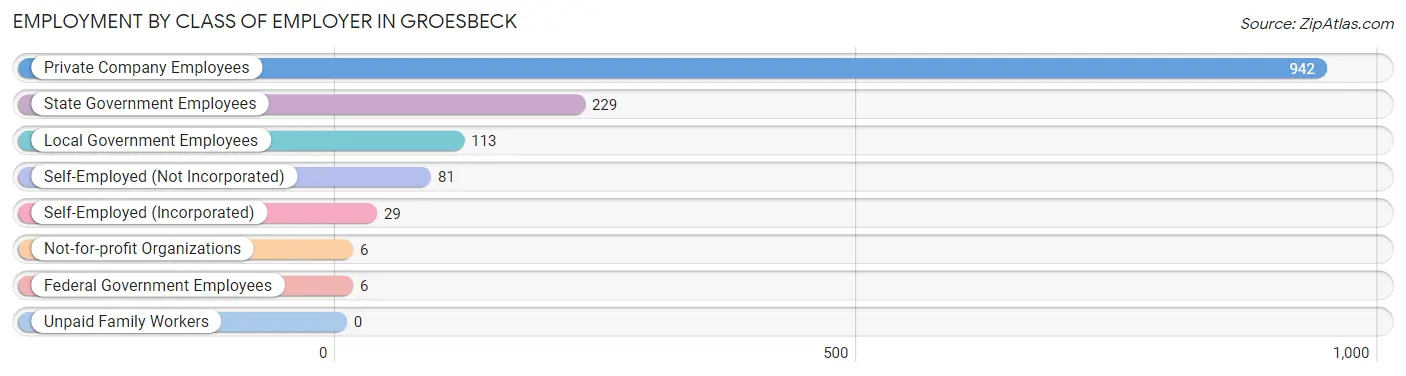
| Employer Class | # Employees | % Employees |
| Private Company Employees | 942 | 67.0% |
| Self-Employed (Incorporated) | 29 | 2.1% |
| Self-Employed (Not Incorporated) | 81 | 5.8% |
| Not-for-profit Organizations | 6 | 0.4% |
| Local Government Employees | 113 | 8.0% |
| State Government Employees | 229 | 16.3% |
| Federal Government Employees | 6 | 0.4% |
| Unpaid Family Workers | 0 | 0.0% |
| Total | 1,406 | 100.0% |
Employment Status by Age in Groesbeck
According to the labor force statistics for Groesbeck, out of the total population over 16 years of age (2,924), 48.6% or 1,421 individuals are in the labor force, with 1.0% or 14 of them unemployed. The age group with the highest labor force participation rate is 45 to 54 years, with 85.0% or 408 individuals in the labor force. Within the labor force, the 16 to 19 years age range has the highest percentage of unemployed individuals, with 15.4% or 2 of them being unemployed.
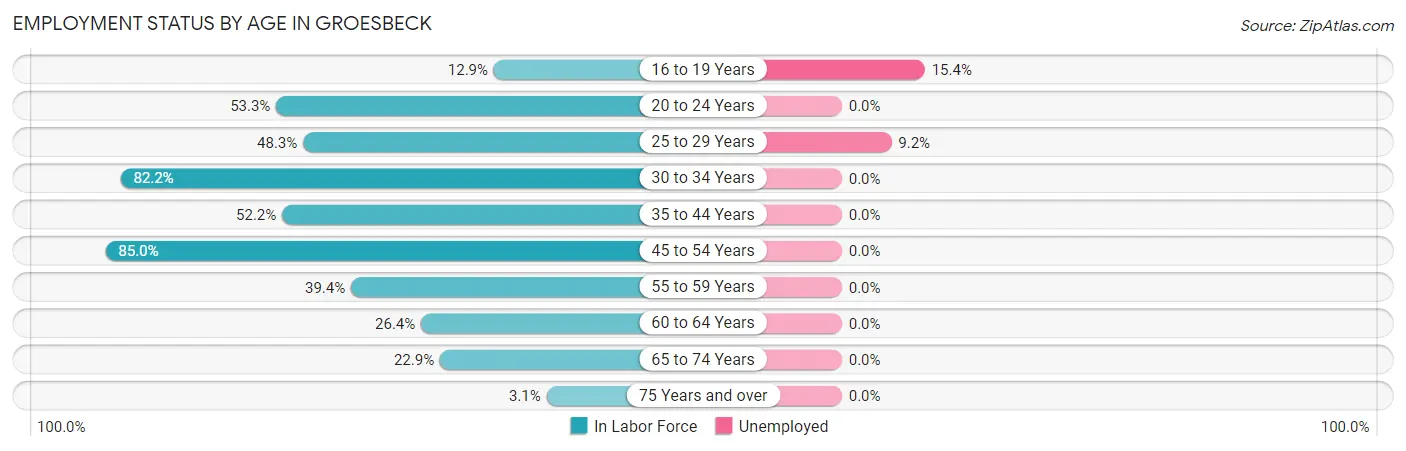
| Age Bracket | In Labor Force | Unemployed |
| 16 to 19 Years | 13 (12.9%) | 2 (15.4%) |
| 20 to 24 Years | 114 (53.3%) | 0 (0.0%) |
| 25 to 29 Years | 130 (48.3%) | 12 (9.2%) |
| 30 to 34 Years | 278 (82.2%) | 0 (0.0%) |
| 35 to 44 Years | 261 (52.2%) | 0 (0.0%) |
| 45 to 54 Years | 408 (85.0%) | 0 (0.0%) |
| 55 to 59 Years | 74 (39.4%) | 0 (0.0%) |
| 60 to 64 Years | 62 (26.4%) | 0 (0.0%) |
| 65 to 74 Years | 71 (22.9%) | 0 (0.0%) |
| 75 Years and over | 9 (3.1%) | 0 (0.0%) |
| Total | 1,421 (48.6%) | 14 (1.0%) |
Employment Status by Educational Attainment in Groesbeck
According to labor force statistics for Groesbeck, 60.3% of individuals (1,212) out of the total population between 25 and 64 years of age (2,010) are in the labor force, with 1.0% or 12 of them being unemployed. The group with the highest labor force participation rate are those with the educational attainment of bachelor's degree or higher, with 82.9% or 136 individuals in the labor force. Within the labor force, individuals with high school diploma education have the highest percentage of unemployment, with 2.8% or 12 of them being unemployed.
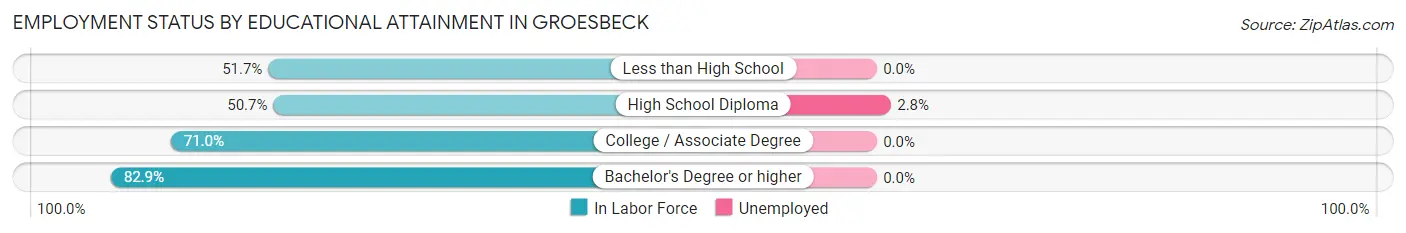
| Educational Attainment | In Labor Force | Unemployed |
| Less than High School | 171 (51.7%) | 0 (0.0%) |
| High School Diploma | 422 (50.7%) | 23 (2.8%) |
| College / Associate Degree | 484 (71.0%) | 0 (0.0%) |
| Bachelor's Degree or higher | 136 (82.9%) | 0 (0.0%) |
| Total | 1,212 (60.3%) | 20 (1.0%) |
Employment Occupations by Sex in Groesbeck
Management, Business, Science and Arts Occupations
The most common Management, Business, Science and Arts occupations in Groesbeck are Management (102 | 7.2%), Business & Financial (59 | 4.2%), Community & Social Service (50 | 3.6%), Computers, Engineering & Science (48 | 3.4%), and Architecture & Engineering (48 | 3.4%).

Management, Business, Science and Arts Occupations by Sex
Within the Management, Business, Science and Arts occupations in Groesbeck, the most male-oriented occupations are Computers, Engineering & Science (100.0%), Architecture & Engineering (100.0%), and Legal Services & Support (100.0%), while the most female-oriented occupations are Management (100.0%), Education, Arts & Media (100.0%), and Health Diagnosing & Treating (100.0%).
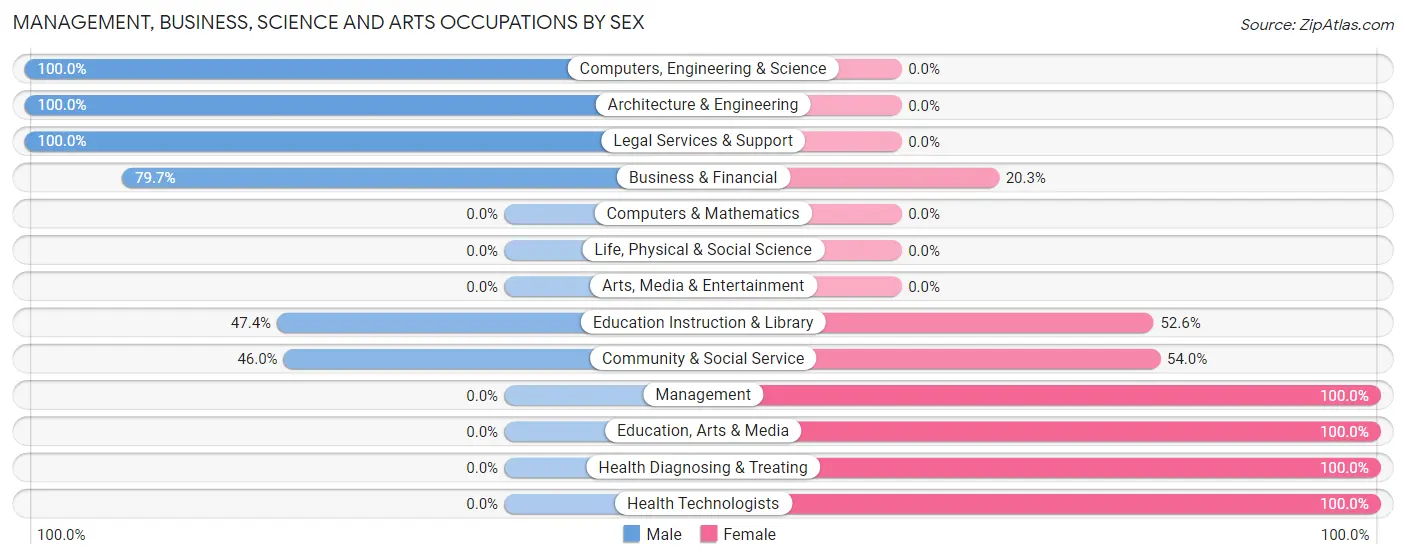
| Occupation | Male | Female |
| Management | 0 (0.0%) | 102 (100.0%) |
| Business & Financial | 47 (79.7%) | 12 (20.3%) |
| Computers, Engineering & Science | 48 (100.0%) | 0 (0.0%) |
| Computers & Mathematics | 0 (0.0%) | 0 (0.0%) |
| Architecture & Engineering | 48 (100.0%) | 0 (0.0%) |
| Life, Physical & Social Science | 0 (0.0%) | 0 (0.0%) |
| Community & Social Service | 23 (46.0%) | 27 (54.0%) |
| Education, Arts & Media | 0 (0.0%) | 7 (100.0%) |
| Legal Services & Support | 5 (100.0%) | 0 (0.0%) |
| Education Instruction & Library | 18 (47.4%) | 20 (52.6%) |
| Arts, Media & Entertainment | 0 (0.0%) | 0 (0.0%) |
| Health Diagnosing & Treating | 0 (0.0%) | 34 (100.0%) |
| Health Technologists | 0 (0.0%) | 34 (100.0%) |
| Total (Category) | 118 (40.3%) | 175 (59.7%) |
| Total (Overall) | 741 (52.7%) | 665 (47.3%) |
Services Occupations
The most common Services occupations in Groesbeck are Healthcare Support (135 | 9.6%), Security & Protection (133 | 9.5%), Law Enforcement (133 | 9.5%), Cleaning & Maintenance (65 | 4.6%), and Food Preparation & Serving (38 | 2.7%).

Services Occupations by Sex
Within the Services occupations in Groesbeck, the most male-oriented occupations are Cleaning & Maintenance (89.2%), Healthcare Support (31.9%), and Food Preparation & Serving (21.0%), while the most female-oriented occupations are Security & Protection (100.0%), Law Enforcement (100.0%), and Personal Care & Service (100.0%).
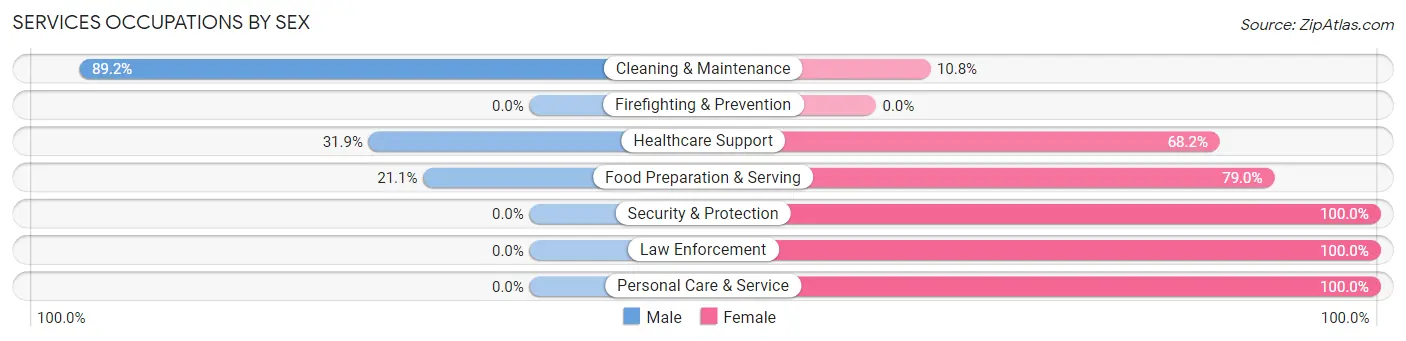
| Occupation | Male | Female |
| Healthcare Support | 43 (31.9%) | 92 (68.1%) |
| Security & Protection | 0 (0.0%) | 133 (100.0%) |
| Firefighting & Prevention | 0 (0.0%) | 0 (0.0%) |
| Law Enforcement | 0 (0.0%) | 133 (100.0%) |
| Food Preparation & Serving | 8 (21.0%) | 30 (78.9%) |
| Cleaning & Maintenance | 58 (89.2%) | 7 (10.8%) |
| Personal Care & Service | 0 (0.0%) | 19 (100.0%) |
| Total (Category) | 109 (28.0%) | 281 (72.1%) |
| Total (Overall) | 741 (52.7%) | 665 (47.3%) |
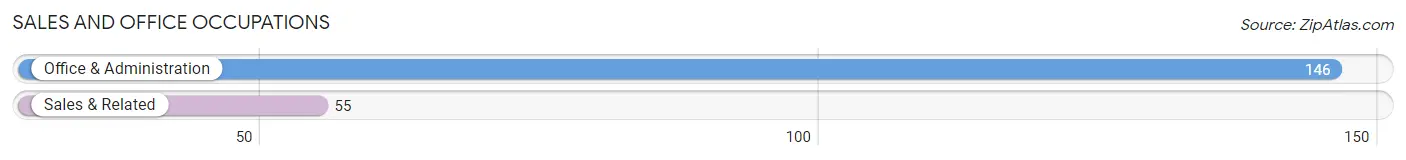
Sales and Office Occupations
The most common Sales and Office occupations in Groesbeck are Office & Administration (146 | 10.4%), and Sales & Related (55 | 3.9%).
Sales and Office Occupations by Sex
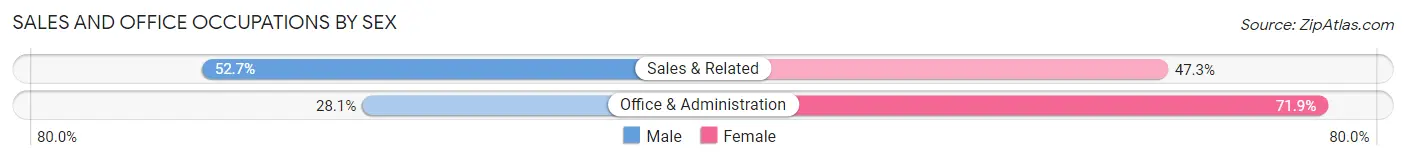
| Occupation | Male | Female |
| Sales & Related | 29 (52.7%) | 26 (47.3%) |
| Office & Administration | 41 (28.1%) | 105 (71.9%) |
| Total (Category) | 70 (34.8%) | 131 (65.2%) |
| Total (Overall) | 741 (52.7%) | 665 (47.3%) |
Natural Resources, Construction and Maintenance Occupations
The most common Natural Resources, Construction and Maintenance occupations in Groesbeck are Installation, Maintenance & Repair (136 | 9.7%), and Construction & Extraction (41 | 2.9%).
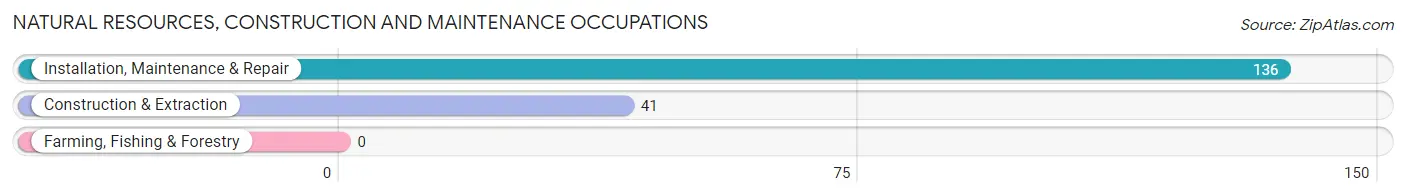
Natural Resources, Construction and Maintenance Occupations by Sex
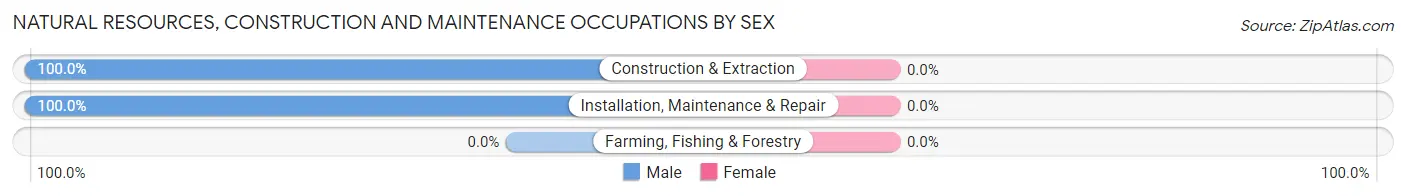
| Occupation | Male | Female |
| Farming, Fishing & Forestry | 0 (0.0%) | 0 (0.0%) |
| Construction & Extraction | 41 (100.0%) | 0 (0.0%) |
| Installation, Maintenance & Repair | 136 (100.0%) | 0 (0.0%) |
| Total (Category) | 177 (100.0%) | 0 (0.0%) |
| Total (Overall) | 741 (52.7%) | 665 (47.3%) |
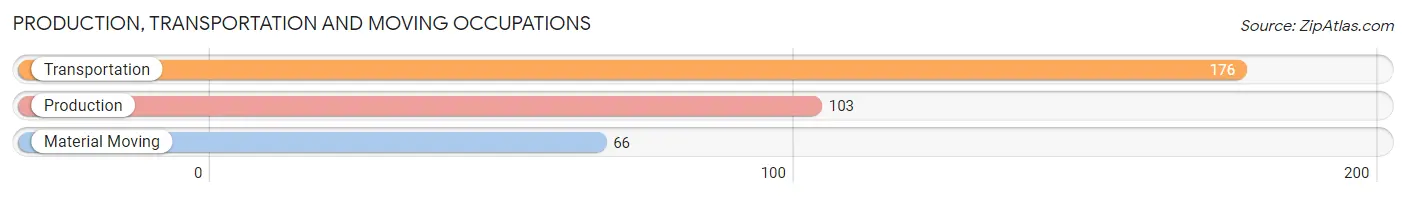
Production, Transportation and Moving Occupations
The most common Production, Transportation and Moving occupations in Groesbeck are Transportation (176 | 12.5%), Production (103 | 7.3%), and Material Moving (66 | 4.7%).
Production, Transportation and Moving Occupations by Sex
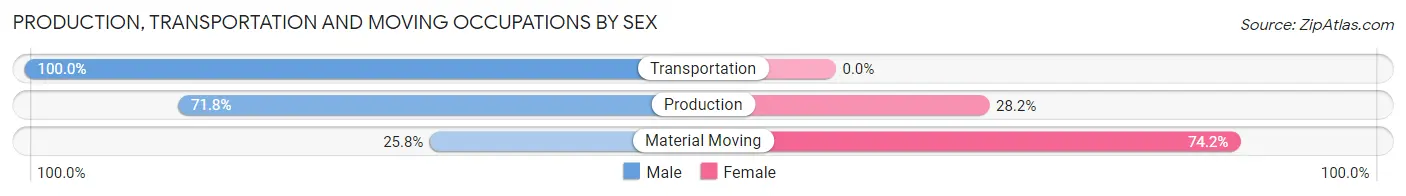
| Occupation | Male | Female |
| Production | 74 (71.8%) | 29 (28.2%) |
| Transportation | 176 (100.0%) | 0 (0.0%) |
| Material Moving | 17 (25.8%) | 49 (74.2%) |
| Total (Category) | 267 (77.4%) | 78 (22.6%) |
| Total (Overall) | 741 (52.7%) | 665 (47.3%) |
Employment Industries by Sex in Groesbeck
Employment Industries in Groesbeck
The major employment industries in Groesbeck include Health Care & Social Assistance (341 | 24.2%), Public Administration (172 | 12.2%), Manufacturing (128 | 9.1%), Retail Trade (127 | 9.0%), and Construction (111 | 7.9%).

Employment Industries by Sex in Groesbeck
The Groesbeck industries that see more men than women are Agriculture, Fishing & Hunting (100.0%), Mining, Quarrying, & Extraction (100.0%), and Construction (100.0%), whereas the industries that tend to have a higher number of women are Finance & Insurance (100.0%), Arts, Entertainment & Recreation (100.0%), and Public Administration (94.8%).
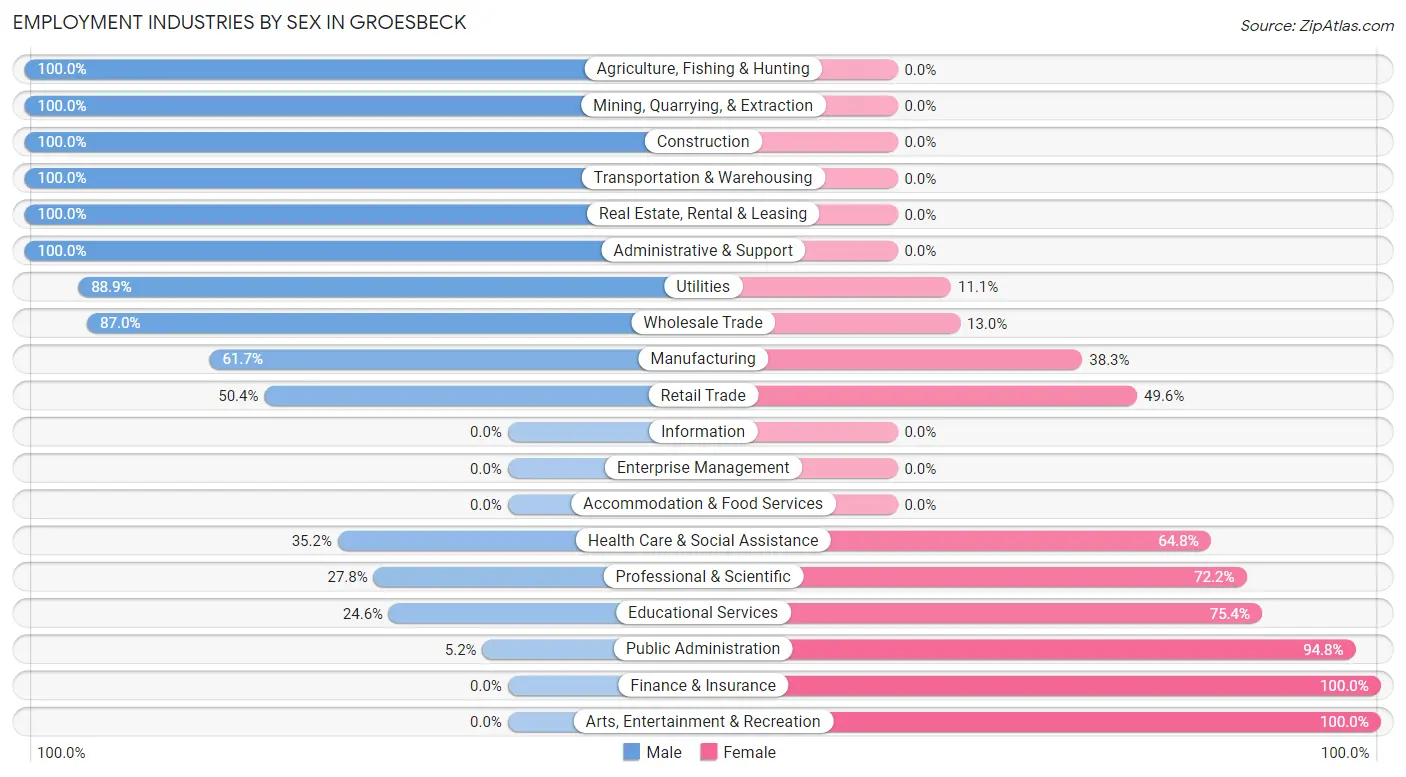
| Industry | Male | Female |
| Agriculture, Fishing & Hunting | 10 (100.0%) | 0 (0.0%) |
| Mining, Quarrying, & Extraction | 42 (100.0%) | 0 (0.0%) |
| Construction | 111 (100.0%) | 0 (0.0%) |
| Manufacturing | 79 (61.7%) | 49 (38.3%) |
| Wholesale Trade | 47 (87.0%) | 7 (13.0%) |
| Retail Trade | 64 (50.4%) | 63 (49.6%) |
| Transportation & Warehousing | 28 (100.0%) | 0 (0.0%) |
| Utilities | 48 (88.9%) | 6 (11.1%) |
| Information | 0 (0.0%) | 0 (0.0%) |
| Finance & Insurance | 0 (0.0%) | 89 (100.0%) |
| Real Estate, Rental & Leasing | 105 (100.0%) | 0 (0.0%) |
| Professional & Scientific | 5 (27.8%) | 13 (72.2%) |
| Enterprise Management | 0 (0.0%) | 0 (0.0%) |
| Administrative & Support | 58 (100.0%) | 0 (0.0%) |
| Educational Services | 15 (24.6%) | 46 (75.4%) |
| Health Care & Social Assistance | 120 (35.2%) | 221 (64.8%) |
| Arts, Entertainment & Recreation | 0 (0.0%) | 8 (100.0%) |
| Accommodation & Food Services | 0 (0.0%) | 0 (0.0%) |
| Public Administration | 9 (5.2%) | 163 (94.8%) |
| Total | 741 (52.7%) | 665 (47.3%) |
Education in Groesbeck
School Enrollment in Groesbeck
The most common levels of schooling among the 644 students in Groesbeck are high school (235 | 36.5%), elementary school (170 | 26.4%), and middle school (146 | 22.7%).
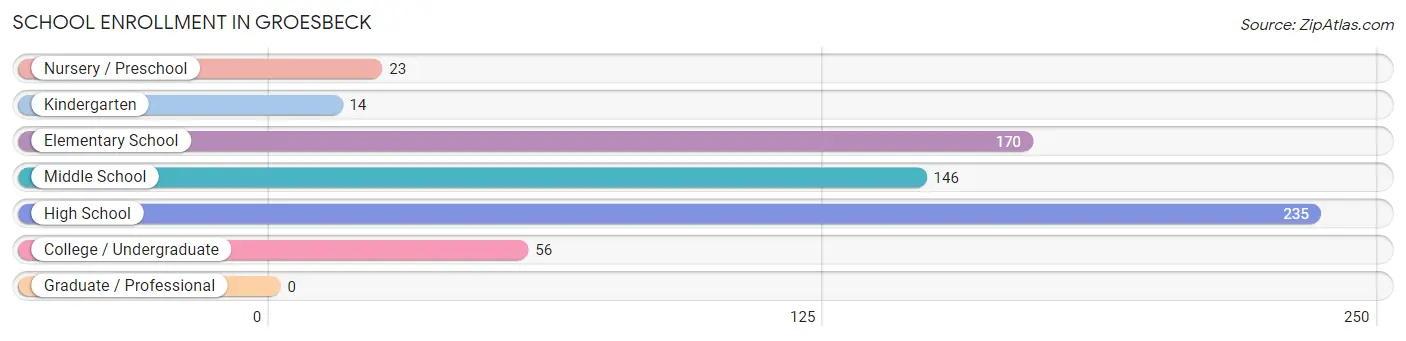
| School Level | # Students | % Students |
| Nursery / Preschool | 23 | 3.6% |
| Kindergarten | 14 | 2.2% |
| Elementary School | 170 | 26.4% |
| Middle School | 146 | 22.7% |
| High School | 235 | 36.5% |
| College / Undergraduate | 56 | 8.7% |
| Graduate / Professional | 0 | 0.0% |
| Total | 644 | 100.0% |
School Enrollment by Age by Funding Source in Groesbeck
Out of a total of 644 students who are enrolled in schools in Groesbeck, 31 (4.8%) attend a private institution, while the remaining 613 (95.2%) are enrolled in public schools. The age group of 35 years and over has the highest likelihood of being enrolled in private schools, with 12 (75.0% in the age bracket) enrolled. Conversely, the age group of 5 to 9 year old has the lowest likelihood of being enrolled in a private school, with 188 (100.0% in the age bracket) attending a public institution.
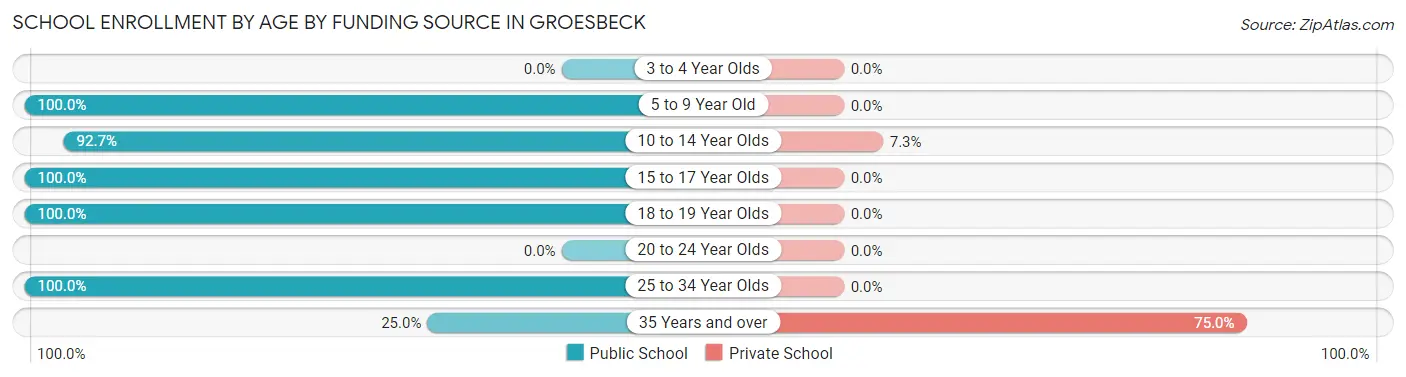
| Age Bracket | Public School | Private School |
| 3 to 4 Year Olds | 0 (0.0%) | 0 (0.0%) |
| 5 to 9 Year Old | 188 (100.0%) | 0 (0.0%) |
| 10 to 14 Year Olds | 242 (92.7%) | 19 (7.3%) |
| 15 to 17 Year Olds | 117 (100.0%) | 0 (0.0%) |
| 18 to 19 Year Olds | 24 (100.0%) | 0 (0.0%) |
| 20 to 24 Year Olds | 0 (0.0%) | 0 (0.0%) |
| 25 to 34 Year Olds | 38 (100.0%) | 0 (0.0%) |
| 35 Years and over | 4 (25.0%) | 12 (75.0%) |
| Total | 613 (95.2%) | 31 (4.8%) |
Educational Attainment by Field of Study in Groesbeck
Education (129 | 41.3%), arts & humanities (39 | 12.5%), computers & mathematics (23 | 7.4%), physical & health sciences (23 | 7.4%), and business (23 | 7.4%) are the most common fields of study among 312 individuals in Groesbeck who have obtained a bachelor's degree or higher.
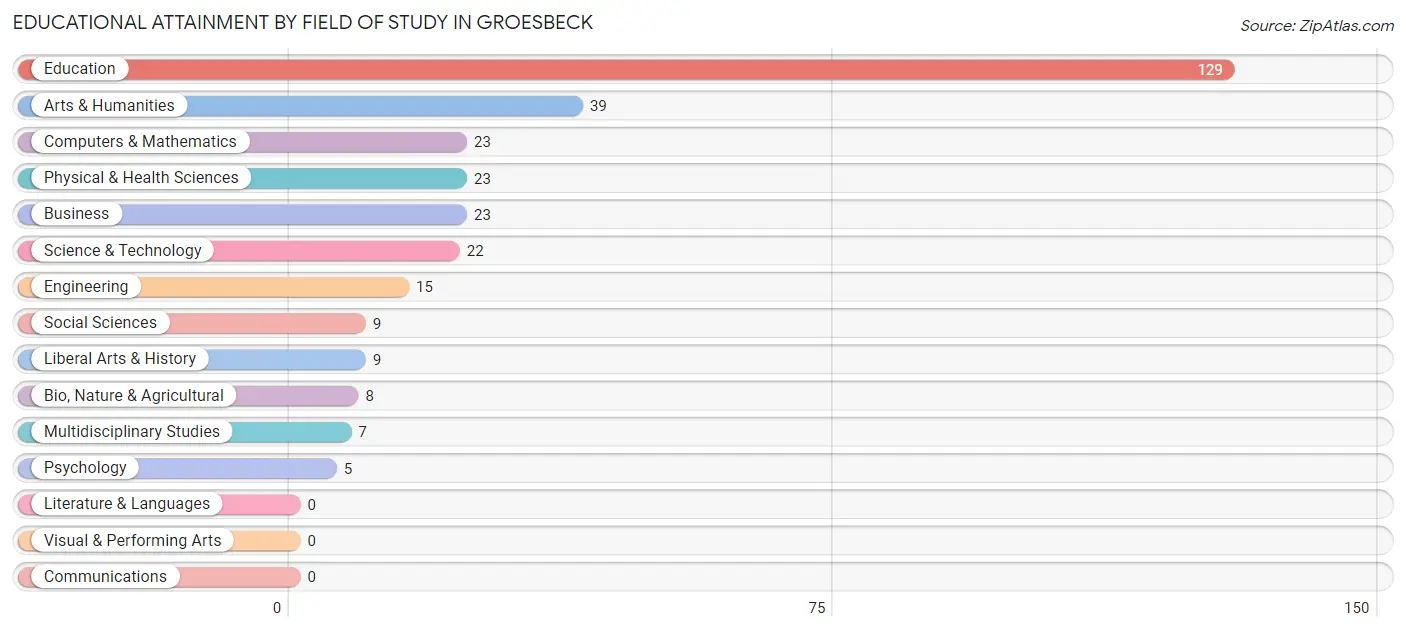
| Field of Study | # Graduates | % Graduates |
| Computers & Mathematics | 23 | 7.4% |
| Bio, Nature & Agricultural | 8 | 2.6% |
| Physical & Health Sciences | 23 | 7.4% |
| Psychology | 5 | 1.6% |
| Social Sciences | 9 | 2.9% |
| Engineering | 15 | 4.8% |
| Multidisciplinary Studies | 7 | 2.2% |
| Science & Technology | 22 | 7.0% |
| Business | 23 | 7.4% |
| Education | 129 | 41.3% |
| Literature & Languages | 0 | 0.0% |
| Liberal Arts & History | 9 | 2.9% |
| Visual & Performing Arts | 0 | 0.0% |
| Communications | 0 | 0.0% |
| Arts & Humanities | 39 | 12.5% |
| Total | 312 | 100.0% |
Transportation & Commute in Groesbeck
Vehicle Availability by Sex in Groesbeck
The most prevalent vehicle ownership categories in Groesbeck are males with 2 vehicles (442, accounting for 59.7%) and females with 2 vehicles (268, making up 66.5%).
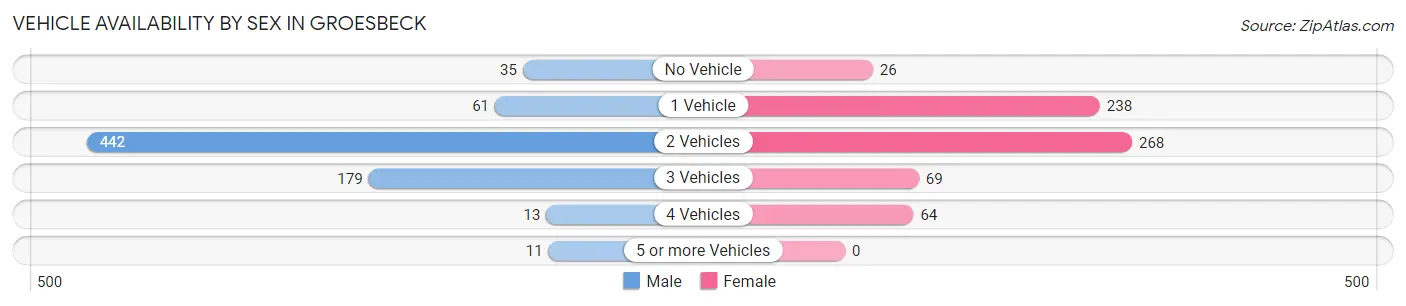
| Vehicles Available | Male | Female |
| No Vehicle | 35 (4.7%) | 26 (3.9%) |
| 1 Vehicle | 61 (8.2%) | 238 (35.8%) |
| 2 Vehicles | 442 (59.7%) | 268 (40.3%) |
| 3 Vehicles | 179 (24.2%) | 69 (10.4%) |
| 4 Vehicles | 13 (1.8%) | 64 (9.6%) |
| 5 or more Vehicles | 11 (1.5%) | 0 (0.0%) |
| Total | 741 (100.0%) | 665 (100.0%) |
Commute Time in Groesbeck
The most frequently occuring commute durations in Groesbeck are 5 to 9 minutes (281 commuters, 22.5%), 20 to 24 minutes (221 commuters, 17.7%), and 90 or more minutes (201 commuters, 16.1%).

| Commute Time | # Commuters | % Commuters |
| Less than 5 Minutes | 145 | 11.6% |
| 5 to 9 Minutes | 281 | 22.5% |
| 10 to 14 Minutes | 135 | 10.8% |
| 15 to 19 Minutes | 30 | 2.4% |
| 20 to 24 Minutes | 221 | 17.7% |
| 25 to 29 Minutes | 39 | 3.1% |
| 30 to 34 Minutes | 59 | 4.7% |
| 35 to 39 Minutes | 0 | 0.0% |
| 40 to 44 Minutes | 71 | 5.7% |
| 45 to 59 Minutes | 68 | 5.4% |
| 60 to 89 Minutes | 0 | 0.0% |
| 90 or more Minutes | 201 | 16.1% |
Commute Time by Sex in Groesbeck
The most common commute times in Groesbeck are 90 or more minutes (201 commuters, 28.2%) for males and 5 to 9 minutes (210 commuters, 39.0%) for females.
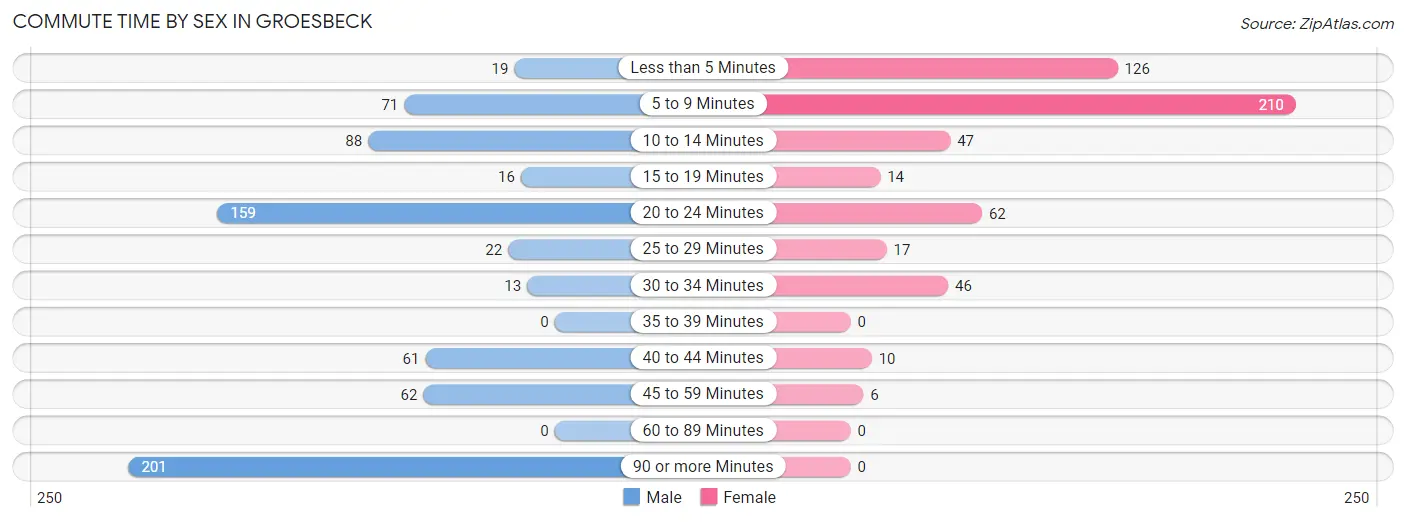
| Commute Time | Male | Female |
| Less than 5 Minutes | 19 (2.7%) | 126 (23.4%) |
| 5 to 9 Minutes | 71 (10.0%) | 210 (39.0%) |
| 10 to 14 Minutes | 88 (12.4%) | 47 (8.7%) |
| 15 to 19 Minutes | 16 (2.2%) | 14 (2.6%) |
| 20 to 24 Minutes | 159 (22.3%) | 62 (11.5%) |
| 25 to 29 Minutes | 22 (3.1%) | 17 (3.2%) |
| 30 to 34 Minutes | 13 (1.8%) | 46 (8.6%) |
| 35 to 39 Minutes | 0 (0.0%) | 0 (0.0%) |
| 40 to 44 Minutes | 61 (8.6%) | 10 (1.9%) |
| 45 to 59 Minutes | 62 (8.7%) | 6 (1.1%) |
| 60 to 89 Minutes | 0 (0.0%) | 0 (0.0%) |
| 90 or more Minutes | 201 (28.2%) | 0 (0.0%) |
Time of Departure to Work by Sex in Groesbeck
The most frequent times of departure to work in Groesbeck are 12:00 AM to 4:59 AM (207, 29.1%) for males and 7:30 AM to 7:59 AM (168, 31.2%) for females.
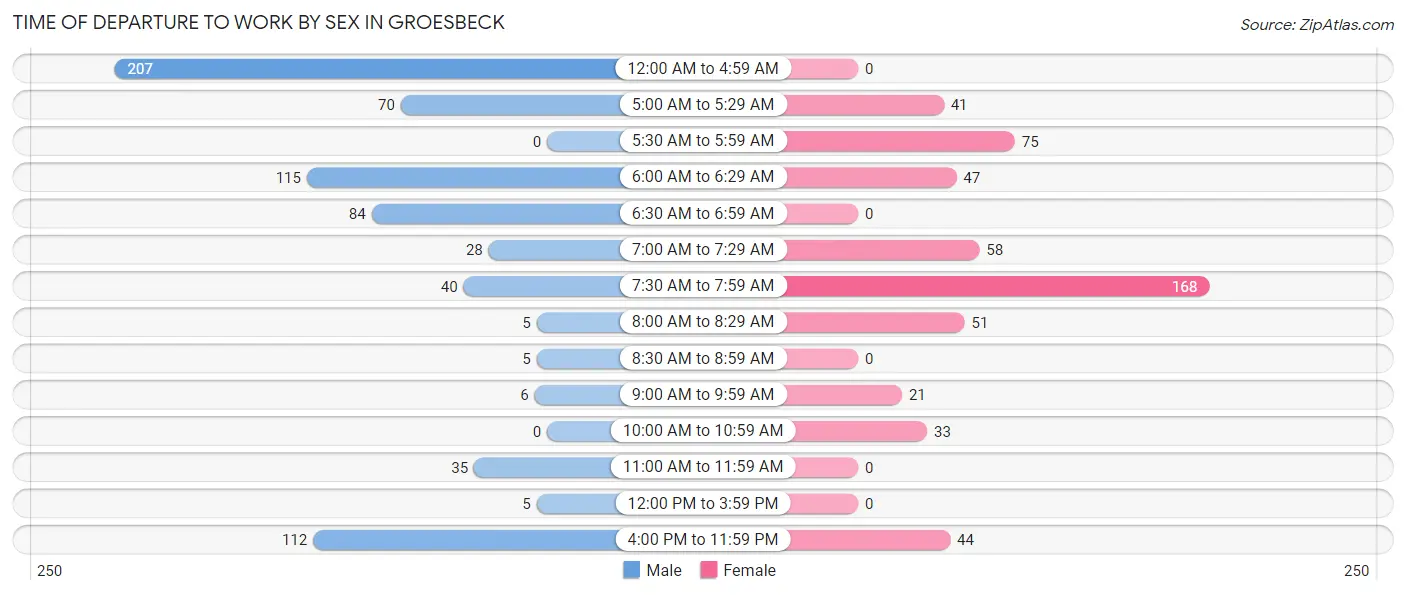
| Time of Departure | Male | Female |
| 12:00 AM to 4:59 AM | 207 (29.1%) | 0 (0.0%) |
| 5:00 AM to 5:29 AM | 70 (9.8%) | 41 (7.6%) |
| 5:30 AM to 5:59 AM | 0 (0.0%) | 75 (13.9%) |
| 6:00 AM to 6:29 AM | 115 (16.2%) | 47 (8.7%) |
| 6:30 AM to 6:59 AM | 84 (11.8%) | 0 (0.0%) |
| 7:00 AM to 7:29 AM | 28 (3.9%) | 58 (10.8%) |
| 7:30 AM to 7:59 AM | 40 (5.6%) | 168 (31.2%) |
| 8:00 AM to 8:29 AM | 5 (0.7%) | 51 (9.5%) |
| 8:30 AM to 8:59 AM | 5 (0.7%) | 0 (0.0%) |
| 9:00 AM to 9:59 AM | 6 (0.8%) | 21 (3.9%) |
| 10:00 AM to 10:59 AM | 0 (0.0%) | 33 (6.1%) |
| 11:00 AM to 11:59 AM | 35 (4.9%) | 0 (0.0%) |
| 12:00 PM to 3:59 PM | 5 (0.7%) | 0 (0.0%) |
| 4:00 PM to 11:59 PM | 112 (15.7%) | 44 (8.2%) |
| Total | 712 (100.0%) | 538 (100.0%) |
Housing Occupancy in Groesbeck
Occupancy by Ownership in Groesbeck
Of the total 1,296 dwellings in Groesbeck, owner-occupied units account for 743 (57.3%), while renter-occupied units make up 553 (42.7%).
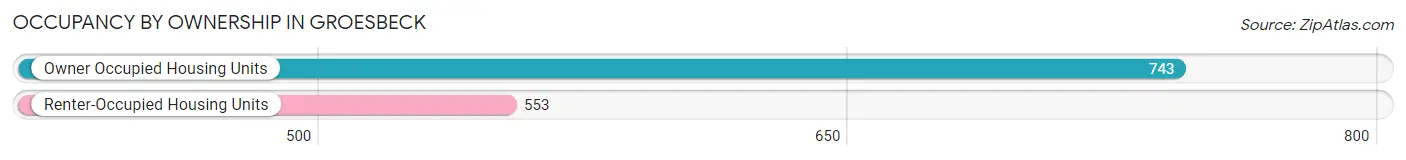
| Occupancy | # Housing Units | % Housing Units |
| Owner Occupied Housing Units | 743 | 57.3% |
| Renter-Occupied Housing Units | 553 | 42.7% |
| Total Occupied Housing Units | 1,296 | 100.0% |
Occupancy by Household Size in Groesbeck
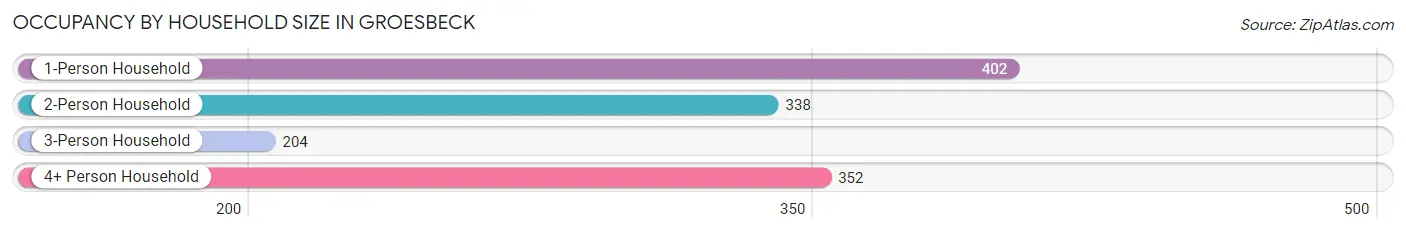
| Household Size | # Housing Units | % Housing Units |
| 1-Person Household | 402 | 31.0% |
| 2-Person Household | 338 | 26.1% |
| 3-Person Household | 204 | 15.7% |
| 4+ Person Household | 352 | 27.2% |
| Total Housing Units | 1,296 | 100.0% |
Occupancy by Ownership by Household Size in Groesbeck
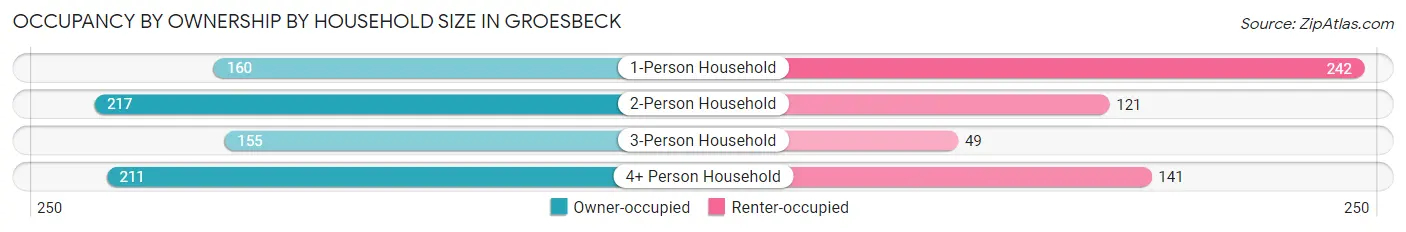
| Household Size | Owner-occupied | Renter-occupied |
| 1-Person Household | 160 (39.8%) | 242 (60.2%) |
| 2-Person Household | 217 (64.2%) | 121 (35.8%) |
| 3-Person Household | 155 (76.0%) | 49 (24.0%) |
| 4+ Person Household | 211 (59.9%) | 141 (40.1%) |
| Total Housing Units | 743 (57.3%) | 553 (42.7%) |
Occupancy by Educational Attainment in Groesbeck
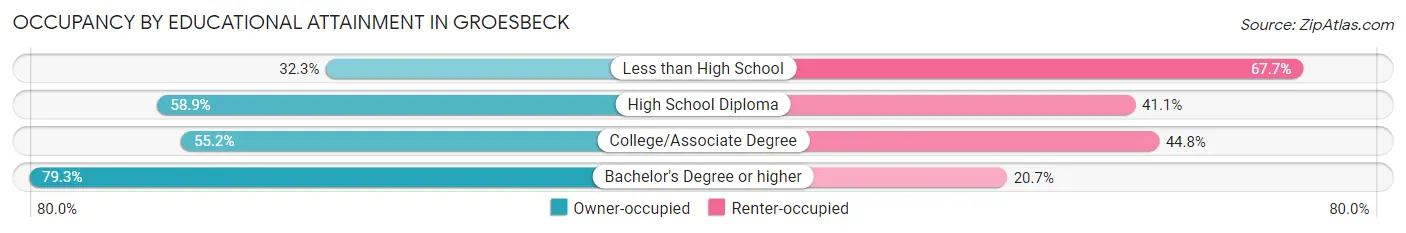
| Household Size | Owner-occupied | Renter-occupied |
| Less than High School | 42 (32.3%) | 88 (67.7%) |
| High School Diploma | 264 (58.9%) | 184 (41.1%) |
| College/Associate Degree | 303 (55.2%) | 246 (44.8%) |
| Bachelor's Degree or higher | 134 (79.3%) | 35 (20.7%) |
Occupancy by Age of Householder in Groesbeck

| Age Bracket | # Households | % Households |
| Under 35 Years | 289 | 22.3% |
| 35 to 44 Years | 183 | 14.1% |
| 45 to 54 Years | 147 | 11.3% |
| 55 to 64 Years | 338 | 26.1% |
| 65 to 74 Years | 183 | 14.1% |
| 75 to 84 Years | 83 | 6.4% |
| 85 Years and Over | 73 | 5.6% |
| Total | 1,296 | 100.0% |
Housing Finances in Groesbeck
Median Income by Occupancy in Groesbeck
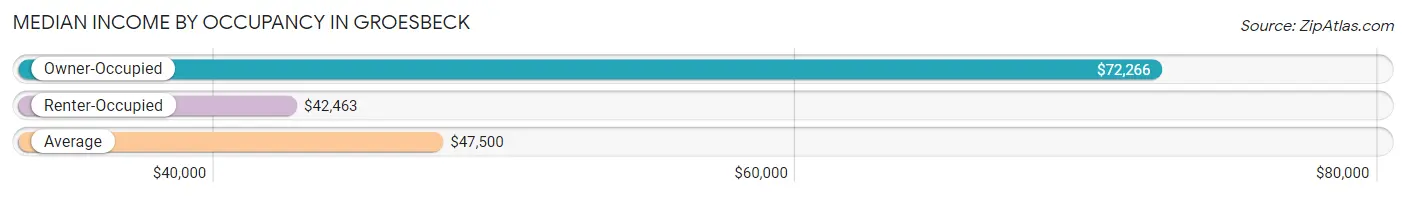
| Occupancy Type | # Households | Median Income |
| Owner-Occupied | 743 (57.3%) | $72,266 |
| Renter-Occupied | 553 (42.7%) | $42,463 |
| Average | 1,296 (100.0%) | $47,500 |
Occupancy by Householder Income Bracket in Groesbeck
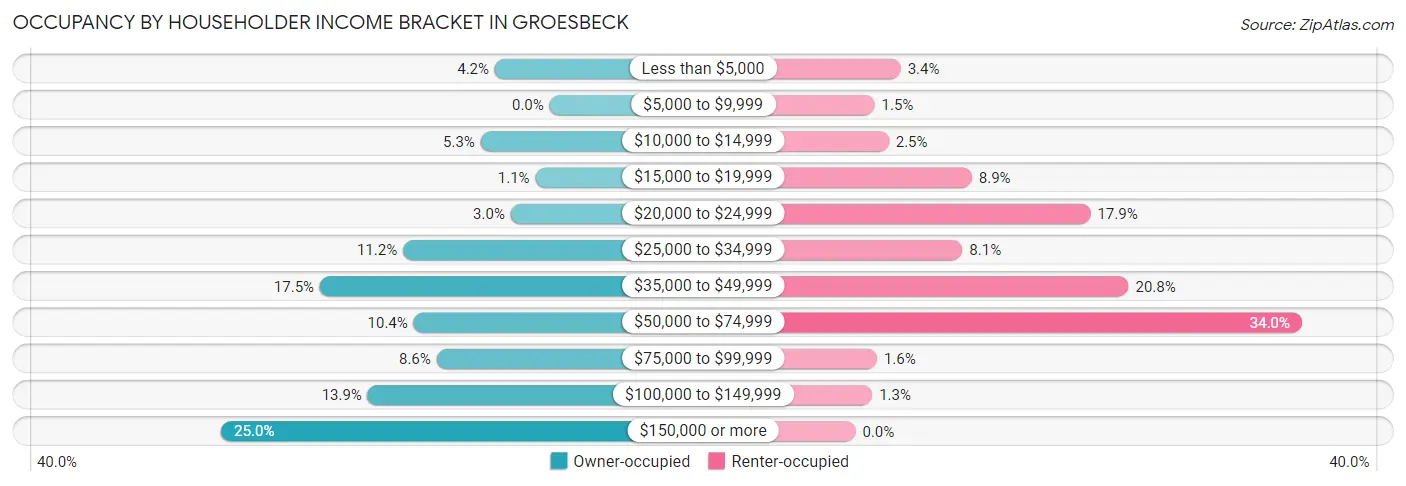
| Income Bracket | Owner-occupied | Renter-occupied |
| Less than $5,000 | 31 (4.2%) | 19 (3.4%) |
| $5,000 to $9,999 | 0 (0.0%) | 8 (1.5%) |
| $10,000 to $14,999 | 39 (5.2%) | 14 (2.5%) |
| $15,000 to $19,999 | 8 (1.1%) | 49 (8.9%) |
| $20,000 to $24,999 | 22 (3.0%) | 99 (17.9%) |
| $25,000 to $34,999 | 83 (11.2%) | 45 (8.1%) |
| $35,000 to $49,999 | 130 (17.5%) | 115 (20.8%) |
| $50,000 to $74,999 | 77 (10.4%) | 188 (34.0%) |
| $75,000 to $99,999 | 64 (8.6%) | 9 (1.6%) |
| $100,000 to $149,999 | 103 (13.9%) | 7 (1.3%) |
| $150,000 or more | 186 (25.0%) | 0 (0.0%) |
| Total | 743 (100.0%) | 553 (100.0%) |
Monthly Housing Cost Tiers in Groesbeck
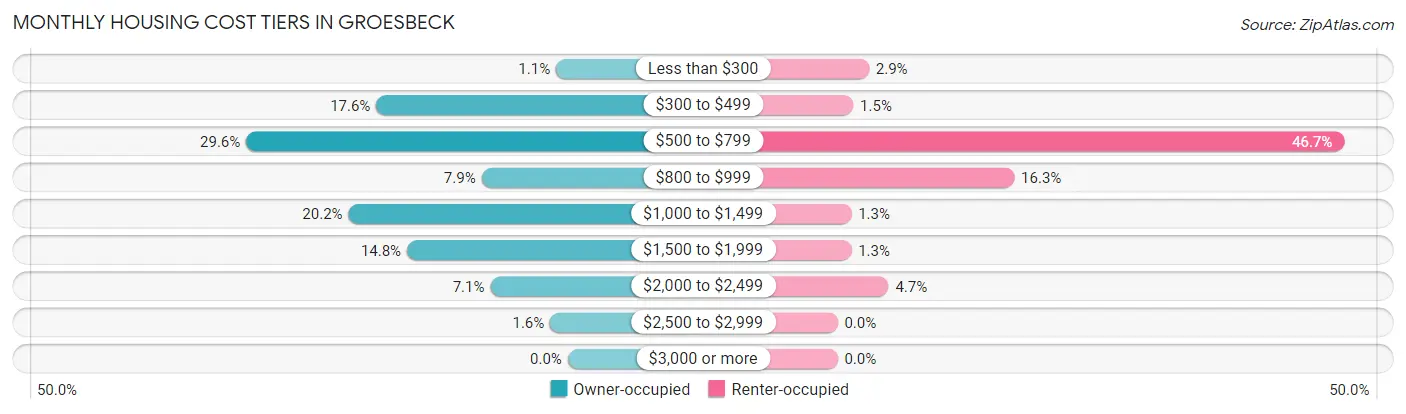
| Monthly Cost | Owner-occupied | Renter-occupied |
| Less than $300 | 8 (1.1%) | 16 (2.9%) |
| $300 to $499 | 131 (17.6%) | 8 (1.5%) |
| $500 to $799 | 220 (29.6%) | 258 (46.7%) |
| $800 to $999 | 59 (7.9%) | 90 (16.3%) |
| $1,000 to $1,499 | 150 (20.2%) | 7 (1.3%) |
| $1,500 to $1,999 | 110 (14.8%) | 7 (1.3%) |
| $2,000 to $2,499 | 53 (7.1%) | 26 (4.7%) |
| $2,500 to $2,999 | 12 (1.6%) | 0 (0.0%) |
| $3,000 or more | 0 (0.0%) | 0 (0.0%) |
| Total | 743 (100.0%) | 553 (100.0%) |
Physical Housing Characteristics in Groesbeck
Housing Structures in Groesbeck
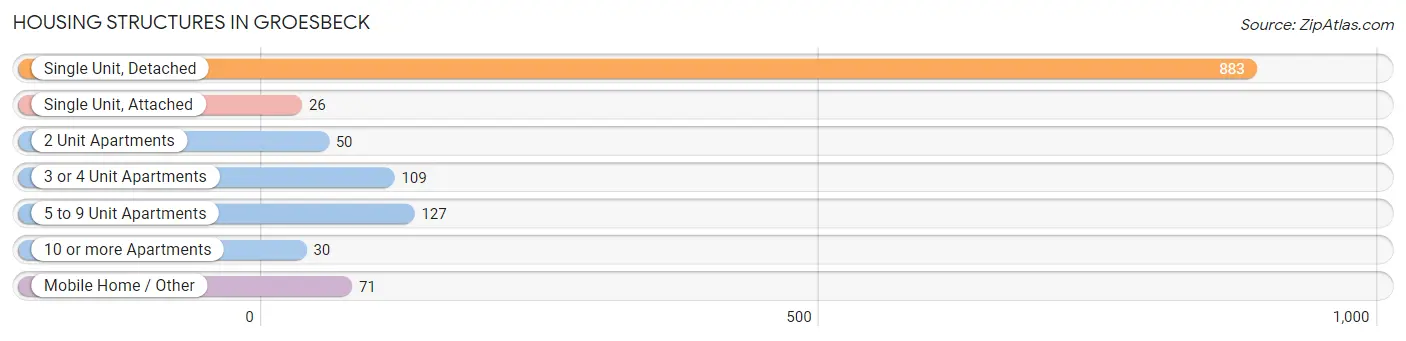
| Structure Type | # Housing Units | % Housing Units |
| Single Unit, Detached | 883 | 68.1% |
| Single Unit, Attached | 26 | 2.0% |
| 2 Unit Apartments | 50 | 3.9% |
| 3 or 4 Unit Apartments | 109 | 8.4% |
| 5 to 9 Unit Apartments | 127 | 9.8% |
| 10 or more Apartments | 30 | 2.3% |
| Mobile Home / Other | 71 | 5.5% |
| Total | 1,296 | 100.0% |
Housing Structures by Occupancy in Groesbeck
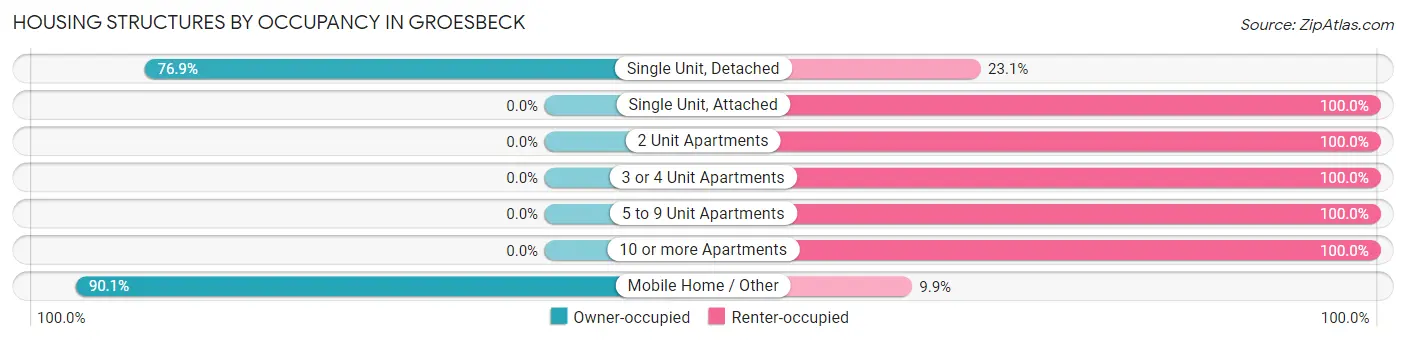
| Structure Type | Owner-occupied | Renter-occupied |
| Single Unit, Detached | 679 (76.9%) | 204 (23.1%) |
| Single Unit, Attached | 0 (0.0%) | 26 (100.0%) |
| 2 Unit Apartments | 0 (0.0%) | 50 (100.0%) |
| 3 or 4 Unit Apartments | 0 (0.0%) | 109 (100.0%) |
| 5 to 9 Unit Apartments | 0 (0.0%) | 127 (100.0%) |
| 10 or more Apartments | 0 (0.0%) | 30 (100.0%) |
| Mobile Home / Other | 64 (90.1%) | 7 (9.9%) |
| Total | 743 (57.3%) | 553 (42.7%) |
Housing Structures by Number of Rooms in Groesbeck
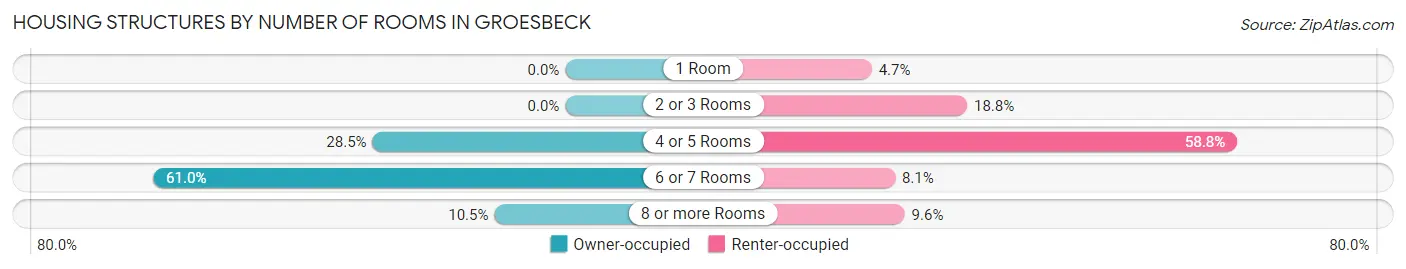
| Number of Rooms | Owner-occupied | Renter-occupied |
| 1 Room | 0 (0.0%) | 26 (4.7%) |
| 2 or 3 Rooms | 0 (0.0%) | 104 (18.8%) |
| 4 or 5 Rooms | 212 (28.5%) | 325 (58.8%) |
| 6 or 7 Rooms | 453 (61.0%) | 45 (8.1%) |
| 8 or more Rooms | 78 (10.5%) | 53 (9.6%) |
| Total | 743 (100.0%) | 553 (100.0%) |
Housing Structure by Heating Type in Groesbeck
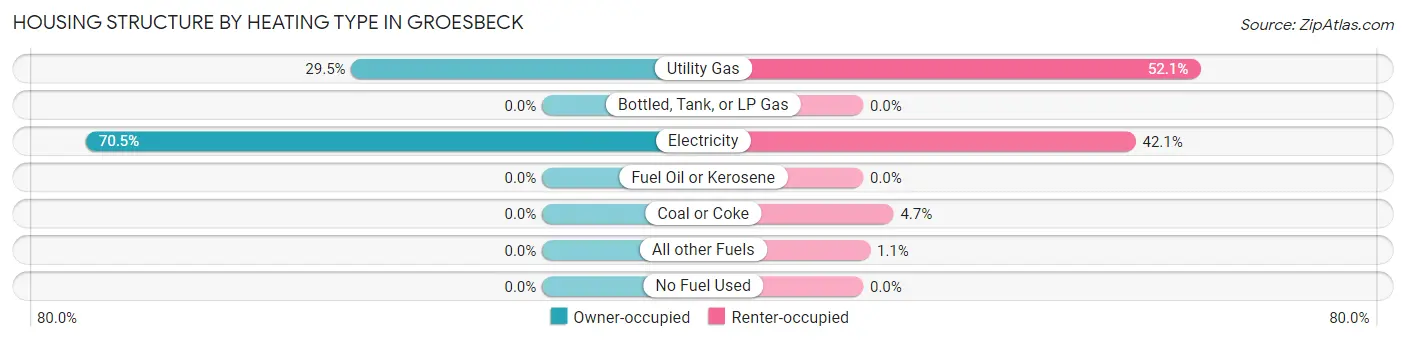
| Heating Type | Owner-occupied | Renter-occupied |
| Utility Gas | 219 (29.5%) | 288 (52.1%) |
| Bottled, Tank, or LP Gas | 0 (0.0%) | 0 (0.0%) |
| Electricity | 524 (70.5%) | 233 (42.1%) |
| Fuel Oil or Kerosene | 0 (0.0%) | 0 (0.0%) |
| Coal or Coke | 0 (0.0%) | 26 (4.7%) |
| All other Fuels | 0 (0.0%) | 6 (1.1%) |
| No Fuel Used | 0 (0.0%) | 0 (0.0%) |
| Total | 743 (100.0%) | 553 (100.0%) |
Household Vehicle Usage in Groesbeck
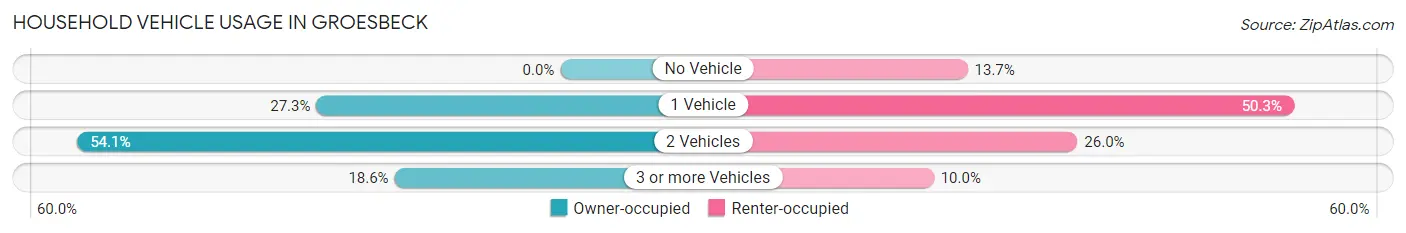
| Vehicles per Household | Owner-occupied | Renter-occupied |
| No Vehicle | 0 (0.0%) | 76 (13.7%) |
| 1 Vehicle | 203 (27.3%) | 278 (50.3%) |
| 2 Vehicles | 402 (54.1%) | 144 (26.0%) |
| 3 or more Vehicles | 138 (18.6%) | 55 (10.0%) |
| Total | 743 (100.0%) | 553 (100.0%) |
Real Estate & Mortgages in Groesbeck
Real Estate and Mortgage Overview in Groesbeck
| Characteristic | Without Mortgage | With Mortgage |
| Housing Units | 412 | 331 |
| Median Property Value | $89,200 | $159,500 |
| Median Household Income | $44,722 | $149 |
| Monthly Housing Costs | $552 | $0 |
| Real Estate Taxes | $2,313 | $60 |
Property Value by Mortgage Status in Groesbeck
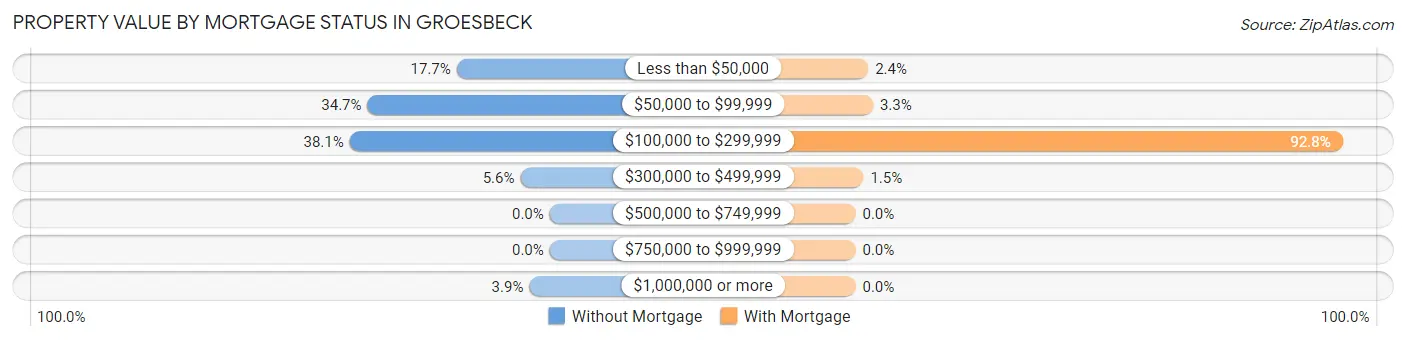
| Property Value | Without Mortgage | With Mortgage |
| Less than $50,000 | 73 (17.7%) | 8 (2.4%) |
| $50,000 to $99,999 | 143 (34.7%) | 11 (3.3%) |
| $100,000 to $299,999 | 157 (38.1%) | 307 (92.7%) |
| $300,000 to $499,999 | 23 (5.6%) | 5 (1.5%) |
| $500,000 to $749,999 | 0 (0.0%) | 0 (0.0%) |
| $750,000 to $999,999 | 0 (0.0%) | 0 (0.0%) |
| $1,000,000 or more | 16 (3.9%) | 0 (0.0%) |
| Total | 412 (100.0%) | 331 (100.0%) |
Household Income by Mortgage Status in Groesbeck
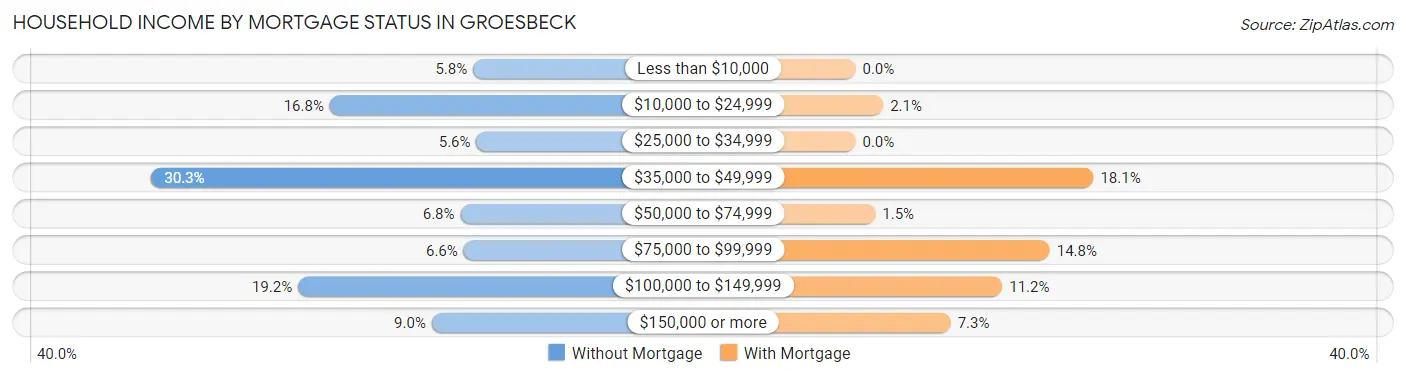
| Household Income | Without Mortgage | With Mortgage |
| Less than $10,000 | 24 (5.8%) | 0 (0.0%) |
| $10,000 to $24,999 | 69 (16.8%) | 7 (2.1%) |
| $25,000 to $34,999 | 23 (5.6%) | 0 (0.0%) |
| $35,000 to $49,999 | 125 (30.3%) | 60 (18.1%) |
| $50,000 to $74,999 | 28 (6.8%) | 5 (1.5%) |
| $75,000 to $99,999 | 27 (6.6%) | 49 (14.8%) |
| $100,000 to $149,999 | 79 (19.2%) | 37 (11.2%) |
| $150,000 or more | 37 (9.0%) | 24 (7.2%) |
| Total | 412 (100.0%) | 331 (100.0%) |
Property Value to Household Income Ratio in Groesbeck
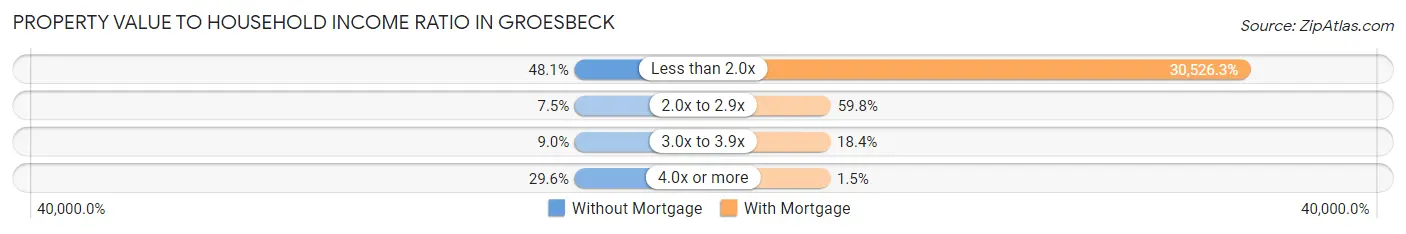
| Value-to-Income Ratio | Without Mortgage | With Mortgage |
| Less than 2.0x | 198 (48.1%) | 101,042 (30,526.3%) |
| 2.0x to 2.9x | 31 (7.5%) | 198 (59.8%) |
| 3.0x to 3.9x | 37 (9.0%) | 61 (18.4%) |
| 4.0x or more | 122 (29.6%) | 5 (1.5%) |
| Total | 412 (100.0%) | 331 (100.0%) |
Real Estate Taxes by Mortgage Status in Groesbeck
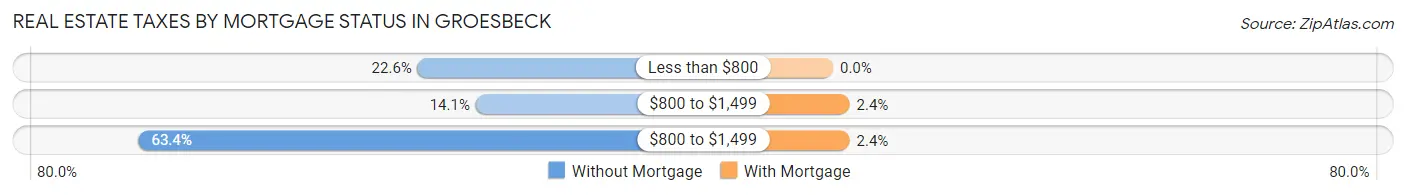
| Property Taxes | Without Mortgage | With Mortgage |
| Less than $800 | 93 (22.6%) | 0 (0.0%) |
| $800 to $1,499 | 58 (14.1%) | 8 (2.4%) |
| $800 to $1,499 | 261 (63.3%) | 8 (2.4%) |
| Total | 412 (100.0%) | 331 (100.0%) |
Health & Disability in Groesbeck
Health Insurance Coverage by Age in Groesbeck
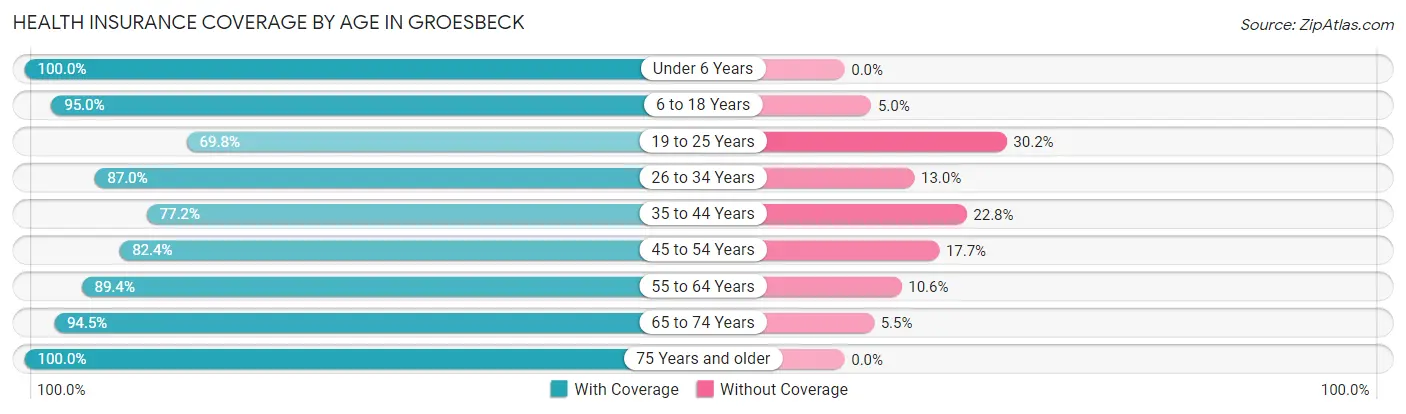
| Age Bracket | With Coverage | Without Coverage |
| Under 6 Years | 233 (100.0%) | 0 (0.0%) |
| 6 to 18 Years | 573 (95.0%) | 30 (5.0%) |
| 19 to 25 Years | 180 (69.8%) | 78 (30.2%) |
| 26 to 34 Years | 361 (87.0%) | 54 (13.0%) |
| 35 to 44 Years | 353 (77.2%) | 104 (22.8%) |
| 45 to 54 Years | 364 (82.4%) | 78 (17.6%) |
| 55 to 64 Years | 353 (89.4%) | 42 (10.6%) |
| 65 to 74 Years | 276 (94.5%) | 16 (5.5%) |
| 75 Years and older | 221 (100.0%) | 0 (0.0%) |
| Total | 2,914 (87.9%) | 402 (12.1%) |
Health Insurance Coverage by Citizenship Status in Groesbeck
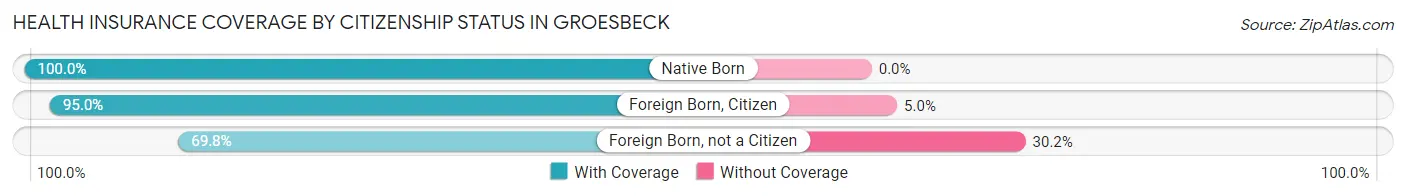
| Citizenship Status | With Coverage | Without Coverage |
| Native Born | 233 (100.0%) | 0 (0.0%) |
| Foreign Born, Citizen | 573 (95.0%) | 30 (5.0%) |
| Foreign Born, not a Citizen | 180 (69.8%) | 78 (30.2%) |
Health Insurance Coverage by Household Income in Groesbeck
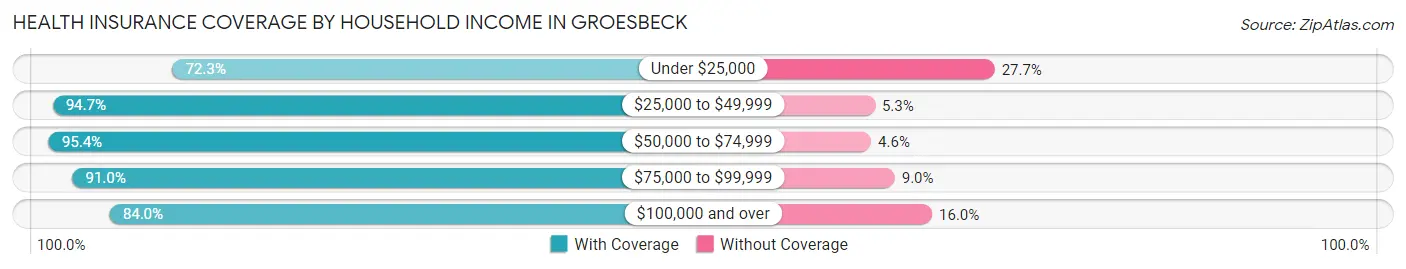
| Household Income | With Coverage | Without Coverage |
| Under $25,000 | 300 (72.3%) | 115 (27.7%) |
| $25,000 to $49,999 | 736 (94.7%) | 41 (5.3%) |
| $50,000 to $74,999 | 712 (95.4%) | 34 (4.6%) |
| $75,000 to $99,999 | 162 (91.0%) | 16 (9.0%) |
| $100,000 and over | 1,004 (84.0%) | 191 (16.0%) |
Public vs Private Health Insurance Coverage by Age in Groesbeck
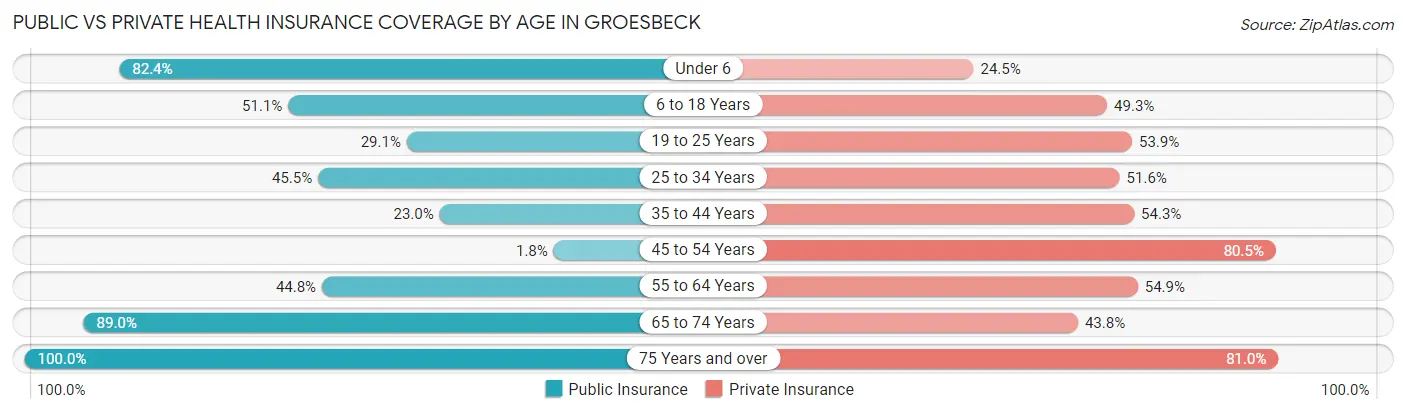
| Age Bracket | Public Insurance | Private Insurance |
| Under 6 | 192 (82.4%) | 57 (24.5%) |
| 6 to 18 Years | 308 (51.1%) | 297 (49.2%) |
| 19 to 25 Years | 75 (29.1%) | 139 (53.9%) |
| 25 to 34 Years | 189 (45.5%) | 214 (51.6%) |
| 35 to 44 Years | 105 (23.0%) | 248 (54.3%) |
| 45 to 54 Years | 8 (1.8%) | 356 (80.5%) |
| 55 to 64 Years | 177 (44.8%) | 217 (54.9%) |
| 65 to 74 Years | 260 (89.0%) | 128 (43.8%) |
| 75 Years and over | 221 (100.0%) | 179 (81.0%) |
| Total | 1,535 (46.3%) | 1,835 (55.3%) |
Disability Status by Sex by Age in Groesbeck

| Age Bracket | Male | Female |
| Under 5 Years | 0 (0.0%) | 0 (0.0%) |
| 5 to 17 Years | 9 (3.0%) | 0 (0.0%) |
| 18 to 34 Years | 34 (9.0%) | 26 (7.9%) |
| 35 to 64 Years | 128 (15.9%) | 63 (12.9%) |
| 65 to 74 Years | 9 (22.0%) | 54 (21.5%) |
| 75 Years and over | 50 (58.8%) | 90 (66.2%) |
Disability Class by Sex by Age in Groesbeck
Disability Class: Hearing Difficulty
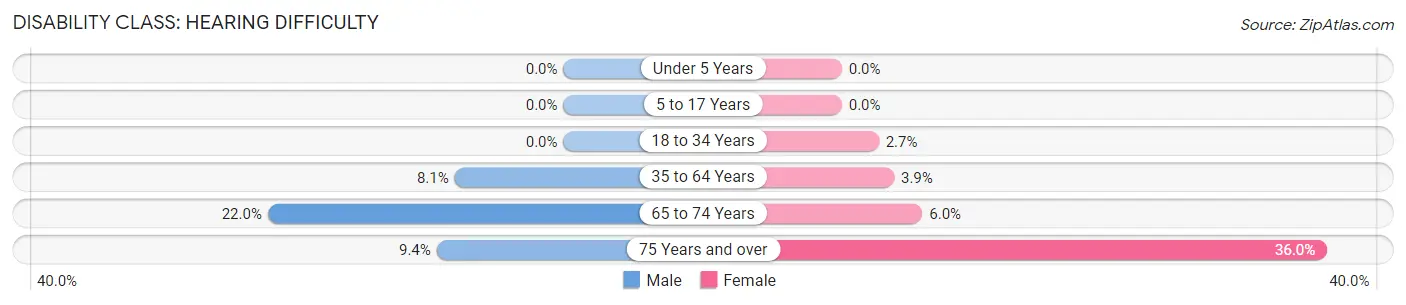
| Age Bracket | Male | Female |
| Under 5 Years | 0 (0.0%) | 0 (0.0%) |
| 5 to 17 Years | 0 (0.0%) | 0 (0.0%) |
| 18 to 34 Years | 0 (0.0%) | 9 (2.7%) |
| 35 to 64 Years | 65 (8.1%) | 19 (3.9%) |
| 65 to 74 Years | 9 (22.0%) | 15 (6.0%) |
| 75 Years and over | 8 (9.4%) | 49 (36.0%) |
Disability Class: Vision Difficulty
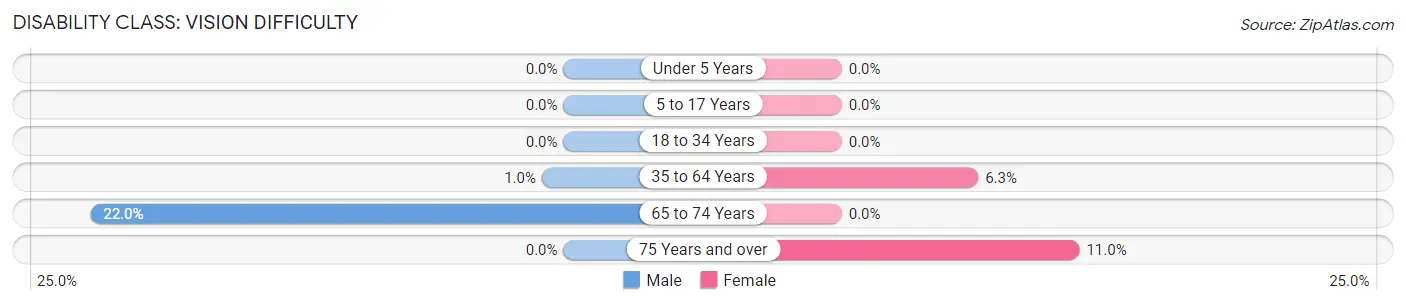
| Age Bracket | Male | Female |
| Under 5 Years | 0 (0.0%) | 0 (0.0%) |
| 5 to 17 Years | 0 (0.0%) | 0 (0.0%) |
| 18 to 34 Years | 0 (0.0%) | 0 (0.0%) |
| 35 to 64 Years | 8 (1.0%) | 31 (6.3%) |
| 65 to 74 Years | 9 (22.0%) | 0 (0.0%) |
| 75 Years and over | 0 (0.0%) | 15 (11.0%) |
Disability Class: Cognitive Difficulty
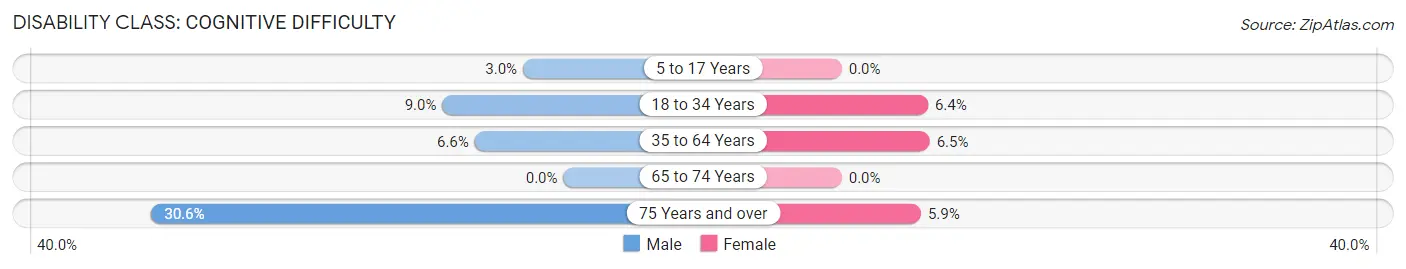
| Age Bracket | Male | Female |
| 5 to 17 Years | 9 (3.0%) | 0 (0.0%) |
| 18 to 34 Years | 34 (9.0%) | 21 (6.4%) |
| 35 to 64 Years | 53 (6.6%) | 32 (6.5%) |
| 65 to 74 Years | 0 (0.0%) | 0 (0.0%) |
| 75 Years and over | 26 (30.6%) | 8 (5.9%) |
Disability Class: Ambulatory Difficulty
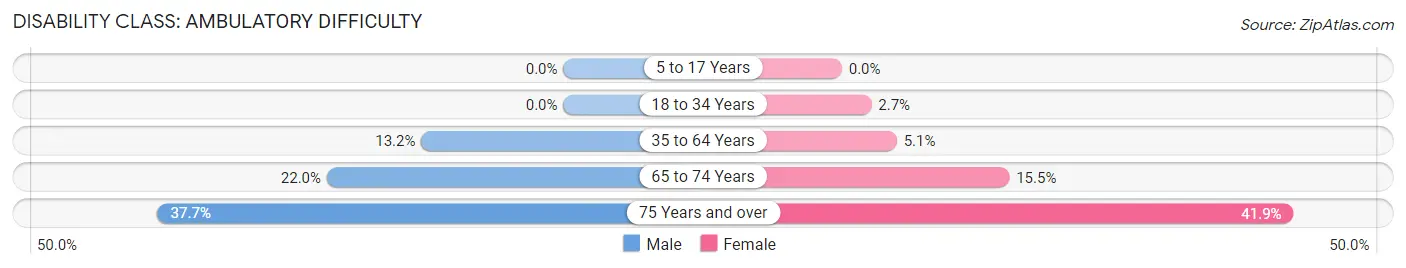
| Age Bracket | Male | Female |
| 5 to 17 Years | 0 (0.0%) | 0 (0.0%) |
| 18 to 34 Years | 0 (0.0%) | 9 (2.7%) |
| 35 to 64 Years | 106 (13.2%) | 25 (5.1%) |
| 65 to 74 Years | 9 (22.0%) | 39 (15.5%) |
| 75 Years and over | 32 (37.7%) | 57 (41.9%) |
Disability Class: Self-Care Difficulty
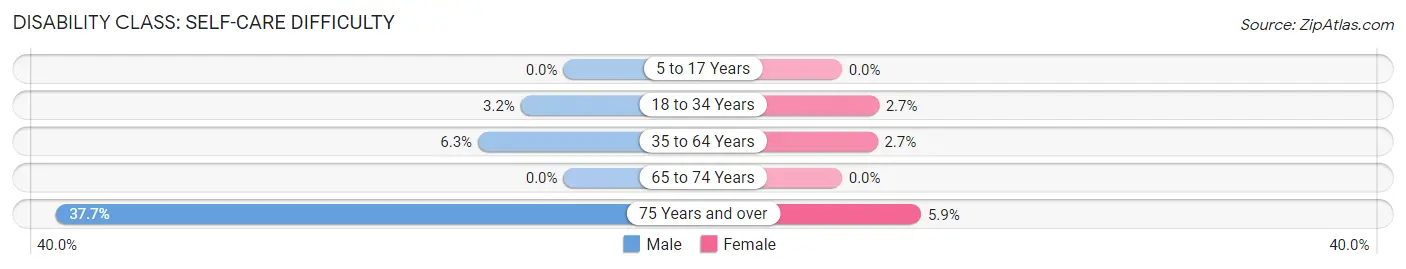
| Age Bracket | Male | Female |
| 5 to 17 Years | 0 (0.0%) | 0 (0.0%) |
| 18 to 34 Years | 12 (3.2%) | 9 (2.7%) |
| 35 to 64 Years | 51 (6.3%) | 13 (2.6%) |
| 65 to 74 Years | 0 (0.0%) | 0 (0.0%) |
| 75 Years and over | 32 (37.7%) | 8 (5.9%) |
Technology Access in Groesbeck
Computing Device Access in Groesbeck
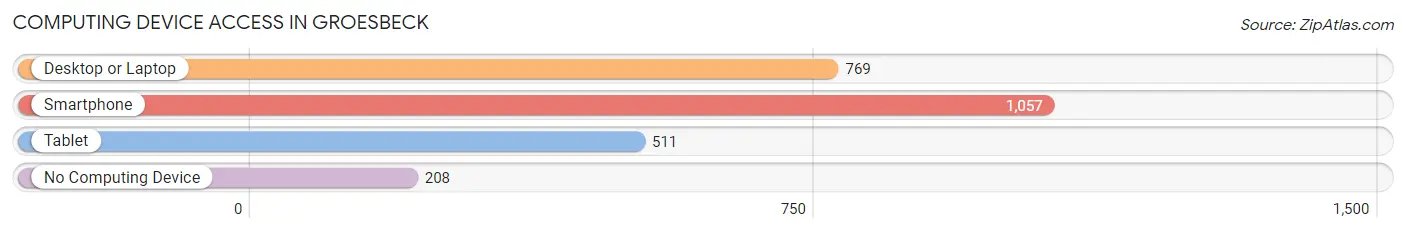
| Device Type | # Households | % Households |
| Desktop or Laptop | 769 | 59.3% |
| Smartphone | 1,057 | 81.6% |
| Tablet | 511 | 39.4% |
| No Computing Device | 208 | 16.1% |
| Total | 1,296 | 100.0% |
Internet Access in Groesbeck
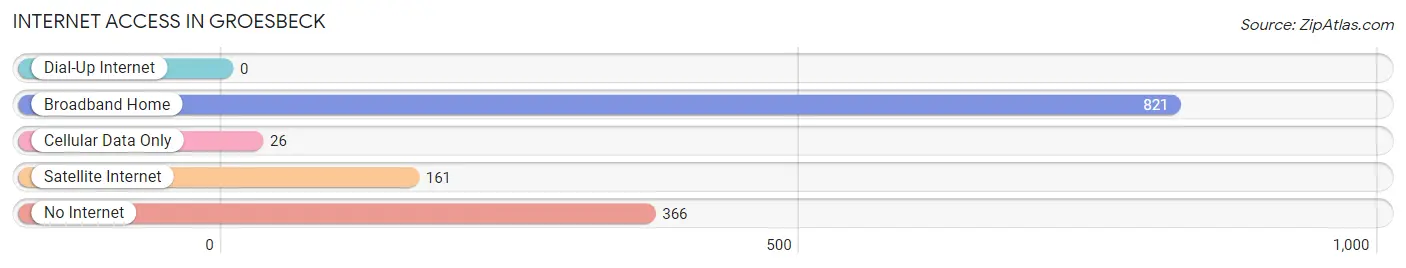
| Internet Type | # Households | % Households |
| Dial-Up Internet | 0 | 0.0% |
| Broadband Home | 821 | 63.3% |
| Cellular Data Only | 26 | 2.0% |
| Satellite Internet | 161 | 12.4% |
| No Internet | 366 | 28.2% |
| Total | 1,296 | 100.0% |
Groesbeck Summary
Groesbeck, Texas is a small city located in Limestone County, Texas. It is situated about halfway between Dallas and Houston, and is part of the Waco Metropolitan Statistical Area. The city has a population of around 4,000 people, and is known for its rural charm and friendly atmosphere.
History
The area that is now Groesbeck was first settled in the early 1800s by German immigrants. The town was originally called “Grossbeck” after one of the settlers, but the name was later changed to Groesbeck. The town was officially incorporated in 1873, and the first post office was established in 1876.
In the late 1800s, Groesbeck became a major stop on the Houston and Texas Central Railway. This allowed the town to become a major shipping center for the surrounding area. The town also became a center for cotton production, and by the early 1900s, Groesbeck was a thriving community.
In the 1920s, the town was hit hard by the Great Depression, and many of the businesses in the area closed. However, the town was able to recover and by the 1950s, Groesbeck was once again a thriving community.
Geography
Groesbeck is located in Limestone County, Texas, about halfway between Dallas and Houston. The city is situated on the banks of the Navasota River, and is surrounded by rolling hills and lush green pastures. The climate in Groesbeck is generally mild, with hot summers and cool winters.
Economy
The economy of Groesbeck is largely based on agriculture and manufacturing. The town is home to several large farms, and the surrounding area is known for its production of cotton, corn, and other crops. Groesbeck is also home to several manufacturing plants, including a paper mill and a plastics factory.
The town is also home to several small businesses, including restaurants, shops, and other services. Groesbeck is also home to a branch of the Texas A&M University System, which offers a variety of educational opportunities.
Demographics
As of the 2010 census, the population of Groesbeck was 4,000 people. The racial makeup of the town was 79.3% White, 16.2% Hispanic or Latino, 1.7% African American, 0.7% Native American, 0.3% Asian, and 2.1% from other races.
The median household income in Groesbeck was $31,250, and the median family income was $37,500. The per capita income in the town was $17,845. The poverty rate in Groesbeck was 17.2%, and the unemployment rate was 6.2%.
Conclusion
Groesbeck, Texas is a small city located in Limestone County, Texas. It is situated about halfway between Dallas and Houston, and is part of the Waco Metropolitan Statistical Area. The city has a population of around 4,000 people, and is known for its rural charm and friendly atmosphere. The economy of Groesbeck is largely based on agriculture and manufacturing, and the town is home to several small businesses. The racial makeup of the town is 79.3% White, 16.2% Hispanic or Latino, 1.7% African American, 0.7% Native American, 0.3% Asian, and 2.1% from other races. The median household income in Groesbeck was $31,250, and the poverty rate was 17.2%. Groesbeck is a charming town with a rich history and a bright future.
Common Questions
What is the Total Population of Groesbeck?
Total Population of Groesbeck is 3,661.
What is the Total Male Population of Groesbeck?
Total Male Population of Groesbeck is 1,992.
What is the Total Female Population of Groesbeck?
Total Female Population of Groesbeck is 1,669.
What is the Ratio of Males per 100 Females in Groesbeck?
There are 119.35 Males per 100 Females in Groesbeck.
What is the Ratio of Females per 100 Males in Groesbeck?
There are 83.79 Females per 100 Males in Groesbeck.
What is the Median Population Age in Groesbeck?
Median Population Age in Groesbeck is 38.9 Years.
What is the Average Family Size in Groesbeck
Average Family Size in Groesbeck is 3.2 People.
What is the Average Household Size in Groesbeck
Average Household Size in Groesbeck is 2.5 People.
What is Per Capita Income in Groesbeck?
Per Capita income in Groesbeck is $29,195.
What is the Median Family Income in Groesbeck?
Median Family Income in Groesbeck is $58,759.
What is the Median Household income in Groesbeck?
Median Household Income in Groesbeck is $47,500.
What is Income or Wage Gap in Groesbeck?
Income or Wage Gap in Groesbeck is 31.0%.
Women in Groesbeck earn 69.0 cents for every dollar earned by a man.
What is Inequality or Gini Index in Groesbeck?
Inequality or Gini Index in Groesbeck is 0.46.
How Large is the Labor Force in Groesbeck?
There are 1,421 People in the Labor Forcein in Groesbeck.
What is the Percentage of People in the Labor Force in Groesbeck?
48.6% of People are in the Labor Force in Groesbeck.
What is the Unemployment Rate in Groesbeck?
Unemployment Rate in Groesbeck is 1.0%.