Turkey, TX
Turkey Map
Turkey Overview
292
TOTAL POPULATION
139
MALE POPULATION
153
FEMALE POPULATION
90.85
MALES / 100 FEMALES
110.07
FEMALES / 100 MALES
36.2
MEDIAN AGE
3.5
AVG FAMILY SIZE
2.9
AVG HOUSEHOLD SIZE
$30,911
PER CAPITA INCOME
$73,214
AVG FAMILY INCOME
$47,000
AVG HOUSEHOLD INCOME
0.56
INEQUALITY / GINI INDEX
137
LABOR FORCE [ PEOPLE ]
53.1%
PERCENT IN LABOR FORCE
3.6%
UNEMPLOYMENT RATE
Turkey Zip Codes
Turkey Area Codes
Race in Turkey
The most populous races in Turkey are White / Caucasian (203 | 69.5%), Hispanic or Latino (141 | 48.3%), and Two or more Races (69 | 23.6%).
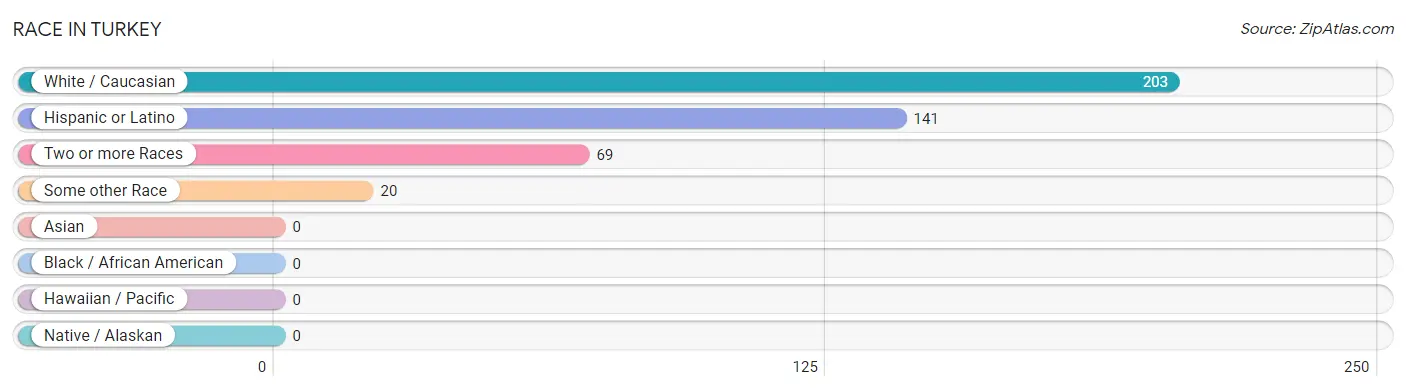
| Race | # Population | % Population |
| Asian | 0 | 0.0% |
| Black / African American | 0 | 0.0% |
| Hawaiian / Pacific | 0 | 0.0% |
| Hispanic or Latino | 141 | 48.3% |
| Native / Alaskan | 0 | 0.0% |
| White / Caucasian | 203 | 69.5% |
| Two or more Races | 69 | 23.6% |
| Some other Race | 20 | 6.9% |
| Total | 292 | 100.0% |
Ancestry in Turkey
The most populous ancestries reported in Turkey are Mexican (118 | 40.4%), German (59 | 20.2%), English (36 | 12.3%), Spaniard (23 | 7.9%), and Scotch-Irish (21 | 7.2%), together accounting for 88.0% of all Turkey residents.
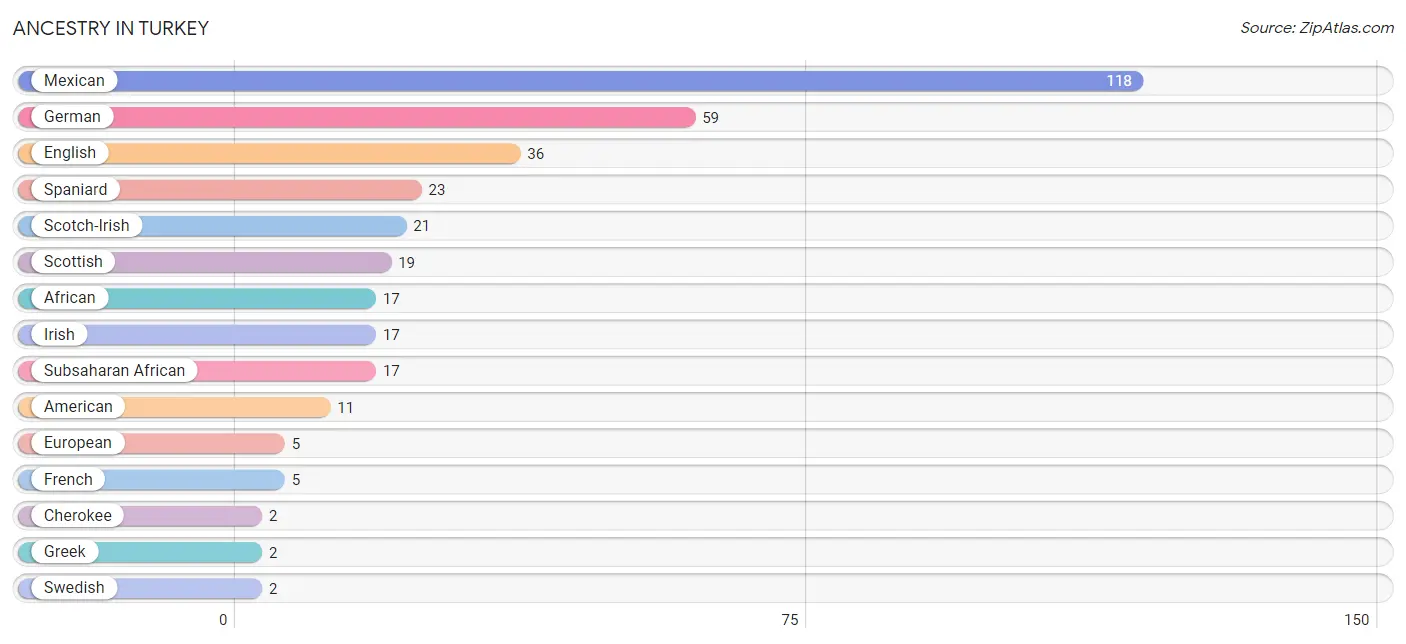
| Ancestry | # Population | % Population |
| African | 17 | 5.8% |
| American | 11 | 3.8% |
| Cherokee | 2 | 0.7% |
| English | 36 | 12.3% |
| European | 5 | 1.7% |
| French | 5 | 1.7% |
| German | 59 | 20.2% |
| Greek | 2 | 0.7% |
| Irish | 17 | 5.8% |
| Mexican | 118 | 40.4% |
| Mexican American Indian | 1 | 0.3% |
| Scotch-Irish | 21 | 7.2% |
| Scottish | 19 | 6.5% |
| Spaniard | 23 | 7.9% |
| Subsaharan African | 17 | 5.8% |
| Swedish | 2 | 0.7% | View All 16 Rows |
Immigrants in Turkey
The most numerous immigrant groups reported in Turkey came from Central America (30 | 10.3%), Latin America (30 | 10.3%), and Mexico (30 | 10.3%), together accounting for 30.8% of all Turkey residents.
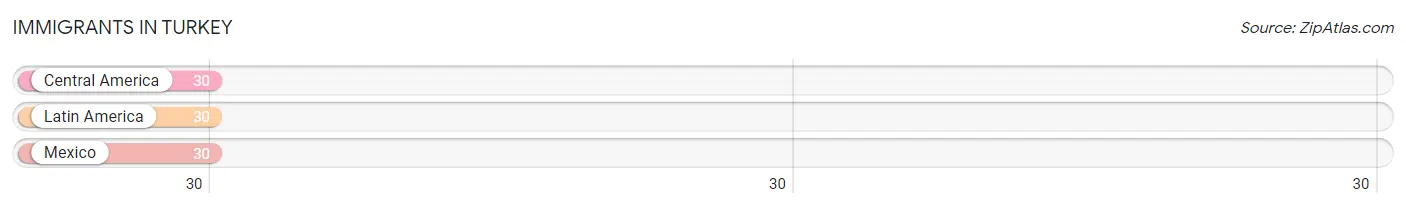
| Immigration Origin | # Population | % Population |
| Central America | 30 | 10.3% |
| Latin America | 30 | 10.3% |
| Mexico | 30 | 10.3% | View All 3 Rows |
Sex and Age in Turkey
Sex and Age in Turkey
The most populous age groups in Turkey are 25 to 29 Years (29 | 20.9%) for men and 20 to 24 Years (45 | 29.4%) for women.
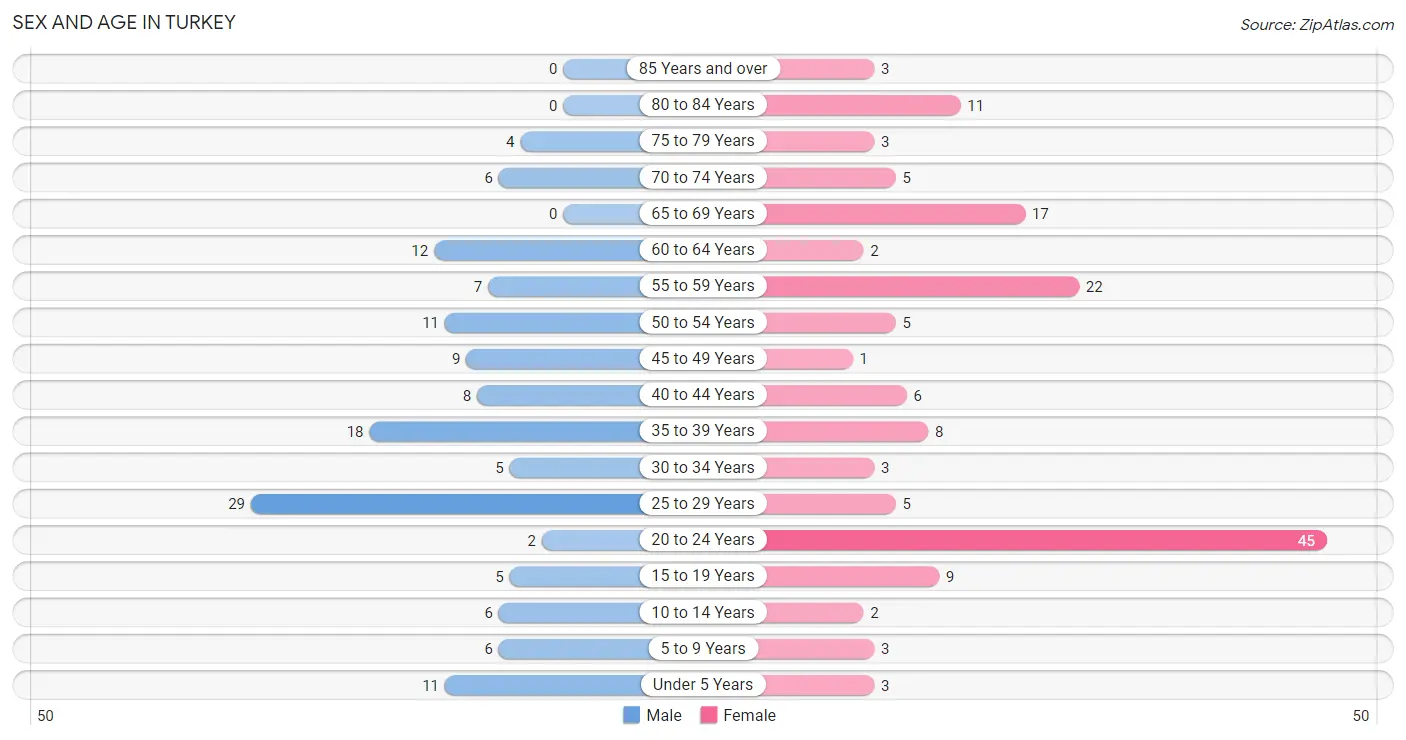
| Age Bracket | Male | Female |
| Under 5 Years | 11 (7.9%) | 3 (2.0%) |
| 5 to 9 Years | 6 (4.3%) | 3 (2.0%) |
| 10 to 14 Years | 6 (4.3%) | 2 (1.3%) |
| 15 to 19 Years | 5 (3.6%) | 9 (5.9%) |
| 20 to 24 Years | 2 (1.4%) | 45 (29.4%) |
| 25 to 29 Years | 29 (20.9%) | 5 (3.3%) |
| 30 to 34 Years | 5 (3.6%) | 3 (2.0%) |
| 35 to 39 Years | 18 (13.0%) | 8 (5.2%) |
| 40 to 44 Years | 8 (5.8%) | 6 (3.9%) |
| 45 to 49 Years | 9 (6.5%) | 1 (0.6%) |
| 50 to 54 Years | 11 (7.9%) | 5 (3.3%) |
| 55 to 59 Years | 7 (5.0%) | 22 (14.4%) |
| 60 to 64 Years | 12 (8.6%) | 2 (1.3%) |
| 65 to 69 Years | 0 (0.0%) | 17 (11.1%) |
| 70 to 74 Years | 6 (4.3%) | 5 (3.3%) |
| 75 to 79 Years | 4 (2.9%) | 3 (2.0%) |
| 80 to 84 Years | 0 (0.0%) | 11 (7.2%) |
| 85 Years and over | 0 (0.0%) | 3 (2.0%) |
| Total | 139 (100.0%) | 153 (100.0%) |
Families and Households in Turkey
Median Family Size in Turkey
The median family size in Turkey is 3.50 persons per family, with married-couple families (49 | 64.5%) accounting for the largest median family size of 3.73 persons per family. On the other hand, single female/mother families (20 | 26.3%) represent the smallest median family size with 3.00 persons per family.
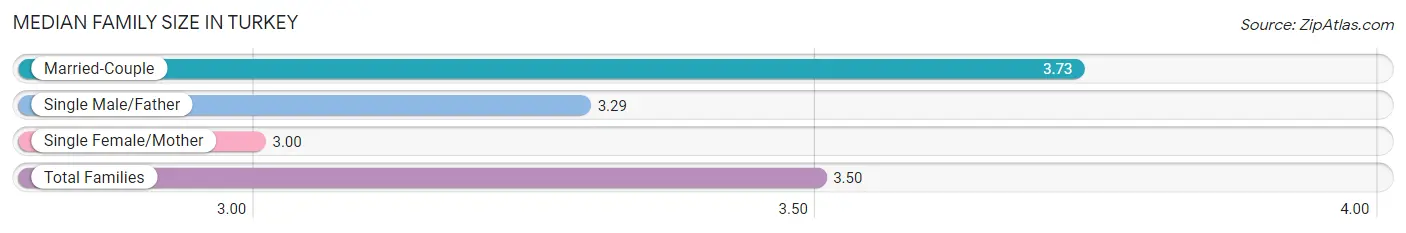
| Family Type | # Families | Family Size |
| Married-Couple | 49 (64.5%) | 3.73 |
| Single Male/Father | 7 (9.2%) | 3.29 |
| Single Female/Mother | 20 (26.3%) | 3.00 |
| Total Families | 76 (100.0%) | 3.50 |
Median Household Size in Turkey
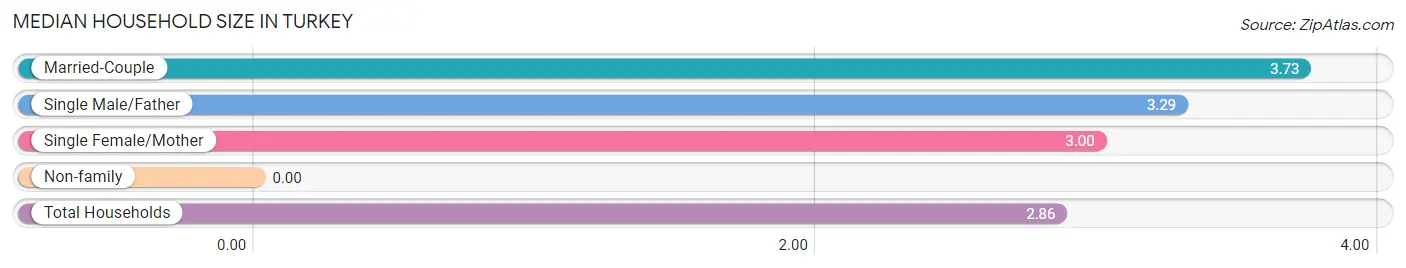
| Household Type | # Households | Household Size |
| Married-Couple | 49 (48.0%) | 3.73 |
| Single Male/Father | 7 (6.9%) | 3.29 |
| Single Female/Mother | 20 (19.6%) | 3.00 |
| Non-family | 26 (25.5%) | - |
| Total Households | 102 (100.0%) | 2.86 |
Household Size by Marriage Status in Turkey
Out of a total of 102 households in Turkey, 76 (74.5%) are family households, while 26 (25.5%) are nonfamily households. The most numerous type of family households are 2-person households, comprising 59, and the most common type of nonfamily households are 1-person households, comprising 26.
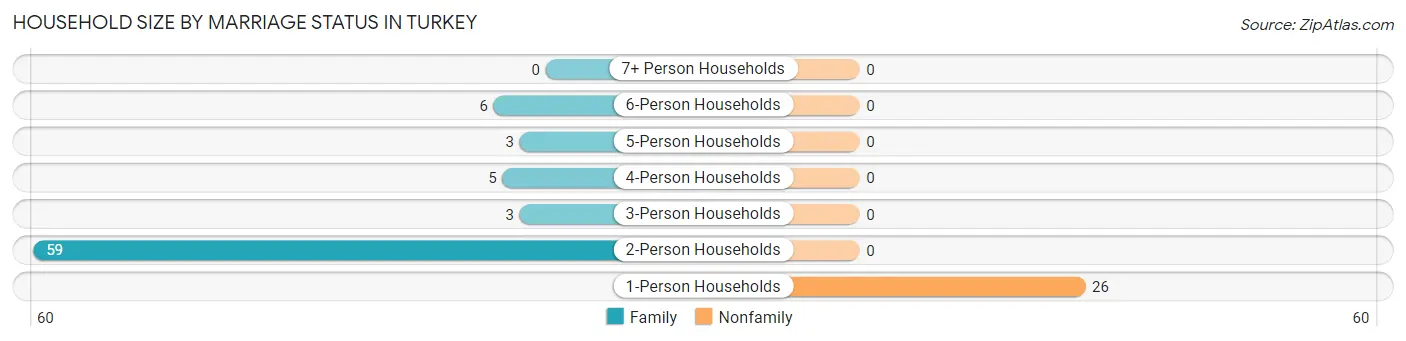
| Household Size | Family Households | Nonfamily Households |
| 1-Person Households | - | 26 (25.5%) |
| 2-Person Households | 59 (57.8%) | 0 (0.0%) |
| 3-Person Households | 3 (2.9%) | 0 (0.0%) |
| 4-Person Households | 5 (4.9%) | 0 (0.0%) |
| 5-Person Households | 3 (2.9%) | 0 (0.0%) |
| 6-Person Households | 6 (5.9%) | 0 (0.0%) |
| 7+ Person Households | 0 (0.0%) | 0 (0.0%) |
| Total | 76 (74.5%) | 26 (25.5%) |
Female Fertility in Turkey
Fertility by Age in Turkey
Average fertility rate in Turkey is 24.0 births per 1,000 women. Women in the age bracket of 20 to 34 years have the highest fertility rate with 38.0 births per 1,000 women. Women in the age bracket of 20 to 34 years acount for 100.0% of all women with births.
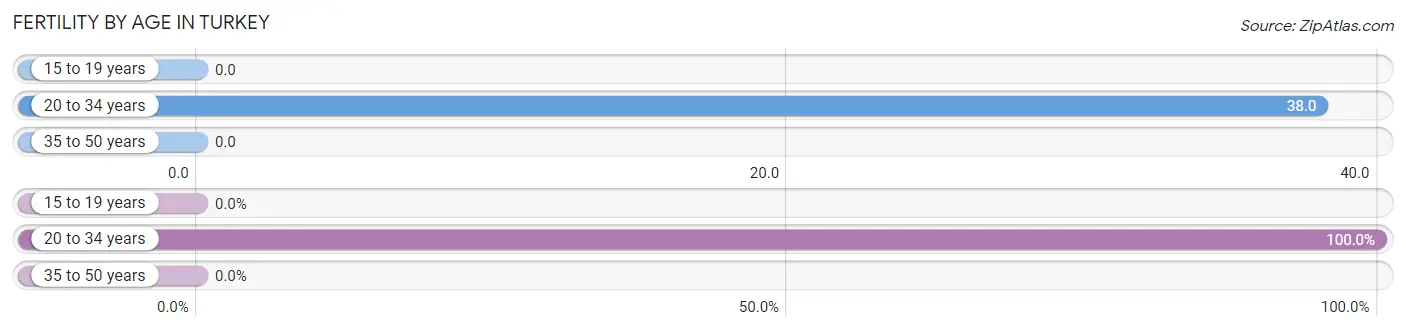
| Age Bracket | Women with Births | Births / 1,000 Women |
| 15 to 19 years | 0 (0.0%) | 0.0 |
| 20 to 34 years | 2 (100.0%) | 38.0 |
| 35 to 50 years | 0 (0.0%) | 0.0 |
| Total | 2 (100.0%) | 24.0 |
Fertility by Age by Marriage Status in Turkey
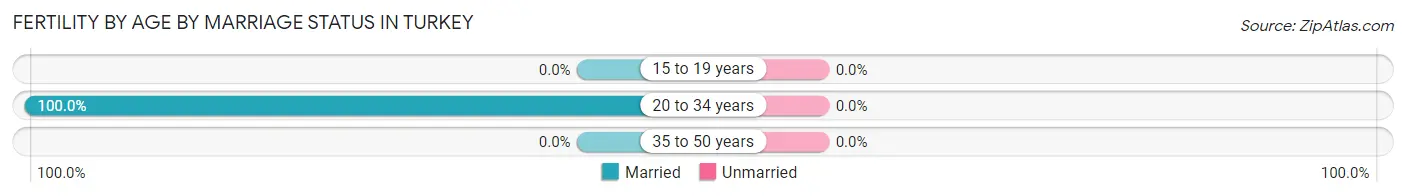
| Age Bracket | Married | Unmarried |
| 15 to 19 years | 0 (0.0%) | 0 (0.0%) |
| 20 to 34 years | 2 (100.0%) | 0 (0.0%) |
| 35 to 50 years | 0 (0.0%) | 0 (0.0%) |
| Total | 2 (100.0%) | 0 (0.0%) |
Fertility by Education in Turkey
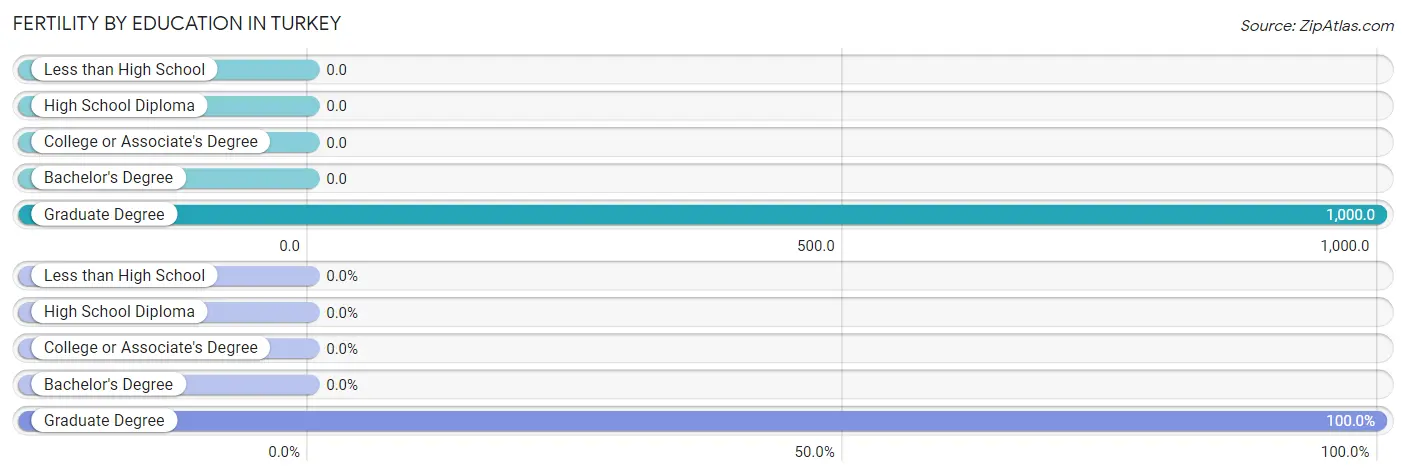
| Educational Attainment | Women with Births | Births / 1,000 Women |
| Less than High School | 0 (0.0%) | 0.0 |
| High School Diploma | 0 (0.0%) | 0.0 |
| College or Associate's Degree | 0 (0.0%) | 0.0 |
| Bachelor's Degree | 0 (0.0%) | 0.0 |
| Graduate Degree | 2 (100.0%) | 1,000.0 |
| Total | 2 (100.0%) | 24.0 |
Fertility by Education by Marriage Status in Turkey
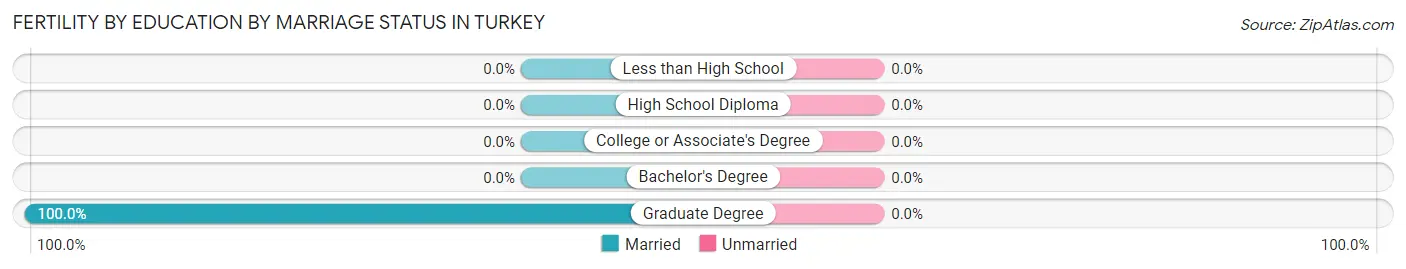
| Educational Attainment | Married | Unmarried |
| Less than High School | 0 (0.0%) | 0 (0.0%) |
| High School Diploma | 0 (0.0%) | 0 (0.0%) |
| College or Associate's Degree | 0 (0.0%) | 0 (0.0%) |
| Bachelor's Degree | 0 (0.0%) | 0 (0.0%) |
| Graduate Degree | 2 (100.0%) | 0 (0.0%) |
| Total | 2 (100.0%) | 0 (0.0%) |
Income in Turkey
Income Overview in Turkey
Per Capita Income in Turkey is $30,911, while median incomes of families and households are $73,214 and $47,000 respectively.
| Characteristic | Number | Measure |
| Per Capita Income | 292 | $30,911 |
| Median Family Income | 76 | $73,214 |
| Mean Family Income | 76 | $103,401 |
| Median Household Income | 102 | $47,000 |
| Mean Household Income | 102 | $81,454 |
| Income Deficit | 76 | $0 |
| Wage / Income Gap (%) | 292 | 0.00% |
| Wage / Income Gap ($) | 292 | 100.00¢ per $1 |
| Gini / Inequality Index | 292 | 0.56 |
Earnings by Sex in Turkey
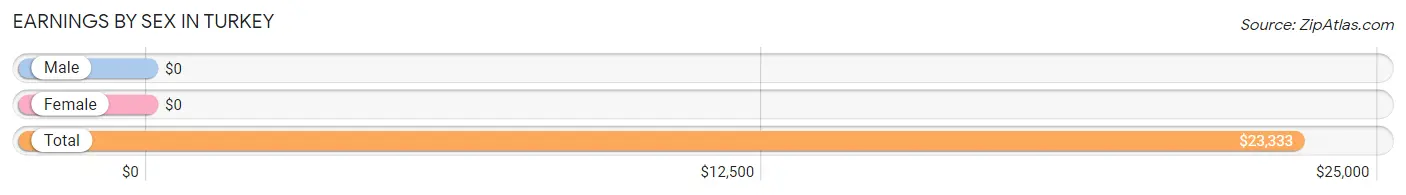
| Sex | Number | Average Earnings |
| Male | 79 (59.0%) | $0 |
| Female | 55 (41.0%) | $0 |
| Total | 134 (100.0%) | $23,333 |
Earnings by Sex by Income Bracket in Turkey
The most common earnings brackets in Turkey are $75,000 to $99,999 for men (26 | 32.9%) and $7,500 to $9,999 for women (20 | 36.4%).
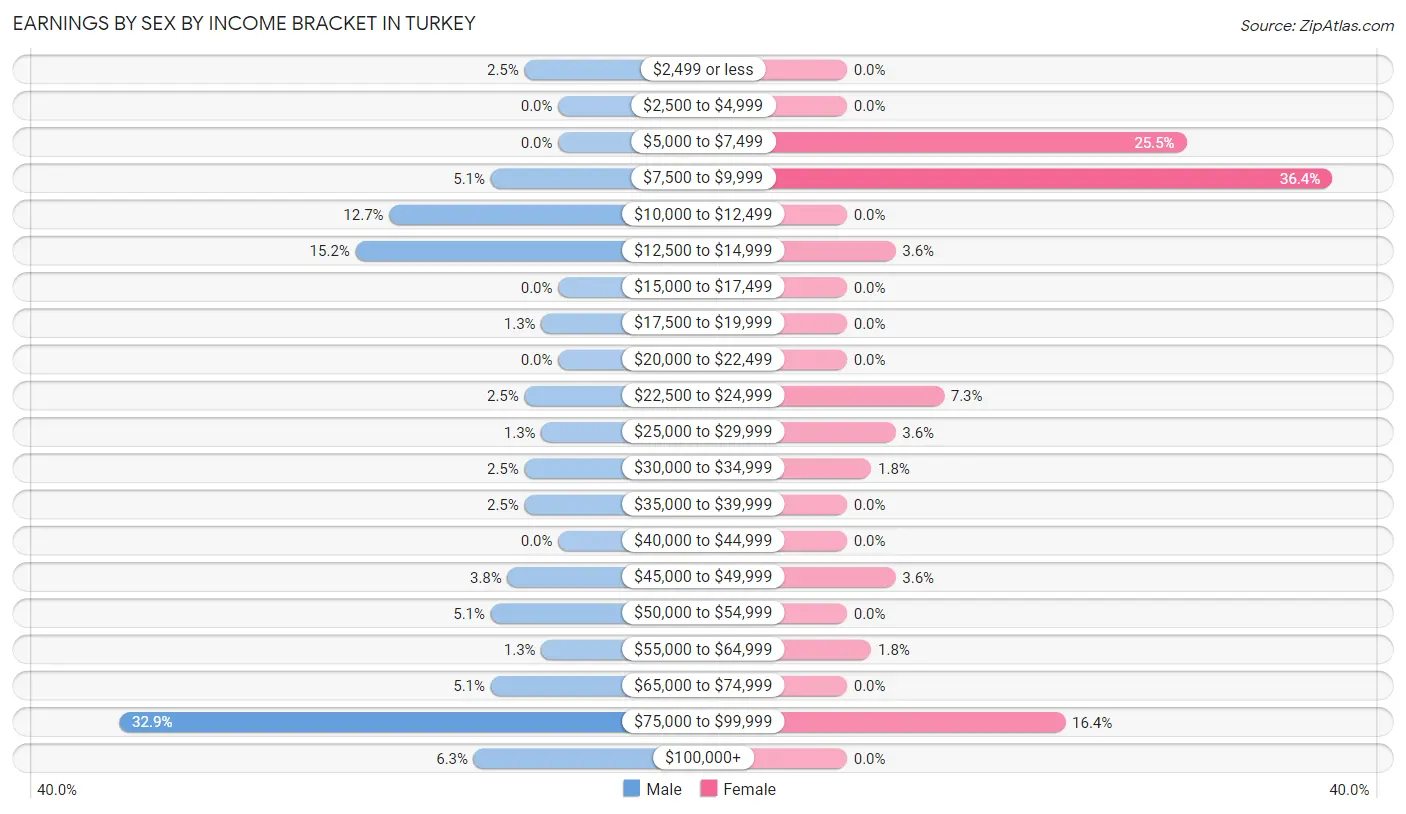
| Income | Male | Female |
| $2,499 or less | 2 (2.5%) | 0 (0.0%) |
| $2,500 to $4,999 | 0 (0.0%) | 0 (0.0%) |
| $5,000 to $7,499 | 0 (0.0%) | 14 (25.5%) |
| $7,500 to $9,999 | 4 (5.1%) | 20 (36.4%) |
| $10,000 to $12,499 | 10 (12.7%) | 0 (0.0%) |
| $12,500 to $14,999 | 12 (15.2%) | 2 (3.6%) |
| $15,000 to $17,499 | 0 (0.0%) | 0 (0.0%) |
| $17,500 to $19,999 | 1 (1.3%) | 0 (0.0%) |
| $20,000 to $22,499 | 0 (0.0%) | 0 (0.0%) |
| $22,500 to $24,999 | 2 (2.5%) | 4 (7.3%) |
| $25,000 to $29,999 | 1 (1.3%) | 2 (3.6%) |
| $30,000 to $34,999 | 2 (2.5%) | 1 (1.8%) |
| $35,000 to $39,999 | 2 (2.5%) | 0 (0.0%) |
| $40,000 to $44,999 | 0 (0.0%) | 0 (0.0%) |
| $45,000 to $49,999 | 3 (3.8%) | 2 (3.6%) |
| $50,000 to $54,999 | 4 (5.1%) | 0 (0.0%) |
| $55,000 to $64,999 | 1 (1.3%) | 1 (1.8%) |
| $65,000 to $74,999 | 4 (5.1%) | 0 (0.0%) |
| $75,000 to $99,999 | 26 (32.9%) | 9 (16.4%) |
| $100,000+ | 5 (6.3%) | 0 (0.0%) |
| Total | 79 (100.0%) | 55 (100.0%) |
Earnings by Sex by Educational Attainment in Turkey
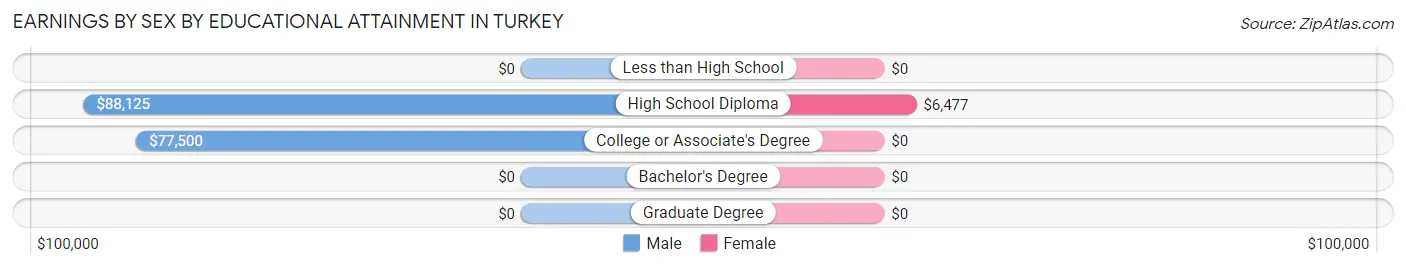
| Educational Attainment | Male Income | Female Income |
| Less than High School | - | - |
| High School Diploma | $88,125 | $6,477 |
| College or Associate's Degree | $77,500 | $0 |
| Bachelor's Degree | - | - |
| Graduate Degree | - | - |
| Total | - | - |
Family Income in Turkey
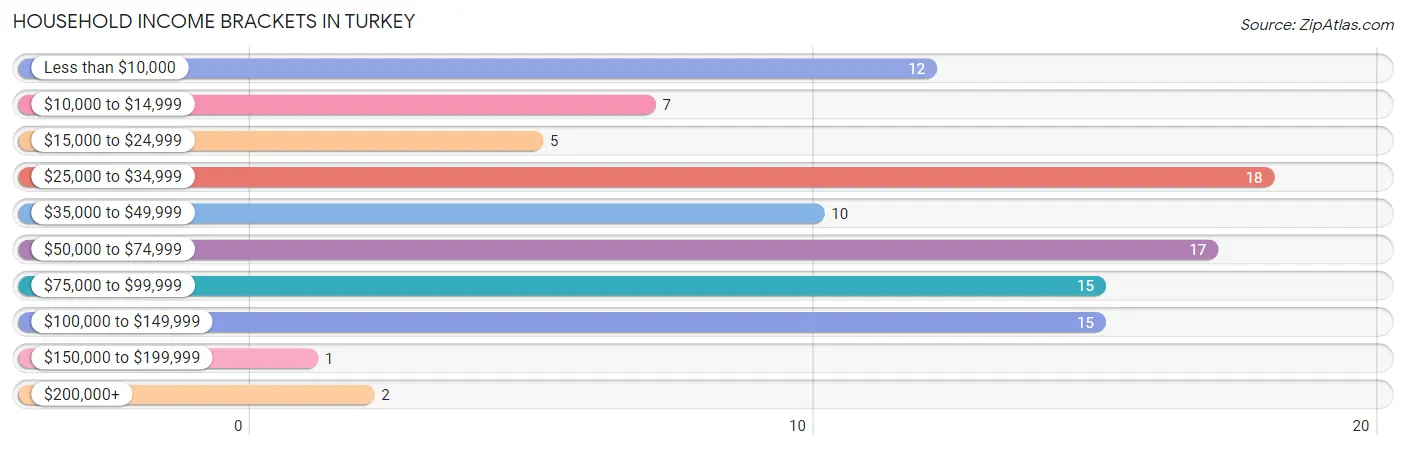
Family Income Brackets in Turkey
According to the Turkey family income data, there are 16 families falling into the $50,000 to $74,999 income range, which is the most common income bracket and makes up 21.0% of all families.
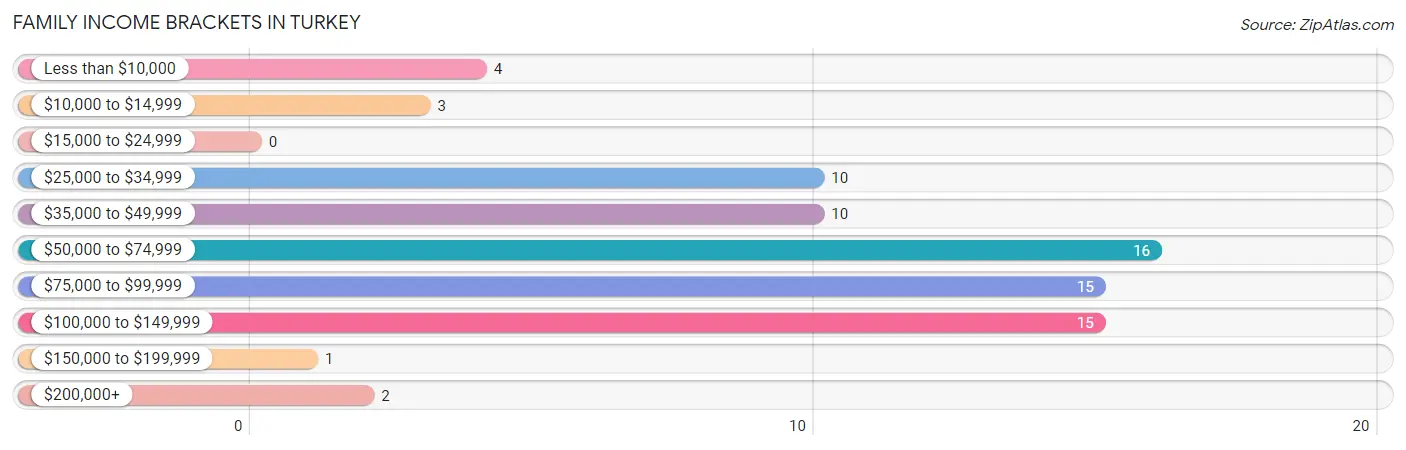
| Income Bracket | # Families | % Families |
| Less than $10,000 | 4 | 5.3% |
| $10,000 to $14,999 | 3 | 3.9% |
| $15,000 to $24,999 | 0 | 0.0% |
| $25,000 to $34,999 | 10 | 13.2% |
| $35,000 to $49,999 | 10 | 13.2% |
| $50,000 to $74,999 | 16 | 21.1% |
| $75,000 to $99,999 | 15 | 19.7% |
| $100,000 to $149,999 | 15 | 19.7% |
| $150,000 to $199,999 | 1 | 1.3% |
| $200,000+ | 2 | 2.6% |
Family Income by Famaliy Size in Turkey
2-person families (59 | 77.6%) account for the highest median family income in Turkey with $74,464 per family, while 2-person families (59 | 77.6%) have the highest median income of $37,232 per family member.
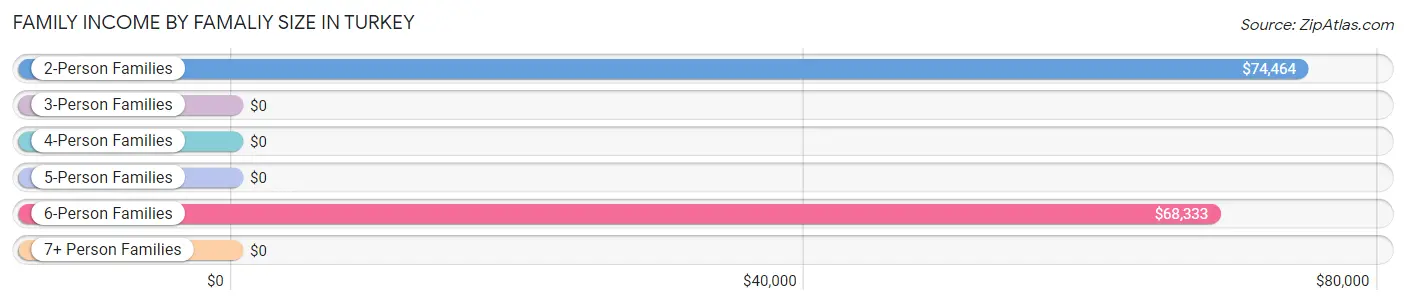
| Income Bracket | # Families | Median Income |
| 2-Person Families | 59 (77.6%) | $74,464 |
| 3-Person Families | 3 (4.0%) | $0 |
| 4-Person Families | 5 (6.6%) | $0 |
| 5-Person Families | 3 (4.0%) | $0 |
| 6-Person Families | 6 (7.9%) | $68,333 |
| 7+ Person Families | 0 (0.0%) | $0 |
| Total | 76 (100.0%) | $73,214 |
Family Income by Number of Earners in Turkey
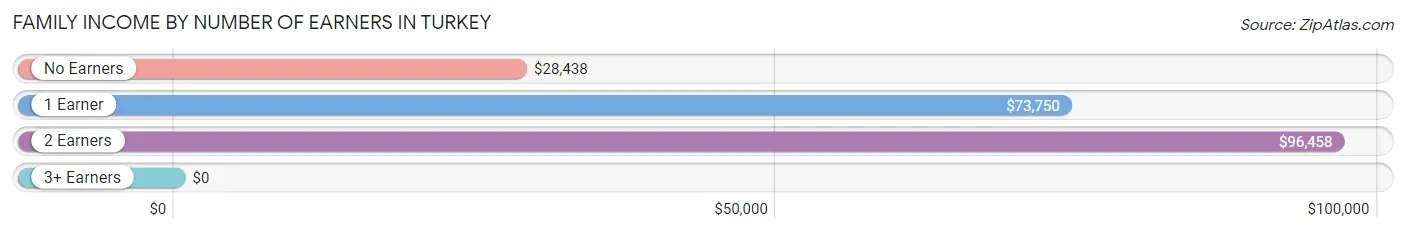
| Number of Earners | # Families | Median Income |
| No Earners | 17 (22.4%) | $28,438 |
| 1 Earner | 28 (36.8%) | $73,750 |
| 2 Earners | 28 (36.8%) | $96,458 |
| 3+ Earners | 3 (4.0%) | $0 |
| Total | 76 (100.0%) | $73,214 |
Household Income in Turkey
Household Income Brackets in Turkey
With 18 households falling in the category, the $25,000 to $34,999 income range is the most frequent in Turkey, accounting for 17.6% of all households. In contrast, only 1 households (1.0%) fall into the $150,000 to $199,999 income bracket, making it the least populous group.
| Income Bracket | # Households | % Households |
| Less than $10,000 | 12 | 11.8% |
| $10,000 to $14,999 | 7 | 6.9% |
| $15,000 to $24,999 | 5 | 4.9% |
| $25,000 to $34,999 | 18 | 17.6% |
| $35,000 to $49,999 | 10 | 9.8% |
| $50,000 to $74,999 | 17 | 16.7% |
| $75,000 to $99,999 | 15 | 14.7% |
| $100,000 to $149,999 | 15 | 14.7% |
| $150,000 to $199,999 | 1 | 1.0% |
| $200,000+ | 2 | 2.0% |
Household Income by Householder Age in Turkey
The median household income in Turkey is $47,000, with the highest median household income of $95,104 found in the 25 to 44 years age bracket for the primary householder. A total of 31 households (30.4%) fall into this category. Meanwhile, the 15 to 24 years age bracket for the primary householder has the lowest median household income of $0, with 2 households (2.0%) in this group.
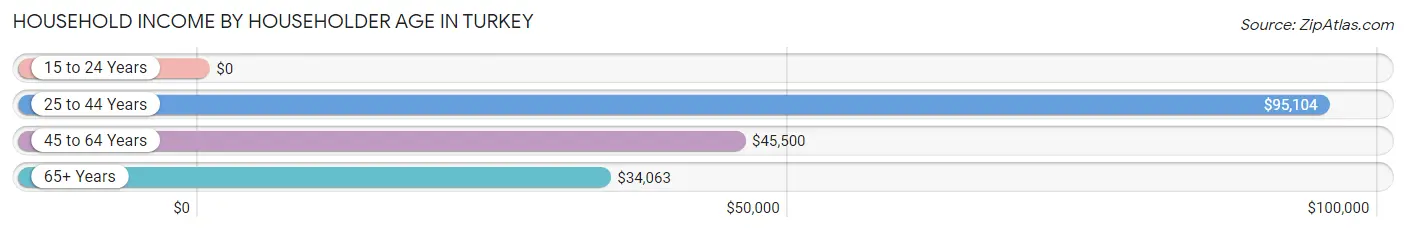
| Income Bracket | # Households | Median Income |
| 15 to 24 Years | 2 (2.0%) | $0 |
| 25 to 44 Years | 31 (30.4%) | $95,104 |
| 45 to 64 Years | 36 (35.3%) | $45,500 |
| 65+ Years | 33 (32.4%) | $34,063 |
| Total | 102 (100.0%) | $47,000 |
Poverty in Turkey
Income Below Poverty by Sex and Age in Turkey
With 9.3% poverty level for males and 17.6% for females among the residents of Turkey, 45 to 54 year old males and 45 to 54 year old females are the most vulnerable to poverty, with 7 males (35.0%) and 4 females (66.7%) in their respective age groups living below the poverty level.
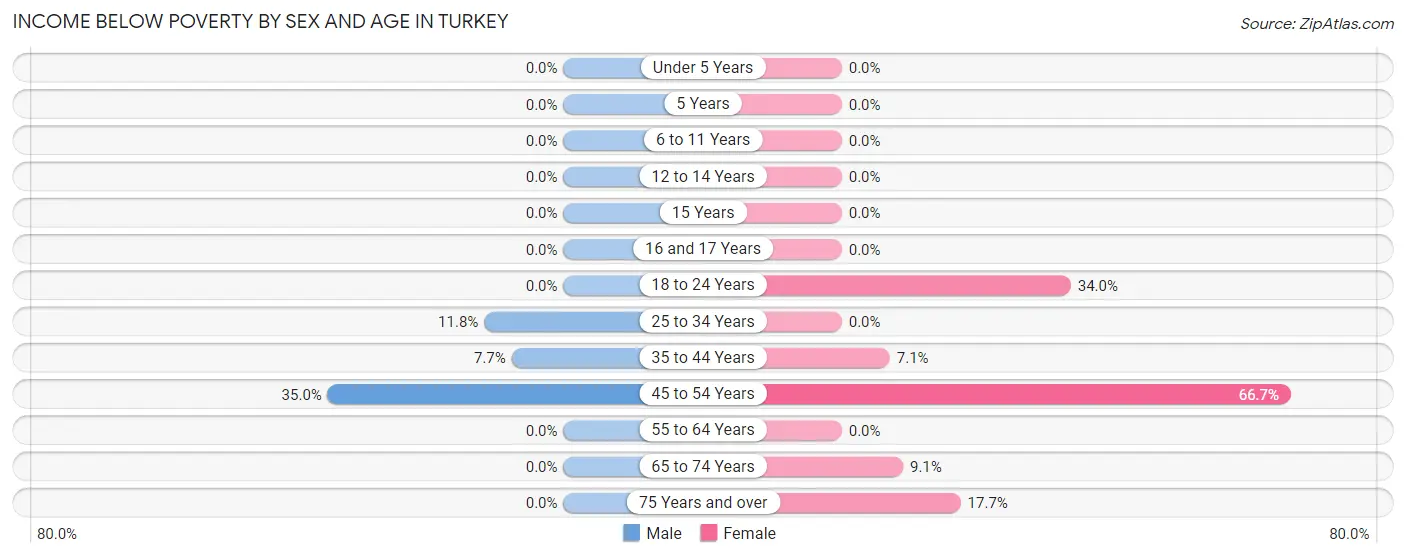
| Age Bracket | Male | Female |
| Under 5 Years | 0 (0.0%) | 0 (0.0%) |
| 5 Years | 0 (0.0%) | 0 (0.0%) |
| 6 to 11 Years | 0 (0.0%) | 0 (0.0%) |
| 12 to 14 Years | 0 (0.0%) | 0 (0.0%) |
| 15 Years | 0 (0.0%) | 0 (0.0%) |
| 16 and 17 Years | 0 (0.0%) | 0 (0.0%) |
| 18 to 24 Years | 0 (0.0%) | 17 (34.0%) |
| 25 to 34 Years | 4 (11.8%) | 0 (0.0%) |
| 35 to 44 Years | 2 (7.7%) | 1 (7.1%) |
| 45 to 54 Years | 7 (35.0%) | 4 (66.7%) |
| 55 to 64 Years | 0 (0.0%) | 0 (0.0%) |
| 65 to 74 Years | 0 (0.0%) | 2 (9.1%) |
| 75 Years and over | 0 (0.0%) | 3 (17.6%) |
| Total | 13 (9.3%) | 27 (17.6%) |
Income Above Poverty by Sex and Age in Turkey
According to the poverty statistics in Turkey, males aged under 5 years and females aged under 5 years are the age groups that are most secure financially, with 100.0% of males and 100.0% of females in these age groups living above the poverty line.
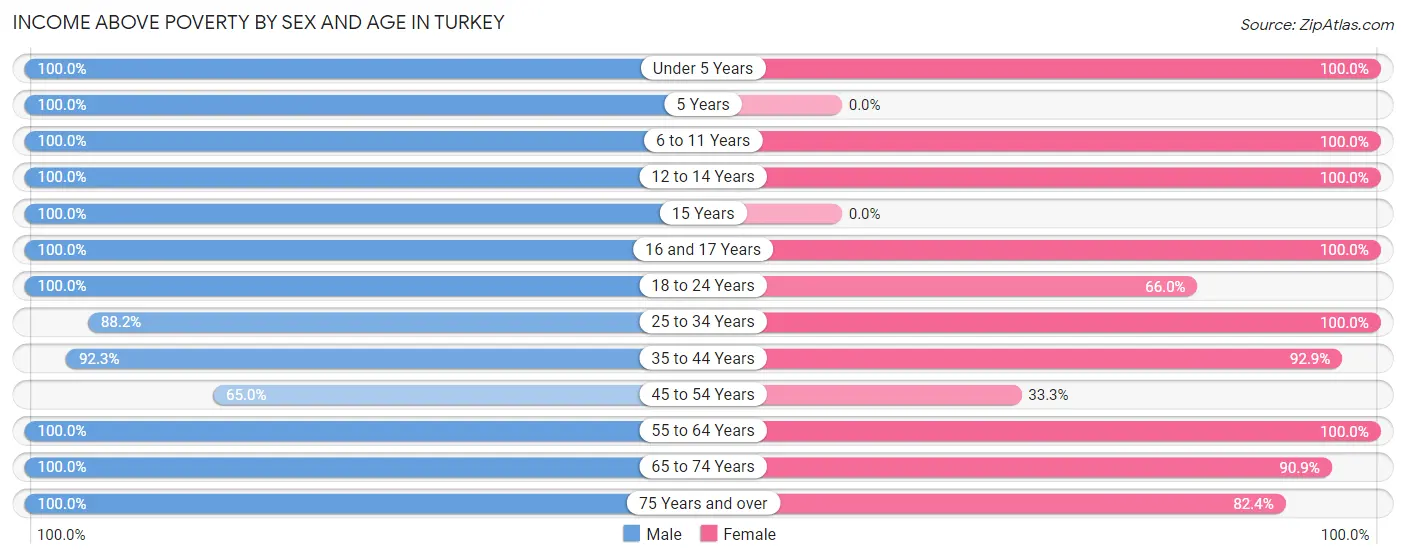
| Age Bracket | Male | Female |
| Under 5 Years | 11 (100.0%) | 3 (100.0%) |
| 5 Years | 5 (100.0%) | 0 (0.0%) |
| 6 to 11 Years | 5 (100.0%) | 4 (100.0%) |
| 12 to 14 Years | 2 (100.0%) | 1 (100.0%) |
| 15 Years | 3 (100.0%) | 0 (0.0%) |
| 16 and 17 Years | 2 (100.0%) | 4 (100.0%) |
| 18 to 24 Years | 2 (100.0%) | 33 (66.0%) |
| 25 to 34 Years | 30 (88.2%) | 8 (100.0%) |
| 35 to 44 Years | 24 (92.3%) | 13 (92.9%) |
| 45 to 54 Years | 13 (65.0%) | 2 (33.3%) |
| 55 to 64 Years | 19 (100.0%) | 24 (100.0%) |
| 65 to 74 Years | 6 (100.0%) | 20 (90.9%) |
| 75 Years and over | 4 (100.0%) | 14 (82.4%) |
| Total | 126 (90.6%) | 126 (82.4%) |
Income Below Poverty Among Married-Couple Families in Turkey
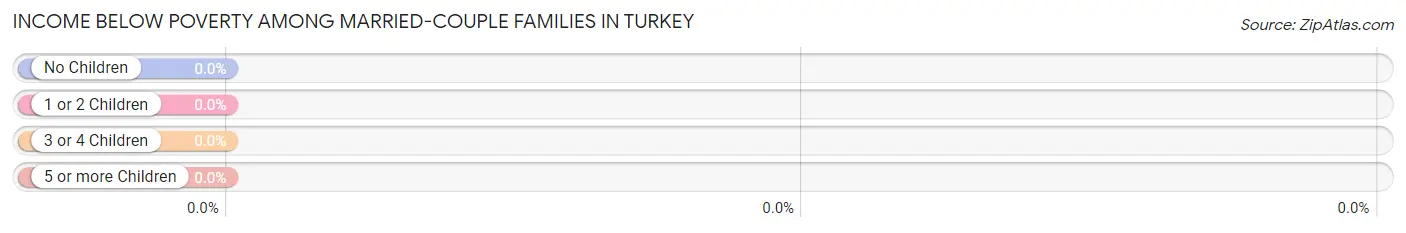
| Children | Above Poverty | Below Poverty |
| No Children | 41 (100.0%) | 0 (0.0%) |
| 1 or 2 Children | 4 (100.0%) | 0 (0.0%) |
| 3 or 4 Children | 4 (100.0%) | 0 (0.0%) |
| 5 or more Children | 0 (0.0%) | 0 (0.0%) |
| Total | 49 (100.0%) | 0 (0.0%) |
Income Below Poverty Among Single-Parent Households in Turkey
According to the poverty data in Turkey, 42.9% or 3 single-father households and 20.0% or 4 single-mother households are living below the poverty line. Among single-father households, those with no children have the highest poverty rate, with 3 households (100.0%) experiencing poverty. Likewise, among single-mother households, those with no children have the highest poverty rate, with 4 households (23.5%) falling below the poverty line.
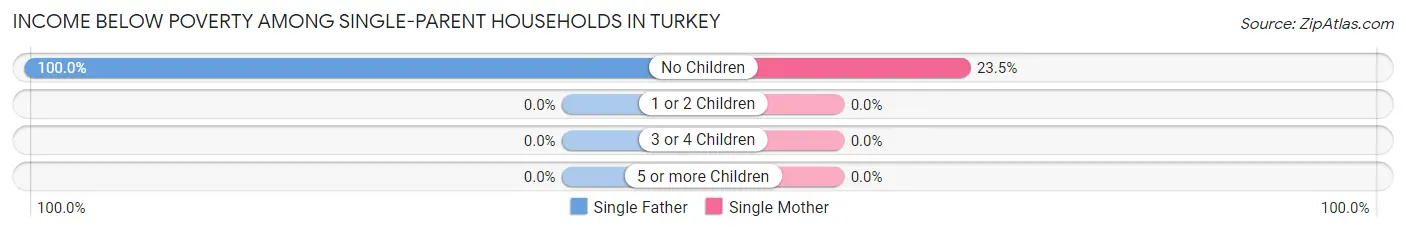
| Children | Single Father | Single Mother |
| No Children | 3 (100.0%) | 4 (23.5%) |
| 1 or 2 Children | 0 (0.0%) | 0 (0.0%) |
| 3 or 4 Children | 0 (0.0%) | 0 (0.0%) |
| 5 or more Children | 0 (0.0%) | 0 (0.0%) |
| Total | 3 (42.9%) | 4 (20.0%) |
Income Below Poverty Among Married-Couple vs Single-Parent Households in Turkey
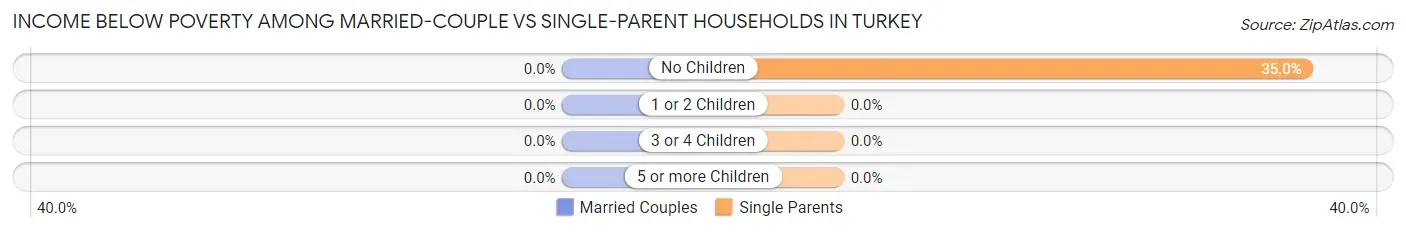
| Children | Married-Couple Families | Single-Parent Households |
| No Children | 0 (0.0%) | 7 (35.0%) |
| 1 or 2 Children | 0 (0.0%) | 0 (0.0%) |
| 3 or 4 Children | 0 (0.0%) | 0 (0.0%) |
| 5 or more Children | 0 (0.0%) | 0 (0.0%) |
| Total | 0 (0.0%) | 7 (25.9%) |
Employment Characteristics in Turkey
Employment by Class of Employer in Turkey
Among the 132 employed individuals in Turkey, private company employees (78 | 59.1%), self-employed (incorporated) (13 | 9.9%), and not-for-profit organizations (12 | 9.1%) make up the most common classes of employment.
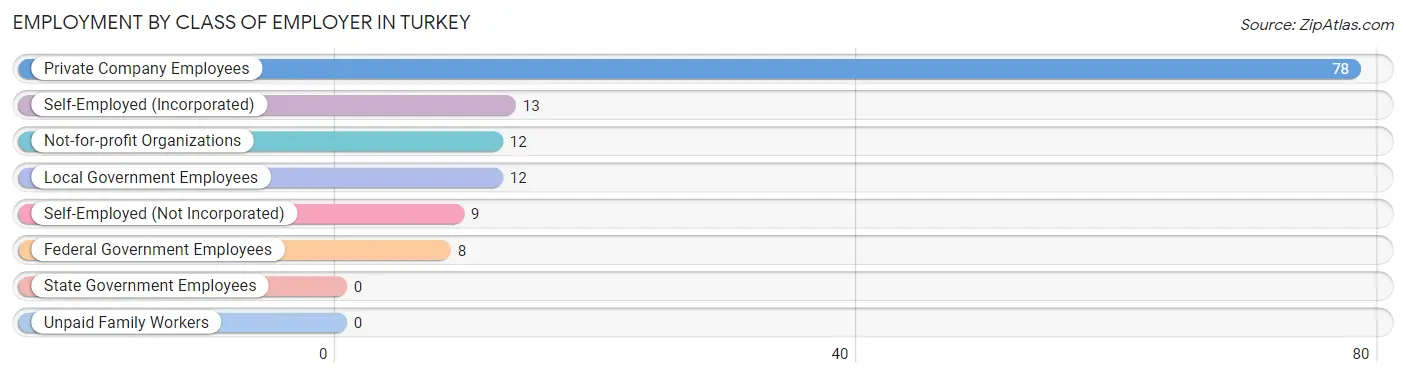
| Employer Class | # Employees | % Employees |
| Private Company Employees | 78 | 59.1% |
| Self-Employed (Incorporated) | 13 | 9.9% |
| Self-Employed (Not Incorporated) | 9 | 6.8% |
| Not-for-profit Organizations | 12 | 9.1% |
| Local Government Employees | 12 | 9.1% |
| State Government Employees | 0 | 0.0% |
| Federal Government Employees | 8 | 6.1% |
| Unpaid Family Workers | 0 | 0.0% |
| Total | 132 | 100.0% |
Employment Status by Age in Turkey
According to the labor force statistics for Turkey, out of the total population over 16 years of age (258), 53.1% or 137 individuals are in the labor force, with 3.6% or 5 of them unemployed. The age group with the highest labor force participation rate is 30 to 34 years, with 100.0% or 8 individuals in the labor force. Within the labor force, the 75 years and over age range has the highest percentage of unemployed individuals, with 100.0% or 1 of them being unemployed.
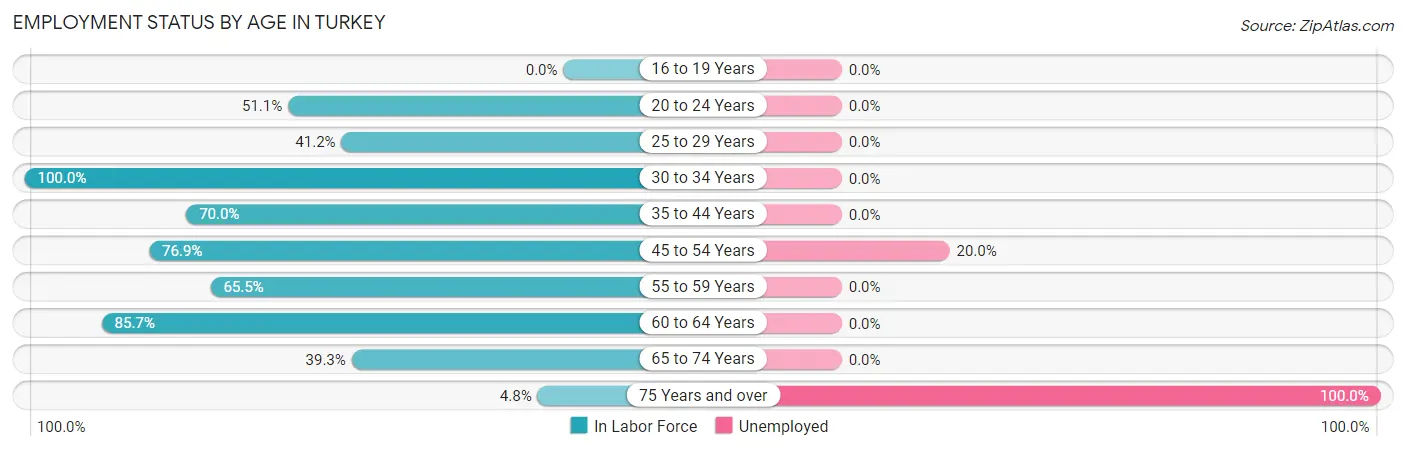
| Age Bracket | In Labor Force | Unemployed |
| 16 to 19 Years | 0 (0.0%) | 0 (0.0%) |
| 20 to 24 Years | 24 (51.1%) | 0 (0.0%) |
| 25 to 29 Years | 14 (41.2%) | 0 (0.0%) |
| 30 to 34 Years | 8 (100.0%) | 0 (0.0%) |
| 35 to 44 Years | 28 (70.0%) | 0 (0.0%) |
| 45 to 54 Years | 20 (76.9%) | 4 (20.0%) |
| 55 to 59 Years | 19 (65.5%) | 0 (0.0%) |
| 60 to 64 Years | 12 (85.7%) | 0 (0.0%) |
| 65 to 74 Years | 11 (39.3%) | 0 (0.0%) |
| 75 Years and over | 1 (4.8%) | 1 (100.0%) |
| Total | 137 (53.1%) | 5 (3.6%) |
Employment Status by Educational Attainment in Turkey
According to labor force statistics for Turkey, 66.9% of individuals (101) out of the total population between 25 and 64 years of age (151) are in the labor force, with 4.0% or 4 of them being unemployed. The group with the highest labor force participation rate are those with the educational attainment of less than high school, with 85.2% or 46 individuals in the labor force. Within the labor force, individuals with less than high school education have the highest percentage of unemployment, with 6.5% or 3 of them being unemployed.
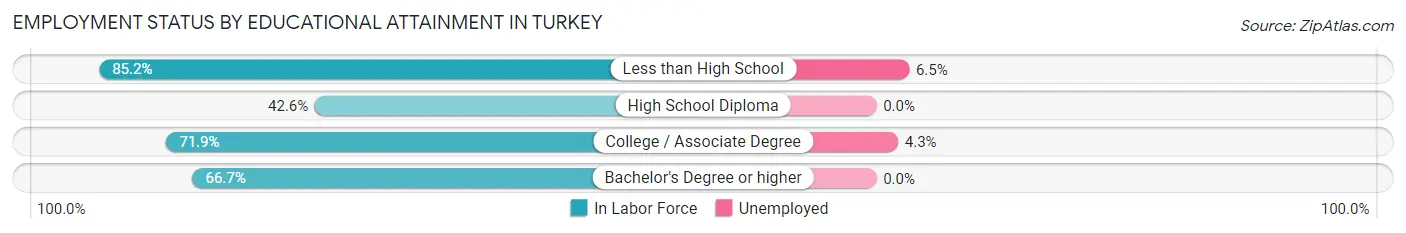
| Educational Attainment | In Labor Force | Unemployed |
| Less than High School | 46 (85.2%) | 4 (6.5%) |
| High School Diploma | 20 (42.6%) | 0 (0.0%) |
| College / Associate Degree | 23 (71.9%) | 1 (4.3%) |
| Bachelor's Degree or higher | 12 (66.7%) | 0 (0.0%) |
| Total | 101 (66.9%) | 6 (4.0%) |
Employment Occupations by Sex in Turkey
Management, Business, Science and Arts Occupations
The most common Management, Business, Science and Arts occupations in Turkey are Management (24 | 18.2%), Community & Social Service (14 | 10.6%), Education, Arts & Media (12 | 9.1%), Education Instruction & Library (2 | 1.5%), and Business & Financial (1 | 0.8%).
Management, Business, Science and Arts Occupations by Sex
Within the Management, Business, Science and Arts occupations in Turkey, the most male-oriented occupations are Education, Arts & Media (100.0%), Community & Social Service (85.7%), and Management (66.7%), while the most female-oriented occupations are Business & Financial (100.0%), Education Instruction & Library (100.0%), and Health Diagnosing & Treating (100.0%).
| Occupation | Male | Female |
| Management | 16 (66.7%) | 8 (33.3%) |
| Business & Financial | 0 (0.0%) | 1 (100.0%) |
| Computers, Engineering & Science | 0 (0.0%) | 0 (0.0%) |
| Computers & Mathematics | 0 (0.0%) | 0 (0.0%) |
| Architecture & Engineering | 0 (0.0%) | 0 (0.0%) |
| Life, Physical & Social Science | 0 (0.0%) | 0 (0.0%) |
| Community & Social Service | 12 (85.7%) | 2 (14.3%) |
| Education, Arts & Media | 12 (100.0%) | 0 (0.0%) |
| Legal Services & Support | 0 (0.0%) | 0 (0.0%) |
| Education Instruction & Library | 0 (0.0%) | 2 (100.0%) |
| Arts, Media & Entertainment | 0 (0.0%) | 0 (0.0%) |
| Health Diagnosing & Treating | 0 (0.0%) | 1 (100.0%) |
| Health Technologists | 0 (0.0%) | 1 (100.0%) |
| Total (Category) | 28 (70.0%) | 12 (30.0%) |
| Total (Overall) | 77 (58.3%) | 55 (41.7%) |
Services Occupations
The most common Services occupations in Turkey are Healthcare Support (11 | 8.3%), Cleaning & Maintenance (7 | 5.3%), Security & Protection (5 | 3.8%), Firefighting & Prevention (5 | 3.8%), and Food Preparation & Serving (2 | 1.5%).
Services Occupations by Sex
Within the Services occupations in Turkey, the most male-oriented occupations are Security & Protection (100.0%), Firefighting & Prevention (100.0%), and Cleaning & Maintenance (57.1%), while the most female-oriented occupations are Healthcare Support (100.0%), Food Preparation & Serving (100.0%), and Cleaning & Maintenance (42.9%).
| Occupation | Male | Female |
| Healthcare Support | 0 (0.0%) | 11 (100.0%) |
| Security & Protection | 5 (100.0%) | 0 (0.0%) |
| Firefighting & Prevention | 5 (100.0%) | 0 (0.0%) |
| Law Enforcement | 0 (0.0%) | 0 (0.0%) |
| Food Preparation & Serving | 0 (0.0%) | 2 (100.0%) |
| Cleaning & Maintenance | 4 (57.1%) | 3 (42.9%) |
| Personal Care & Service | 0 (0.0%) | 0 (0.0%) |
| Total (Category) | 9 (36.0%) | 16 (64.0%) |
| Total (Overall) | 77 (58.3%) | 55 (41.7%) |
Sales and Office Occupations
The most common Sales and Office occupations in Turkey are Office & Administration (25 | 18.9%), and Sales & Related (8 | 6.1%).

Sales and Office Occupations by Sex

| Occupation | Male | Female |
| Sales & Related | 6 (75.0%) | 2 (25.0%) |
| Office & Administration | 0 (0.0%) | 25 (100.0%) |
| Total (Category) | 6 (18.2%) | 27 (81.8%) |
| Total (Overall) | 77 (58.3%) | 55 (41.7%) |
Natural Resources, Construction and Maintenance Occupations
The most common Natural Resources, Construction and Maintenance occupations in Turkey are Installation, Maintenance & Repair (14 | 10.6%), Construction & Extraction (7 | 5.3%), and Farming, Fishing & Forestry (6 | 4.5%).
Natural Resources, Construction and Maintenance Occupations by Sex
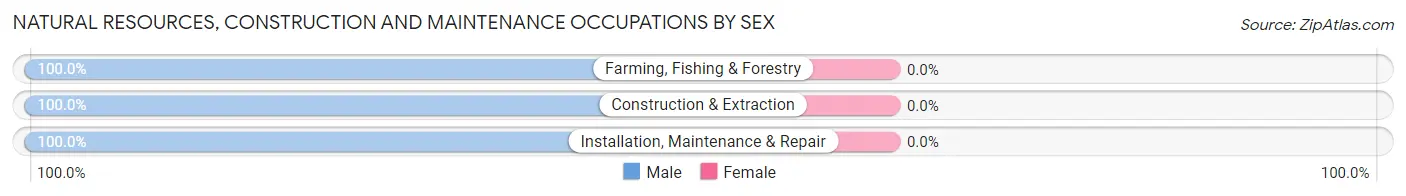
| Occupation | Male | Female |
| Farming, Fishing & Forestry | 6 (100.0%) | 0 (0.0%) |
| Construction & Extraction | 7 (100.0%) | 0 (0.0%) |
| Installation, Maintenance & Repair | 14 (100.0%) | 0 (0.0%) |
| Total (Category) | 27 (100.0%) | 0 (0.0%) |
| Total (Overall) | 77 (58.3%) | 55 (41.7%) |
Production, Transportation and Moving Occupations
The most common Production, Transportation and Moving occupations in Turkey are Material Moving (4 | 3.0%), Production (2 | 1.5%), and Transportation (1 | 0.8%).
Production, Transportation and Moving Occupations by Sex
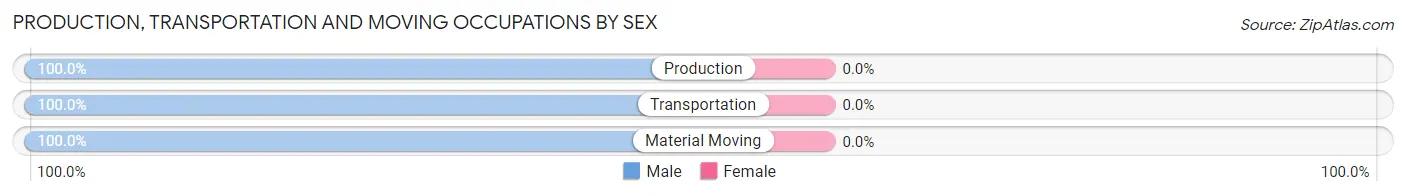
| Occupation | Male | Female |
| Production | 2 (100.0%) | 0 (0.0%) |
| Transportation | 1 (100.0%) | 0 (0.0%) |
| Material Moving | 4 (100.0%) | 0 (0.0%) |
| Total (Category) | 7 (100.0%) | 0 (0.0%) |
| Total (Overall) | 77 (58.3%) | 55 (41.7%) |
Employment Industries by Sex in Turkey
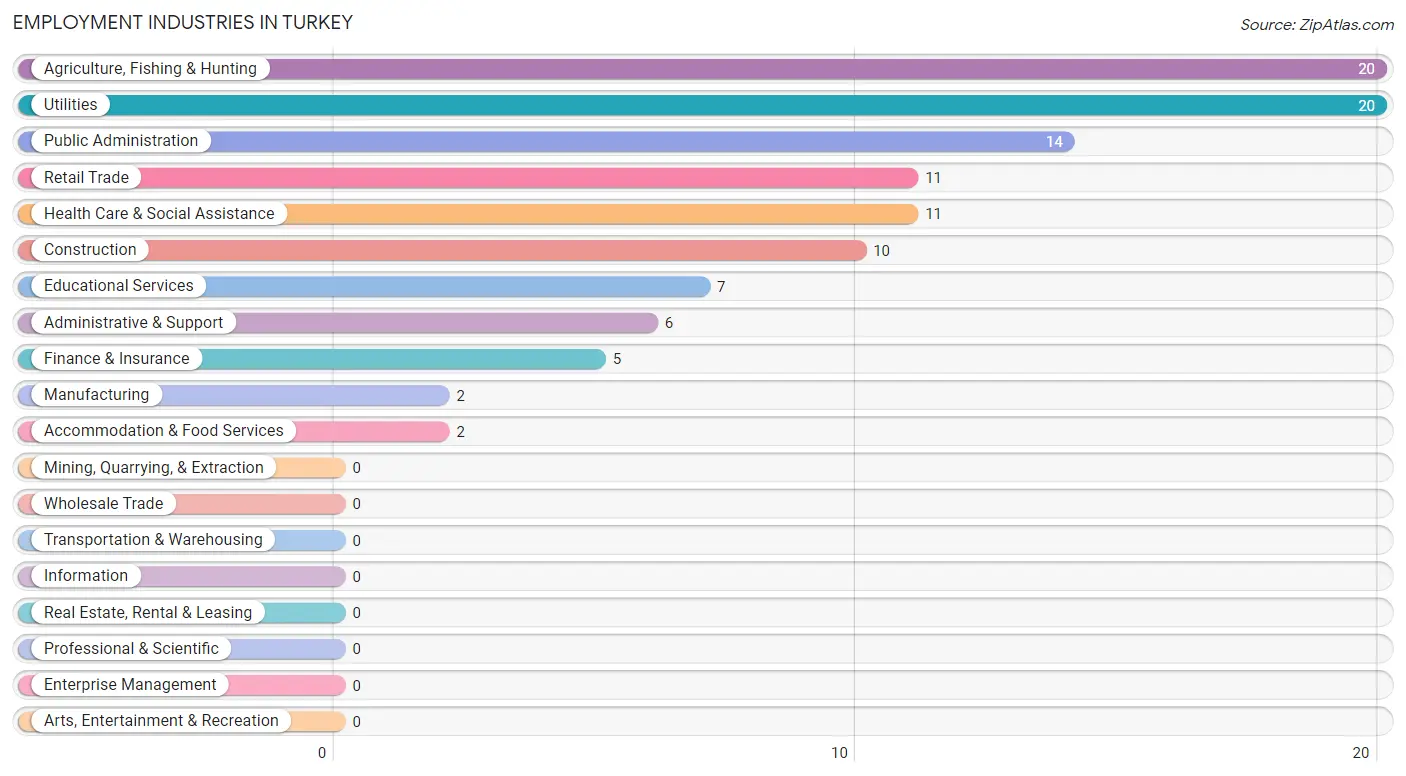
Employment Industries in Turkey
The major employment industries in Turkey include Agriculture, Fishing & Hunting (20 | 15.1%), Utilities (20 | 15.1%), Public Administration (14 | 10.6%), Retail Trade (11 | 8.3%), and Health Care & Social Assistance (11 | 8.3%).
Employment Industries by Sex in Turkey
The Turkey industries that see more men than women are Agriculture, Fishing & Hunting (100.0%), Construction (100.0%), and Manufacturing (100.0%), whereas the industries that tend to have a higher number of women are Utilities (100.0%), Educational Services (100.0%), and Health Care & Social Assistance (100.0%).
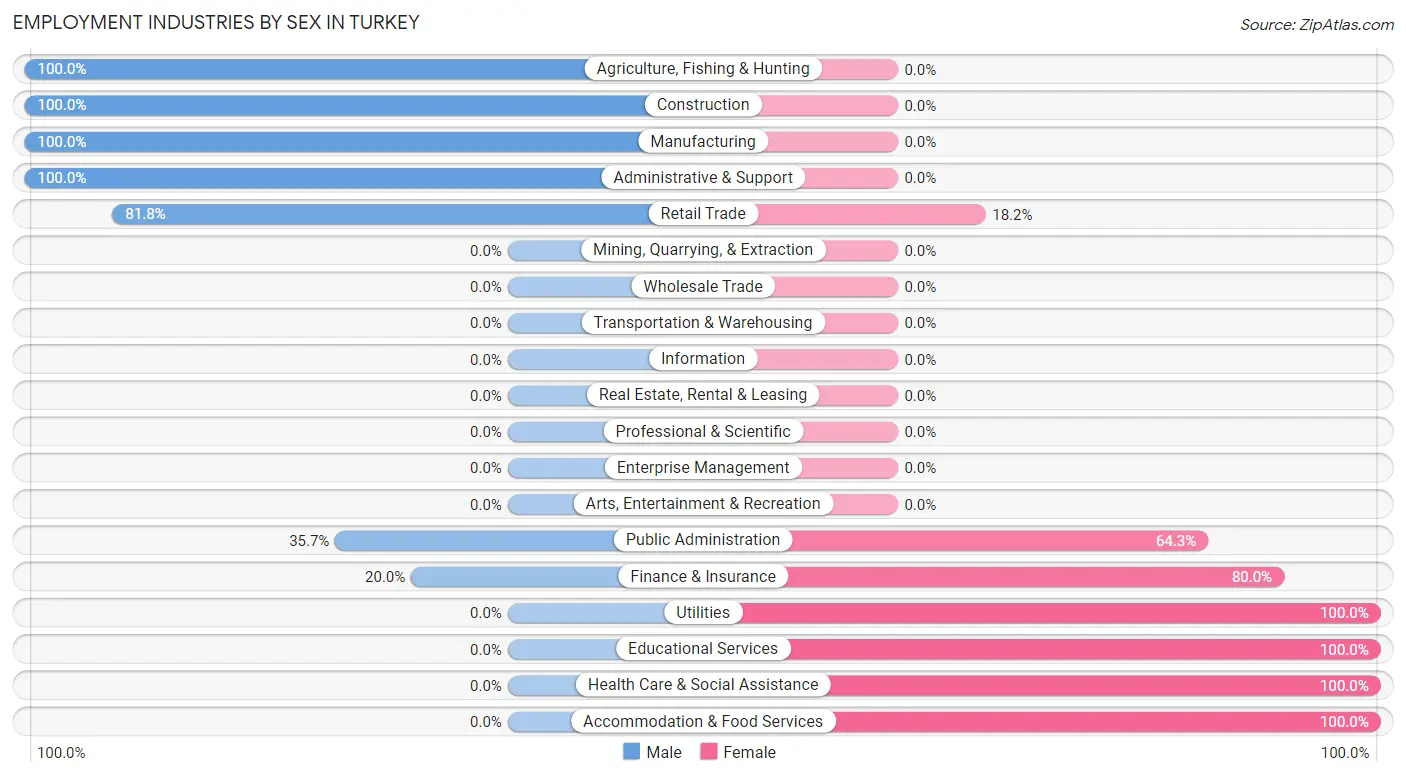
| Industry | Male | Female |
| Agriculture, Fishing & Hunting | 20 (100.0%) | 0 (0.0%) |
| Mining, Quarrying, & Extraction | 0 (0.0%) | 0 (0.0%) |
| Construction | 10 (100.0%) | 0 (0.0%) |
| Manufacturing | 2 (100.0%) | 0 (0.0%) |
| Wholesale Trade | 0 (0.0%) | 0 (0.0%) |
| Retail Trade | 9 (81.8%) | 2 (18.2%) |
| Transportation & Warehousing | 0 (0.0%) | 0 (0.0%) |
| Utilities | 0 (0.0%) | 20 (100.0%) |
| Information | 0 (0.0%) | 0 (0.0%) |
| Finance & Insurance | 1 (20.0%) | 4 (80.0%) |
| Real Estate, Rental & Leasing | 0 (0.0%) | 0 (0.0%) |
| Professional & Scientific | 0 (0.0%) | 0 (0.0%) |
| Enterprise Management | 0 (0.0%) | 0 (0.0%) |
| Administrative & Support | 6 (100.0%) | 0 (0.0%) |
| Educational Services | 0 (0.0%) | 7 (100.0%) |
| Health Care & Social Assistance | 0 (0.0%) | 11 (100.0%) |
| Arts, Entertainment & Recreation | 0 (0.0%) | 0 (0.0%) |
| Accommodation & Food Services | 0 (0.0%) | 2 (100.0%) |
| Public Administration | 5 (35.7%) | 9 (64.3%) |
| Total | 77 (58.3%) | 55 (41.7%) |
Education in Turkey
School Enrollment in Turkey
The most common levels of schooling among the 54 students in Turkey are college / undergraduate (28 | 51.8%), high school (10 | 18.5%), and middle school (7 | 13.0%).
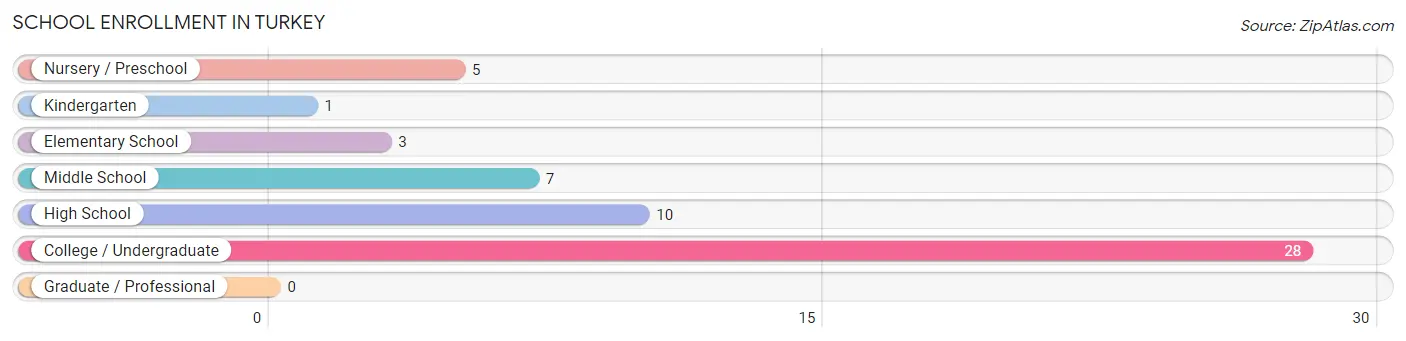
| School Level | # Students | % Students |
| Nursery / Preschool | 5 | 9.3% |
| Kindergarten | 1 | 1.8% |
| Elementary School | 3 | 5.6% |
| Middle School | 7 | 13.0% |
| High School | 10 | 18.5% |
| College / Undergraduate | 28 | 51.8% |
| Graduate / Professional | 0 | 0.0% |
| Total | 54 | 100.0% |
School Enrollment by Age by Funding Source in Turkey
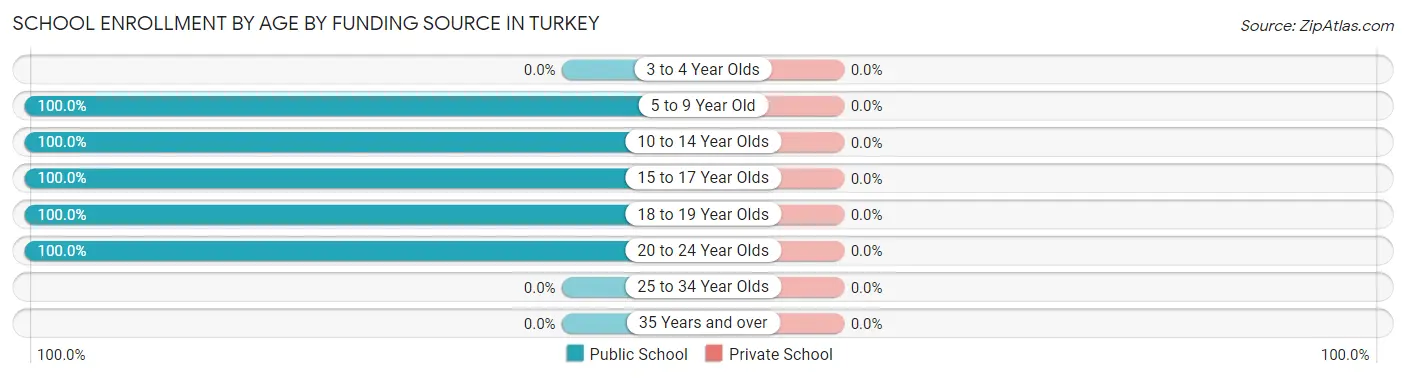
| Age Bracket | Public School | Private School |
| 3 to 4 Year Olds | 0 (0.0%) | 0 (0.0%) |
| 5 to 9 Year Old | 9 (100.0%) | 0 (0.0%) |
| 10 to 14 Year Olds | 8 (100.0%) | 0 (0.0%) |
| 15 to 17 Year Olds | 9 (100.0%) | 0 (0.0%) |
| 18 to 19 Year Olds | 5 (100.0%) | 0 (0.0%) |
| 20 to 24 Year Olds | 23 (100.0%) | 0 (0.0%) |
| 25 to 34 Year Olds | 0 (0.0%) | 0 (0.0%) |
| 35 Years and over | 0 (0.0%) | 0 (0.0%) |
| Total | 54 (100.0%) | 0 (0.0%) |
Educational Attainment by Field of Study in Turkey
Psychology (4 | 19.1%), social sciences (4 | 19.1%), education (4 | 19.1%), business (3 | 14.3%), and computers & mathematics (1 | 4.8%) are the most common fields of study among 21 individuals in Turkey who have obtained a bachelor's degree or higher.
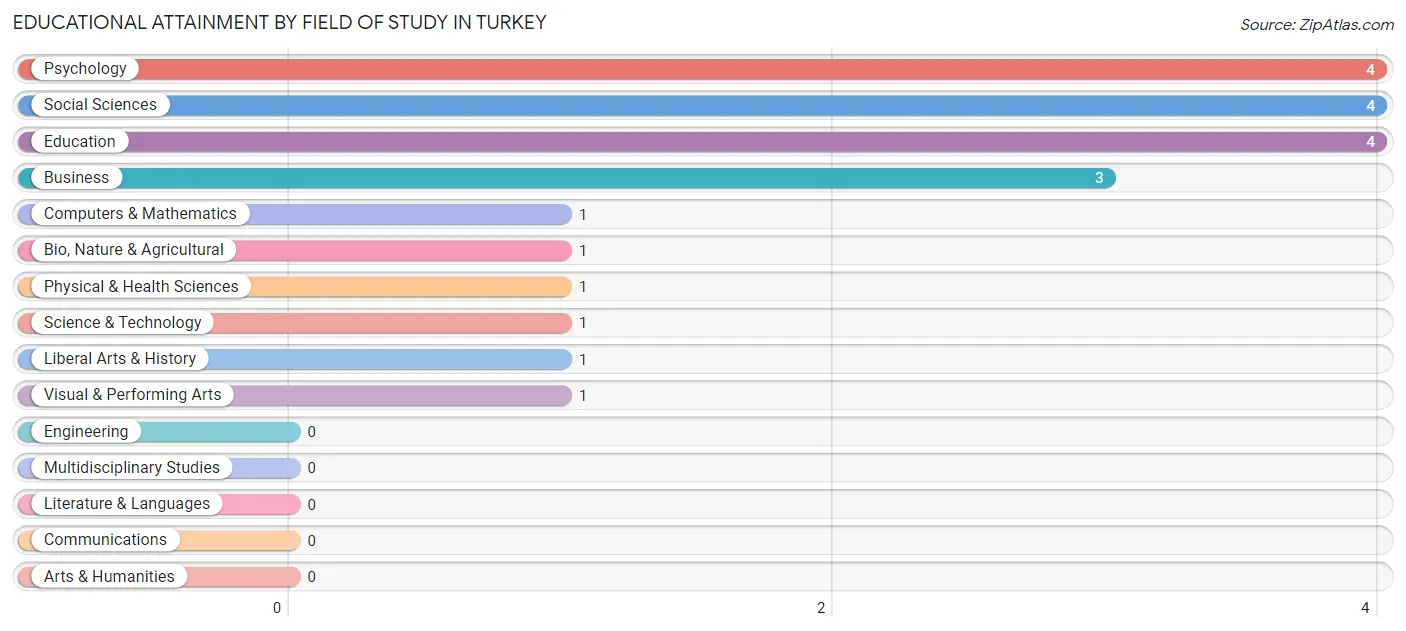
| Field of Study | # Graduates | % Graduates |
| Computers & Mathematics | 1 | 4.8% |
| Bio, Nature & Agricultural | 1 | 4.8% |
| Physical & Health Sciences | 1 | 4.8% |
| Psychology | 4 | 19.1% |
| Social Sciences | 4 | 19.1% |
| Engineering | 0 | 0.0% |
| Multidisciplinary Studies | 0 | 0.0% |
| Science & Technology | 1 | 4.8% |
| Business | 3 | 14.3% |
| Education | 4 | 19.1% |
| Literature & Languages | 0 | 0.0% |
| Liberal Arts & History | 1 | 4.8% |
| Visual & Performing Arts | 1 | 4.8% |
| Communications | 0 | 0.0% |
| Arts & Humanities | 0 | 0.0% |
| Total | 21 | 100.0% |
Transportation & Commute in Turkey
Vehicle Availability by Sex in Turkey
The most prevalent vehicle ownership categories in Turkey are males with 2 vehicles (31, accounting for 40.3%) and females with 2 vehicles (16, making up 56.4%).
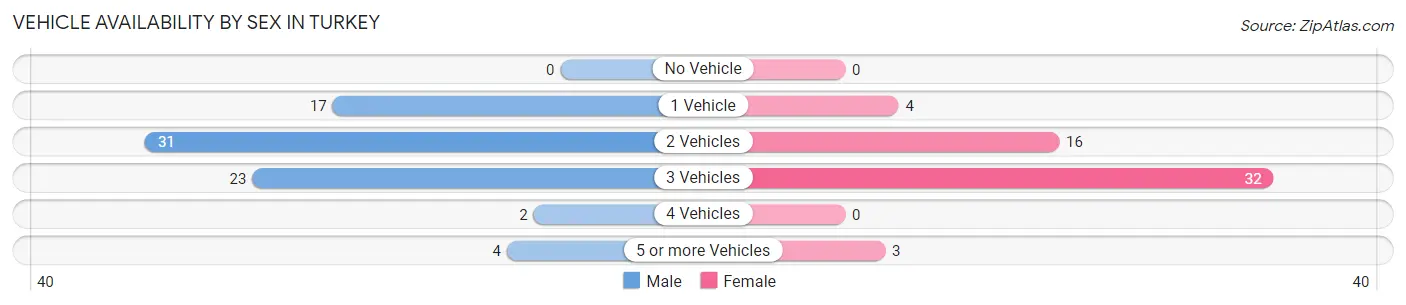
| Vehicles Available | Male | Female |
| No Vehicle | 0 (0.0%) | 0 (0.0%) |
| 1 Vehicle | 17 (22.1%) | 4 (7.3%) |
| 2 Vehicles | 31 (40.3%) | 16 (29.1%) |
| 3 Vehicles | 23 (29.9%) | 32 (58.2%) |
| 4 Vehicles | 2 (2.6%) | 0 (0.0%) |
| 5 or more Vehicles | 4 (5.2%) | 3 (5.4%) |
| Total | 77 (100.0%) | 55 (100.0%) |
Commute Time in Turkey
The most frequently occuring commute durations in Turkey are 10 to 14 minutes (42 commuters, 32.3%), 5 to 9 minutes (31 commuters, 23.8%), and less than 5 minutes (24 commuters, 18.5%).
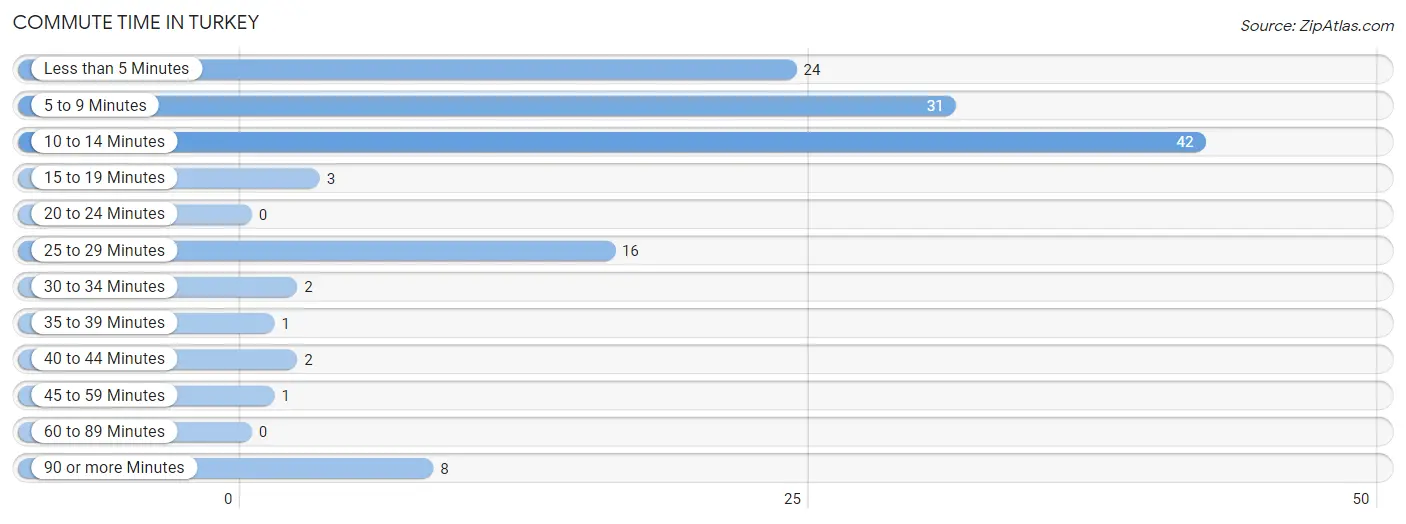
| Commute Time | # Commuters | % Commuters |
| Less than 5 Minutes | 24 | 18.5% |
| 5 to 9 Minutes | 31 | 23.8% |
| 10 to 14 Minutes | 42 | 32.3% |
| 15 to 19 Minutes | 3 | 2.3% |
| 20 to 24 Minutes | 0 | 0.0% |
| 25 to 29 Minutes | 16 | 12.3% |
| 30 to 34 Minutes | 2 | 1.5% |
| 35 to 39 Minutes | 1 | 0.8% |
| 40 to 44 Minutes | 2 | 1.5% |
| 45 to 59 Minutes | 1 | 0.8% |
| 60 to 89 Minutes | 0 | 0.0% |
| 90 or more Minutes | 8 | 6.1% |
Commute Time by Sex in Turkey
The most common commute times in Turkey are 5 to 9 minutes (16 commuters, 21.0%) for males and 10 to 14 minutes (26 commuters, 48.1%) for females.
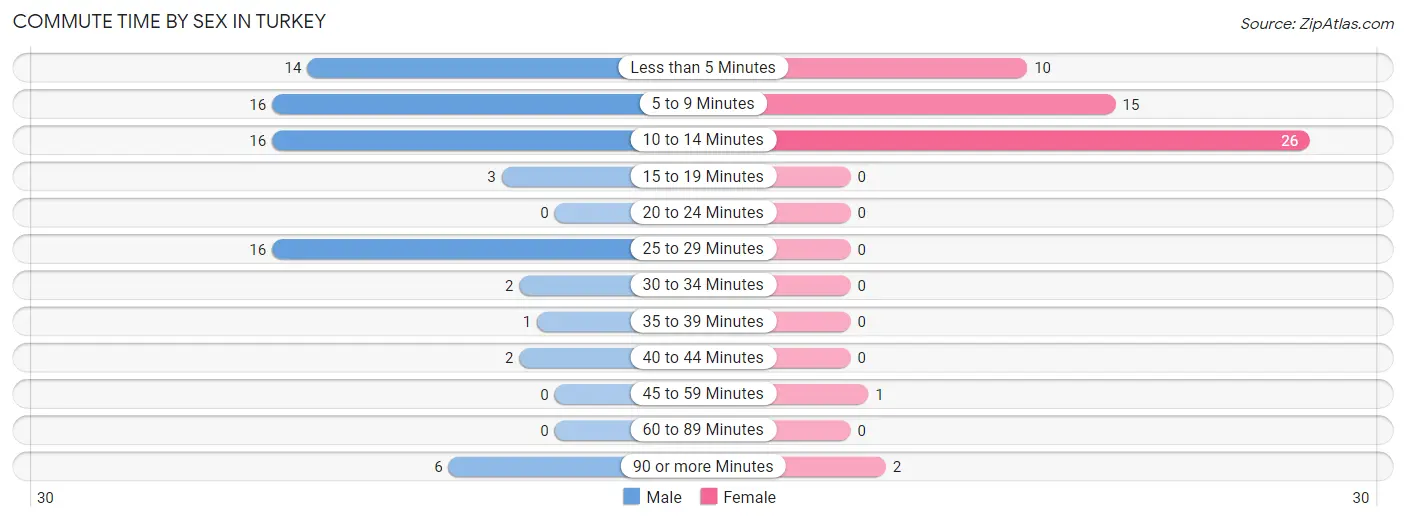
| Commute Time | Male | Female |
| Less than 5 Minutes | 14 (18.4%) | 10 (18.5%) |
| 5 to 9 Minutes | 16 (21.0%) | 15 (27.8%) |
| 10 to 14 Minutes | 16 (21.0%) | 26 (48.1%) |
| 15 to 19 Minutes | 3 (4.0%) | 0 (0.0%) |
| 20 to 24 Minutes | 0 (0.0%) | 0 (0.0%) |
| 25 to 29 Minutes | 16 (21.0%) | 0 (0.0%) |
| 30 to 34 Minutes | 2 (2.6%) | 0 (0.0%) |
| 35 to 39 Minutes | 1 (1.3%) | 0 (0.0%) |
| 40 to 44 Minutes | 2 (2.6%) | 0 (0.0%) |
| 45 to 59 Minutes | 0 (0.0%) | 1 (1.8%) |
| 60 to 89 Minutes | 0 (0.0%) | 0 (0.0%) |
| 90 or more Minutes | 6 (7.9%) | 2 (3.7%) |
Time of Departure to Work by Sex in Turkey
The most frequent times of departure to work in Turkey are 6:00 AM to 6:29 AM (23, 30.3%) for males and 8:30 AM to 8:59 AM (33, 61.1%) for females.
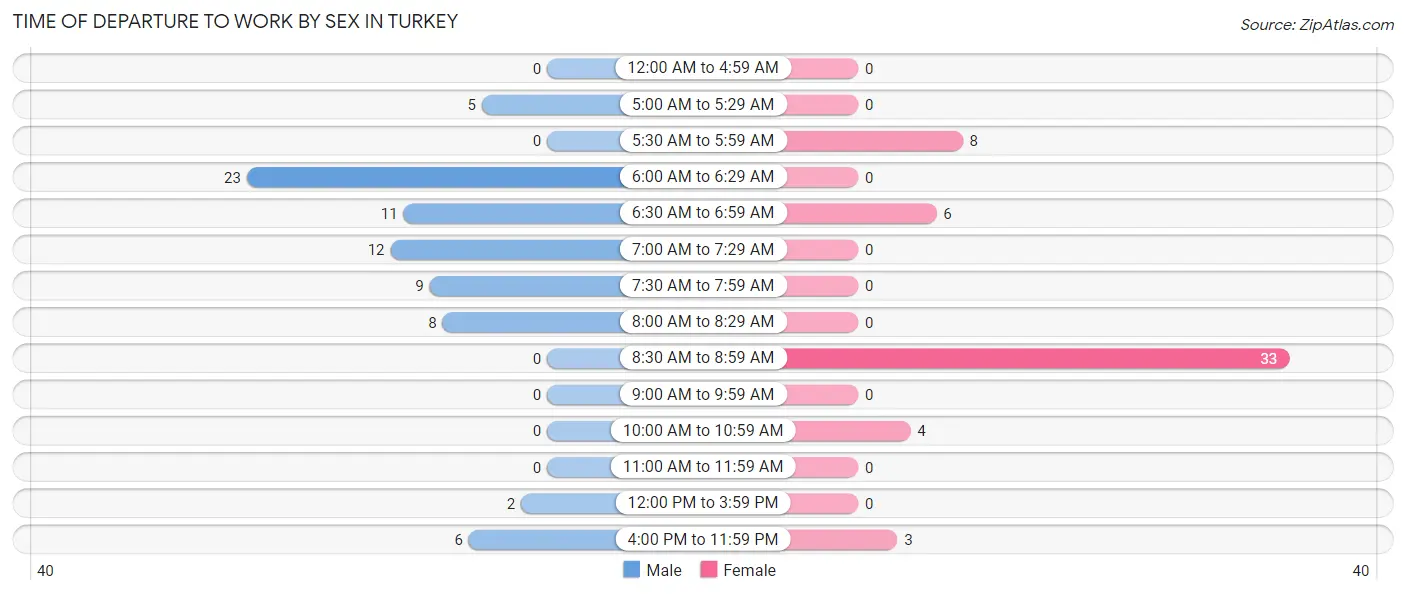
| Time of Departure | Male | Female |
| 12:00 AM to 4:59 AM | 0 (0.0%) | 0 (0.0%) |
| 5:00 AM to 5:29 AM | 5 (6.6%) | 0 (0.0%) |
| 5:30 AM to 5:59 AM | 0 (0.0%) | 8 (14.8%) |
| 6:00 AM to 6:29 AM | 23 (30.3%) | 0 (0.0%) |
| 6:30 AM to 6:59 AM | 11 (14.5%) | 6 (11.1%) |
| 7:00 AM to 7:29 AM | 12 (15.8%) | 0 (0.0%) |
| 7:30 AM to 7:59 AM | 9 (11.8%) | 0 (0.0%) |
| 8:00 AM to 8:29 AM | 8 (10.5%) | 0 (0.0%) |
| 8:30 AM to 8:59 AM | 0 (0.0%) | 33 (61.1%) |
| 9:00 AM to 9:59 AM | 0 (0.0%) | 0 (0.0%) |
| 10:00 AM to 10:59 AM | 0 (0.0%) | 4 (7.4%) |
| 11:00 AM to 11:59 AM | 0 (0.0%) | 0 (0.0%) |
| 12:00 PM to 3:59 PM | 2 (2.6%) | 0 (0.0%) |
| 4:00 PM to 11:59 PM | 6 (7.9%) | 3 (5.6%) |
| Total | 76 (100.0%) | 54 (100.0%) |
Housing Occupancy in Turkey
Occupancy by Ownership in Turkey
Of the total 102 dwellings in Turkey, owner-occupied units account for 71 (69.6%), while renter-occupied units make up 31 (30.4%).
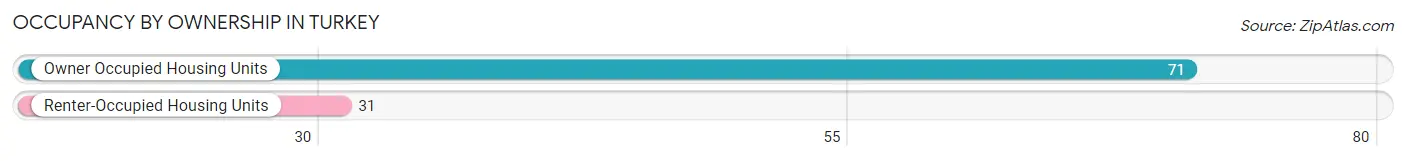
| Occupancy | # Housing Units | % Housing Units |
| Owner Occupied Housing Units | 71 | 69.6% |
| Renter-Occupied Housing Units | 31 | 30.4% |
| Total Occupied Housing Units | 102 | 100.0% |
Occupancy by Household Size in Turkey
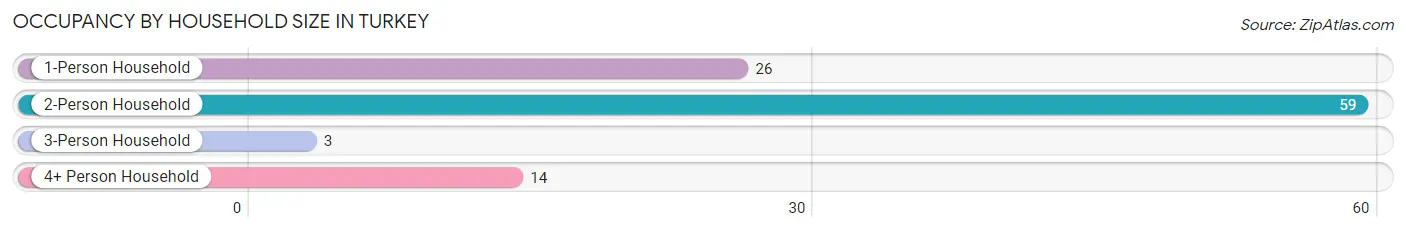
| Household Size | # Housing Units | % Housing Units |
| 1-Person Household | 26 | 25.5% |
| 2-Person Household | 59 | 57.8% |
| 3-Person Household | 3 | 2.9% |
| 4+ Person Household | 14 | 13.7% |
| Total Housing Units | 102 | 100.0% |
Occupancy by Ownership by Household Size in Turkey
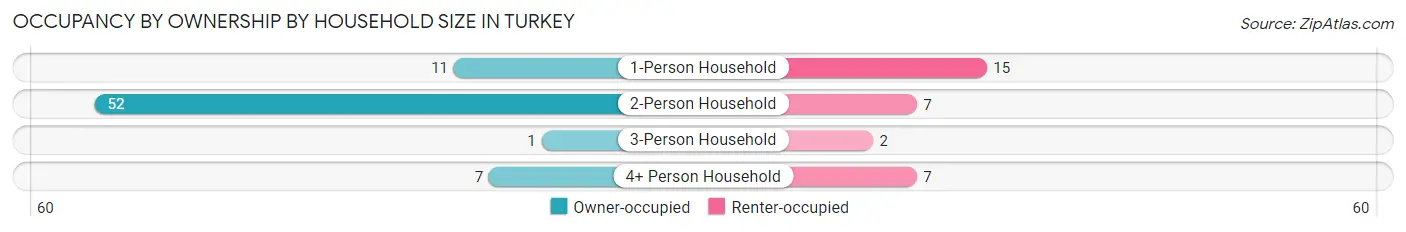
| Household Size | Owner-occupied | Renter-occupied |
| 1-Person Household | 11 (42.3%) | 15 (57.7%) |
| 2-Person Household | 52 (88.1%) | 7 (11.9%) |
| 3-Person Household | 1 (33.3%) | 2 (66.7%) |
| 4+ Person Household | 7 (50.0%) | 7 (50.0%) |
| Total Housing Units | 71 (69.6%) | 31 (30.4%) |
Occupancy by Educational Attainment in Turkey
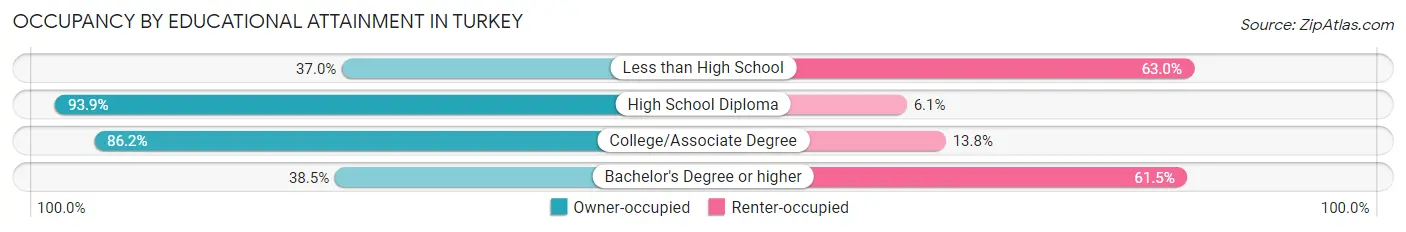
| Household Size | Owner-occupied | Renter-occupied |
| Less than High School | 10 (37.0%) | 17 (63.0%) |
| High School Diploma | 31 (93.9%) | 2 (6.1%) |
| College/Associate Degree | 25 (86.2%) | 4 (13.8%) |
| Bachelor's Degree or higher | 5 (38.5%) | 8 (61.5%) |
Occupancy by Age of Householder in Turkey
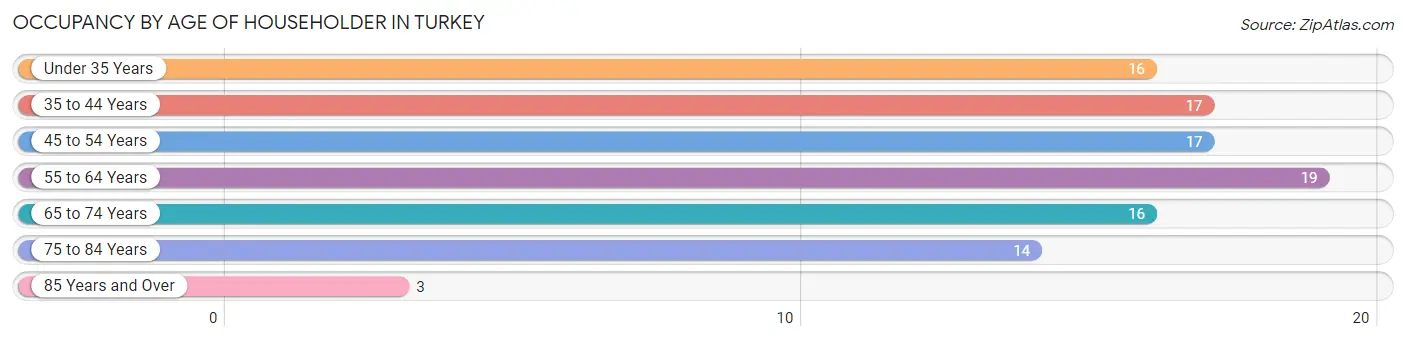
| Age Bracket | # Households | % Households |
| Under 35 Years | 16 | 15.7% |
| 35 to 44 Years | 17 | 16.7% |
| 45 to 54 Years | 17 | 16.7% |
| 55 to 64 Years | 19 | 18.6% |
| 65 to 74 Years | 16 | 15.7% |
| 75 to 84 Years | 14 | 13.7% |
| 85 Years and Over | 3 | 2.9% |
| Total | 102 | 100.0% |
Housing Finances in Turkey
Median Income by Occupancy in Turkey
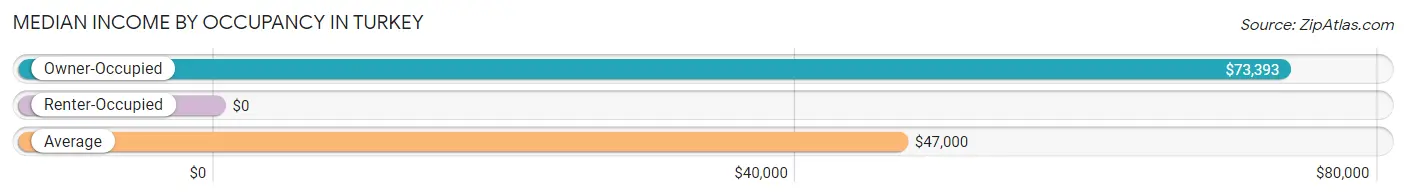
| Occupancy Type | # Households | Median Income |
| Owner-Occupied | 71 (69.6%) | $73,393 |
| Renter-Occupied | 31 (30.4%) | $0 |
| Average | 102 (100.0%) | $47,000 |
Occupancy by Householder Income Bracket in Turkey
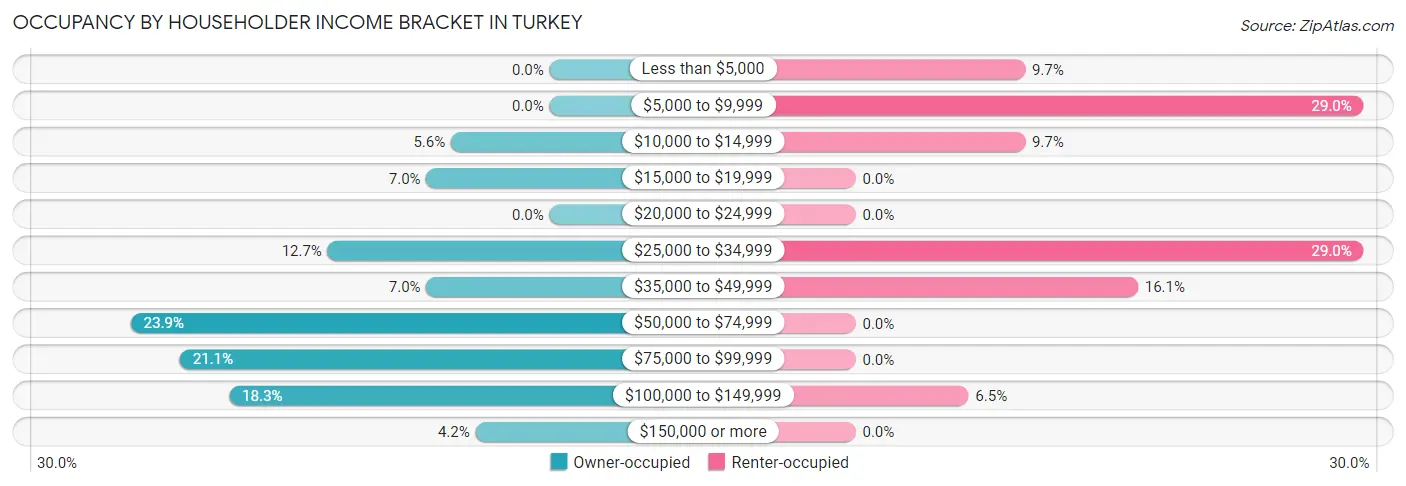
| Income Bracket | Owner-occupied | Renter-occupied |
| Less than $5,000 | 0 (0.0%) | 3 (9.7%) |
| $5,000 to $9,999 | 0 (0.0%) | 9 (29.0%) |
| $10,000 to $14,999 | 4 (5.6%) | 3 (9.7%) |
| $15,000 to $19,999 | 5 (7.0%) | 0 (0.0%) |
| $20,000 to $24,999 | 0 (0.0%) | 0 (0.0%) |
| $25,000 to $34,999 | 9 (12.7%) | 9 (29.0%) |
| $35,000 to $49,999 | 5 (7.0%) | 5 (16.1%) |
| $50,000 to $74,999 | 17 (23.9%) | 0 (0.0%) |
| $75,000 to $99,999 | 15 (21.1%) | 0 (0.0%) |
| $100,000 to $149,999 | 13 (18.3%) | 2 (6.5%) |
| $150,000 or more | 3 (4.2%) | 0 (0.0%) |
| Total | 71 (100.0%) | 31 (100.0%) |
Monthly Housing Cost Tiers in Turkey
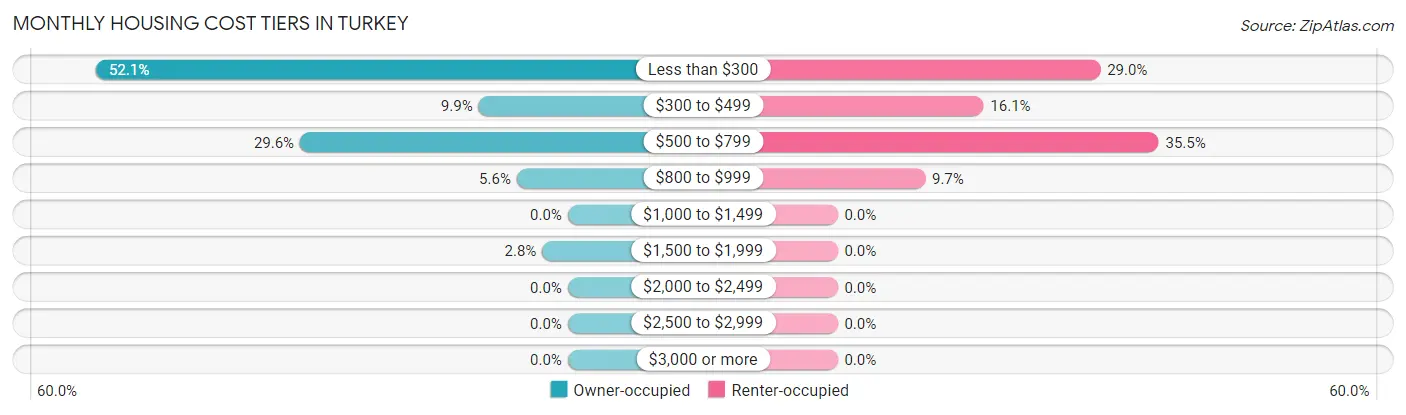
| Monthly Cost | Owner-occupied | Renter-occupied |
| Less than $300 | 37 (52.1%) | 9 (29.0%) |
| $300 to $499 | 7 (9.9%) | 5 (16.1%) |
| $500 to $799 | 21 (29.6%) | 11 (35.5%) |
| $800 to $999 | 4 (5.6%) | 3 (9.7%) |
| $1,000 to $1,499 | 0 (0.0%) | 0 (0.0%) |
| $1,500 to $1,999 | 2 (2.8%) | 0 (0.0%) |
| $2,000 to $2,499 | 0 (0.0%) | 0 (0.0%) |
| $2,500 to $2,999 | 0 (0.0%) | 0 (0.0%) |
| $3,000 or more | 0 (0.0%) | 0 (0.0%) |
| Total | 71 (100.0%) | 31 (100.0%) |
Physical Housing Characteristics in Turkey
Housing Structures in Turkey
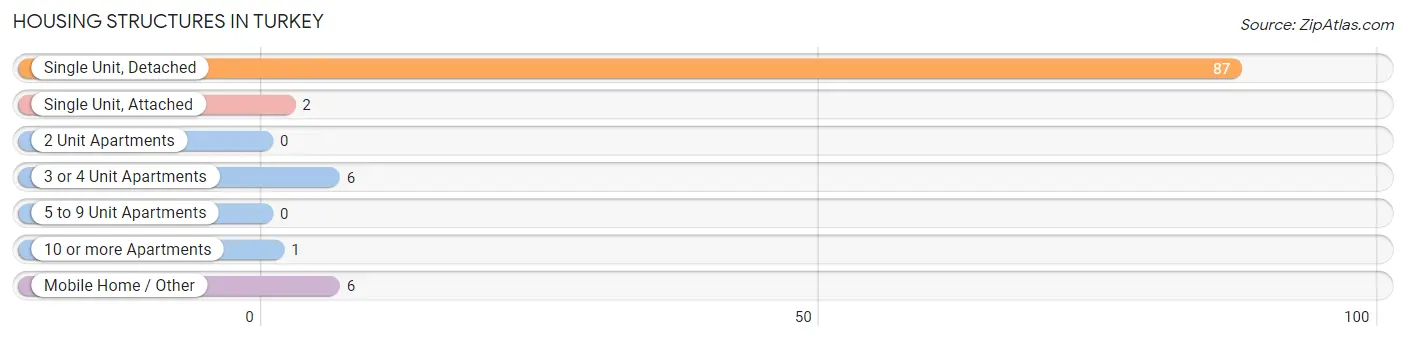
| Structure Type | # Housing Units | % Housing Units |
| Single Unit, Detached | 87 | 85.3% |
| Single Unit, Attached | 2 | 2.0% |
| 2 Unit Apartments | 0 | 0.0% |
| 3 or 4 Unit Apartments | 6 | 5.9% |
| 5 to 9 Unit Apartments | 0 | 0.0% |
| 10 or more Apartments | 1 | 1.0% |
| Mobile Home / Other | 6 | 5.9% |
| Total | 102 | 100.0% |
Housing Structures by Occupancy in Turkey
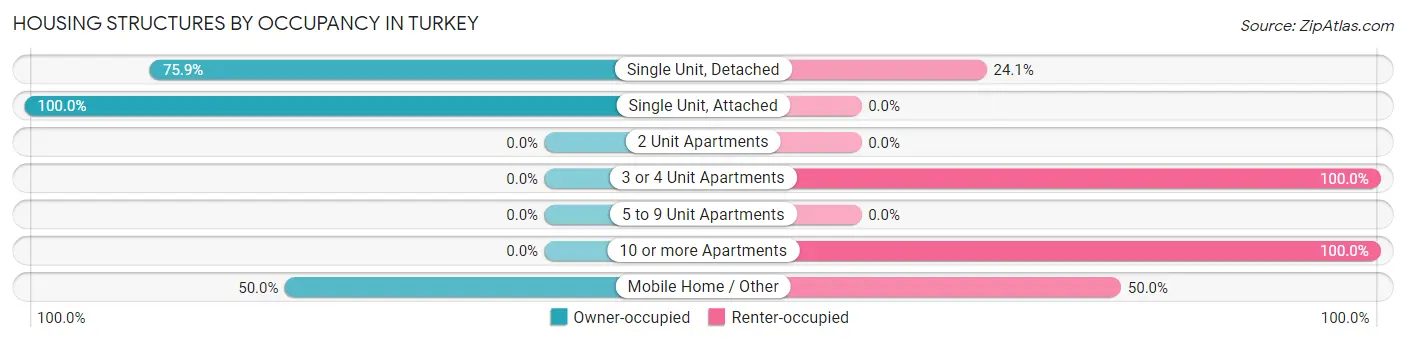
| Structure Type | Owner-occupied | Renter-occupied |
| Single Unit, Detached | 66 (75.9%) | 21 (24.1%) |
| Single Unit, Attached | 2 (100.0%) | 0 (0.0%) |
| 2 Unit Apartments | 0 (0.0%) | 0 (0.0%) |
| 3 or 4 Unit Apartments | 0 (0.0%) | 6 (100.0%) |
| 5 to 9 Unit Apartments | 0 (0.0%) | 0 (0.0%) |
| 10 or more Apartments | 0 (0.0%) | 1 (100.0%) |
| Mobile Home / Other | 3 (50.0%) | 3 (50.0%) |
| Total | 71 (69.6%) | 31 (30.4%) |
Housing Structures by Number of Rooms in Turkey
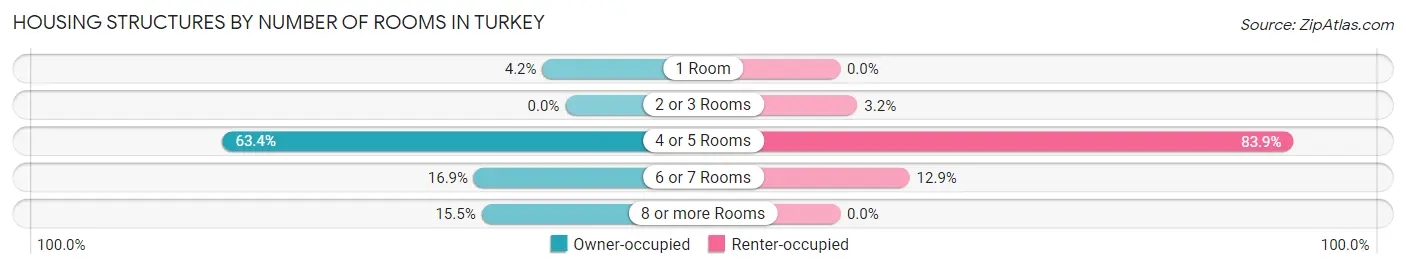
| Number of Rooms | Owner-occupied | Renter-occupied |
| 1 Room | 3 (4.2%) | 0 (0.0%) |
| 2 or 3 Rooms | 0 (0.0%) | 1 (3.2%) |
| 4 or 5 Rooms | 45 (63.4%) | 26 (83.9%) |
| 6 or 7 Rooms | 12 (16.9%) | 4 (12.9%) |
| 8 or more Rooms | 11 (15.5%) | 0 (0.0%) |
| Total | 71 (100.0%) | 31 (100.0%) |
Housing Structure by Heating Type in Turkey
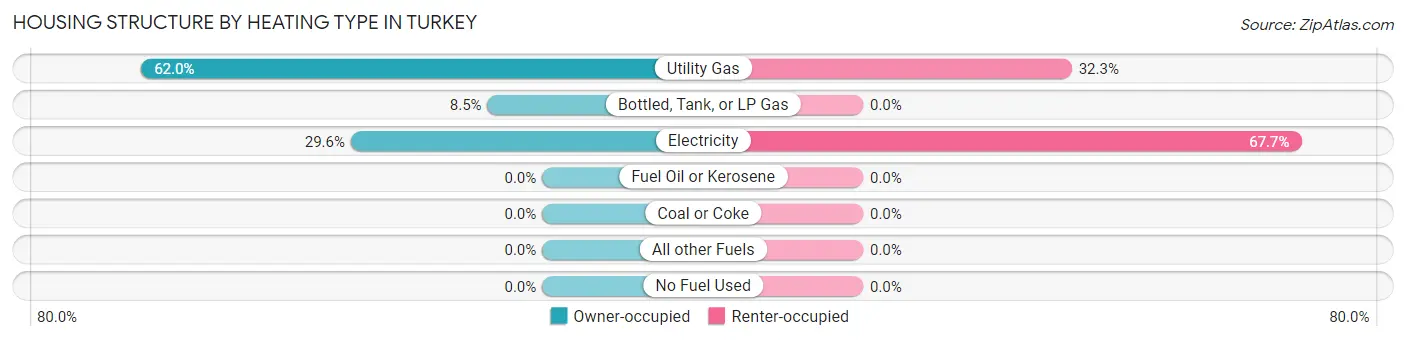
| Heating Type | Owner-occupied | Renter-occupied |
| Utility Gas | 44 (62.0%) | 10 (32.3%) |
| Bottled, Tank, or LP Gas | 6 (8.5%) | 0 (0.0%) |
| Electricity | 21 (29.6%) | 21 (67.7%) |
| Fuel Oil or Kerosene | 0 (0.0%) | 0 (0.0%) |
| Coal or Coke | 0 (0.0%) | 0 (0.0%) |
| All other Fuels | 0 (0.0%) | 0 (0.0%) |
| No Fuel Used | 0 (0.0%) | 0 (0.0%) |
| Total | 71 (100.0%) | 31 (100.0%) |
Household Vehicle Usage in Turkey
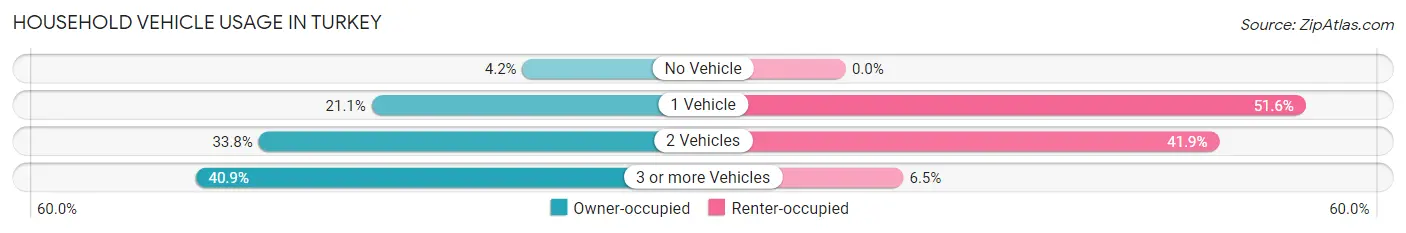
| Vehicles per Household | Owner-occupied | Renter-occupied |
| No Vehicle | 3 (4.2%) | 0 (0.0%) |
| 1 Vehicle | 15 (21.1%) | 16 (51.6%) |
| 2 Vehicles | 24 (33.8%) | 13 (41.9%) |
| 3 or more Vehicles | 29 (40.8%) | 2 (6.5%) |
| Total | 71 (100.0%) | 31 (100.0%) |
Real Estate & Mortgages in Turkey
Real Estate and Mortgage Overview in Turkey
| Characteristic | Without Mortgage | With Mortgage |
| Housing Units | 66 | 5 |
| Median Property Value | $40,000 | $0 |
| Median Household Income | $73,929 | $0 |
| Monthly Housing Costs | $275 | $0 |
| Real Estate Taxes | $433 | $0 |
Property Value by Mortgage Status in Turkey
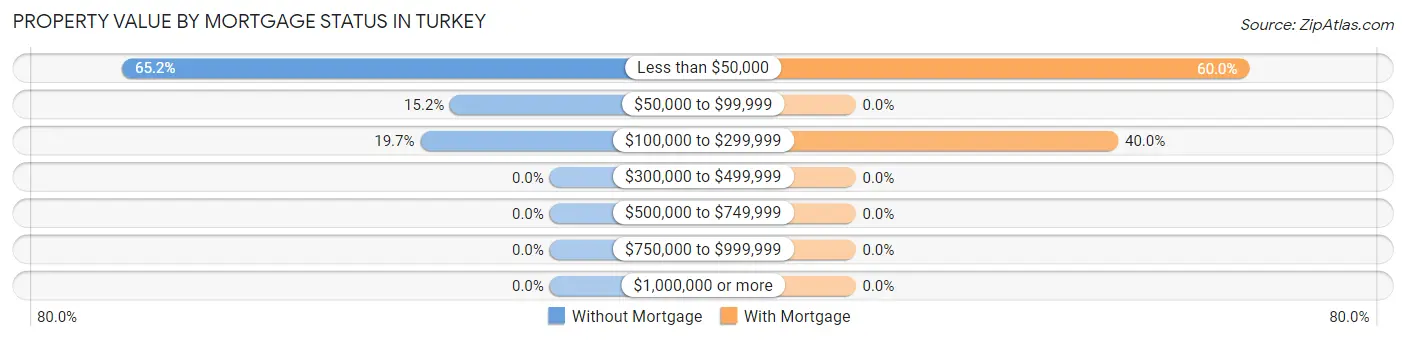
| Property Value | Without Mortgage | With Mortgage |
| Less than $50,000 | 43 (65.1%) | 3 (60.0%) |
| $50,000 to $99,999 | 10 (15.1%) | 0 (0.0%) |
| $100,000 to $299,999 | 13 (19.7%) | 2 (40.0%) |
| $300,000 to $499,999 | 0 (0.0%) | 0 (0.0%) |
| $500,000 to $749,999 | 0 (0.0%) | 0 (0.0%) |
| $750,000 to $999,999 | 0 (0.0%) | 0 (0.0%) |
| $1,000,000 or more | 0 (0.0%) | 0 (0.0%) |
| Total | 66 (100.0%) | 5 (100.0%) |
Household Income by Mortgage Status in Turkey
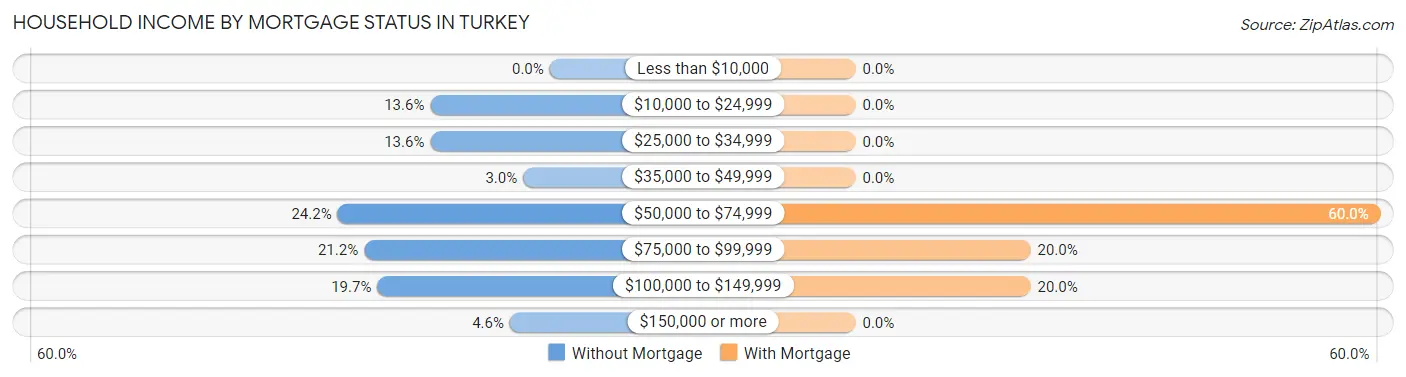
| Household Income | Without Mortgage | With Mortgage |
| Less than $10,000 | 0 (0.0%) | 0 (0.0%) |
| $10,000 to $24,999 | 9 (13.6%) | 0 (0.0%) |
| $25,000 to $34,999 | 9 (13.6%) | 0 (0.0%) |
| $35,000 to $49,999 | 2 (3.0%) | 0 (0.0%) |
| $50,000 to $74,999 | 16 (24.2%) | 3 (60.0%) |
| $75,000 to $99,999 | 14 (21.2%) | 1 (20.0%) |
| $100,000 to $149,999 | 13 (19.7%) | 1 (20.0%) |
| $150,000 or more | 3 (4.5%) | 0 (0.0%) |
| Total | 66 (100.0%) | 5 (100.0%) |
Property Value to Household Income Ratio in Turkey
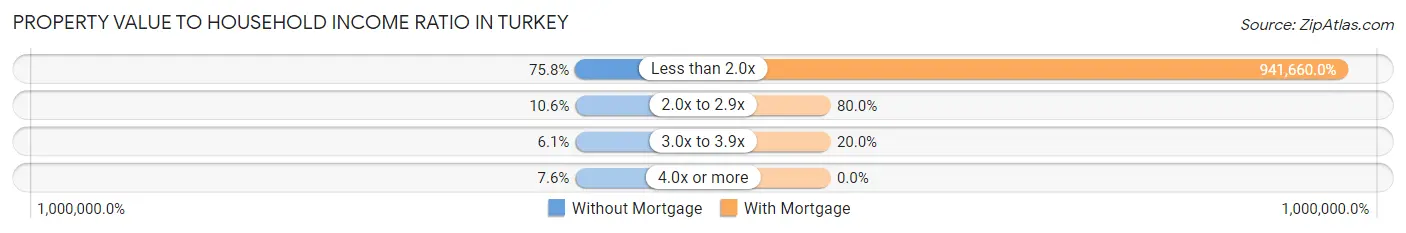
| Value-to-Income Ratio | Without Mortgage | With Mortgage |
| Less than 2.0x | 50 (75.8%) | 47,083 (941,660.0%) |
| 2.0x to 2.9x | 7 (10.6%) | 4 (80.0%) |
| 3.0x to 3.9x | 4 (6.1%) | 1 (20.0%) |
| 4.0x or more | 5 (7.6%) | 0 (0.0%) |
| Total | 66 (100.0%) | 5 (100.0%) |
Real Estate Taxes by Mortgage Status in Turkey
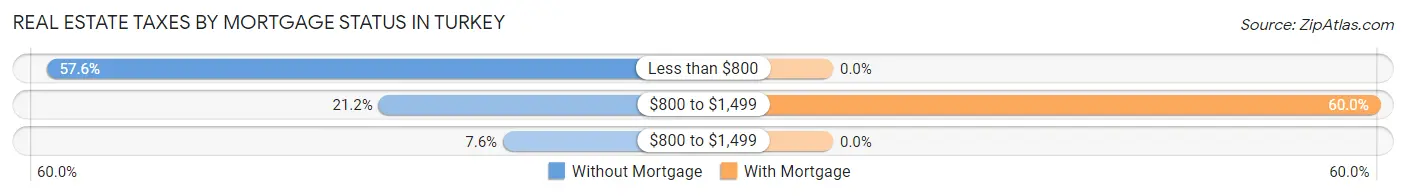
| Property Taxes | Without Mortgage | With Mortgage |
| Less than $800 | 38 (57.6%) | 0 (0.0%) |
| $800 to $1,499 | 14 (21.2%) | 3 (60.0%) |
| $800 to $1,499 | 5 (7.6%) | 0 (0.0%) |
| Total | 66 (100.0%) | 5 (100.0%) |
Health & Disability in Turkey
Health Insurance Coverage by Age in Turkey
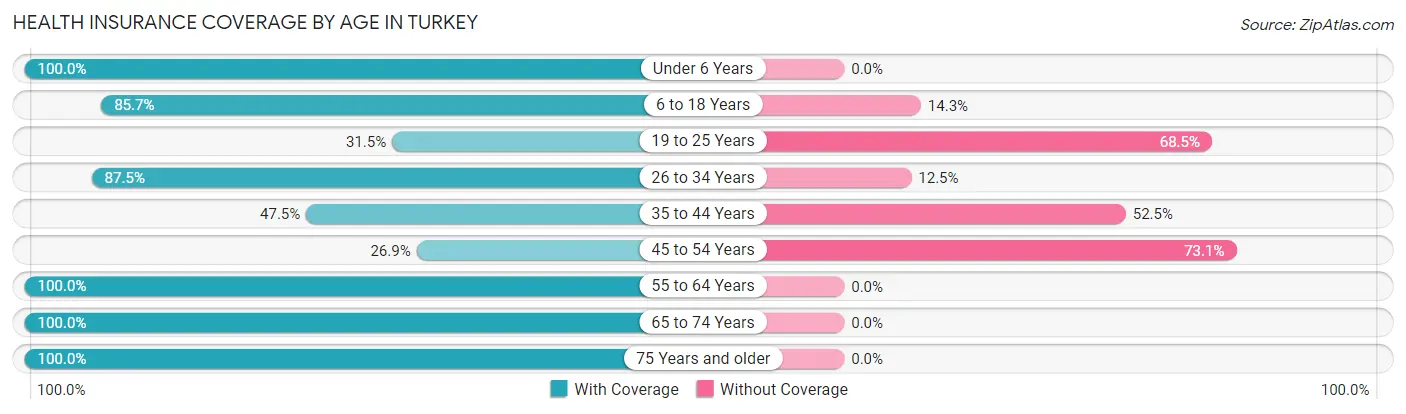
| Age Bracket | With Coverage | Without Coverage |
| Under 6 Years | 19 (100.0%) | 0 (0.0%) |
| 6 to 18 Years | 18 (85.7%) | 3 (14.3%) |
| 19 to 25 Years | 17 (31.5%) | 37 (68.5%) |
| 26 to 34 Years | 35 (87.5%) | 5 (12.5%) |
| 35 to 44 Years | 19 (47.5%) | 21 (52.5%) |
| 45 to 54 Years | 7 (26.9%) | 19 (73.1%) |
| 55 to 64 Years | 43 (100.0%) | 0 (0.0%) |
| 65 to 74 Years | 28 (100.0%) | 0 (0.0%) |
| 75 Years and older | 21 (100.0%) | 0 (0.0%) |
| Total | 207 (70.9%) | 85 (29.1%) |
Health Insurance Coverage by Citizenship Status in Turkey
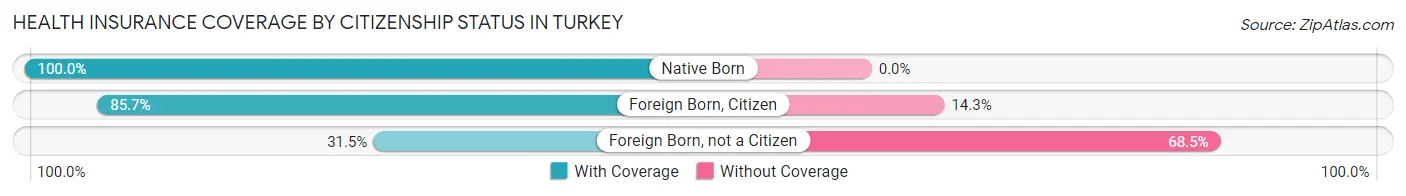
| Citizenship Status | With Coverage | Without Coverage |
| Native Born | 19 (100.0%) | 0 (0.0%) |
| Foreign Born, Citizen | 18 (85.7%) | 3 (14.3%) |
| Foreign Born, not a Citizen | 17 (31.5%) | 37 (68.5%) |
Health Insurance Coverage by Household Income in Turkey
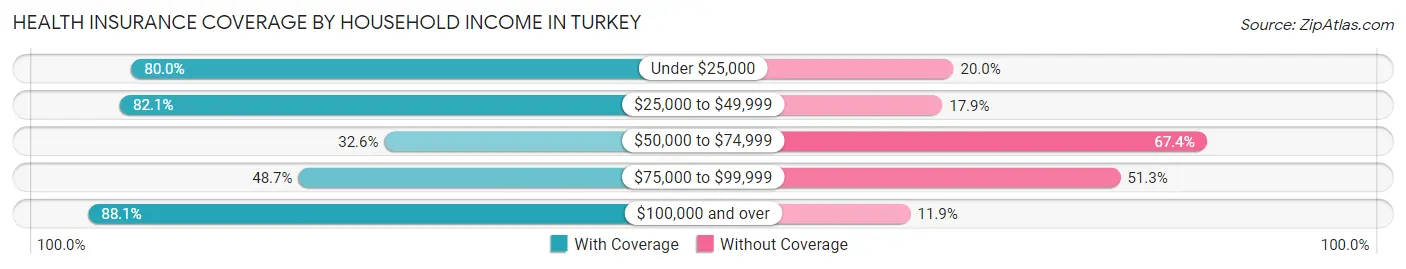
| Household Income | With Coverage | Without Coverage |
| Under $25,000 | 36 (80.0%) | 9 (20.0%) |
| $25,000 to $49,999 | 78 (82.1%) | 17 (17.9%) |
| $50,000 to $74,999 | 15 (32.6%) | 31 (67.4%) |
| $75,000 to $99,999 | 19 (48.7%) | 20 (51.3%) |
| $100,000 and over | 59 (88.1%) | 8 (11.9%) |
Public vs Private Health Insurance Coverage by Age in Turkey
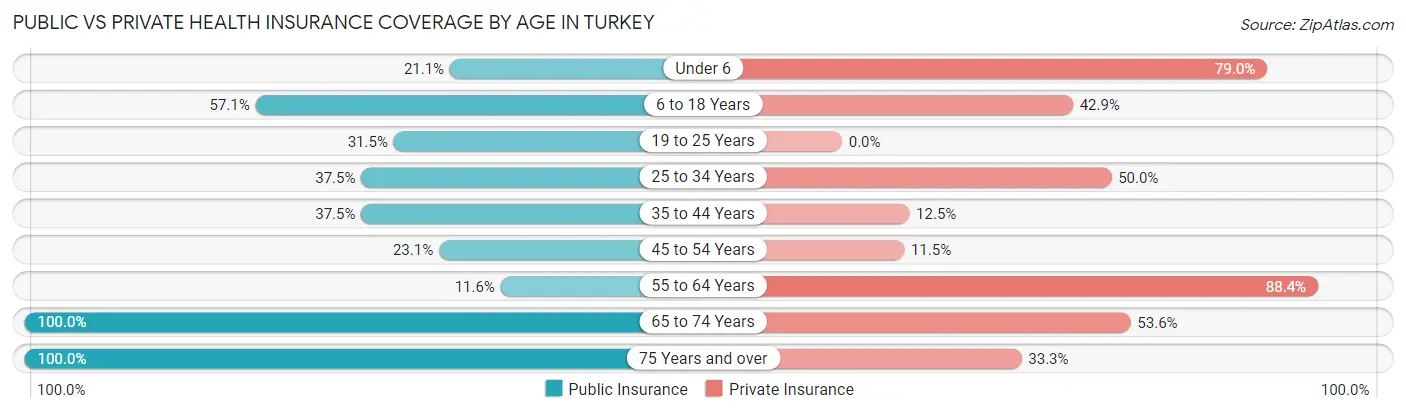
| Age Bracket | Public Insurance | Private Insurance |
| Under 6 | 4 (21.0%) | 15 (78.9%) |
| 6 to 18 Years | 12 (57.1%) | 9 (42.9%) |
| 19 to 25 Years | 17 (31.5%) | 0 (0.0%) |
| 25 to 34 Years | 15 (37.5%) | 20 (50.0%) |
| 35 to 44 Years | 15 (37.5%) | 5 (12.5%) |
| 45 to 54 Years | 6 (23.1%) | 3 (11.5%) |
| 55 to 64 Years | 5 (11.6%) | 38 (88.4%) |
| 65 to 74 Years | 28 (100.0%) | 15 (53.6%) |
| 75 Years and over | 21 (100.0%) | 7 (33.3%) |
| Total | 123 (42.1%) | 112 (38.4%) |
Disability Status by Sex by Age in Turkey
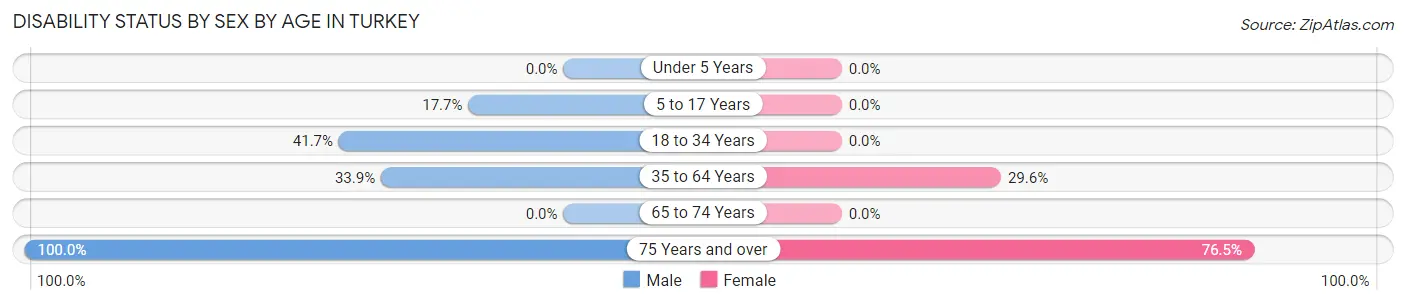
| Age Bracket | Male | Female |
| Under 5 Years | 0 (0.0%) | 0 (0.0%) |
| 5 to 17 Years | 3 (17.6%) | 0 (0.0%) |
| 18 to 34 Years | 15 (41.7%) | 0 (0.0%) |
| 35 to 64 Years | 22 (33.9%) | 13 (29.5%) |
| 65 to 74 Years | 0 (0.0%) | 0 (0.0%) |
| 75 Years and over | 4 (100.0%) | 13 (76.5%) |
Disability Class by Sex by Age in Turkey
Disability Class: Hearing Difficulty
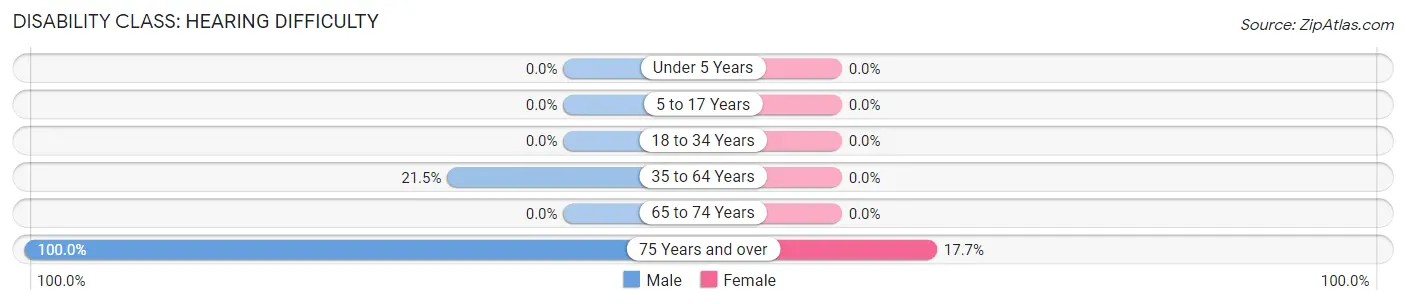
| Age Bracket | Male | Female |
| Under 5 Years | 0 (0.0%) | 0 (0.0%) |
| 5 to 17 Years | 0 (0.0%) | 0 (0.0%) |
| 18 to 34 Years | 0 (0.0%) | 0 (0.0%) |
| 35 to 64 Years | 14 (21.5%) | 0 (0.0%) |
| 65 to 74 Years | 0 (0.0%) | 0 (0.0%) |
| 75 Years and over | 4 (100.0%) | 3 (17.6%) |
Disability Class: Vision Difficulty
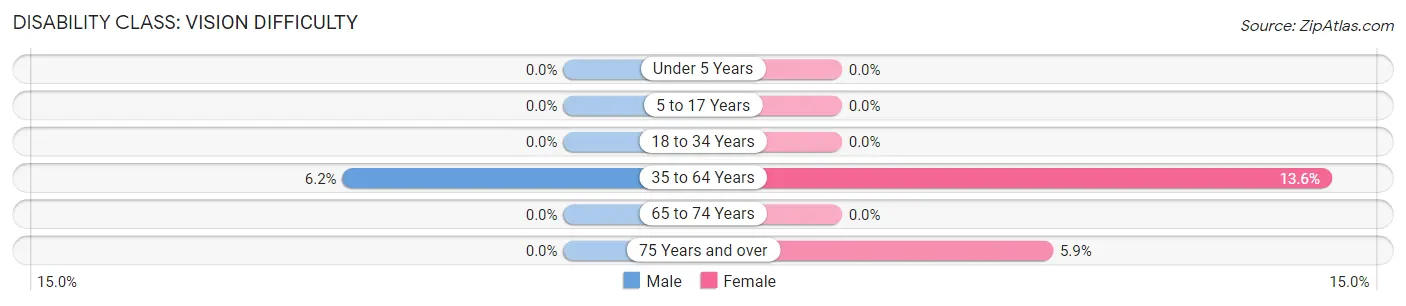
| Age Bracket | Male | Female |
| Under 5 Years | 0 (0.0%) | 0 (0.0%) |
| 5 to 17 Years | 0 (0.0%) | 0 (0.0%) |
| 18 to 34 Years | 0 (0.0%) | 0 (0.0%) |
| 35 to 64 Years | 4 (6.1%) | 6 (13.6%) |
| 65 to 74 Years | 0 (0.0%) | 0 (0.0%) |
| 75 Years and over | 0 (0.0%) | 1 (5.9%) |
Disability Class: Cognitive Difficulty
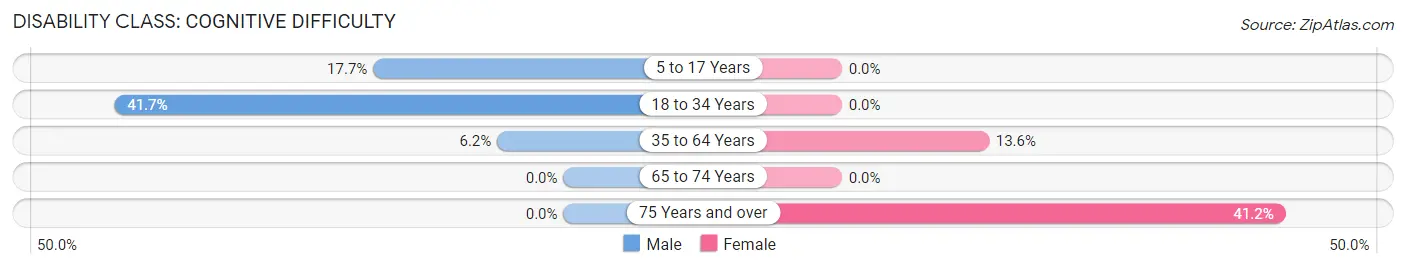
| Age Bracket | Male | Female |
| 5 to 17 Years | 3 (17.6%) | 0 (0.0%) |
| 18 to 34 Years | 15 (41.7%) | 0 (0.0%) |
| 35 to 64 Years | 4 (6.1%) | 6 (13.6%) |
| 65 to 74 Years | 0 (0.0%) | 0 (0.0%) |
| 75 Years and over | 0 (0.0%) | 7 (41.2%) |
Disability Class: Ambulatory Difficulty
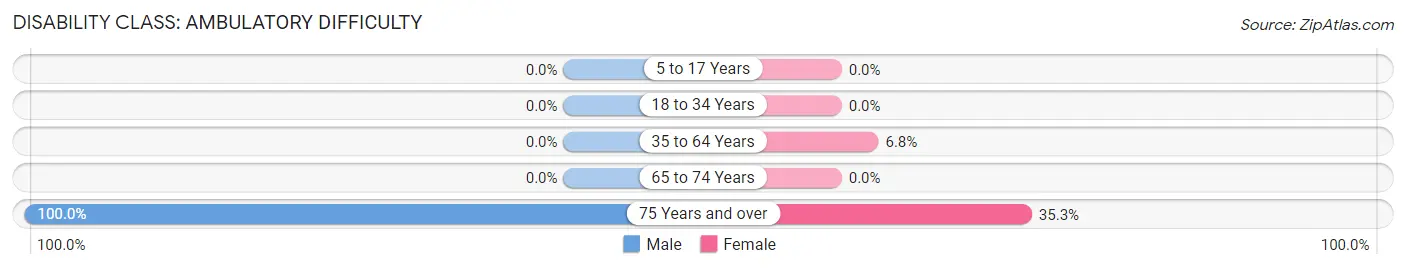
| Age Bracket | Male | Female |
| 5 to 17 Years | 0 (0.0%) | 0 (0.0%) |
| 18 to 34 Years | 0 (0.0%) | 0 (0.0%) |
| 35 to 64 Years | 0 (0.0%) | 3 (6.8%) |
| 65 to 74 Years | 0 (0.0%) | 0 (0.0%) |
| 75 Years and over | 4 (100.0%) | 6 (35.3%) |
Disability Class: Self-Care Difficulty
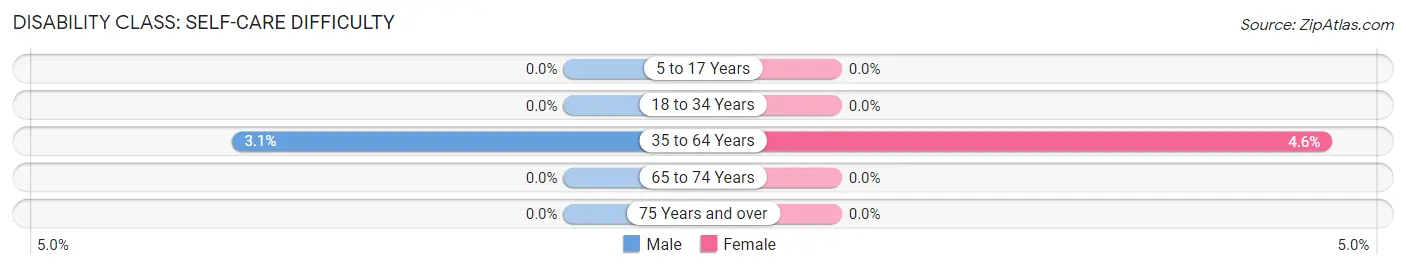
| Age Bracket | Male | Female |
| 5 to 17 Years | 0 (0.0%) | 0 (0.0%) |
| 18 to 34 Years | 0 (0.0%) | 0 (0.0%) |
| 35 to 64 Years | 2 (3.1%) | 2 (4.5%) |
| 65 to 74 Years | 0 (0.0%) | 0 (0.0%) |
| 75 Years and over | 0 (0.0%) | 0 (0.0%) |
Technology Access in Turkey
Computing Device Access in Turkey
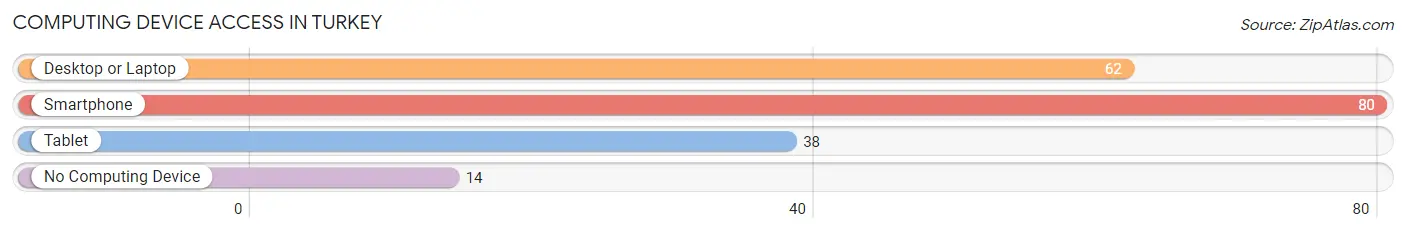
| Device Type | # Households | % Households |
| Desktop or Laptop | 62 | 60.8% |
| Smartphone | 80 | 78.4% |
| Tablet | 38 | 37.2% |
| No Computing Device | 14 | 13.7% |
| Total | 102 | 100.0% |
Internet Access in Turkey
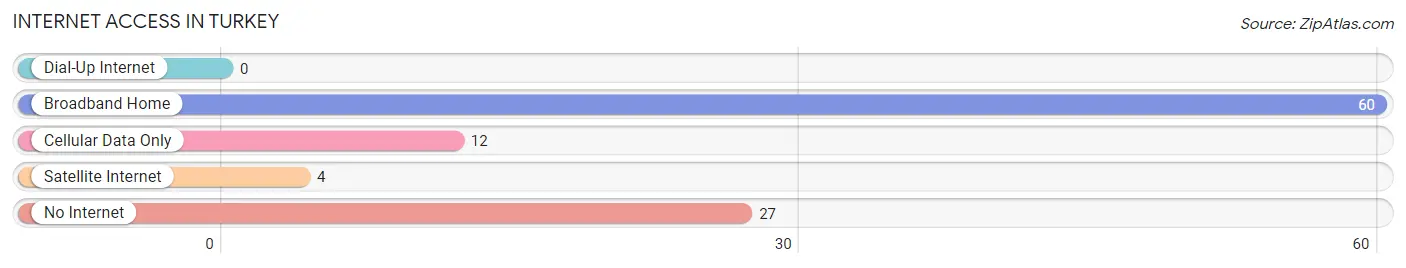
| Internet Type | # Households | % Households |
| Dial-Up Internet | 0 | 0.0% |
| Broadband Home | 60 | 58.8% |
| Cellular Data Only | 12 | 11.8% |
| Satellite Internet | 4 | 3.9% |
| No Internet | 27 | 26.5% |
| Total | 102 | 100.0% |
Turkey Summary
Turkey, Texas is a small town located in the northern part of the state, in the panhandle region. It is situated in the county of Hall, and is part of the Wichita Falls Metropolitan Statistical Area. The town has a population of 1,845 people, according to the 2010 census.
History
The town of Turkey was founded in 1891 by a group of settlers from the nearby town of Estelline. The settlers named the town after the wild turkeys that were abundant in the area. The town was incorporated in 1909, and the first mayor was elected in 1910.
The town grew slowly, but steadily, and by the 1920s, it had become a thriving agricultural center. Cotton, wheat, and corn were the main crops grown in the area. The town also had a number of businesses, including a bank, a hotel, a general store, and a movie theater.
In the 1940s, the town began to experience a decline in population as many of the young people left to join the military or to find work in larger cities. The population continued to decline until the 1970s, when the town began to experience a resurgence.
Geography
Turkey is located in the northern part of the state, in the panhandle region. It is situated in the county of Hall, and is part of the Wichita Falls Metropolitan Statistical Area. The town is located at the intersection of U.S. Highway 82 and State Highway 86.
The town is situated on the edge of the High Plains, and is surrounded by rolling hills and grasslands. The climate is semi-arid, with hot summers and mild winters. The average annual temperature is around 65 degrees Fahrenheit.
Economy
The economy of Turkey is largely based on agriculture. Cotton, wheat, and corn are the main crops grown in the area. The town also has a number of businesses, including a bank, a hotel, a general store, and a movie theater.
The town is also home to a number of manufacturing companies, including a furniture factory, a plastics factory, and a metal fabrication plant. The town also has a number of small businesses, including restaurants, shops, and service providers.
Demographics
According to the 2010 census, the population of Turkey was 1,845 people. The population is predominantly white, with a small Hispanic minority. The median household income is $31,250, and the median age is 37.
The town has a low unemployment rate, and the majority of the population is employed in the agricultural and manufacturing sectors. The town also has a number of small businesses, including restaurants, shops, and service providers.
Conclusion
Turkey, Texas is a small town located in the northern part of the state, in the panhandle region. It is situated in the county of Hall, and is part of the Wichita Falls Metropolitan Statistical Area. The town has a population of 1,845 people, according to the 2010 census. The economy of Turkey is largely based on agriculture, with cotton, wheat, and corn being the main crops grown in the area. The town also has a number of businesses, including a bank, a hotel, a general store, and a movie theater. The population is predominantly white, with a small Hispanic minority. The median household income is $31,250, and the median age is 37. The town has a low unemployment rate, and the majority of the population is employed in the agricultural and manufacturing sectors.
Common Questions
What is the Total Population of Turkey?
Total Population of Turkey is 292.
What is the Total Male Population of Turkey?
Total Male Population of Turkey is 139.
What is the Total Female Population of Turkey?
Total Female Population of Turkey is 153.
What is the Ratio of Males per 100 Females in Turkey?
There are 90.85 Males per 100 Females in Turkey.
What is the Ratio of Females per 100 Males in Turkey?
There are 110.07 Females per 100 Males in Turkey.
What is the Median Population Age in Turkey?
Median Population Age in Turkey is 36.2 Years.
What is the Average Family Size in Turkey
Average Family Size in Turkey is 3.5 People.
What is the Average Household Size in Turkey
Average Household Size in Turkey is 2.9 People.
What is Per Capita Income in Turkey?
Per Capita income in Turkey is $30,911.
What is the Median Family Income in Turkey?
Median Family Income in Turkey is $73,214.
What is the Median Household income in Turkey?
Median Household Income in Turkey is $47,000.
What is Inequality or Gini Index in Turkey?
Inequality or Gini Index in Turkey is 0.56.
How Large is the Labor Force in Turkey?
There are 137 People in the Labor Forcein in Turkey.
What is the Percentage of People in the Labor Force in Turkey?
53.1% of People are in the Labor Force in Turkey.
What is the Unemployment Rate in Turkey?
Unemployment Rate in Turkey is 3.6%.