Berryville, TX
Berryville Map
Berryville Overview
1,169
TOTAL POPULATION
532
MALE POPULATION
637
FEMALE POPULATION
83.52
MALES / 100 FEMALES
119.74
FEMALES / 100 MALES
40.7
MEDIAN AGE
2.8
AVG FAMILY SIZE
2.5
AVG HOUSEHOLD SIZE
$23,367
PER CAPITA INCOME
$77,375
AVG FAMILY INCOME
$50,938
AVG HOUSEHOLD INCOME
23.3%
WAGE / INCOME GAP [ % ]
76.7¢/ $1
WAGE / INCOME GAP [ $ ]
0.35
INEQUALITY / GINI INDEX
399
LABOR FORCE [ PEOPLE ]
43.3%
PERCENT IN LABOR FORCE
5.3%
UNEMPLOYMENT RATE
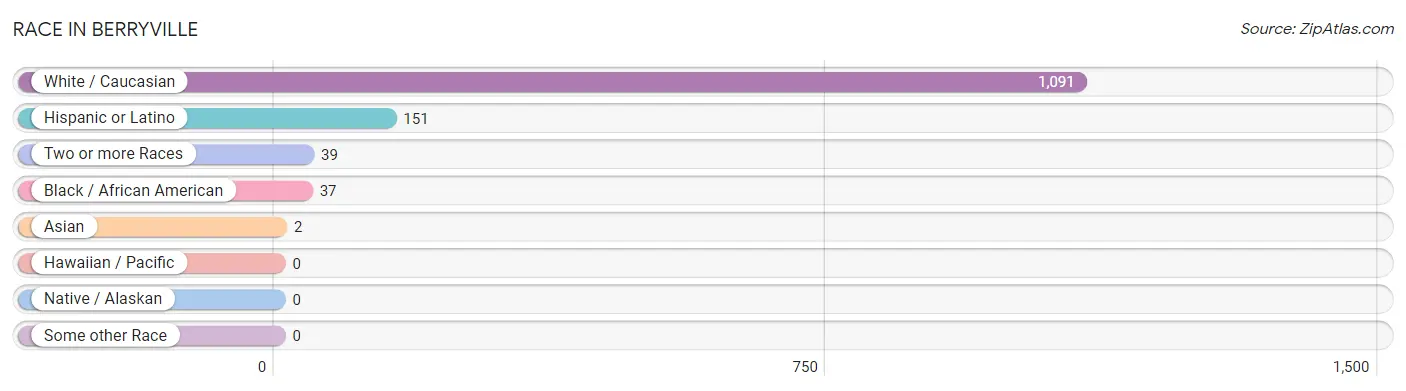
Race in Berryville
The most populous races in Berryville are White / Caucasian (1,091 | 93.3%), Hispanic or Latino (151 | 12.9%), and Two or more Races (39 | 3.3%).
| Race | # Population | % Population |
| Asian | 2 | 0.2% |
| Black / African American | 37 | 3.2% |
| Hawaiian / Pacific | 0 | 0.0% |
| Hispanic or Latino | 151 | 12.9% |
| Native / Alaskan | 0 | 0.0% |
| White / Caucasian | 1,091 | 93.3% |
| Two or more Races | 39 | 3.3% |
| Some other Race | 0 | 0.0% |
| Total | 1,169 | 100.0% |
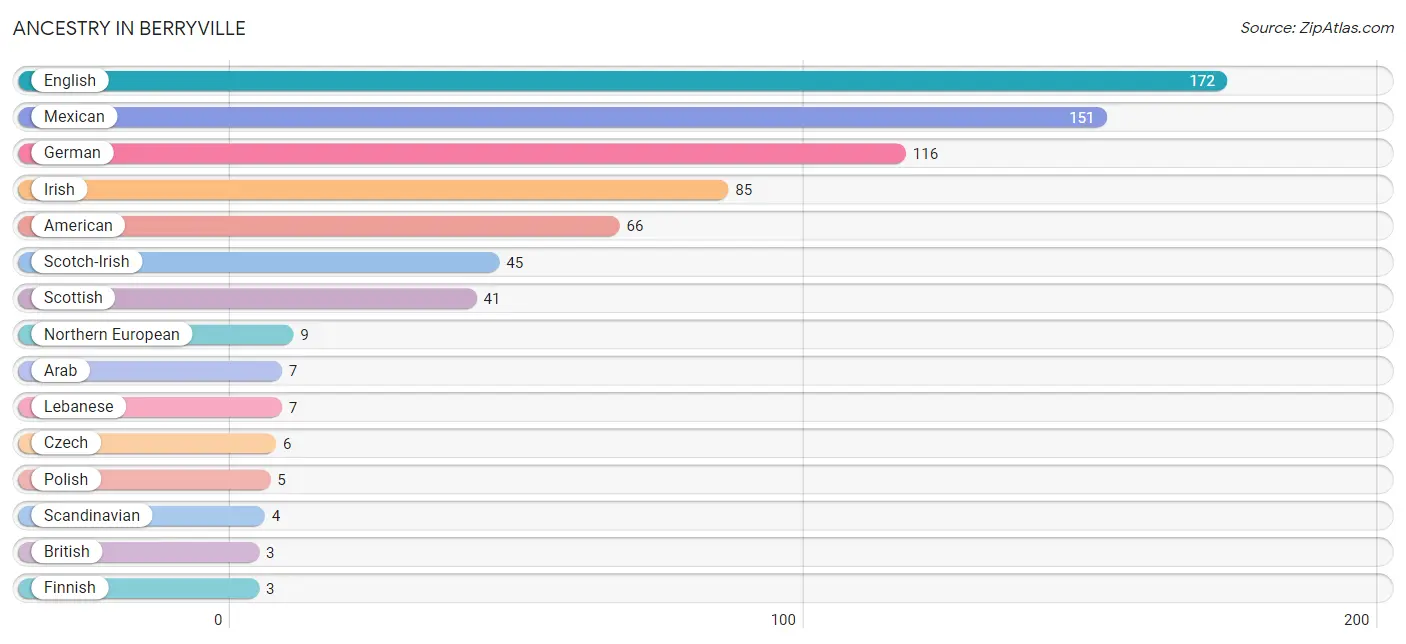
Ancestry in Berryville
The most populous ancestries reported in Berryville are English (172 | 14.7%), Mexican (151 | 12.9%), German (116 | 9.9%), Irish (85 | 7.3%), and American (66 | 5.7%), together accounting for 50.5% of all Berryville residents.
| Ancestry | # Population | % Population |
| American | 66 | 5.7% |
| Arab | 7 | 0.6% |
| British | 3 | 0.3% |
| Czech | 6 | 0.5% |
| English | 172 | 14.7% |
| Finnish | 3 | 0.3% |
| German | 116 | 9.9% |
| Greek | 3 | 0.3% |
| Indian (Asian) | 2 | 0.2% |
| Irish | 85 | 7.3% |
| Lebanese | 7 | 0.6% |
| Mexican | 151 | 12.9% |
| Northern European | 9 | 0.8% |
| Polish | 5 | 0.4% |
| Scandinavian | 4 | 0.3% |
| Scotch-Irish | 45 | 3.8% |
| Scottish | 41 | 3.5% |
| Swedish | 2 | 0.2% |
| Welsh | 3 | 0.3% | View All 19 Rows |
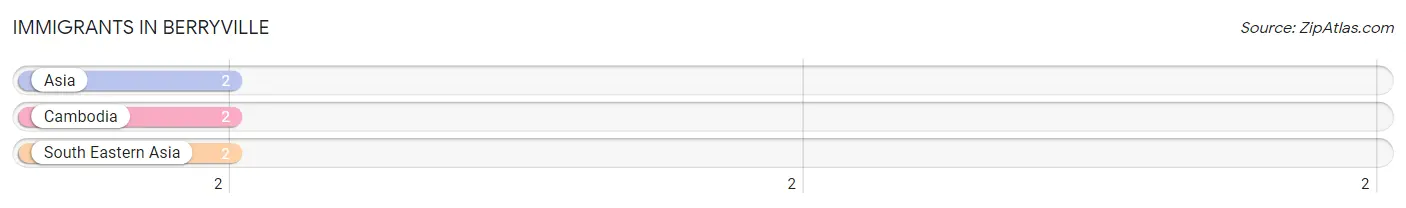
Immigrants in Berryville
The most numerous immigrant groups reported in Berryville came from Asia (2 | 0.2%), Cambodia (2 | 0.2%), and South Eastern Asia (2 | 0.2%), together accounting for 0.5% of all Berryville residents.
| Immigration Origin | # Population | % Population |
| Asia | 2 | 0.2% |
| Cambodia | 2 | 0.2% |
| South Eastern Asia | 2 | 0.2% | View All 3 Rows |
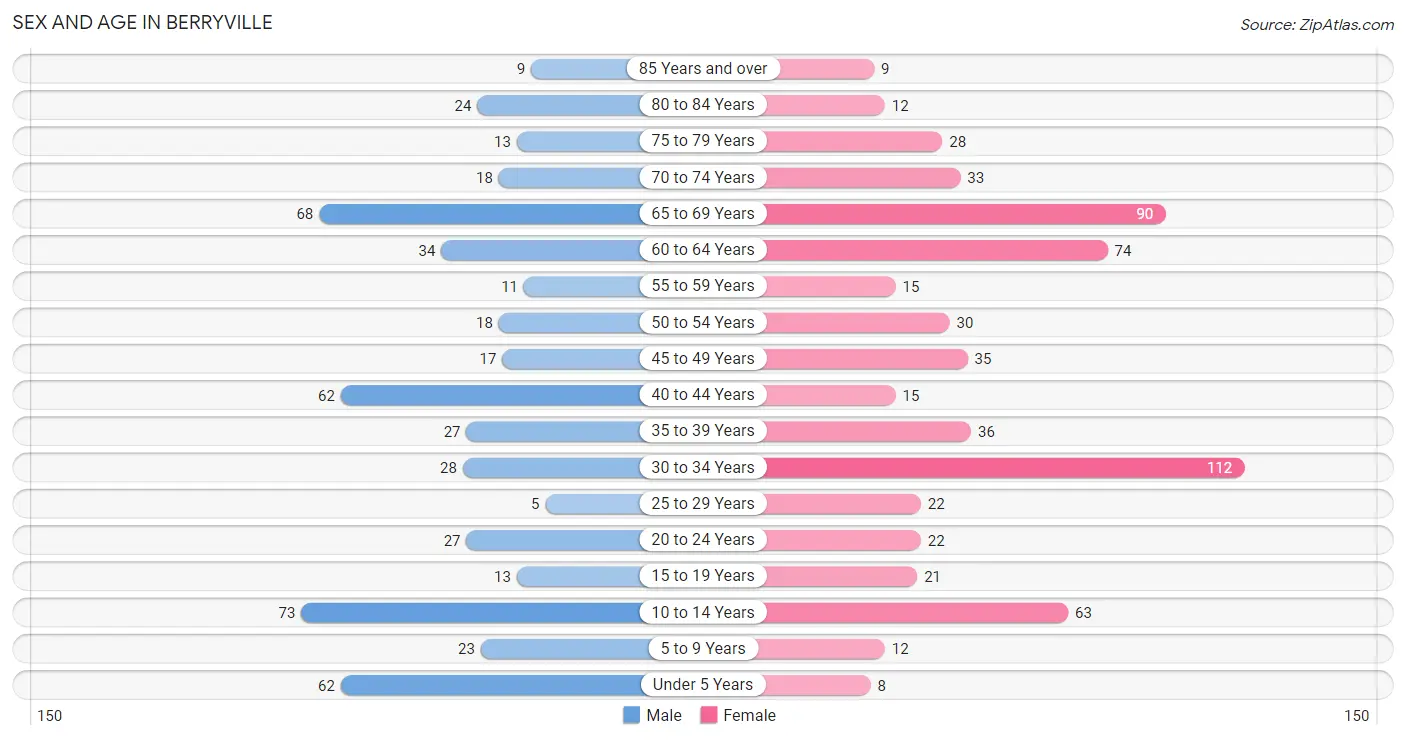
Sex and Age in Berryville
Sex and Age in Berryville
The most populous age groups in Berryville are 10 to 14 Years (73 | 13.7%) for men and 30 to 34 Years (112 | 17.6%) for women.
| Age Bracket | Male | Female |
| Under 5 Years | 62 (11.7%) | 8 (1.3%) |
| 5 to 9 Years | 23 (4.3%) | 12 (1.9%) |
| 10 to 14 Years | 73 (13.7%) | 63 (9.9%) |
| 15 to 19 Years | 13 (2.4%) | 21 (3.3%) |
| 20 to 24 Years | 27 (5.1%) | 22 (3.5%) |
| 25 to 29 Years | 5 (0.9%) | 22 (3.5%) |
| 30 to 34 Years | 28 (5.3%) | 112 (17.6%) |
| 35 to 39 Years | 27 (5.1%) | 36 (5.7%) |
| 40 to 44 Years | 62 (11.7%) | 15 (2.4%) |
| 45 to 49 Years | 17 (3.2%) | 35 (5.5%) |
| 50 to 54 Years | 18 (3.4%) | 30 (4.7%) |
| 55 to 59 Years | 11 (2.1%) | 15 (2.4%) |
| 60 to 64 Years | 34 (6.4%) | 74 (11.6%) |
| 65 to 69 Years | 68 (12.8%) | 90 (14.1%) |
| 70 to 74 Years | 18 (3.4%) | 33 (5.2%) |
| 75 to 79 Years | 13 (2.4%) | 28 (4.4%) |
| 80 to 84 Years | 24 (4.5%) | 12 (1.9%) |
| 85 Years and over | 9 (1.7%) | 9 (1.4%) |
| Total | 532 (100.0%) | 637 (100.0%) |
Families and Households in Berryville
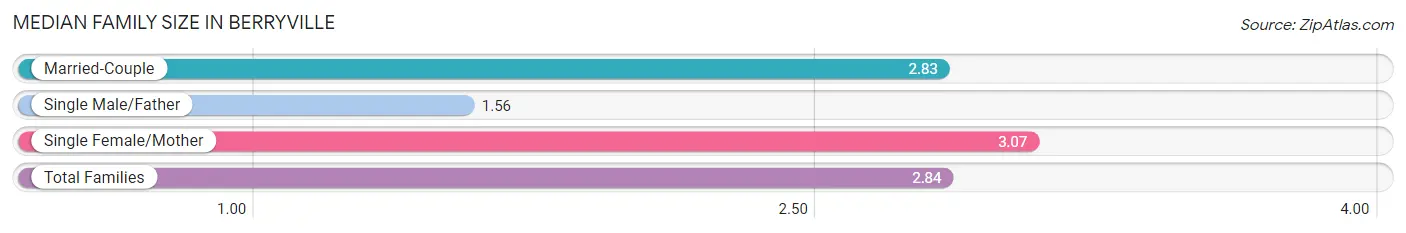
Median Family Size in Berryville
The median family size in Berryville is 2.84 persons per family, with single female/mother families (54 | 14.6%) accounting for the largest median family size of 3.07 persons per family. On the other hand, single male/father families (9 | 2.4%) represent the smallest median family size with 1.56 persons per family.
| Family Type | # Families | Family Size |
| Married-Couple | 306 (82.9%) | 2.83 |
| Single Male/Father | 9 (2.4%) | 1.56 |
| Single Female/Mother | 54 (14.6%) | 3.07 |
| Total Families | 369 (100.0%) | 2.84 |
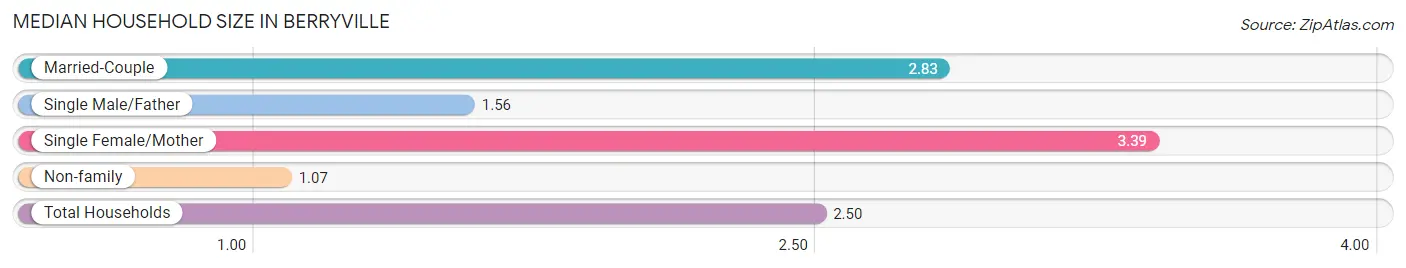
Median Household Size in Berryville
The median household size in Berryville is 2.50 persons per household, with single female/mother households (54 | 11.6%) accounting for the largest median household size of 3.39 persons per household. non-family households (98 | 21.0%) represent the smallest median household size with 1.07 persons per household.
| Household Type | # Households | Household Size |
| Married-Couple | 306 (65.5%) | 2.83 |
| Single Male/Father | 9 (1.9%) | 1.56 |
| Single Female/Mother | 54 (11.6%) | 3.39 |
| Non-family | 98 (21.0%) | 1.07 |
| Total Households | 467 (100.0%) | 2.50 |
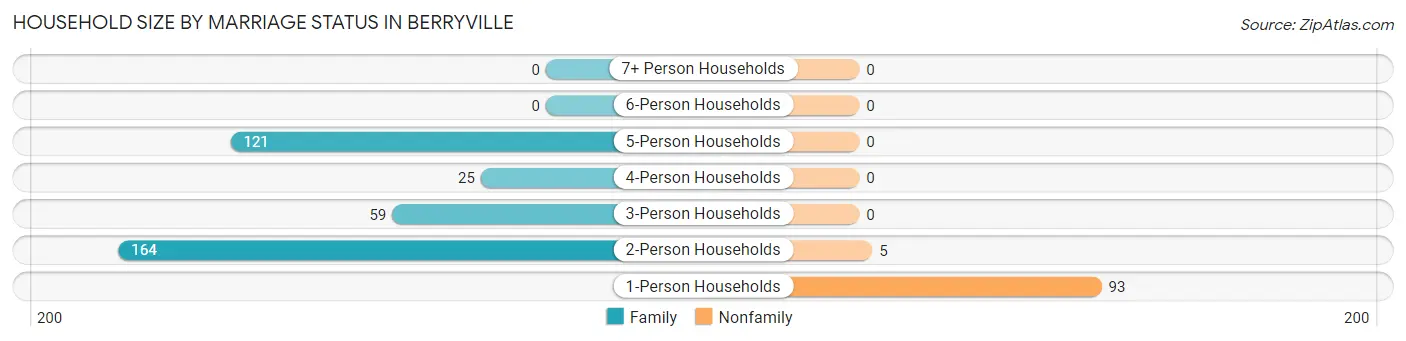
Household Size by Marriage Status in Berryville
Out of a total of 467 households in Berryville, 369 (79.0%) are family households, while 98 (21.0%) are nonfamily households. The most numerous type of family households are 2-person households, comprising 164, and the most common type of nonfamily households are 1-person households, comprising 93.
| Household Size | Family Households | Nonfamily Households |
| 1-Person Households | - | 93 (19.9%) |
| 2-Person Households | 164 (35.1%) | 5 (1.1%) |
| 3-Person Households | 59 (12.6%) | 0 (0.0%) |
| 4-Person Households | 25 (5.3%) | 0 (0.0%) |
| 5-Person Households | 121 (25.9%) | 0 (0.0%) |
| 6-Person Households | 0 (0.0%) | 0 (0.0%) |
| 7+ Person Households | 0 (0.0%) | 0 (0.0%) |
| Total | 369 (79.0%) | 98 (21.0%) |
Female Fertility in Berryville
Fertility by Age in Berryville
Average fertility rate in Berryville is 10.0 births per 1,000 women. Women in the age bracket of 35 to 50 years have the highest fertility rate with 28.0 births per 1,000 women. Women in the age bracket of 35 to 50 years acount for 100.0% of all women with births.
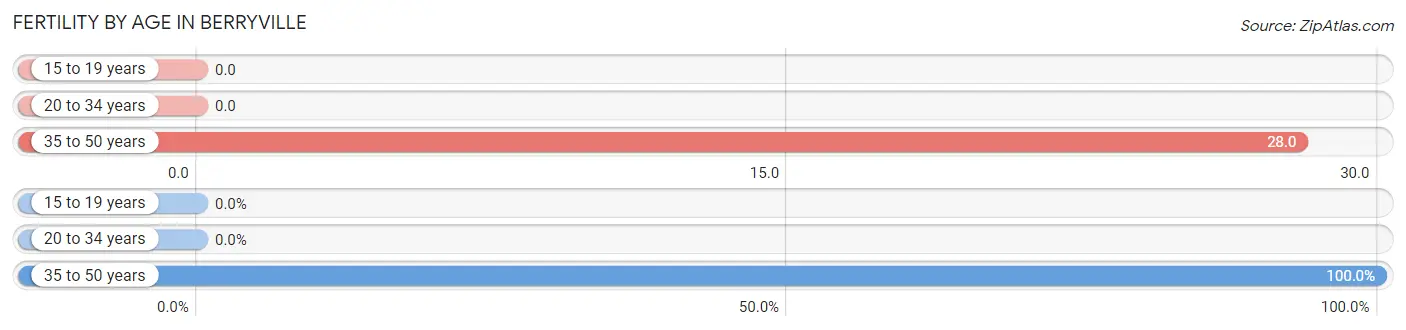
| Age Bracket | Women with Births | Births / 1,000 Women |
| 15 to 19 years | 0 (0.0%) | 0.0 |
| 20 to 34 years | 0 (0.0%) | 0.0 |
| 35 to 50 years | 3 (100.0%) | 28.0 |
| Total | 3 (100.0%) | 10.0 |
Fertility by Age by Marriage Status in Berryville
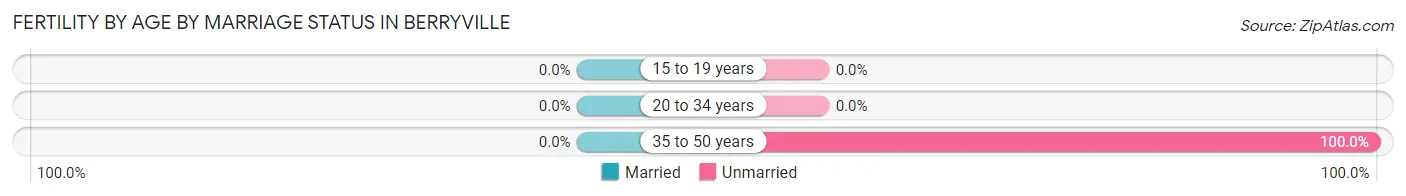
| Age Bracket | Married | Unmarried |
| 15 to 19 years | 0 (0.0%) | 0 (0.0%) |
| 20 to 34 years | 0 (0.0%) | 0 (0.0%) |
| 35 to 50 years | 0 (0.0%) | 3 (100.0%) |
| Total | 0 (0.0%) | 3 (100.0%) |
Fertility by Education in Berryville
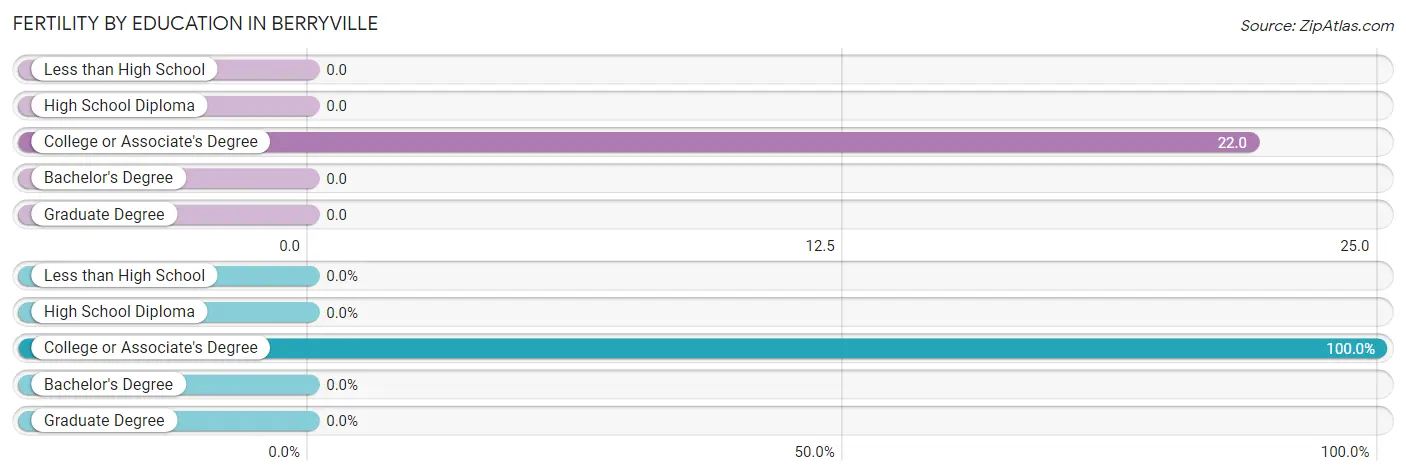
| Educational Attainment | Women with Births | Births / 1,000 Women |
| Less than High School | 0 (0.0%) | 0.0 |
| High School Diploma | 0 (0.0%) | 0.0 |
| College or Associate's Degree | 3 (100.0%) | 22.0 |
| Bachelor's Degree | 0 (0.0%) | 0.0 |
| Graduate Degree | 0 (0.0%) | 0.0 |
| Total | 3 (100.0%) | 10.0 |
Fertility by Education by Marriage Status in Berryville
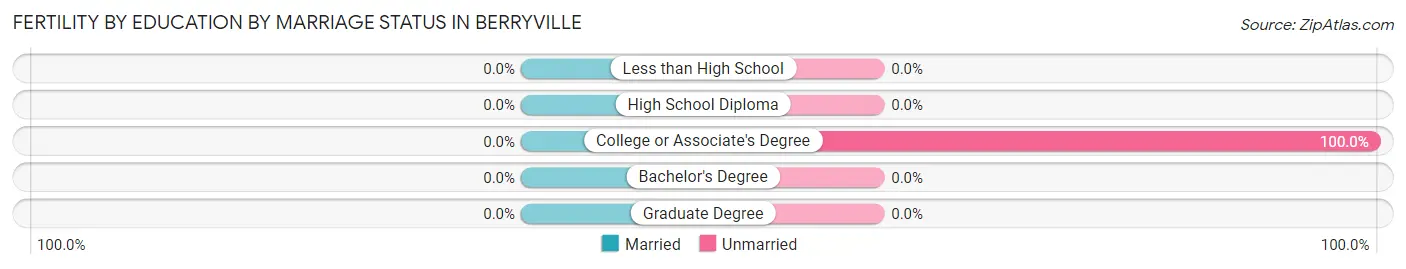
| Educational Attainment | Married | Unmarried |
| Less than High School | 0 (0.0%) | 0 (0.0%) |
| High School Diploma | 0 (0.0%) | 0 (0.0%) |
| College or Associate's Degree | 0 (0.0%) | 3 (100.0%) |
| Bachelor's Degree | 0 (0.0%) | 0 (0.0%) |
| Graduate Degree | 0 (0.0%) | 0 (0.0%) |
| Total | 0 (0.0%) | 3 (100.0%) |
Income in Berryville
Income Overview in Berryville
Per Capita Income in Berryville is $23,367, while median incomes of families and households are $77,375 and $50,938 respectively.
| Characteristic | Number | Measure |
| Per Capita Income | 1,169 | $23,367 |
| Median Family Income | 369 | $77,375 |
| Mean Family Income | 369 | $76,476 |
| Median Household Income | 467 | $50,938 |
| Mean Household Income | 467 | $68,270 |
| Income Deficit | 369 | $0 |
| Wage / Income Gap (%) | 1,169 | 23.30% |
| Wage / Income Gap ($) | 1,169 | 76.70¢ per $1 |
| Gini / Inequality Index | 1,169 | 0.35 |
Earnings by Sex in Berryville
Average Earnings in Berryville are $41,125, $48,240 for men and $37,000 for women, a difference of 23.3%.
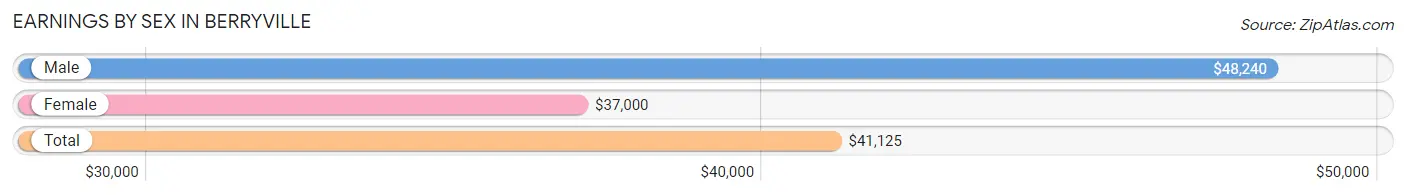
| Sex | Number | Average Earnings |
| Male | 277 (67.1%) | $48,240 |
| Female | 136 (32.9%) | $37,000 |
| Total | 413 (100.0%) | $41,125 |
Earnings by Sex by Income Bracket in Berryville
The most common earnings brackets in Berryville are $45,000 to $49,999 for men (49 | 17.7%) and $50,000 to $54,999 for women (26 | 19.1%).
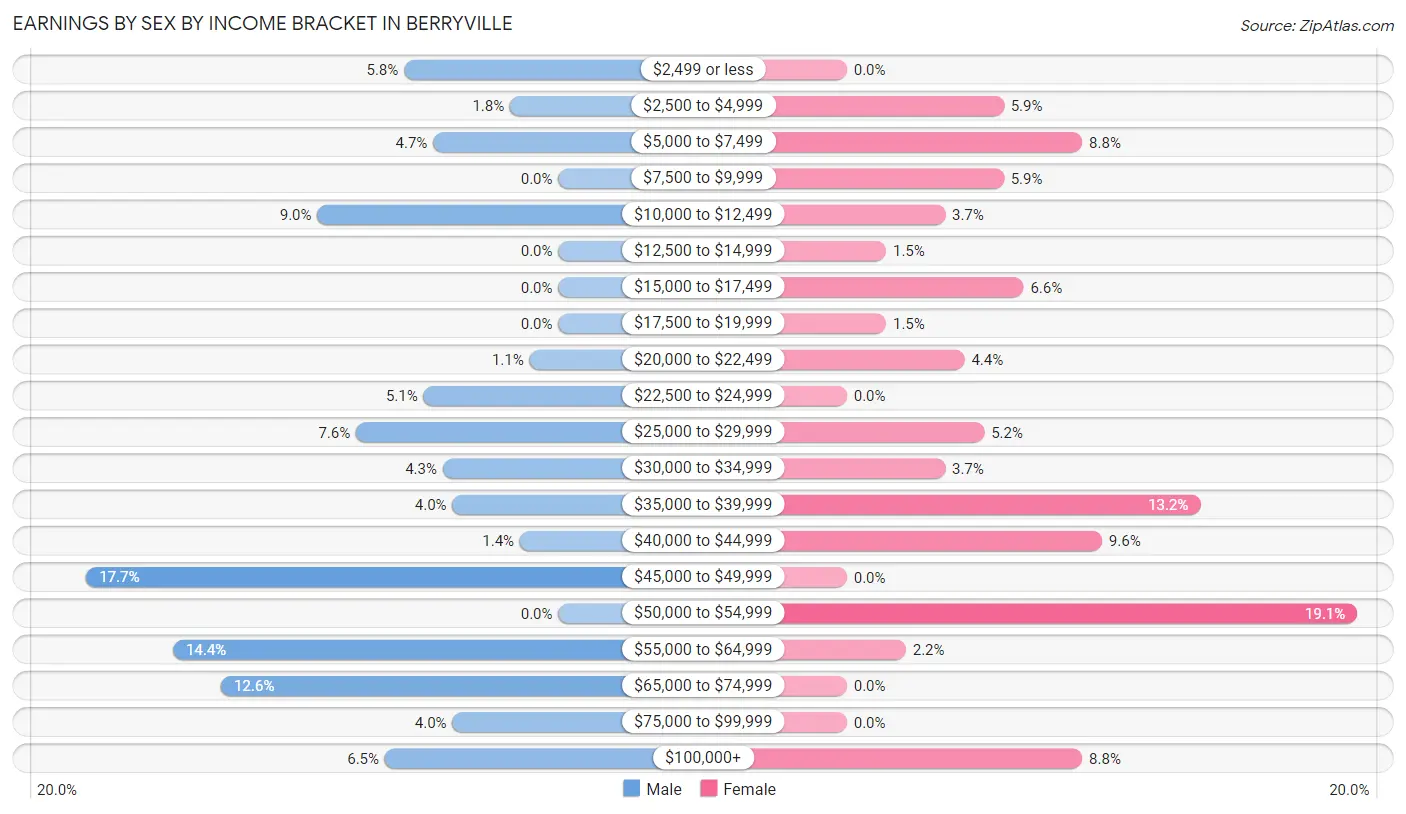
| Income | Male | Female |
| $2,499 or less | 16 (5.8%) | 0 (0.0%) |
| $2,500 to $4,999 | 5 (1.8%) | 8 (5.9%) |
| $5,000 to $7,499 | 13 (4.7%) | 12 (8.8%) |
| $7,500 to $9,999 | 0 (0.0%) | 8 (5.9%) |
| $10,000 to $12,499 | 25 (9.0%) | 5 (3.7%) |
| $12,500 to $14,999 | 0 (0.0%) | 2 (1.5%) |
| $15,000 to $17,499 | 0 (0.0%) | 9 (6.6%) |
| $17,500 to $19,999 | 0 (0.0%) | 2 (1.5%) |
| $20,000 to $22,499 | 3 (1.1%) | 6 (4.4%) |
| $22,500 to $24,999 | 14 (5.1%) | 0 (0.0%) |
| $25,000 to $29,999 | 21 (7.6%) | 7 (5.1%) |
| $30,000 to $34,999 | 12 (4.3%) | 5 (3.7%) |
| $35,000 to $39,999 | 11 (4.0%) | 18 (13.2%) |
| $40,000 to $44,999 | 4 (1.4%) | 13 (9.6%) |
| $45,000 to $49,999 | 49 (17.7%) | 0 (0.0%) |
| $50,000 to $54,999 | 0 (0.0%) | 26 (19.1%) |
| $55,000 to $64,999 | 40 (14.4%) | 3 (2.2%) |
| $65,000 to $74,999 | 35 (12.6%) | 0 (0.0%) |
| $75,000 to $99,999 | 11 (4.0%) | 0 (0.0%) |
| $100,000+ | 18 (6.5%) | 12 (8.8%) |
| Total | 277 (100.0%) | 136 (100.0%) |
Earnings by Sex by Educational Attainment in Berryville
Average earnings in Berryville are $49,107 for men and $38,750 for women, a difference of 21.1%. Men with an educational attainment of college or associate's degree enjoy the highest average annual earnings of $57,875, while those with less than high school education earn the least with $11,300. Women with an educational attainment of college or associate's degree earn the most with the average annual earnings of $41,250, while those with high school diploma education have the smallest earnings of $29,464.
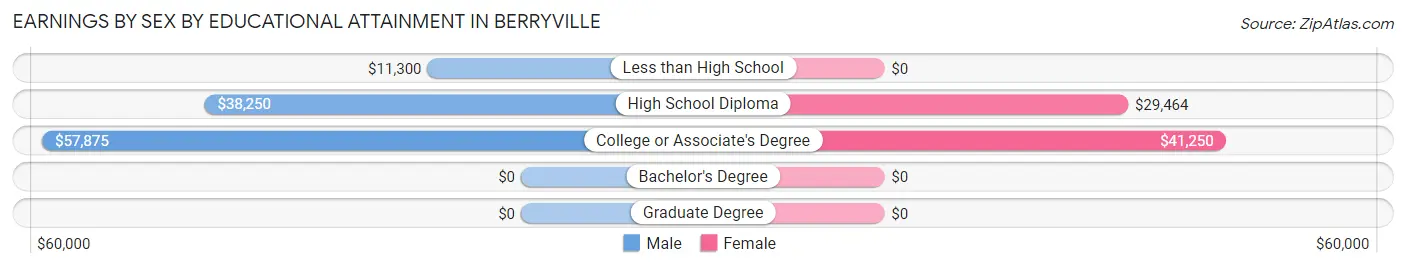
| Educational Attainment | Male Income | Female Income |
| Less than High School | $11,300 | $0 |
| High School Diploma | $38,250 | $29,464 |
| College or Associate's Degree | $57,875 | $41,250 |
| Bachelor's Degree | - | - |
| Graduate Degree | - | - |
| Total | $49,107 | $38,750 |
Family Income in Berryville
Family Income Brackets in Berryville
According to the Berryville family income data, there are 128 families falling into the $75,000 to $99,999 income range, which is the most common income bracket and makes up 34.7% of all families. Conversely, the less than $10,000 income bracket is the least frequent group with only 2 families (0.5%) belonging to this category.
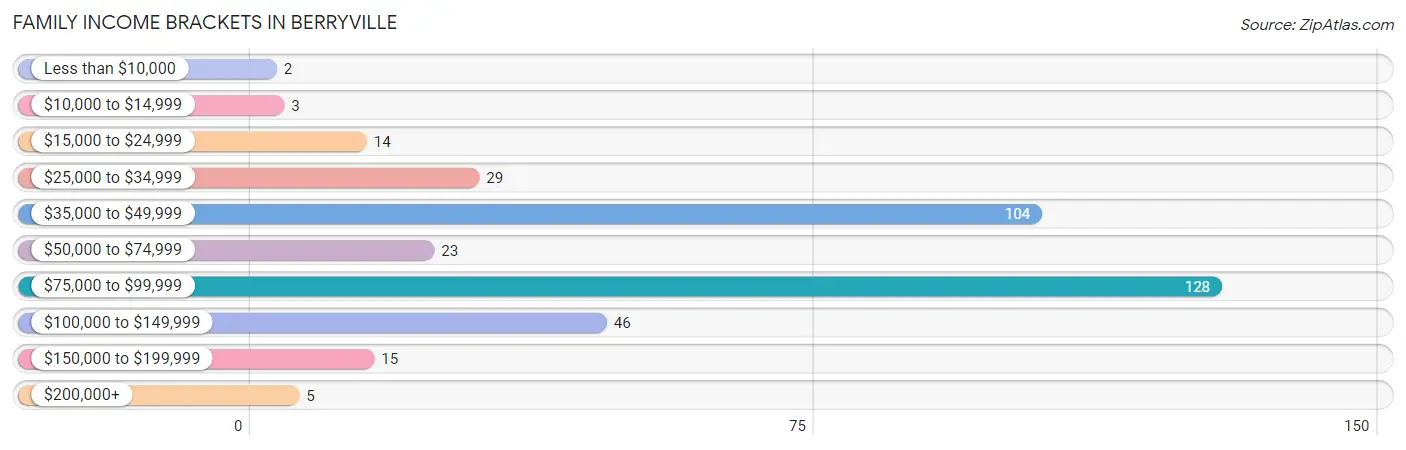
| Income Bracket | # Families | % Families |
| Less than $10,000 | 2 | 0.5% |
| $10,000 to $14,999 | 3 | 0.8% |
| $15,000 to $24,999 | 14 | 3.8% |
| $25,000 to $34,999 | 29 | 7.9% |
| $35,000 to $49,999 | 104 | 28.2% |
| $50,000 to $74,999 | 23 | 6.2% |
| $75,000 to $99,999 | 128 | 34.7% |
| $100,000 to $149,999 | 46 | 12.5% |
| $150,000 to $199,999 | 15 | 4.1% |
| $200,000+ | 5 | 1.4% |
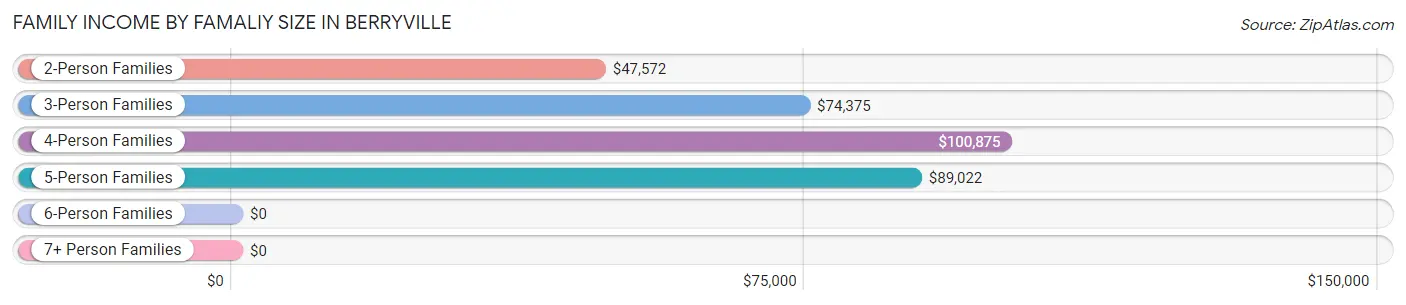
Family Income by Famaliy Size in Berryville
4-person families (25 | 6.8%) account for the highest median family income in Berryville with $100,875 per family, while 4-person families (25 | 6.8%) have the highest median income of $25,219 per family member.
| Income Bracket | # Families | Median Income |
| 2-Person Families | 175 (47.4%) | $47,572 |
| 3-Person Families | 51 (13.8%) | $74,375 |
| 4-Person Families | 25 (6.8%) | $100,875 |
| 5-Person Families | 118 (32.0%) | $89,022 |
| 6-Person Families | 0 (0.0%) | $0 |
| 7+ Person Families | 0 (0.0%) | $0 |
| Total | 369 (100.0%) | $77,375 |
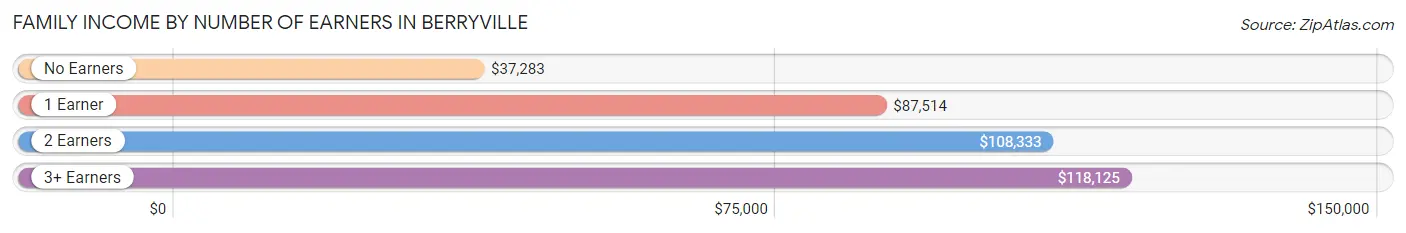
Family Income by Number of Earners in Berryville
The median family income in Berryville is $77,375, with families comprising 3+ earners (10) having the highest median family income of $118,125, while families with no earners (78) have the lowest median family income of $37,283, accounting for 2.7% and 21.1% of families, respectively.
| Number of Earners | # Families | Median Income |
| No Earners | 78 (21.1%) | $37,283 |
| 1 Earner | 207 (56.1%) | $87,514 |
| 2 Earners | 74 (20.1%) | $108,333 |
| 3+ Earners | 10 (2.7%) | $118,125 |
| Total | 369 (100.0%) | $77,375 |
Household Income in Berryville
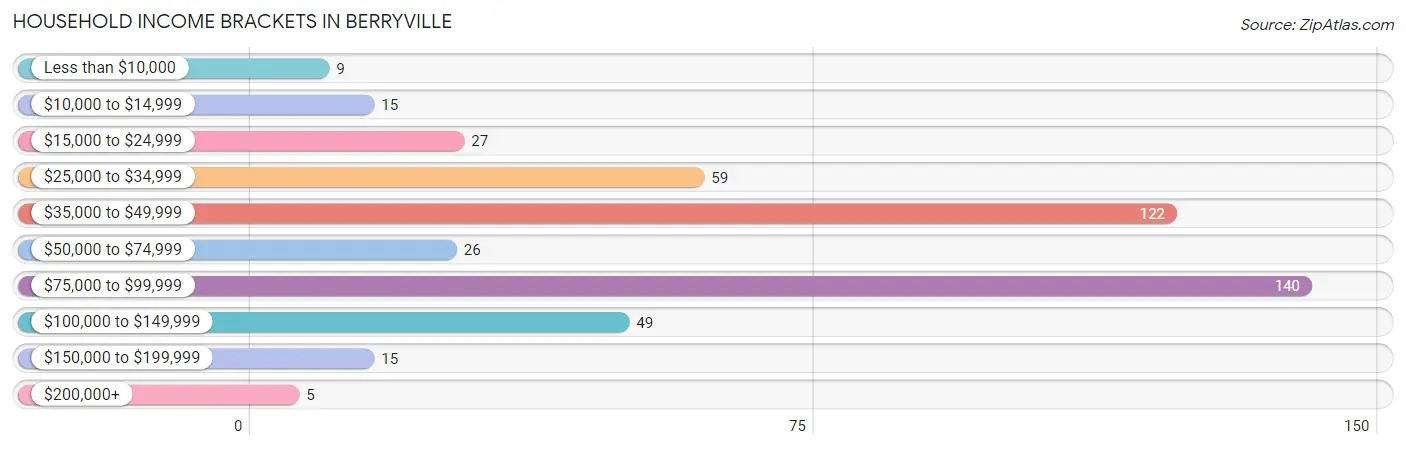
Household Income Brackets in Berryville
With 140 households falling in the category, the $75,000 to $99,999 income range is the most frequent in Berryville, accounting for 30.0% of all households. In contrast, only 5 households (1.1%) fall into the $200,000+ income bracket, making it the least populous group.
| Income Bracket | # Households | % Households |
| Less than $10,000 | 9 | 1.9% |
| $10,000 to $14,999 | 15 | 3.2% |
| $15,000 to $24,999 | 27 | 5.8% |
| $25,000 to $34,999 | 59 | 12.6% |
| $35,000 to $49,999 | 122 | 26.1% |
| $50,000 to $74,999 | 26 | 5.6% |
| $75,000 to $99,999 | 140 | 30.0% |
| $100,000 to $149,999 | 49 | 10.5% |
| $150,000 to $199,999 | 15 | 3.2% |
| $200,000+ | 5 | 1.1% |
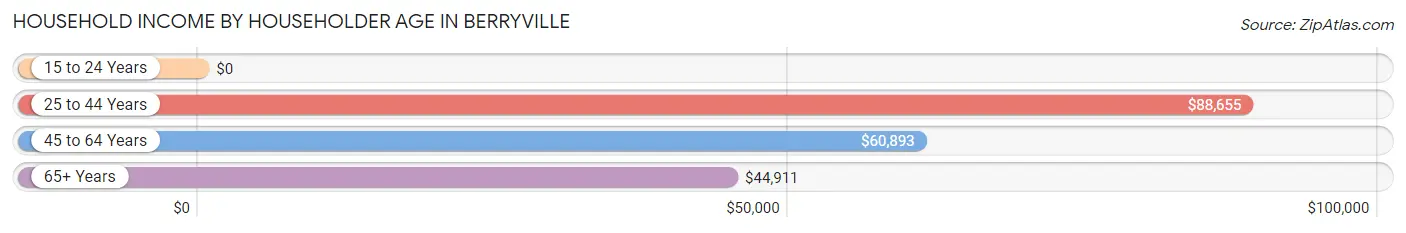
Household Income by Householder Age in Berryville
The median household income in Berryville is $50,938, with the highest median household income of $88,655 found in the 25 to 44 years age bracket for the primary householder. A total of 169 households (36.2%) fall into this category.
| Income Bracket | # Households | Median Income |
| 15 to 24 Years | 0 (0.0%) | $0 |
| 25 to 44 Years | 169 (36.2%) | $88,655 |
| 45 to 64 Years | 125 (26.8%) | $60,893 |
| 65+ Years | 173 (37.0%) | $44,911 |
| Total | 467 (100.0%) | $50,938 |
Poverty in Berryville
Income Below Poverty by Sex and Age in Berryville
With 6.4% poverty level for males and 4.4% for females among the residents of Berryville, 35 to 44 year old males and 6 to 11 year old females are the most vulnerable to poverty, with 14 males (15.7%) and 3 females (13.0%) in their respective age groups living below the poverty level.
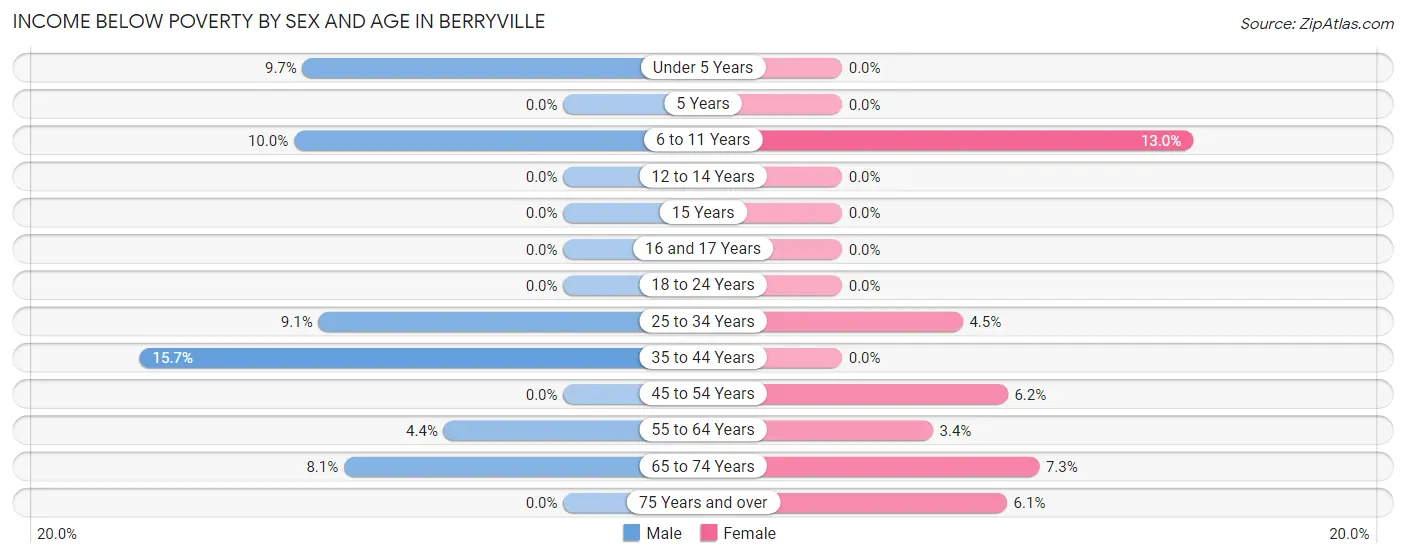
| Age Bracket | Male | Female |
| Under 5 Years | 6 (9.7%) | 0 (0.0%) |
| 5 Years | 0 (0.0%) | 0 (0.0%) |
| 6 to 11 Years | 2 (10.0%) | 3 (13.0%) |
| 12 to 14 Years | 0 (0.0%) | 0 (0.0%) |
| 15 Years | 0 (0.0%) | 0 (0.0%) |
| 16 and 17 Years | 0 (0.0%) | 0 (0.0%) |
| 18 to 24 Years | 0 (0.0%) | 0 (0.0%) |
| 25 to 34 Years | 3 (9.1%) | 6 (4.5%) |
| 35 to 44 Years | 14 (15.7%) | 0 (0.0%) |
| 45 to 54 Years | 0 (0.0%) | 4 (6.1%) |
| 55 to 64 Years | 2 (4.4%) | 3 (3.4%) |
| 65 to 74 Years | 7 (8.1%) | 9 (7.3%) |
| 75 Years and over | 0 (0.0%) | 3 (6.1%) |
| Total | 34 (6.4%) | 28 (4.4%) |
Income Above Poverty by Sex and Age in Berryville
According to the poverty statistics in Berryville, males aged 5 years and females aged under 5 years are the age groups that are most secure financially, with 100.0% of males and 100.0% of females in these age groups living above the poverty line.
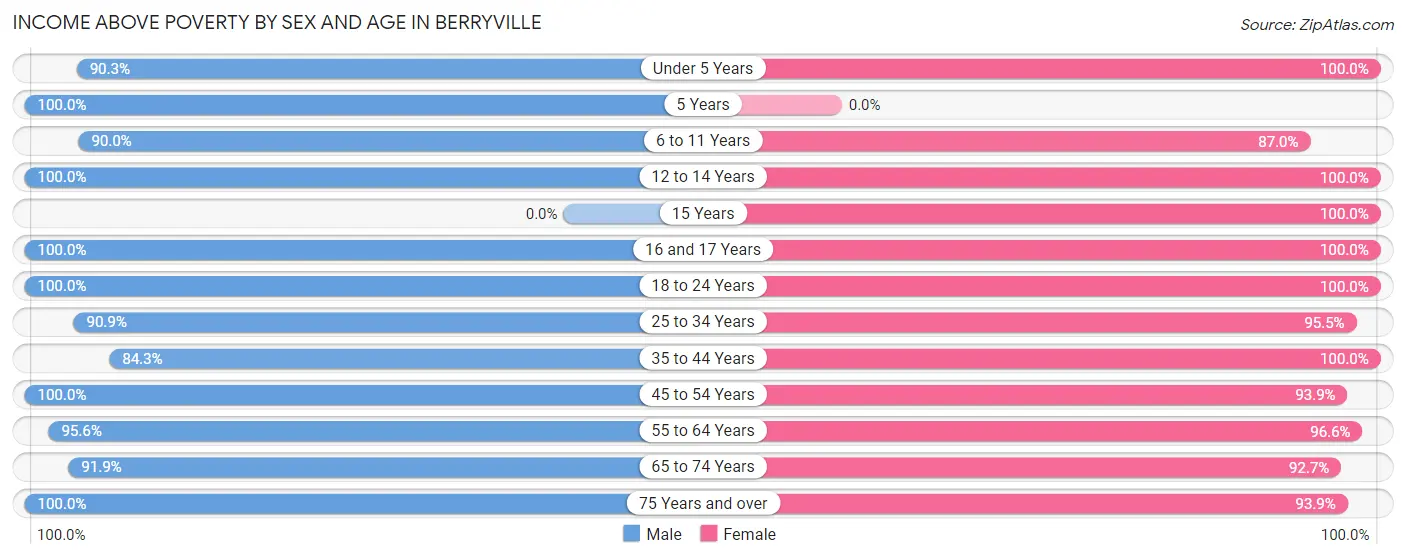
| Age Bracket | Male | Female |
| Under 5 Years | 56 (90.3%) | 8 (100.0%) |
| 5 Years | 9 (100.0%) | 0 (0.0%) |
| 6 to 11 Years | 18 (90.0%) | 20 (87.0%) |
| 12 to 14 Years | 67 (100.0%) | 52 (100.0%) |
| 15 Years | 0 (0.0%) | 7 (100.0%) |
| 16 and 17 Years | 3 (100.0%) | 11 (100.0%) |
| 18 to 24 Years | 37 (100.0%) | 25 (100.0%) |
| 25 to 34 Years | 30 (90.9%) | 128 (95.5%) |
| 35 to 44 Years | 75 (84.3%) | 51 (100.0%) |
| 45 to 54 Years | 35 (100.0%) | 61 (93.9%) |
| 55 to 64 Years | 43 (95.6%) | 86 (96.6%) |
| 65 to 74 Years | 79 (91.9%) | 114 (92.7%) |
| 75 Years and over | 46 (100.0%) | 46 (93.9%) |
| Total | 498 (93.6%) | 609 (95.6%) |
Income Below Poverty Among Married-Couple Families in Berryville
The poverty statistics for married-couple families in Berryville show that 0.6% or 2 of the total 306 families live below the poverty line. Families with no children have the highest poverty rate of 1.2%, comprising of 2 families. On the other hand, families with 1 or 2 children have the lowest poverty rate of 0.0%, which includes 0 families.
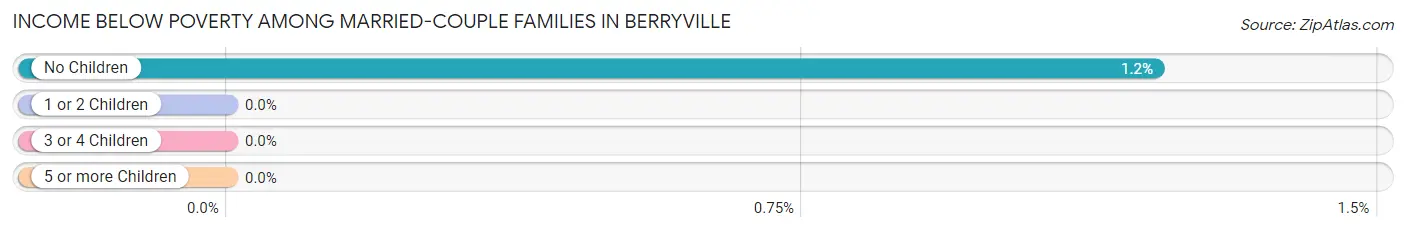
| Children | Above Poverty | Below Poverty |
| No Children | 163 (98.8%) | 2 (1.2%) |
| 1 or 2 Children | 39 (100.0%) | 0 (0.0%) |
| 3 or 4 Children | 102 (100.0%) | 0 (0.0%) |
| 5 or more Children | 0 (0.0%) | 0 (0.0%) |
| Total | 304 (99.4%) | 2 (0.6%) |
Income Below Poverty Among Single-Parent Households in Berryville
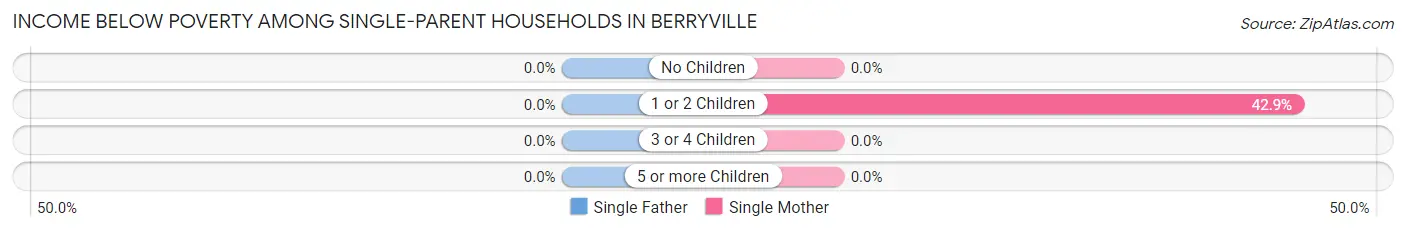
| Children | Single Father | Single Mother |
| No Children | 0 (0.0%) | 0 (0.0%) |
| 1 or 2 Children | 0 (0.0%) | 6 (42.9%) |
| 3 or 4 Children | 0 (0.0%) | 0 (0.0%) |
| 5 or more Children | 0 (0.0%) | 0 (0.0%) |
| Total | 0 (0.0%) | 6 (11.1%) |
Income Below Poverty Among Married-Couple vs Single-Parent Households in Berryville
The poverty data for Berryville shows that 2 of the married-couple family households (0.6%) and 6 of the single-parent households (9.5%) are living below the poverty level. Within the married-couple family households, those with no children have the highest poverty rate, with 2 households (1.2%) falling below the poverty line. Among the single-parent households, those with 1 or 2 children have the highest poverty rate, with 6 household (37.5%) living below poverty.
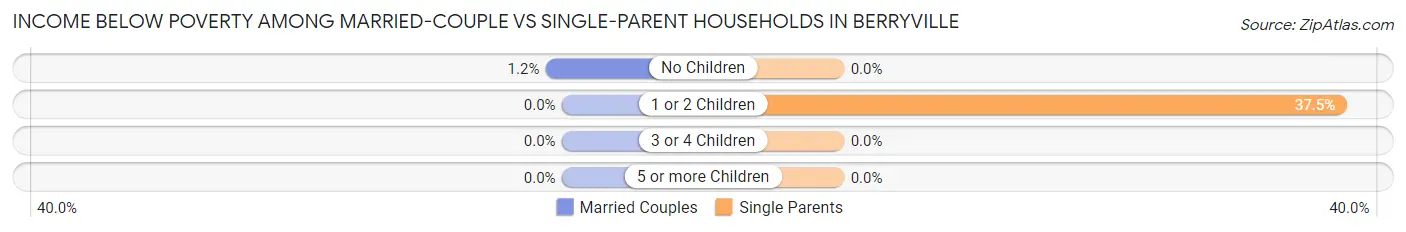
| Children | Married-Couple Families | Single-Parent Households |
| No Children | 2 (1.2%) | 0 (0.0%) |
| 1 or 2 Children | 0 (0.0%) | 6 (37.5%) |
| 3 or 4 Children | 0 (0.0%) | 0 (0.0%) |
| 5 or more Children | 0 (0.0%) | 0 (0.0%) |
| Total | 2 (0.6%) | 6 (9.5%) |
Employment Characteristics in Berryville
Employment by Class of Employer in Berryville
Among the 378 employed individuals in Berryville, private company employees (214 | 56.6%), local government employees (73 | 19.3%), and not-for-profit organizations (38 | 10.1%) make up the most common classes of employment.
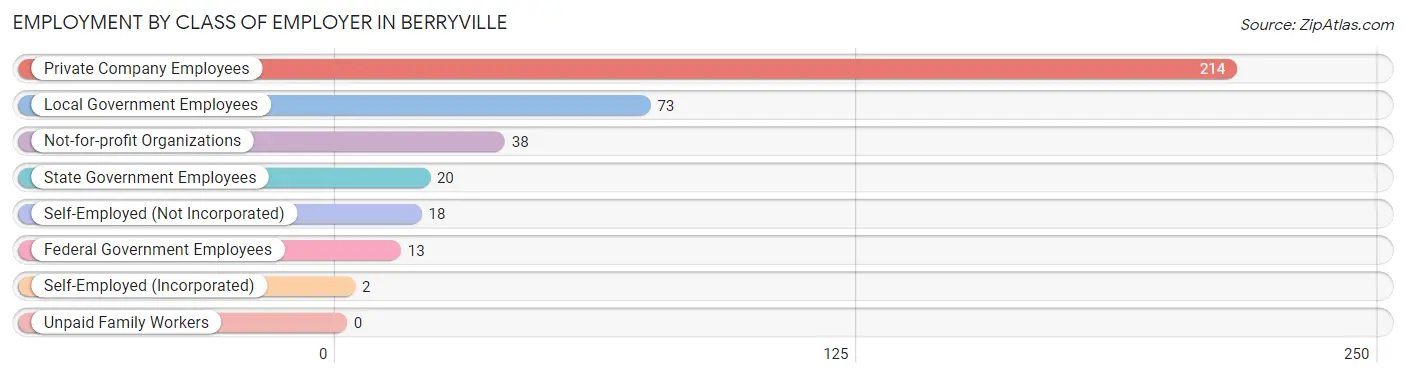
| Employer Class | # Employees | % Employees |
| Private Company Employees | 214 | 56.6% |
| Self-Employed (Incorporated) | 2 | 0.5% |
| Self-Employed (Not Incorporated) | 18 | 4.8% |
| Not-for-profit Organizations | 38 | 10.1% |
| Local Government Employees | 73 | 19.3% |
| State Government Employees | 20 | 5.3% |
| Federal Government Employees | 13 | 3.4% |
| Unpaid Family Workers | 0 | 0.0% |
| Total | 378 | 100.0% |
Employment Status by Age in Berryville
According to the labor force statistics for Berryville, out of the total population over 16 years of age (921), 43.3% or 399 individuals are in the labor force, with 5.3% or 21 of them unemployed. The age group with the highest labor force participation rate is 25 to 29 years, with 100.0% or 27 individuals in the labor force. Within the labor force, the 25 to 29 years age range has the highest percentage of unemployed individuals, with 22.2% or 6 of them being unemployed.
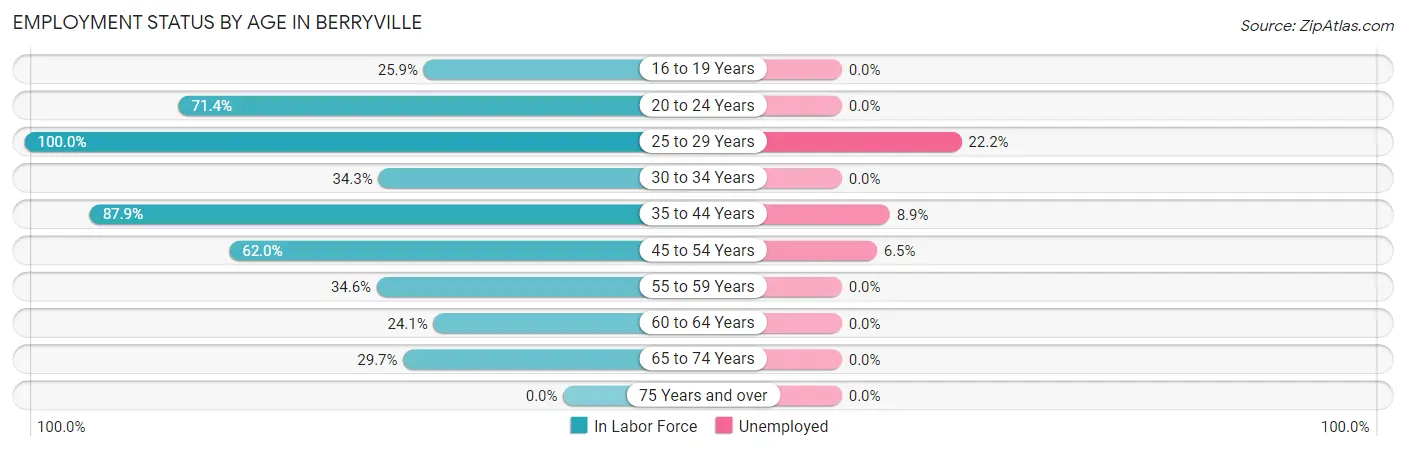
| Age Bracket | In Labor Force | Unemployed |
| 16 to 19 Years | 7 (25.9%) | 0 (0.0%) |
| 20 to 24 Years | 35 (71.4%) | 0 (0.0%) |
| 25 to 29 Years | 27 (100.0%) | 6 (22.2%) |
| 30 to 34 Years | 48 (34.3%) | 0 (0.0%) |
| 35 to 44 Years | 123 (87.9%) | 11 (8.9%) |
| 45 to 54 Years | 62 (62.0%) | 4 (6.5%) |
| 55 to 59 Years | 9 (34.6%) | 0 (0.0%) |
| 60 to 64 Years | 26 (24.1%) | 0 (0.0%) |
| 65 to 74 Years | 62 (29.7%) | 0 (0.0%) |
| 75 Years and over | 0 (0.0%) | 0 (0.0%) |
| Total | 399 (43.3%) | 21 (5.3%) |
Employment Status by Educational Attainment in Berryville
According to labor force statistics for Berryville, 54.5% of individuals (295) out of the total population between 25 and 64 years of age (541) are in the labor force, with 7.1% or 21 of them being unemployed. The group with the highest labor force participation rate are those with the educational attainment of less than high school, with 75.0% or 42 individuals in the labor force. Within the labor force, individuals with high school diploma education have the highest percentage of unemployment, with 15.5% or 17 of them being unemployed.
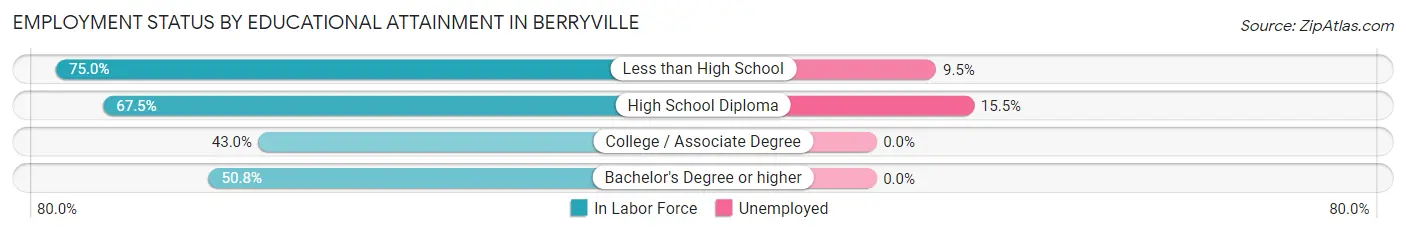
| Educational Attainment | In Labor Force | Unemployed |
| Less than High School | 42 (75.0%) | 5 (9.5%) |
| High School Diploma | 110 (67.5%) | 25 (15.5%) |
| College / Associate Degree | 113 (43.0%) | 0 (0.0%) |
| Bachelor's Degree or higher | 30 (50.8%) | 0 (0.0%) |
| Total | 295 (54.5%) | 38 (7.1%) |
Employment Occupations by Sex in Berryville
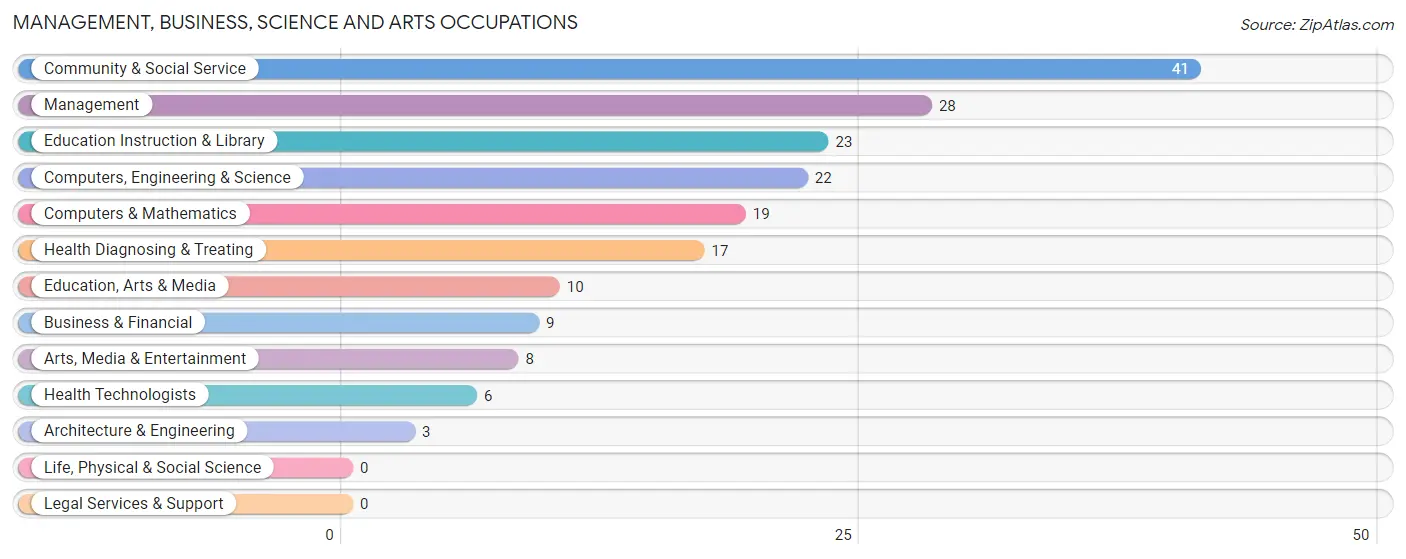
Management, Business, Science and Arts Occupations
The most common Management, Business, Science and Arts occupations in Berryville are Community & Social Service (41 | 10.8%), Management (28 | 7.4%), Education Instruction & Library (23 | 6.1%), Computers, Engineering & Science (22 | 5.8%), and Computers & Mathematics (19 | 5.0%).
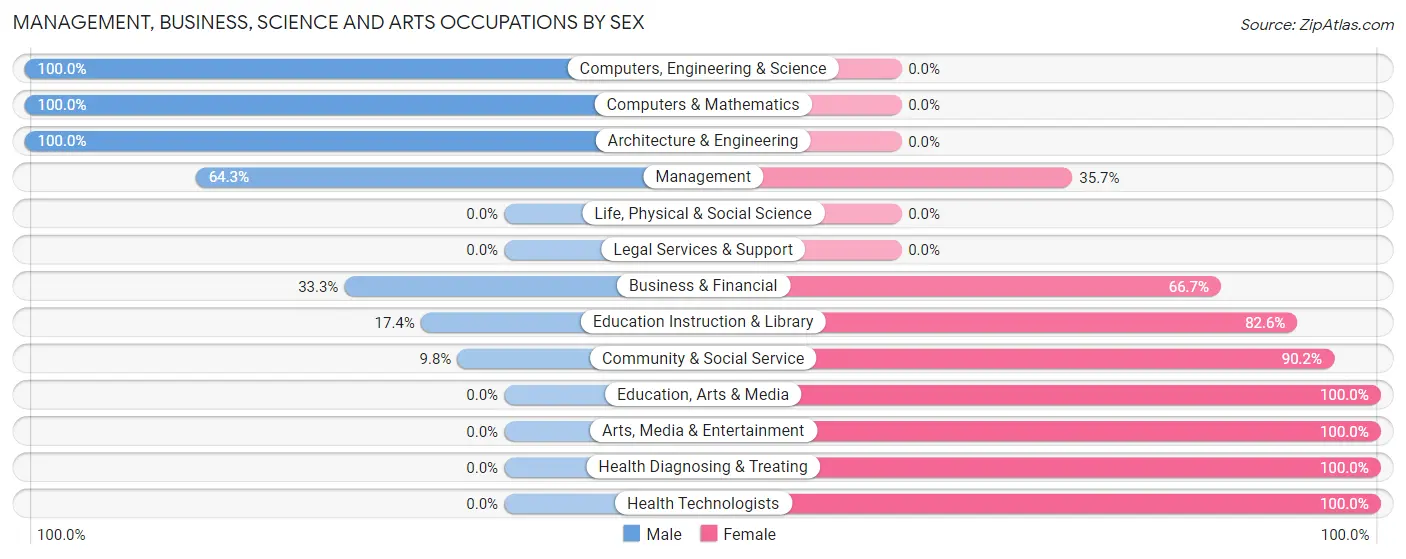
Management, Business, Science and Arts Occupations by Sex
Within the Management, Business, Science and Arts occupations in Berryville, the most male-oriented occupations are Computers, Engineering & Science (100.0%), Computers & Mathematics (100.0%), and Architecture & Engineering (100.0%), while the most female-oriented occupations are Education, Arts & Media (100.0%), Arts, Media & Entertainment (100.0%), and Health Diagnosing & Treating (100.0%).
| Occupation | Male | Female |
| Management | 18 (64.3%) | 10 (35.7%) |
| Business & Financial | 3 (33.3%) | 6 (66.7%) |
| Computers, Engineering & Science | 22 (100.0%) | 0 (0.0%) |
| Computers & Mathematics | 19 (100.0%) | 0 (0.0%) |
| Architecture & Engineering | 3 (100.0%) | 0 (0.0%) |
| Life, Physical & Social Science | 0 (0.0%) | 0 (0.0%) |
| Community & Social Service | 4 (9.8%) | 37 (90.2%) |
| Education, Arts & Media | 0 (0.0%) | 10 (100.0%) |
| Legal Services & Support | 0 (0.0%) | 0 (0.0%) |
| Education Instruction & Library | 4 (17.4%) | 19 (82.6%) |
| Arts, Media & Entertainment | 0 (0.0%) | 8 (100.0%) |
| Health Diagnosing & Treating | 0 (0.0%) | 17 (100.0%) |
| Health Technologists | 0 (0.0%) | 6 (100.0%) |
| Total (Category) | 47 (40.2%) | 70 (59.8%) |
| Total (Overall) | 258 (68.2%) | 120 (31.8%) |
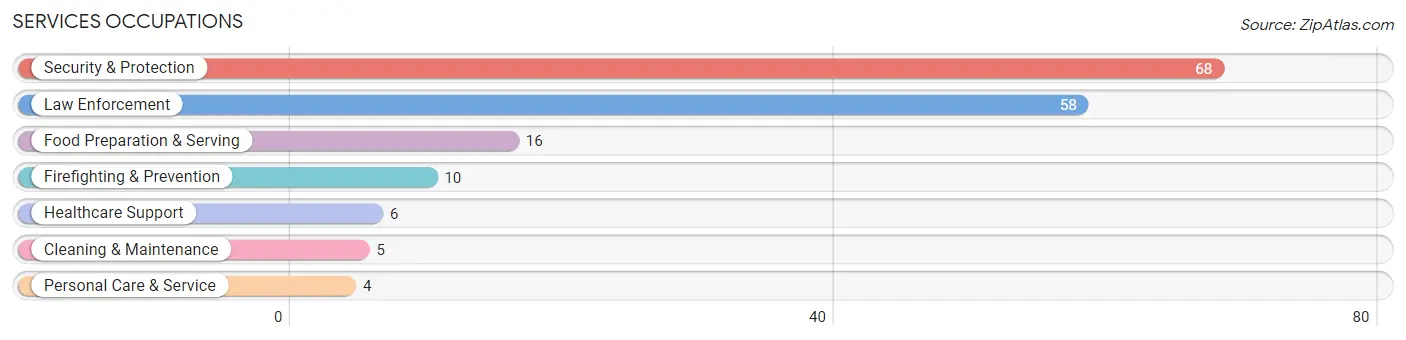
Services Occupations
The most common Services occupations in Berryville are Security & Protection (68 | 18.0%), Law Enforcement (58 | 15.3%), Food Preparation & Serving (16 | 4.2%), Firefighting & Prevention (10 | 2.6%), and Healthcare Support (6 | 1.6%).
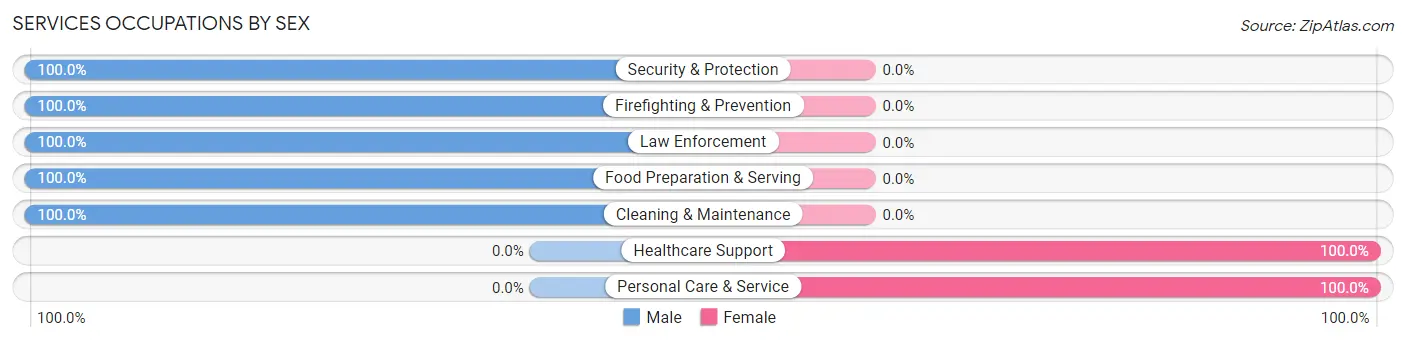
Services Occupations by Sex
Within the Services occupations in Berryville, the most male-oriented occupations are Security & Protection (100.0%), Firefighting & Prevention (100.0%), and Law Enforcement (100.0%), while the most female-oriented occupations are Healthcare Support (100.0%), and Personal Care & Service (100.0%).
| Occupation | Male | Female |
| Healthcare Support | 0 (0.0%) | 6 (100.0%) |
| Security & Protection | 68 (100.0%) | 0 (0.0%) |
| Firefighting & Prevention | 10 (100.0%) | 0 (0.0%) |
| Law Enforcement | 58 (100.0%) | 0 (0.0%) |
| Food Preparation & Serving | 16 (100.0%) | 0 (0.0%) |
| Cleaning & Maintenance | 5 (100.0%) | 0 (0.0%) |
| Personal Care & Service | 0 (0.0%) | 4 (100.0%) |
| Total (Category) | 89 (89.9%) | 10 (10.1%) |
| Total (Overall) | 258 (68.2%) | 120 (31.8%) |
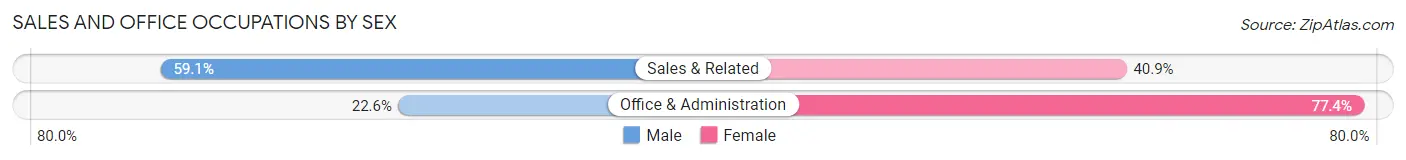
Sales and Office Occupations
The most common Sales and Office occupations in Berryville are Office & Administration (31 | 8.2%), and Sales & Related (22 | 5.8%).

Sales and Office Occupations by Sex
| Occupation | Male | Female |
| Sales & Related | 13 (59.1%) | 9 (40.9%) |
| Office & Administration | 7 (22.6%) | 24 (77.4%) |
| Total (Category) | 20 (37.7%) | 33 (62.3%) |
| Total (Overall) | 258 (68.2%) | 120 (31.8%) |
Natural Resources, Construction and Maintenance Occupations
The most common Natural Resources, Construction and Maintenance occupations in Berryville are , and Construction & Extraction (69 | 18.2%).

Natural Resources, Construction and Maintenance Occupations by Sex

| Occupation | Male | Female |
| Farming, Fishing & Forestry | 0 (0.0%) | 0 (0.0%) |
| Construction & Extraction | 66 (95.7%) | 3 (4.3%) |
| Installation, Maintenance & Repair | 0 (0.0%) | 0 (0.0%) |
| Total (Category) | 66 (95.7%) | 3 (4.3%) |
| Total (Overall) | 258 (68.2%) | 120 (31.8%) |
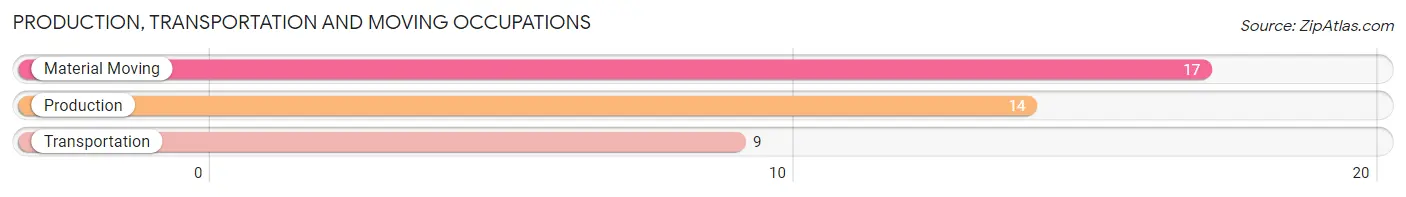
Production, Transportation and Moving Occupations
The most common Production, Transportation and Moving occupations in Berryville are Material Moving (17 | 4.5%), Production (14 | 3.7%), and Transportation (9 | 2.4%).
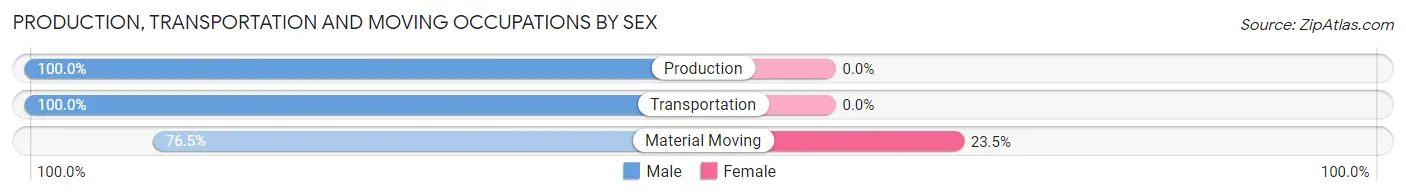
Production, Transportation and Moving Occupations by Sex
| Occupation | Male | Female |
| Production | 14 (100.0%) | 0 (0.0%) |
| Transportation | 9 (100.0%) | 0 (0.0%) |
| Material Moving | 13 (76.5%) | 4 (23.5%) |
| Total (Category) | 36 (90.0%) | 4 (10.0%) |
| Total (Overall) | 258 (68.2%) | 120 (31.8%) |
Employment Industries by Sex in Berryville
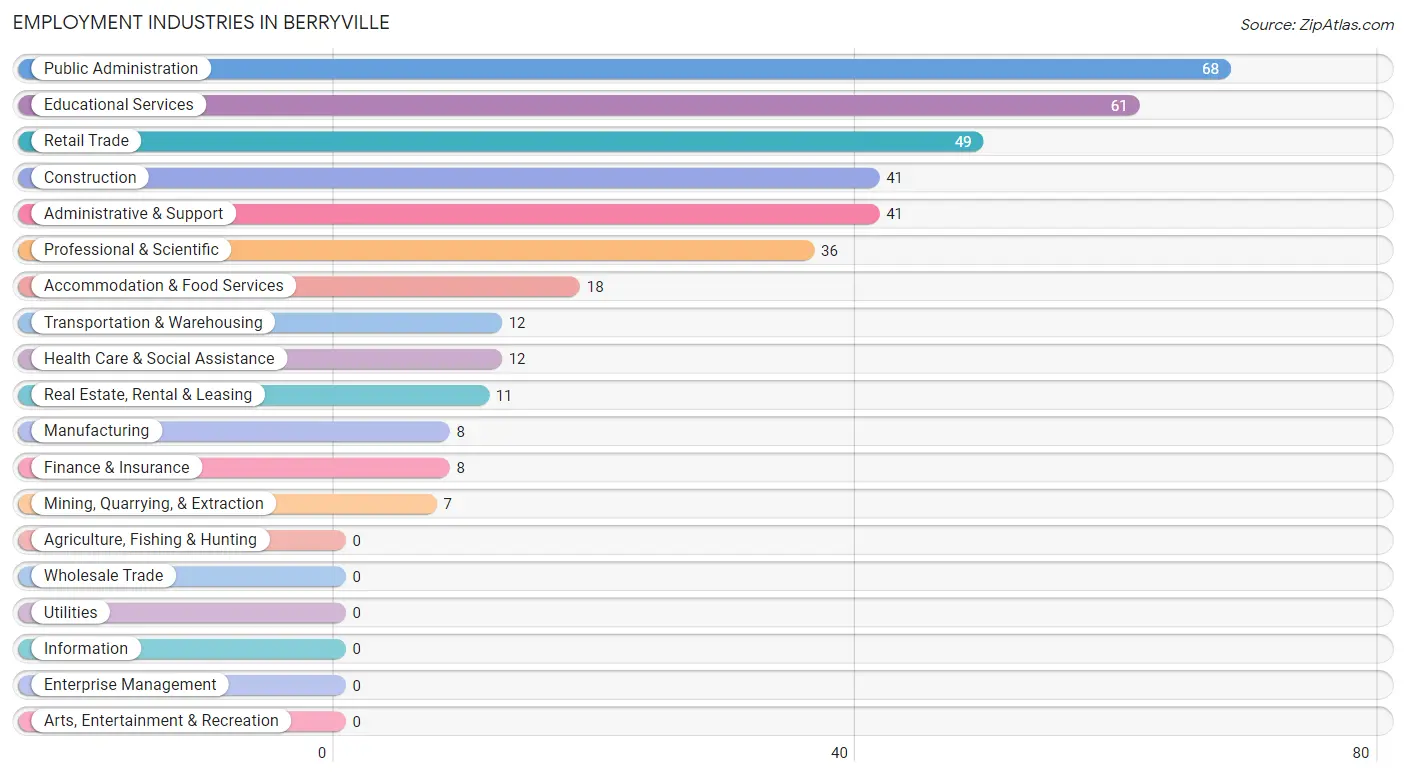
Employment Industries in Berryville
The major employment industries in Berryville include Public Administration (68 | 18.0%), Educational Services (61 | 16.1%), Retail Trade (49 | 13.0%), Construction (41 | 10.8%), and Administrative & Support (41 | 10.8%).
Employment Industries by Sex in Berryville
The Berryville industries that see more men than women are Mining, Quarrying, & Extraction (100.0%), Public Administration (100.0%), and Construction (92.7%), whereas the industries that tend to have a higher number of women are Health Care & Social Assistance (100.0%), Real Estate, Rental & Leasing (81.8%), and Educational Services (65.6%).
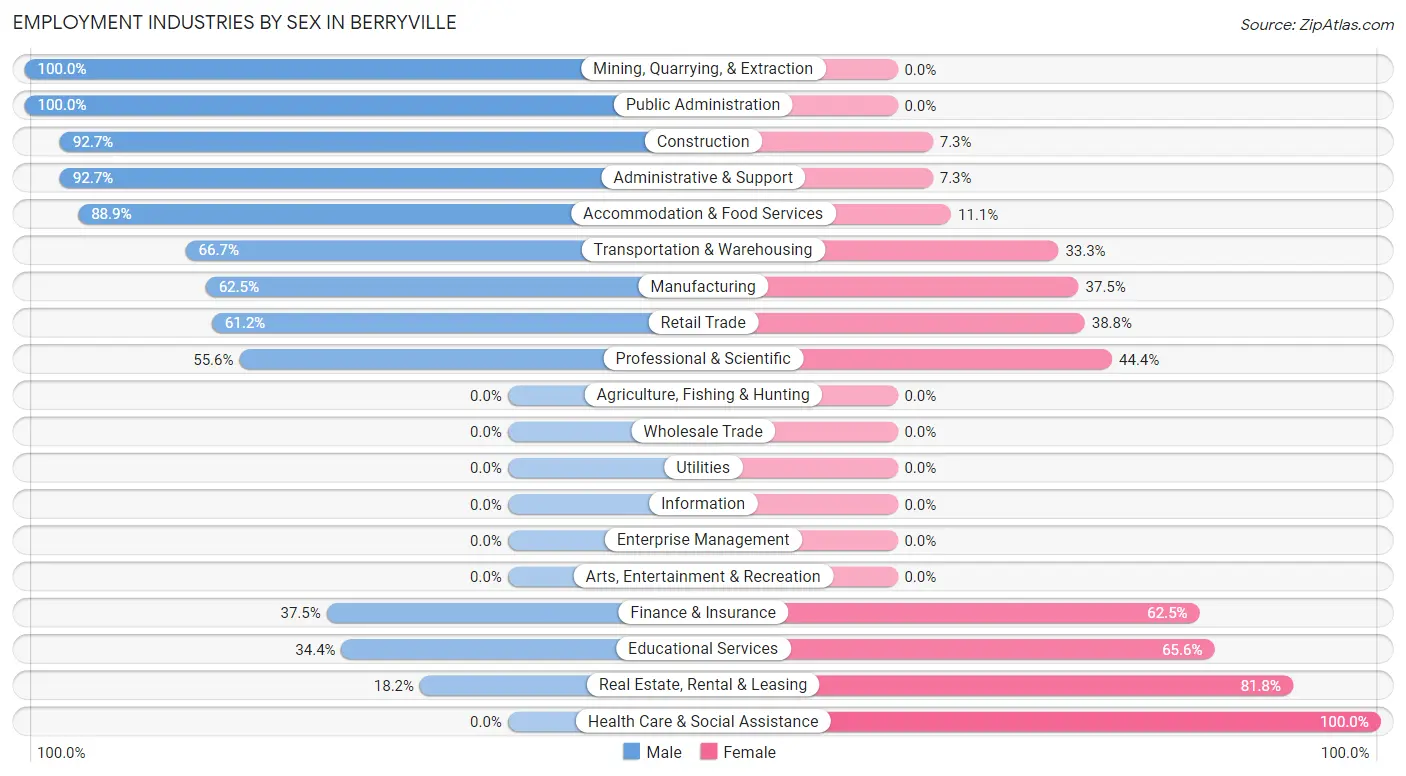
| Industry | Male | Female |
| Agriculture, Fishing & Hunting | 0 (0.0%) | 0 (0.0%) |
| Mining, Quarrying, & Extraction | 7 (100.0%) | 0 (0.0%) |
| Construction | 38 (92.7%) | 3 (7.3%) |
| Manufacturing | 5 (62.5%) | 3 (37.5%) |
| Wholesale Trade | 0 (0.0%) | 0 (0.0%) |
| Retail Trade | 30 (61.2%) | 19 (38.8%) |
| Transportation & Warehousing | 8 (66.7%) | 4 (33.3%) |
| Utilities | 0 (0.0%) | 0 (0.0%) |
| Information | 0 (0.0%) | 0 (0.0%) |
| Finance & Insurance | 3 (37.5%) | 5 (62.5%) |
| Real Estate, Rental & Leasing | 2 (18.2%) | 9 (81.8%) |
| Professional & Scientific | 20 (55.6%) | 16 (44.4%) |
| Enterprise Management | 0 (0.0%) | 0 (0.0%) |
| Administrative & Support | 38 (92.7%) | 3 (7.3%) |
| Educational Services | 21 (34.4%) | 40 (65.6%) |
| Health Care & Social Assistance | 0 (0.0%) | 12 (100.0%) |
| Arts, Entertainment & Recreation | 0 (0.0%) | 0 (0.0%) |
| Accommodation & Food Services | 16 (88.9%) | 2 (11.1%) |
| Public Administration | 68 (100.0%) | 0 (0.0%) |
| Total | 258 (68.2%) | 120 (31.8%) |
Education in Berryville
School Enrollment in Berryville
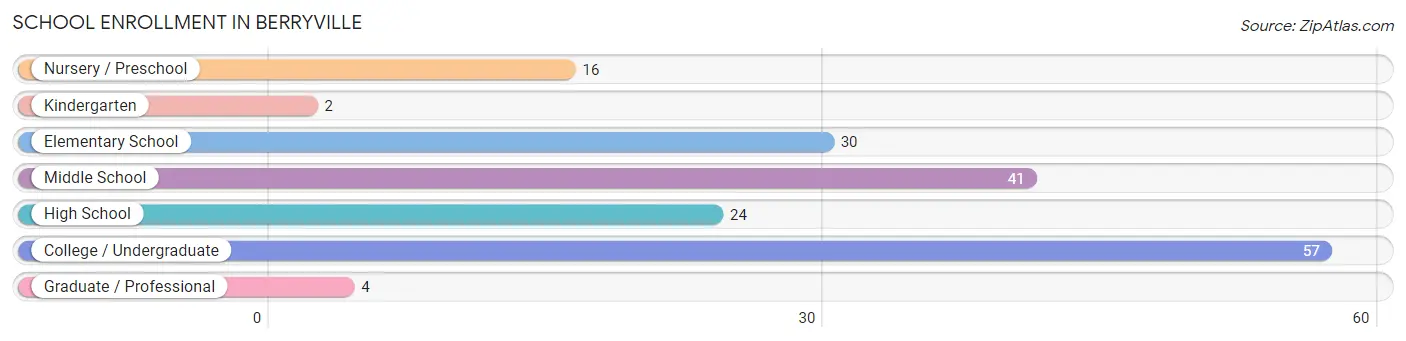
The most common levels of schooling among the 174 students in Berryville are college / undergraduate (57 | 32.8%), middle school (41 | 23.6%), and elementary school (30 | 17.2%).
| School Level | # Students | % Students |
| Nursery / Preschool | 16 | 9.2% |
| Kindergarten | 2 | 1.1% |
| Elementary School | 30 | 17.2% |
| Middle School | 41 | 23.6% |
| High School | 24 | 13.8% |
| College / Undergraduate | 57 | 32.8% |
| Graduate / Professional | 4 | 2.3% |
| Total | 174 | 100.0% |
School Enrollment by Age by Funding Source in Berryville
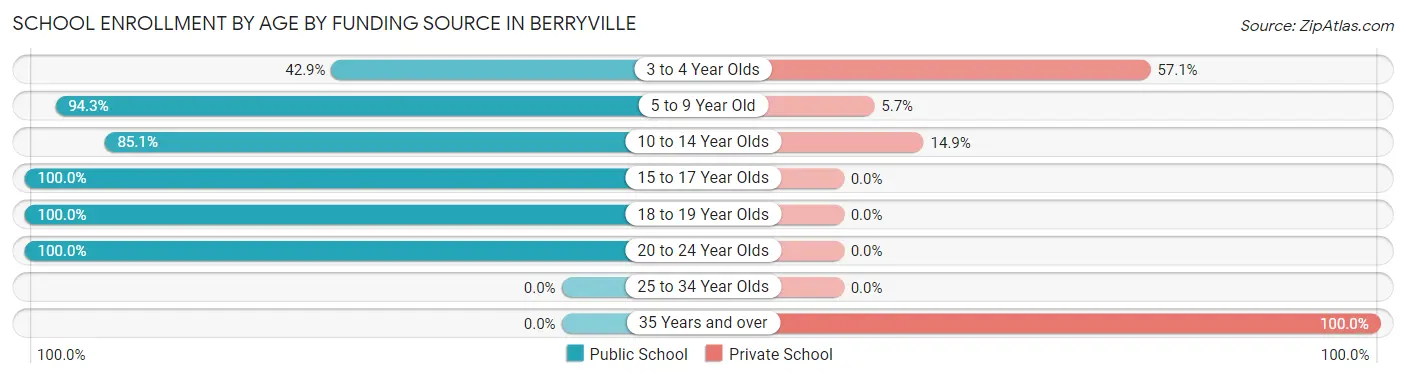
Out of a total of 174 students who are enrolled in schools in Berryville, 45 (25.9%) attend a private institution, while the remaining 129 (74.1%) are enrolled in public schools. The age group of 35 years and over has the highest likelihood of being enrolled in private schools, with 32 (100.0% in the age bracket) enrolled. Conversely, the age group of 15 to 17 year olds has the lowest likelihood of being enrolled in a private school, with 21 (100.0% in the age bracket) attending a public institution.
| Age Bracket | Public School | Private School |
| 3 to 4 Year Olds | 3 (42.9%) | 4 (57.1%) |
| 5 to 9 Year Old | 33 (94.3%) | 2 (5.7%) |
| 10 to 14 Year Olds | 40 (85.1%) | 7 (14.9%) |
| 15 to 17 Year Olds | 21 (100.0%) | 0 (0.0%) |
| 18 to 19 Year Olds | 10 (100.0%) | 0 (0.0%) |
| 20 to 24 Year Olds | 22 (100.0%) | 0 (0.0%) |
| 25 to 34 Year Olds | 0 (0.0%) | 0 (0.0%) |
| 35 Years and over | 0 (0.0%) | 32 (100.0%) |
| Total | 129 (74.1%) | 45 (25.9%) |
Educational Attainment by Field of Study in Berryville
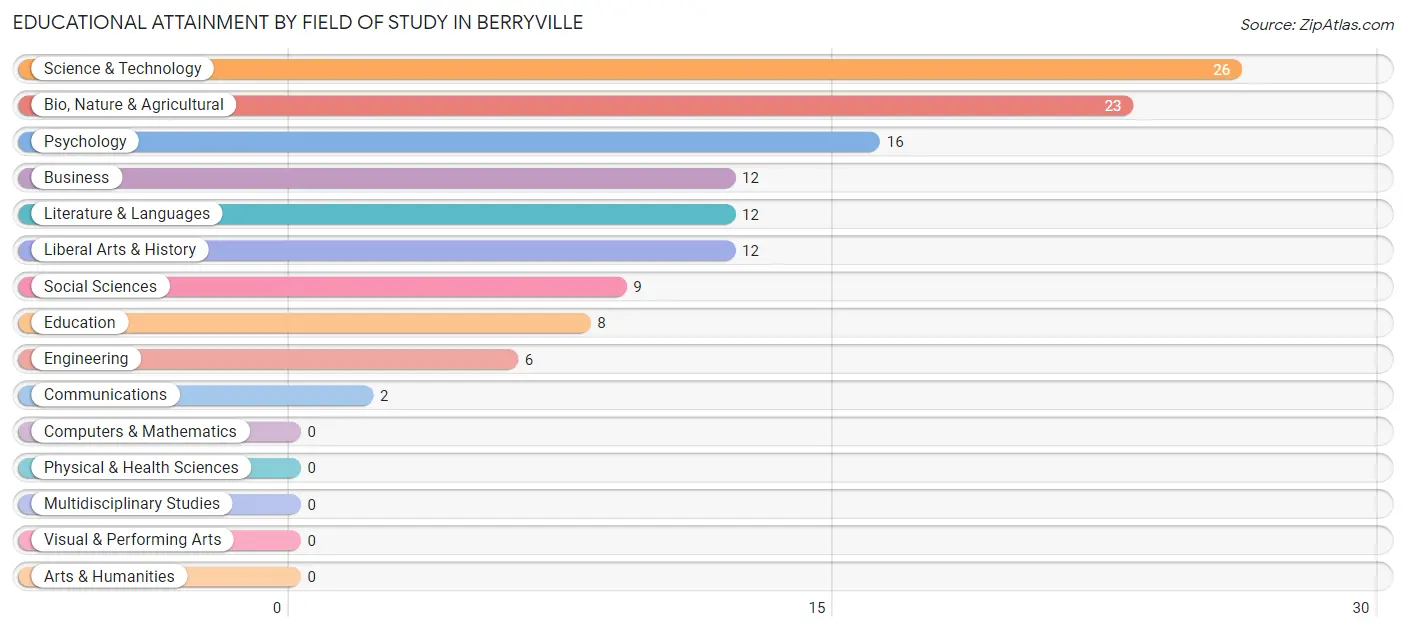
Science & technology (26 | 20.6%), bio, nature & agricultural (23 | 18.2%), psychology (16 | 12.7%), business (12 | 9.5%), and literature & languages (12 | 9.5%) are the most common fields of study among 126 individuals in Berryville who have obtained a bachelor's degree or higher.
| Field of Study | # Graduates | % Graduates |
| Computers & Mathematics | 0 | 0.0% |
| Bio, Nature & Agricultural | 23 | 18.2% |
| Physical & Health Sciences | 0 | 0.0% |
| Psychology | 16 | 12.7% |
| Social Sciences | 9 | 7.1% |
| Engineering | 6 | 4.8% |
| Multidisciplinary Studies | 0 | 0.0% |
| Science & Technology | 26 | 20.6% |
| Business | 12 | 9.5% |
| Education | 8 | 6.4% |
| Literature & Languages | 12 | 9.5% |
| Liberal Arts & History | 12 | 9.5% |
| Visual & Performing Arts | 0 | 0.0% |
| Communications | 2 | 1.6% |
| Arts & Humanities | 0 | 0.0% |
| Total | 126 | 100.0% |
Transportation & Commute in Berryville
Vehicle Availability by Sex in Berryville
The most prevalent vehicle ownership categories in Berryville are males with 2 vehicles (115, accounting for 44.6%) and females with 2 vehicles (36, making up 95.8%).
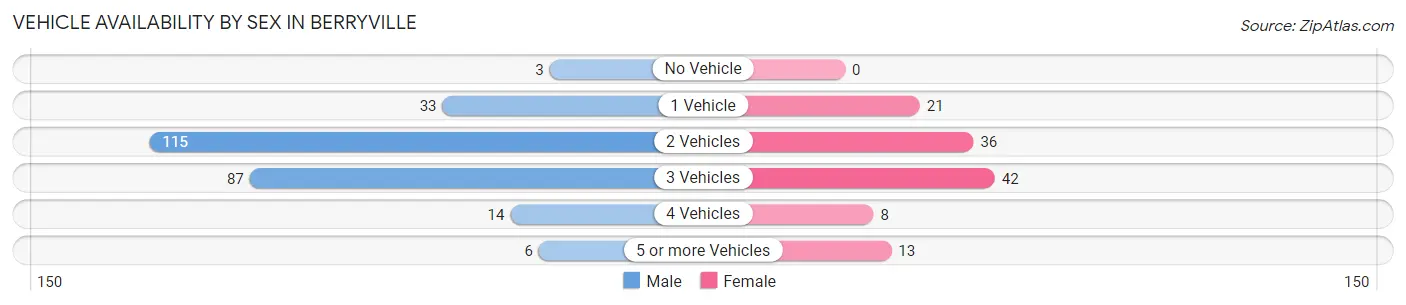
| Vehicles Available | Male | Female |
| No Vehicle | 3 (1.2%) | 0 (0.0%) |
| 1 Vehicle | 33 (12.8%) | 21 (17.5%) |
| 2 Vehicles | 115 (44.6%) | 36 (30.0%) |
| 3 Vehicles | 87 (33.7%) | 42 (35.0%) |
| 4 Vehicles | 14 (5.4%) | 8 (6.7%) |
| 5 or more Vehicles | 6 (2.3%) | 13 (10.8%) |
| Total | 258 (100.0%) | 120 (100.0%) |
Commute Time in Berryville
The most frequently occuring commute durations in Berryville are 30 to 34 minutes (100 commuters, 28.1%), 15 to 19 minutes (64 commuters, 18.0%), and 10 to 14 minutes (43 commuters, 12.1%).
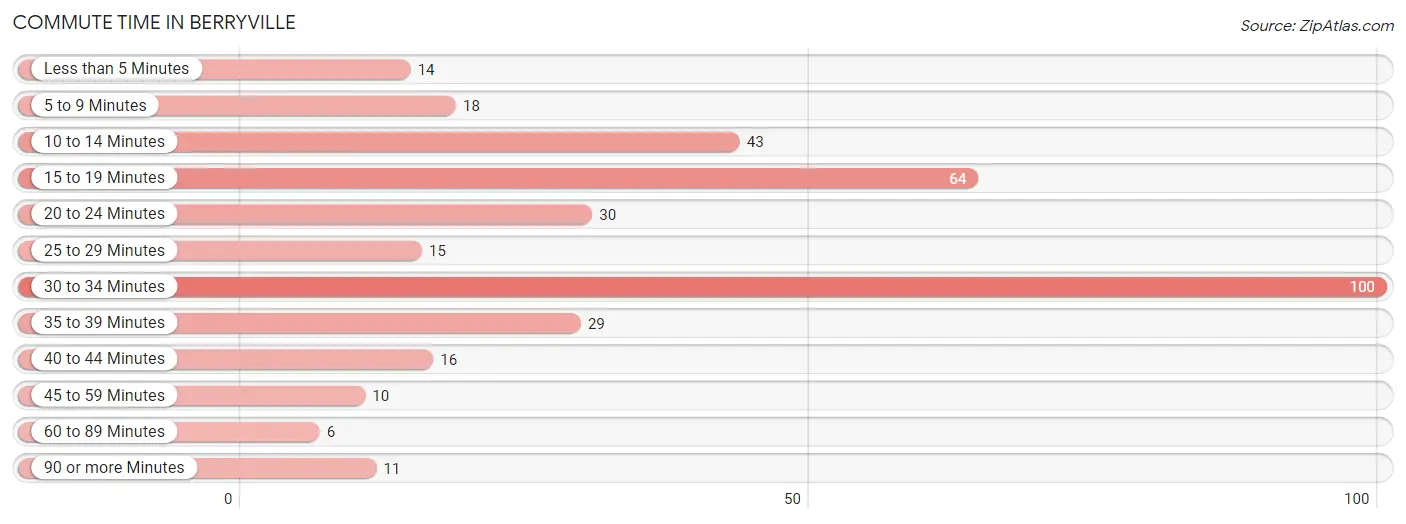
| Commute Time | # Commuters | % Commuters |
| Less than 5 Minutes | 14 | 3.9% |
| 5 to 9 Minutes | 18 | 5.1% |
| 10 to 14 Minutes | 43 | 12.1% |
| 15 to 19 Minutes | 64 | 18.0% |
| 20 to 24 Minutes | 30 | 8.4% |
| 25 to 29 Minutes | 15 | 4.2% |
| 30 to 34 Minutes | 100 | 28.1% |
| 35 to 39 Minutes | 29 | 8.2% |
| 40 to 44 Minutes | 16 | 4.5% |
| 45 to 59 Minutes | 10 | 2.8% |
| 60 to 89 Minutes | 6 | 1.7% |
| 90 or more Minutes | 11 | 3.1% |
Commute Time by Sex in Berryville
The most common commute times in Berryville are 30 to 34 minutes (97 commuters, 39.3%) for males and 10 to 14 minutes (34 commuters, 31.2%) for females.
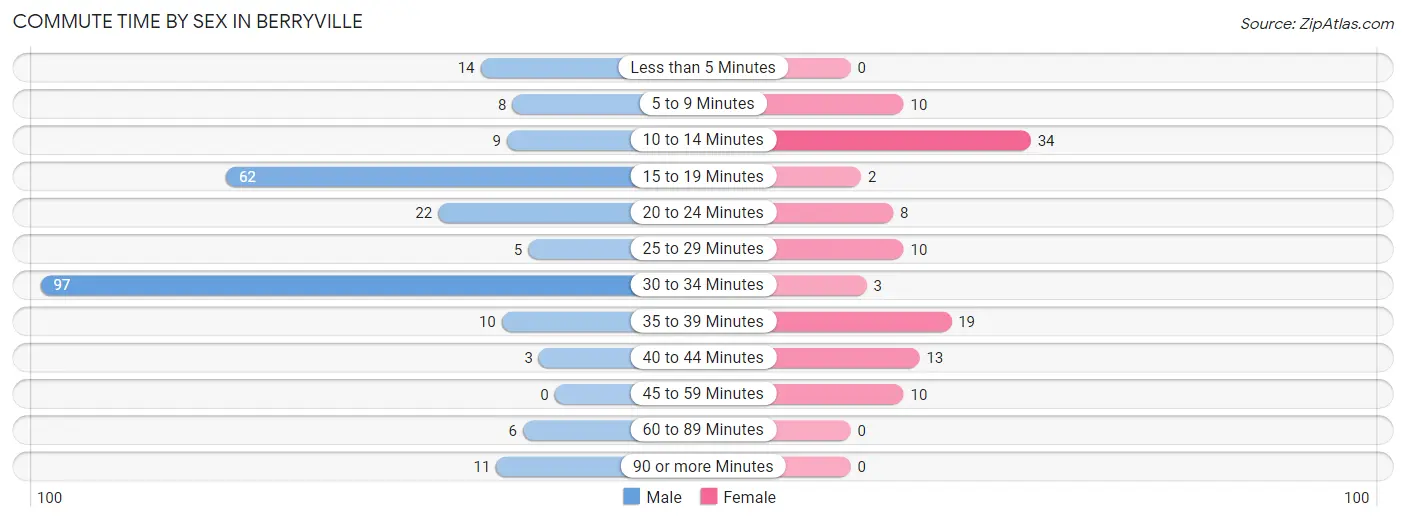
| Commute Time | Male | Female |
| Less than 5 Minutes | 14 (5.7%) | 0 (0.0%) |
| 5 to 9 Minutes | 8 (3.2%) | 10 (9.2%) |
| 10 to 14 Minutes | 9 (3.6%) | 34 (31.2%) |
| 15 to 19 Minutes | 62 (25.1%) | 2 (1.8%) |
| 20 to 24 Minutes | 22 (8.9%) | 8 (7.3%) |
| 25 to 29 Minutes | 5 (2.0%) | 10 (9.2%) |
| 30 to 34 Minutes | 97 (39.3%) | 3 (2.8%) |
| 35 to 39 Minutes | 10 (4.1%) | 19 (17.4%) |
| 40 to 44 Minutes | 3 (1.2%) | 13 (11.9%) |
| 45 to 59 Minutes | 0 (0.0%) | 10 (9.2%) |
| 60 to 89 Minutes | 6 (2.4%) | 0 (0.0%) |
| 90 or more Minutes | 11 (4.4%) | 0 (0.0%) |
Time of Departure to Work by Sex in Berryville
The most frequent times of departure to work in Berryville are 8:00 AM to 8:29 AM (83, 33.6%) for males and 7:00 AM to 7:29 AM (55, 50.5%) for females.
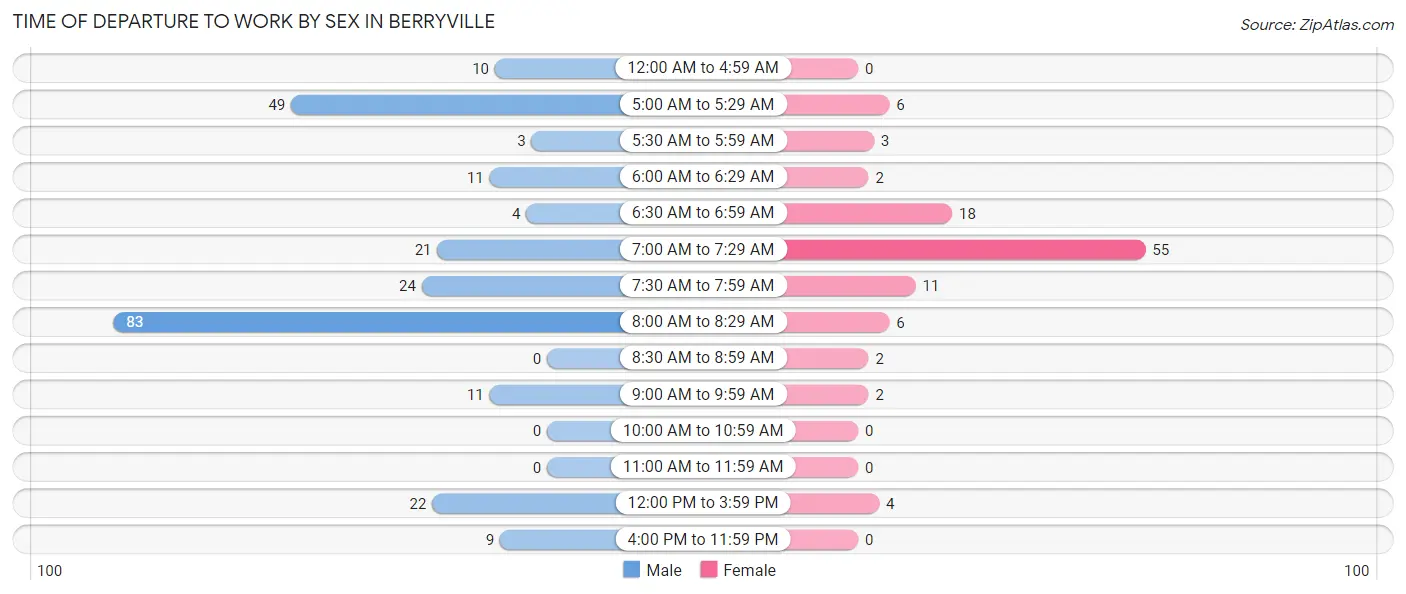
| Time of Departure | Male | Female |
| 12:00 AM to 4:59 AM | 10 (4.1%) | 0 (0.0%) |
| 5:00 AM to 5:29 AM | 49 (19.8%) | 6 (5.5%) |
| 5:30 AM to 5:59 AM | 3 (1.2%) | 3 (2.8%) |
| 6:00 AM to 6:29 AM | 11 (4.4%) | 2 (1.8%) |
| 6:30 AM to 6:59 AM | 4 (1.6%) | 18 (16.5%) |
| 7:00 AM to 7:29 AM | 21 (8.5%) | 55 (50.5%) |
| 7:30 AM to 7:59 AM | 24 (9.7%) | 11 (10.1%) |
| 8:00 AM to 8:29 AM | 83 (33.6%) | 6 (5.5%) |
| 8:30 AM to 8:59 AM | 0 (0.0%) | 2 (1.8%) |
| 9:00 AM to 9:59 AM | 11 (4.4%) | 2 (1.8%) |
| 10:00 AM to 10:59 AM | 0 (0.0%) | 0 (0.0%) |
| 11:00 AM to 11:59 AM | 0 (0.0%) | 0 (0.0%) |
| 12:00 PM to 3:59 PM | 22 (8.9%) | 4 (3.7%) |
| 4:00 PM to 11:59 PM | 9 (3.6%) | 0 (0.0%) |
| Total | 247 (100.0%) | 109 (100.0%) |
Housing Occupancy in Berryville
Occupancy by Ownership in Berryville
Of the total 467 dwellings in Berryville, owner-occupied units account for 426 (91.2%), while renter-occupied units make up 41 (8.8%).
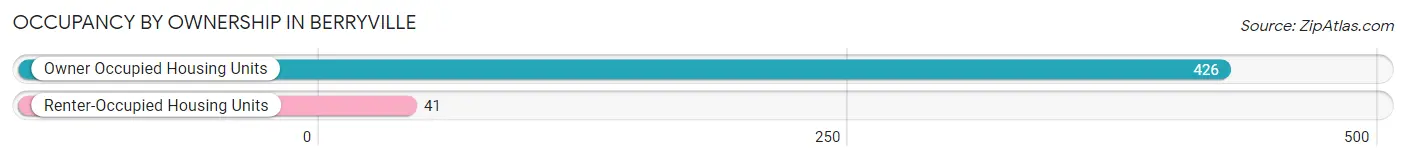
| Occupancy | # Housing Units | % Housing Units |
| Owner Occupied Housing Units | 426 | 91.2% |
| Renter-Occupied Housing Units | 41 | 8.8% |
| Total Occupied Housing Units | 467 | 100.0% |
Occupancy by Household Size in Berryville
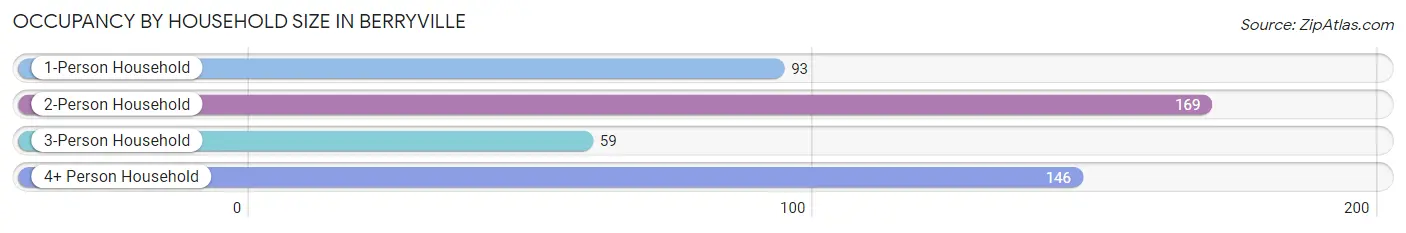
| Household Size | # Housing Units | % Housing Units |
| 1-Person Household | 93 | 19.9% |
| 2-Person Household | 169 | 36.2% |
| 3-Person Household | 59 | 12.6% |
| 4+ Person Household | 146 | 31.3% |
| Total Housing Units | 467 | 100.0% |
Occupancy by Ownership by Household Size in Berryville
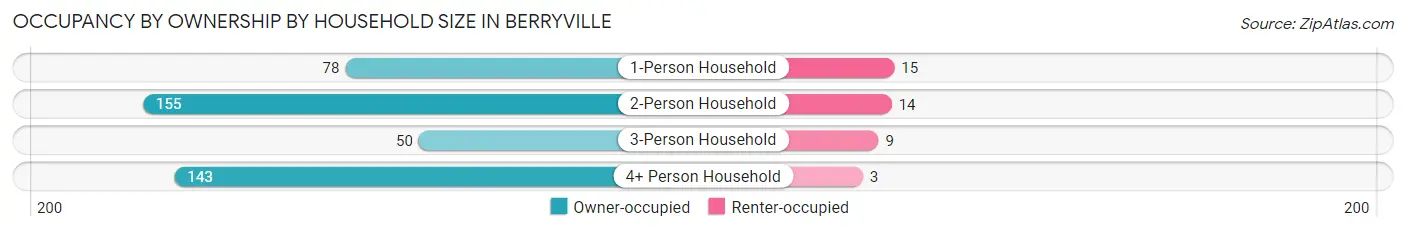
| Household Size | Owner-occupied | Renter-occupied |
| 1-Person Household | 78 (83.9%) | 15 (16.1%) |
| 2-Person Household | 155 (91.7%) | 14 (8.3%) |
| 3-Person Household | 50 (84.8%) | 9 (15.2%) |
| 4+ Person Household | 143 (98.0%) | 3 (2.1%) |
| Total Housing Units | 426 (91.2%) | 41 (8.8%) |
Occupancy by Educational Attainment in Berryville
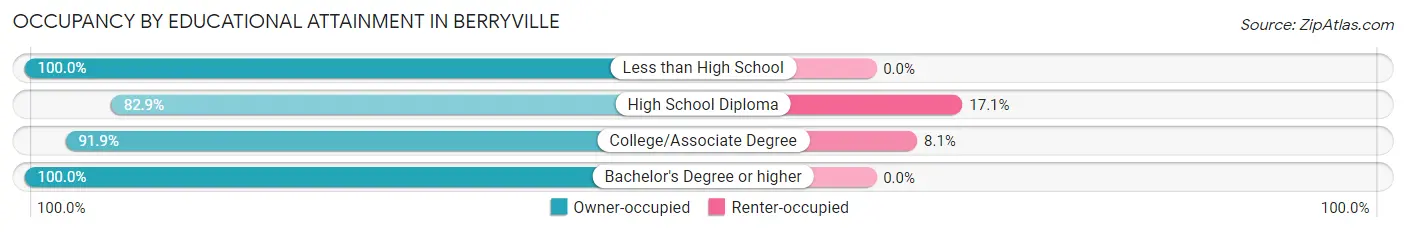
| Household Size | Owner-occupied | Renter-occupied |
| Less than High School | 20 (100.0%) | 0 (0.0%) |
| High School Diploma | 97 (82.9%) | 20 (17.1%) |
| College/Associate Degree | 238 (91.9%) | 21 (8.1%) |
| Bachelor's Degree or higher | 71 (100.0%) | 0 (0.0%) |
Occupancy by Age of Householder in Berryville
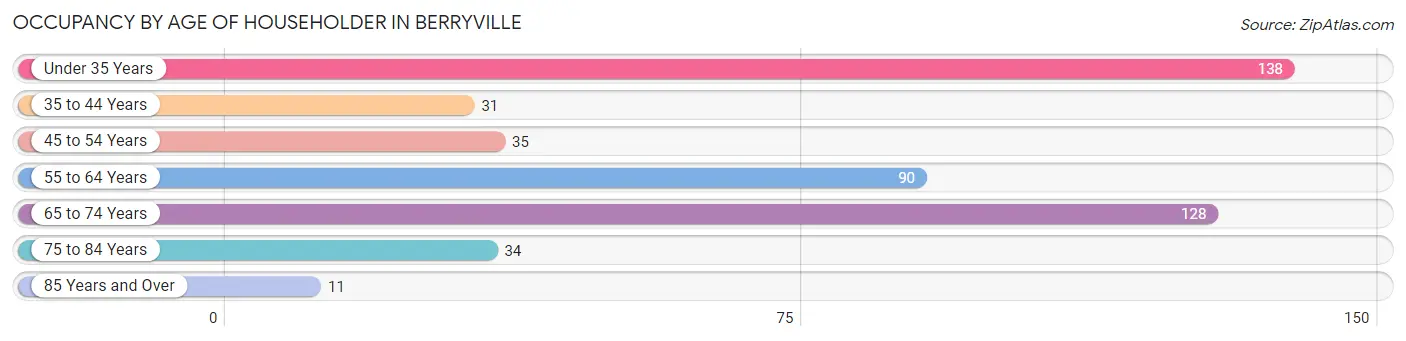
| Age Bracket | # Households | % Households |
| Under 35 Years | 138 | 29.5% |
| 35 to 44 Years | 31 | 6.6% |
| 45 to 54 Years | 35 | 7.5% |
| 55 to 64 Years | 90 | 19.3% |
| 65 to 74 Years | 128 | 27.4% |
| 75 to 84 Years | 34 | 7.3% |
| 85 Years and Over | 11 | 2.4% |
| Total | 467 | 100.0% |
Housing Finances in Berryville
Median Income by Occupancy in Berryville
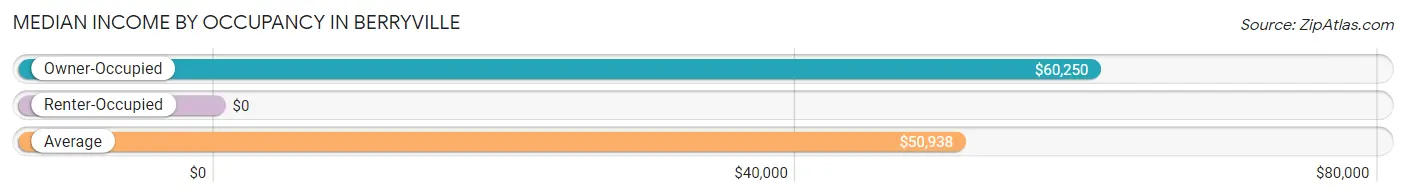
| Occupancy Type | # Households | Median Income |
| Owner-Occupied | 426 (91.2%) | $60,250 |
| Renter-Occupied | 41 (8.8%) | $0 |
| Average | 467 (100.0%) | $50,938 |
Occupancy by Householder Income Bracket in Berryville
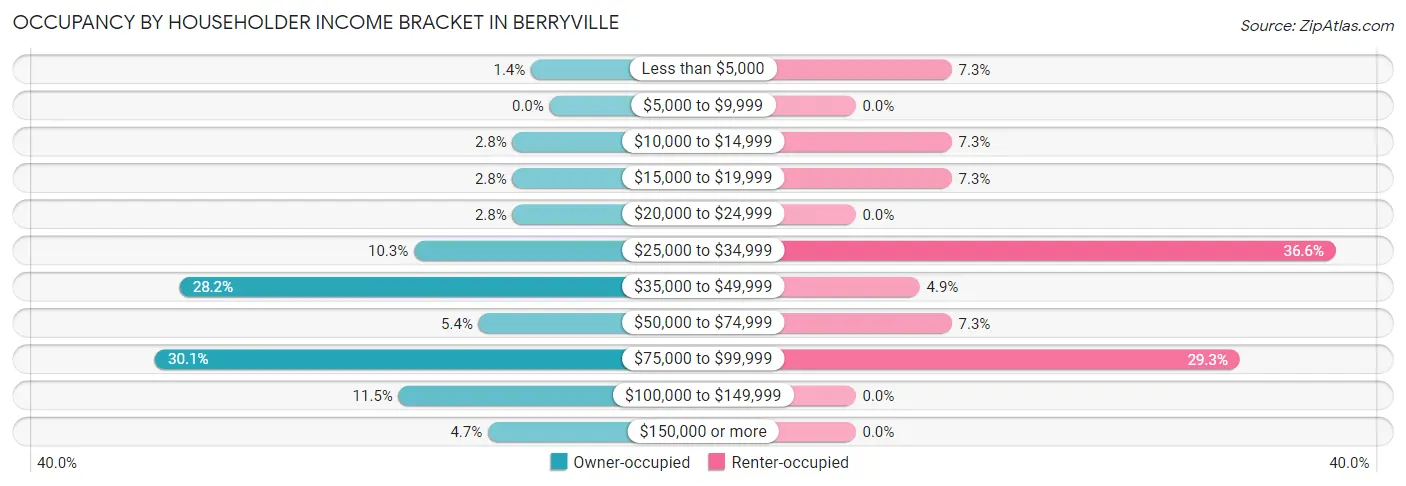
| Income Bracket | Owner-occupied | Renter-occupied |
| Less than $5,000 | 6 (1.4%) | 3 (7.3%) |
| $5,000 to $9,999 | 0 (0.0%) | 0 (0.0%) |
| $10,000 to $14,999 | 12 (2.8%) | 3 (7.3%) |
| $15,000 to $19,999 | 12 (2.8%) | 3 (7.3%) |
| $20,000 to $24,999 | 12 (2.8%) | 0 (0.0%) |
| $25,000 to $34,999 | 44 (10.3%) | 15 (36.6%) |
| $35,000 to $49,999 | 120 (28.2%) | 2 (4.9%) |
| $50,000 to $74,999 | 23 (5.4%) | 3 (7.3%) |
| $75,000 to $99,999 | 128 (30.0%) | 12 (29.3%) |
| $100,000 to $149,999 | 49 (11.5%) | 0 (0.0%) |
| $150,000 or more | 20 (4.7%) | 0 (0.0%) |
| Total | 426 (100.0%) | 41 (100.0%) |
Monthly Housing Cost Tiers in Berryville
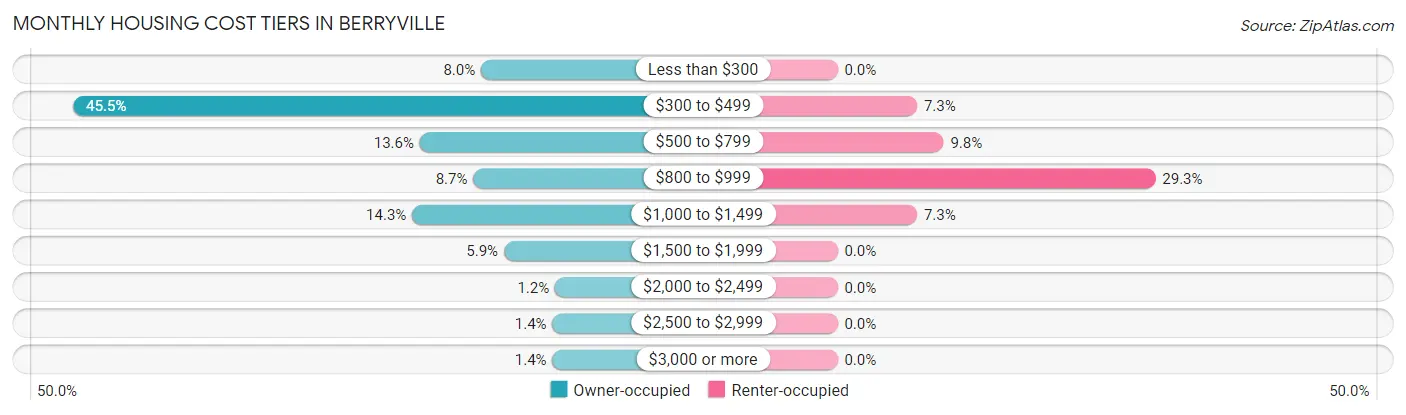
| Monthly Cost | Owner-occupied | Renter-occupied |
| Less than $300 | 34 (8.0%) | 0 (0.0%) |
| $300 to $499 | 194 (45.5%) | 3 (7.3%) |
| $500 to $799 | 58 (13.6%) | 4 (9.8%) |
| $800 to $999 | 37 (8.7%) | 12 (29.3%) |
| $1,000 to $1,499 | 61 (14.3%) | 3 (7.3%) |
| $1,500 to $1,999 | 25 (5.9%) | 0 (0.0%) |
| $2,000 to $2,499 | 5 (1.2%) | 0 (0.0%) |
| $2,500 to $2,999 | 6 (1.4%) | 0 (0.0%) |
| $3,000 or more | 6 (1.4%) | 0 (0.0%) |
| Total | 426 (100.0%) | 41 (100.0%) |
Physical Housing Characteristics in Berryville
Housing Structures in Berryville
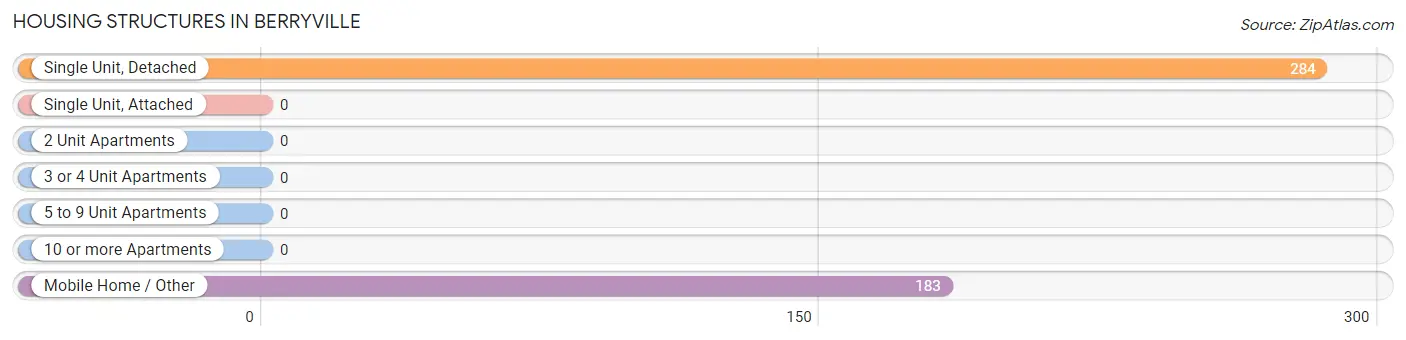
| Structure Type | # Housing Units | % Housing Units |
| Single Unit, Detached | 284 | 60.8% |
| Single Unit, Attached | 0 | 0.0% |
| 2 Unit Apartments | 0 | 0.0% |
| 3 or 4 Unit Apartments | 0 | 0.0% |
| 5 to 9 Unit Apartments | 0 | 0.0% |
| 10 or more Apartments | 0 | 0.0% |
| Mobile Home / Other | 183 | 39.2% |
| Total | 467 | 100.0% |
Housing Structures by Occupancy in Berryville
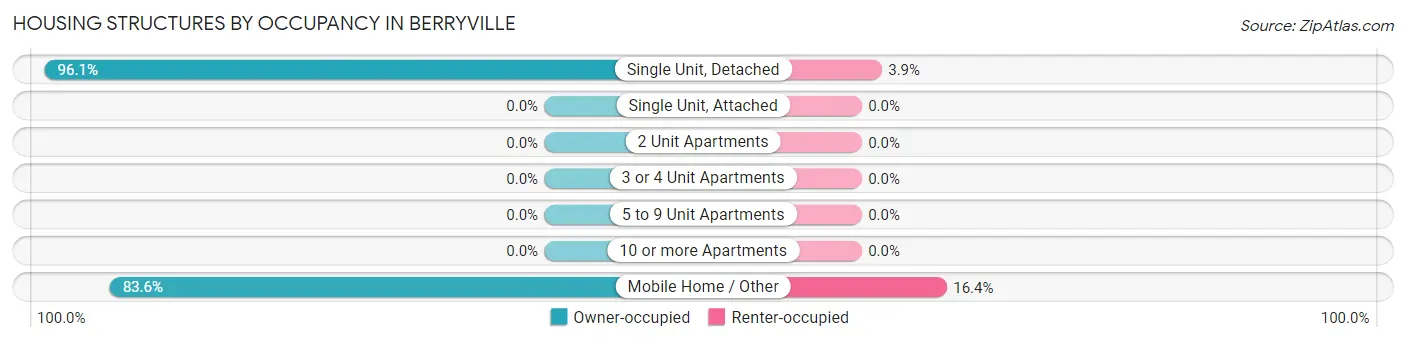
| Structure Type | Owner-occupied | Renter-occupied |
| Single Unit, Detached | 273 (96.1%) | 11 (3.9%) |
| Single Unit, Attached | 0 (0.0%) | 0 (0.0%) |
| 2 Unit Apartments | 0 (0.0%) | 0 (0.0%) |
| 3 or 4 Unit Apartments | 0 (0.0%) | 0 (0.0%) |
| 5 to 9 Unit Apartments | 0 (0.0%) | 0 (0.0%) |
| 10 or more Apartments | 0 (0.0%) | 0 (0.0%) |
| Mobile Home / Other | 153 (83.6%) | 30 (16.4%) |
| Total | 426 (91.2%) | 41 (8.8%) |
Housing Structures by Number of Rooms in Berryville
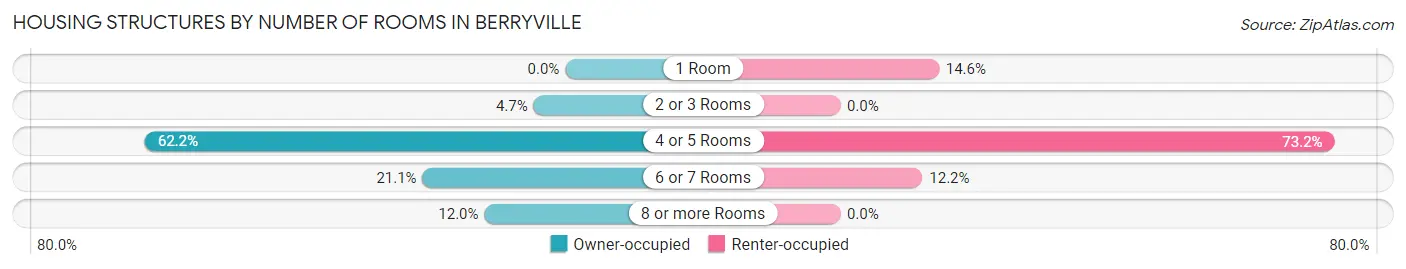
| Number of Rooms | Owner-occupied | Renter-occupied |
| 1 Room | 0 (0.0%) | 6 (14.6%) |
| 2 or 3 Rooms | 20 (4.7%) | 0 (0.0%) |
| 4 or 5 Rooms | 265 (62.2%) | 30 (73.2%) |
| 6 or 7 Rooms | 90 (21.1%) | 5 (12.2%) |
| 8 or more Rooms | 51 (12.0%) | 0 (0.0%) |
| Total | 426 (100.0%) | 41 (100.0%) |
Housing Structure by Heating Type in Berryville
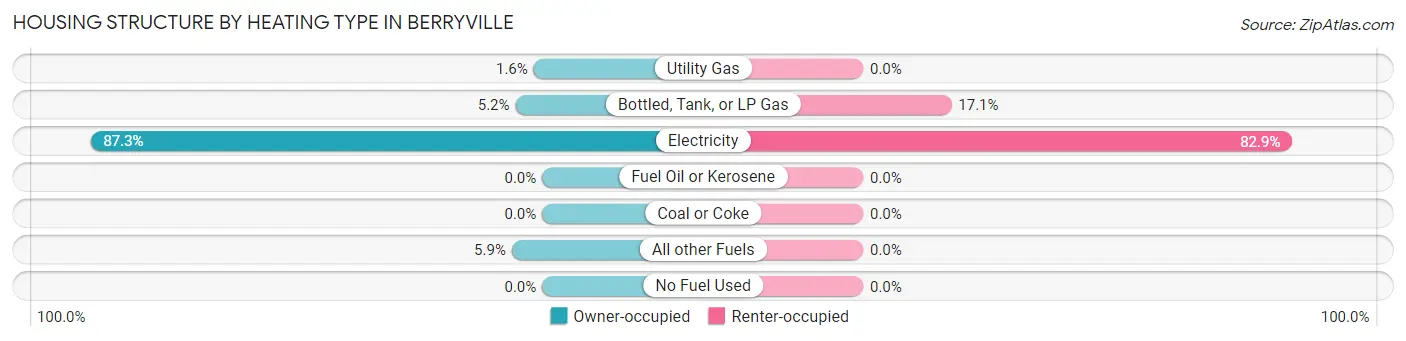
| Heating Type | Owner-occupied | Renter-occupied |
| Utility Gas | 7 (1.6%) | 0 (0.0%) |
| Bottled, Tank, or LP Gas | 22 (5.2%) | 7 (17.1%) |
| Electricity | 372 (87.3%) | 34 (82.9%) |
| Fuel Oil or Kerosene | 0 (0.0%) | 0 (0.0%) |
| Coal or Coke | 0 (0.0%) | 0 (0.0%) |
| All other Fuels | 25 (5.9%) | 0 (0.0%) |
| No Fuel Used | 0 (0.0%) | 0 (0.0%) |
| Total | 426 (100.0%) | 41 (100.0%) |
Household Vehicle Usage in Berryville
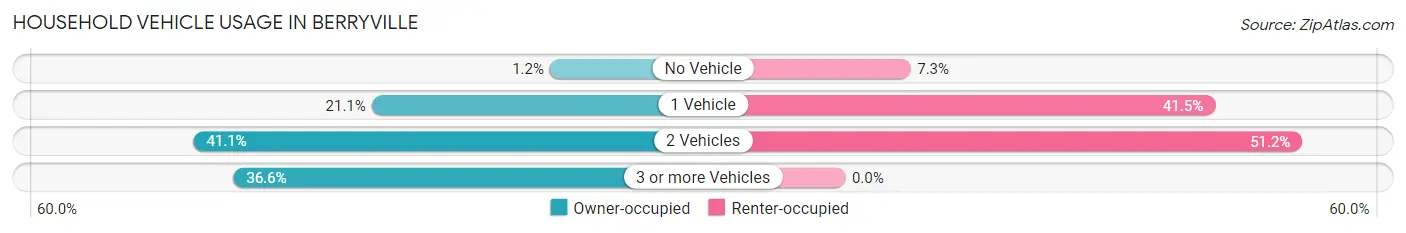
| Vehicles per Household | Owner-occupied | Renter-occupied |
| No Vehicle | 5 (1.2%) | 3 (7.3%) |
| 1 Vehicle | 90 (21.1%) | 17 (41.5%) |
| 2 Vehicles | 175 (41.1%) | 21 (51.2%) |
| 3 or more Vehicles | 156 (36.6%) | 0 (0.0%) |
| Total | 426 (100.0%) | 41 (100.0%) |
Real Estate & Mortgages in Berryville
Real Estate and Mortgage Overview in Berryville
| Characteristic | Without Mortgage | With Mortgage |
| Housing Units | 300 | 126 |
| Median Property Value | $97,500 | $208,300 |
| Median Household Income | $49,519 | $14 |
| Monthly Housing Costs | $457 | $6 |
| Real Estate Taxes | $876 | $0 |
Property Value by Mortgage Status in Berryville
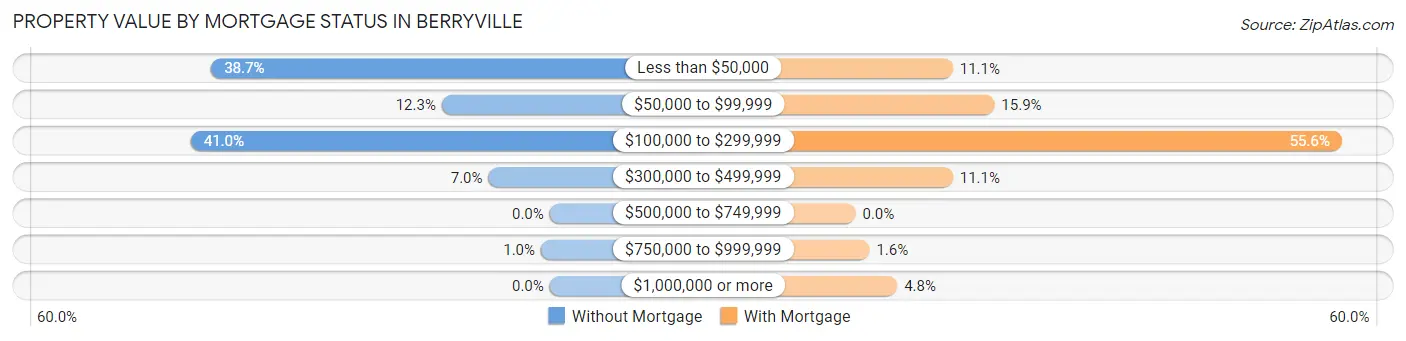
| Property Value | Without Mortgage | With Mortgage |
| Less than $50,000 | 116 (38.7%) | 14 (11.1%) |
| $50,000 to $99,999 | 37 (12.3%) | 20 (15.9%) |
| $100,000 to $299,999 | 123 (41.0%) | 70 (55.6%) |
| $300,000 to $499,999 | 21 (7.0%) | 14 (11.1%) |
| $500,000 to $749,999 | 0 (0.0%) | 0 (0.0%) |
| $750,000 to $999,999 | 3 (1.0%) | 2 (1.6%) |
| $1,000,000 or more | 0 (0.0%) | 6 (4.8%) |
| Total | 300 (100.0%) | 126 (100.0%) |
Household Income by Mortgage Status in Berryville
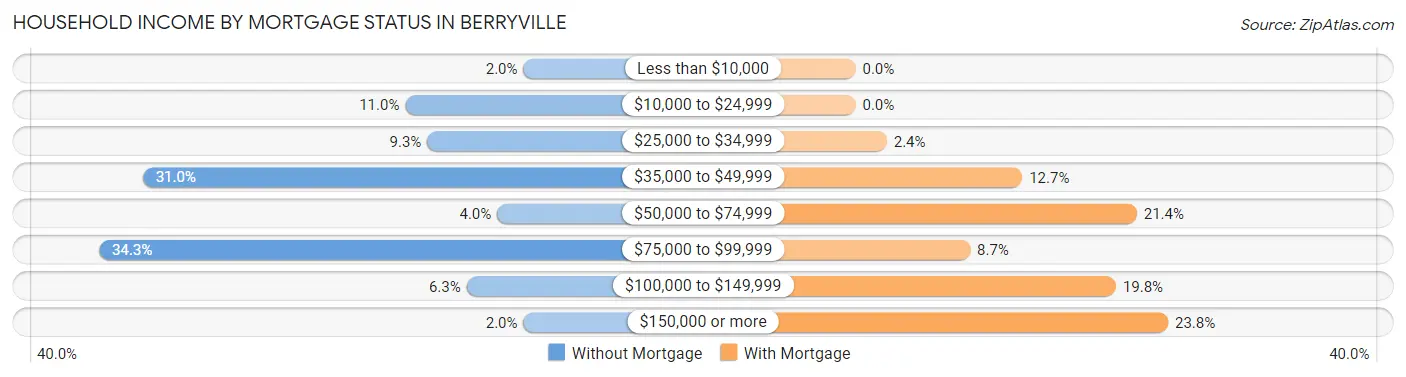
| Household Income | Without Mortgage | With Mortgage |
| Less than $10,000 | 6 (2.0%) | 0 (0.0%) |
| $10,000 to $24,999 | 33 (11.0%) | 0 (0.0%) |
| $25,000 to $34,999 | 28 (9.3%) | 3 (2.4%) |
| $35,000 to $49,999 | 93 (31.0%) | 16 (12.7%) |
| $50,000 to $74,999 | 12 (4.0%) | 27 (21.4%) |
| $75,000 to $99,999 | 103 (34.3%) | 11 (8.7%) |
| $100,000 to $149,999 | 19 (6.3%) | 25 (19.8%) |
| $150,000 or more | 6 (2.0%) | 30 (23.8%) |
| Total | 300 (100.0%) | 126 (100.0%) |
Property Value to Household Income Ratio in Berryville
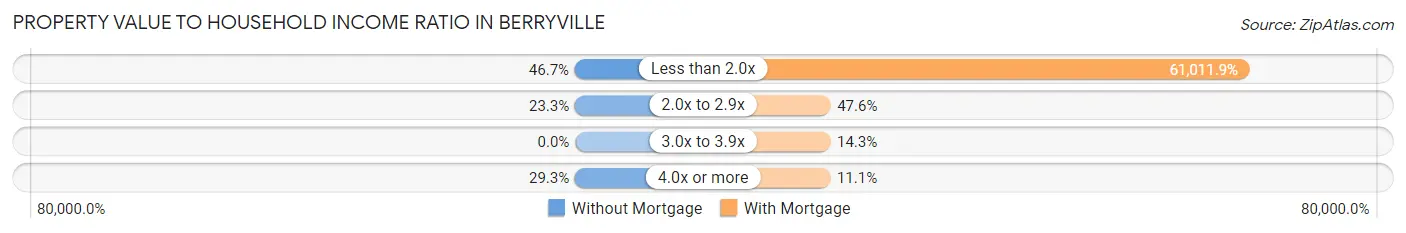
| Value-to-Income Ratio | Without Mortgage | With Mortgage |
| Less than 2.0x | 140 (46.7%) | 76,875 (61,011.9%) |
| 2.0x to 2.9x | 70 (23.3%) | 60 (47.6%) |
| 3.0x to 3.9x | 0 (0.0%) | 18 (14.3%) |
| 4.0x or more | 88 (29.3%) | 14 (11.1%) |
| Total | 300 (100.0%) | 126 (100.0%) |
Real Estate Taxes by Mortgage Status in Berryville
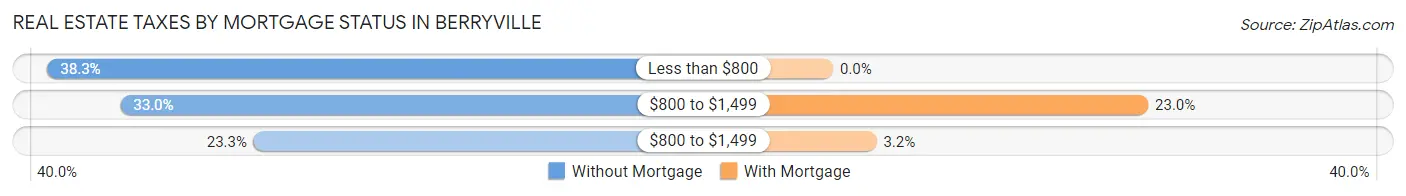
| Property Taxes | Without Mortgage | With Mortgage |
| Less than $800 | 115 (38.3%) | 0 (0.0%) |
| $800 to $1,499 | 99 (33.0%) | 29 (23.0%) |
| $800 to $1,499 | 70 (23.3%) | 4 (3.2%) |
| Total | 300 (100.0%) | 126 (100.0%) |
Health & Disability in Berryville
Health Insurance Coverage by Age in Berryville
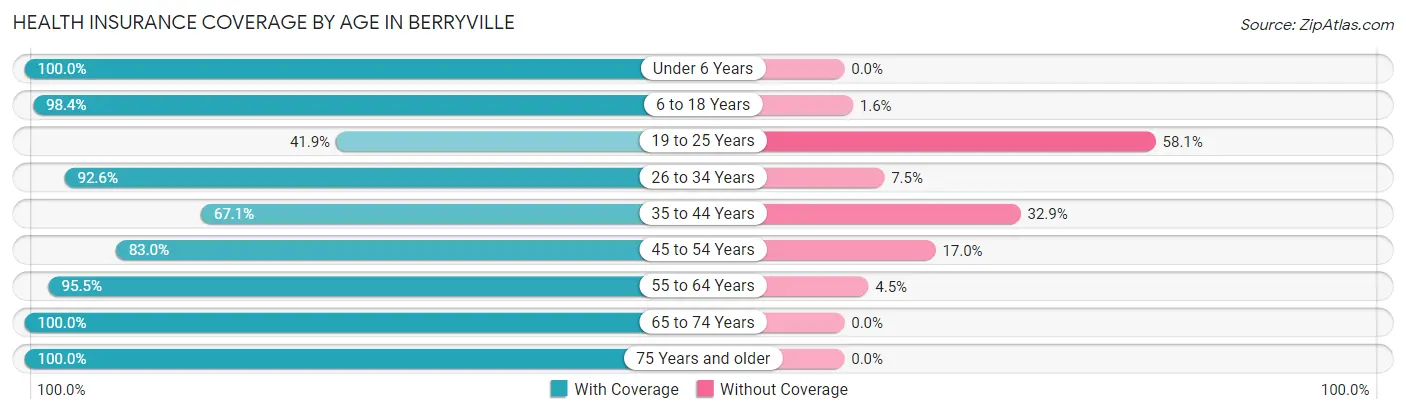
| Age Bracket | With Coverage | Without Coverage |
| Under 6 Years | 79 (100.0%) | 0 (0.0%) |
| 6 to 18 Years | 186 (98.4%) | 3 (1.6%) |
| 19 to 25 Years | 26 (41.9%) | 36 (58.1%) |
| 26 to 34 Years | 149 (92.5%) | 12 (7.4%) |
| 35 to 44 Years | 94 (67.1%) | 46 (32.9%) |
| 45 to 54 Years | 83 (83.0%) | 17 (17.0%) |
| 55 to 64 Years | 128 (95.5%) | 6 (4.5%) |
| 65 to 74 Years | 209 (100.0%) | 0 (0.0%) |
| 75 Years and older | 95 (100.0%) | 0 (0.0%) |
| Total | 1,049 (89.7%) | 120 (10.3%) |
Health Insurance Coverage by Citizenship Status in Berryville
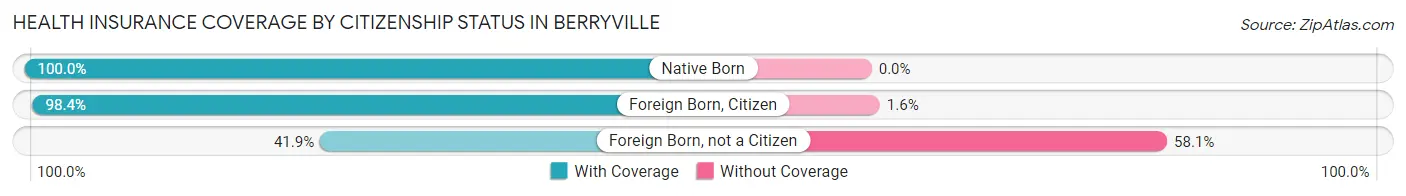
| Citizenship Status | With Coverage | Without Coverage |
| Native Born | 79 (100.0%) | 0 (0.0%) |
| Foreign Born, Citizen | 186 (98.4%) | 3 (1.6%) |
| Foreign Born, not a Citizen | 26 (41.9%) | 36 (58.1%) |
Health Insurance Coverage by Household Income in Berryville
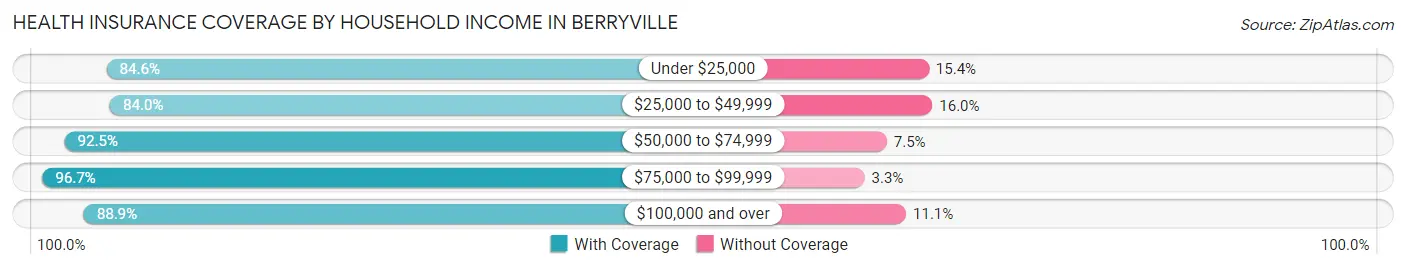
| Household Income | With Coverage | Without Coverage |
| Under $25,000 | 55 (84.6%) | 10 (15.4%) |
| $25,000 to $49,999 | 309 (84.0%) | 59 (16.0%) |
| $50,000 to $74,999 | 74 (92.5%) | 6 (7.5%) |
| $75,000 to $99,999 | 347 (96.7%) | 12 (3.3%) |
| $100,000 and over | 264 (88.9%) | 33 (11.1%) |
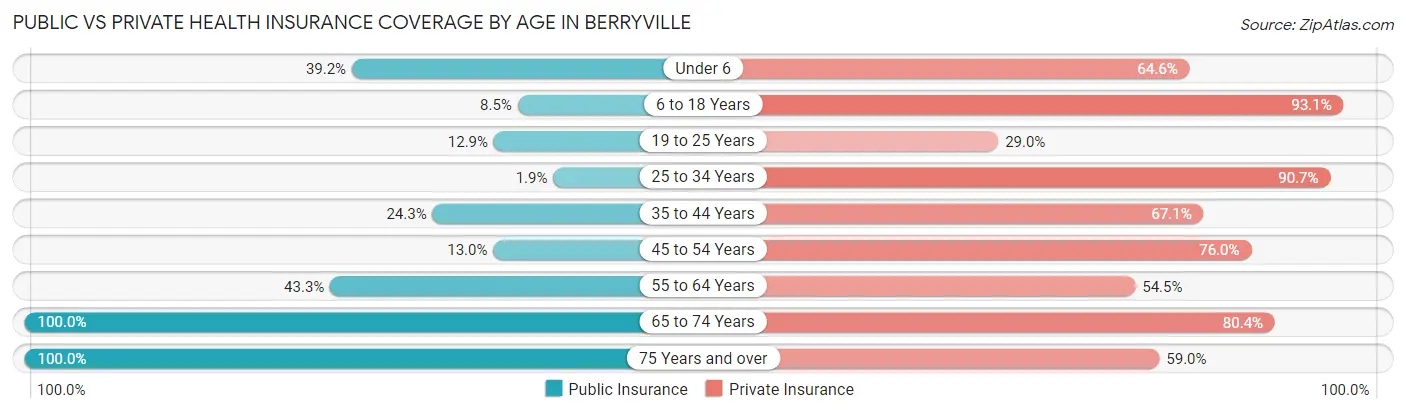
Public vs Private Health Insurance Coverage by Age in Berryville
| Age Bracket | Public Insurance | Private Insurance |
| Under 6 | 31 (39.2%) | 51 (64.6%) |
| 6 to 18 Years | 16 (8.5%) | 176 (93.1%) |
| 19 to 25 Years | 8 (12.9%) | 18 (29.0%) |
| 25 to 34 Years | 3 (1.9%) | 146 (90.7%) |
| 35 to 44 Years | 34 (24.3%) | 94 (67.1%) |
| 45 to 54 Years | 13 (13.0%) | 76 (76.0%) |
| 55 to 64 Years | 58 (43.3%) | 73 (54.5%) |
| 65 to 74 Years | 209 (100.0%) | 168 (80.4%) |
| 75 Years and over | 95 (100.0%) | 56 (59.0%) |
| Total | 467 (40.0%) | 858 (73.4%) |
Disability Status by Sex by Age in Berryville
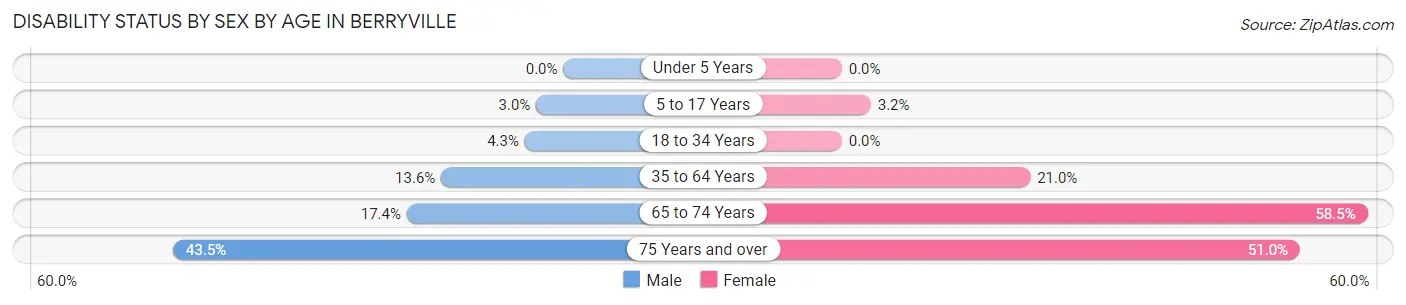
| Age Bracket | Male | Female |
| Under 5 Years | 0 (0.0%) | 0 (0.0%) |
| 5 to 17 Years | 3 (3.0%) | 3 (3.2%) |
| 18 to 34 Years | 3 (4.3%) | 0 (0.0%) |
| 35 to 64 Years | 23 (13.6%) | 43 (21.0%) |
| 65 to 74 Years | 15 (17.4%) | 72 (58.5%) |
| 75 Years and over | 20 (43.5%) | 25 (51.0%) |
Disability Class by Sex by Age in Berryville
Disability Class: Hearing Difficulty
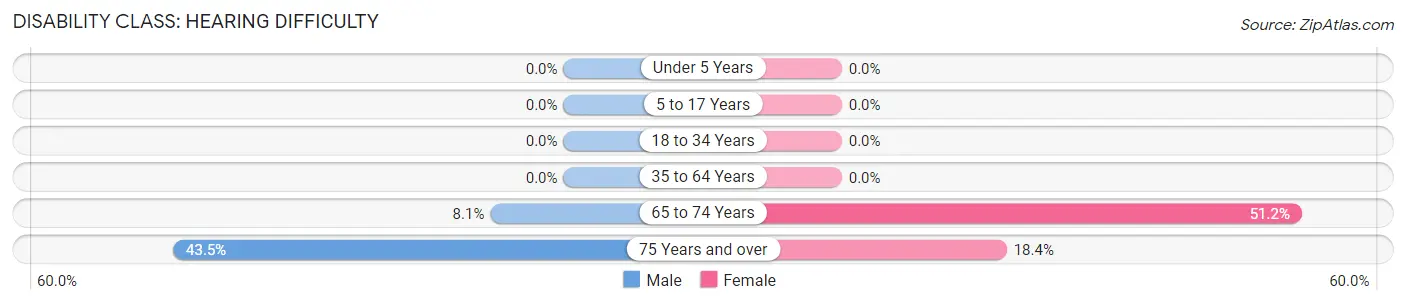
| Age Bracket | Male | Female |
| Under 5 Years | 0 (0.0%) | 0 (0.0%) |
| 5 to 17 Years | 0 (0.0%) | 0 (0.0%) |
| 18 to 34 Years | 0 (0.0%) | 0 (0.0%) |
| 35 to 64 Years | 0 (0.0%) | 0 (0.0%) |
| 65 to 74 Years | 7 (8.1%) | 63 (51.2%) |
| 75 Years and over | 20 (43.5%) | 9 (18.4%) |
Disability Class: Vision Difficulty
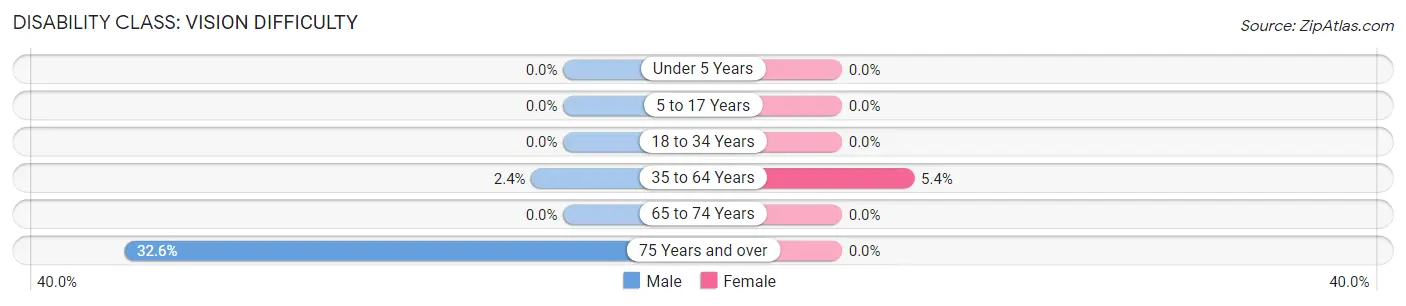
| Age Bracket | Male | Female |
| Under 5 Years | 0 (0.0%) | 0 (0.0%) |
| 5 to 17 Years | 0 (0.0%) | 0 (0.0%) |
| 18 to 34 Years | 0 (0.0%) | 0 (0.0%) |
| 35 to 64 Years | 4 (2.4%) | 11 (5.4%) |
| 65 to 74 Years | 0 (0.0%) | 0 (0.0%) |
| 75 Years and over | 15 (32.6%) | 0 (0.0%) |
Disability Class: Cognitive Difficulty
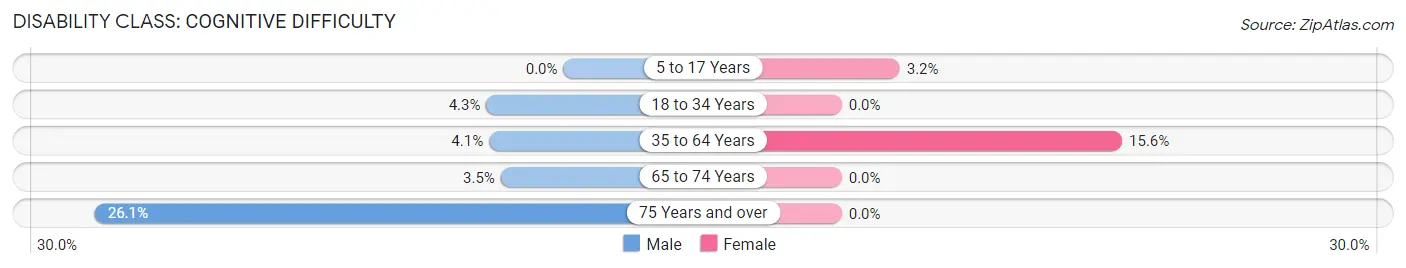
| Age Bracket | Male | Female |
| 5 to 17 Years | 0 (0.0%) | 3 (3.2%) |
| 18 to 34 Years | 3 (4.3%) | 0 (0.0%) |
| 35 to 64 Years | 7 (4.1%) | 32 (15.6%) |
| 65 to 74 Years | 3 (3.5%) | 0 (0.0%) |
| 75 Years and over | 12 (26.1%) | 0 (0.0%) |
Disability Class: Ambulatory Difficulty
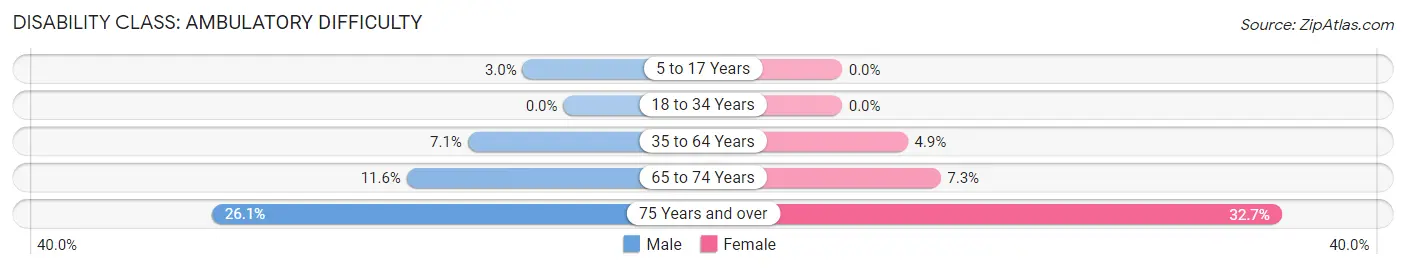
| Age Bracket | Male | Female |
| 5 to 17 Years | 3 (3.0%) | 0 (0.0%) |
| 18 to 34 Years | 0 (0.0%) | 0 (0.0%) |
| 35 to 64 Years | 12 (7.1%) | 10 (4.9%) |
| 65 to 74 Years | 10 (11.6%) | 9 (7.3%) |
| 75 Years and over | 12 (26.1%) | 16 (32.7%) |
Disability Class: Self-Care Difficulty
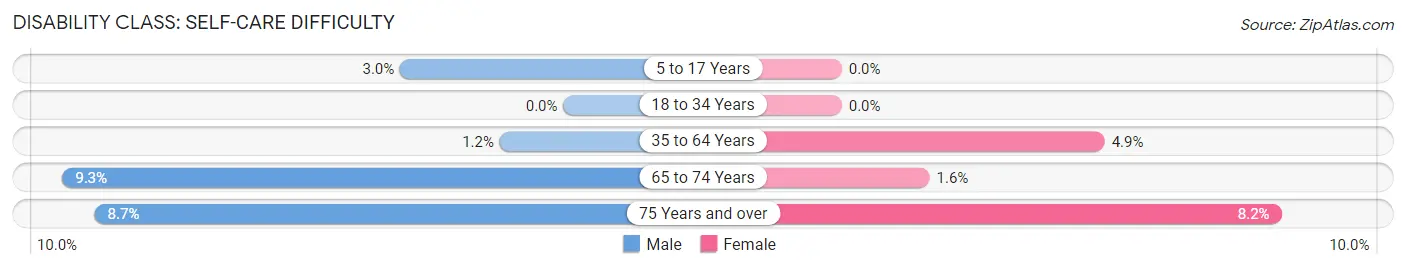
| Age Bracket | Male | Female |
| 5 to 17 Years | 3 (3.0%) | 0 (0.0%) |
| 18 to 34 Years | 0 (0.0%) | 0 (0.0%) |
| 35 to 64 Years | 2 (1.2%) | 10 (4.9%) |
| 65 to 74 Years | 8 (9.3%) | 2 (1.6%) |
| 75 Years and over | 4 (8.7%) | 4 (8.2%) |
Technology Access in Berryville
Computing Device Access in Berryville
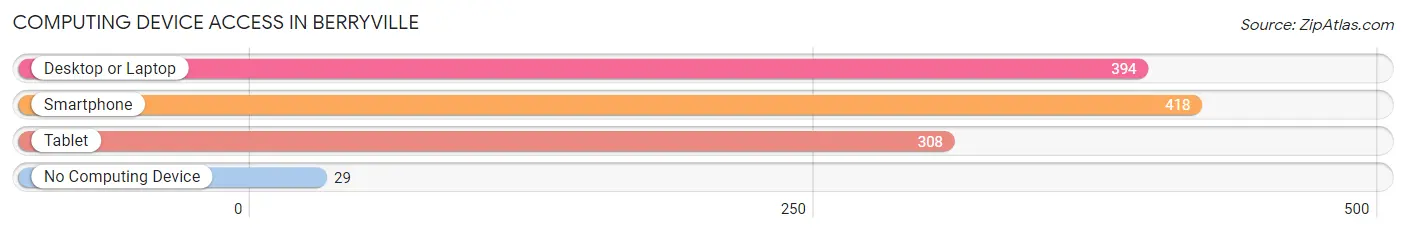
| Device Type | # Households | % Households |
| Desktop or Laptop | 394 | 84.4% |
| Smartphone | 418 | 89.5% |
| Tablet | 308 | 65.9% |
| No Computing Device | 29 | 6.2% |
| Total | 467 | 100.0% |
Internet Access in Berryville
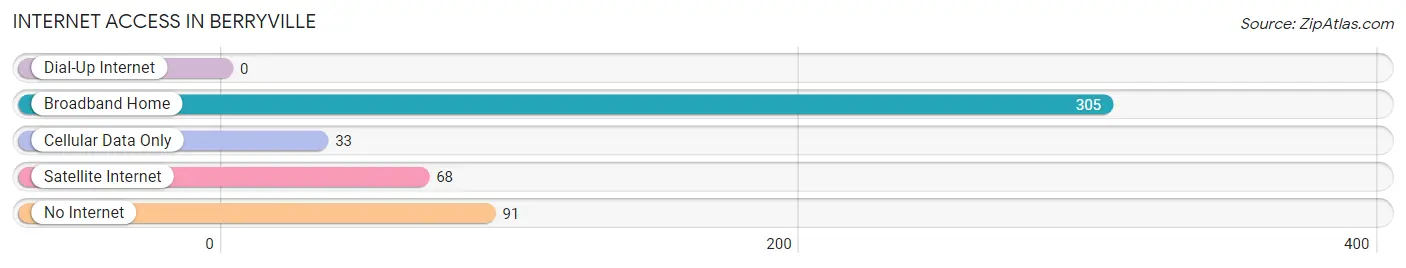
| Internet Type | # Households | % Households |
| Dial-Up Internet | 0 | 0.0% |
| Broadband Home | 305 | 65.3% |
| Cellular Data Only | 33 | 7.1% |
| Satellite Internet | 68 | 14.6% |
| No Internet | 91 | 19.5% |
| Total | 467 | 100.0% |
Berryville Summary
Introduction
The small town of Berryville, Texas is located in the southeastern corner of the state, just north of the Louisiana border. It is a rural community with a population of just over 1,000 people. The town is known for its rich history, diverse geography, and vibrant economy. This paper will explore the history, geography, economy, and demographics of Berryville in 2000 words.
History
Berryville was founded in 1837 by a group of settlers from Tennessee. The town was named after the local berry bushes that grew in abundance in the area. The town quickly grew and became a center of commerce for the surrounding area. In 1845, the town was incorporated and the first post office was established.
In the late 1800s, the town experienced a period of growth and prosperity. The railroad was extended to the town in 1881, and the town became a major shipping hub for the region. The town also became a center for education, with the establishment of a school in 1883.
In the early 1900s, the town experienced a period of decline. The railroad was abandoned in the 1920s, and the town's economy suffered. The Great Depression further weakened the town's economy, and many of the town's residents moved away in search of better opportunities.
In the 1950s, the town experienced a period of revitalization. The town was connected to the state highway system, and the economy began to improve. The town also experienced a population boom, as many people moved to the area in search of a better life.
Geography
Berryville is located in the southeastern corner of Texas, just north of the Louisiana border. The town is situated in the Piney Woods region of the state, and is surrounded by rolling hills and dense forests. The town is located near the Sabine River, which provides a source of water for the area.
The town is located in the humid subtropical climate zone, and experiences hot, humid summers and mild winters. The average annual temperature is around 70 degrees Fahrenheit, and the average annual precipitation is around 45 inches.
Economy
The economy of Berryville is largely based on agriculture and forestry. The town is home to several farms and ranches, and the surrounding area is home to many timber companies. The town is also home to several small businesses, including restaurants, retail stores, and service providers.
The town is also home to several manufacturing companies, including a furniture factory and a plastics factory. The town is also home to a small airport, which provides air transportation to the surrounding area.
Demographics
As of the 2010 census, the population of Berryville was 1,072. The town is predominantly white, with a population that is 97.2% white. The town also has a small Hispanic population, which makes up 1.7% of the population.
The median household income in Berryville is $37,500, and the median home value is $90,000. The town has a poverty rate of 17.3%, and the unemployment rate is 5.2%.
Conclusion
Berryville is a small town in the southeastern corner of Texas. The town has a rich history, diverse geography, and vibrant economy. The town is predominantly white, with a population that is 97.2% white. The town is home to several farms and ranches, and the surrounding area is home to many timber companies. The town is also home to several small businesses, including restaurants, retail stores, and service providers. The town is also home to several manufacturing companies, including a furniture factory and a plastics factory. The town is also home to a small airport, which provides air transportation to the surrounding area. The median household income in Berryville is $37,500, and the median home value is $90,000. The town has a poverty rate of 17.3%, and the unemployment rate is 5.2%.
Common Questions
What is the Total Population of Berryville?
Total Population of Berryville is 1,169.
What is the Total Male Population of Berryville?
Total Male Population of Berryville is 532.
What is the Total Female Population of Berryville?
Total Female Population of Berryville is 637.
What is the Ratio of Males per 100 Females in Berryville?
There are 83.52 Males per 100 Females in Berryville.
What is the Ratio of Females per 100 Males in Berryville?
There are 119.74 Females per 100 Males in Berryville.
What is the Median Population Age in Berryville?
Median Population Age in Berryville is 40.7 Years.
What is the Average Family Size in Berryville
Average Family Size in Berryville is 2.8 People.
What is the Average Household Size in Berryville
Average Household Size in Berryville is 2.5 People.
What is Per Capita Income in Berryville?
Per Capita income in Berryville is $23,367.
What is the Median Family Income in Berryville?
Median Family Income in Berryville is $77,375.
What is the Median Household income in Berryville?
Median Household Income in Berryville is $50,938.
What is Income or Wage Gap in Berryville?
Income or Wage Gap in Berryville is 23.3%.
Women in Berryville earn 76.7 cents for every dollar earned by a man.
What is Inequality or Gini Index in Berryville?
Inequality or Gini Index in Berryville is 0.35.
How Large is the Labor Force in Berryville?
There are 399 People in the Labor Forcein in Berryville.
What is the Percentage of People in the Labor Force in Berryville?
43.3% of People are in the Labor Force in Berryville.
What is the Unemployment Rate in Berryville?
Unemployment Rate in Berryville is 5.3%.