Canutillo, TX
Canutillo Map
Canutillo Overview
6,800
TOTAL POPULATION
3,040
MALE POPULATION
3,760
FEMALE POPULATION
80.85
MALES / 100 FEMALES
123.68
FEMALES / 100 MALES
28.9
MEDIAN AGE
4.2
AVG FAMILY SIZE
3.4
AVG HOUSEHOLD SIZE
$20,578
PER CAPITA INCOME
$53,964
AVG FAMILY INCOME
$40,655
AVG HOUSEHOLD INCOME
17.8%
WAGE / INCOME GAP [ % ]
82.2¢/ $1
WAGE / INCOME GAP [ $ ]
$14,285
FAMILY INCOME DEFICIT
0.52
INEQUALITY / GINI INDEX
2,573
LABOR FORCE [ PEOPLE ]
58.3%
PERCENT IN LABOR FORCE
2.8%
UNEMPLOYMENT RATE
Canutillo Zip Codes
Canutillo Area Codes
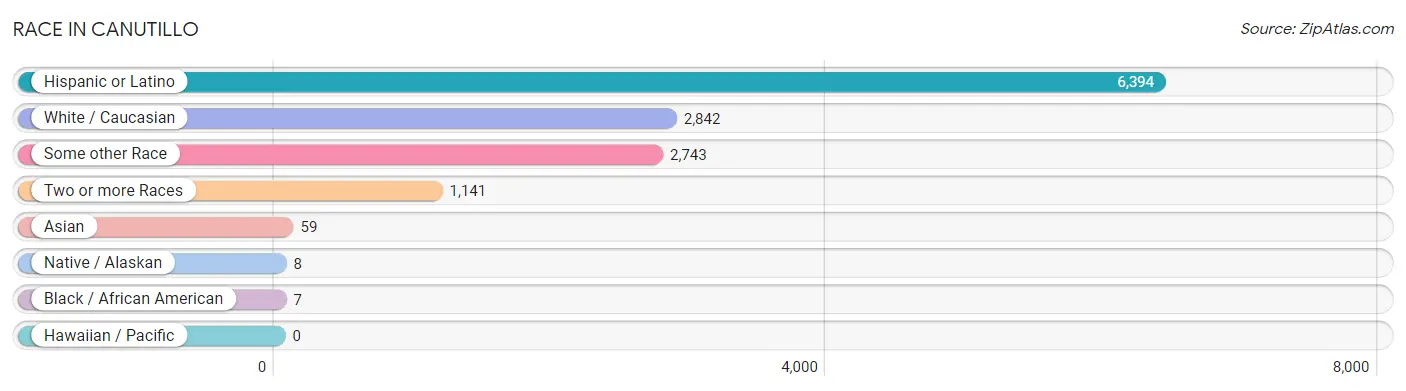
Race in Canutillo
The most populous races in Canutillo are Hispanic or Latino (6,394 | 94.0%), White / Caucasian (2,842 | 41.8%), and Some other Race (2,743 | 40.3%).
| Race | # Population | % Population |
| Asian | 59 | 0.9% |
| Black / African American | 7 | 0.1% |
| Hawaiian / Pacific | 0 | 0.0% |
| Hispanic or Latino | 6,394 | 94.0% |
| Native / Alaskan | 8 | 0.1% |
| White / Caucasian | 2,842 | 41.8% |
| Two or more Races | 1,141 | 16.8% |
| Some other Race | 2,743 | 40.3% |
| Total | 6,800 | 100.0% |
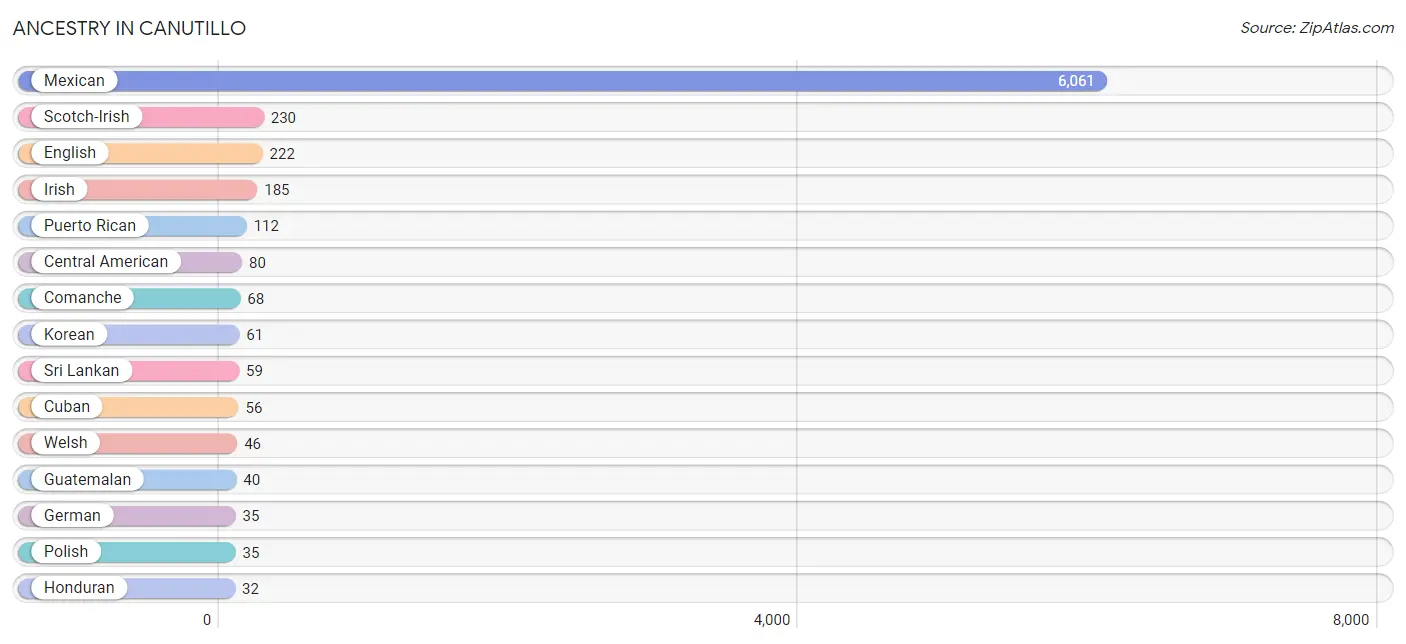
Ancestry in Canutillo
The most populous ancestries reported in Canutillo are Mexican (6,061 | 89.1%), Scotch-Irish (230 | 3.4%), English (222 | 3.3%), Irish (185 | 2.7%), and Puerto Rican (112 | 1.7%), together accounting for 100.1% of all Canutillo residents.
| Ancestry | # Population | % Population |
| Arab | 14 | 0.2% |
| Central American | 80 | 1.2% |
| Comanche | 68 | 1.0% |
| Cuban | 56 | 0.8% |
| Ecuadorian | 18 | 0.3% |
| English | 222 | 3.3% |
| European | 16 | 0.2% |
| French | 25 | 0.4% |
| French Canadian | 16 | 0.2% |
| German | 35 | 0.5% |
| Guatemalan | 40 | 0.6% |
| Honduran | 32 | 0.5% |
| Irish | 185 | 2.7% |
| Italian | 9 | 0.1% |
| Korean | 61 | 0.9% |
| Lebanese | 5 | 0.1% |
| Mexican | 6,061 | 89.1% |
| Mexican American Indian | 8 | 0.1% |
| Polish | 35 | 0.5% |
| Puerto Rican | 112 | 1.7% |
| Russian | 11 | 0.2% |
| Salvadoran | 8 | 0.1% |
| Scotch-Irish | 230 | 3.4% |
| Scottish | 8 | 0.1% |
| South American | 18 | 0.3% |
| Sri Lankan | 59 | 0.9% |
| Welsh | 46 | 0.7% | View All 27 Rows |
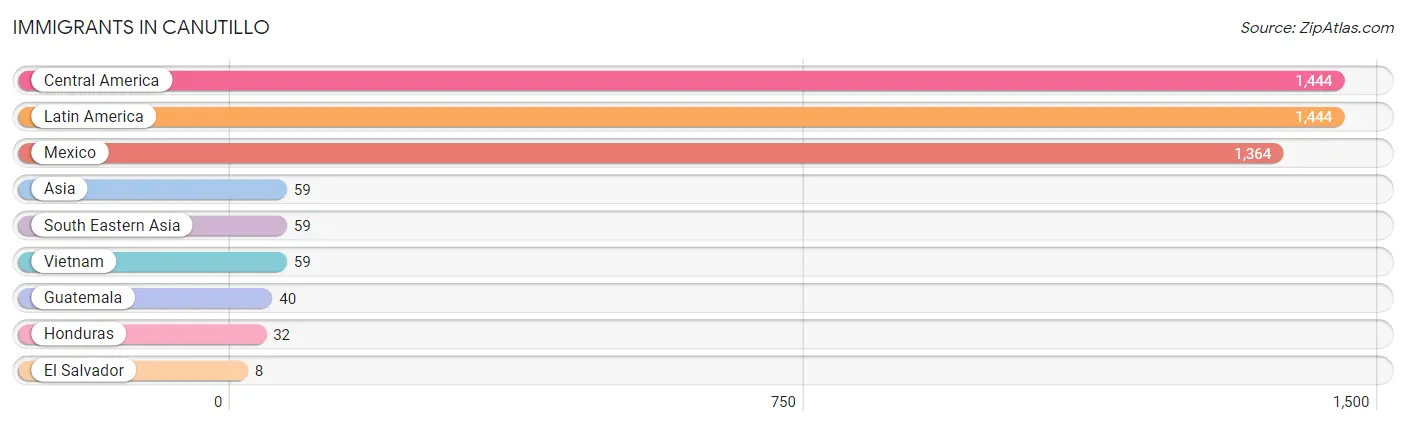
Immigrants in Canutillo
The most numerous immigrant groups reported in Canutillo came from Central America (1,444 | 21.2%), Latin America (1,444 | 21.2%), Mexico (1,364 | 20.1%), Asia (59 | 0.9%), and South Eastern Asia (59 | 0.9%), together accounting for 64.3% of all Canutillo residents.
| Immigration Origin | # Population | % Population |
| Asia | 59 | 0.9% |
| Central America | 1,444 | 21.2% |
| El Salvador | 8 | 0.1% |
| Guatemala | 40 | 0.6% |
| Honduras | 32 | 0.5% |
| Latin America | 1,444 | 21.2% |
| Mexico | 1,364 | 20.1% |
| South Eastern Asia | 59 | 0.9% |
| Vietnam | 59 | 0.9% | View All 9 Rows |
Sex and Age in Canutillo
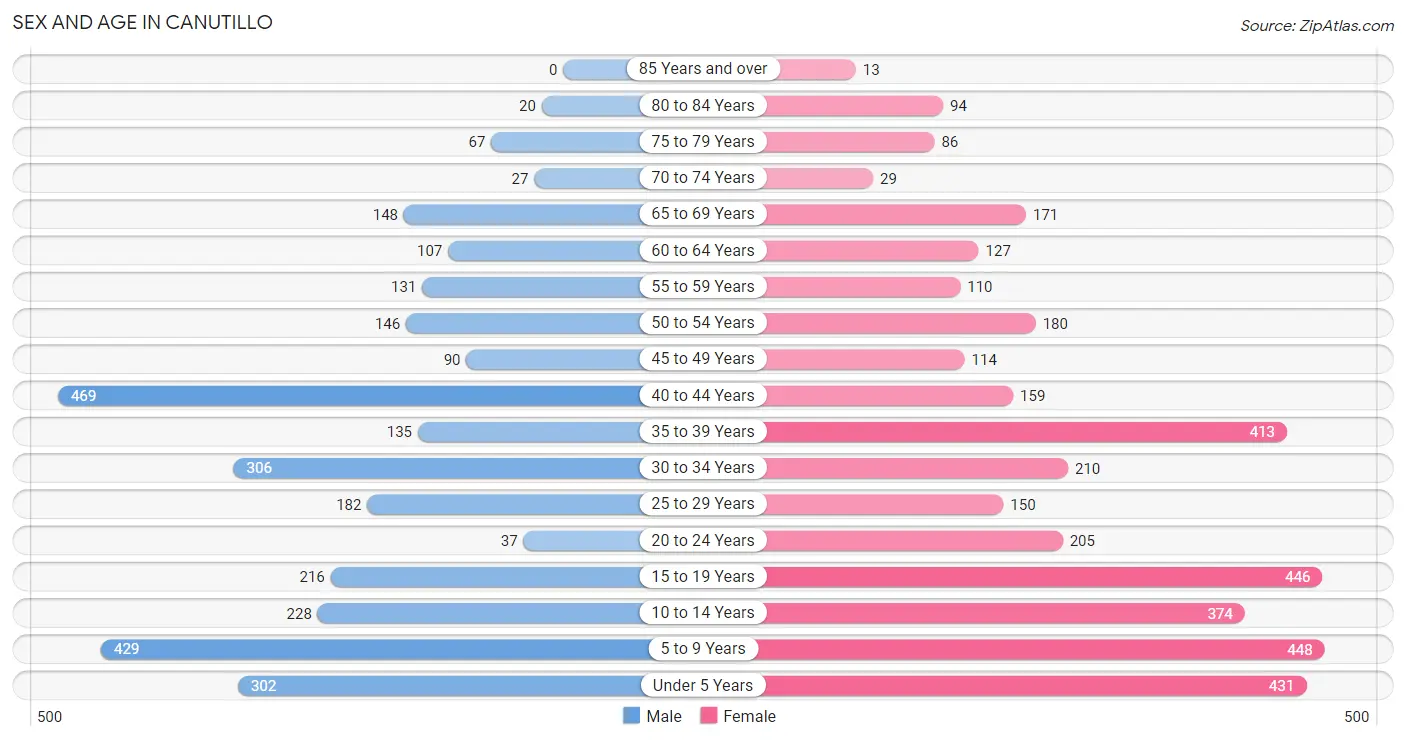
Sex and Age in Canutillo
The most populous age groups in Canutillo are 40 to 44 Years (469 | 15.4%) for men and 5 to 9 Years (448 | 11.9%) for women.
| Age Bracket | Male | Female |
| Under 5 Years | 302 (9.9%) | 431 (11.5%) |
| 5 to 9 Years | 429 (14.1%) | 448 (11.9%) |
| 10 to 14 Years | 228 (7.5%) | 374 (10.0%) |
| 15 to 19 Years | 216 (7.1%) | 446 (11.9%) |
| 20 to 24 Years | 37 (1.2%) | 205 (5.4%) |
| 25 to 29 Years | 182 (6.0%) | 150 (4.0%) |
| 30 to 34 Years | 306 (10.1%) | 210 (5.6%) |
| 35 to 39 Years | 135 (4.4%) | 413 (11.0%) |
| 40 to 44 Years | 469 (15.4%) | 159 (4.2%) |
| 45 to 49 Years | 90 (3.0%) | 114 (3.0%) |
| 50 to 54 Years | 146 (4.8%) | 180 (4.8%) |
| 55 to 59 Years | 131 (4.3%) | 110 (2.9%) |
| 60 to 64 Years | 107 (3.5%) | 127 (3.4%) |
| 65 to 69 Years | 148 (4.9%) | 171 (4.5%) |
| 70 to 74 Years | 27 (0.9%) | 29 (0.8%) |
| 75 to 79 Years | 67 (2.2%) | 86 (2.3%) |
| 80 to 84 Years | 20 (0.7%) | 94 (2.5%) |
| 85 Years and over | 0 (0.0%) | 13 (0.4%) |
| Total | 3,040 (100.0%) | 3,760 (100.0%) |
Families and Households in Canutillo
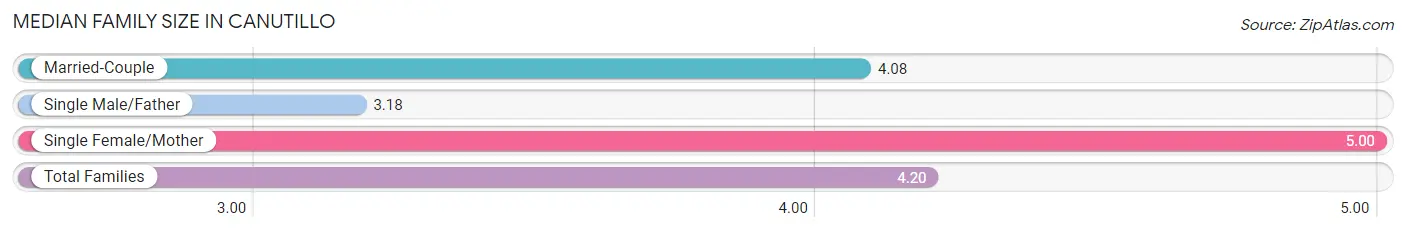
Median Family Size in Canutillo
The median family size in Canutillo is 4.20 persons per family, with single female/mother families (273 | 19.0%) accounting for the largest median family size of 5 persons per family. On the other hand, single male/father families (92 | 6.4%) represent the smallest median family size with 3.18 persons per family.
| Family Type | # Families | Family Size |
| Married-Couple | 1,070 (74.6%) | 4.08 |
| Single Male/Father | 92 (6.4%) | 3.18 |
| Single Female/Mother | 273 (19.0%) | 5.00 |
| Total Families | 1,435 (100.0%) | 4.20 |
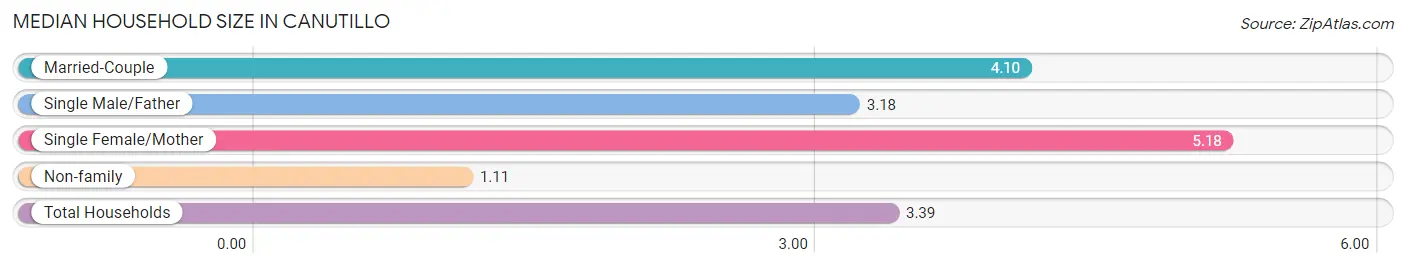
Median Household Size in Canutillo
The median household size in Canutillo is 3.39 persons per household, with single female/mother households (273 | 13.8%) accounting for the largest median household size of 5.18 persons per household. non-family households (544 | 27.5%) represent the smallest median household size with 1.11 persons per household.
| Household Type | # Households | Household Size |
| Married-Couple | 1,070 (54.1%) | 4.10 |
| Single Male/Father | 92 (4.6%) | 3.18 |
| Single Female/Mother | 273 (13.8%) | 5.18 |
| Non-family | 544 (27.5%) | 1.11 |
| Total Households | 1,979 (100.0%) | 3.39 |
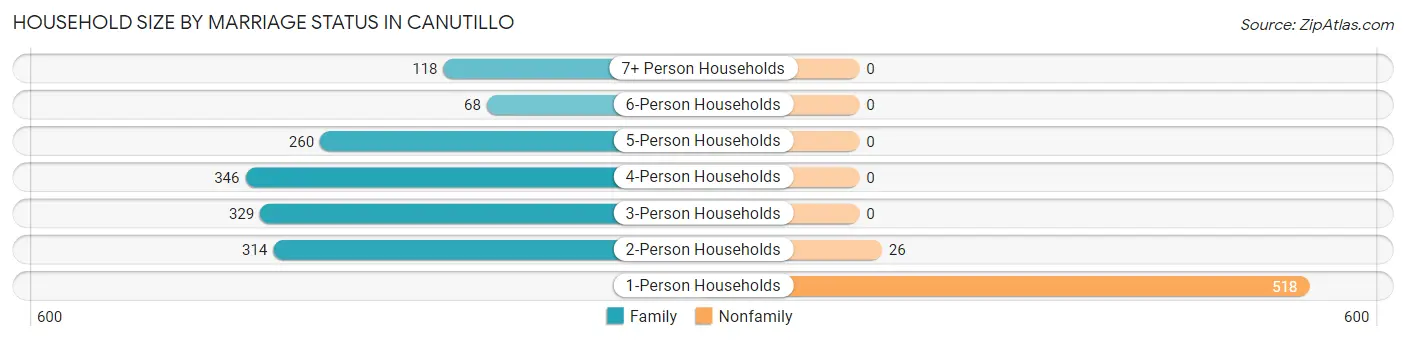
Household Size by Marriage Status in Canutillo
Out of a total of 1,979 households in Canutillo, 1,435 (72.5%) are family households, while 544 (27.5%) are nonfamily households. The most numerous type of family households are 4-person households, comprising 346, and the most common type of nonfamily households are 1-person households, comprising 518.
| Household Size | Family Households | Nonfamily Households |
| 1-Person Households | - | 518 (26.2%) |
| 2-Person Households | 314 (15.9%) | 26 (1.3%) |
| 3-Person Households | 329 (16.6%) | 0 (0.0%) |
| 4-Person Households | 346 (17.5%) | 0 (0.0%) |
| 5-Person Households | 260 (13.1%) | 0 (0.0%) |
| 6-Person Households | 68 (3.4%) | 0 (0.0%) |
| 7+ Person Households | 118 (6.0%) | 0 (0.0%) |
| Total | 1,435 (72.5%) | 544 (27.5%) |
Female Fertility in Canutillo
Fertility by Age in Canutillo
Average fertility rate in Canutillo is 63.0 births per 1,000 women. Women in the age bracket of 20 to 34 years have the highest fertility rate with 115.0 births per 1,000 women. Women in the age bracket of 20 to 34 years acount for 59.6% of all women with births.
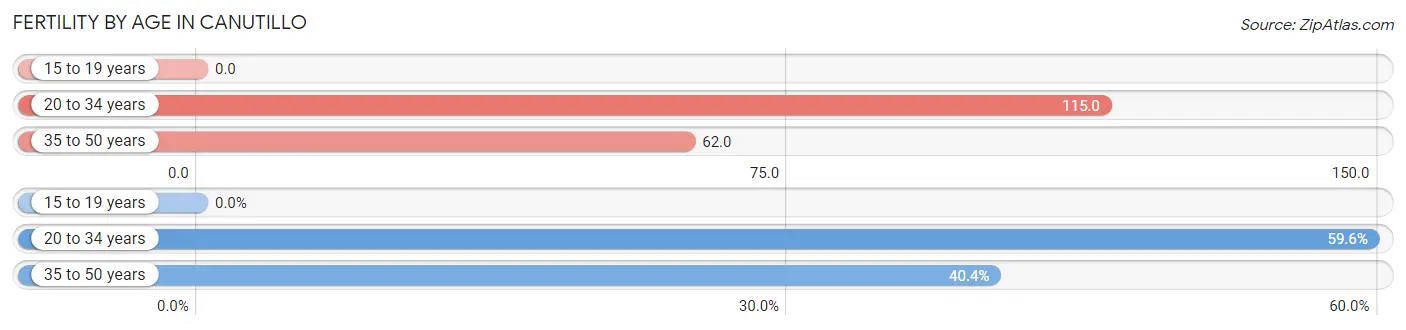
| Age Bracket | Women with Births | Births / 1,000 Women |
| 15 to 19 years | 0 (0.0%) | 0.0 |
| 20 to 34 years | 65 (59.6%) | 115.0 |
| 35 to 50 years | 44 (40.4%) | 62.0 |
| Total | 109 (100.0%) | 63.0 |
Fertility by Age by Marriage Status in Canutillo
30.3% of women with births (109) in Canutillo are married. The highest percentage of unmarried women with births falls into 20 to 34 years age bracket with 89.2% of them unmarried at the time of birth, while the lowest percentage of unmarried women with births belong to 35 to 50 years age bracket with 40.9% of them unmarried.
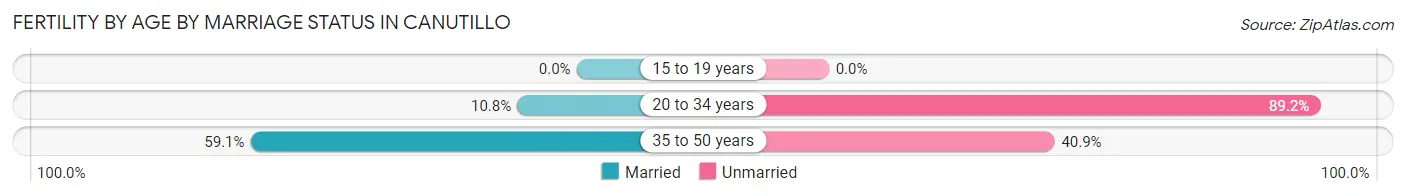
| Age Bracket | Married | Unmarried |
| 15 to 19 years | 0 (0.0%) | 0 (0.0%) |
| 20 to 34 years | 7 (10.8%) | 58 (89.2%) |
| 35 to 50 years | 26 (59.1%) | 18 (40.9%) |
| Total | 33 (30.3%) | 76 (69.7%) |
Fertility by Education in Canutillo
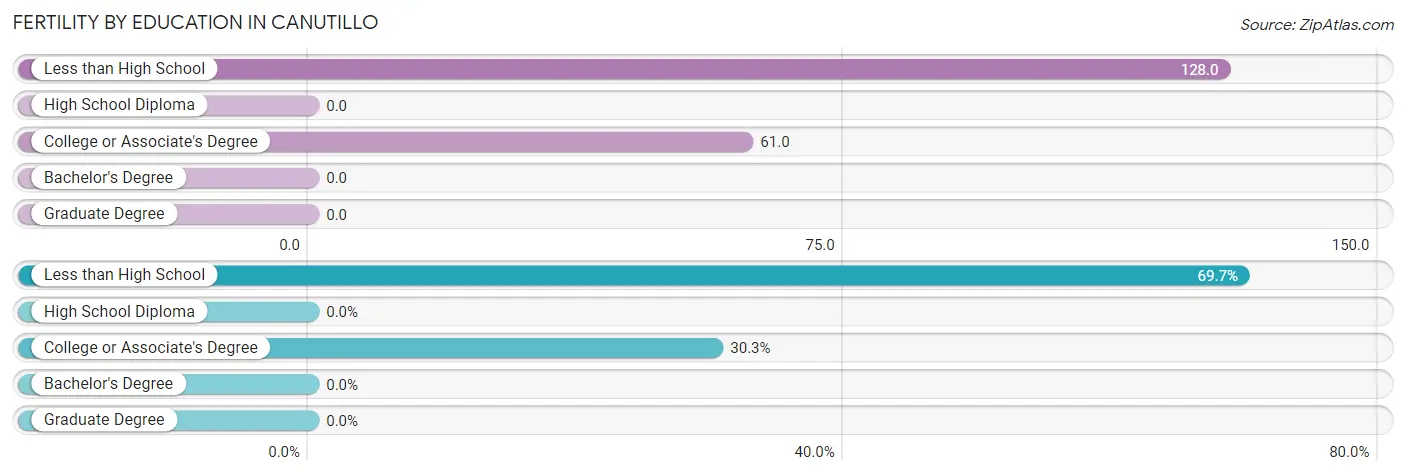
| Educational Attainment | Women with Births | Births / 1,000 Women |
| Less than High School | 76 (69.7%) | 128.0 |
| High School Diploma | 0 (0.0%) | 0.0 |
| College or Associate's Degree | 33 (30.3%) | 61.0 |
| Bachelor's Degree | 0 (0.0%) | 0.0 |
| Graduate Degree | 0 (0.0%) | 0.0 |
| Total | 109 (100.0%) | 63.0 |
Fertility by Education by Marriage Status in Canutillo
69.7% of women with births in Canutillo are unmarried. Women with the educational attainment of college or associate's degree are most likely to be married with 100.0% of them married at childbirth, while women with the educational attainment of less than high school are least likely to be married with 100.0% of them unmarried at childbirth.
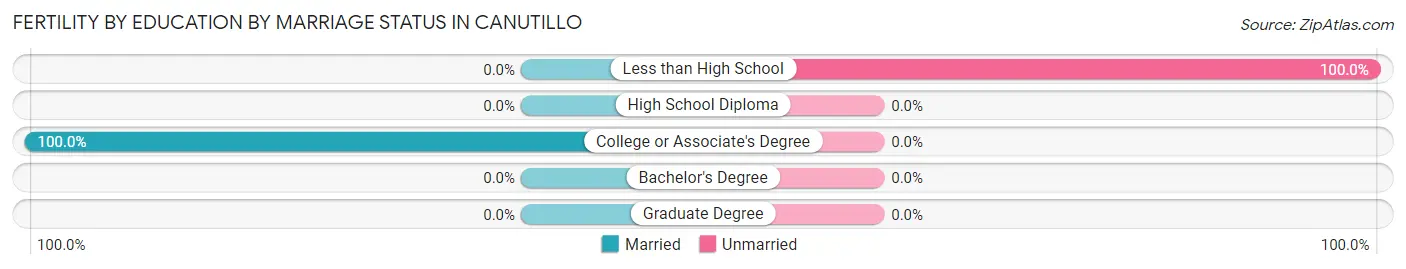
| Educational Attainment | Married | Unmarried |
| Less than High School | 0 (0.0%) | 76 (100.0%) |
| High School Diploma | 0 (0.0%) | 0 (0.0%) |
| College or Associate's Degree | 33 (100.0%) | 0 (0.0%) |
| Bachelor's Degree | 0 (0.0%) | 0 (0.0%) |
| Graduate Degree | 0 (0.0%) | 0 (0.0%) |
| Total | 33 (30.3%) | 76 (69.7%) |
Income in Canutillo
Income Overview in Canutillo
Per Capita Income in Canutillo is $20,578, while median incomes of families and households are $53,964 and $40,655 respectively.
| Characteristic | Number | Measure |
| Per Capita Income | 6,800 | $20,578 |
| Median Family Income | 1,435 | $53,964 |
| Mean Family Income | 1,435 | $86,315 |
| Median Household Income | 1,979 | $40,655 |
| Mean Household Income | 1,979 | $68,287 |
| Income Deficit | 1,435 | $14,285 |
| Wage / Income Gap (%) | 6,800 | 17.77% |
| Wage / Income Gap ($) | 6,800 | 82.23¢ per $1 |
| Gini / Inequality Index | 6,800 | 0.52 |
Earnings by Sex in Canutillo
Average Earnings in Canutillo are $36,596, $39,487 for men and $32,470 for women, a difference of 17.8%.
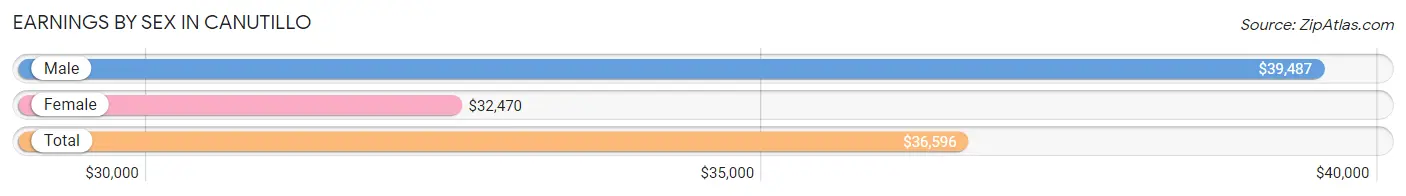
| Sex | Number | Average Earnings |
| Male | 1,418 (51.8%) | $39,487 |
| Female | 1,319 (48.2%) | $32,470 |
| Total | 2,737 (100.0%) | $36,596 |
Earnings by Sex by Income Bracket in Canutillo
The most common earnings brackets in Canutillo are $30,000 to $34,999 for men (289 | 20.4%) and $75,000 to $99,999 for women (199 | 15.1%).
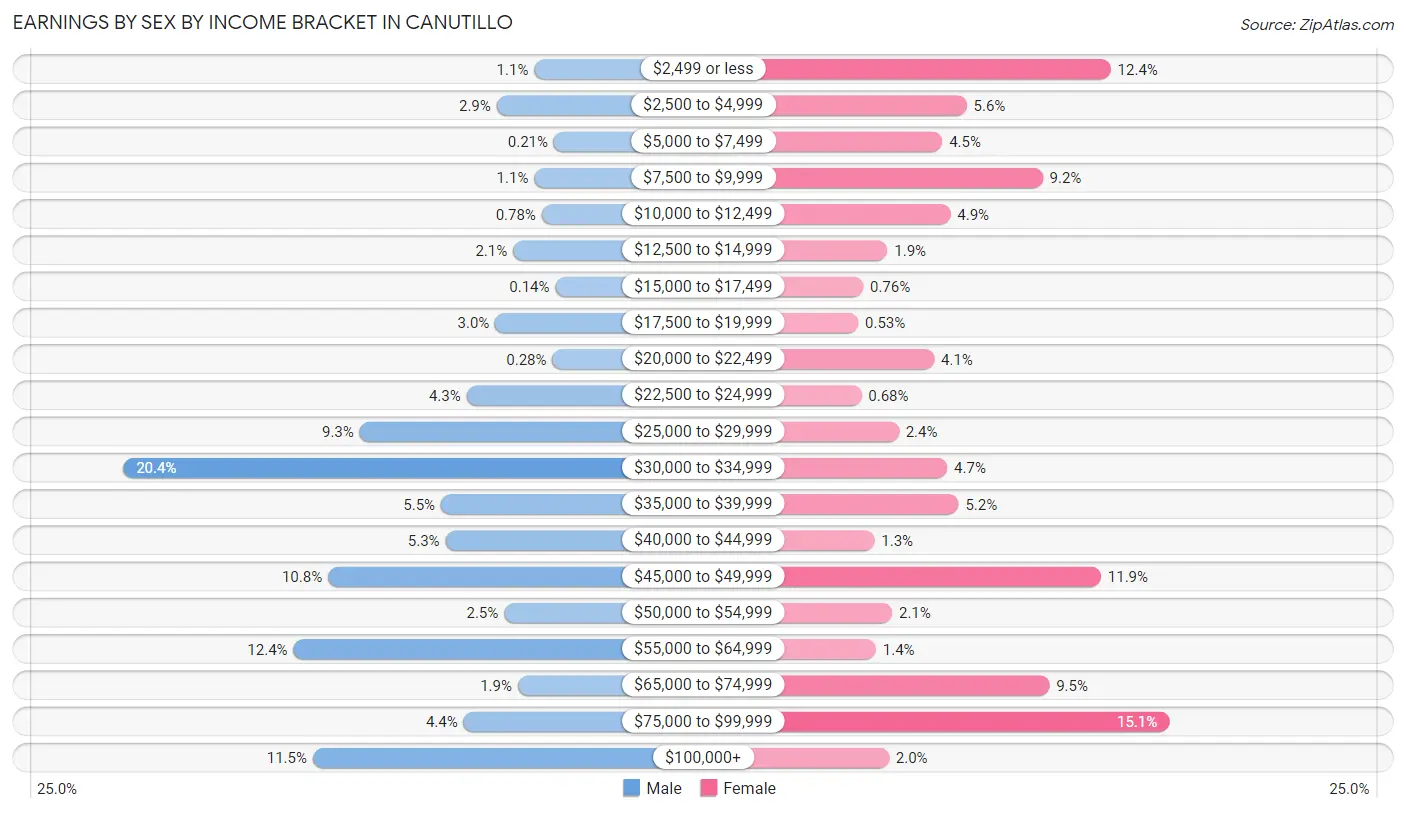
| Income | Male | Female |
| $2,499 or less | 16 (1.1%) | 163 (12.4%) |
| $2,500 to $4,999 | 41 (2.9%) | 74 (5.6%) |
| $5,000 to $7,499 | 3 (0.2%) | 59 (4.5%) |
| $7,500 to $9,999 | 16 (1.1%) | 121 (9.2%) |
| $10,000 to $12,499 | 11 (0.8%) | 64 (4.9%) |
| $12,500 to $14,999 | 30 (2.1%) | 25 (1.9%) |
| $15,000 to $17,499 | 2 (0.1%) | 10 (0.8%) |
| $17,500 to $19,999 | 42 (3.0%) | 7 (0.5%) |
| $20,000 to $22,499 | 4 (0.3%) | 54 (4.1%) |
| $22,500 to $24,999 | 61 (4.3%) | 9 (0.7%) |
| $25,000 to $29,999 | 132 (9.3%) | 32 (2.4%) |
| $30,000 to $34,999 | 289 (20.4%) | 62 (4.7%) |
| $35,000 to $39,999 | 78 (5.5%) | 69 (5.2%) |
| $40,000 to $44,999 | 75 (5.3%) | 17 (1.3%) |
| $45,000 to $49,999 | 153 (10.8%) | 157 (11.9%) |
| $50,000 to $54,999 | 36 (2.5%) | 28 (2.1%) |
| $55,000 to $64,999 | 176 (12.4%) | 18 (1.4%) |
| $65,000 to $74,999 | 27 (1.9%) | 125 (9.5%) |
| $75,000 to $99,999 | 63 (4.4%) | 199 (15.1%) |
| $100,000+ | 163 (11.5%) | 26 (2.0%) |
| Total | 1,418 (100.0%) | 1,319 (100.0%) |
Earnings by Sex by Educational Attainment in Canutillo
Average earnings in Canutillo are $39,840 for men and $37,462 for women, a difference of 6.0%. Men with an educational attainment of graduate degree enjoy the highest average annual earnings of $172,994, while those with less than high school education earn the least with $33,165. Women with an educational attainment of graduate degree earn the most with the average annual earnings of $87,985, while those with less than high school education have the smallest earnings of $2,499.
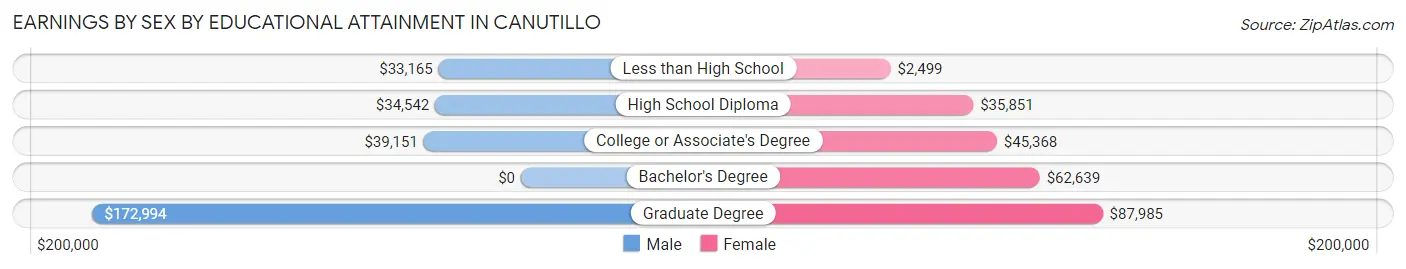
| Educational Attainment | Male Income | Female Income |
| Less than High School | $33,165 | $2,499 |
| High School Diploma | $34,542 | $35,851 |
| College or Associate's Degree | $39,151 | $45,368 |
| Bachelor's Degree | - | - |
| Graduate Degree | $172,994 | $87,985 |
| Total | $39,840 | $37,462 |
Family Income in Canutillo
Family Income Brackets in Canutillo
According to the Canutillo family income data, there are 327 families falling into the $100,000 to $149,999 income range, which is the most common income bracket and makes up 22.8% of all families. Conversely, the $15,000 to $24,999 income bracket is the least frequent group with only 49 families (3.4%) belonging to this category.
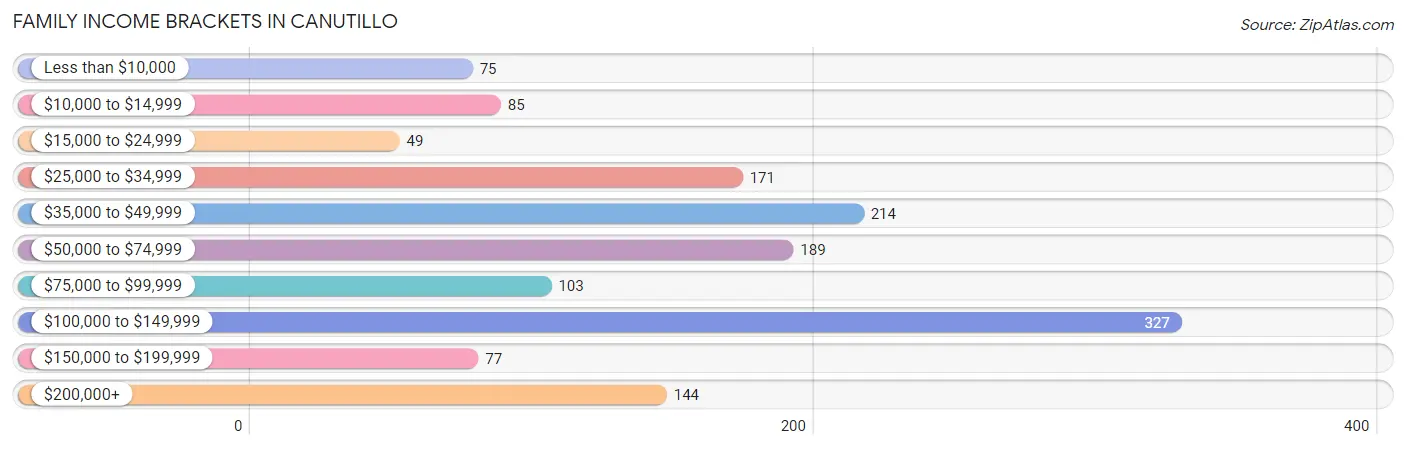
| Income Bracket | # Families | % Families |
| Less than $10,000 | 75 | 5.2% |
| $10,000 to $14,999 | 85 | 5.9% |
| $15,000 to $24,999 | 49 | 3.4% |
| $25,000 to $34,999 | 171 | 11.9% |
| $35,000 to $49,999 | 214 | 14.9% |
| $50,000 to $74,999 | 189 | 13.2% |
| $75,000 to $99,999 | 103 | 7.2% |
| $100,000 to $149,999 | 327 | 22.8% |
| $150,000 to $199,999 | 77 | 5.4% |
| $200,000+ | 144 | 10.0% |
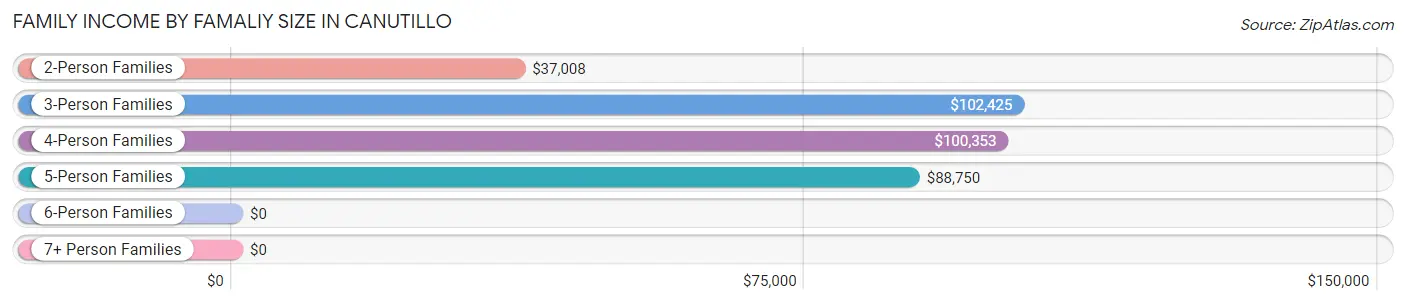
Family Income by Famaliy Size in Canutillo
3-person families (311 | 21.7%) account for the highest median family income in Canutillo with $102,425 per family, while 3-person families (311 | 21.7%) have the highest median income of $34,142 per family member.
| Income Bracket | # Families | Median Income |
| 2-Person Families | 343 (23.9%) | $37,008 |
| 3-Person Families | 311 (21.7%) | $102,425 |
| 4-Person Families | 335 (23.3%) | $100,353 |
| 5-Person Families | 284 (19.8%) | $88,750 |
| 6-Person Families | 44 (3.1%) | $0 |
| 7+ Person Families | 118 (8.2%) | $0 |
| Total | 1,435 (100.0%) | $53,964 |
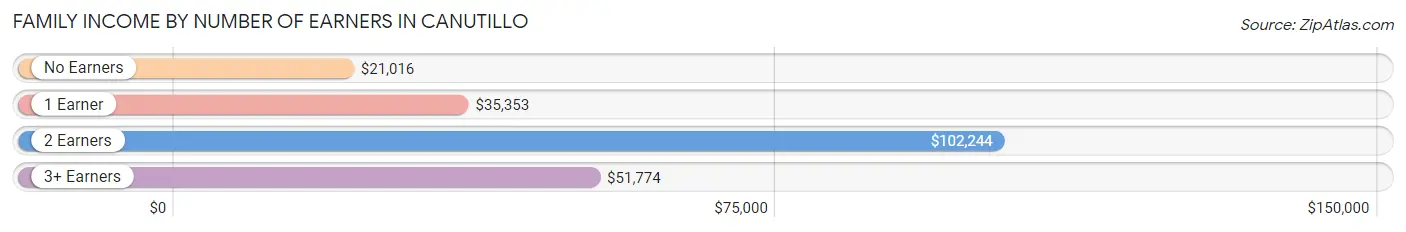
Family Income by Number of Earners in Canutillo
The median family income in Canutillo is $53,964, with families comprising 2 earners (654) having the highest median family income of $102,244, while families with no earners (57) have the lowest median family income of $21,016, accounting for 45.6% and 4.0% of families, respectively.
| Number of Earners | # Families | Median Income |
| No Earners | 57 (4.0%) | $21,016 |
| 1 Earner | 632 (44.0%) | $35,353 |
| 2 Earners | 654 (45.6%) | $102,244 |
| 3+ Earners | 92 (6.4%) | $51,774 |
| Total | 1,435 (100.0%) | $53,964 |
Household Income in Canutillo
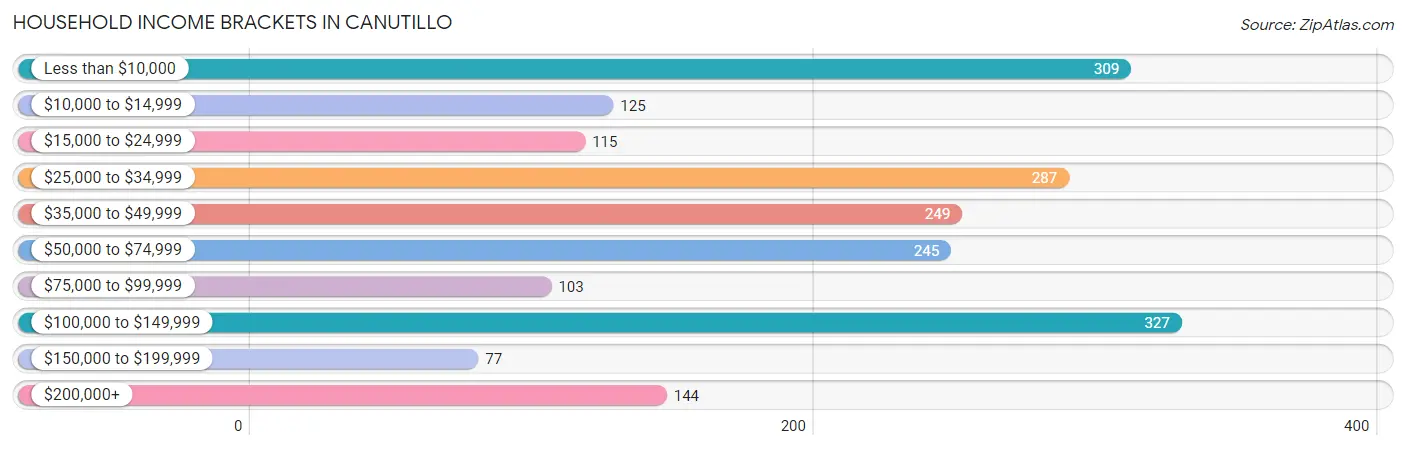
Household Income Brackets in Canutillo
With 327 households falling in the category, the $100,000 to $149,999 income range is the most frequent in Canutillo, accounting for 16.5% of all households. In contrast, only 77 households (3.9%) fall into the $150,000 to $199,999 income bracket, making it the least populous group.
| Income Bracket | # Households | % Households |
| Less than $10,000 | 309 | 15.6% |
| $10,000 to $14,999 | 125 | 6.3% |
| $15,000 to $24,999 | 115 | 5.8% |
| $25,000 to $34,999 | 287 | 14.5% |
| $35,000 to $49,999 | 249 | 12.6% |
| $50,000 to $74,999 | 245 | 12.4% |
| $75,000 to $99,999 | 103 | 5.2% |
| $100,000 to $149,999 | 327 | 16.5% |
| $150,000 to $199,999 | 77 | 3.9% |
| $200,000+ | 144 | 7.3% |
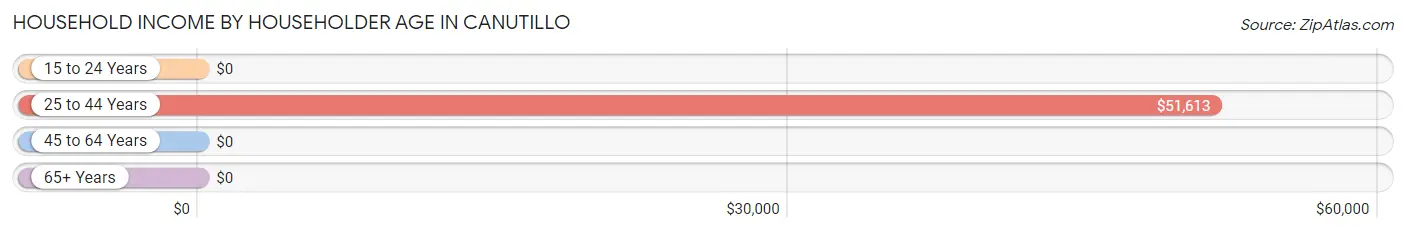
Household Income by Householder Age in Canutillo
The median household income in Canutillo is $40,655, with the highest median household income of $51,613 found in the 25 to 44 years age bracket for the primary householder. A total of 958 households (48.4%) fall into this category. Meanwhile, the 15 to 24 years age bracket for the primary householder has the lowest median household income of $0, with 62 households (3.1%) in this group.
| Income Bracket | # Households | Median Income |
| 15 to 24 Years | 62 (3.1%) | $0 |
| 25 to 44 Years | 958 (48.4%) | $51,613 |
| 45 to 64 Years | 483 (24.4%) | $0 |
| 65+ Years | 476 (24.0%) | $0 |
| Total | 1,979 (100.0%) | $40,655 |
Poverty in Canutillo
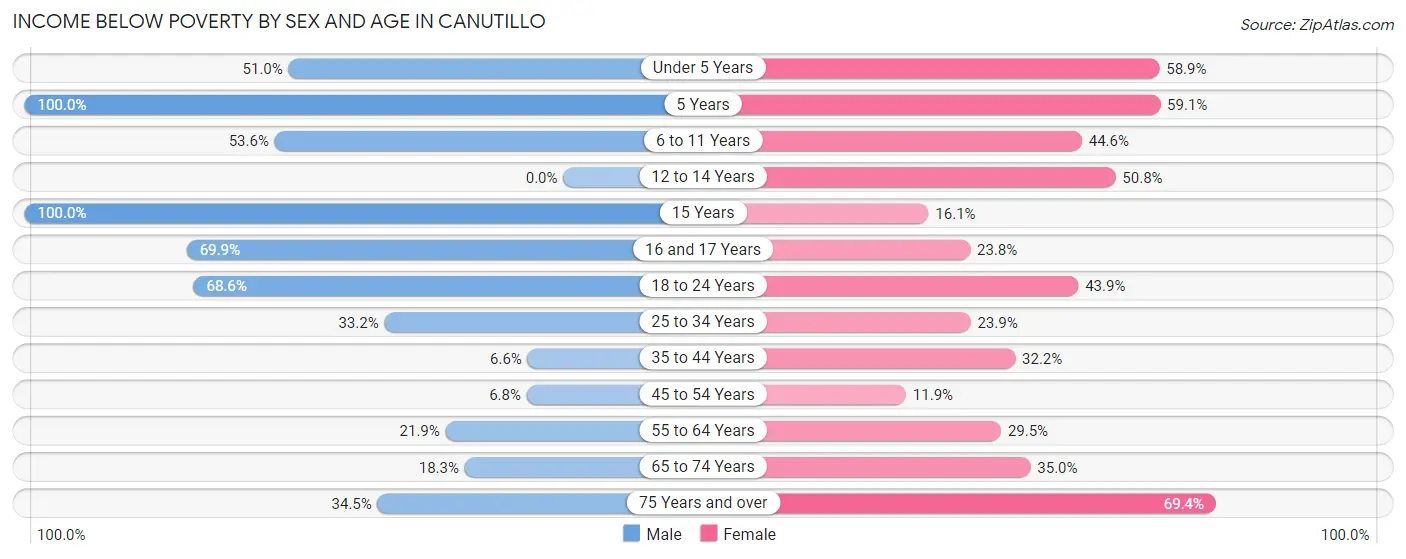
Income Below Poverty by Sex and Age in Canutillo
With 32.9% poverty level for males and 38.2% for females among the residents of Canutillo, 5 year old males and 75 year old and over females are the most vulnerable to poverty, with 59 males (100.0%) and 134 females (69.4%) in their respective age groups living below the poverty level.
| Age Bracket | Male | Female |
| Under 5 Years | 154 (51.0%) | 254 (58.9%) |
| 5 Years | 59 (100.0%) | 65 (59.1%) |
| 6 to 11 Years | 270 (53.6%) | 233 (44.6%) |
| 12 to 14 Years | 0 (0.0%) | 96 (50.8%) |
| 15 Years | 32 (100.0%) | 23 (16.1%) |
| 16 and 17 Years | 72 (69.9%) | 45 (23.8%) |
| 18 to 24 Years | 81 (68.6%) | 140 (43.9%) |
| 25 to 34 Years | 162 (33.2%) | 86 (23.9%) |
| 35 to 44 Years | 40 (6.6%) | 184 (32.2%) |
| 45 to 54 Years | 16 (6.8%) | 35 (11.9%) |
| 55 to 64 Years | 52 (21.8%) | 70 (29.5%) |
| 65 to 74 Years | 32 (18.3%) | 70 (35.0%) |
| 75 Years and over | 30 (34.5%) | 134 (69.4%) |
| Total | 1,000 (32.9%) | 1,435 (38.2%) |
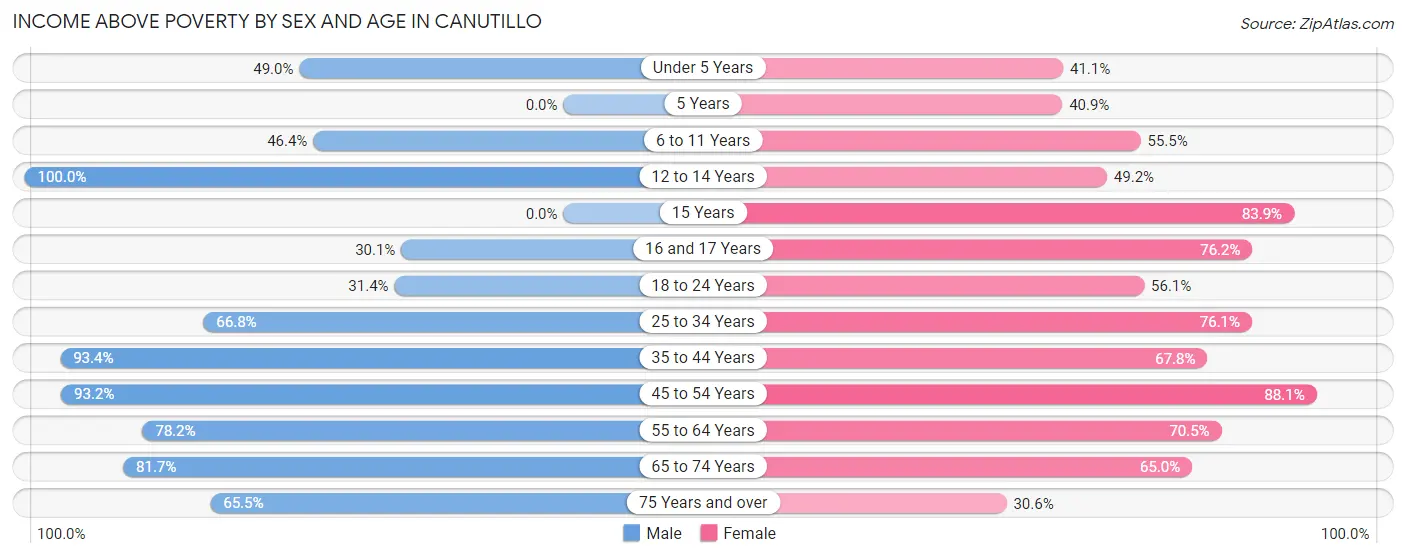
Income Above Poverty by Sex and Age in Canutillo
According to the poverty statistics in Canutillo, males aged 12 to 14 years and females aged 45 to 54 years are the age groups that are most secure financially, with 100.0% of males and 88.1% of females in these age groups living above the poverty line.
| Age Bracket | Male | Female |
| Under 5 Years | 148 (49.0%) | 177 (41.1%) |
| 5 Years | 0 (0.0%) | 45 (40.9%) |
| 6 to 11 Years | 234 (46.4%) | 290 (55.4%) |
| 12 to 14 Years | 94 (100.0%) | 93 (49.2%) |
| 15 Years | 0 (0.0%) | 120 (83.9%) |
| 16 and 17 Years | 31 (30.1%) | 144 (76.2%) |
| 18 to 24 Years | 37 (31.4%) | 179 (56.1%) |
| 25 to 34 Years | 326 (66.8%) | 274 (76.1%) |
| 35 to 44 Years | 564 (93.4%) | 388 (67.8%) |
| 45 to 54 Years | 220 (93.2%) | 259 (88.1%) |
| 55 to 64 Years | 186 (78.1%) | 167 (70.5%) |
| 65 to 74 Years | 143 (81.7%) | 130 (65.0%) |
| 75 Years and over | 57 (65.5%) | 59 (30.6%) |
| Total | 2,040 (67.1%) | 2,325 (61.8%) |
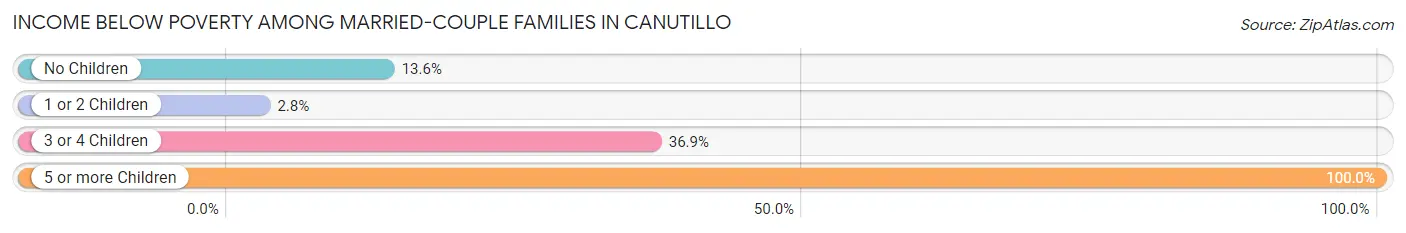
Income Below Poverty Among Married-Couple Families in Canutillo
The poverty statistics for married-couple families in Canutillo show that 18.3% or 196 of the total 1,070 families live below the poverty line. Families with 5 or more children have the highest poverty rate of 100.0%, comprising of 69 families. On the other hand, families with 1 or 2 children have the lowest poverty rate of 2.8%, which includes 15 families.
| Children | Above Poverty | Below Poverty |
| No Children | 228 (86.4%) | 36 (13.6%) |
| 1 or 2 Children | 516 (97.2%) | 15 (2.8%) |
| 3 or 4 Children | 130 (63.1%) | 76 (36.9%) |
| 5 or more Children | 0 (0.0%) | 69 (100.0%) |
| Total | 874 (81.7%) | 196 (18.3%) |
Income Below Poverty Among Single-Parent Households in Canutillo
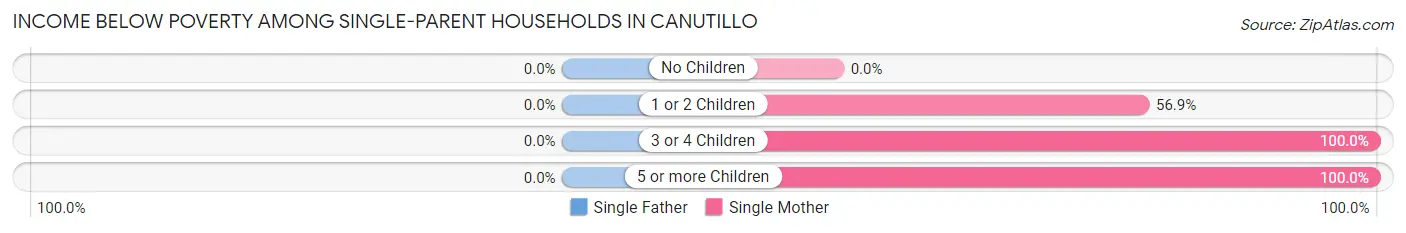
| Children | Single Father | Single Mother |
| No Children | 0 (0.0%) | 0 (0.0%) |
| 1 or 2 Children | 0 (0.0%) | 62 (56.9%) |
| 3 or 4 Children | 0 (0.0%) | 26 (100.0%) |
| 5 or more Children | 0 (0.0%) | 49 (100.0%) |
| Total | 0 (0.0%) | 137 (50.2%) |
Income Below Poverty Among Married-Couple vs Single-Parent Households in Canutillo
The poverty data for Canutillo shows that 196 of the married-couple family households (18.3%) and 137 of the single-parent households (37.5%) are living below the poverty level. Within the married-couple family households, those with 5 or more children have the highest poverty rate, with 69 households (100.0%) falling below the poverty line. Among the single-parent households, those with 5 or more children have the highest poverty rate, with 49 household (100.0%) living below poverty.
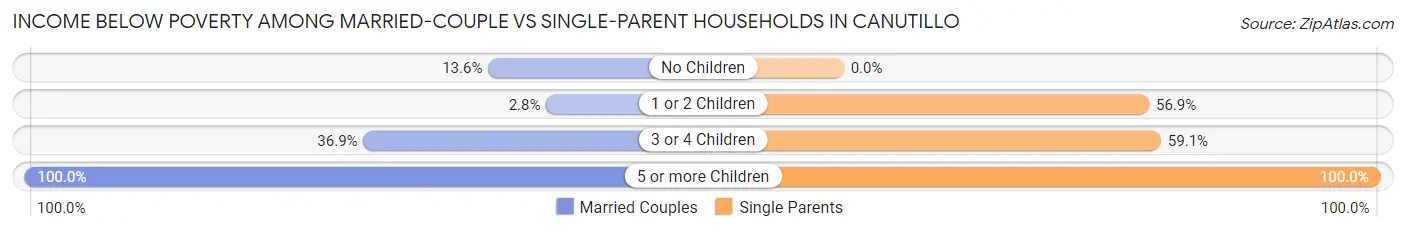
| Children | Married-Couple Families | Single-Parent Households |
| No Children | 36 (13.6%) | 0 (0.0%) |
| 1 or 2 Children | 15 (2.8%) | 62 (56.9%) |
| 3 or 4 Children | 76 (36.9%) | 26 (59.1%) |
| 5 or more Children | 69 (100.0%) | 49 (100.0%) |
| Total | 196 (18.3%) | 137 (37.5%) |
Employment Characteristics in Canutillo
Employment by Class of Employer in Canutillo
Among the 2,501 employed individuals in Canutillo, private company employees (1,514 | 60.5%), self-employed (not incorporated) (338 | 13.5%), and local government employees (278 | 11.1%) make up the most common classes of employment.
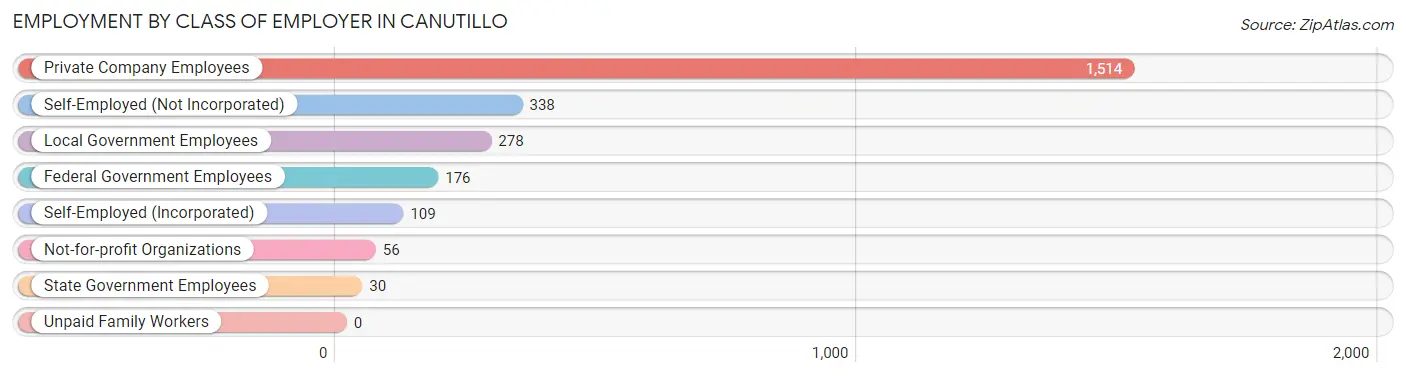
| Employer Class | # Employees | % Employees |
| Private Company Employees | 1,514 | 60.5% |
| Self-Employed (Incorporated) | 109 | 4.4% |
| Self-Employed (Not Incorporated) | 338 | 13.5% |
| Not-for-profit Organizations | 56 | 2.2% |
| Local Government Employees | 278 | 11.1% |
| State Government Employees | 30 | 1.2% |
| Federal Government Employees | 176 | 7.0% |
| Unpaid Family Workers | 0 | 0.0% |
| Total | 2,501 | 100.0% |
Employment Status by Age in Canutillo
According to the labor force statistics for Canutillo, out of the total population over 16 years of age (4,413), 58.3% or 2,573 individuals are in the labor force, with 2.8% or 72 of them unemployed. The age group with the highest labor force participation rate is 55 to 59 years, with 83.8% or 202 individuals in the labor force. Within the labor force, the 25 to 29 years age range has the highest percentage of unemployed individuals, with 15.4% or 37 of them being unemployed.
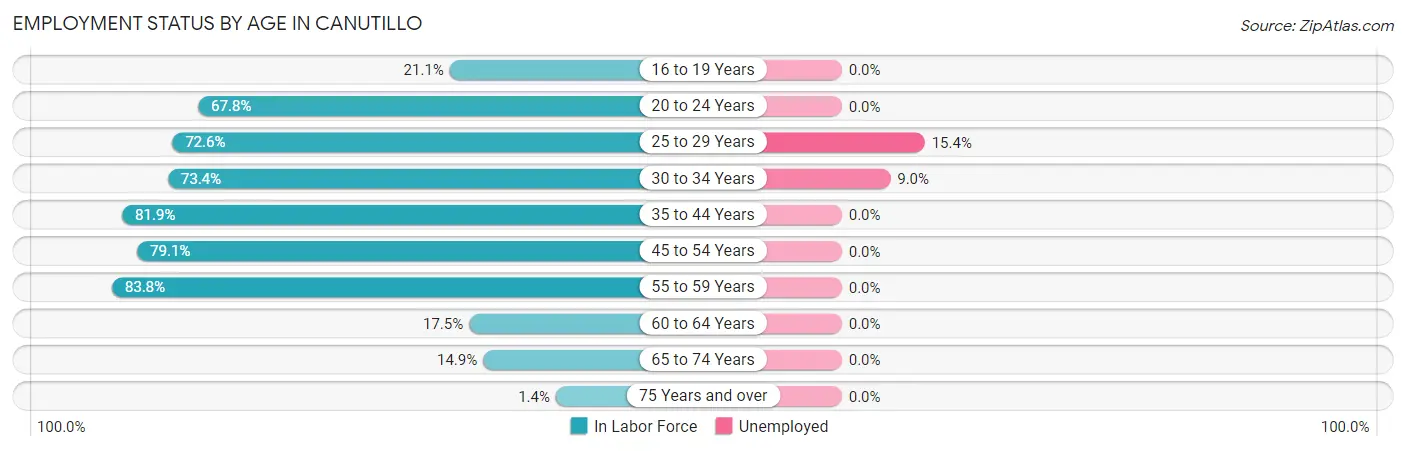
| Age Bracket | In Labor Force | Unemployed |
| 16 to 19 Years | 103 (21.1%) | 0 (0.0%) |
| 20 to 24 Years | 164 (67.8%) | 0 (0.0%) |
| 25 to 29 Years | 241 (72.6%) | 37 (15.4%) |
| 30 to 34 Years | 379 (73.4%) | 34 (9.0%) |
| 35 to 44 Years | 963 (81.9%) | 0 (0.0%) |
| 45 to 54 Years | 419 (79.1%) | 0 (0.0%) |
| 55 to 59 Years | 202 (83.8%) | 0 (0.0%) |
| 60 to 64 Years | 41 (17.5%) | 0 (0.0%) |
| 65 to 74 Years | 56 (14.9%) | 0 (0.0%) |
| 75 Years and over | 4 (1.4%) | 0 (0.0%) |
| Total | 2,573 (58.3%) | 72 (2.8%) |
Employment Status by Educational Attainment in Canutillo
According to labor force statistics for Canutillo, 74.1% of individuals (2,244) out of the total population between 25 and 64 years of age (3,029) are in the labor force, with 3.2% or 72 of them being unemployed. The group with the highest labor force participation rate are those with the educational attainment of bachelor's degree or higher, with 93.9% or 581 individuals in the labor force. Within the labor force, individuals with bachelor's degree or higher education have the highest percentage of unemployment, with 5.9% or 34 of them being unemployed.
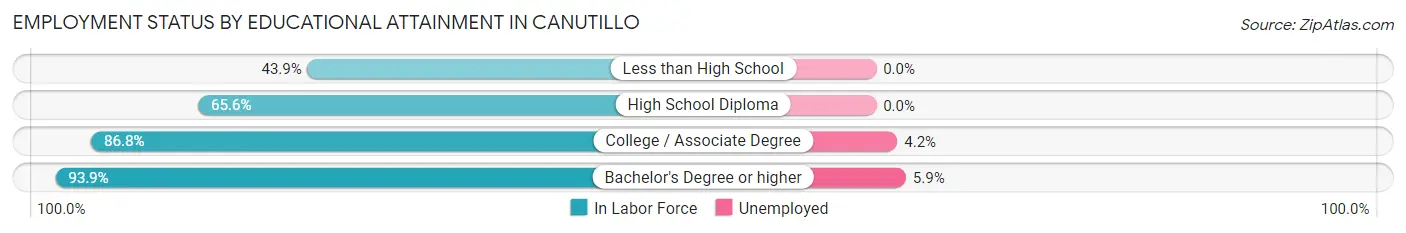
| Educational Attainment | In Labor Force | Unemployed |
| Less than High School | 272 (43.9%) | 0 (0.0%) |
| High School Diploma | 502 (65.6%) | 0 (0.0%) |
| College / Associate Degree | 890 (86.8%) | 43 (4.2%) |
| Bachelor's Degree or higher | 581 (93.9%) | 37 (5.9%) |
| Total | 2,244 (74.1%) | 97 (3.2%) |
Employment Occupations by Sex in Canutillo
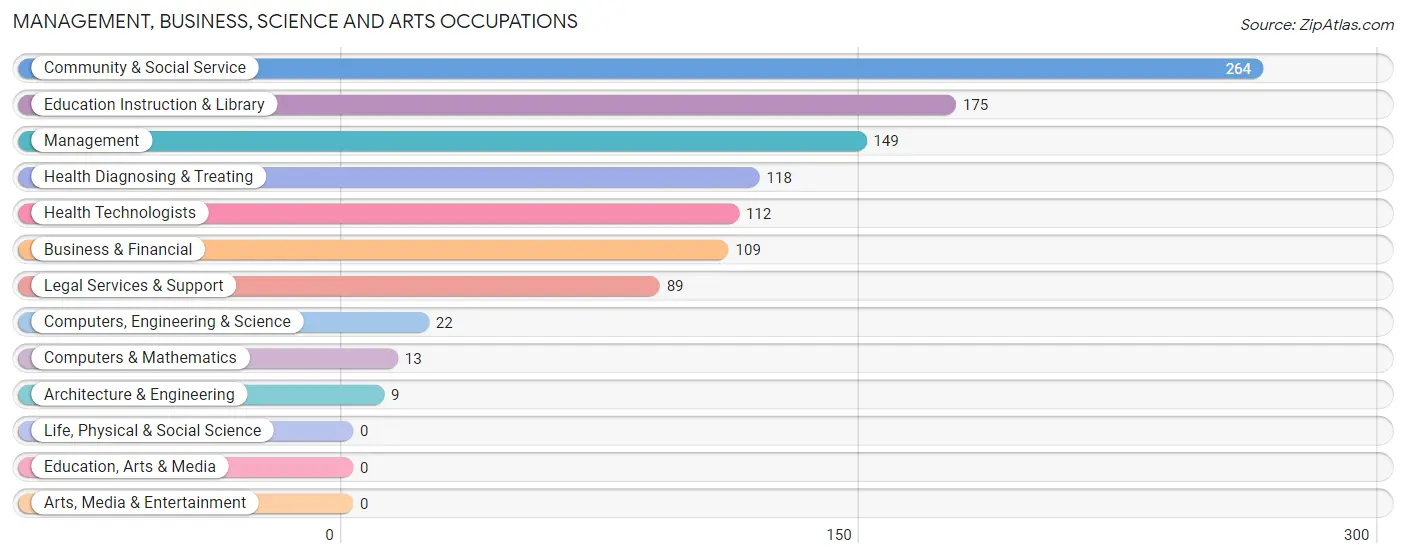
Management, Business, Science and Arts Occupations
The most common Management, Business, Science and Arts occupations in Canutillo are Community & Social Service (264 | 10.6%), Education Instruction & Library (175 | 7.0%), Management (149 | 6.0%), Health Diagnosing & Treating (118 | 4.7%), and Health Technologists (112 | 4.5%).
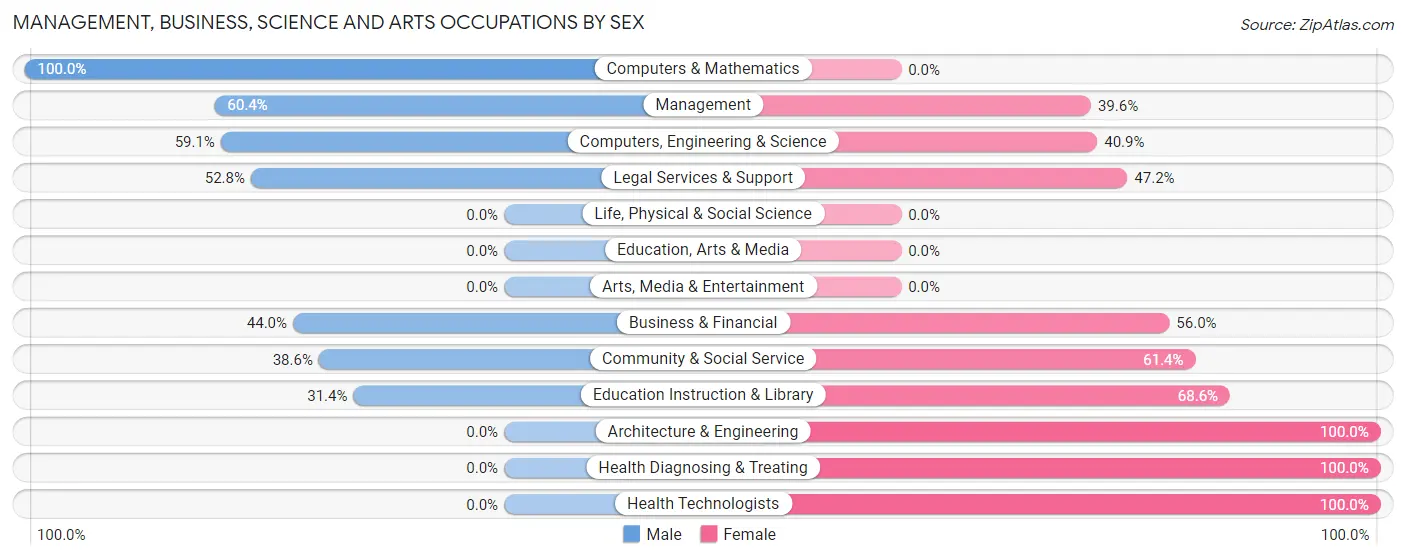
Management, Business, Science and Arts Occupations by Sex
Within the Management, Business, Science and Arts occupations in Canutillo, the most male-oriented occupations are Computers & Mathematics (100.0%), Management (60.4%), and Computers, Engineering & Science (59.1%), while the most female-oriented occupations are Architecture & Engineering (100.0%), Health Diagnosing & Treating (100.0%), and Health Technologists (100.0%).
| Occupation | Male | Female |
| Management | 90 (60.4%) | 59 (39.6%) |
| Business & Financial | 48 (44.0%) | 61 (56.0%) |
| Computers, Engineering & Science | 13 (59.1%) | 9 (40.9%) |
| Computers & Mathematics | 13 (100.0%) | 0 (0.0%) |
| Architecture & Engineering | 0 (0.0%) | 9 (100.0%) |
| Life, Physical & Social Science | 0 (0.0%) | 0 (0.0%) |
| Community & Social Service | 102 (38.6%) | 162 (61.4%) |
| Education, Arts & Media | 0 (0.0%) | 0 (0.0%) |
| Legal Services & Support | 47 (52.8%) | 42 (47.2%) |
| Education Instruction & Library | 55 (31.4%) | 120 (68.6%) |
| Arts, Media & Entertainment | 0 (0.0%) | 0 (0.0%) |
| Health Diagnosing & Treating | 0 (0.0%) | 118 (100.0%) |
| Health Technologists | 0 (0.0%) | 112 (100.0%) |
| Total (Category) | 253 (38.2%) | 409 (61.8%) |
| Total (Overall) | 1,389 (55.5%) | 1,112 (44.5%) |
Services Occupations
The most common Services occupations in Canutillo are Security & Protection (129 | 5.2%), Cleaning & Maintenance (128 | 5.1%), Law Enforcement (103 | 4.1%), Food Preparation & Serving (98 | 3.9%), and Healthcare Support (57 | 2.3%).

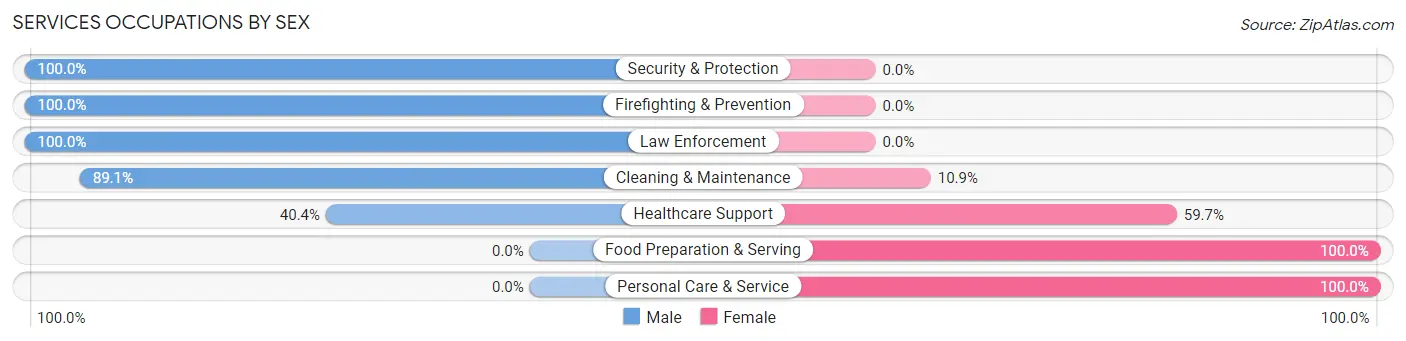
Services Occupations by Sex
Within the Services occupations in Canutillo, the most male-oriented occupations are Security & Protection (100.0%), Firefighting & Prevention (100.0%), and Law Enforcement (100.0%), while the most female-oriented occupations are Food Preparation & Serving (100.0%), Personal Care & Service (100.0%), and Healthcare Support (59.7%).
| Occupation | Male | Female |
| Healthcare Support | 23 (40.4%) | 34 (59.7%) |
| Security & Protection | 129 (100.0%) | 0 (0.0%) |
| Firefighting & Prevention | 26 (100.0%) | 0 (0.0%) |
| Law Enforcement | 103 (100.0%) | 0 (0.0%) |
| Food Preparation & Serving | 0 (0.0%) | 98 (100.0%) |
| Cleaning & Maintenance | 114 (89.1%) | 14 (10.9%) |
| Personal Care & Service | 0 (0.0%) | 55 (100.0%) |
| Total (Category) | 266 (57.0%) | 201 (43.0%) |
| Total (Overall) | 1,389 (55.5%) | 1,112 (44.5%) |
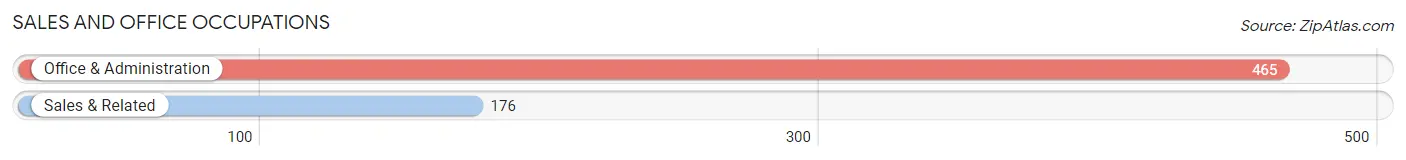
Sales and Office Occupations
The most common Sales and Office occupations in Canutillo are Office & Administration (465 | 18.6%), and Sales & Related (176 | 7.0%).
Sales and Office Occupations by Sex
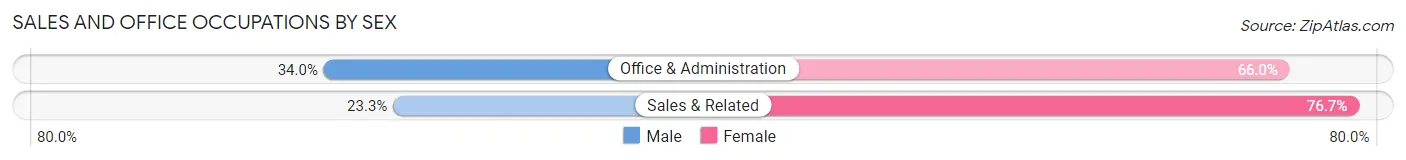
| Occupation | Male | Female |
| Sales & Related | 41 (23.3%) | 135 (76.7%) |
| Office & Administration | 158 (34.0%) | 307 (66.0%) |
| Total (Category) | 199 (31.0%) | 442 (69.0%) |
| Total (Overall) | 1,389 (55.5%) | 1,112 (44.5%) |
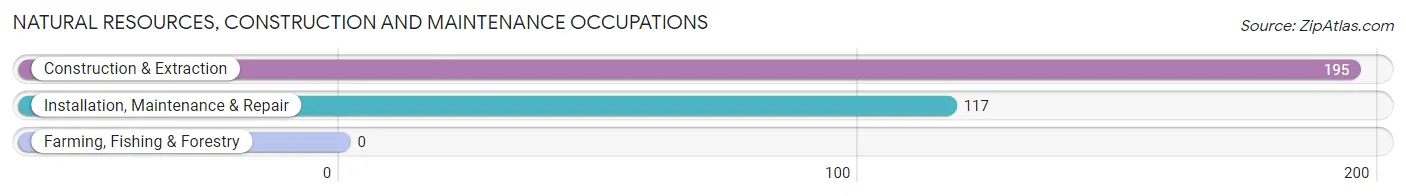
Natural Resources, Construction and Maintenance Occupations
The most common Natural Resources, Construction and Maintenance occupations in Canutillo are Construction & Extraction (195 | 7.8%), and Installation, Maintenance & Repair (117 | 4.7%).
Natural Resources, Construction and Maintenance Occupations by Sex
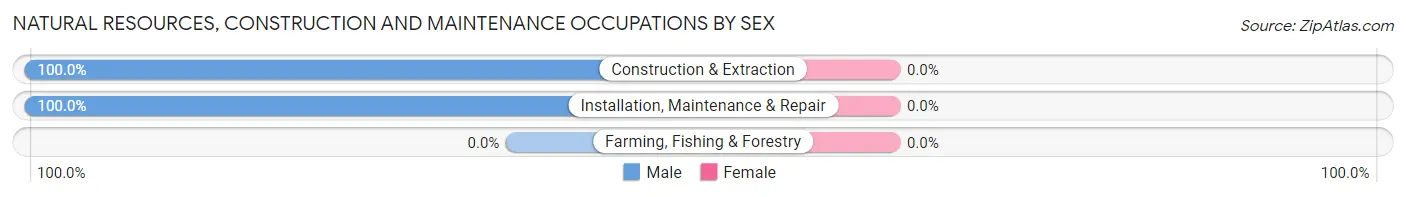
| Occupation | Male | Female |
| Farming, Fishing & Forestry | 0 (0.0%) | 0 (0.0%) |
| Construction & Extraction | 195 (100.0%) | 0 (0.0%) |
| Installation, Maintenance & Repair | 117 (100.0%) | 0 (0.0%) |
| Total (Category) | 312 (100.0%) | 0 (0.0%) |
| Total (Overall) | 1,389 (55.5%) | 1,112 (44.5%) |
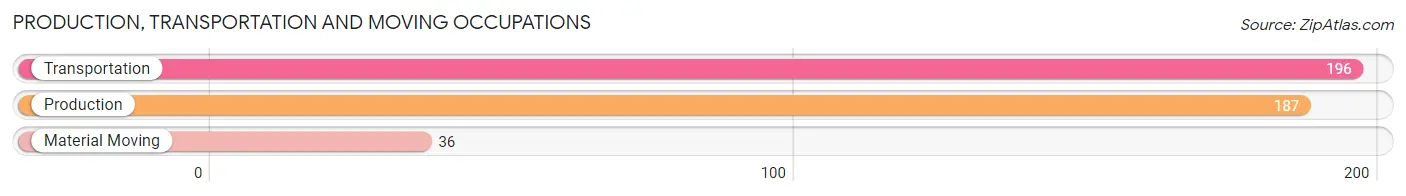
Production, Transportation and Moving Occupations
The most common Production, Transportation and Moving occupations in Canutillo are Transportation (196 | 7.8%), Production (187 | 7.5%), and Material Moving (36 | 1.4%).
Production, Transportation and Moving Occupations by Sex
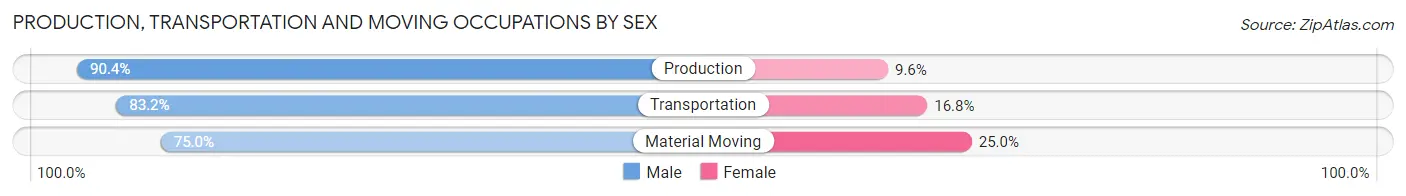
| Occupation | Male | Female |
| Production | 169 (90.4%) | 18 (9.6%) |
| Transportation | 163 (83.2%) | 33 (16.8%) |
| Material Moving | 27 (75.0%) | 9 (25.0%) |
| Total (Category) | 359 (85.7%) | 60 (14.3%) |
| Total (Overall) | 1,389 (55.5%) | 1,112 (44.5%) |
Employment Industries by Sex in Canutillo
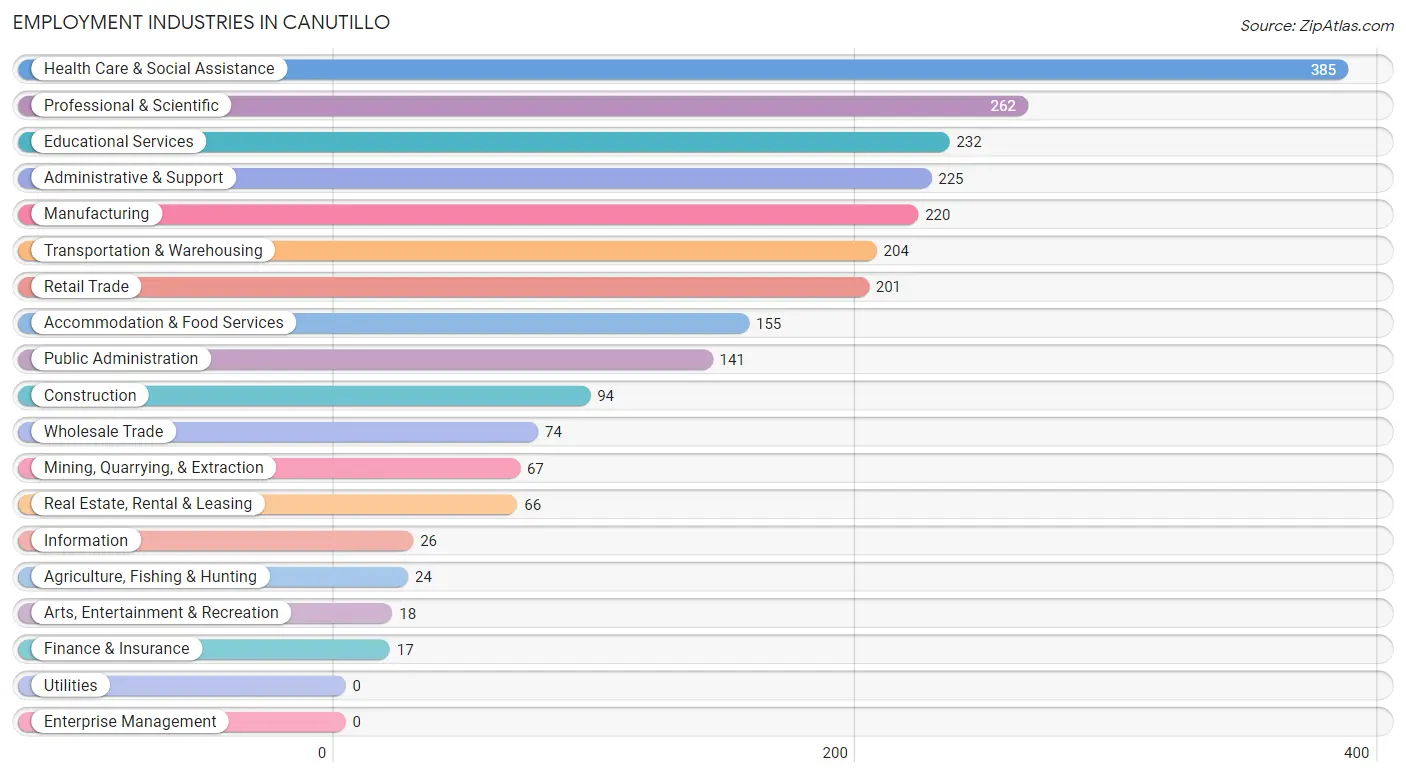
Employment Industries in Canutillo
The major employment industries in Canutillo include Health Care & Social Assistance (385 | 15.4%), Professional & Scientific (262 | 10.5%), Educational Services (232 | 9.3%), Administrative & Support (225 | 9.0%), and Manufacturing (220 | 8.8%).
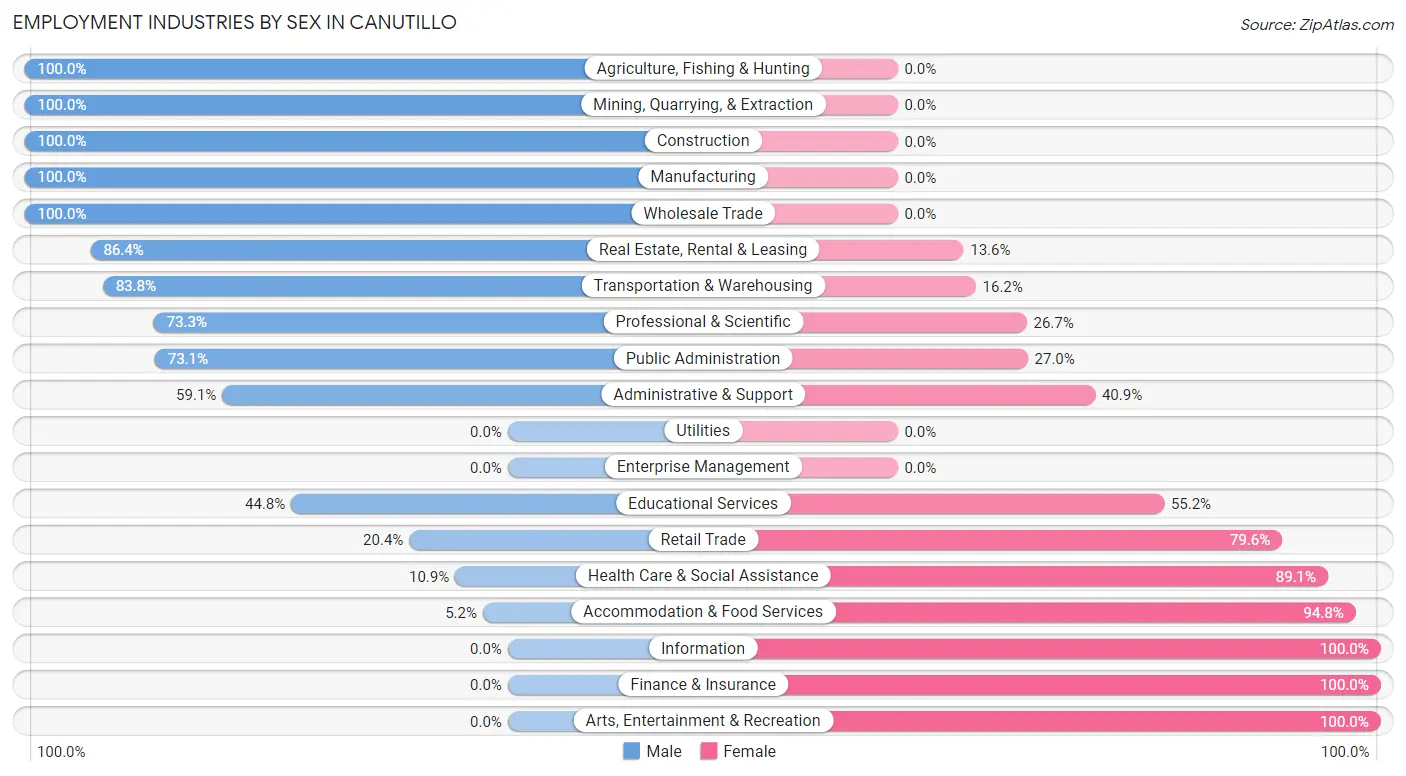
Employment Industries by Sex in Canutillo
The Canutillo industries that see more men than women are Agriculture, Fishing & Hunting (100.0%), Mining, Quarrying, & Extraction (100.0%), and Construction (100.0%), whereas the industries that tend to have a higher number of women are Information (100.0%), Finance & Insurance (100.0%), and Arts, Entertainment & Recreation (100.0%).
| Industry | Male | Female |
| Agriculture, Fishing & Hunting | 24 (100.0%) | 0 (0.0%) |
| Mining, Quarrying, & Extraction | 67 (100.0%) | 0 (0.0%) |
| Construction | 94 (100.0%) | 0 (0.0%) |
| Manufacturing | 220 (100.0%) | 0 (0.0%) |
| Wholesale Trade | 74 (100.0%) | 0 (0.0%) |
| Retail Trade | 41 (20.4%) | 160 (79.6%) |
| Transportation & Warehousing | 171 (83.8%) | 33 (16.2%) |
| Utilities | 0 (0.0%) | 0 (0.0%) |
| Information | 0 (0.0%) | 26 (100.0%) |
| Finance & Insurance | 0 (0.0%) | 17 (100.0%) |
| Real Estate, Rental & Leasing | 57 (86.4%) | 9 (13.6%) |
| Professional & Scientific | 192 (73.3%) | 70 (26.7%) |
| Enterprise Management | 0 (0.0%) | 0 (0.0%) |
| Administrative & Support | 133 (59.1%) | 92 (40.9%) |
| Educational Services | 104 (44.8%) | 128 (55.2%) |
| Health Care & Social Assistance | 42 (10.9%) | 343 (89.1%) |
| Arts, Entertainment & Recreation | 0 (0.0%) | 18 (100.0%) |
| Accommodation & Food Services | 8 (5.2%) | 147 (94.8%) |
| Public Administration | 103 (73.1%) | 38 (27.0%) |
| Total | 1,389 (55.5%) | 1,112 (44.5%) |
Education in Canutillo
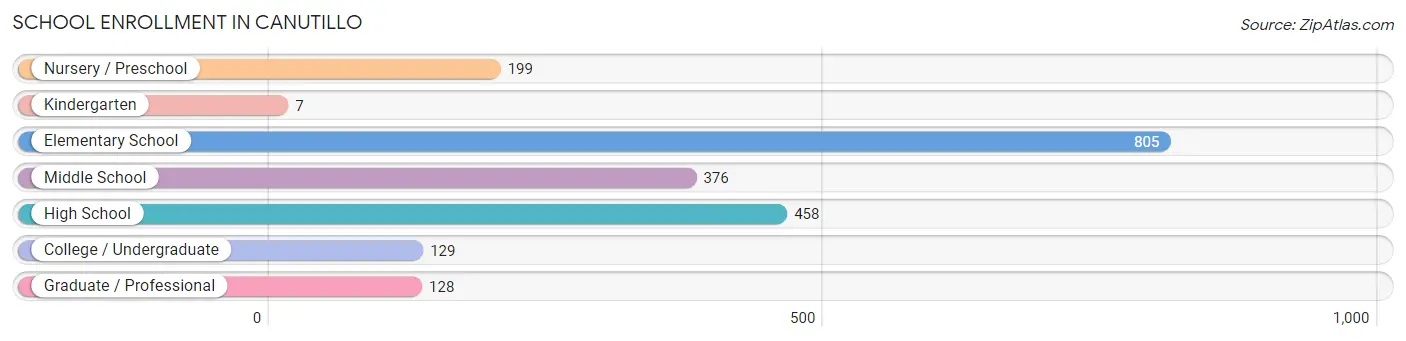
School Enrollment in Canutillo
The most common levels of schooling among the 2,102 students in Canutillo are elementary school (805 | 38.3%), high school (458 | 21.8%), and middle school (376 | 17.9%).
| School Level | # Students | % Students |
| Nursery / Preschool | 199 | 9.5% |
| Kindergarten | 7 | 0.3% |
| Elementary School | 805 | 38.3% |
| Middle School | 376 | 17.9% |
| High School | 458 | 21.8% |
| College / Undergraduate | 129 | 6.1% |
| Graduate / Professional | 128 | 6.1% |
| Total | 2,102 | 100.0% |
School Enrollment by Age by Funding Source in Canutillo
Out of a total of 2,102 students who are enrolled in schools in Canutillo, 158 (7.5%) attend a private institution, while the remaining 1,944 (92.5%) are enrolled in public schools. The age group of 25 to 34 year olds has the highest likelihood of being enrolled in private schools, with 49 (58.3% in the age bracket) enrolled. Conversely, the age group of 10 to 14 year olds has the lowest likelihood of being enrolled in a private school, with 548 (100.0% in the age bracket) attending a public institution.
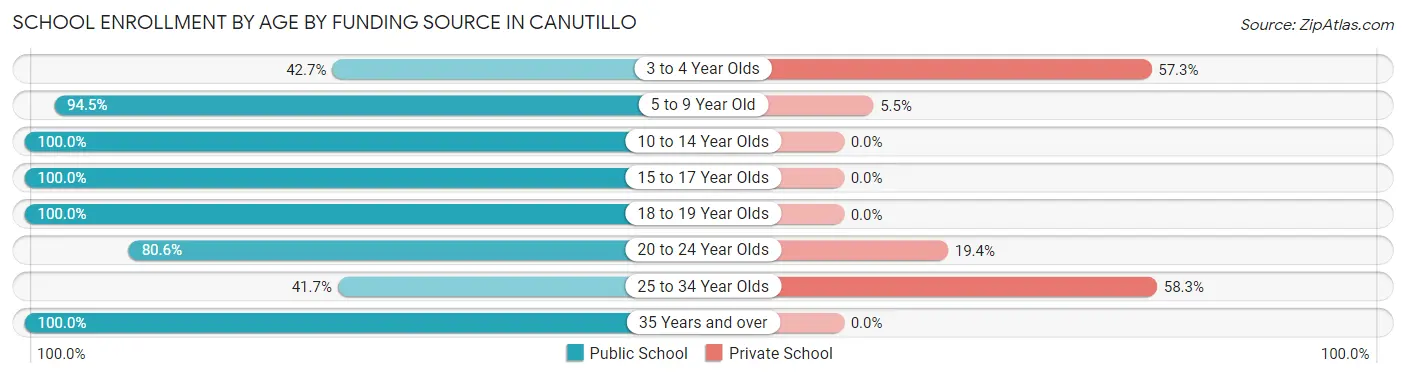
| Age Bracket | Public School | Private School |
| 3 to 4 Year Olds | 38 (42.7%) | 51 (57.3%) |
| 5 to 9 Year Old | 773 (94.5%) | 45 (5.5%) |
| 10 to 14 Year Olds | 548 (100.0%) | 0 (0.0%) |
| 15 to 17 Year Olds | 363 (100.0%) | 0 (0.0%) |
| 18 to 19 Year Olds | 113 (100.0%) | 0 (0.0%) |
| 20 to 24 Year Olds | 54 (80.6%) | 13 (19.4%) |
| 25 to 34 Year Olds | 35 (41.7%) | 49 (58.3%) |
| 35 Years and over | 20 (100.0%) | 0 (0.0%) |
| Total | 1,944 (92.5%) | 158 (7.5%) |
Educational Attainment by Field of Study in Canutillo
Psychology (150 | 21.4%), engineering (81 | 11.6%), science & technology (76 | 10.8%), multidisciplinary studies (74 | 10.6%), and social sciences (67 | 9.6%) are the most common fields of study among 701 individuals in Canutillo who have obtained a bachelor's degree or higher.
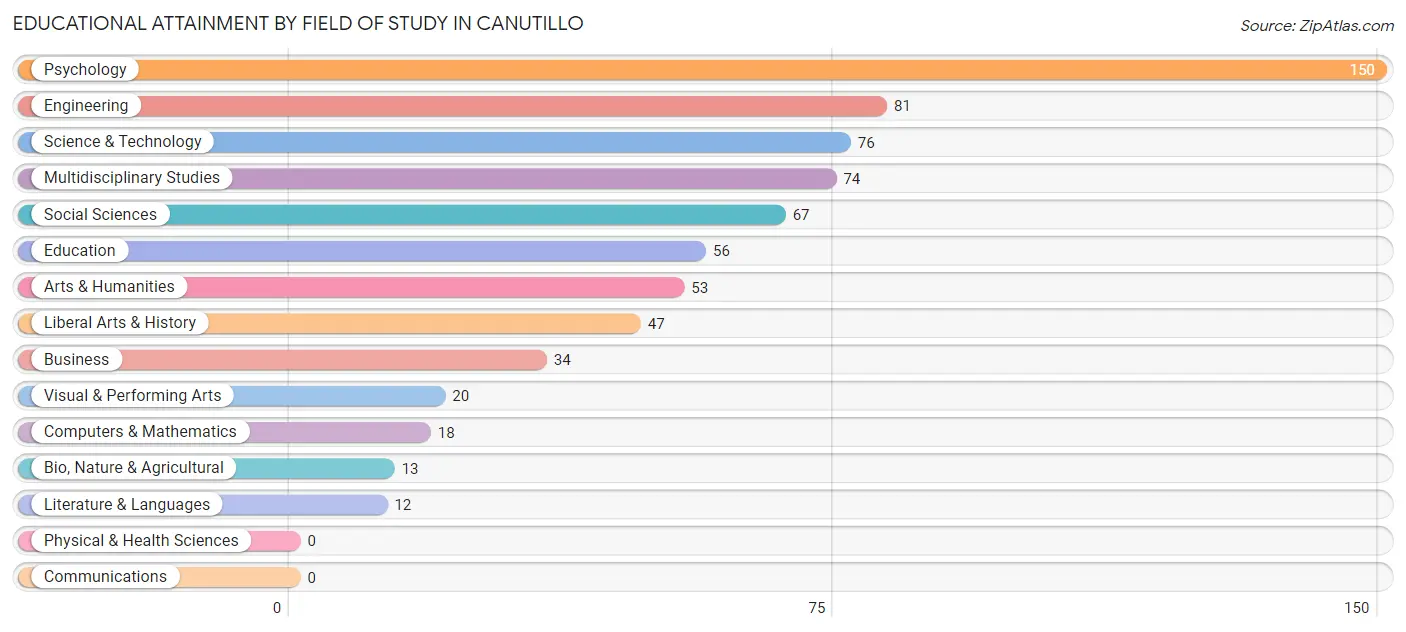
| Field of Study | # Graduates | % Graduates |
| Computers & Mathematics | 18 | 2.6% |
| Bio, Nature & Agricultural | 13 | 1.8% |
| Physical & Health Sciences | 0 | 0.0% |
| Psychology | 150 | 21.4% |
| Social Sciences | 67 | 9.6% |
| Engineering | 81 | 11.6% |
| Multidisciplinary Studies | 74 | 10.6% |
| Science & Technology | 76 | 10.8% |
| Business | 34 | 4.9% |
| Education | 56 | 8.0% |
| Literature & Languages | 12 | 1.7% |
| Liberal Arts & History | 47 | 6.7% |
| Visual & Performing Arts | 20 | 2.9% |
| Communications | 0 | 0.0% |
| Arts & Humanities | 53 | 7.6% |
| Total | 701 | 100.0% |
Transportation & Commute in Canutillo
Vehicle Availability by Sex in Canutillo
The most prevalent vehicle ownership categories in Canutillo are males with 2 vehicles (716, accounting for 51.5%) and females with 2 vehicles (528, making up 64.4%).
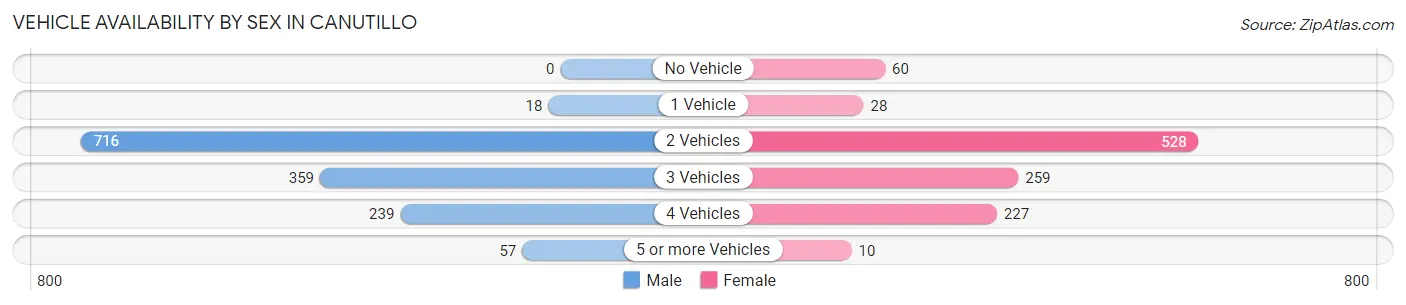
| Vehicles Available | Male | Female |
| No Vehicle | 0 (0.0%) | 60 (5.4%) |
| 1 Vehicle | 18 (1.3%) | 28 (2.5%) |
| 2 Vehicles | 716 (51.5%) | 528 (47.5%) |
| 3 Vehicles | 359 (25.9%) | 259 (23.3%) |
| 4 Vehicles | 239 (17.2%) | 227 (20.4%) |
| 5 or more Vehicles | 57 (4.1%) | 10 (0.9%) |
| Total | 1,389 (100.0%) | 1,112 (100.0%) |
Commute Time in Canutillo
The most frequently occuring commute durations in Canutillo are 30 to 34 minutes (581 commuters, 26.3%), 5 to 9 minutes (359 commuters, 16.2%), and 15 to 19 minutes (280 commuters, 12.7%).
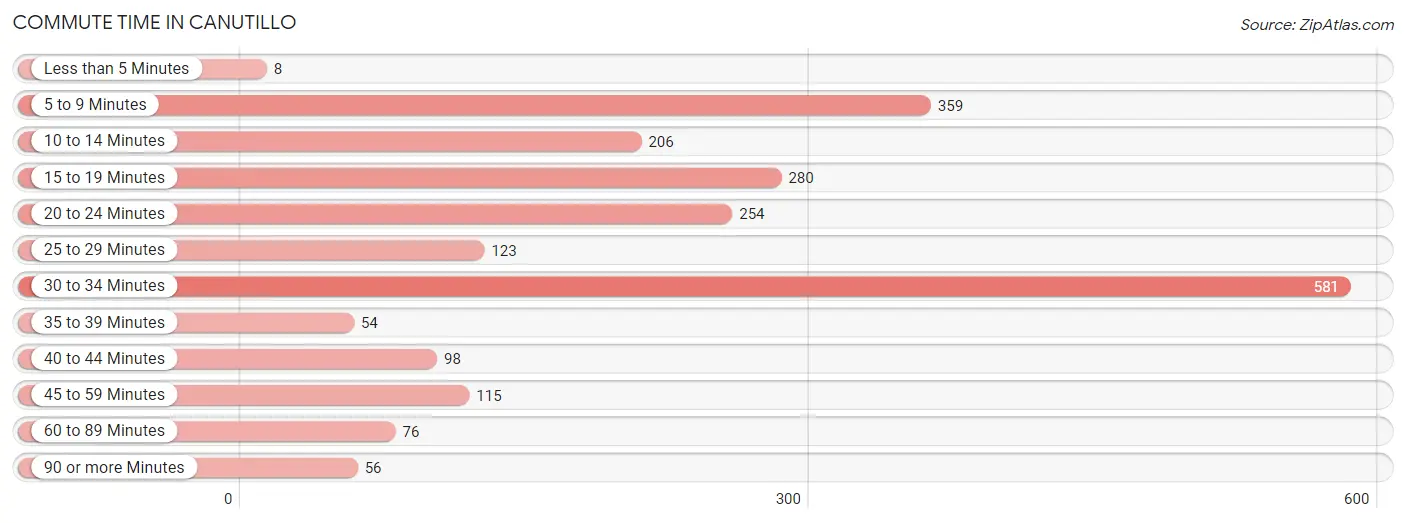
| Commute Time | # Commuters | % Commuters |
| Less than 5 Minutes | 8 | 0.4% |
| 5 to 9 Minutes | 359 | 16.2% |
| 10 to 14 Minutes | 206 | 9.3% |
| 15 to 19 Minutes | 280 | 12.7% |
| 20 to 24 Minutes | 254 | 11.5% |
| 25 to 29 Minutes | 123 | 5.6% |
| 30 to 34 Minutes | 581 | 26.3% |
| 35 to 39 Minutes | 54 | 2.4% |
| 40 to 44 Minutes | 98 | 4.4% |
| 45 to 59 Minutes | 115 | 5.2% |
| 60 to 89 Minutes | 76 | 3.4% |
| 90 or more Minutes | 56 | 2.5% |
Commute Time by Sex in Canutillo
The most common commute times in Canutillo are 30 to 34 minutes (397 commuters, 33.4%) for males and 30 to 34 minutes (184 commuters, 18.0%) for females.
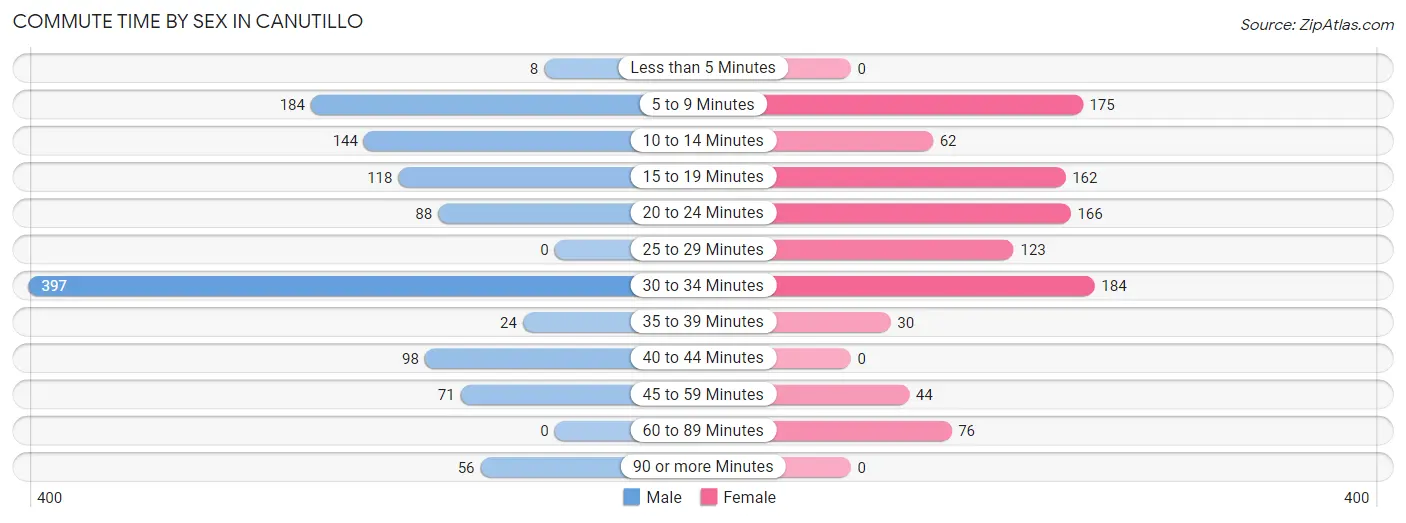
| Commute Time | Male | Female |
| Less than 5 Minutes | 8 (0.7%) | 0 (0.0%) |
| 5 to 9 Minutes | 184 (15.5%) | 175 (17.1%) |
| 10 to 14 Minutes | 144 (12.1%) | 62 (6.1%) |
| 15 to 19 Minutes | 118 (9.9%) | 162 (15.9%) |
| 20 to 24 Minutes | 88 (7.4%) | 166 (16.2%) |
| 25 to 29 Minutes | 0 (0.0%) | 123 (12.0%) |
| 30 to 34 Minutes | 397 (33.4%) | 184 (18.0%) |
| 35 to 39 Minutes | 24 (2.0%) | 30 (2.9%) |
| 40 to 44 Minutes | 98 (8.3%) | 0 (0.0%) |
| 45 to 59 Minutes | 71 (6.0%) | 44 (4.3%) |
| 60 to 89 Minutes | 0 (0.0%) | 76 (7.4%) |
| 90 or more Minutes | 56 (4.7%) | 0 (0.0%) |
Time of Departure to Work by Sex in Canutillo
The most frequent times of departure to work in Canutillo are 6:00 AM to 6:29 AM (320, 26.9%) for males and 7:00 AM to 7:29 AM (220, 21.5%) for females.
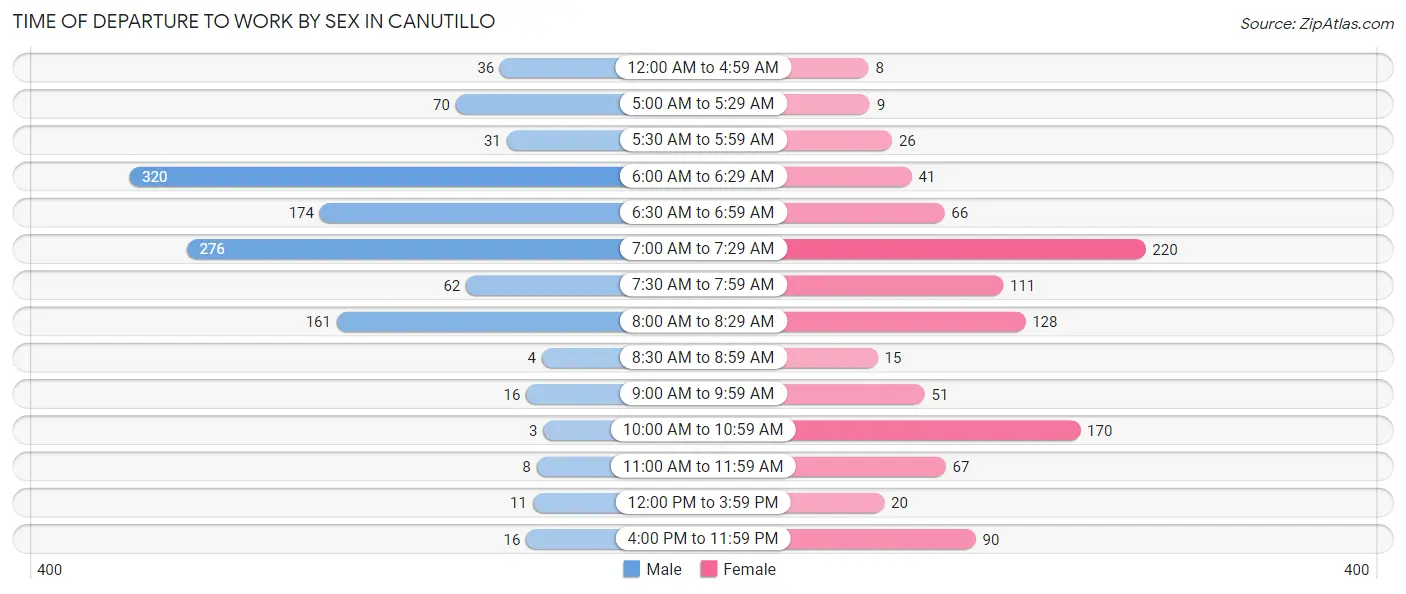
| Time of Departure | Male | Female |
| 12:00 AM to 4:59 AM | 36 (3.0%) | 8 (0.8%) |
| 5:00 AM to 5:29 AM | 70 (5.9%) | 9 (0.9%) |
| 5:30 AM to 5:59 AM | 31 (2.6%) | 26 (2.5%) |
| 6:00 AM to 6:29 AM | 320 (26.9%) | 41 (4.0%) |
| 6:30 AM to 6:59 AM | 174 (14.6%) | 66 (6.5%) |
| 7:00 AM to 7:29 AM | 276 (23.2%) | 220 (21.5%) |
| 7:30 AM to 7:59 AM | 62 (5.2%) | 111 (10.9%) |
| 8:00 AM to 8:29 AM | 161 (13.6%) | 128 (12.5%) |
| 8:30 AM to 8:59 AM | 4 (0.3%) | 15 (1.5%) |
| 9:00 AM to 9:59 AM | 16 (1.3%) | 51 (5.0%) |
| 10:00 AM to 10:59 AM | 3 (0.3%) | 170 (16.6%) |
| 11:00 AM to 11:59 AM | 8 (0.7%) | 67 (6.6%) |
| 12:00 PM to 3:59 PM | 11 (0.9%) | 20 (2.0%) |
| 4:00 PM to 11:59 PM | 16 (1.3%) | 90 (8.8%) |
| Total | 1,188 (100.0%) | 1,022 (100.0%) |
Housing Occupancy in Canutillo
Occupancy by Ownership in Canutillo
Of the total 1,979 dwellings in Canutillo, owner-occupied units account for 1,525 (77.1%), while renter-occupied units make up 454 (22.9%).
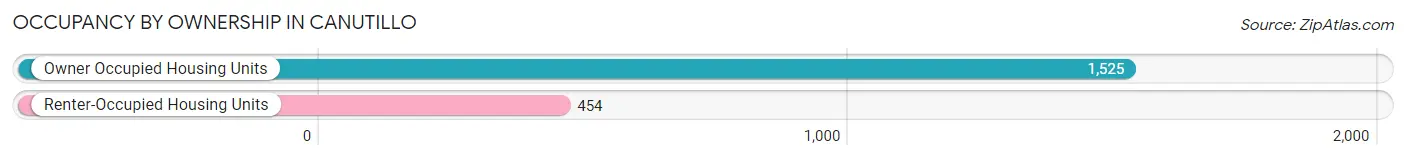
| Occupancy | # Housing Units | % Housing Units |
| Owner Occupied Housing Units | 1,525 | 77.1% |
| Renter-Occupied Housing Units | 454 | 22.9% |
| Total Occupied Housing Units | 1,979 | 100.0% |
Occupancy by Household Size in Canutillo
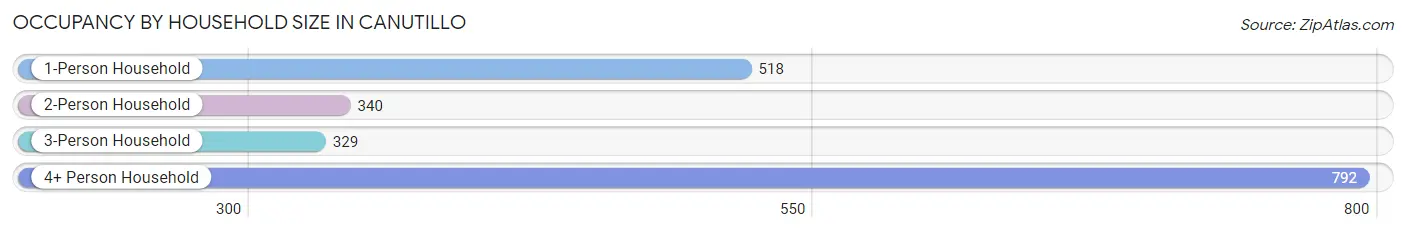
| Household Size | # Housing Units | % Housing Units |
| 1-Person Household | 518 | 26.2% |
| 2-Person Household | 340 | 17.2% |
| 3-Person Household | 329 | 16.6% |
| 4+ Person Household | 792 | 40.0% |
| Total Housing Units | 1,979 | 100.0% |
Occupancy by Ownership by Household Size in Canutillo
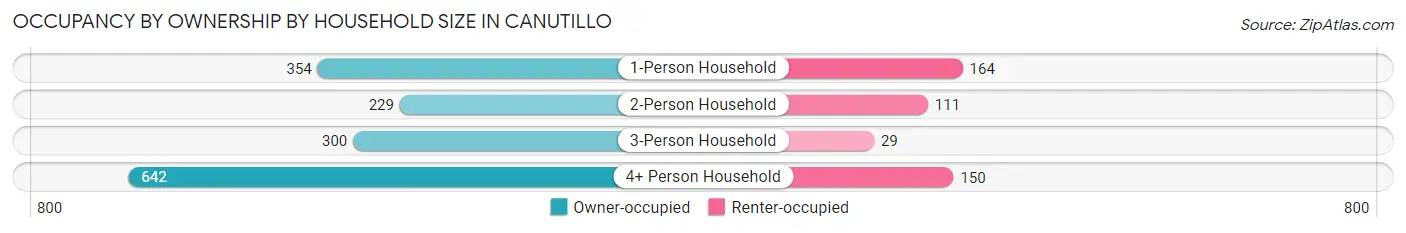
| Household Size | Owner-occupied | Renter-occupied |
| 1-Person Household | 354 (68.3%) | 164 (31.7%) |
| 2-Person Household | 229 (67.3%) | 111 (32.7%) |
| 3-Person Household | 300 (91.2%) | 29 (8.8%) |
| 4+ Person Household | 642 (81.1%) | 150 (18.9%) |
| Total Housing Units | 1,525 (77.1%) | 454 (22.9%) |
Occupancy by Educational Attainment in Canutillo
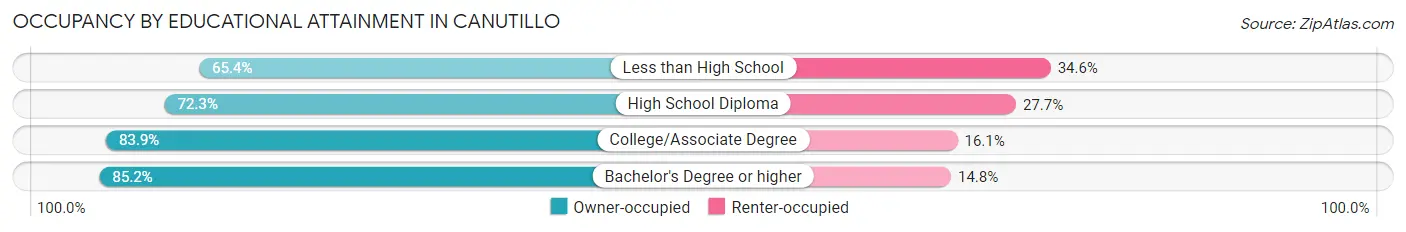
| Household Size | Owner-occupied | Renter-occupied |
| Less than High School | 310 (65.4%) | 164 (34.6%) |
| High School Diploma | 323 (72.3%) | 124 (27.7%) |
| College/Associate Degree | 582 (83.9%) | 112 (16.1%) |
| Bachelor's Degree or higher | 310 (85.2%) | 54 (14.8%) |
Occupancy by Age of Householder in Canutillo
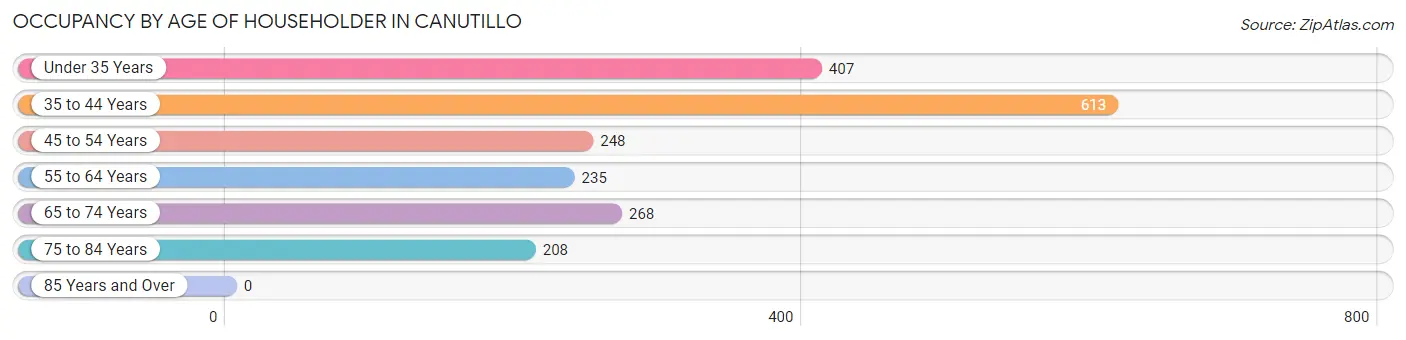
| Age Bracket | # Households | % Households |
| Under 35 Years | 407 | 20.6% |
| 35 to 44 Years | 613 | 31.0% |
| 45 to 54 Years | 248 | 12.5% |
| 55 to 64 Years | 235 | 11.9% |
| 65 to 74 Years | 268 | 13.5% |
| 75 to 84 Years | 208 | 10.5% |
| 85 Years and Over | 0 | 0.0% |
| Total | 1,979 | 100.0% |
Housing Finances in Canutillo
Median Income by Occupancy in Canutillo
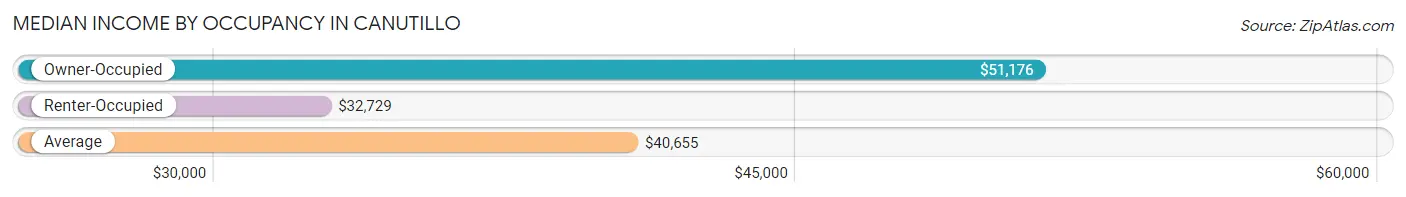
| Occupancy Type | # Households | Median Income |
| Owner-Occupied | 1,525 (77.1%) | $51,176 |
| Renter-Occupied | 454 (22.9%) | $32,729 |
| Average | 1,979 (100.0%) | $40,655 |
Occupancy by Householder Income Bracket in Canutillo
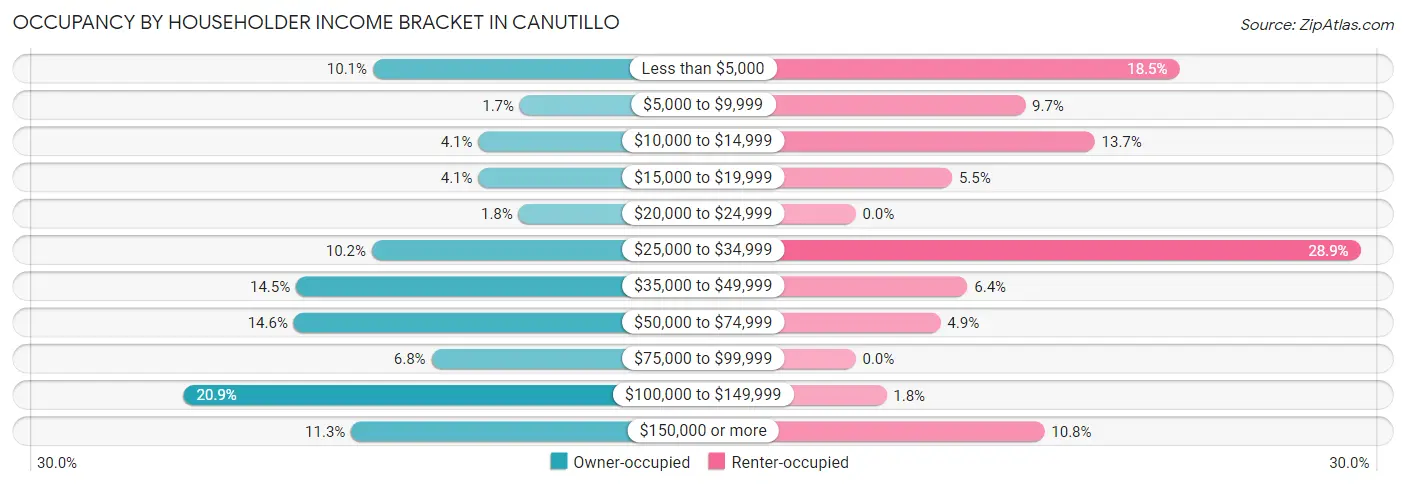
| Income Bracket | Owner-occupied | Renter-occupied |
| Less than $5,000 | 154 (10.1%) | 84 (18.5%) |
| $5,000 to $9,999 | 26 (1.7%) | 44 (9.7%) |
| $10,000 to $14,999 | 62 (4.1%) | 62 (13.7%) |
| $15,000 to $19,999 | 62 (4.1%) | 25 (5.5%) |
| $20,000 to $24,999 | 27 (1.8%) | 0 (0.0%) |
| $25,000 to $34,999 | 155 (10.2%) | 131 (28.8%) |
| $35,000 to $49,999 | 221 (14.5%) | 29 (6.4%) |
| $50,000 to $74,999 | 223 (14.6%) | 22 (4.9%) |
| $75,000 to $99,999 | 103 (6.8%) | 0 (0.0%) |
| $100,000 to $149,999 | 319 (20.9%) | 8 (1.8%) |
| $150,000 or more | 173 (11.3%) | 49 (10.8%) |
| Total | 1,525 (100.0%) | 454 (100.0%) |
Monthly Housing Cost Tiers in Canutillo
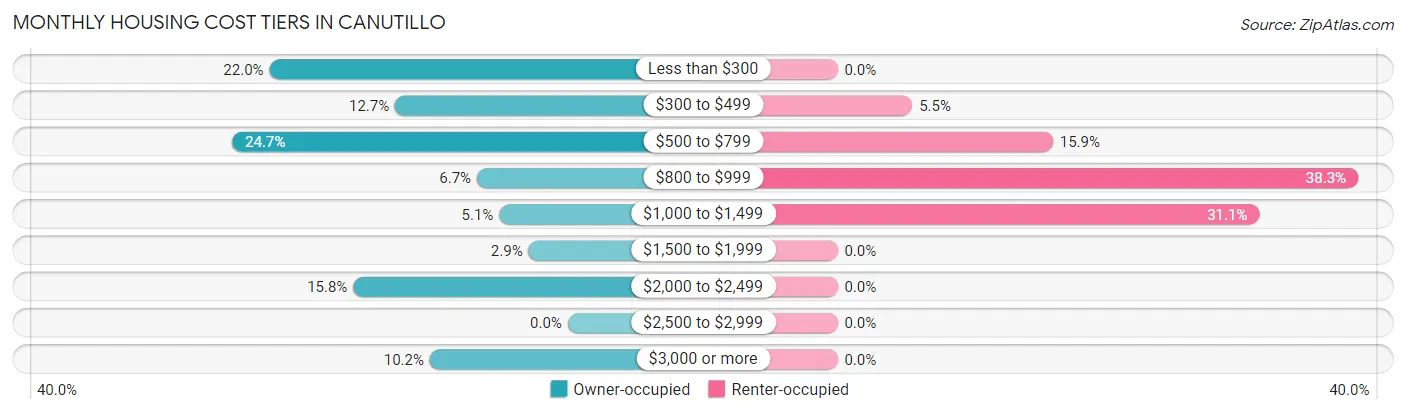
| Monthly Cost | Owner-occupied | Renter-occupied |
| Less than $300 | 335 (22.0%) | 0 (0.0%) |
| $300 to $499 | 194 (12.7%) | 25 (5.5%) |
| $500 to $799 | 377 (24.7%) | 72 (15.9%) |
| $800 to $999 | 102 (6.7%) | 174 (38.3%) |
| $1,000 to $1,499 | 77 (5.1%) | 141 (31.1%) |
| $1,500 to $1,999 | 44 (2.9%) | 0 (0.0%) |
| $2,000 to $2,499 | 241 (15.8%) | 0 (0.0%) |
| $2,500 to $2,999 | 0 (0.0%) | 0 (0.0%) |
| $3,000 or more | 155 (10.2%) | 0 (0.0%) |
| Total | 1,525 (100.0%) | 454 (100.0%) |
Physical Housing Characteristics in Canutillo
Housing Structures in Canutillo
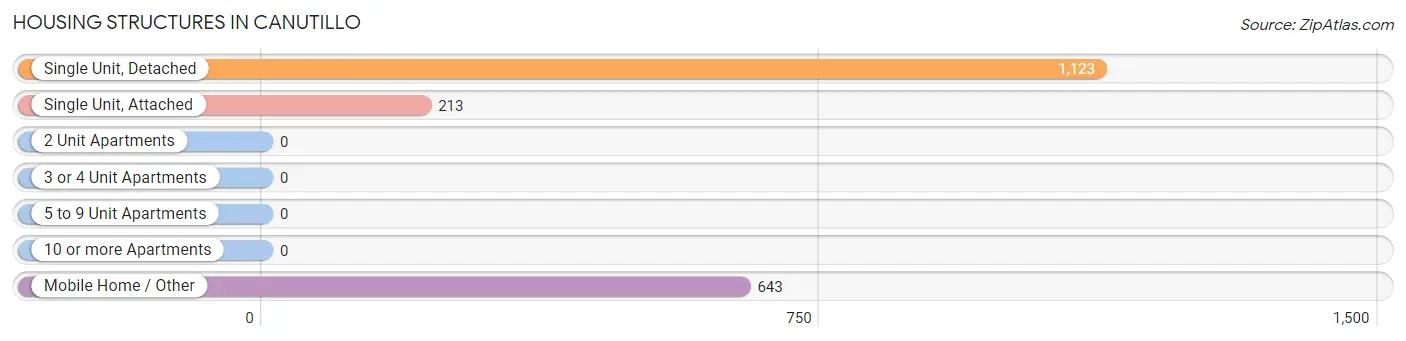
| Structure Type | # Housing Units | % Housing Units |
| Single Unit, Detached | 1,123 | 56.8% |
| Single Unit, Attached | 213 | 10.8% |
| 2 Unit Apartments | 0 | 0.0% |
| 3 or 4 Unit Apartments | 0 | 0.0% |
| 5 to 9 Unit Apartments | 0 | 0.0% |
| 10 or more Apartments | 0 | 0.0% |
| Mobile Home / Other | 643 | 32.5% |
| Total | 1,979 | 100.0% |
Housing Structures by Occupancy in Canutillo
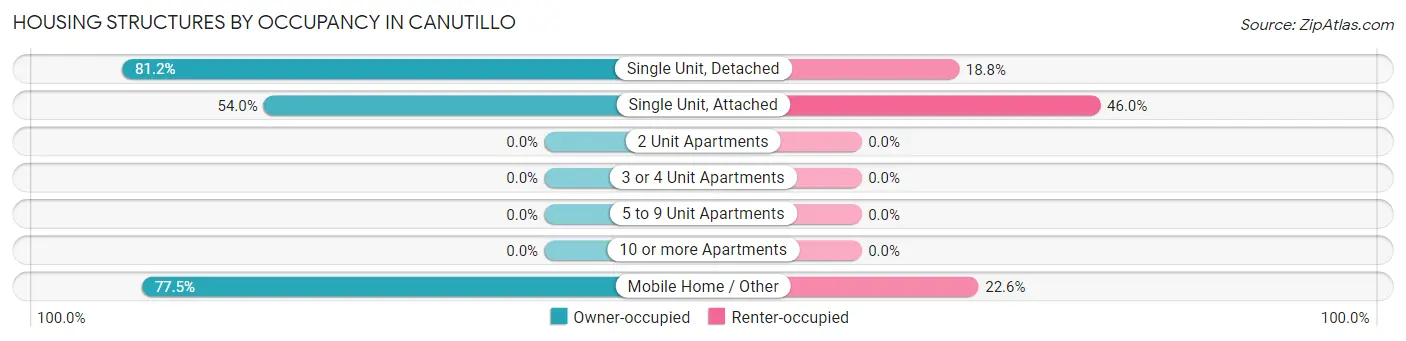
| Structure Type | Owner-occupied | Renter-occupied |
| Single Unit, Detached | 912 (81.2%) | 211 (18.8%) |
| Single Unit, Attached | 115 (54.0%) | 98 (46.0%) |
| 2 Unit Apartments | 0 (0.0%) | 0 (0.0%) |
| 3 or 4 Unit Apartments | 0 (0.0%) | 0 (0.0%) |
| 5 to 9 Unit Apartments | 0 (0.0%) | 0 (0.0%) |
| 10 or more Apartments | 0 (0.0%) | 0 (0.0%) |
| Mobile Home / Other | 498 (77.4%) | 145 (22.6%) |
| Total | 1,525 (77.1%) | 454 (22.9%) |
Housing Structures by Number of Rooms in Canutillo
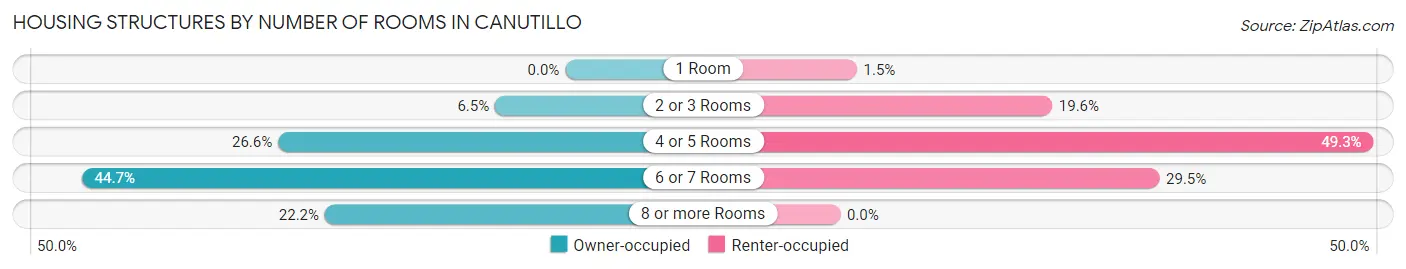
| Number of Rooms | Owner-occupied | Renter-occupied |
| 1 Room | 0 (0.0%) | 7 (1.5%) |
| 2 or 3 Rooms | 99 (6.5%) | 89 (19.6%) |
| 4 or 5 Rooms | 405 (26.6%) | 224 (49.3%) |
| 6 or 7 Rooms | 682 (44.7%) | 134 (29.5%) |
| 8 or more Rooms | 339 (22.2%) | 0 (0.0%) |
| Total | 1,525 (100.0%) | 454 (100.0%) |
Housing Structure by Heating Type in Canutillo
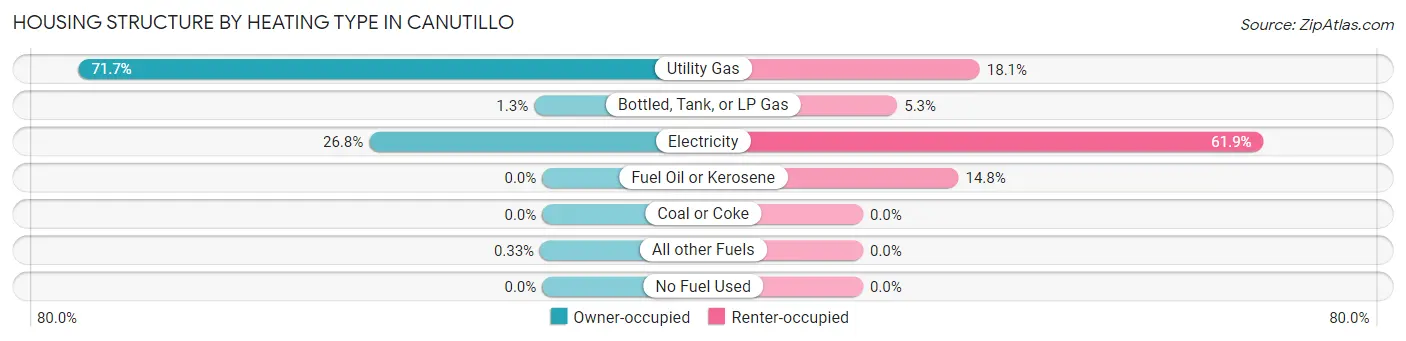
| Heating Type | Owner-occupied | Renter-occupied |
| Utility Gas | 1,093 (71.7%) | 82 (18.1%) |
| Bottled, Tank, or LP Gas | 19 (1.3%) | 24 (5.3%) |
| Electricity | 408 (26.8%) | 281 (61.9%) |
| Fuel Oil or Kerosene | 0 (0.0%) | 67 (14.8%) |
| Coal or Coke | 0 (0.0%) | 0 (0.0%) |
| All other Fuels | 5 (0.3%) | 0 (0.0%) |
| No Fuel Used | 0 (0.0%) | 0 (0.0%) |
| Total | 1,525 (100.0%) | 454 (100.0%) |
Household Vehicle Usage in Canutillo
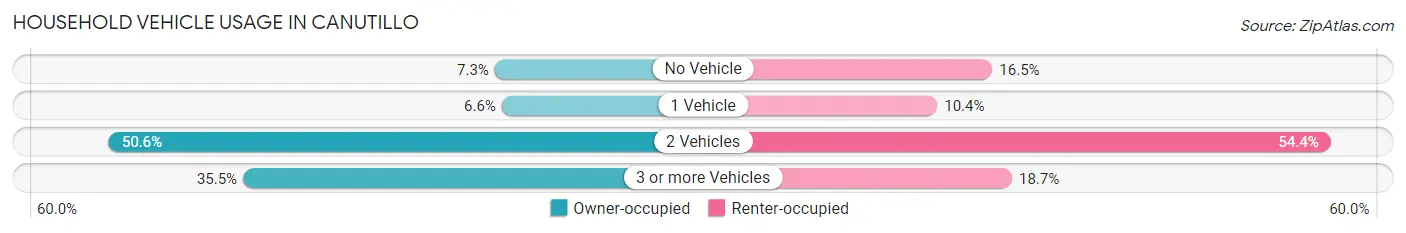
| Vehicles per Household | Owner-occupied | Renter-occupied |
| No Vehicle | 112 (7.3%) | 75 (16.5%) |
| 1 Vehicle | 100 (6.6%) | 47 (10.3%) |
| 2 Vehicles | 771 (50.6%) | 247 (54.4%) |
| 3 or more Vehicles | 542 (35.5%) | 85 (18.7%) |
| Total | 1,525 (100.0%) | 454 (100.0%) |
Real Estate & Mortgages in Canutillo
Real Estate and Mortgage Overview in Canutillo
| Characteristic | Without Mortgage | With Mortgage |
| Housing Units | 912 | 613 |
| Median Property Value | $90,700 | $263,800 |
| Median Household Income | $35,962 | $170 |
| Monthly Housing Costs | $414 | $155 |
| Real Estate Taxes | $1,739 | $5 |
Property Value by Mortgage Status in Canutillo
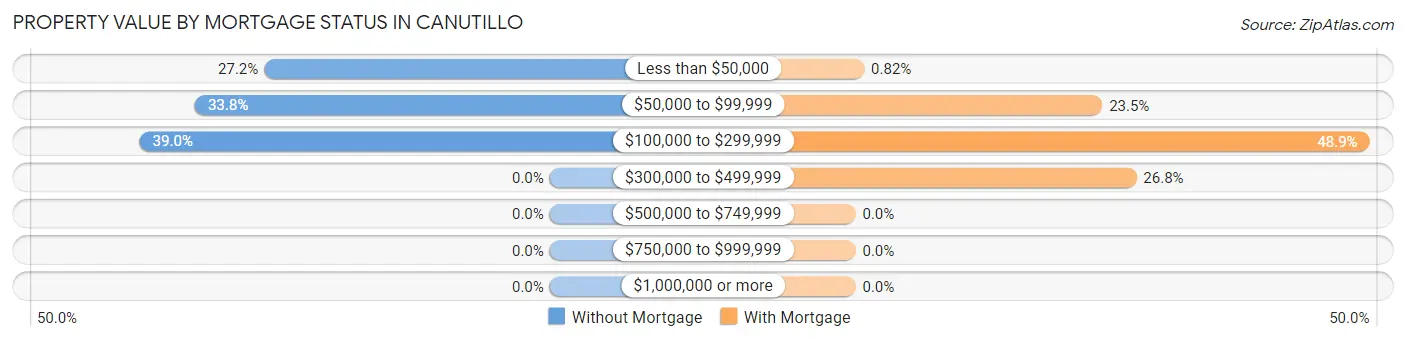
| Property Value | Without Mortgage | With Mortgage |
| Less than $50,000 | 248 (27.2%) | 5 (0.8%) |
| $50,000 to $99,999 | 308 (33.8%) | 144 (23.5%) |
| $100,000 to $299,999 | 356 (39.0%) | 300 (48.9%) |
| $300,000 to $499,999 | 0 (0.0%) | 164 (26.8%) |
| $500,000 to $749,999 | 0 (0.0%) | 0 (0.0%) |
| $750,000 to $999,999 | 0 (0.0%) | 0 (0.0%) |
| $1,000,000 or more | 0 (0.0%) | 0 (0.0%) |
| Total | 912 (100.0%) | 613 (100.0%) |
Household Income by Mortgage Status in Canutillo
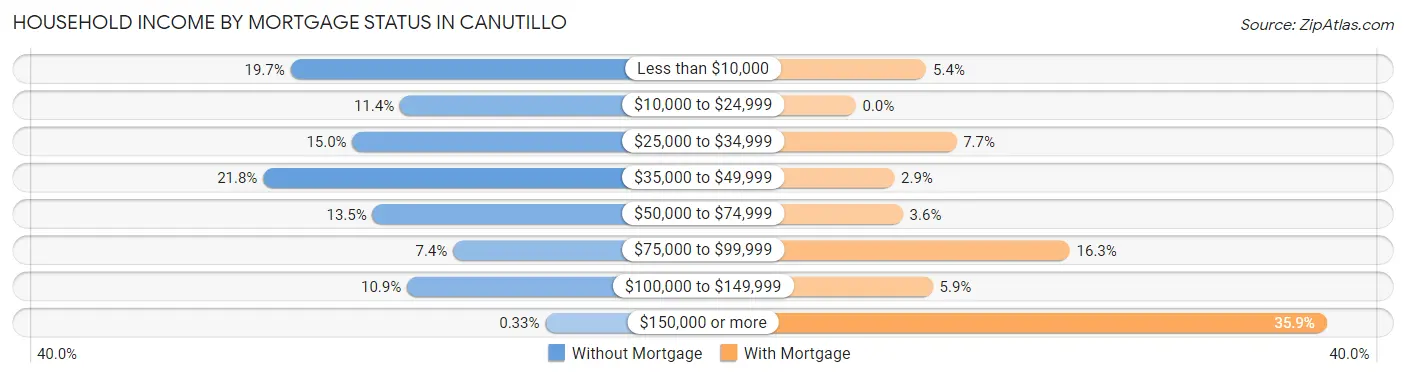
| Household Income | Without Mortgage | With Mortgage |
| Less than $10,000 | 180 (19.7%) | 33 (5.4%) |
| $10,000 to $24,999 | 104 (11.4%) | 0 (0.0%) |
| $25,000 to $34,999 | 137 (15.0%) | 47 (7.7%) |
| $35,000 to $49,999 | 199 (21.8%) | 18 (2.9%) |
| $50,000 to $74,999 | 123 (13.5%) | 22 (3.6%) |
| $75,000 to $99,999 | 67 (7.3%) | 100 (16.3%) |
| $100,000 to $149,999 | 99 (10.9%) | 36 (5.9%) |
| $150,000 or more | 3 (0.3%) | 220 (35.9%) |
| Total | 912 (100.0%) | 613 (100.0%) |
Property Value to Household Income Ratio in Canutillo
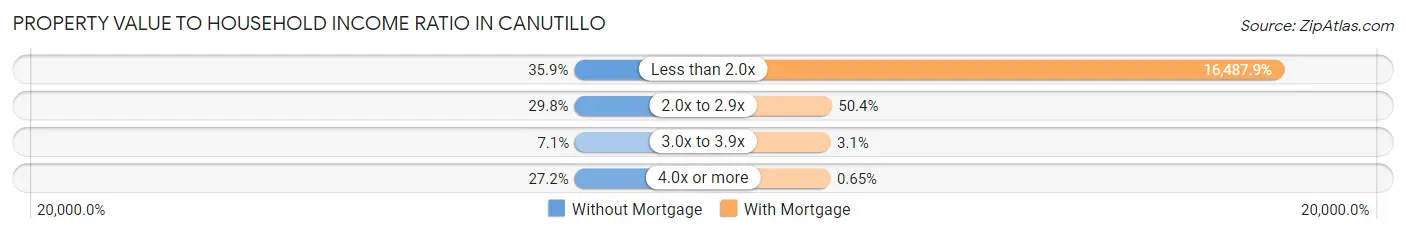
| Value-to-Income Ratio | Without Mortgage | With Mortgage |
| Less than 2.0x | 327 (35.9%) | 101,071 (16,487.9%) |
| 2.0x to 2.9x | 272 (29.8%) | 309 (50.4%) |
| 3.0x to 3.9x | 65 (7.1%) | 19 (3.1%) |
| 4.0x or more | 248 (27.2%) | 4 (0.6%) |
| Total | 912 (100.0%) | 613 (100.0%) |
Real Estate Taxes by Mortgage Status in Canutillo
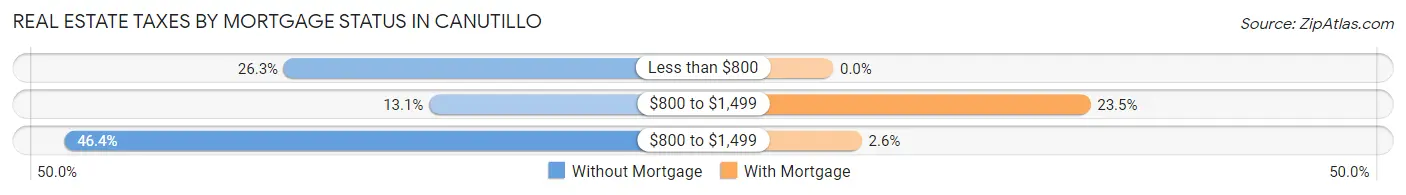
| Property Taxes | Without Mortgage | With Mortgage |
| Less than $800 | 240 (26.3%) | 0 (0.0%) |
| $800 to $1,499 | 119 (13.1%) | 144 (23.5%) |
| $800 to $1,499 | 423 (46.4%) | 16 (2.6%) |
| Total | 912 (100.0%) | 613 (100.0%) |
Health & Disability in Canutillo
Health Insurance Coverage by Age in Canutillo
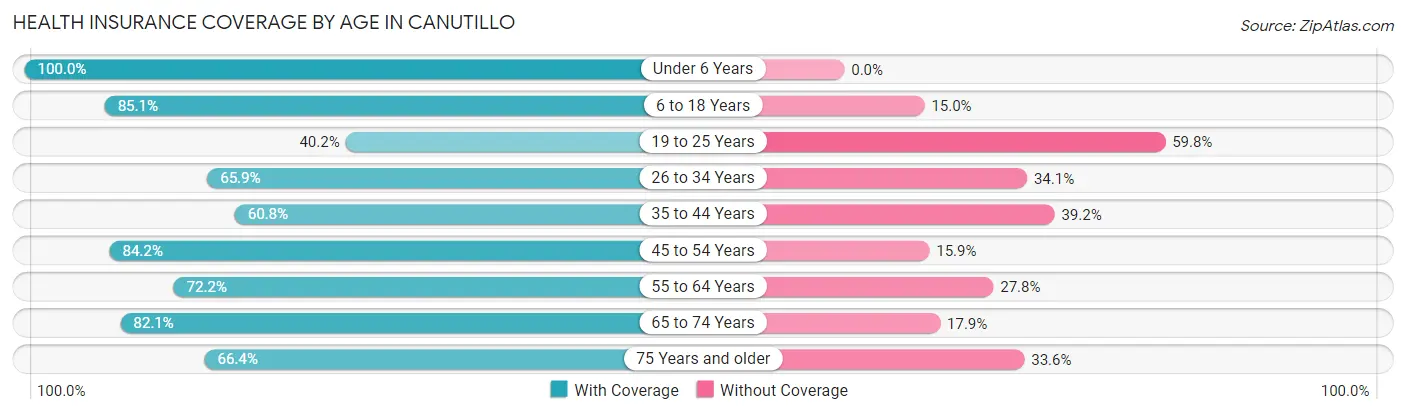
| Age Bracket | With Coverage | Without Coverage |
| Under 6 Years | 902 (100.0%) | 0 (0.0%) |
| 6 to 18 Years | 1,604 (85.1%) | 282 (14.9%) |
| 19 to 25 Years | 147 (40.2%) | 219 (59.8%) |
| 26 to 34 Years | 534 (65.9%) | 276 (34.1%) |
| 35 to 44 Years | 715 (60.8%) | 461 (39.2%) |
| 45 to 54 Years | 446 (84.2%) | 84 (15.9%) |
| 55 to 64 Years | 343 (72.2%) | 132 (27.8%) |
| 65 to 74 Years | 308 (82.1%) | 67 (17.9%) |
| 75 Years and older | 186 (66.4%) | 94 (33.6%) |
| Total | 5,185 (76.2%) | 1,615 (23.7%) |
Health Insurance Coverage by Citizenship Status in Canutillo
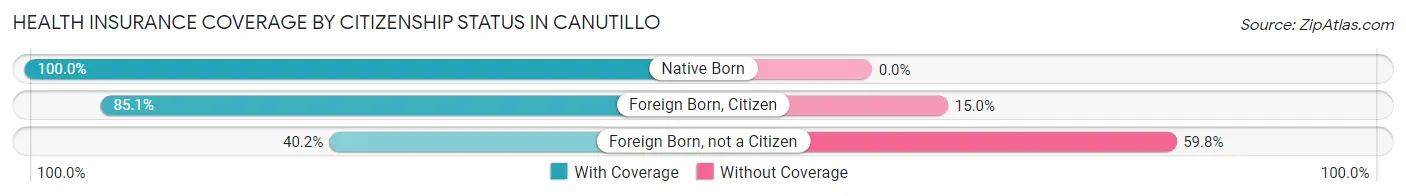
| Citizenship Status | With Coverage | Without Coverage |
| Native Born | 902 (100.0%) | 0 (0.0%) |
| Foreign Born, Citizen | 1,604 (85.1%) | 282 (14.9%) |
| Foreign Born, not a Citizen | 147 (40.2%) | 219 (59.8%) |
Health Insurance Coverage by Household Income in Canutillo
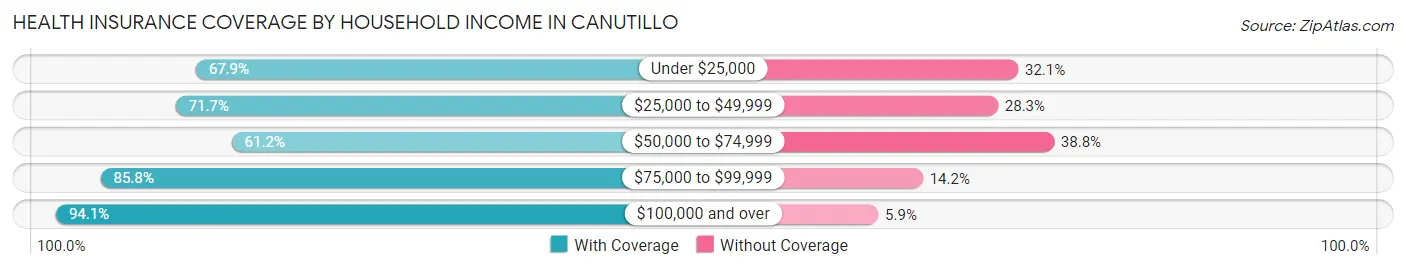
| Household Income | With Coverage | Without Coverage |
| Under $25,000 | 972 (67.9%) | 459 (32.1%) |
| $25,000 to $49,999 | 1,396 (71.7%) | 551 (28.3%) |
| $50,000 to $74,999 | 519 (61.2%) | 329 (38.8%) |
| $75,000 to $99,999 | 446 (85.8%) | 74 (14.2%) |
| $100,000 and over | 1,840 (94.1%) | 115 (5.9%) |
Public vs Private Health Insurance Coverage by Age in Canutillo
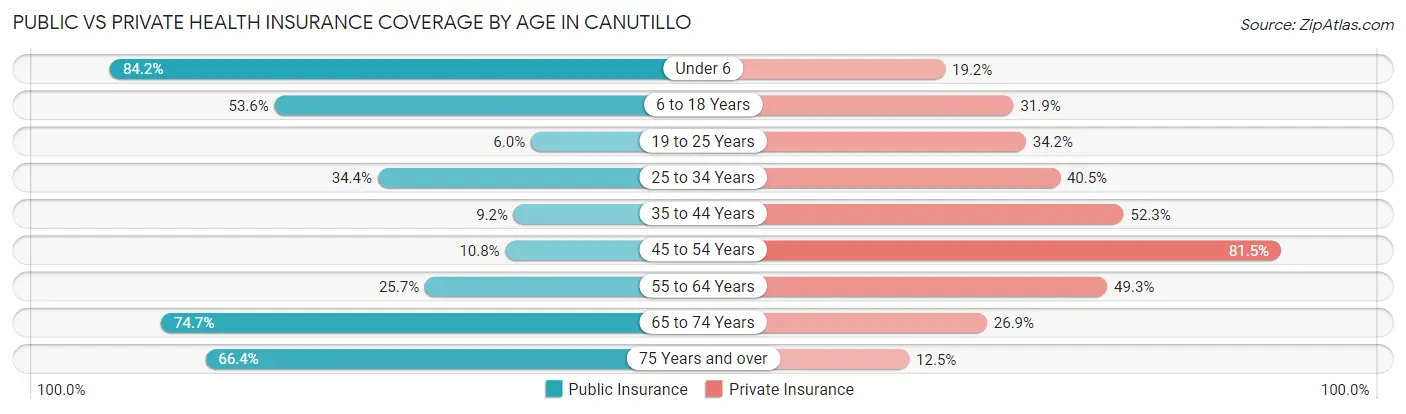
| Age Bracket | Public Insurance | Private Insurance |
| Under 6 | 759 (84.2%) | 173 (19.2%) |
| 6 to 18 Years | 1,011 (53.6%) | 601 (31.9%) |
| 19 to 25 Years | 22 (6.0%) | 125 (34.2%) |
| 25 to 34 Years | 279 (34.4%) | 328 (40.5%) |
| 35 to 44 Years | 108 (9.2%) | 615 (52.3%) |
| 45 to 54 Years | 57 (10.7%) | 432 (81.5%) |
| 55 to 64 Years | 122 (25.7%) | 234 (49.3%) |
| 65 to 74 Years | 280 (74.7%) | 101 (26.9%) |
| 75 Years and over | 186 (66.4%) | 35 (12.5%) |
| Total | 2,824 (41.5%) | 2,644 (38.9%) |
Disability Status by Sex by Age in Canutillo
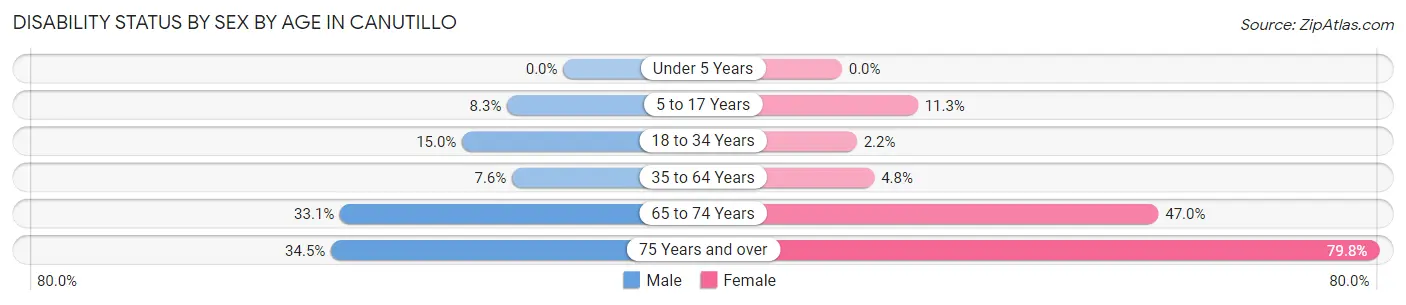
| Age Bracket | Male | Female |
| Under 5 Years | 0 (0.0%) | 0 (0.0%) |
| 5 to 17 Years | 66 (8.3%) | 130 (11.3%) |
| 18 to 34 Years | 91 (15.0%) | 15 (2.2%) |
| 35 to 64 Years | 82 (7.6%) | 53 (4.8%) |
| 65 to 74 Years | 58 (33.1%) | 94 (47.0%) |
| 75 Years and over | 30 (34.5%) | 154 (79.8%) |
Disability Class by Sex by Age in Canutillo
Disability Class: Hearing Difficulty
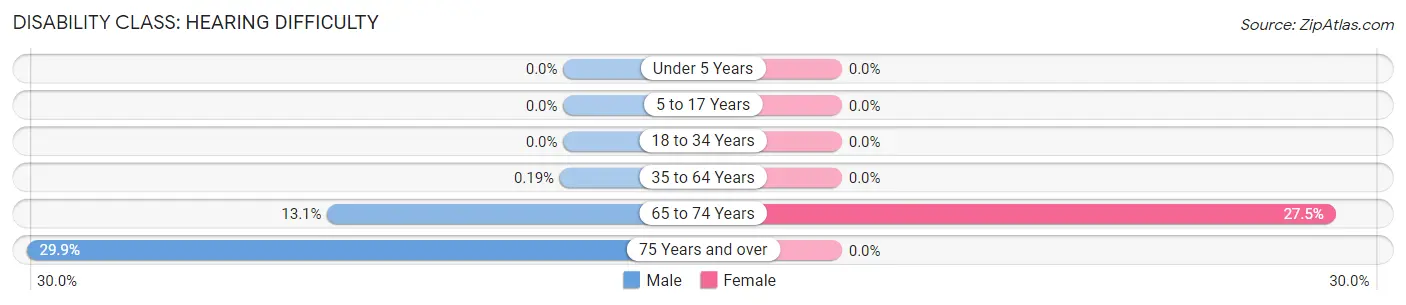
| Age Bracket | Male | Female |
| Under 5 Years | 0 (0.0%) | 0 (0.0%) |
| 5 to 17 Years | 0 (0.0%) | 0 (0.0%) |
| 18 to 34 Years | 0 (0.0%) | 0 (0.0%) |
| 35 to 64 Years | 2 (0.2%) | 0 (0.0%) |
| 65 to 74 Years | 23 (13.1%) | 55 (27.5%) |
| 75 Years and over | 26 (29.9%) | 0 (0.0%) |
Disability Class: Vision Difficulty
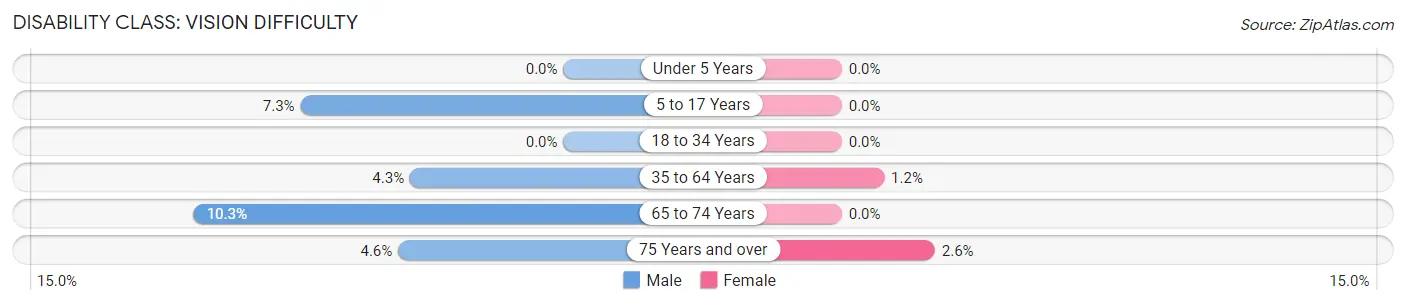
| Age Bracket | Male | Female |
| Under 5 Years | 0 (0.0%) | 0 (0.0%) |
| 5 to 17 Years | 58 (7.3%) | 0 (0.0%) |
| 18 to 34 Years | 0 (0.0%) | 0 (0.0%) |
| 35 to 64 Years | 46 (4.3%) | 13 (1.2%) |
| 65 to 74 Years | 18 (10.3%) | 0 (0.0%) |
| 75 Years and over | 4 (4.6%) | 5 (2.6%) |
Disability Class: Cognitive Difficulty
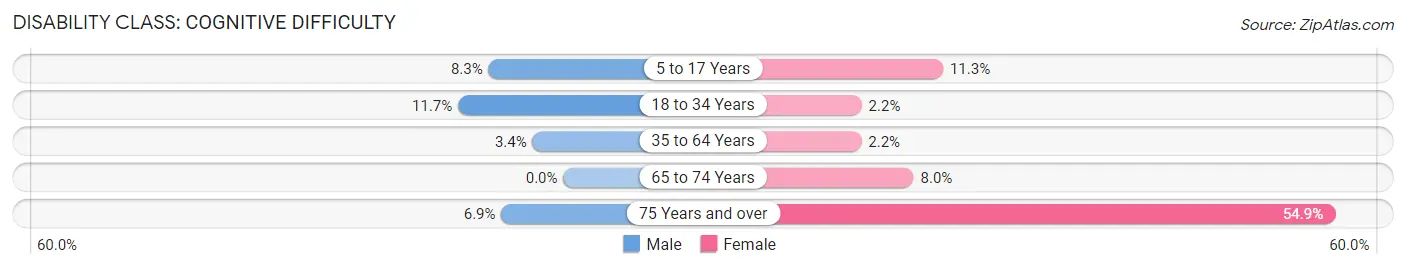
| Age Bracket | Male | Female |
| 5 to 17 Years | 66 (8.3%) | 130 (11.3%) |
| 18 to 34 Years | 71 (11.7%) | 15 (2.2%) |
| 35 to 64 Years | 37 (3.4%) | 24 (2.2%) |
| 65 to 74 Years | 0 (0.0%) | 16 (8.0%) |
| 75 Years and over | 6 (6.9%) | 106 (54.9%) |
Disability Class: Ambulatory Difficulty
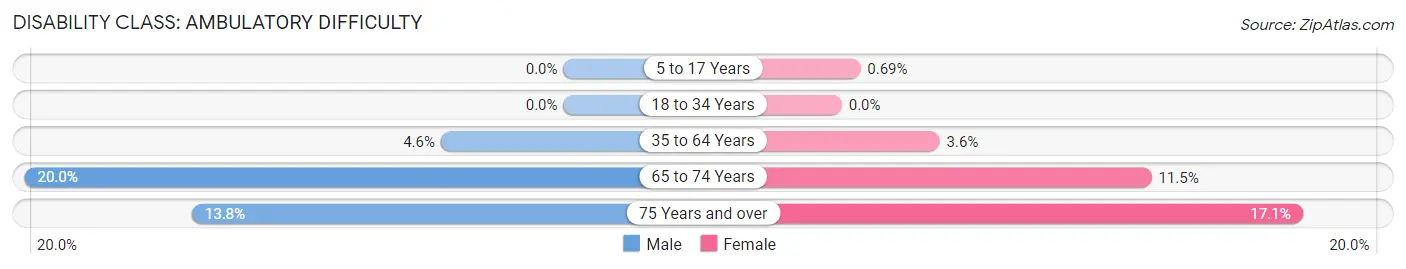
| Age Bracket | Male | Female |
| 5 to 17 Years | 0 (0.0%) | 8 (0.7%) |
| 18 to 34 Years | 0 (0.0%) | 0 (0.0%) |
| 35 to 64 Years | 49 (4.5%) | 40 (3.6%) |
| 65 to 74 Years | 35 (20.0%) | 23 (11.5%) |
| 75 Years and over | 12 (13.8%) | 33 (17.1%) |
Disability Class: Self-Care Difficulty
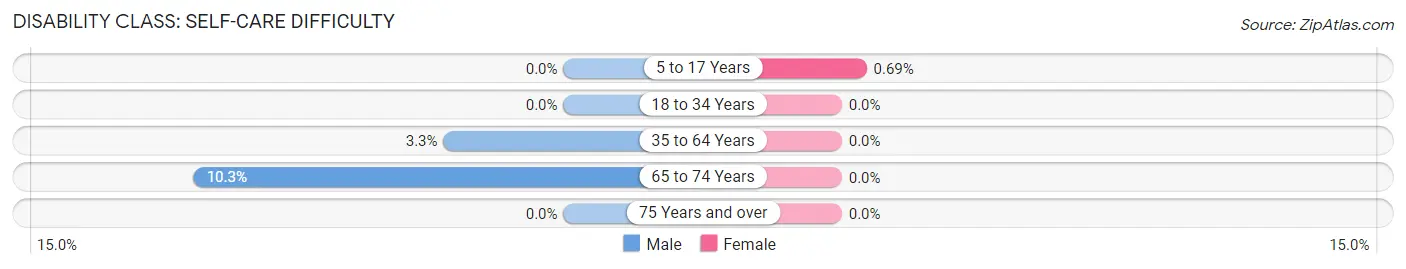
| Age Bracket | Male | Female |
| 5 to 17 Years | 0 (0.0%) | 8 (0.7%) |
| 18 to 34 Years | 0 (0.0%) | 0 (0.0%) |
| 35 to 64 Years | 36 (3.3%) | 0 (0.0%) |
| 65 to 74 Years | 18 (10.3%) | 0 (0.0%) |
| 75 Years and over | 0 (0.0%) | 0 (0.0%) |
Technology Access in Canutillo
Computing Device Access in Canutillo
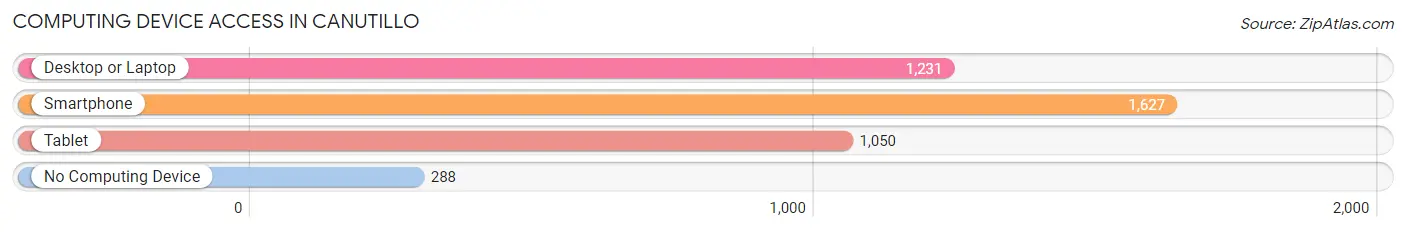
| Device Type | # Households | % Households |
| Desktop or Laptop | 1,231 | 62.2% |
| Smartphone | 1,627 | 82.2% |
| Tablet | 1,050 | 53.1% |
| No Computing Device | 288 | 14.5% |
| Total | 1,979 | 100.0% |
Internet Access in Canutillo
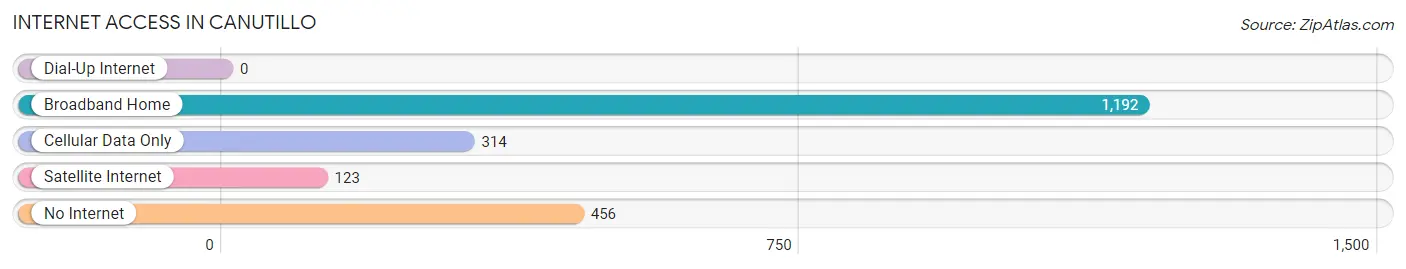
| Internet Type | # Households | % Households |
| Dial-Up Internet | 0 | 0.0% |
| Broadband Home | 1,192 | 60.2% |
| Cellular Data Only | 314 | 15.9% |
| Satellite Internet | 123 | 6.2% |
| No Internet | 456 | 23.0% |
| Total | 1,979 | 100.0% |
Canutillo Summary
Canutillo is a small town located in El Paso County, Texas. It is situated on the western edge of the state, just north of the Rio Grande River. The town has a population of approximately 6,000 people and is part of the El Paso Metropolitan Statistical Area.
History
Canutillo was founded in 1881 by a group of settlers from Mexico. The town was named after a nearby mountain, which was named after a Spanish word meaning “little can”. The settlers were attracted to the area due to its fertile soil and abundant water supply. The town quickly grew and by the early 1900s, it had become a thriving agricultural community.
In the mid-1900s, the town began to experience a population boom as more people moved to the area. This was due to the construction of the nearby Fort Bliss military base, which brought many new jobs to the area. The town also experienced a surge in population due to the influx of Mexican immigrants.
Geography
Canutillo is located in El Paso County, Texas. It is situated on the western edge of the state, just north of the Rio Grande River. The town is located at an elevation of 3,845 feet above sea level. The town is surrounded by desert terrain and is located near the Franklin Mountains.
The climate in Canutillo is semi-arid, with hot summers and mild winters. The average annual temperature is around 70 degrees Fahrenheit. The town receives an average of 8 inches of rain per year.
Economy
The economy of Canutillo is largely based on agriculture and tourism. The town is home to several farms and ranches, which produce a variety of crops and livestock. The town is also home to several tourist attractions, such as the nearby Franklin Mountains State Park.
The town is also home to several businesses, including restaurants, retail stores, and auto repair shops. The town is also home to several manufacturing companies, which produce a variety of products, such as furniture and clothing.
Demographics
As of the 2010 census, the population of Canutillo was 6,000. The town has a population density of 1,845 people per square mile. The racial makeup of the town is predominantly Hispanic, with over 90% of the population identifying as such. The median household income in Canutillo is $37,000, which is lower than the national average. The town has a poverty rate of 22%, which is higher than the national average.
Canutillo is a small town with a rich history and a diverse population. The town is home to a variety of businesses and attractions, which make it an attractive place to live and visit. The town is also home to a variety of cultural events, such as the annual Canutillo Fiesta. The town is a great place to live and visit, and it is sure to continue to grow and thrive in the years to come.
Common Questions
What is the Total Population of Canutillo?
Total Population of Canutillo is 6,800.
What is the Total Male Population of Canutillo?
Total Male Population of Canutillo is 3,040.
What is the Total Female Population of Canutillo?
Total Female Population of Canutillo is 3,760.
What is the Ratio of Males per 100 Females in Canutillo?
There are 80.85 Males per 100 Females in Canutillo.
What is the Ratio of Females per 100 Males in Canutillo?
There are 123.68 Females per 100 Males in Canutillo.
What is the Median Population Age in Canutillo?
Median Population Age in Canutillo is 28.9 Years.
What is the Average Family Size in Canutillo
Average Family Size in Canutillo is 4.2 People.
What is the Average Household Size in Canutillo
Average Household Size in Canutillo is 3.4 People.
What is Per Capita Income in Canutillo?
Per Capita income in Canutillo is $20,578.
What is the Median Family Income in Canutillo?
Median Family Income in Canutillo is $53,964.
What is the Median Household income in Canutillo?
Median Household Income in Canutillo is $40,655.
What is Income or Wage Gap in Canutillo?
Income or Wage Gap in Canutillo is 17.8%.
Women in Canutillo earn 82.2 cents for every dollar earned by a man.
What is Family Income Deficit in Canutillo?
Family Income Deficit in Canutillo is $14,285.
Families that are below poverty line in Canutillo earn $14,285 less on average than the poverty threshold level.
What is Inequality or Gini Index in Canutillo?
Inequality or Gini Index in Canutillo is 0.52.
How Large is the Labor Force in Canutillo?
There are 2,573 People in the Labor Forcein in Canutillo.
What is the Percentage of People in the Labor Force in Canutillo?
58.3% of People are in the Labor Force in Canutillo.
What is the Unemployment Rate in Canutillo?
Unemployment Rate in Canutillo is 2.8%.