Zip Codes with the Highest Percentage of Population with a Degree in Psychology in Fort Worth, TX

RELATED REPORTS & OPTIONS

Psychology
Population
Families and Households
Female Fertility
Female Fertility (Unmarried)
Race (Community Size)
Race (Percentage)
Ancestry (Community Size)
AfghanAfricanAlbanianAlsatianAmericanApacheArabArgentineanArmenianAustralianAustrianBahamianBangladeshiBarbadianBasqueBelgianBhutaneseBlackfeetBolivianBrazilianBritishBritish West IndianBulgarianBurmeseCajunCambodianCanadianCelticCentral AmericanCentral American IndianCherokeeCheyenneChickasawChileanChippewaChoctawColombianComancheCosta RicanCreekCroatianCrowCubanCzechCzechoslovakianDanishDelawareDominicanDutchDutch West IndianEastern EuropeanEcuadorianEgyptianEnglishEstonianEthiopianEuropeanFilipinoFinnishFrenchFrench American IndianFrench CanadianGermanGerman RussianGhanaianGreekGuamanian / ChamorroGuatemalanGuyaneseHaitianHonduranHopiHungarianIcelanderIndian (Asian)IndonesianInupiatIranianIraqiIrishIroquoisIsraeliItalianJamaicanJapaneseJordanianKenyanKiowaKoreanLaotianLatvianLebaneseLiberianLithuanianLuxembourgerMalaysianMalteseMexicanMexican American IndianMongolianMoroccanNative HawaiianNavajoNicaraguanNigerianNorthern EuropeanNorwegianOsageOttawaPakistaniPalestinianPanamanianPennsylvania GermanPeruvianPolishPortuguesePotawatomiPuebloPuerto RicanRomanianRussianSalvadoranSamoanScandinavianScotch-IrishScottishSerbianSiouxSlavicSlovakSloveneSomaliSouth AfricanSouth AmericanSouth American IndianSpaniardSpanishSpanish AmericanSpanish American IndianSri LankanSubsaharan AfricanSudaneseSwedishSwissSyrianThaiTonganTrinidadian and TobagonianTurkishUgandanUkrainianVenezuelanVietnameseWelshWest IndianYaquiYugoslavianZimbabwean
Ancestry (Percentage)
AfghanAfricanAlbanianAlsatianAmericanApacheArabArgentineanArmenianAustralianAustrianBahamianBangladeshiBarbadianBasqueBelgianBhutaneseBlackfeetBolivianBrazilianBritishBritish West IndianBulgarianBurmeseCajunCambodianCanadianCelticCentral AmericanCentral American IndianCherokeeCheyenneChickasawChileanChippewaChoctawColombianComancheCosta RicanCreekCroatianCrowCubanCzechCzechoslovakianDanishDelawareDominicanDutchDutch West IndianEastern EuropeanEcuadorianEgyptianEnglishEstonianEthiopianEuropeanFilipinoFinnishFrenchFrench American IndianFrench CanadianGermanGerman RussianGhanaianGreekGuamanian / ChamorroGuatemalanGuyaneseHaitianHonduranHopiHungarianIcelanderIndian (Asian)IndonesianInupiatIranianIraqiIrishIroquoisIsraeliItalianJamaicanJapaneseJordanianKenyanKiowaKoreanLaotianLatvianLebaneseLiberianLithuanianLuxembourgerMalaysianMalteseMexicanMexican American IndianMongolianMoroccanNative HawaiianNavajoNicaraguanNigerianNorthern EuropeanNorwegianOsageOttawaPakistaniPalestinianPanamanianPennsylvania GermanPeruvianPolishPortuguesePotawatomiPuebloPuerto RicanRomanianRussianSalvadoranSamoanScandinavianScotch-IrishScottishSerbianSiouxSlavicSlovakSloveneSomaliSouth AfricanSouth AmericanSouth American IndianSpaniardSpanishSpanish AmericanSpanish American IndianSri LankanSubsaharan AfricanSudaneseSwedishSwissSyrianThaiTonganTrinidadian and TobagonianTurkishUgandanUkrainianVenezuelanVietnameseWelshWest IndianYaquiYugoslavianZimbabwean
Immigrant Origin (Total)
AfghanistanAfricaAlbaniaArgentinaAsiaAustraliaBahamasBangladeshBarbadosBelarusBelizeBoliviaBosnia and HerzegovinaBrazilBulgariaBurma / MyanmarCambodiaCameroonCanadaCaribbeanCentral AmericaChileChinaColombiaCongoCosta RicaCroatiaCubaCzechoslovakiaDominican RepublicEastern AfricaEastern AsiaEastern EuropeEcuadorEgyptEl SalvadorEnglandEritreaEthiopiaEuropeFranceGermanyGhanaGreeceGuatemalaHaitiHondurasHong KongHungaryIndiaIndonesiaIranIraqIrelandIsraelItalyJamaicaJapanJordanKenyaKoreaLaosLatin AmericaLebanonLiberiaMalaysiaMexicoMicronesiaMiddle AfricaMoroccoNepalNetherlandsNicaraguaNigeriaNorthern AfricaNorthern EuropeOceaniaPakistanPanamaPeruPhilippinesPolandPortugalRomaniaRussiaScotlandSenegalSerbiaSomaliaSouth AfricaSouth AmericaSouth Central AsiaSouth Eastern AsiaSouthern EuropeSpainSri LankaSudanSwedenSwitzerlandSyriaTaiwanThailandTrinidad and TobagoTurkeyUgandaUkraineVenezuelaVietnamWestern AfricaWestern AsiaWestern EuropeZaireZimbabwe
Immigrant Origin (Percentage)
AfghanistanAfricaAlbaniaArgentinaAsiaAustraliaBahamasBangladeshBarbadosBelarusBelizeBoliviaBosnia and HerzegovinaBrazilBulgariaBurma / MyanmarCambodiaCameroonCanadaCaribbeanCentral AmericaChileChinaColombiaCongoCosta RicaCroatiaCubaCzechoslovakiaDominican RepublicEastern AfricaEastern AsiaEastern EuropeEcuadorEgyptEl SalvadorEnglandEritreaEthiopiaEuropeFranceGermanyGhanaGreeceGuatemalaHaitiHondurasHong KongHungaryIndiaIndonesiaIranIraqIrelandIsraelItalyJamaicaJapanJordanKenyaKoreaLaosLatin AmericaLebanonLiberiaMalaysiaMexicoMicronesiaMiddle AfricaMoroccoNepalNetherlandsNicaraguaNigeriaNorthern AfricaNorthern EuropeOceaniaPakistanPanamaPeruPhilippinesPolandPortugalRomaniaRussiaScotlandSenegalSerbiaSomaliaSouth AfricaSouth AmericaSouth Central AsiaSouth Eastern AsiaSouthern EuropeSpainSri LankaSudanSwedenSwitzerlandSyriaTaiwanThailandTrinidad and TobagoTurkeyUgandaUkraineVenezuelaVietnamWestern AfricaWestern AsiaWestern EuropeZaireZimbabwe
Income
Income (Families)
Income (Households)
Poverty
Poverty (Families)
Unemployment
Employment Occupations
Employment Industries
Employer Class
Commute Time
Commute Means
School Enrollment
Education by Degree Field
Occupancy
Finances
Physical Characteristics
Fort Worth
Compare Zip Codes
Comparison Subject

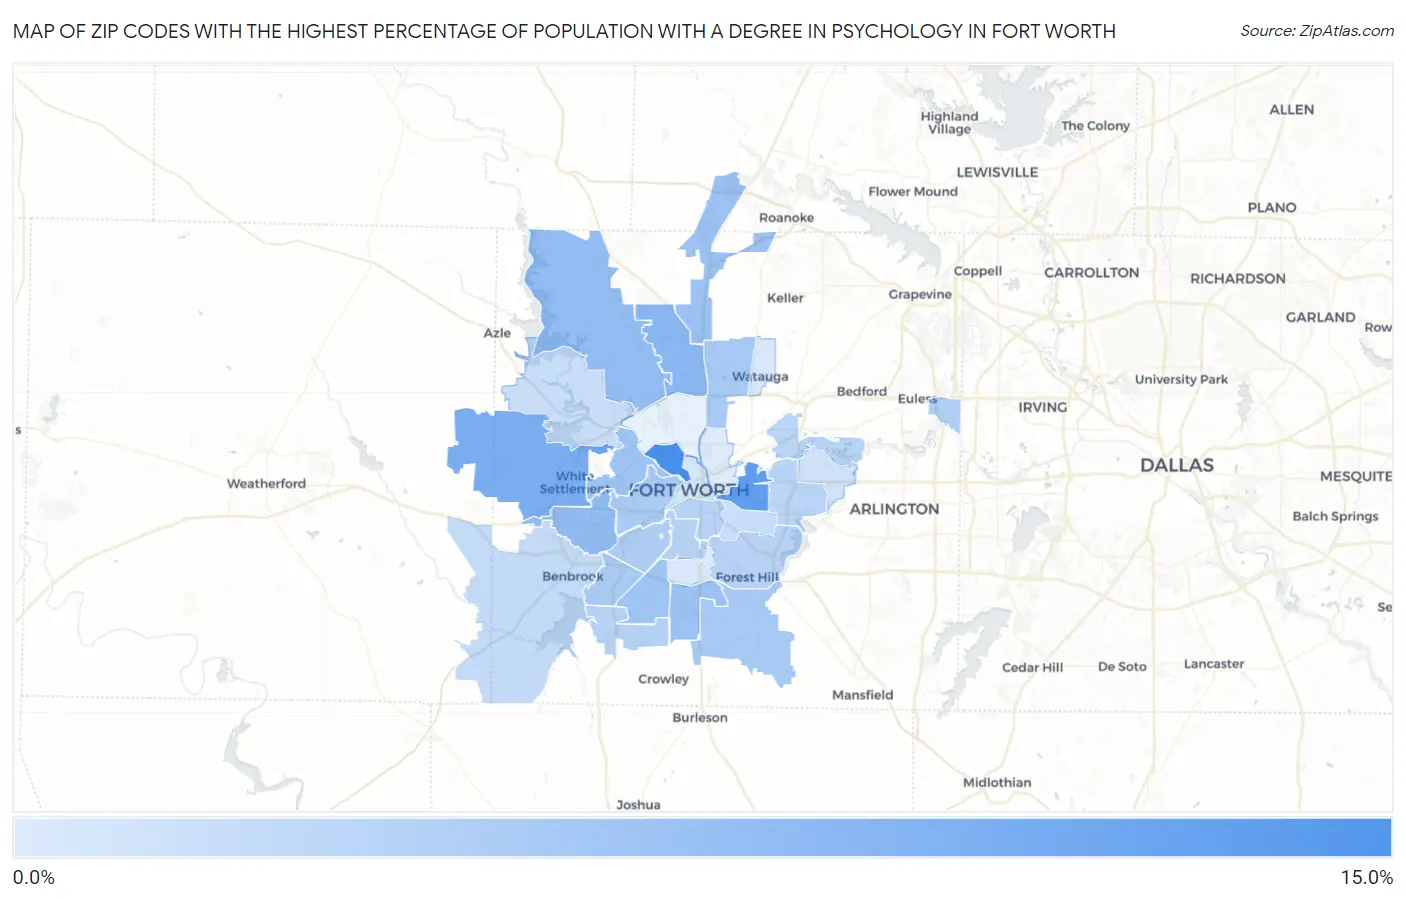
Map of Zip Codes with the Highest Percentage of Population with a Degree in Psychology in Fort Worth

0.0%
15.0%
Zip Codes with the Highest Percentage of Population with a Degree in Psychology in Fort Worth Map

Zip Codes with the Highest Percentage of Population with a Degree in Psychology in Fort Worth, TX

Zip Code % Graduates vs State vs National
1.7616410.8%4.3%(+6.55)#925.1%(+5.79)#2,119
2.761039.2%4.3%(+4.92)#1245.1%(+4.17)#2,975
3.761087.5%4.3%(+3.24)#1965.1%(+2.49)#4,744
4.761316.5%4.3%(+2.16)#2635.1%(+1.41)#6,747
5.761166.0%4.3%(+1.68)#3115.1%(+0.923)#8,019
6.761795.9%4.3%(+1.55)#3305.1%(+0.801)#8,417
7.761345.4%4.3%(+1.13)#3885.1%(+0.376)#9,759
8.761775.3%4.3%(+1.01)#4115.1%(+0.254)#10,136
9.761145.2%4.3%(+0.907)#4275.1%(+0.154)#10,515
10.761335.2%4.3%(+0.870)#4345.1%(+0.118)#10,651
11.761404.6%4.3%(+0.264)#5515.1%(-0.488)#12,870
12.761374.6%4.3%(+0.261)#5535.1%(-0.491)#12,882
13.761074.5%4.3%(+0.152)#5765.1%(-0.601)#13,299
14.761324.4%4.3%(+0.064)#6075.1%(-0.689)#13,625
15.761094.2%4.3%(-0.088)#6505.1%(-0.841)#14,181
16.761554.0%4.3%(-0.276)#7015.1%(-1.03)#14,843
17.761233.7%4.3%(-0.550)#7865.1%(-1.30)#15,793
18.761103.7%4.3%(-0.600)#8015.1%(-1.35)#15,967
19.761193.6%4.3%(-0.738)#8345.1%(-1.49)#16,492
20.761043.5%4.3%(-0.799)#8525.1%(-1.55)#16,696
21.761183.5%4.3%(-0.807)#8555.1%(-1.56)#16,722
22.761123.4%4.3%(-0.867)#8695.1%(-1.62)#16,905
23.761262.9%4.3%(-1.41)#9915.1%(-2.16)#18,539
24.761352.6%4.3%(-1.67)#1,0385.1%(-2.43)#19,287
25.761052.6%4.3%(-1.72)#1,0465.1%(-2.48)#19,414
26.761202.0%4.3%(-2.33)#1,1525.1%(-3.09)#20,881
27.761021.7%4.3%(-2.61)#1,1895.1%(-3.36)#21,438
28.761481.5%4.3%(-2.81)#1,2165.1%(-3.56)#21,838
29.761151.5%4.3%(-2.83)#1,2205.1%(-3.58)#21,873
30.761111.3%4.3%(-3.00)#1,2415.1%(-3.75)#22,143

Common Questions

What are the Top 10 Zip Codes with the Highest Percentage of Population with a Degree in Psychology in Fort Worth, TX?
Top 10 Zip Codes with the Highest Percentage of Population with a Degree in Psychology in Fort Worth, TX are:
#1
10.8%
#2
9.2%
#3
7.5%
#4
6.5%
#5
6.0%
#6
5.9%
#7
5.4%
#8
5.3%
#9
5.2%
#10
5.2%
What zip code has the Highest Percentage of Population with a Degree in Psychology in Fort Worth, TX?
76164 has the Highest Percentage of Population with a Degree in Psychology in Fort Worth, TX with 10.8%.
What is the Percentage of Population with a Degree in Psychology in Fort Worth, TX?
Percentage of Population with a Degree in Psychology in Fort Worth is 4.4%.
What is the Percentage of Population with a Degree in Psychology in Texas?
Percentage of Population with a Degree in Psychology in Texas is 4.3%.
What is the Percentage of Population with a Degree in Psychology in the United States?
Percentage of Population with a Degree in Psychology in the United States is 5.1%.