Lakeside town San Patricio County, TX
Lakeside town San Patricio County Overview
310
TOTAL POPULATION
160
MALE POPULATION
150
FEMALE POPULATION
106.67
MALES / 100 FEMALES
93.75
FEMALES / 100 MALES
50.7
MEDIAN AGE
2.8
AVG FAMILY SIZE
2.3
AVG HOUSEHOLD SIZE
$28,864
PER CAPITA INCOME
$68,750
AVG FAMILY INCOME
$51,875
AVG HOUSEHOLD INCOME
38.0%
WAGE / INCOME GAP [ % ]
62.0¢/ $1
WAGE / INCOME GAP [ $ ]
0.38
INEQUALITY / GINI INDEX
138
LABOR FORCE [ PEOPLE ]
48.9%
PERCENT IN LABOR FORCE
Race in Lakeside town San Patricio County
The most populous races in Lakeside town San Patricio County are White / Caucasian (189 | 61.0%), Hispanic or Latino (153 | 49.3%), and Two or more Races (61 | 19.7%).
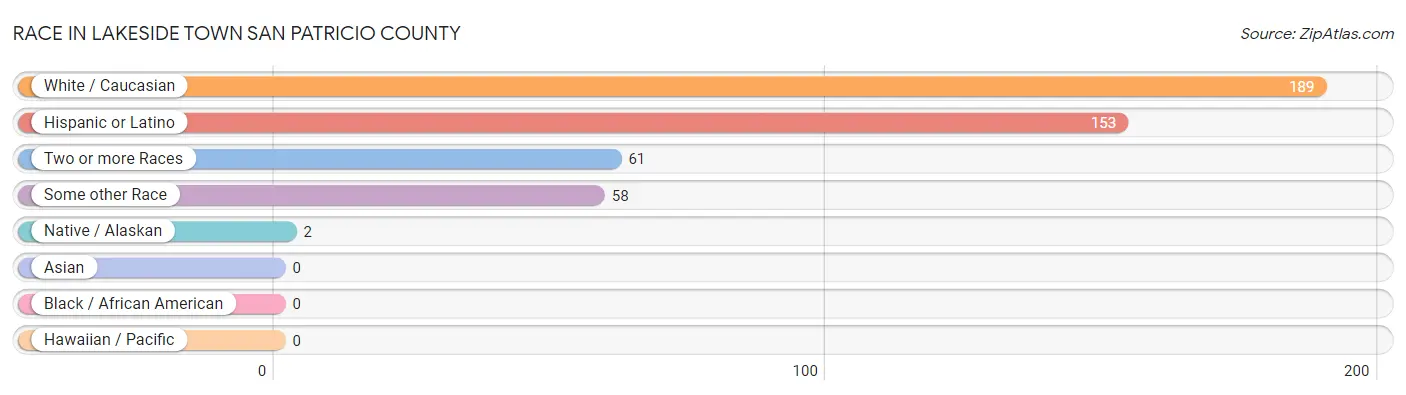
| Race | # Population | % Population |
| Asian | 0 | 0.0% |
| Black / African American | 0 | 0.0% |
| Hawaiian / Pacific | 0 | 0.0% |
| Hispanic or Latino | 153 | 49.3% |
| Native / Alaskan | 2 | 0.6% |
| White / Caucasian | 189 | 61.0% |
| Two or more Races | 61 | 19.7% |
| Some other Race | 58 | 18.7% |
| Total | 310 | 100.0% |
Ancestry in Lakeside town San Patricio County
The most populous ancestries reported in Lakeside town San Patricio County are Mexican (149 | 48.1%), German (32 | 10.3%), English (15 | 4.8%), Irish (9 | 2.9%), and Scottish (7 | 2.3%), together accounting for 68.4% of all Lakeside town San Patricio County residents.
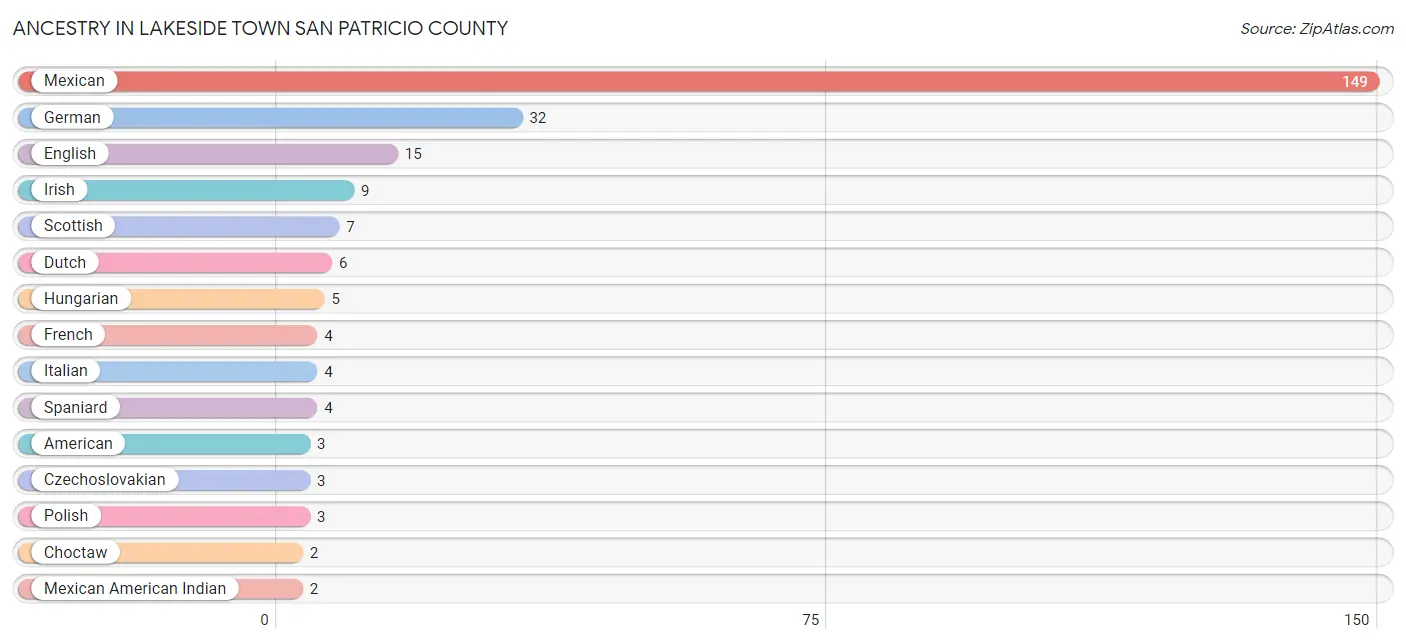
| Ancestry | # Population | % Population |
| American | 3 | 1.0% |
| Choctaw | 2 | 0.6% |
| Czechoslovakian | 3 | 1.0% |
| Dutch | 6 | 1.9% |
| English | 15 | 4.8% |
| European | 1 | 0.3% |
| French | 4 | 1.3% |
| German | 32 | 10.3% |
| Hungarian | 5 | 1.6% |
| Irish | 9 | 2.9% |
| Italian | 4 | 1.3% |
| Mexican | 149 | 48.1% |
| Mexican American Indian | 2 | 0.6% |
| Norwegian | 1 | 0.3% |
| Polish | 3 | 1.0% |
| Portuguese | 1 | 0.3% |
| Scotch-Irish | 1 | 0.3% |
| Scottish | 7 | 2.3% |
| Spaniard | 4 | 1.3% |
| Welsh | 2 | 0.6% | View All 20 Rows |
Immigrants in Lakeside town San Patricio County
The most numerous immigrant groups reported in Lakeside town San Patricio County came from Central America (1 | 0.3%), Latin America (1 | 0.3%), and Mexico (1 | 0.3%), together accounting for 1.0% of all Lakeside town San Patricio County residents.
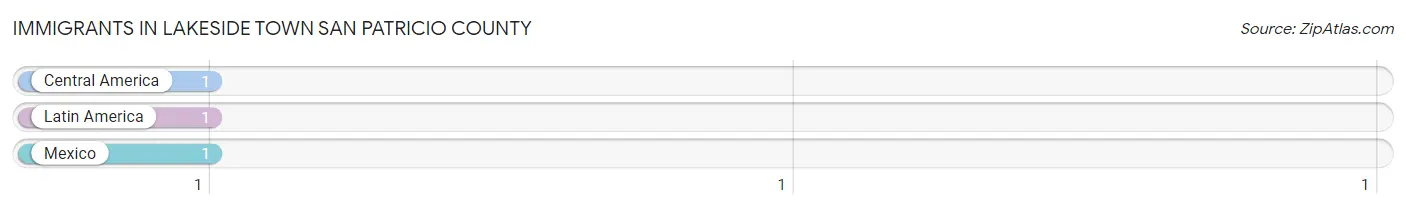
| Immigration Origin | # Population | % Population |
| Central America | 1 | 0.3% |
| Latin America | 1 | 0.3% |
| Mexico | 1 | 0.3% | View All 3 Rows |
Sex and Age in Lakeside town San Patricio County
Sex and Age in Lakeside town San Patricio County
The most populous age groups in Lakeside town San Patricio County are 65 to 69 Years (22 | 13.8%) for men and 15 to 19 Years (24 | 16.0%) for women.
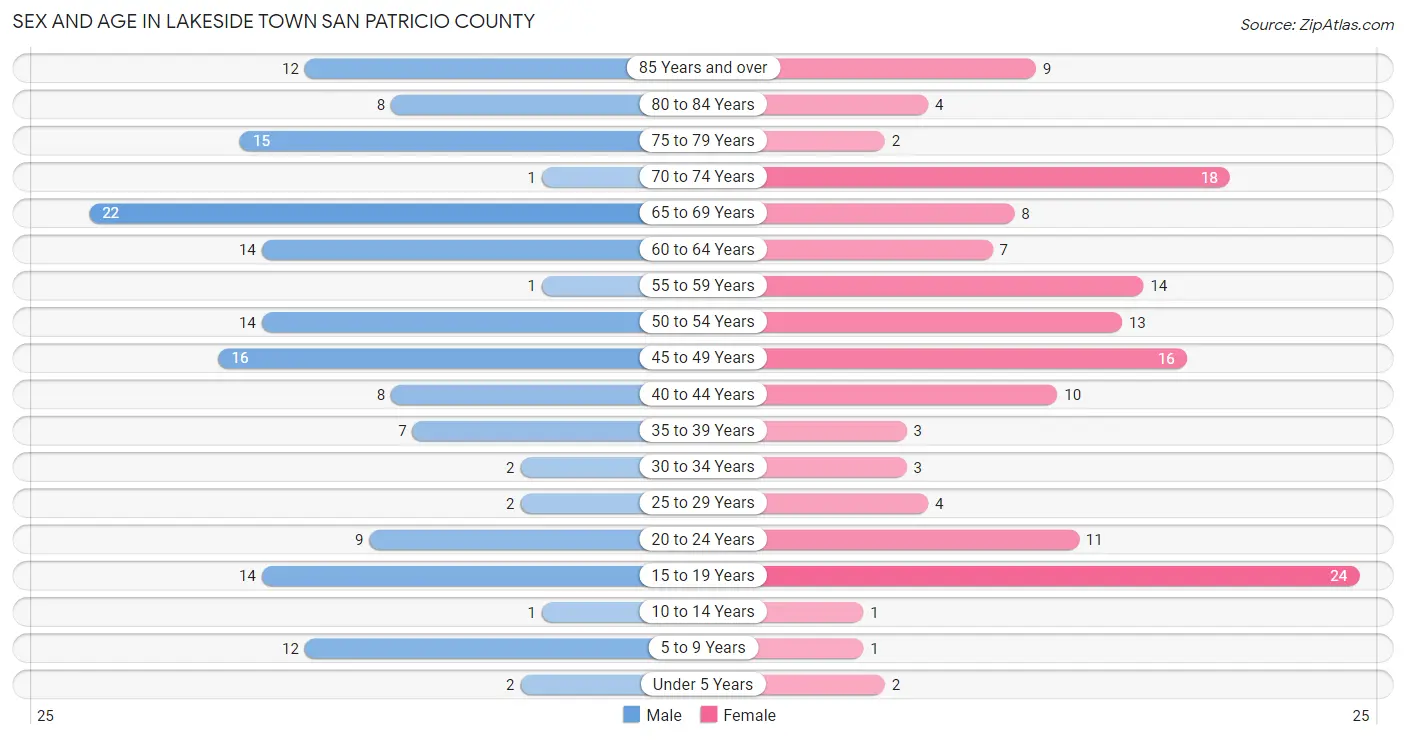
| Age Bracket | Male | Female |
| Under 5 Years | 2 (1.3%) | 2 (1.3%) |
| 5 to 9 Years | 12 (7.5%) | 1 (0.7%) |
| 10 to 14 Years | 1 (0.6%) | 1 (0.7%) |
| 15 to 19 Years | 14 (8.7%) | 24 (16.0%) |
| 20 to 24 Years | 9 (5.6%) | 11 (7.3%) |
| 25 to 29 Years | 2 (1.3%) | 4 (2.7%) |
| 30 to 34 Years | 2 (1.3%) | 3 (2.0%) |
| 35 to 39 Years | 7 (4.4%) | 3 (2.0%) |
| 40 to 44 Years | 8 (5.0%) | 10 (6.7%) |
| 45 to 49 Years | 16 (10.0%) | 16 (10.7%) |
| 50 to 54 Years | 14 (8.7%) | 13 (8.7%) |
| 55 to 59 Years | 1 (0.6%) | 14 (9.3%) |
| 60 to 64 Years | 14 (8.7%) | 7 (4.7%) |
| 65 to 69 Years | 22 (13.8%) | 8 (5.3%) |
| 70 to 74 Years | 1 (0.6%) | 18 (12.0%) |
| 75 to 79 Years | 15 (9.4%) | 2 (1.3%) |
| 80 to 84 Years | 8 (5.0%) | 4 (2.7%) |
| 85 Years and over | 12 (7.5%) | 9 (6.0%) |
| Total | 160 (100.0%) | 150 (100.0%) |
Families and Households in Lakeside town San Patricio County
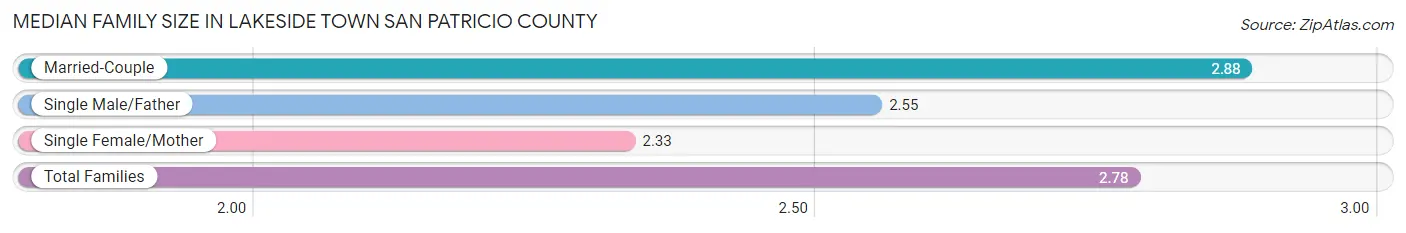
Median Family Size in Lakeside town San Patricio County
The median family size in Lakeside town San Patricio County is 2.78 persons per family, with married-couple families (73 | 78.5%) accounting for the largest median family size of 2.88 persons per family. On the other hand, single female/mother families (9 | 9.7%) represent the smallest median family size with 2.33 persons per family.
| Family Type | # Families | Family Size |
| Married-Couple | 73 (78.5%) | 2.88 |
| Single Male/Father | 11 (11.8%) | 2.55 |
| Single Female/Mother | 9 (9.7%) | 2.33 |
| Total Families | 93 (100.0%) | 2.78 |
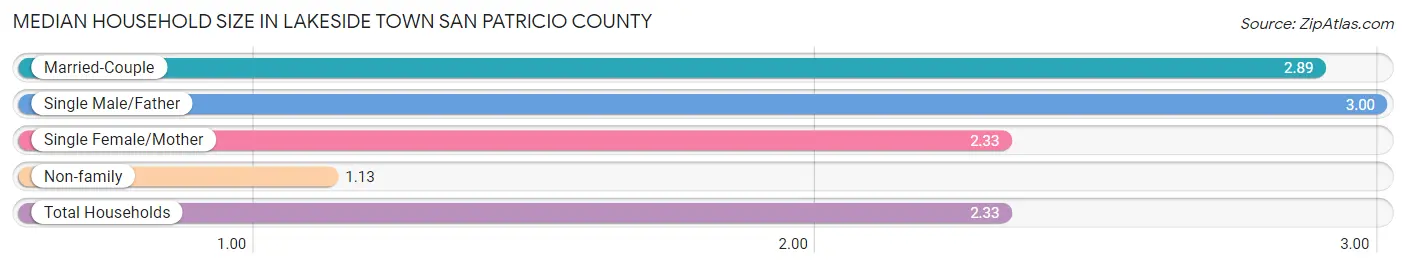
Median Household Size in Lakeside town San Patricio County
The median household size in Lakeside town San Patricio County is 2.33 persons per household, with single male/father households (11 | 8.3%) accounting for the largest median household size of 3 persons per household. non-family households (40 | 30.1%) represent the smallest median household size with 1.13 persons per household.
| Household Type | # Households | Household Size |
| Married-Couple | 73 (54.9%) | 2.89 |
| Single Male/Father | 11 (8.3%) | 3.00 |
| Single Female/Mother | 9 (6.8%) | 2.33 |
| Non-family | 40 (30.1%) | 1.13 |
| Total Households | 133 (100.0%) | 2.33 |
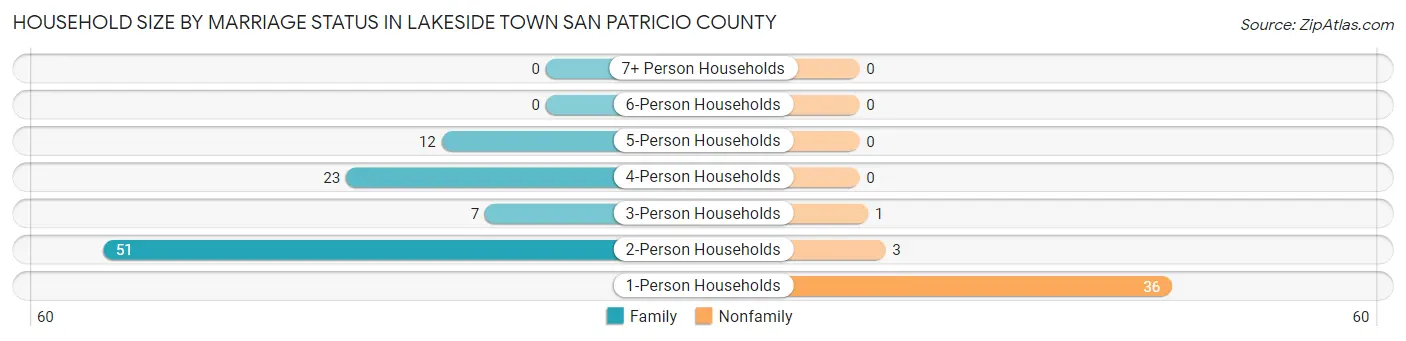
Household Size by Marriage Status in Lakeside town San Patricio County
Out of a total of 133 households in Lakeside town San Patricio County, 93 (69.9%) are family households, while 40 (30.1%) are nonfamily households. The most numerous type of family households are 2-person households, comprising 51, and the most common type of nonfamily households are 1-person households, comprising 36.
| Household Size | Family Households | Nonfamily Households |
| 1-Person Households | - | 36 (27.1%) |
| 2-Person Households | 51 (38.4%) | 3 (2.3%) |
| 3-Person Households | 7 (5.3%) | 1 (0.7%) |
| 4-Person Households | 23 (17.3%) | 0 (0.0%) |
| 5-Person Households | 12 (9.0%) | 0 (0.0%) |
| 6-Person Households | 0 (0.0%) | 0 (0.0%) |
| 7+ Person Households | 0 (0.0%) | 0 (0.0%) |
| Total | 93 (69.9%) | 40 (30.1%) |
Female Fertility in Lakeside town San Patricio County
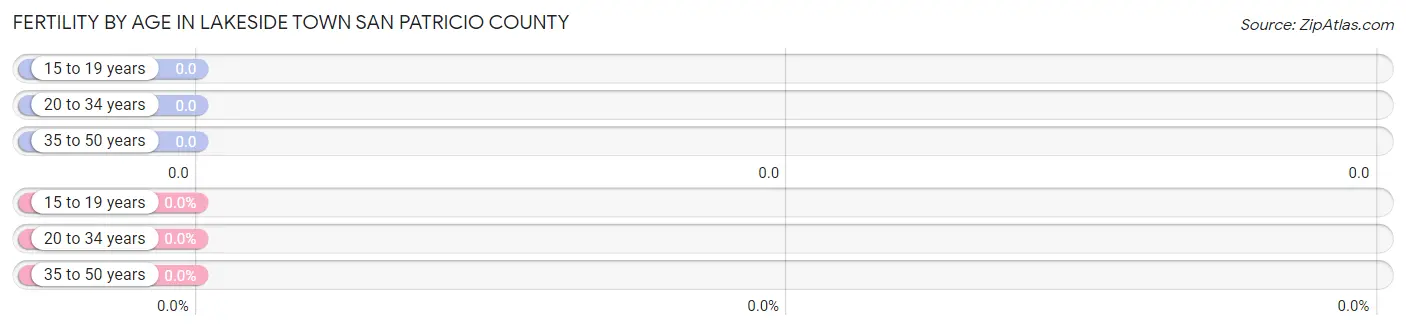
Fertility by Age in Lakeside town San Patricio County
| Age Bracket | Women with Births | Births / 1,000 Women |
| 15 to 19 years | 0 (0.0%) | 0.0 |
| 20 to 34 years | 0 (0.0%) | 0.0 |
| 35 to 50 years | 0 (0.0%) | 0.0 |
| Total | 0 (0.0%) | 0.0 |
Fertility by Age by Marriage Status in Lakeside town San Patricio County
| Age Bracket | Married | Unmarried |
| 15 to 19 years | 0 (0.0%) | 0 (0.0%) |
| 20 to 34 years | 0 (0.0%) | 0 (0.0%) |
| 35 to 50 years | 0 (0.0%) | 0 (0.0%) |
| Total | 0 (0.0%) | 0 (0.0%) |
Fertility by Education in Lakeside town San Patricio County
| Educational Attainment | Women with Births | Births / 1,000 Women |
| Less than High School | 0 (0.0%) | 0.0 |
| High School Diploma | 0 (0.0%) | 0.0 |
| College or Associate's Degree | 0 (0.0%) | 0.0 |
| Bachelor's Degree | 0 (0.0%) | 0.0 |
| Graduate Degree | 0 (0.0%) | 0.0 |
| Total | 0 (0.0%) | 0.0 |
Fertility by Education by Marriage Status in Lakeside town San Patricio County
| Educational Attainment | Married | Unmarried |
| Less than High School | 0 (0.0%) | 0 (0.0%) |
| High School Diploma | 0 (0.0%) | 0 (0.0%) |
| College or Associate's Degree | 0 (0.0%) | 0 (0.0%) |
| Bachelor's Degree | 0 (0.0%) | 0 (0.0%) |
| Graduate Degree | 0 (0.0%) | 0 (0.0%) |
| Total | 0 (0.0%) | 0 (0.0%) |
Income in Lakeside town San Patricio County
Income Overview in Lakeside town San Patricio County
Per Capita Income in Lakeside town San Patricio County is $28,864, while median incomes of families and households are $68,750 and $51,875 respectively.
| Characteristic | Number | Measure |
| Per Capita Income | 310 | $28,864 |
| Median Family Income | 93 | $68,750 |
| Mean Family Income | 93 | $79,310 |
| Median Household Income | 133 | $51,875 |
| Mean Household Income | 133 | $71,266 |
| Income Deficit | 93 | $0 |
| Wage / Income Gap (%) | 310 | 38.00% |
| Wage / Income Gap ($) | 310 | 62.00¢ per $1 |
| Gini / Inequality Index | 310 | 0.38 |
Earnings by Sex in Lakeside town San Patricio County
Average Earnings in Lakeside town San Patricio County are $30,625, $41,964 for men and $26,016 for women, a difference of 38.0%.
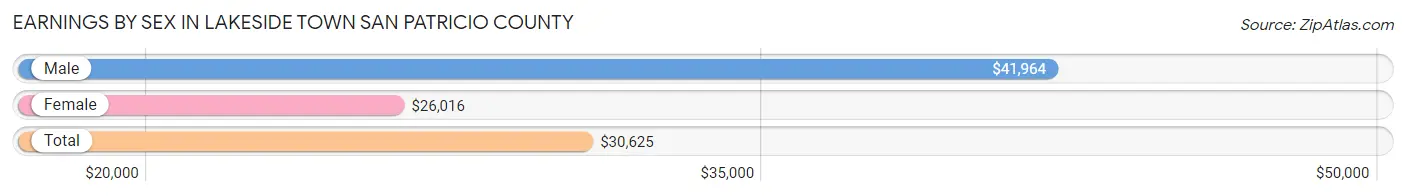
| Sex | Number | Average Earnings |
| Male | 74 (52.5%) | $41,964 |
| Female | 67 (47.5%) | $26,016 |
| Total | 141 (100.0%) | $30,625 |
Earnings by Sex by Income Bracket in Lakeside town San Patricio County
The most common earnings brackets in Lakeside town San Patricio County are $40,000 to $44,999 for men (14 | 18.9%) and $25,000 to $29,999 for women (18 | 26.9%).
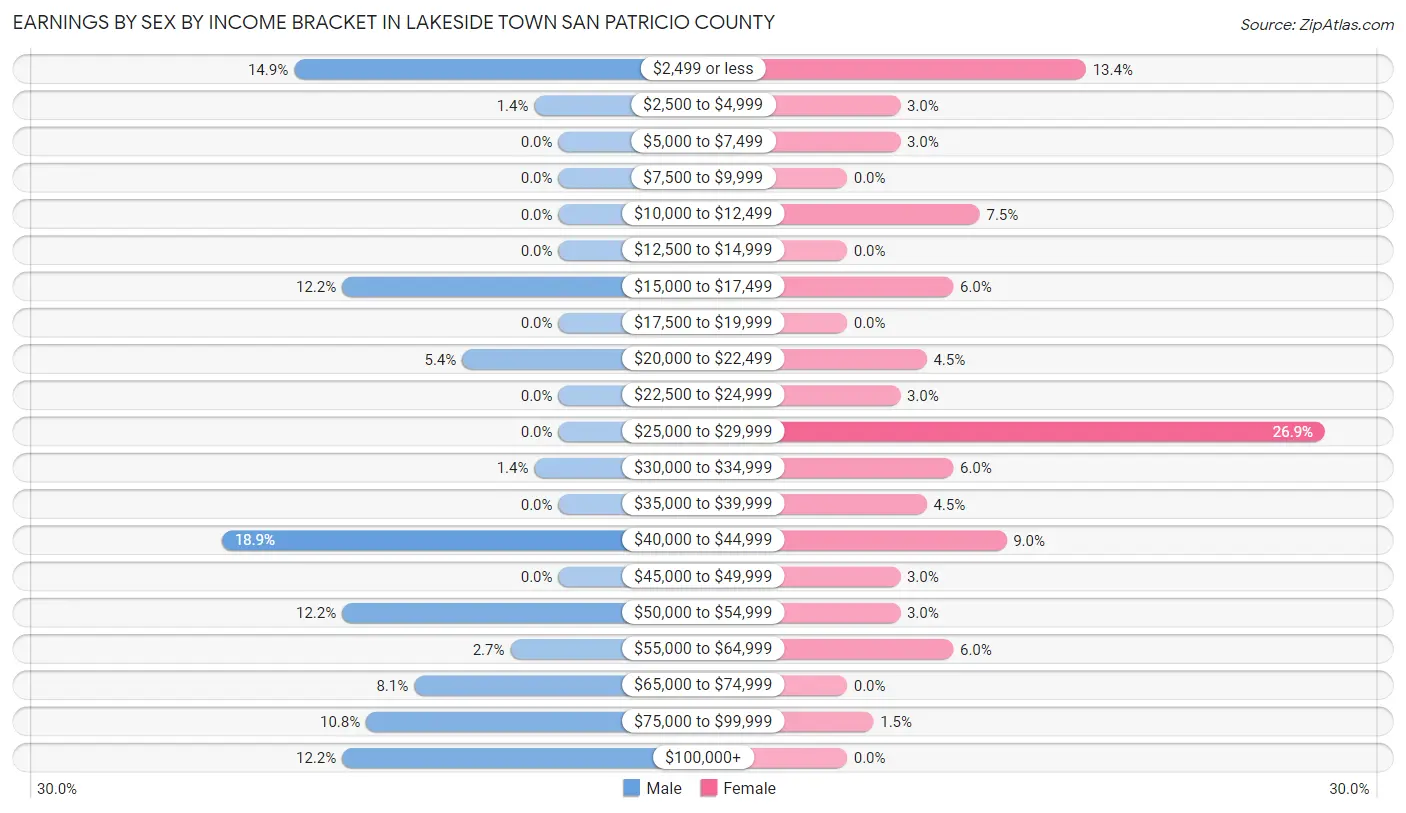
| Income | Male | Female |
| $2,499 or less | 11 (14.9%) | 9 (13.4%) |
| $2,500 to $4,999 | 1 (1.3%) | 2 (3.0%) |
| $5,000 to $7,499 | 0 (0.0%) | 2 (3.0%) |
| $7,500 to $9,999 | 0 (0.0%) | 0 (0.0%) |
| $10,000 to $12,499 | 0 (0.0%) | 5 (7.5%) |
| $12,500 to $14,999 | 0 (0.0%) | 0 (0.0%) |
| $15,000 to $17,499 | 9 (12.2%) | 4 (6.0%) |
| $17,500 to $19,999 | 0 (0.0%) | 0 (0.0%) |
| $20,000 to $22,499 | 4 (5.4%) | 3 (4.5%) |
| $22,500 to $24,999 | 0 (0.0%) | 2 (3.0%) |
| $25,000 to $29,999 | 0 (0.0%) | 18 (26.9%) |
| $30,000 to $34,999 | 1 (1.3%) | 4 (6.0%) |
| $35,000 to $39,999 | 0 (0.0%) | 3 (4.5%) |
| $40,000 to $44,999 | 14 (18.9%) | 6 (9.0%) |
| $45,000 to $49,999 | 0 (0.0%) | 2 (3.0%) |
| $50,000 to $54,999 | 9 (12.2%) | 2 (3.0%) |
| $55,000 to $64,999 | 2 (2.7%) | 4 (6.0%) |
| $65,000 to $74,999 | 6 (8.1%) | 0 (0.0%) |
| $75,000 to $99,999 | 8 (10.8%) | 1 (1.5%) |
| $100,000+ | 9 (12.2%) | 0 (0.0%) |
| Total | 74 (100.0%) | 67 (100.0%) |
Earnings by Sex by Educational Attainment in Lakeside town San Patricio County
Average earnings in Lakeside town San Patricio County are $52,917 for men and $26,875 for women, a difference of 49.2%. Men with an educational attainment of college or associate's degree enjoy the highest average annual earnings of $54,167, while those with college or associate's degree education earn the least with $54,167. Women with an educational attainment of bachelor's degree earn the most with the average annual earnings of $61,250, while those with college or associate's degree education have the smallest earnings of $26,406.
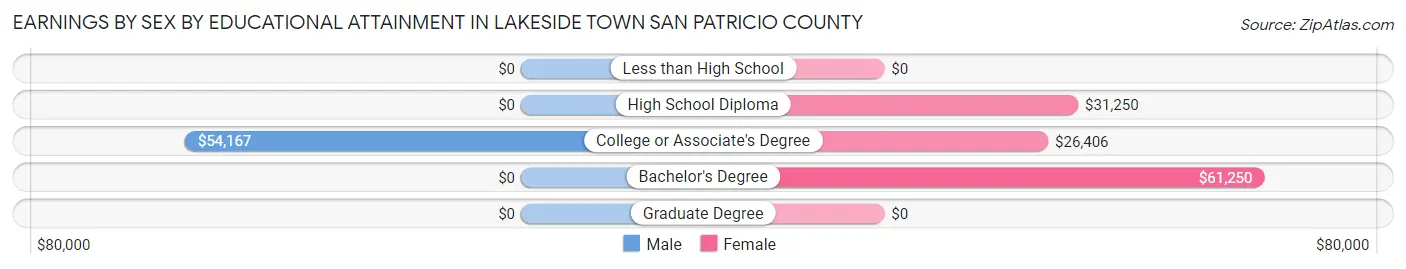
| Educational Attainment | Male Income | Female Income |
| Less than High School | - | - |
| High School Diploma | - | - |
| College or Associate's Degree | $54,167 | $26,406 |
| Bachelor's Degree | - | - |
| Graduate Degree | - | - |
| Total | $52,917 | $26,875 |
Family Income in Lakeside town San Patricio County
Family Income Brackets in Lakeside town San Patricio County
According to the Lakeside town San Patricio County family income data, there are 22 families falling into the $75,000 to $99,999 income range, which is the most common income bracket and makes up 23.7% of all families.
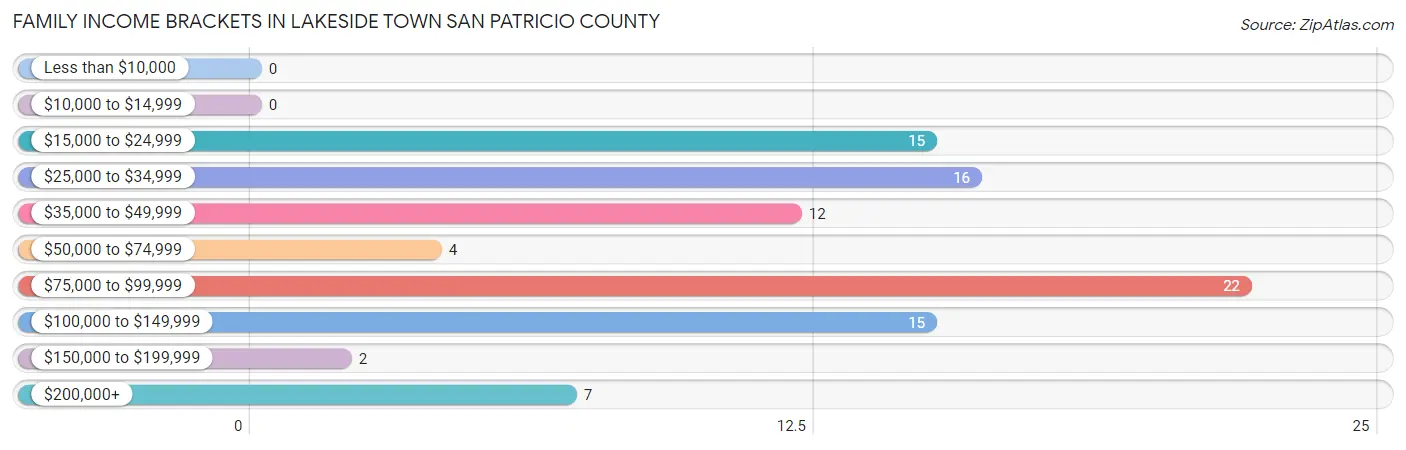
| Income Bracket | # Families | % Families |
| Less than $10,000 | 0 | 0.0% |
| $10,000 to $14,999 | 0 | 0.0% |
| $15,000 to $24,999 | 15 | 16.1% |
| $25,000 to $34,999 | 16 | 17.2% |
| $35,000 to $49,999 | 12 | 12.9% |
| $50,000 to $74,999 | 4 | 4.3% |
| $75,000 to $99,999 | 22 | 23.7% |
| $100,000 to $149,999 | 15 | 16.1% |
| $150,000 to $199,999 | 2 | 2.2% |
| $200,000+ | 7 | 7.5% |
Family Income by Famaliy Size in Lakeside town San Patricio County
4-person families (14 | 15.0%) account for the highest median family income in Lakeside town San Patricio County with $84,444 per family, while 2-person families (51 | 54.8%) have the highest median income of $21,771 per family member.
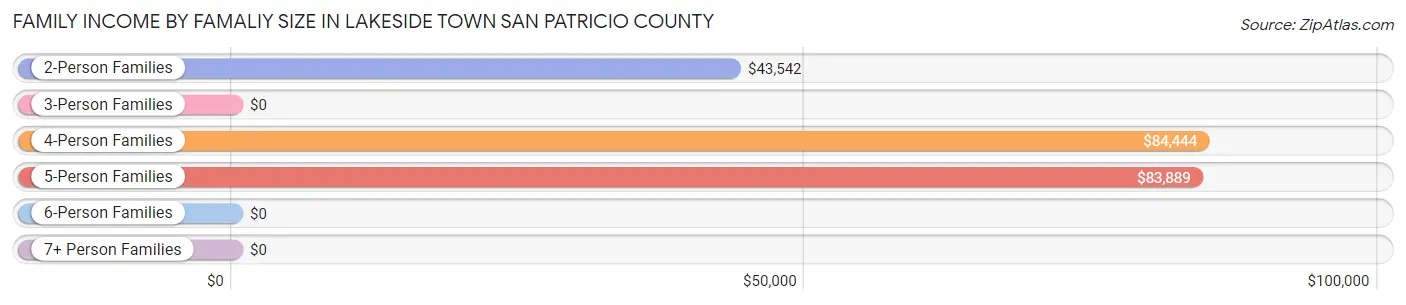
| Income Bracket | # Families | Median Income |
| 2-Person Families | 51 (54.8%) | $43,542 |
| 3-Person Families | 16 (17.2%) | $0 |
| 4-Person Families | 14 (15.0%) | $84,444 |
| 5-Person Families | 12 (12.9%) | $83,889 |
| 6-Person Families | 0 (0.0%) | $0 |
| 7+ Person Families | 0 (0.0%) | $0 |
| Total | 93 (100.0%) | $68,750 |
Family Income by Number of Earners in Lakeside town San Patricio County
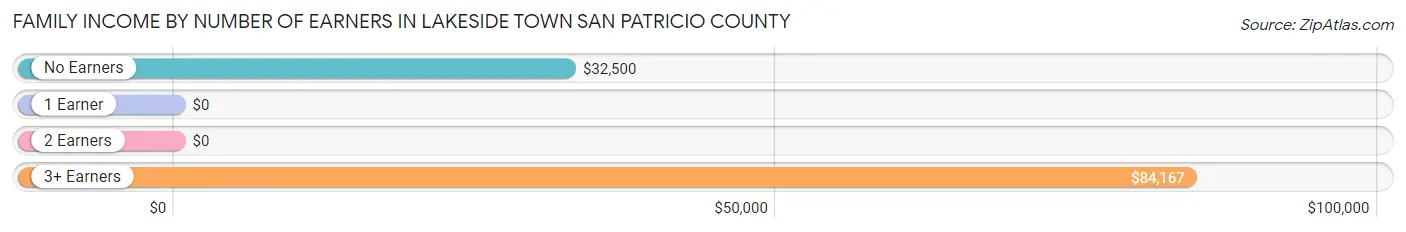
| Number of Earners | # Families | Median Income |
| No Earners | 28 (30.1%) | $32,500 |
| 1 Earner | 28 (30.1%) | $0 |
| 2 Earners | 23 (24.7%) | $0 |
| 3+ Earners | 14 (15.0%) | $84,167 |
| Total | 93 (100.0%) | $68,750 |
Household Income in Lakeside town San Patricio County
Household Income Brackets in Lakeside town San Patricio County
With 30 households falling in the category, the $75,000 to $99,999 income range is the most frequent in Lakeside town San Patricio County, accounting for 22.6% of all households.
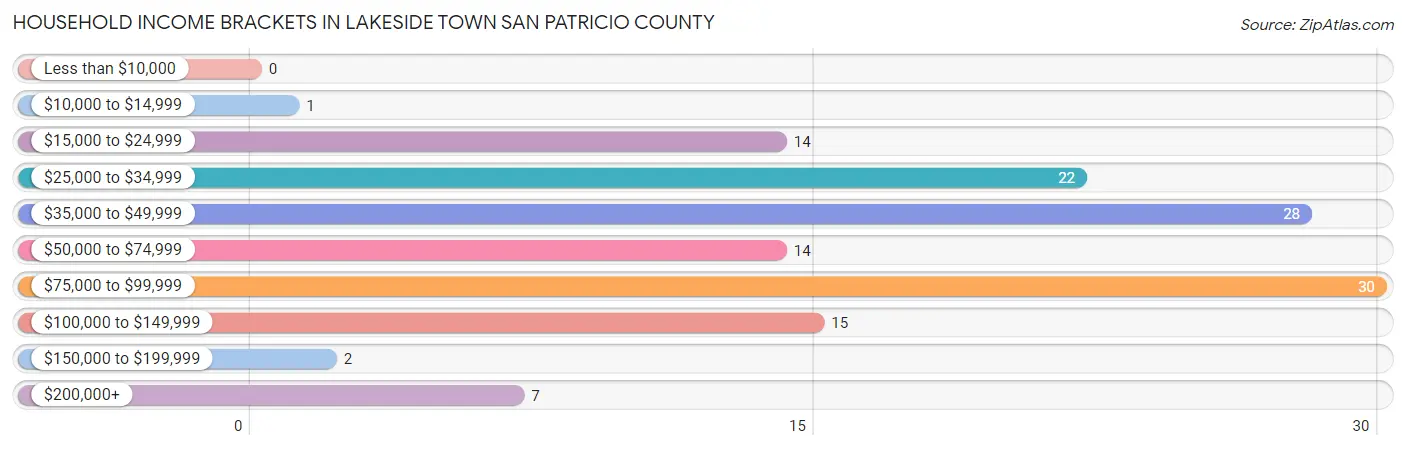
| Income Bracket | # Households | % Households |
| Less than $10,000 | 0 | 0.0% |
| $10,000 to $14,999 | 1 | 0.8% |
| $15,000 to $24,999 | 14 | 10.5% |
| $25,000 to $34,999 | 22 | 16.5% |
| $35,000 to $49,999 | 28 | 21.1% |
| $50,000 to $74,999 | 14 | 10.5% |
| $75,000 to $99,999 | 30 | 22.6% |
| $100,000 to $149,999 | 15 | 11.3% |
| $150,000 to $199,999 | 2 | 1.5% |
| $200,000+ | 7 | 5.3% |
Household Income by Householder Age in Lakeside town San Patricio County
The median household income in Lakeside town San Patricio County is $51,875, with the highest median household income of $82,986 found in the 45 to 64 years age bracket for the primary householder. A total of 57 households (42.9%) fall into this category.
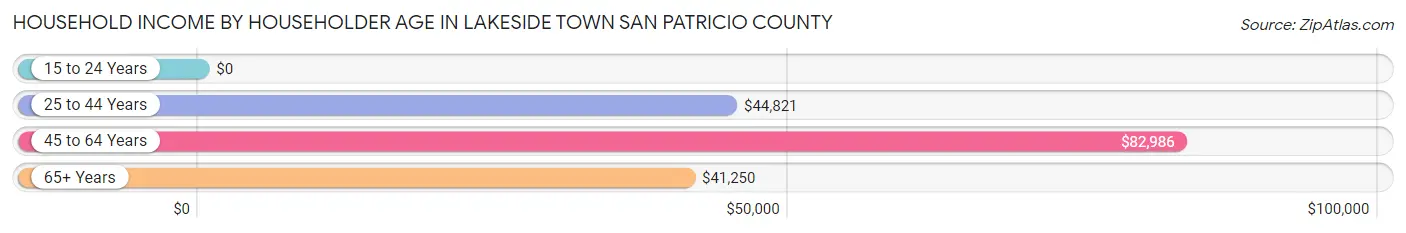
| Income Bracket | # Households | Median Income |
| 15 to 24 Years | 0 (0.0%) | $0 |
| 25 to 44 Years | 17 (12.8%) | $44,821 |
| 45 to 64 Years | 57 (42.9%) | $82,986 |
| 65+ Years | 59 (44.4%) | $41,250 |
| Total | 133 (100.0%) | $51,875 |
Poverty in Lakeside town San Patricio County
Income Below Poverty by Sex and Age in Lakeside town San Patricio County
With 16.9% poverty level for males and 1.3% for females among the residents of Lakeside town San Patricio County, 5 year old males and 75 year old and over females are the most vulnerable to poverty, with 5 males (100.0%) and 1 females (6.7%) in their respective age groups living below the poverty level.
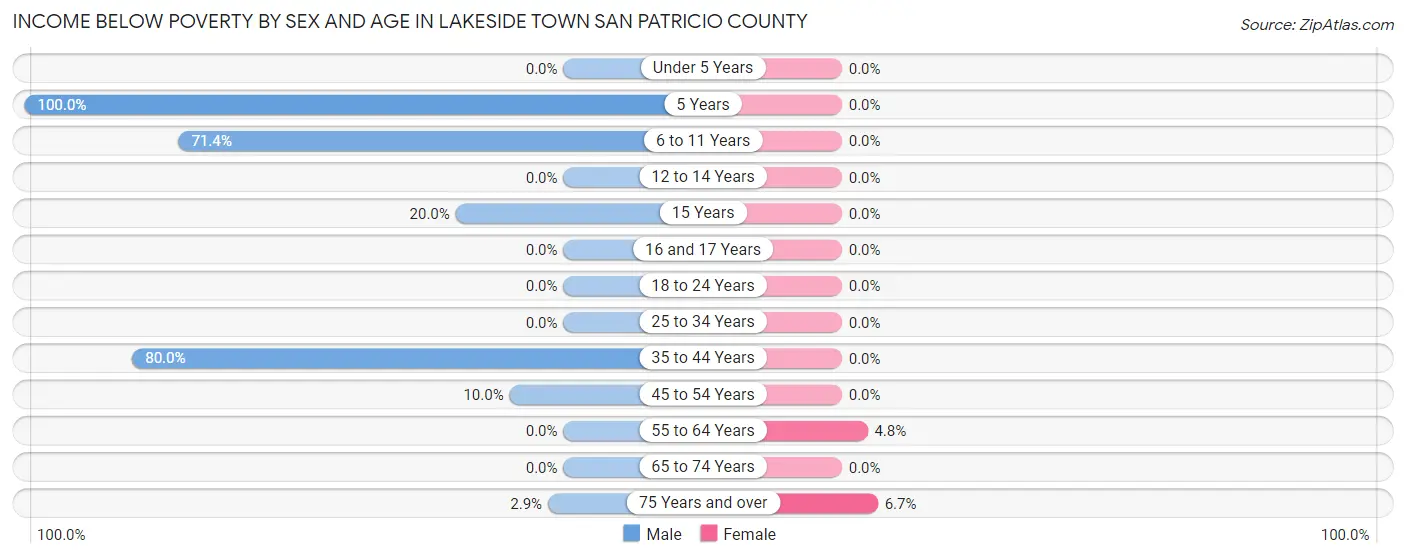
| Age Bracket | Male | Female |
| Under 5 Years | 0 (0.0%) | 0 (0.0%) |
| 5 Years | 5 (100.0%) | 0 (0.0%) |
| 6 to 11 Years | 5 (71.4%) | 0 (0.0%) |
| 12 to 14 Years | 0 (0.0%) | 0 (0.0%) |
| 15 Years | 1 (20.0%) | 0 (0.0%) |
| 16 and 17 Years | 0 (0.0%) | 0 (0.0%) |
| 18 to 24 Years | 0 (0.0%) | 0 (0.0%) |
| 25 to 34 Years | 0 (0.0%) | 0 (0.0%) |
| 35 to 44 Years | 12 (80.0%) | 0 (0.0%) |
| 45 to 54 Years | 3 (10.0%) | 0 (0.0%) |
| 55 to 64 Years | 0 (0.0%) | 1 (4.8%) |
| 65 to 74 Years | 0 (0.0%) | 0 (0.0%) |
| 75 Years and over | 1 (2.9%) | 1 (6.7%) |
| Total | 27 (16.9%) | 2 (1.3%) |
Income Above Poverty by Sex and Age in Lakeside town San Patricio County
According to the poverty statistics in Lakeside town San Patricio County, males aged under 5 years and females aged under 5 years are the age groups that are most secure financially, with 100.0% of males and 100.0% of females in these age groups living above the poverty line.
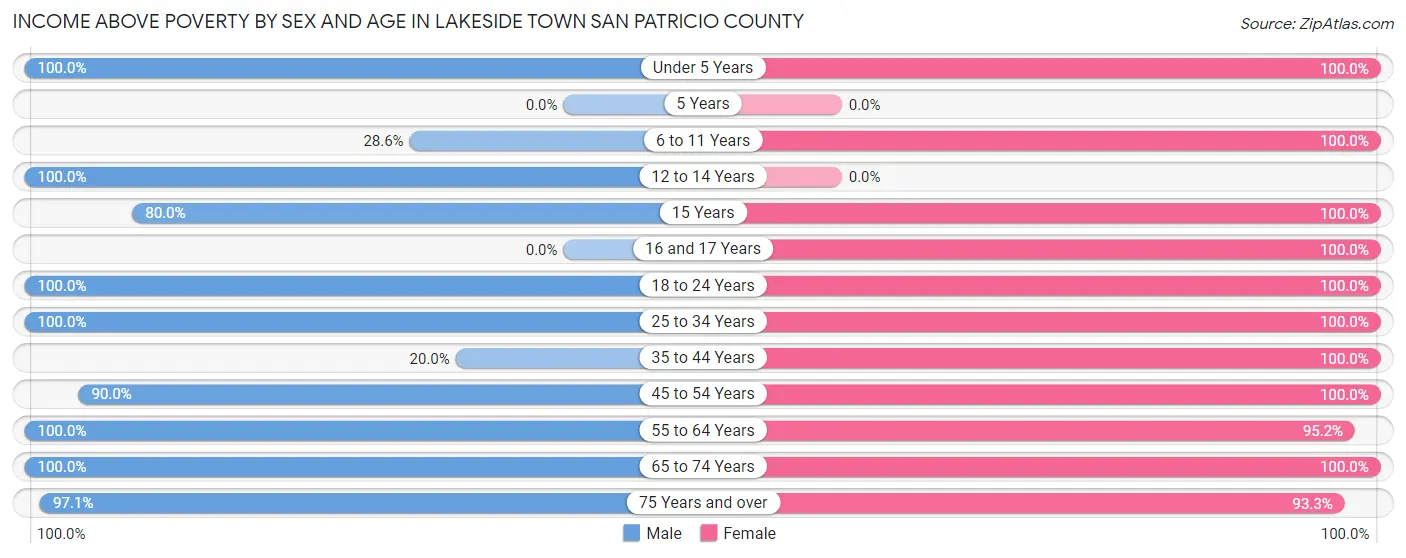
| Age Bracket | Male | Female |
| Under 5 Years | 2 (100.0%) | 2 (100.0%) |
| 5 Years | 0 (0.0%) | 0 (0.0%) |
| 6 to 11 Years | 2 (28.6%) | 2 (100.0%) |
| 12 to 14 Years | 1 (100.0%) | 0 (0.0%) |
| 15 Years | 4 (80.0%) | 4 (100.0%) |
| 16 and 17 Years | 0 (0.0%) | 9 (100.0%) |
| 18 to 24 Years | 18 (100.0%) | 22 (100.0%) |
| 25 to 34 Years | 4 (100.0%) | 7 (100.0%) |
| 35 to 44 Years | 3 (20.0%) | 13 (100.0%) |
| 45 to 54 Years | 27 (90.0%) | 29 (100.0%) |
| 55 to 64 Years | 15 (100.0%) | 20 (95.2%) |
| 65 to 74 Years | 23 (100.0%) | 26 (100.0%) |
| 75 Years and over | 34 (97.1%) | 14 (93.3%) |
| Total | 133 (83.1%) | 148 (98.7%) |
Income Below Poverty Among Married-Couple Families in Lakeside town San Patricio County
The poverty statistics for married-couple families in Lakeside town San Patricio County show that 1.4% or 1 of the total 73 families live below the poverty line. Families with 1 or 2 children have the highest poverty rate of 5.9%, comprising of 1 families. On the other hand, families with no children have the lowest poverty rate of 0.0%, which includes 0 families.
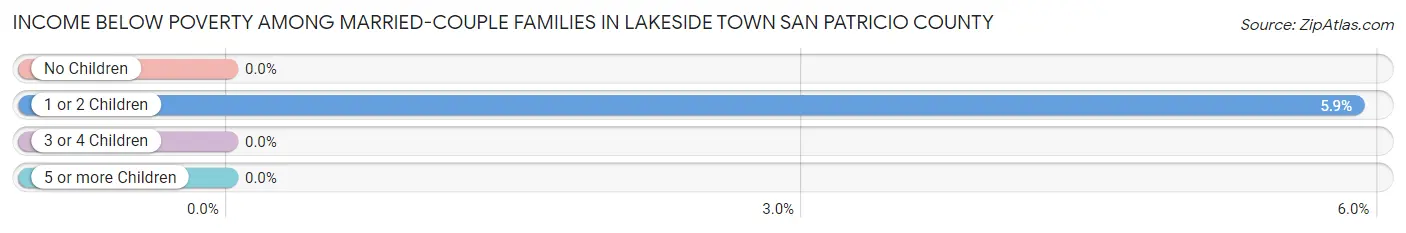
| Children | Above Poverty | Below Poverty |
| No Children | 54 (100.0%) | 0 (0.0%) |
| 1 or 2 Children | 16 (94.1%) | 1 (5.9%) |
| 3 or 4 Children | 2 (100.0%) | 0 (0.0%) |
| 5 or more Children | 0 (0.0%) | 0 (0.0%) |
| Total | 72 (98.6%) | 1 (1.4%) |
Income Below Poverty Among Single-Parent Households in Lakeside town San Patricio County
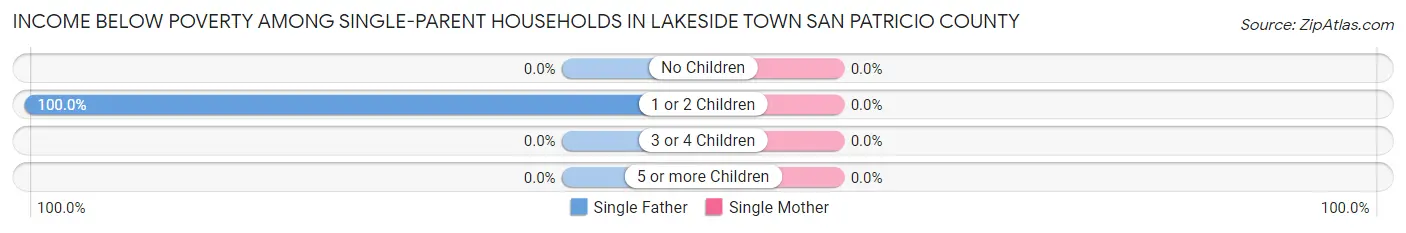
| Children | Single Father | Single Mother |
| No Children | 0 (0.0%) | 0 (0.0%) |
| 1 or 2 Children | 7 (100.0%) | 0 (0.0%) |
| 3 or 4 Children | 0 (0.0%) | 0 (0.0%) |
| 5 or more Children | 0 (0.0%) | 0 (0.0%) |
| Total | 7 (63.6%) | 0 (0.0%) |
Income Below Poverty Among Married-Couple vs Single-Parent Households in Lakeside town San Patricio County
The poverty data for Lakeside town San Patricio County shows that 1 of the married-couple family households (1.4%) and 7 of the single-parent households (35.0%) are living below the poverty level. Within the married-couple family households, those with 1 or 2 children have the highest poverty rate, with 1 households (5.9%) falling below the poverty line. Among the single-parent households, those with 1 or 2 children have the highest poverty rate, with 7 household (77.8%) living below poverty.
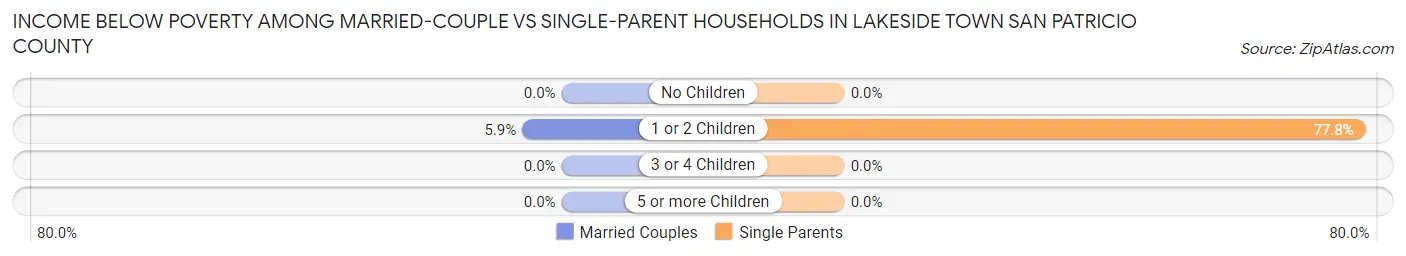
| Children | Married-Couple Families | Single-Parent Households |
| No Children | 0 (0.0%) | 0 (0.0%) |
| 1 or 2 Children | 1 (5.9%) | 7 (77.8%) |
| 3 or 4 Children | 0 (0.0%) | 0 (0.0%) |
| 5 or more Children | 0 (0.0%) | 0 (0.0%) |
| Total | 1 (1.4%) | 7 (35.0%) |
Employment Characteristics in Lakeside town San Patricio County
Employment by Class of Employer in Lakeside town San Patricio County
Among the 138 employed individuals in Lakeside town San Patricio County, private company employees (85 | 61.6%), local government employees (26 | 18.8%), and self-employed (not incorporated) (13 | 9.4%) make up the most common classes of employment.
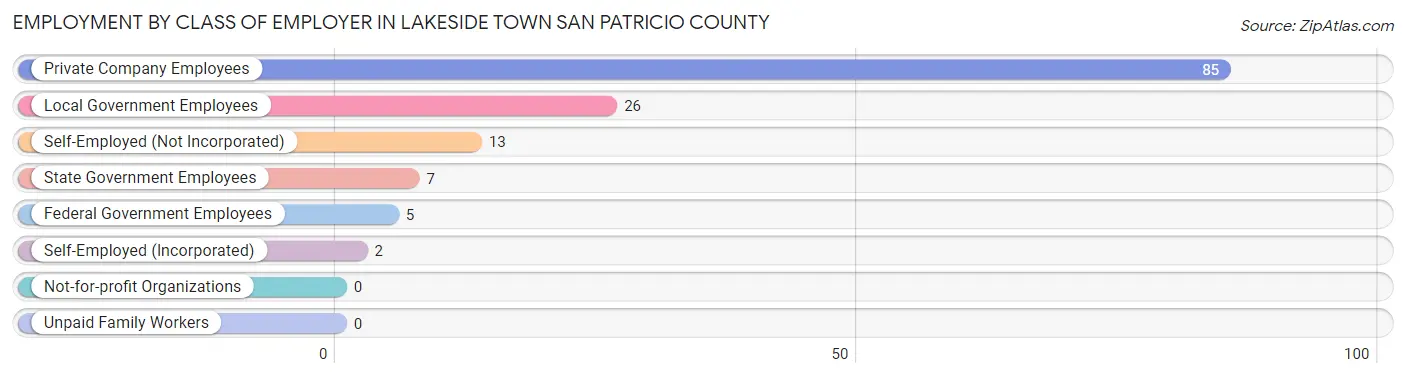
| Employer Class | # Employees | % Employees |
| Private Company Employees | 85 | 61.6% |
| Self-Employed (Incorporated) | 2 | 1.5% |
| Self-Employed (Not Incorporated) | 13 | 9.4% |
| Not-for-profit Organizations | 0 | 0.0% |
| Local Government Employees | 26 | 18.8% |
| State Government Employees | 7 | 5.1% |
| Federal Government Employees | 5 | 3.6% |
| Unpaid Family Workers | 0 | 0.0% |
| Total | 138 | 100.0% |
Employment Status by Age in Lakeside town San Patricio County
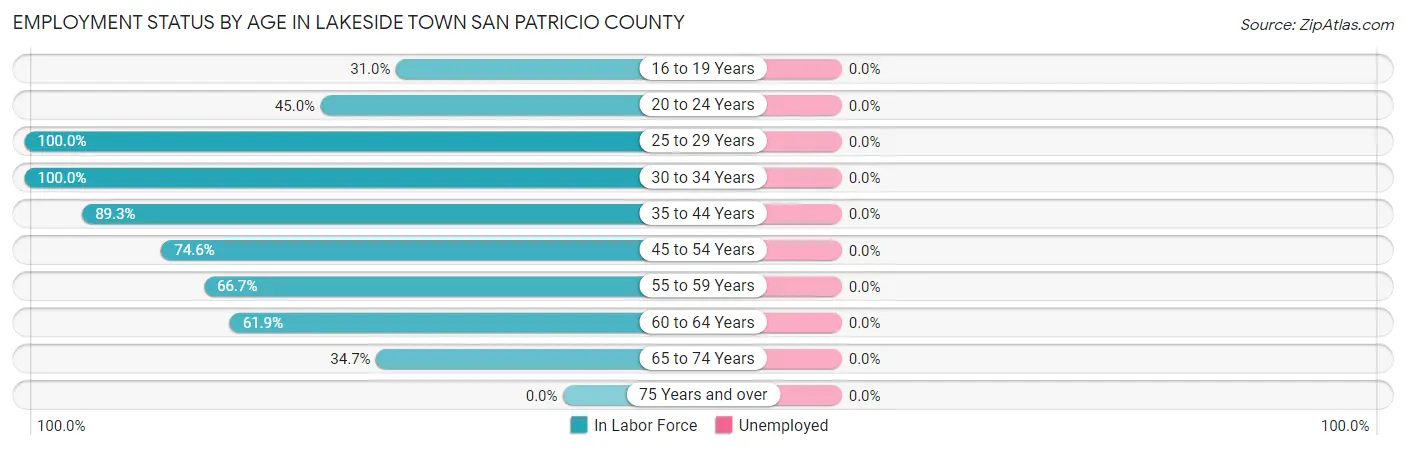
| Age Bracket | In Labor Force | Unemployed |
| 16 to 19 Years | 9 (31.0%) | 0 (0.0%) |
| 20 to 24 Years | 9 (45.0%) | 0 (0.0%) |
| 25 to 29 Years | 6 (100.0%) | 0 (0.0%) |
| 30 to 34 Years | 5 (100.0%) | 0 (0.0%) |
| 35 to 44 Years | 25 (89.3%) | 0 (0.0%) |
| 45 to 54 Years | 44 (74.6%) | 0 (0.0%) |
| 55 to 59 Years | 10 (66.7%) | 0 (0.0%) |
| 60 to 64 Years | 13 (61.9%) | 0 (0.0%) |
| 65 to 74 Years | 17 (34.7%) | 0 (0.0%) |
| 75 Years and over | 0 (0.0%) | 0 (0.0%) |
| Total | 138 (48.9%) | 0 (0.0%) |
Employment Status by Educational Attainment in Lakeside town San Patricio County
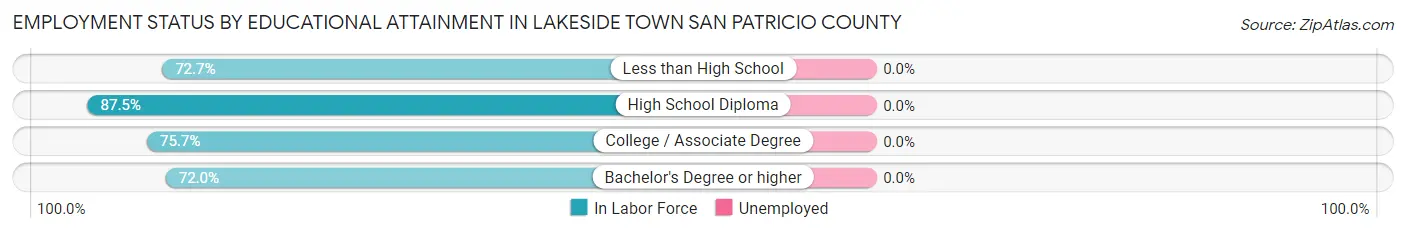
| Educational Attainment | In Labor Force | Unemployed |
| Less than High School | 8 (72.7%) | 0 (0.0%) |
| High School Diploma | 21 (87.5%) | 0 (0.0%) |
| College / Associate Degree | 56 (75.7%) | 0 (0.0%) |
| Bachelor's Degree or higher | 18 (72.0%) | 0 (0.0%) |
| Total | 103 (76.9%) | 0 (0.0%) |
Employment Occupations by Sex in Lakeside town San Patricio County
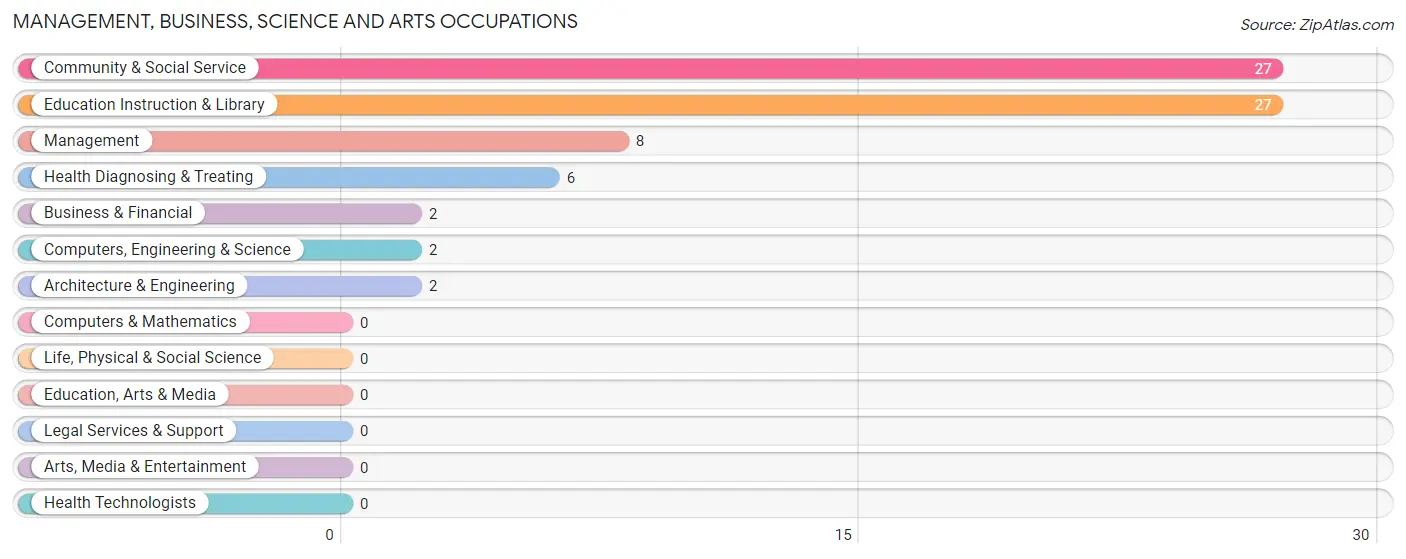
Management, Business, Science and Arts Occupations
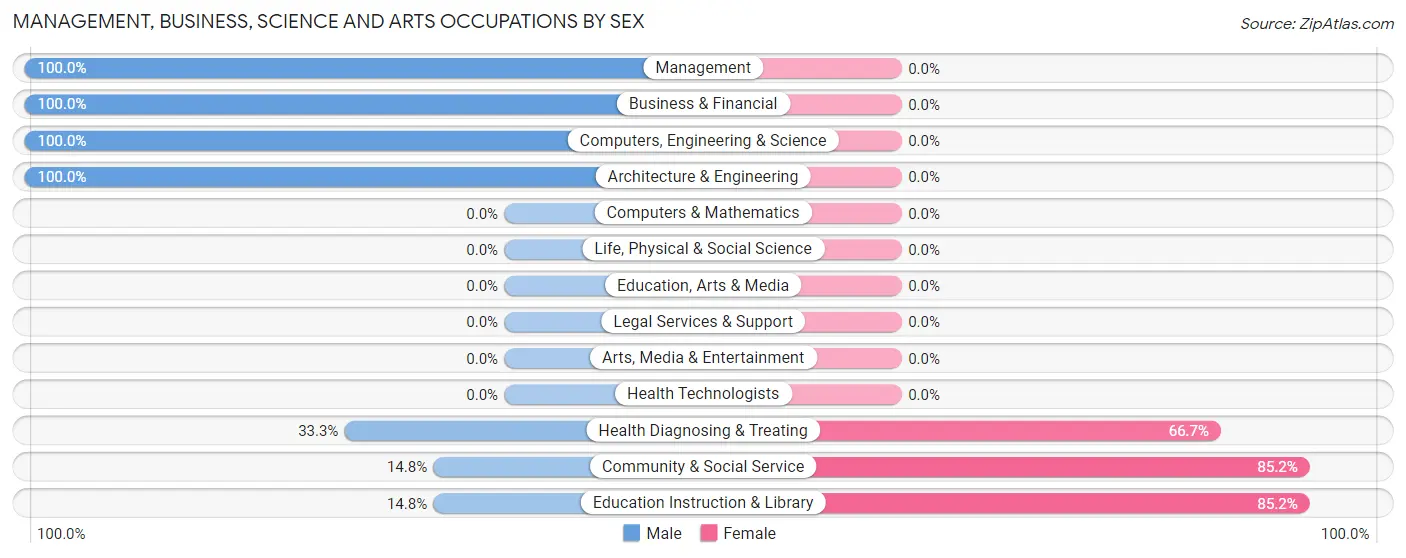
The most common Management, Business, Science and Arts occupations in Lakeside town San Patricio County are Community & Social Service (27 | 20.0%), Education Instruction & Library (27 | 20.0%), Management (8 | 5.9%), Health Diagnosing & Treating (6 | 4.4%), and Business & Financial (2 | 1.5%).
Management, Business, Science and Arts Occupations by Sex
Within the Management, Business, Science and Arts occupations in Lakeside town San Patricio County, the most male-oriented occupations are Management (100.0%), Business & Financial (100.0%), and Computers, Engineering & Science (100.0%), while the most female-oriented occupations are Community & Social Service (85.2%), Education Instruction & Library (85.2%), and Health Diagnosing & Treating (66.7%).
| Occupation | Male | Female |
| Management | 8 (100.0%) | 0 (0.0%) |
| Business & Financial | 2 (100.0%) | 0 (0.0%) |
| Computers, Engineering & Science | 2 (100.0%) | 0 (0.0%) |
| Computers & Mathematics | 0 (0.0%) | 0 (0.0%) |
| Architecture & Engineering | 2 (100.0%) | 0 (0.0%) |
| Life, Physical & Social Science | 0 (0.0%) | 0 (0.0%) |
| Community & Social Service | 4 (14.8%) | 23 (85.2%) |
| Education, Arts & Media | 0 (0.0%) | 0 (0.0%) |
| Legal Services & Support | 0 (0.0%) | 0 (0.0%) |
| Education Instruction & Library | 4 (14.8%) | 23 (85.2%) |
| Arts, Media & Entertainment | 0 (0.0%) | 0 (0.0%) |
| Health Diagnosing & Treating | 2 (33.3%) | 4 (66.7%) |
| Health Technologists | 0 (0.0%) | 0 (0.0%) |
| Total (Category) | 18 (40.0%) | 27 (60.0%) |
| Total (Overall) | 70 (51.8%) | 65 (48.1%) |
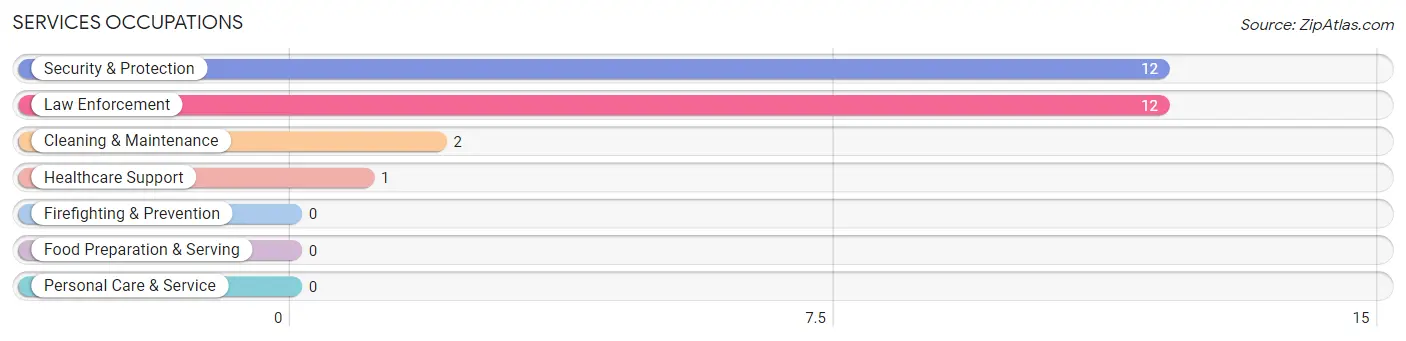
Services Occupations
The most common Services occupations in Lakeside town San Patricio County are Security & Protection (12 | 8.9%), Law Enforcement (12 | 8.9%), Cleaning & Maintenance (2 | 1.5%), and Healthcare Support (1 | 0.7%).
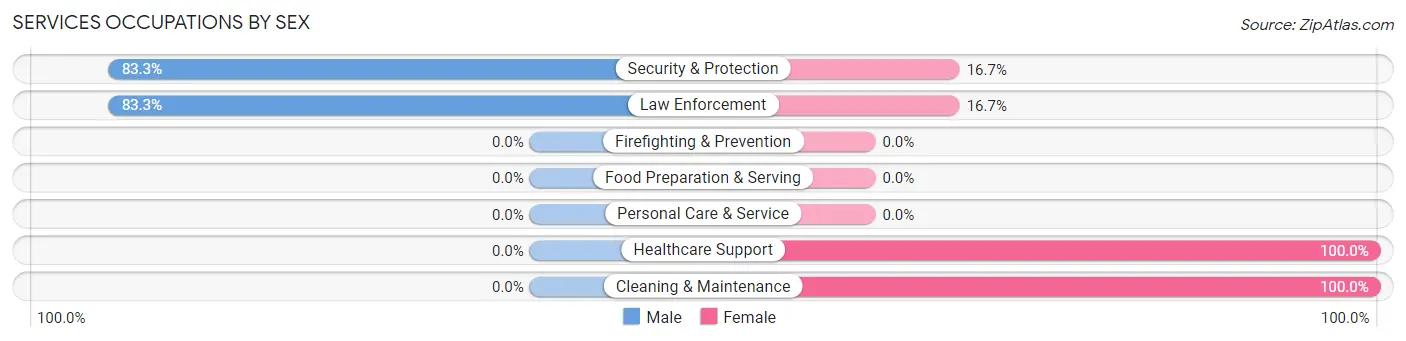
Services Occupations by Sex
Within the Services occupations in Lakeside town San Patricio County, the most male-oriented occupations are Security & Protection (83.3%), and Law Enforcement (83.3%), while the most female-oriented occupations are Healthcare Support (100.0%), Cleaning & Maintenance (100.0%), and Security & Protection (16.7%).
| Occupation | Male | Female |
| Healthcare Support | 0 (0.0%) | 1 (100.0%) |
| Security & Protection | 10 (83.3%) | 2 (16.7%) |
| Firefighting & Prevention | 0 (0.0%) | 0 (0.0%) |
| Law Enforcement | 10 (83.3%) | 2 (16.7%) |
| Food Preparation & Serving | 0 (0.0%) | 0 (0.0%) |
| Cleaning & Maintenance | 0 (0.0%) | 2 (100.0%) |
| Personal Care & Service | 0 (0.0%) | 0 (0.0%) |
| Total (Category) | 10 (66.7%) | 5 (33.3%) |
| Total (Overall) | 70 (51.8%) | 65 (48.1%) |
Sales and Office Occupations
The most common Sales and Office occupations in Lakeside town San Patricio County are Office & Administration (20 | 14.8%), and Sales & Related (19 | 14.1%).

Sales and Office Occupations by Sex

| Occupation | Male | Female |
| Sales & Related | 10 (52.6%) | 9 (47.4%) |
| Office & Administration | 0 (0.0%) | 20 (100.0%) |
| Total (Category) | 10 (25.6%) | 29 (74.4%) |
| Total (Overall) | 70 (51.8%) | 65 (48.1%) |
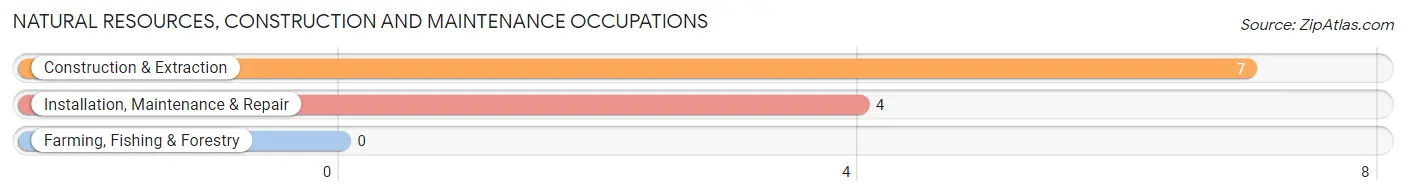
Natural Resources, Construction and Maintenance Occupations
The most common Natural Resources, Construction and Maintenance occupations in Lakeside town San Patricio County are Construction & Extraction (7 | 5.2%), and Installation, Maintenance & Repair (4 | 3.0%).
Natural Resources, Construction and Maintenance Occupations by Sex

| Occupation | Male | Female |
| Farming, Fishing & Forestry | 0 (0.0%) | 0 (0.0%) |
| Construction & Extraction | 7 (100.0%) | 0 (0.0%) |
| Installation, Maintenance & Repair | 4 (100.0%) | 0 (0.0%) |
| Total (Category) | 11 (100.0%) | 0 (0.0%) |
| Total (Overall) | 70 (51.8%) | 65 (48.1%) |
Production, Transportation and Moving Occupations
The most common Production, Transportation and Moving occupations in Lakeside town San Patricio County are Production (16 | 11.8%), and Transportation (9 | 6.7%).
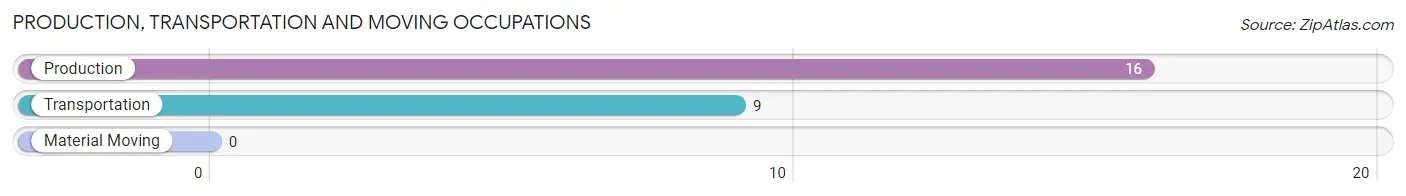
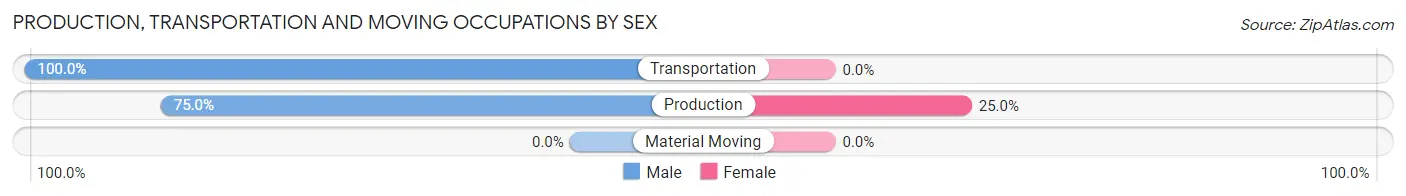
Production, Transportation and Moving Occupations by Sex
| Occupation | Male | Female |
| Production | 12 (75.0%) | 4 (25.0%) |
| Transportation | 9 (100.0%) | 0 (0.0%) |
| Material Moving | 0 (0.0%) | 0 (0.0%) |
| Total (Category) | 21 (84.0%) | 4 (16.0%) |
| Total (Overall) | 70 (51.8%) | 65 (48.1%) |
Employment Industries by Sex in Lakeside town San Patricio County
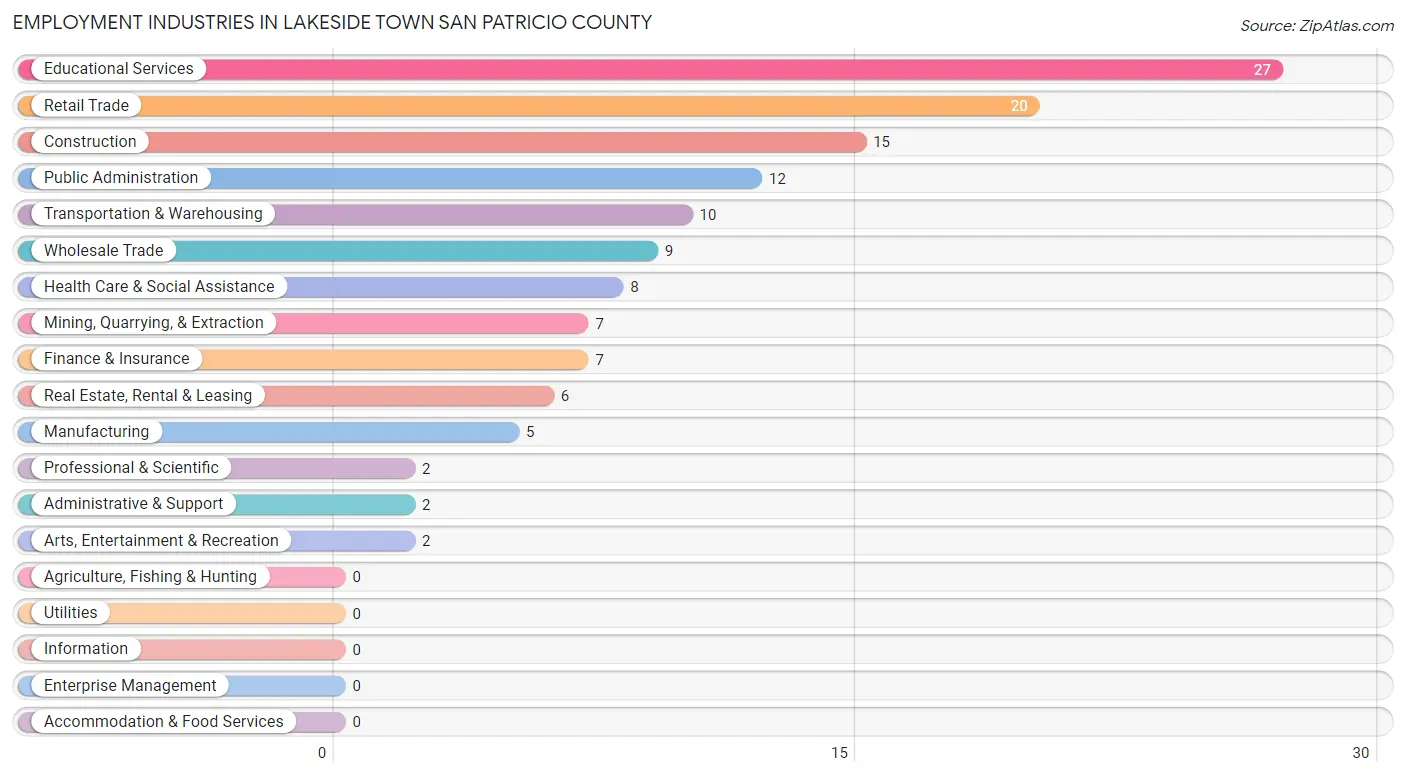
Employment Industries in Lakeside town San Patricio County
The major employment industries in Lakeside town San Patricio County include Educational Services (27 | 20.0%), Retail Trade (20 | 14.8%), Construction (15 | 11.1%), Public Administration (12 | 8.9%), and Transportation & Warehousing (10 | 7.4%).
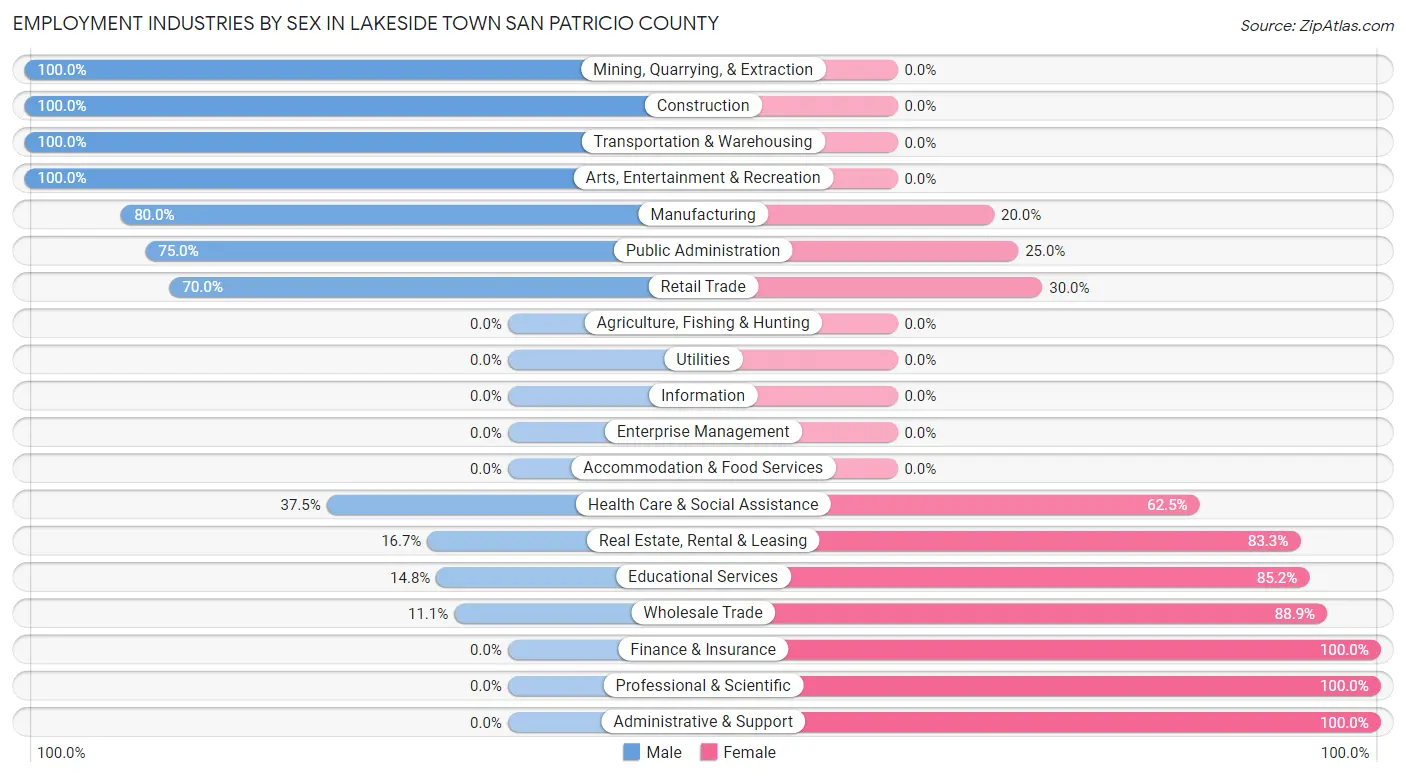
Employment Industries by Sex in Lakeside town San Patricio County
The Lakeside town San Patricio County industries that see more men than women are Mining, Quarrying, & Extraction (100.0%), Construction (100.0%), and Transportation & Warehousing (100.0%), whereas the industries that tend to have a higher number of women are Finance & Insurance (100.0%), Professional & Scientific (100.0%), and Administrative & Support (100.0%).
| Industry | Male | Female |
| Agriculture, Fishing & Hunting | 0 (0.0%) | 0 (0.0%) |
| Mining, Quarrying, & Extraction | 7 (100.0%) | 0 (0.0%) |
| Construction | 15 (100.0%) | 0 (0.0%) |
| Manufacturing | 4 (80.0%) | 1 (20.0%) |
| Wholesale Trade | 1 (11.1%) | 8 (88.9%) |
| Retail Trade | 14 (70.0%) | 6 (30.0%) |
| Transportation & Warehousing | 10 (100.0%) | 0 (0.0%) |
| Utilities | 0 (0.0%) | 0 (0.0%) |
| Information | 0 (0.0%) | 0 (0.0%) |
| Finance & Insurance | 0 (0.0%) | 7 (100.0%) |
| Real Estate, Rental & Leasing | 1 (16.7%) | 5 (83.3%) |
| Professional & Scientific | 0 (0.0%) | 2 (100.0%) |
| Enterprise Management | 0 (0.0%) | 0 (0.0%) |
| Administrative & Support | 0 (0.0%) | 2 (100.0%) |
| Educational Services | 4 (14.8%) | 23 (85.2%) |
| Health Care & Social Assistance | 3 (37.5%) | 5 (62.5%) |
| Arts, Entertainment & Recreation | 2 (100.0%) | 0 (0.0%) |
| Accommodation & Food Services | 0 (0.0%) | 0 (0.0%) |
| Public Administration | 9 (75.0%) | 3 (25.0%) |
| Total | 70 (51.8%) | 65 (48.1%) |
Education in Lakeside town San Patricio County
School Enrollment in Lakeside town San Patricio County
The most common levels of schooling among the 70 students in Lakeside town San Patricio County are college / undergraduate (36 | 51.4%), high school (18 | 25.7%), and elementary school (8 | 11.4%).
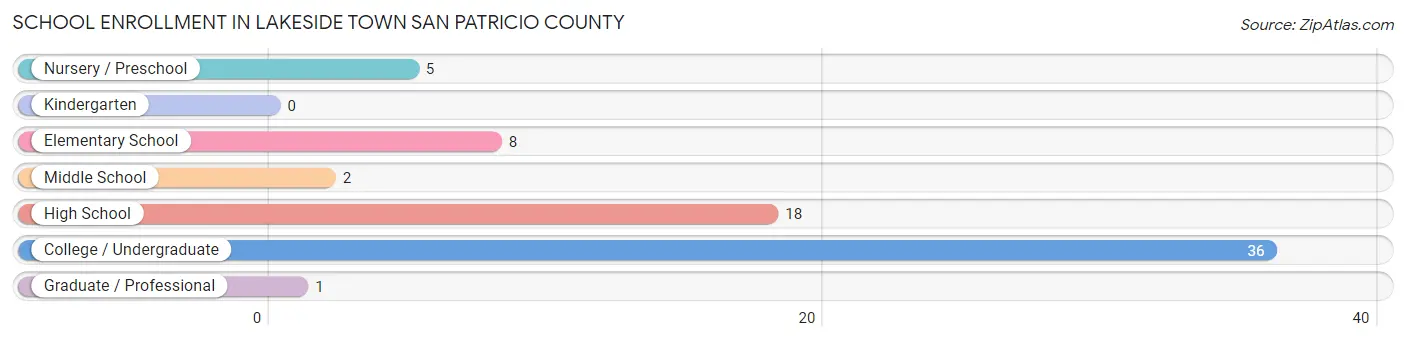
| School Level | # Students | % Students |
| Nursery / Preschool | 5 | 7.1% |
| Kindergarten | 0 | 0.0% |
| Elementary School | 8 | 11.4% |
| Middle School | 2 | 2.9% |
| High School | 18 | 25.7% |
| College / Undergraduate | 36 | 51.4% |
| Graduate / Professional | 1 | 1.4% |
| Total | 70 | 100.0% |
School Enrollment by Age by Funding Source in Lakeside town San Patricio County
Out of a total of 70 students who are enrolled in schools in Lakeside town San Patricio County, 12 (17.1%) attend a private institution, while the remaining 58 (82.9%) are enrolled in public schools. The age group of 35 years and over has the highest likelihood of being enrolled in private schools, with 3 (100.0% in the age bracket) enrolled. Conversely, the age group of 5 to 9 year old has the lowest likelihood of being enrolled in a private school, with 13 (100.0% in the age bracket) attending a public institution.

| Age Bracket | Public School | Private School |
| 3 to 4 Year Olds | 0 (0.0%) | 0 (0.0%) |
| 5 to 9 Year Old | 13 (100.0%) | 0 (0.0%) |
| 10 to 14 Year Olds | 2 (100.0%) | 0 (0.0%) |
| 15 to 17 Year Olds | 9 (50.0%) | 9 (50.0%) |
| 18 to 19 Year Olds | 11 (100.0%) | 0 (0.0%) |
| 20 to 24 Year Olds | 20 (100.0%) | 0 (0.0%) |
| 25 to 34 Year Olds | 3 (100.0%) | 0 (0.0%) |
| 35 Years and over | 0 (0.0%) | 3 (100.0%) |
| Total | 58 (82.9%) | 12 (17.1%) |
Educational Attainment by Field of Study in Lakeside town San Patricio County
Education (14 | 28.6%), psychology (10 | 20.4%), social sciences (10 | 20.4%), science & technology (7 | 14.3%), and engineering (2 | 4.1%) are the most common fields of study among 49 individuals in Lakeside town San Patricio County who have obtained a bachelor's degree or higher.
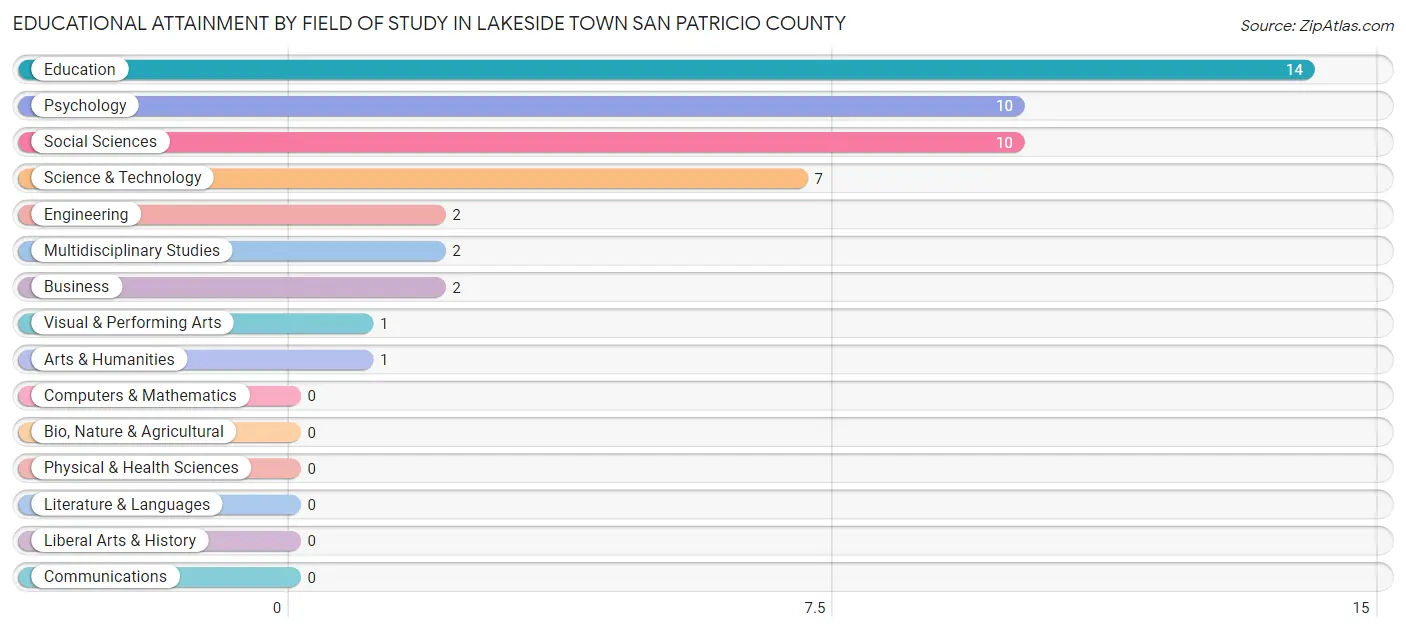
| Field of Study | # Graduates | % Graduates |
| Computers & Mathematics | 0 | 0.0% |
| Bio, Nature & Agricultural | 0 | 0.0% |
| Physical & Health Sciences | 0 | 0.0% |
| Psychology | 10 | 20.4% |
| Social Sciences | 10 | 20.4% |
| Engineering | 2 | 4.1% |
| Multidisciplinary Studies | 2 | 4.1% |
| Science & Technology | 7 | 14.3% |
| Business | 2 | 4.1% |
| Education | 14 | 28.6% |
| Literature & Languages | 0 | 0.0% |
| Liberal Arts & History | 0 | 0.0% |
| Visual & Performing Arts | 1 | 2.0% |
| Communications | 0 | 0.0% |
| Arts & Humanities | 1 | 2.0% |
| Total | 49 | 100.0% |
Transportation & Commute in Lakeside town San Patricio County
Vehicle Availability by Sex in Lakeside town San Patricio County
The most prevalent vehicle ownership categories in Lakeside town San Patricio County are males with 3 vehicles (26, accounting for 35.6%) and females with 3 vehicles (20, making up 40.0%).
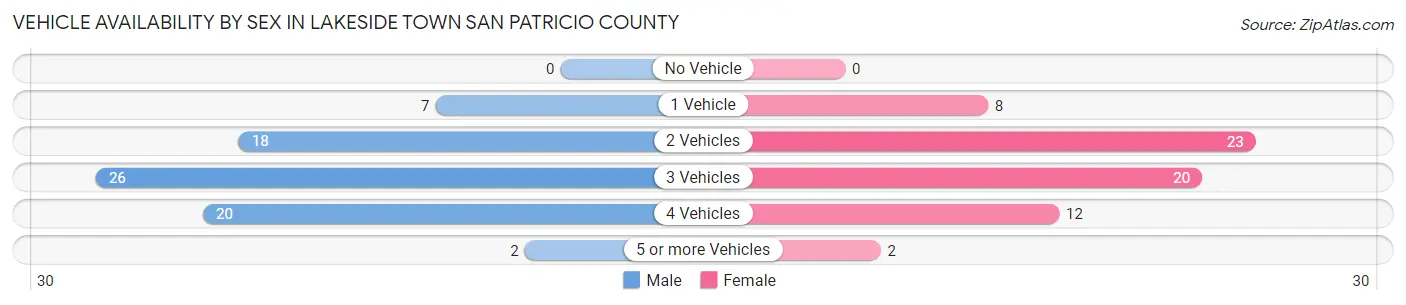
| Vehicles Available | Male | Female |
| No Vehicle | 0 (0.0%) | 0 (0.0%) |
| 1 Vehicle | 7 (9.6%) | 8 (12.3%) |
| 2 Vehicles | 18 (24.7%) | 23 (35.4%) |
| 3 Vehicles | 26 (35.6%) | 20 (30.8%) |
| 4 Vehicles | 20 (27.4%) | 12 (18.5%) |
| 5 or more Vehicles | 2 (2.7%) | 2 (3.1%) |
| Total | 73 (100.0%) | 65 (100.0%) |
Commute Time in Lakeside town San Patricio County
The most frequently occuring commute durations in Lakeside town San Patricio County are 45 to 59 minutes (45 commuters, 35.2%), 10 to 14 minutes (34 commuters, 26.6%), and 20 to 24 minutes (15 commuters, 11.7%).
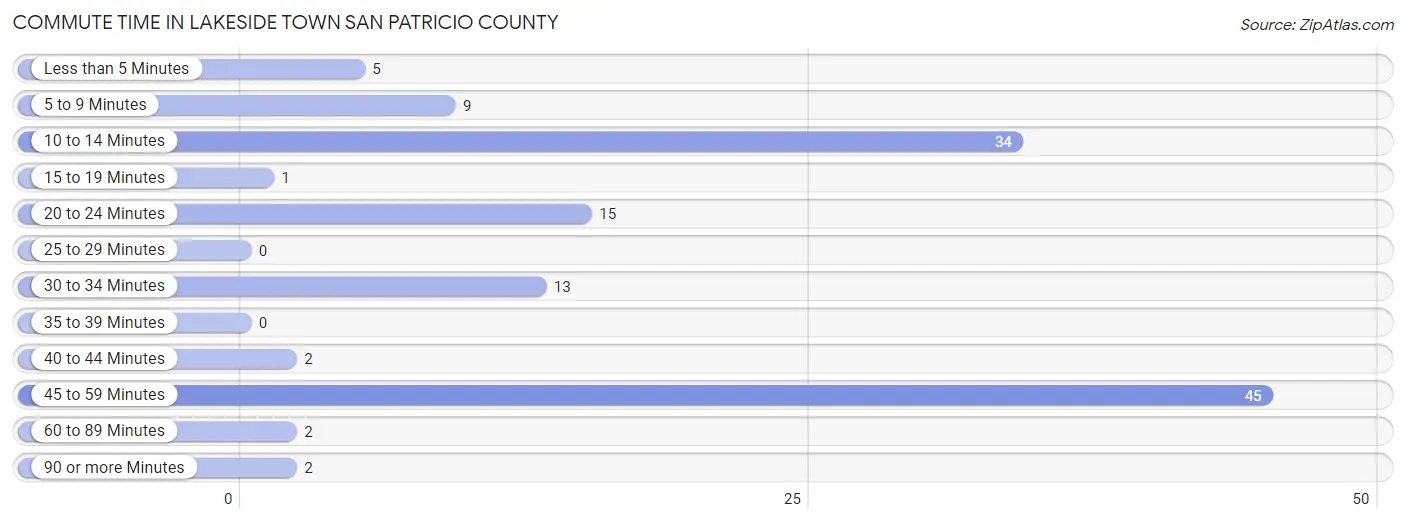
| Commute Time | # Commuters | % Commuters |
| Less than 5 Minutes | 5 | 3.9% |
| 5 to 9 Minutes | 9 | 7.0% |
| 10 to 14 Minutes | 34 | 26.6% |
| 15 to 19 Minutes | 1 | 0.8% |
| 20 to 24 Minutes | 15 | 11.7% |
| 25 to 29 Minutes | 0 | 0.0% |
| 30 to 34 Minutes | 13 | 10.2% |
| 35 to 39 Minutes | 0 | 0.0% |
| 40 to 44 Minutes | 2 | 1.6% |
| 45 to 59 Minutes | 45 | 35.2% |
| 60 to 89 Minutes | 2 | 1.6% |
| 90 or more Minutes | 2 | 1.6% |
Commute Time by Sex in Lakeside town San Patricio County
The most common commute times in Lakeside town San Patricio County are 45 to 59 minutes (28 commuters, 38.4%) for males and 45 to 59 minutes (17 commuters, 30.9%) for females.
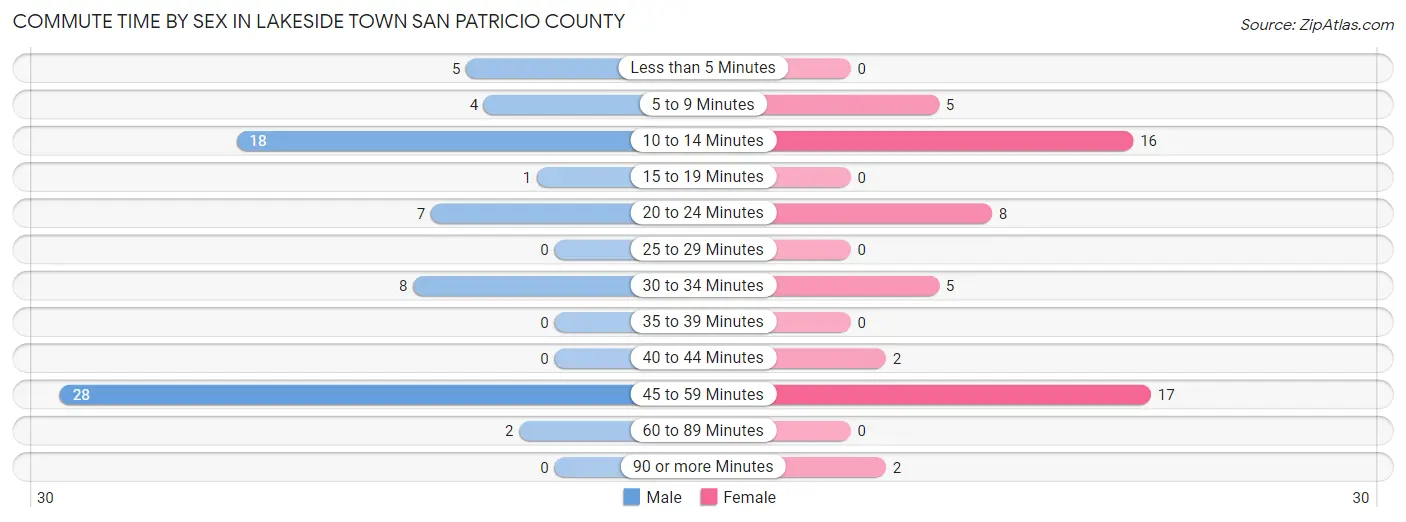
| Commute Time | Male | Female |
| Less than 5 Minutes | 5 (6.9%) | 0 (0.0%) |
| 5 to 9 Minutes | 4 (5.5%) | 5 (9.1%) |
| 10 to 14 Minutes | 18 (24.7%) | 16 (29.1%) |
| 15 to 19 Minutes | 1 (1.4%) | 0 (0.0%) |
| 20 to 24 Minutes | 7 (9.6%) | 8 (14.5%) |
| 25 to 29 Minutes | 0 (0.0%) | 0 (0.0%) |
| 30 to 34 Minutes | 8 (11.0%) | 5 (9.1%) |
| 35 to 39 Minutes | 0 (0.0%) | 0 (0.0%) |
| 40 to 44 Minutes | 0 (0.0%) | 2 (3.6%) |
| 45 to 59 Minutes | 28 (38.4%) | 17 (30.9%) |
| 60 to 89 Minutes | 2 (2.7%) | 0 (0.0%) |
| 90 or more Minutes | 0 (0.0%) | 2 (3.6%) |
Time of Departure to Work by Sex in Lakeside town San Patricio County
The most frequent times of departure to work in Lakeside town San Patricio County are 5:00 AM to 5:29 AM (12, 16.4%) for males and 6:30 AM to 6:59 AM (10, 18.2%) for females.
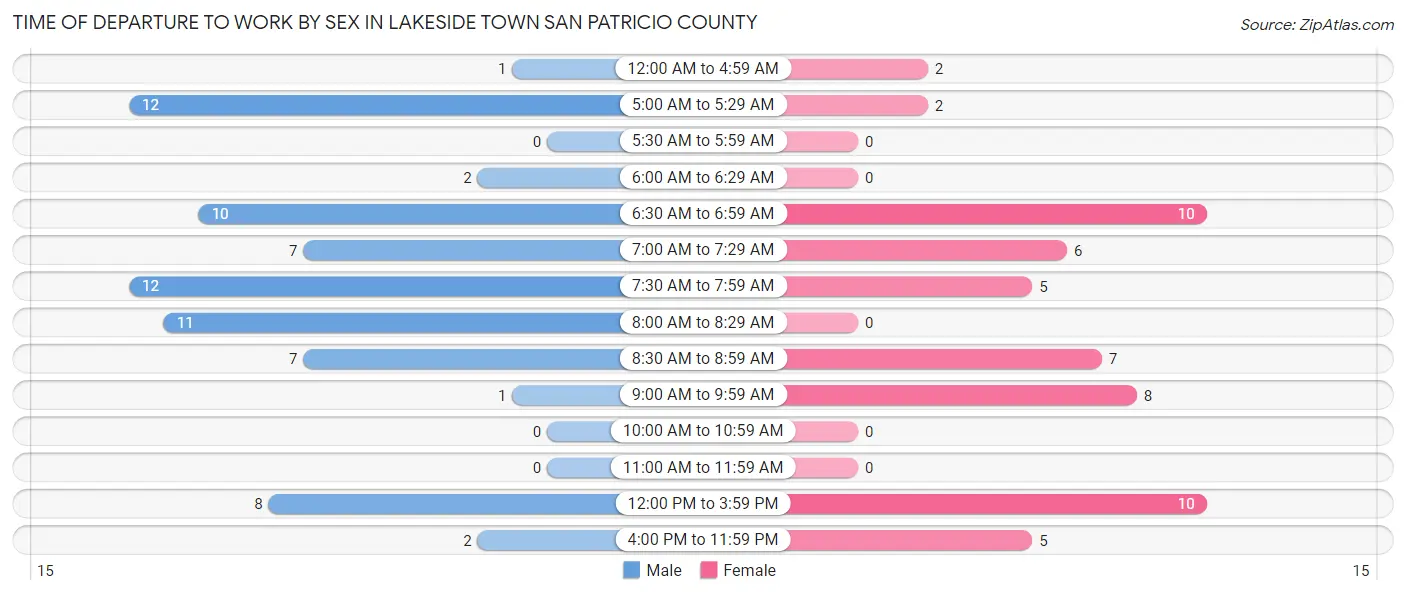
| Time of Departure | Male | Female |
| 12:00 AM to 4:59 AM | 1 (1.4%) | 2 (3.6%) |
| 5:00 AM to 5:29 AM | 12 (16.4%) | 2 (3.6%) |
| 5:30 AM to 5:59 AM | 0 (0.0%) | 0 (0.0%) |
| 6:00 AM to 6:29 AM | 2 (2.7%) | 0 (0.0%) |
| 6:30 AM to 6:59 AM | 10 (13.7%) | 10 (18.2%) |
| 7:00 AM to 7:29 AM | 7 (9.6%) | 6 (10.9%) |
| 7:30 AM to 7:59 AM | 12 (16.4%) | 5 (9.1%) |
| 8:00 AM to 8:29 AM | 11 (15.1%) | 0 (0.0%) |
| 8:30 AM to 8:59 AM | 7 (9.6%) | 7 (12.7%) |
| 9:00 AM to 9:59 AM | 1 (1.4%) | 8 (14.5%) |
| 10:00 AM to 10:59 AM | 0 (0.0%) | 0 (0.0%) |
| 11:00 AM to 11:59 AM | 0 (0.0%) | 0 (0.0%) |
| 12:00 PM to 3:59 PM | 8 (11.0%) | 10 (18.2%) |
| 4:00 PM to 11:59 PM | 2 (2.7%) | 5 (9.1%) |
| Total | 73 (100.0%) | 55 (100.0%) |
Housing Occupancy in Lakeside town San Patricio County
Occupancy by Ownership in Lakeside town San Patricio County
Of the total 133 dwellings in Lakeside town San Patricio County, owner-occupied units account for 119 (89.5%), while renter-occupied units make up 14 (10.5%).
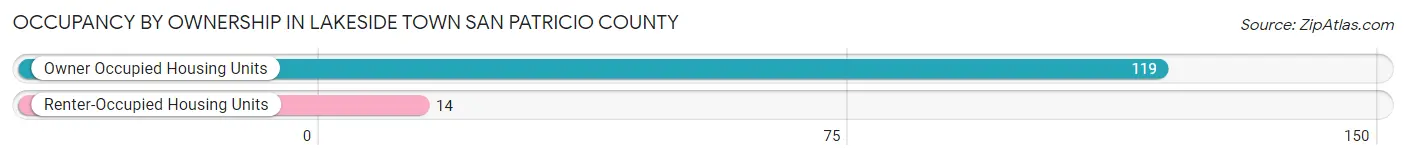
| Occupancy | # Housing Units | % Housing Units |
| Owner Occupied Housing Units | 119 | 89.5% |
| Renter-Occupied Housing Units | 14 | 10.5% |
| Total Occupied Housing Units | 133 | 100.0% |
Occupancy by Household Size in Lakeside town San Patricio County
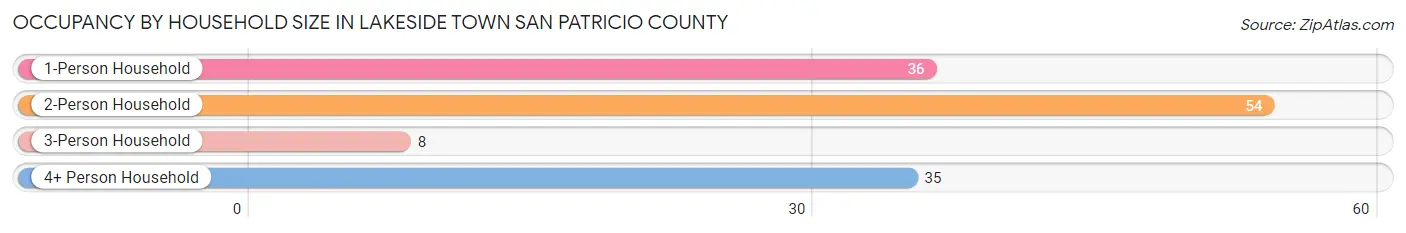
| Household Size | # Housing Units | % Housing Units |
| 1-Person Household | 36 | 27.1% |
| 2-Person Household | 54 | 40.6% |
| 3-Person Household | 8 | 6.0% |
| 4+ Person Household | 35 | 26.3% |
| Total Housing Units | 133 | 100.0% |
Occupancy by Ownership by Household Size in Lakeside town San Patricio County
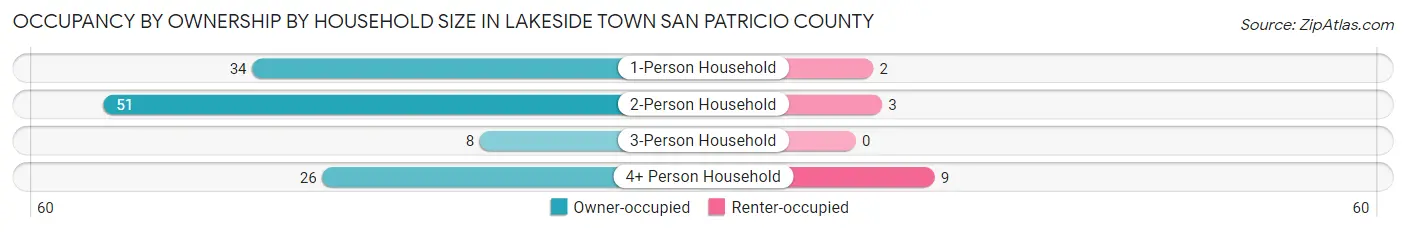
| Household Size | Owner-occupied | Renter-occupied |
| 1-Person Household | 34 (94.4%) | 2 (5.6%) |
| 2-Person Household | 51 (94.4%) | 3 (5.6%) |
| 3-Person Household | 8 (100.0%) | 0 (0.0%) |
| 4+ Person Household | 26 (74.3%) | 9 (25.7%) |
| Total Housing Units | 119 (89.5%) | 14 (10.5%) |
Occupancy by Educational Attainment in Lakeside town San Patricio County
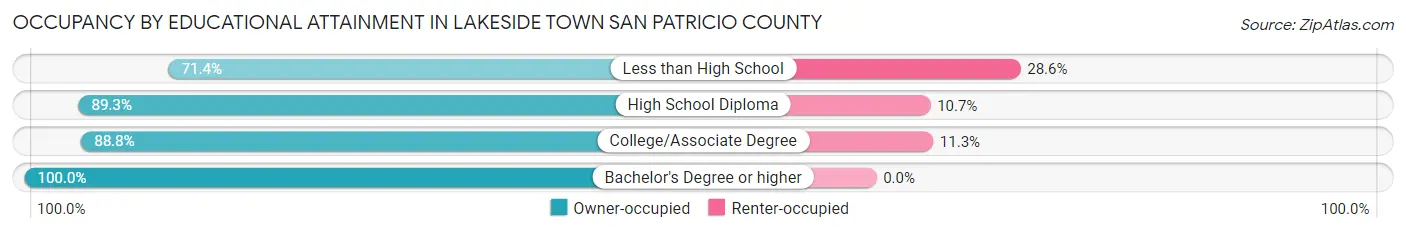
| Household Size | Owner-occupied | Renter-occupied |
| Less than High School | 5 (71.4%) | 2 (28.6%) |
| High School Diploma | 25 (89.3%) | 3 (10.7%) |
| College/Associate Degree | 71 (88.7%) | 9 (11.3%) |
| Bachelor's Degree or higher | 18 (100.0%) | 0 (0.0%) |
Occupancy by Age of Householder in Lakeside town San Patricio County
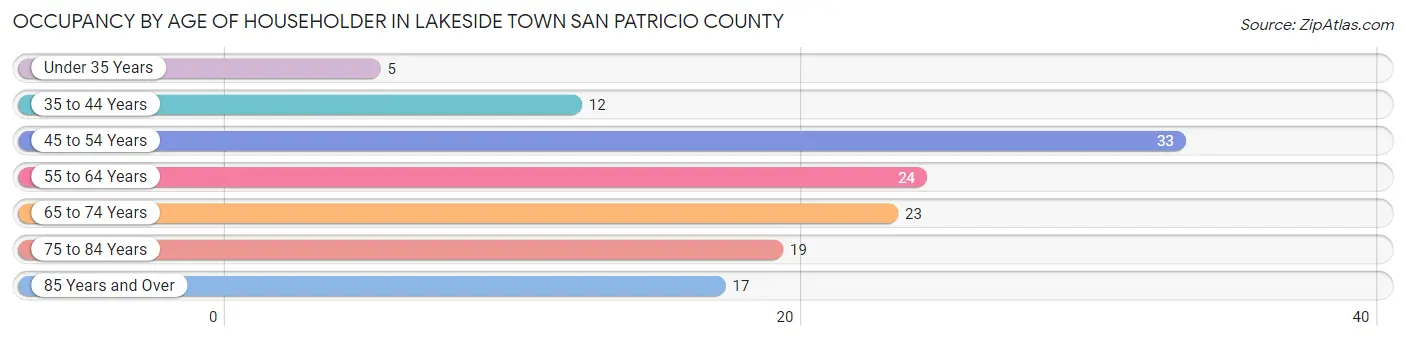
| Age Bracket | # Households | % Households |
| Under 35 Years | 5 | 3.8% |
| 35 to 44 Years | 12 | 9.0% |
| 45 to 54 Years | 33 | 24.8% |
| 55 to 64 Years | 24 | 18.0% |
| 65 to 74 Years | 23 | 17.3% |
| 75 to 84 Years | 19 | 14.3% |
| 85 Years and Over | 17 | 12.8% |
| Total | 133 | 100.0% |
Housing Finances in Lakeside town San Patricio County
Median Income by Occupancy in Lakeside town San Patricio County
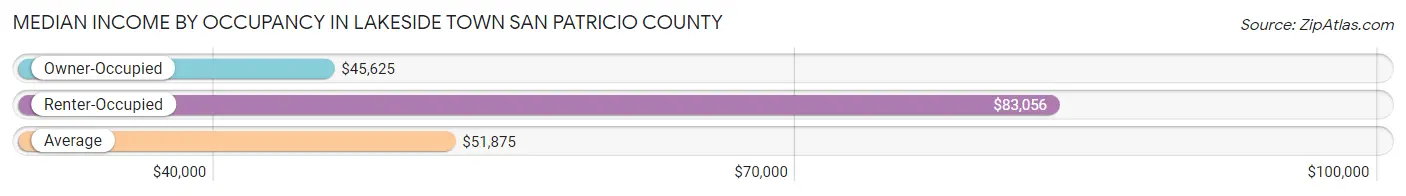
| Occupancy Type | # Households | Median Income |
| Owner-Occupied | 119 (89.5%) | $45,625 |
| Renter-Occupied | 14 (10.5%) | $83,056 |
| Average | 133 (100.0%) | $51,875 |
Occupancy by Householder Income Bracket in Lakeside town San Patricio County
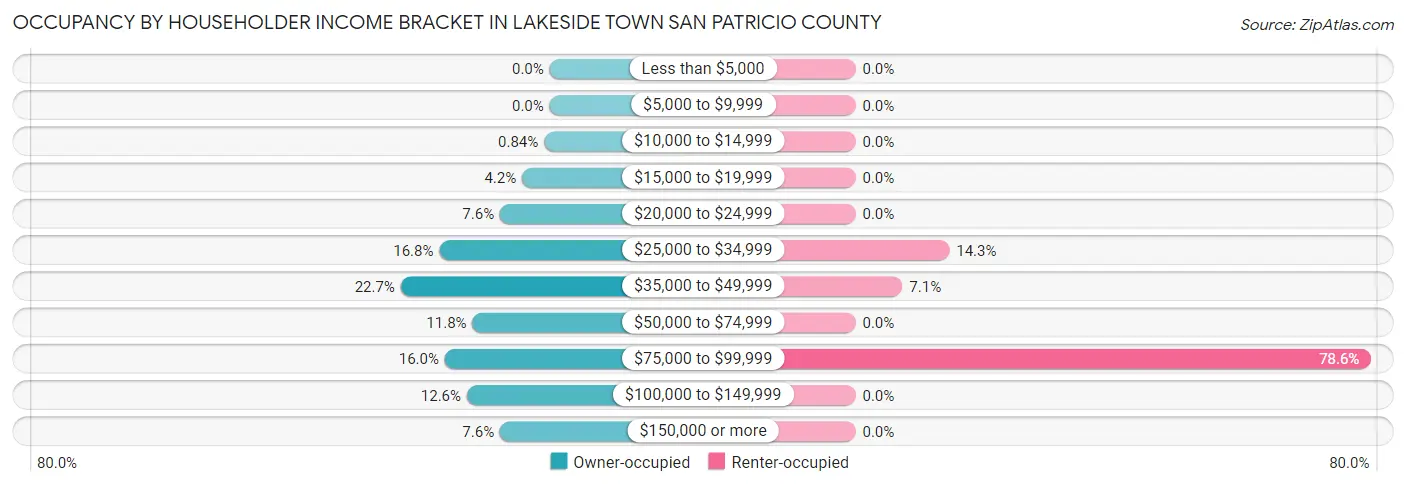
| Income Bracket | Owner-occupied | Renter-occupied |
| Less than $5,000 | 0 (0.0%) | 0 (0.0%) |
| $5,000 to $9,999 | 0 (0.0%) | 0 (0.0%) |
| $10,000 to $14,999 | 1 (0.8%) | 0 (0.0%) |
| $15,000 to $19,999 | 5 (4.2%) | 0 (0.0%) |
| $20,000 to $24,999 | 9 (7.6%) | 0 (0.0%) |
| $25,000 to $34,999 | 20 (16.8%) | 2 (14.3%) |
| $35,000 to $49,999 | 27 (22.7%) | 1 (7.1%) |
| $50,000 to $74,999 | 14 (11.8%) | 0 (0.0%) |
| $75,000 to $99,999 | 19 (16.0%) | 11 (78.6%) |
| $100,000 to $149,999 | 15 (12.6%) | 0 (0.0%) |
| $150,000 or more | 9 (7.6%) | 0 (0.0%) |
| Total | 119 (100.0%) | 14 (100.0%) |
Monthly Housing Cost Tiers in Lakeside town San Patricio County
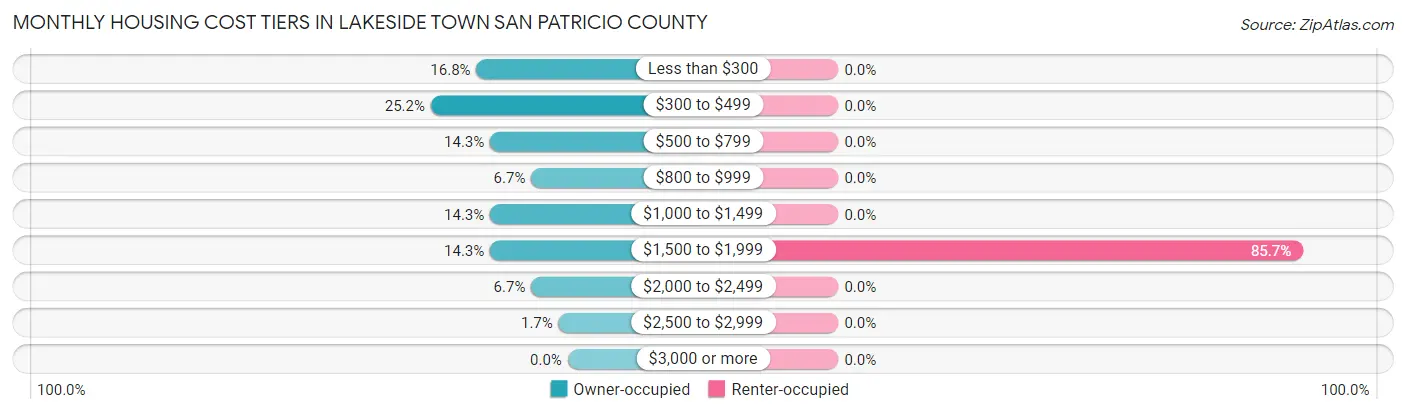
| Monthly Cost | Owner-occupied | Renter-occupied |
| Less than $300 | 20 (16.8%) | 0 (0.0%) |
| $300 to $499 | 30 (25.2%) | 0 (0.0%) |
| $500 to $799 | 17 (14.3%) | 0 (0.0%) |
| $800 to $999 | 8 (6.7%) | 0 (0.0%) |
| $1,000 to $1,499 | 17 (14.3%) | 0 (0.0%) |
| $1,500 to $1,999 | 17 (14.3%) | 12 (85.7%) |
| $2,000 to $2,499 | 8 (6.7%) | 0 (0.0%) |
| $2,500 to $2,999 | 2 (1.7%) | 0 (0.0%) |
| $3,000 or more | 0 (0.0%) | 0 (0.0%) |
| Total | 119 (100.0%) | 14 (100.0%) |
Physical Housing Characteristics in Lakeside town San Patricio County
Housing Structures in Lakeside town San Patricio County
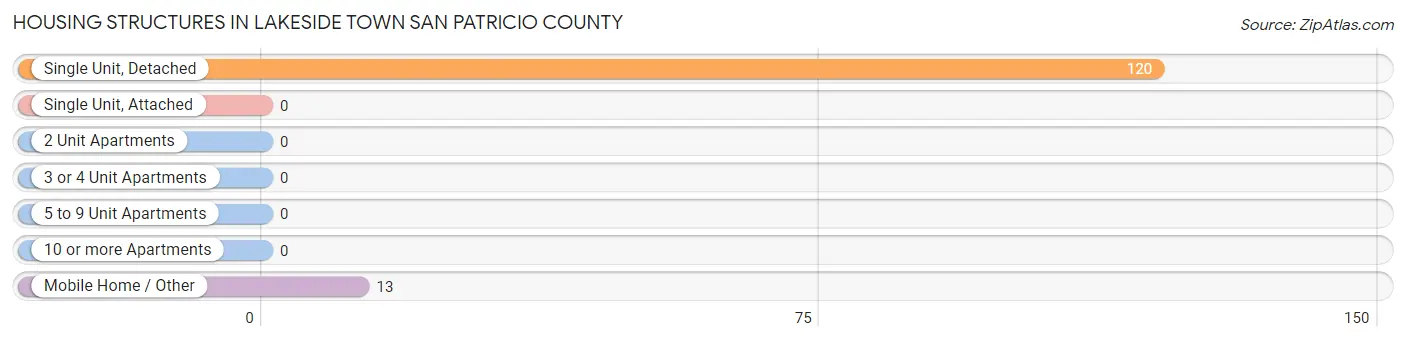
| Structure Type | # Housing Units | % Housing Units |
| Single Unit, Detached | 120 | 90.2% |
| Single Unit, Attached | 0 | 0.0% |
| 2 Unit Apartments | 0 | 0.0% |
| 3 or 4 Unit Apartments | 0 | 0.0% |
| 5 to 9 Unit Apartments | 0 | 0.0% |
| 10 or more Apartments | 0 | 0.0% |
| Mobile Home / Other | 13 | 9.8% |
| Total | 133 | 100.0% |
Housing Structures by Occupancy in Lakeside town San Patricio County

| Structure Type | Owner-occupied | Renter-occupied |
| Single Unit, Detached | 108 (90.0%) | 12 (10.0%) |
| Single Unit, Attached | 0 (0.0%) | 0 (0.0%) |
| 2 Unit Apartments | 0 (0.0%) | 0 (0.0%) |
| 3 or 4 Unit Apartments | 0 (0.0%) | 0 (0.0%) |
| 5 to 9 Unit Apartments | 0 (0.0%) | 0 (0.0%) |
| 10 or more Apartments | 0 (0.0%) | 0 (0.0%) |
| Mobile Home / Other | 11 (84.6%) | 2 (15.4%) |
| Total | 119 (89.5%) | 14 (10.5%) |
Housing Structures by Number of Rooms in Lakeside town San Patricio County
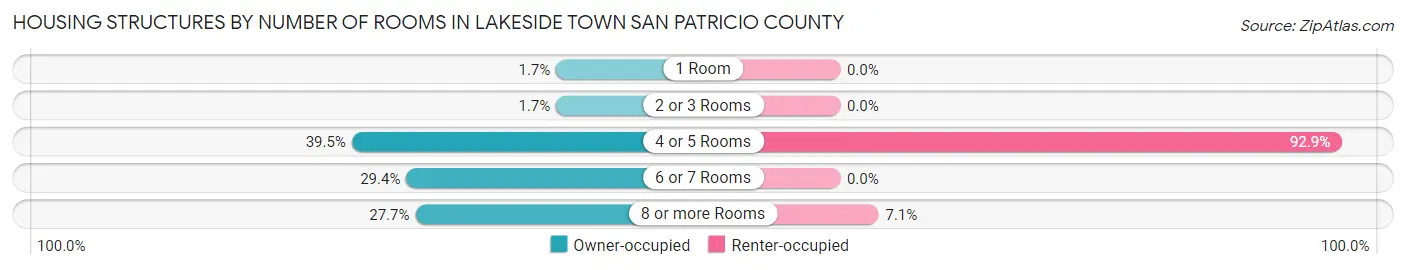
| Number of Rooms | Owner-occupied | Renter-occupied |
| 1 Room | 2 (1.7%) | 0 (0.0%) |
| 2 or 3 Rooms | 2 (1.7%) | 0 (0.0%) |
| 4 or 5 Rooms | 47 (39.5%) | 13 (92.9%) |
| 6 or 7 Rooms | 35 (29.4%) | 0 (0.0%) |
| 8 or more Rooms | 33 (27.7%) | 1 (7.1%) |
| Total | 119 (100.0%) | 14 (100.0%) |
Housing Structure by Heating Type in Lakeside town San Patricio County
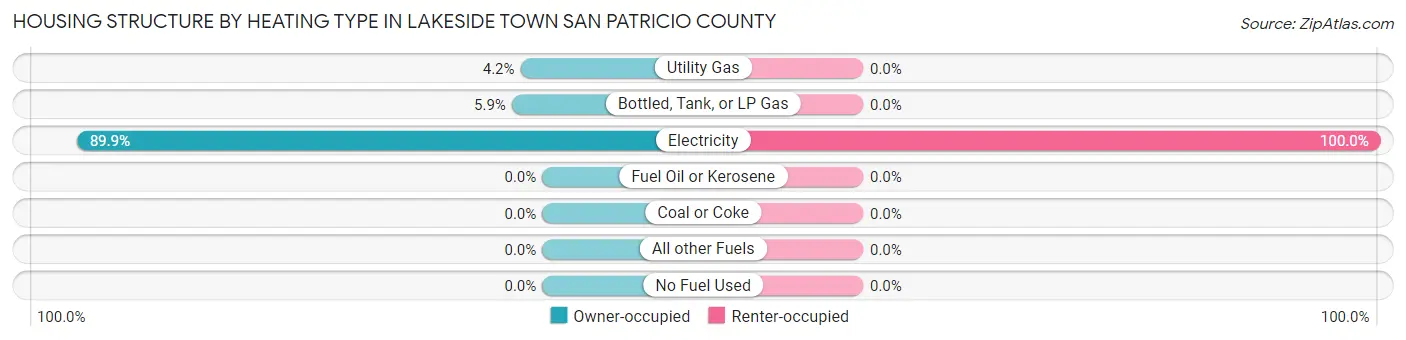
| Heating Type | Owner-occupied | Renter-occupied |
| Utility Gas | 5 (4.2%) | 0 (0.0%) |
| Bottled, Tank, or LP Gas | 7 (5.9%) | 0 (0.0%) |
| Electricity | 107 (89.9%) | 14 (100.0%) |
| Fuel Oil or Kerosene | 0 (0.0%) | 0 (0.0%) |
| Coal or Coke | 0 (0.0%) | 0 (0.0%) |
| All other Fuels | 0 (0.0%) | 0 (0.0%) |
| No Fuel Used | 0 (0.0%) | 0 (0.0%) |
| Total | 119 (100.0%) | 14 (100.0%) |
Household Vehicle Usage in Lakeside town San Patricio County
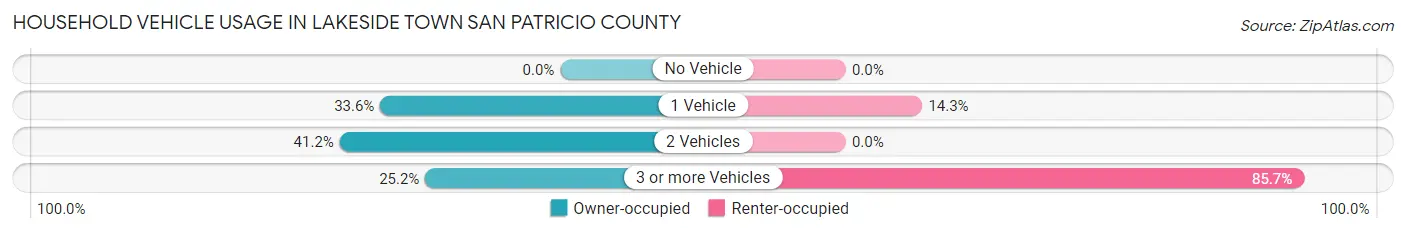
| Vehicles per Household | Owner-occupied | Renter-occupied |
| No Vehicle | 0 (0.0%) | 0 (0.0%) |
| 1 Vehicle | 40 (33.6%) | 2 (14.3%) |
| 2 Vehicles | 49 (41.2%) | 0 (0.0%) |
| 3 or more Vehicles | 30 (25.2%) | 12 (85.7%) |
| Total | 119 (100.0%) | 14 (100.0%) |
Real Estate & Mortgages in Lakeside town San Patricio County
Real Estate and Mortgage Overview in Lakeside town San Patricio County
| Characteristic | Without Mortgage | With Mortgage |
| Housing Units | 82 | 37 |
| Median Property Value | $120,800 | $256,300 |
| Median Household Income | $41,000 | $7 |
| Monthly Housing Costs | $458 | $0 |
| Real Estate Taxes | $1,153 | $3 |
Property Value by Mortgage Status in Lakeside town San Patricio County
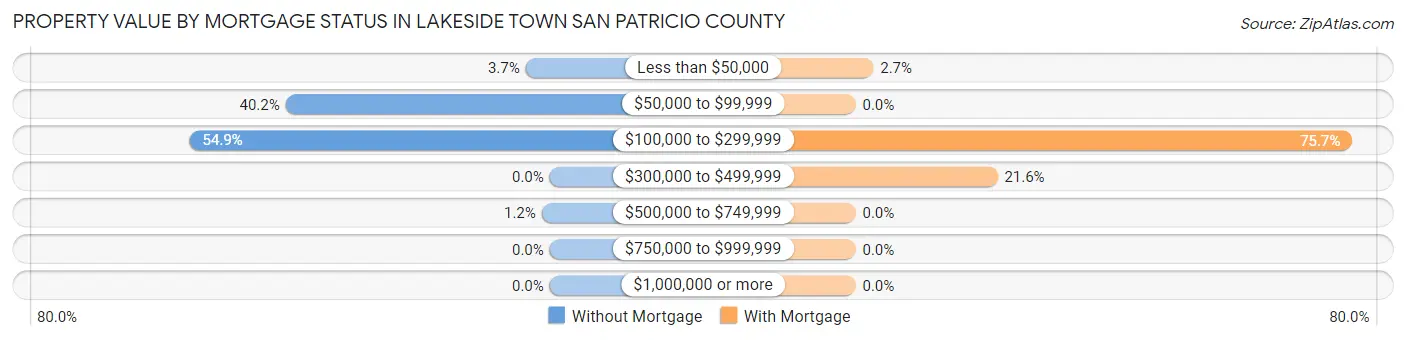
| Property Value | Without Mortgage | With Mortgage |
| Less than $50,000 | 3 (3.7%) | 1 (2.7%) |
| $50,000 to $99,999 | 33 (40.2%) | 0 (0.0%) |
| $100,000 to $299,999 | 45 (54.9%) | 28 (75.7%) |
| $300,000 to $499,999 | 0 (0.0%) | 8 (21.6%) |
| $500,000 to $749,999 | 1 (1.2%) | 0 (0.0%) |
| $750,000 to $999,999 | 0 (0.0%) | 0 (0.0%) |
| $1,000,000 or more | 0 (0.0%) | 0 (0.0%) |
| Total | 82 (100.0%) | 37 (100.0%) |
Household Income by Mortgage Status in Lakeside town San Patricio County
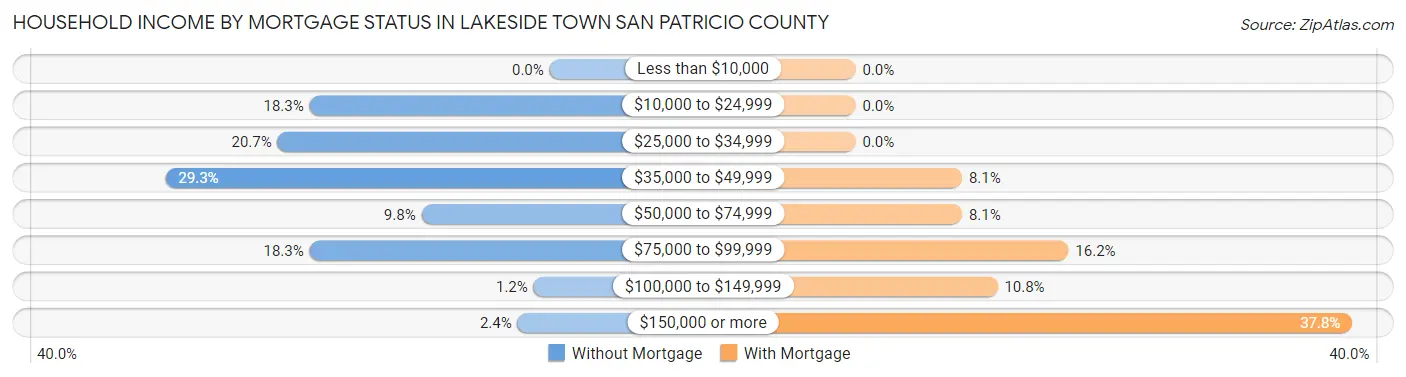
| Household Income | Without Mortgage | With Mortgage |
| Less than $10,000 | 0 (0.0%) | 0 (0.0%) |
| $10,000 to $24,999 | 15 (18.3%) | 0 (0.0%) |
| $25,000 to $34,999 | 17 (20.7%) | 0 (0.0%) |
| $35,000 to $49,999 | 24 (29.3%) | 3 (8.1%) |
| $50,000 to $74,999 | 8 (9.8%) | 3 (8.1%) |
| $75,000 to $99,999 | 15 (18.3%) | 6 (16.2%) |
| $100,000 to $149,999 | 1 (1.2%) | 4 (10.8%) |
| $150,000 or more | 2 (2.4%) | 14 (37.8%) |
| Total | 82 (100.0%) | 37 (100.0%) |
Property Value to Household Income Ratio in Lakeside town San Patricio County
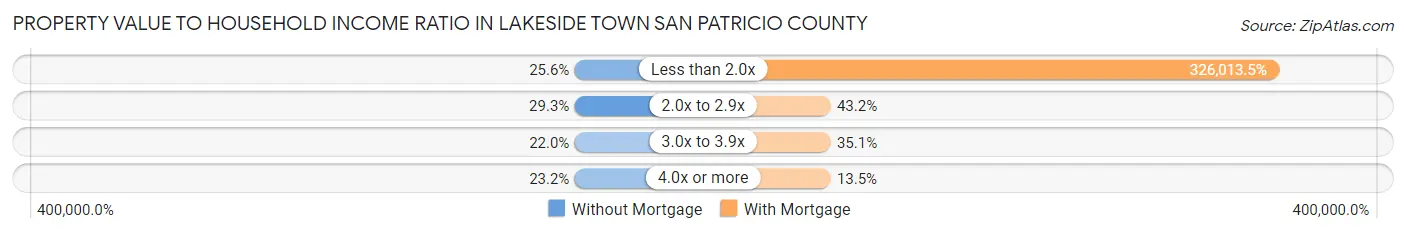
| Value-to-Income Ratio | Without Mortgage | With Mortgage |
| Less than 2.0x | 21 (25.6%) | 120,625 (326,013.5%) |
| 2.0x to 2.9x | 24 (29.3%) | 16 (43.2%) |
| 3.0x to 3.9x | 18 (22.0%) | 13 (35.1%) |
| 4.0x or more | 19 (23.2%) | 5 (13.5%) |
| Total | 82 (100.0%) | 37 (100.0%) |
Real Estate Taxes by Mortgage Status in Lakeside town San Patricio County
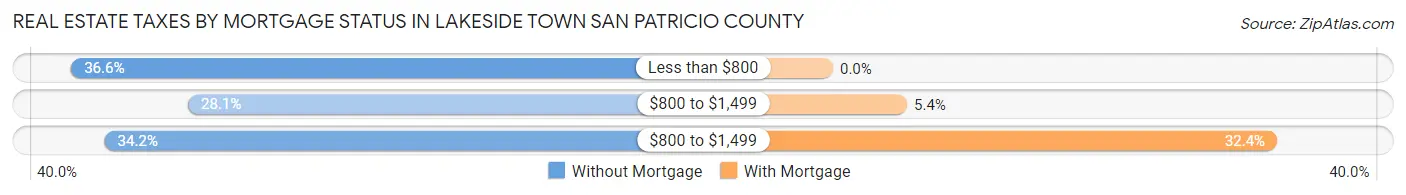
| Property Taxes | Without Mortgage | With Mortgage |
| Less than $800 | 30 (36.6%) | 0 (0.0%) |
| $800 to $1,499 | 23 (28.1%) | 2 (5.4%) |
| $800 to $1,499 | 28 (34.2%) | 12 (32.4%) |
| Total | 82 (100.0%) | 37 (100.0%) |
Health & Disability in Lakeside town San Patricio County
Health Insurance Coverage by Age in Lakeside town San Patricio County
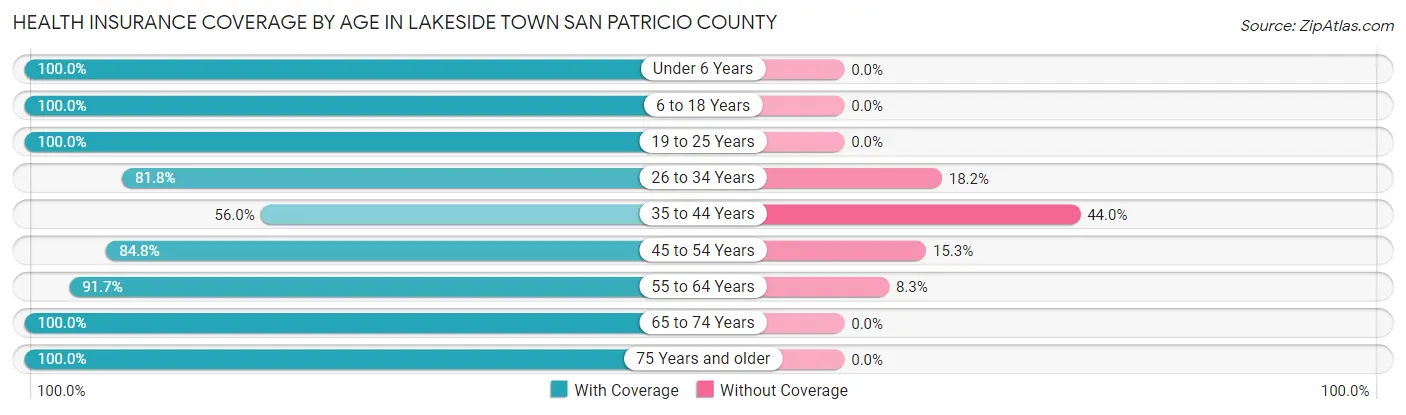
| Age Bracket | With Coverage | Without Coverage |
| Under 6 Years | 9 (100.0%) | 0 (0.0%) |
| 6 to 18 Years | 46 (100.0%) | 0 (0.0%) |
| 19 to 25 Years | 22 (100.0%) | 0 (0.0%) |
| 26 to 34 Years | 9 (81.8%) | 2 (18.2%) |
| 35 to 44 Years | 14 (56.0%) | 11 (44.0%) |
| 45 to 54 Years | 50 (84.8%) | 9 (15.2%) |
| 55 to 64 Years | 33 (91.7%) | 3 (8.3%) |
| 65 to 74 Years | 49 (100.0%) | 0 (0.0%) |
| 75 Years and older | 50 (100.0%) | 0 (0.0%) |
| Total | 282 (91.9%) | 25 (8.1%) |
Health Insurance Coverage by Citizenship Status in Lakeside town San Patricio County

| Citizenship Status | With Coverage | Without Coverage |
| Native Born | 9 (100.0%) | 0 (0.0%) |
| Foreign Born, Citizen | 46 (100.0%) | 0 (0.0%) |
| Foreign Born, not a Citizen | 22 (100.0%) | 0 (0.0%) |
Health Insurance Coverage by Household Income in Lakeside town San Patricio County
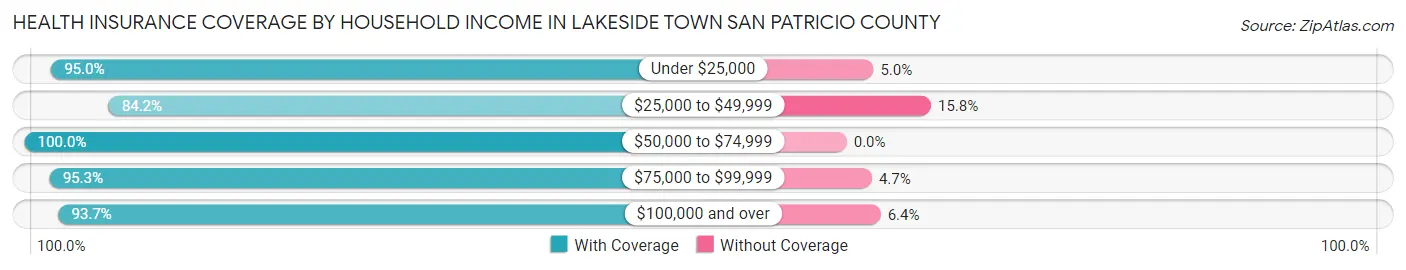
| Household Income | With Coverage | Without Coverage |
| Under $25,000 | 19 (95.0%) | 1 (5.0%) |
| $25,000 to $49,999 | 80 (84.2%) | 15 (15.8%) |
| $50,000 to $74,999 | 23 (100.0%) | 0 (0.0%) |
| $75,000 to $99,999 | 101 (95.3%) | 5 (4.7%) |
| $100,000 and over | 59 (93.6%) | 4 (6.4%) |
Public vs Private Health Insurance Coverage by Age in Lakeside town San Patricio County
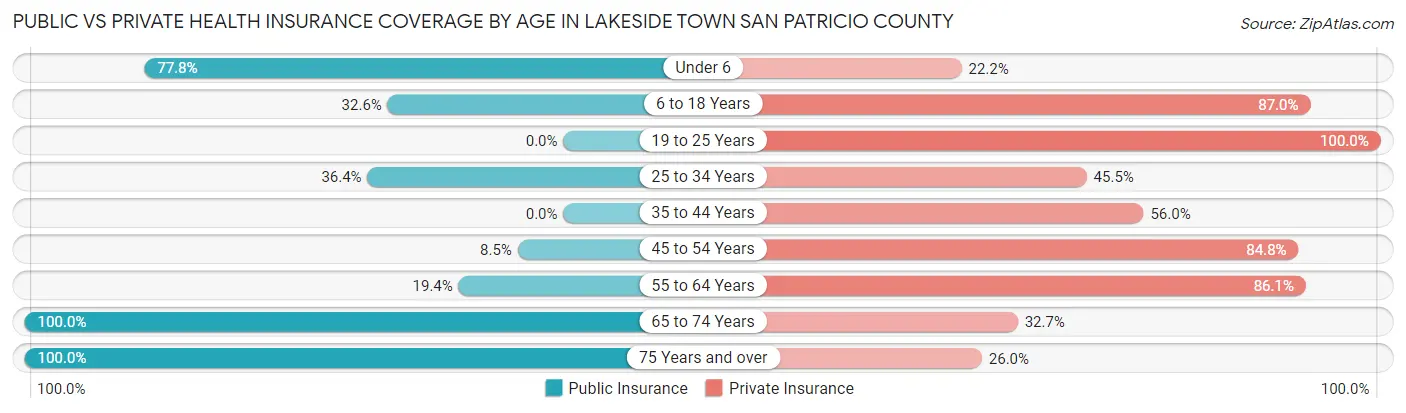
| Age Bracket | Public Insurance | Private Insurance |
| Under 6 | 7 (77.8%) | 2 (22.2%) |
| 6 to 18 Years | 15 (32.6%) | 40 (87.0%) |
| 19 to 25 Years | 0 (0.0%) | 22 (100.0%) |
| 25 to 34 Years | 4 (36.4%) | 5 (45.5%) |
| 35 to 44 Years | 0 (0.0%) | 14 (56.0%) |
| 45 to 54 Years | 5 (8.5%) | 50 (84.8%) |
| 55 to 64 Years | 7 (19.4%) | 31 (86.1%) |
| 65 to 74 Years | 49 (100.0%) | 16 (32.7%) |
| 75 Years and over | 50 (100.0%) | 13 (26.0%) |
| Total | 137 (44.6%) | 193 (62.9%) |
Disability Status by Sex by Age in Lakeside town San Patricio County
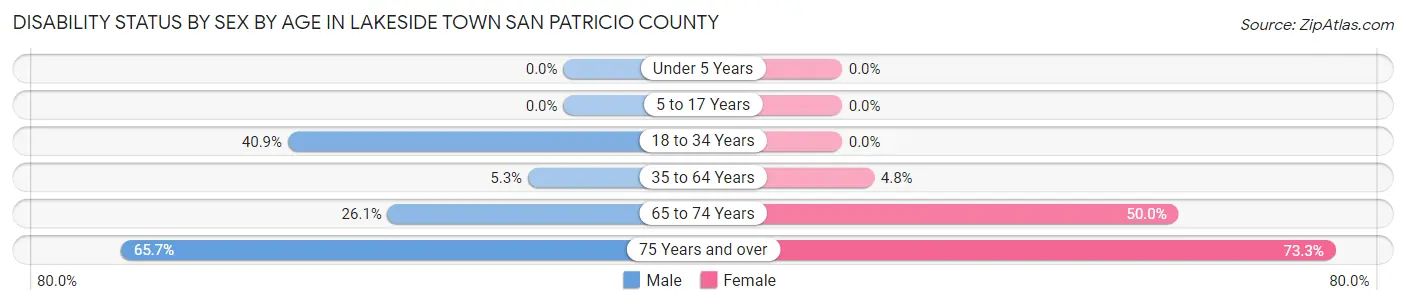
| Age Bracket | Male | Female |
| Under 5 Years | 0 (0.0%) | 0 (0.0%) |
| 5 to 17 Years | 0 (0.0%) | 0 (0.0%) |
| 18 to 34 Years | 9 (40.9%) | 0 (0.0%) |
| 35 to 64 Years | 3 (5.3%) | 3 (4.8%) |
| 65 to 74 Years | 6 (26.1%) | 13 (50.0%) |
| 75 Years and over | 23 (65.7%) | 11 (73.3%) |
Disability Class by Sex by Age in Lakeside town San Patricio County
Disability Class: Hearing Difficulty
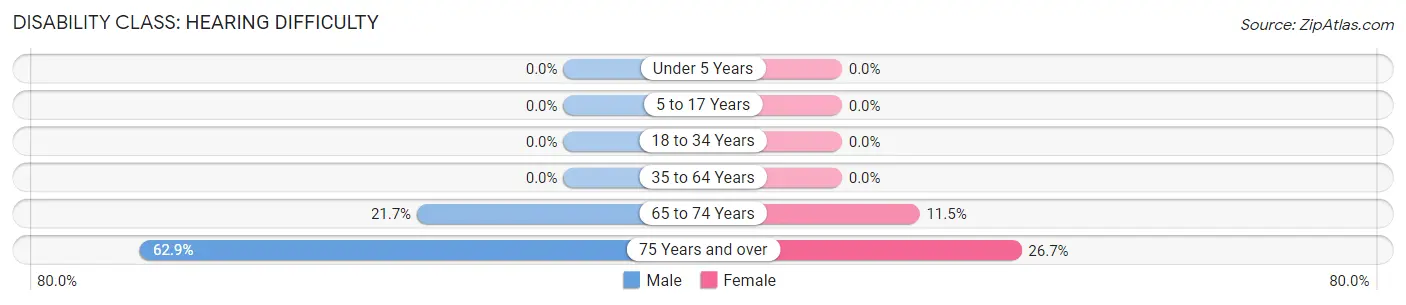
| Age Bracket | Male | Female |
| Under 5 Years | 0 (0.0%) | 0 (0.0%) |
| 5 to 17 Years | 0 (0.0%) | 0 (0.0%) |
| 18 to 34 Years | 0 (0.0%) | 0 (0.0%) |
| 35 to 64 Years | 0 (0.0%) | 0 (0.0%) |
| 65 to 74 Years | 5 (21.7%) | 3 (11.5%) |
| 75 Years and over | 22 (62.9%) | 4 (26.7%) |
Disability Class: Vision Difficulty
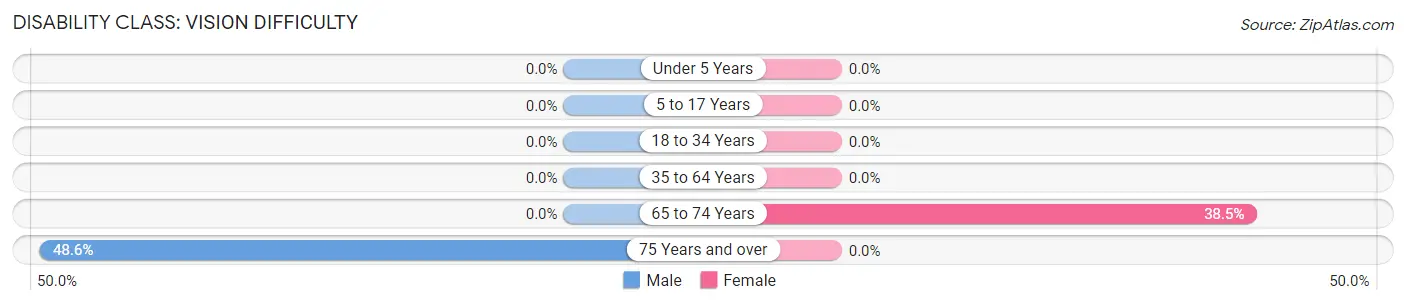
| Age Bracket | Male | Female |
| Under 5 Years | 0 (0.0%) | 0 (0.0%) |
| 5 to 17 Years | 0 (0.0%) | 0 (0.0%) |
| 18 to 34 Years | 0 (0.0%) | 0 (0.0%) |
| 35 to 64 Years | 0 (0.0%) | 0 (0.0%) |
| 65 to 74 Years | 0 (0.0%) | 10 (38.5%) |
| 75 Years and over | 17 (48.6%) | 0 (0.0%) |
Disability Class: Cognitive Difficulty
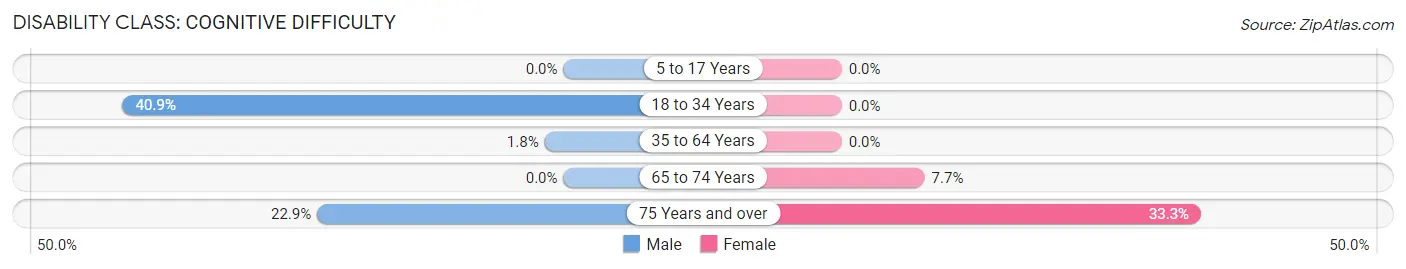
| Age Bracket | Male | Female |
| 5 to 17 Years | 0 (0.0%) | 0 (0.0%) |
| 18 to 34 Years | 9 (40.9%) | 0 (0.0%) |
| 35 to 64 Years | 1 (1.8%) | 0 (0.0%) |
| 65 to 74 Years | 0 (0.0%) | 2 (7.7%) |
| 75 Years and over | 8 (22.9%) | 5 (33.3%) |
Disability Class: Ambulatory Difficulty
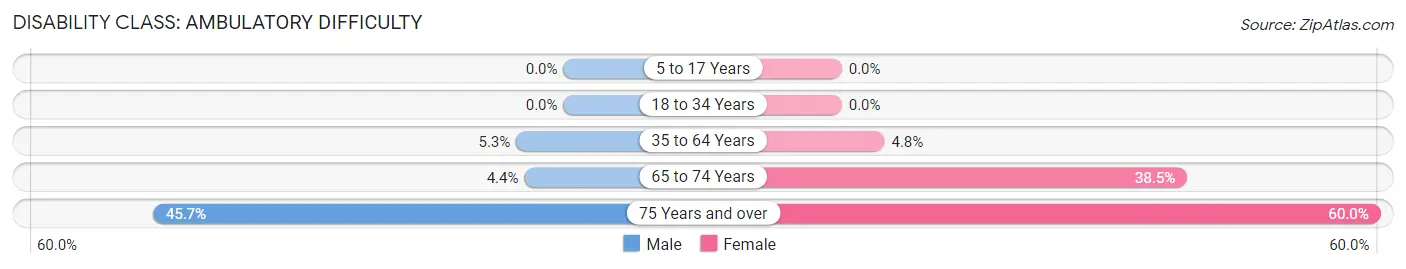
| Age Bracket | Male | Female |
| 5 to 17 Years | 0 (0.0%) | 0 (0.0%) |
| 18 to 34 Years | 0 (0.0%) | 0 (0.0%) |
| 35 to 64 Years | 3 (5.3%) | 3 (4.8%) |
| 65 to 74 Years | 1 (4.3%) | 10 (38.5%) |
| 75 Years and over | 16 (45.7%) | 9 (60.0%) |
Disability Class: Self-Care Difficulty

| Age Bracket | Male | Female |
| 5 to 17 Years | 0 (0.0%) | 0 (0.0%) |
| 18 to 34 Years | 0 (0.0%) | 0 (0.0%) |
| 35 to 64 Years | 1 (1.8%) | 3 (4.8%) |
| 65 to 74 Years | 0 (0.0%) | 0 (0.0%) |
| 75 Years and over | 3 (8.6%) | 7 (46.7%) |
Technology Access in Lakeside town San Patricio County
Computing Device Access in Lakeside town San Patricio County
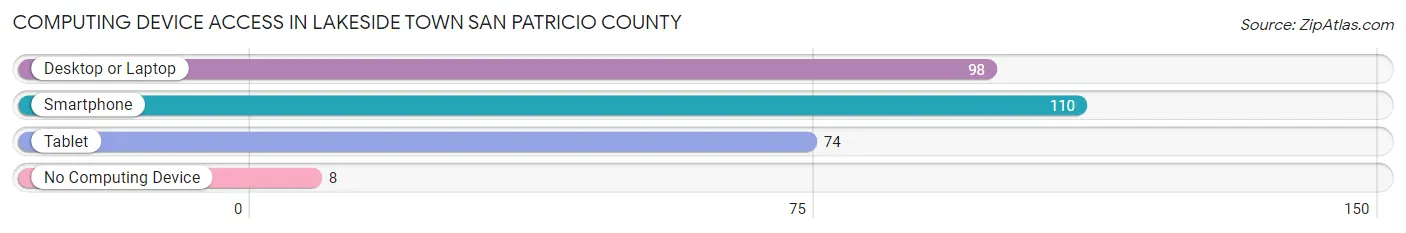
| Device Type | # Households | % Households |
| Desktop or Laptop | 98 | 73.7% |
| Smartphone | 110 | 82.7% |
| Tablet | 74 | 55.6% |
| No Computing Device | 8 | 6.0% |
| Total | 133 | 100.0% |
Internet Access in Lakeside town San Patricio County
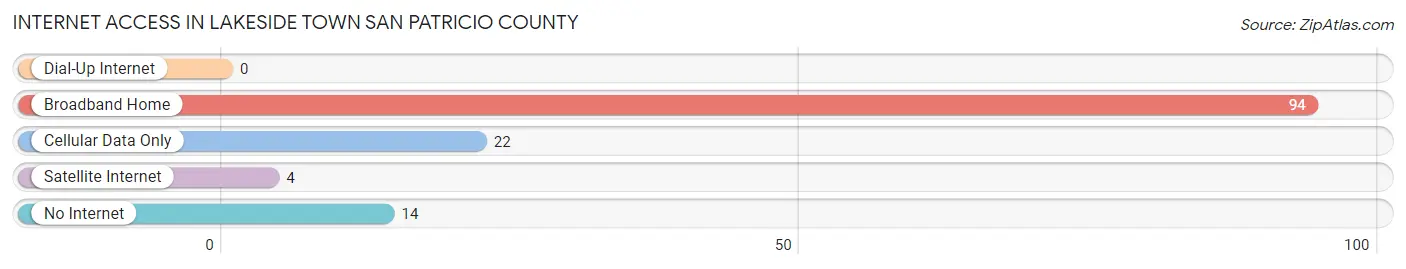
| Internet Type | # Households | % Households |
| Dial-Up Internet | 0 | 0.0% |
| Broadband Home | 94 | 70.7% |
| Cellular Data Only | 22 | 16.5% |
| Satellite Internet | 4 | 3.0% |
| No Internet | 14 | 10.5% |
| Total | 133 | 100.0% |
Lakeside town San Patricio County Summary
Lakeside Town is a small town located in San Patricio County, Texas. It is situated on the western shore of Lake Corpus Christi, about 25 miles south of Corpus Christi. The town has a population of approximately 1,500 people and is a popular destination for fishing, boating, and other outdoor activities.
History
Lakeside Town was founded in the late 1800s by a group of settlers from the nearby town of Refugio. The settlers were looking for a place to settle and start a new life, and they found the perfect spot on the shores of Lake Corpus Christi. The town was originally called “Lakeside”, but the name was changed to “Lakeside Town” in the early 1900s.
The town grew slowly but steadily over the years, and by the mid-1900s it had become a popular destination for fishing and other outdoor activities. In the late 1970s, the town was incorporated and the population began to grow rapidly. Today, Lakeside Town is a thriving community with a population of approximately 1,500 people.
Geography
Lakeside Town is located in San Patricio County, Texas, on the western shore of Lake Corpus Christi. The town is situated on a peninsula, with the lake to the east and the Nueces River to the west. The town is surrounded by lush green hills and is home to a variety of wildlife, including deer, wild turkeys, and various species of birds.
The climate in Lakeside Town is generally mild, with temperatures ranging from the mid-50s in the winter to the mid-90s in the summer. The town receives an average of 35 inches of rain per year, and the area is known for its mild winters and hot summers.
Economy
The economy of Lakeside Town is largely based on tourism and fishing. The town is a popular destination for fishing, boating, and other outdoor activities, and it is home to several marinas and boat ramps. The town also has a number of restaurants, bars, and other businesses that cater to tourists and locals alike.
In addition to tourism and fishing, Lakeside Town is also home to a number of small businesses, including a grocery store, a hardware store, and a few other retail stores. The town also has a few manufacturing plants, including a plant that produces plastic products.
Demographics
As of the 2010 census, the population of Lakeside Town was 1,500. The town is predominantly white, with approximately 75% of the population identifying as white. The remaining 25% of the population is made up of African Americans, Hispanics, and other ethnicities.
The median household income in Lakeside Town is $37,000, and the median home value is $90,000. The town has a low unemployment rate, and the majority of the population is employed in the tourism and fishing industries.
Conclusion
Lakeside Town is a small town located in San Patricio County, Texas. It is situated on the western shore of Lake Corpus Christi, and it is a popular destination for fishing, boating, and other outdoor activities. The town has a population of approximately 1,500 people, and the economy is largely based on tourism and fishing. The town is predominantly white, with a median household income of $37,000 and a median home value of $90,000. Lakeside Town is a thriving community with a variety of businesses and activities for locals and visitors alike.
Common Questions
What is the Total Population of Lakeside town San Patricio County?
Total Population of Lakeside town San Patricio County is 310.
What is the Total Male Population of Lakeside town San Patricio County?
Total Male Population of Lakeside town San Patricio County is 160.
What is the Total Female Population of Lakeside town San Patricio County?
Total Female Population of Lakeside town San Patricio County is 150.
What is the Ratio of Males per 100 Females in Lakeside town San Patricio County?
There are 106.67 Males per 100 Females in Lakeside town San Patricio County.
What is the Ratio of Females per 100 Males in Lakeside town San Patricio County?
There are 93.75 Females per 100 Males in Lakeside town San Patricio County.
What is the Median Population Age in Lakeside town San Patricio County?
Median Population Age in Lakeside town San Patricio County is 50.7 Years.
What is the Average Family Size in Lakeside town San Patricio County
Average Family Size in Lakeside town San Patricio County is 2.8 People.
What is the Average Household Size in Lakeside town San Patricio County
Average Household Size in Lakeside town San Patricio County is 2.3 People.
What is Per Capita Income in Lakeside town San Patricio County?
Per Capita income in Lakeside town San Patricio County is $28,864.
What is the Median Family Income in Lakeside town San Patricio County?
Median Family Income in Lakeside town San Patricio County is $68,750.
What is the Median Household income in Lakeside town San Patricio County?
Median Household Income in Lakeside town San Patricio County is $51,875.
What is Income or Wage Gap in Lakeside town San Patricio County?
Income or Wage Gap in Lakeside town San Patricio County is 38.0%.
Women in Lakeside town San Patricio County earn 62.0 cents for every dollar earned by a man.
What is Inequality or Gini Index in Lakeside town San Patricio County?
Inequality or Gini Index in Lakeside town San Patricio County is 0.38.
How Large is the Labor Force in Lakeside town San Patricio County?
There are 138 People in the Labor Forcein in Lakeside town San Patricio County.
What is the Percentage of People in the Labor Force in Lakeside town San Patricio County?
48.9% of People are in the Labor Force in Lakeside town San Patricio County.