Todd Mission, TX
Todd Mission Map
Todd Mission Overview
133
TOTAL POPULATION
74
MALE POPULATION
59
FEMALE POPULATION
125.42
MALES / 100 FEMALES
79.73
FEMALES / 100 MALES
39.0
MEDIAN AGE
4.3
AVG FAMILY SIZE
3.4
AVG HOUSEHOLD SIZE
$50,850
PER CAPITA INCOME
$135,804
AVG HOUSEHOLD INCOME
0.40
INEQUALITY / GINI INDEX
81
LABOR FORCE [ PEOPLE ]
78.6%
PERCENT IN LABOR FORCE
Todd Mission Area Codes
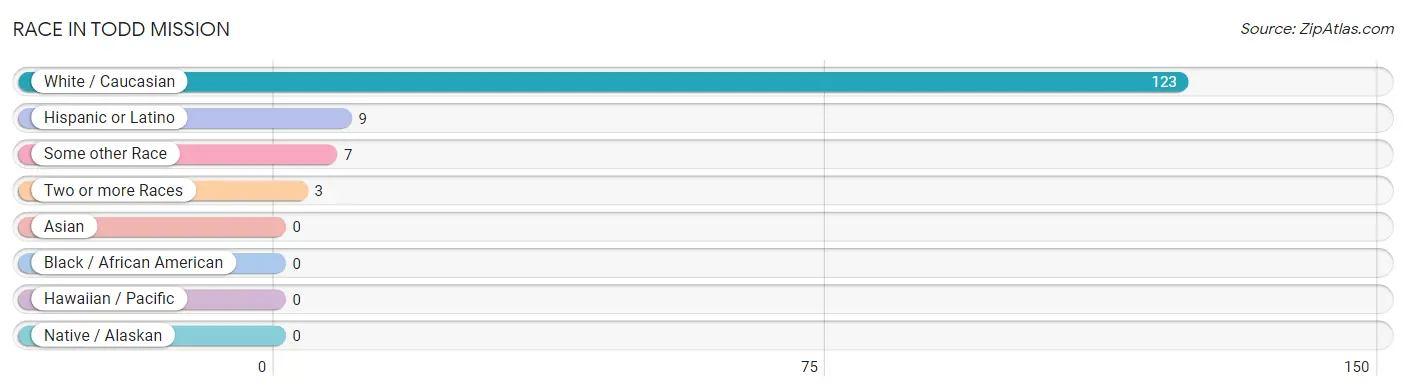
Race in Todd Mission
The most populous races in Todd Mission are White / Caucasian (123 | 92.5%), Hispanic or Latino (9 | 6.8%), and Some other Race (7 | 5.3%).
| Race | # Population | % Population |
| Asian | 0 | 0.0% |
| Black / African American | 0 | 0.0% |
| Hawaiian / Pacific | 0 | 0.0% |
| Hispanic or Latino | 9 | 6.8% |
| Native / Alaskan | 0 | 0.0% |
| White / Caucasian | 123 | 92.5% |
| Two or more Races | 3 | 2.3% |
| Some other Race | 7 | 5.3% |
| Total | 133 | 100.0% |
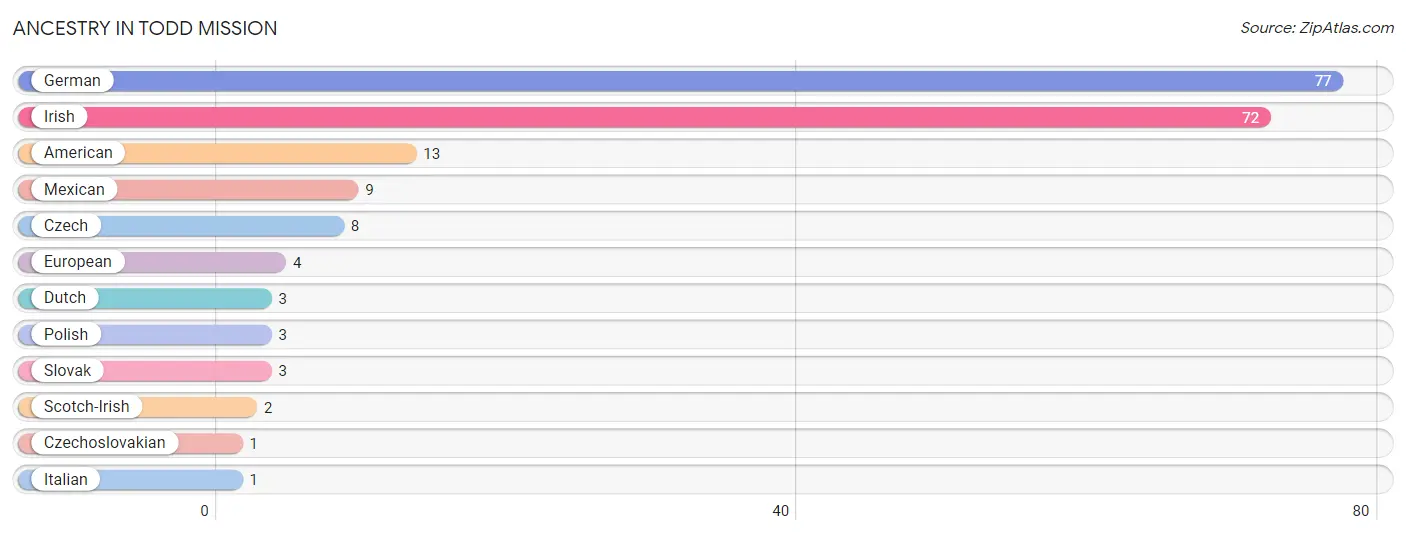
Ancestry in Todd Mission
The most populous ancestries reported in Todd Mission are German (77 | 57.9%), Irish (72 | 54.1%), American (13 | 9.8%), Mexican (9 | 6.8%), and Czech (8 | 6.0%), together accounting for 134.6% of all Todd Mission residents.
| Ancestry | # Population | % Population |
| American | 13 | 9.8% |
| Czech | 8 | 6.0% |
| Czechoslovakian | 1 | 0.7% |
| Dutch | 3 | 2.3% |
| European | 4 | 3.0% |
| German | 77 | 57.9% |
| Irish | 72 | 54.1% |
| Italian | 1 | 0.7% |
| Mexican | 9 | 6.8% |
| Polish | 3 | 2.3% |
| Scotch-Irish | 2 | 1.5% |
| Slovak | 3 | 2.3% | View All 12 Rows |
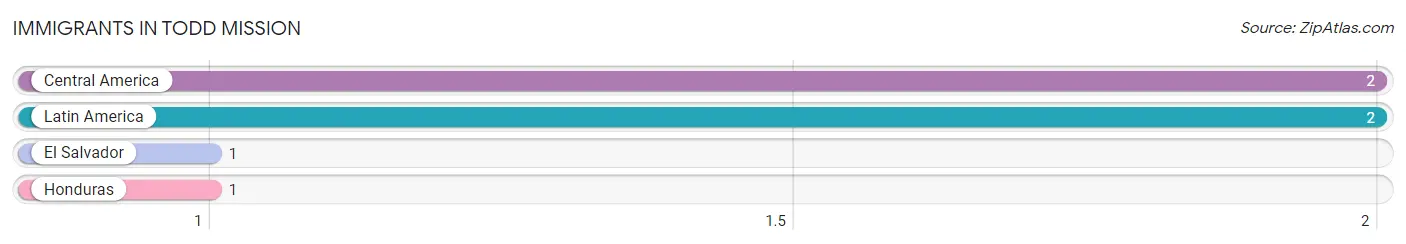
Immigrants in Todd Mission
The most numerous immigrant groups reported in Todd Mission came from Central America (2 | 1.5%), Latin America (2 | 1.5%), El Salvador (1 | 0.7%), and Honduras (1 | 0.7%), together accounting for 4.5% of all Todd Mission residents.
| Immigration Origin | # Population | % Population |
| Central America | 2 | 1.5% |
| El Salvador | 1 | 0.7% |
| Honduras | 1 | 0.7% |
| Latin America | 2 | 1.5% | View All 4 Rows |
Sex and Age in Todd Mission
Sex and Age in Todd Mission
The most populous age groups in Todd Mission are Under 5 Years (28 | 37.8%) for men and 35 to 39 Years (31 | 52.5%) for women.
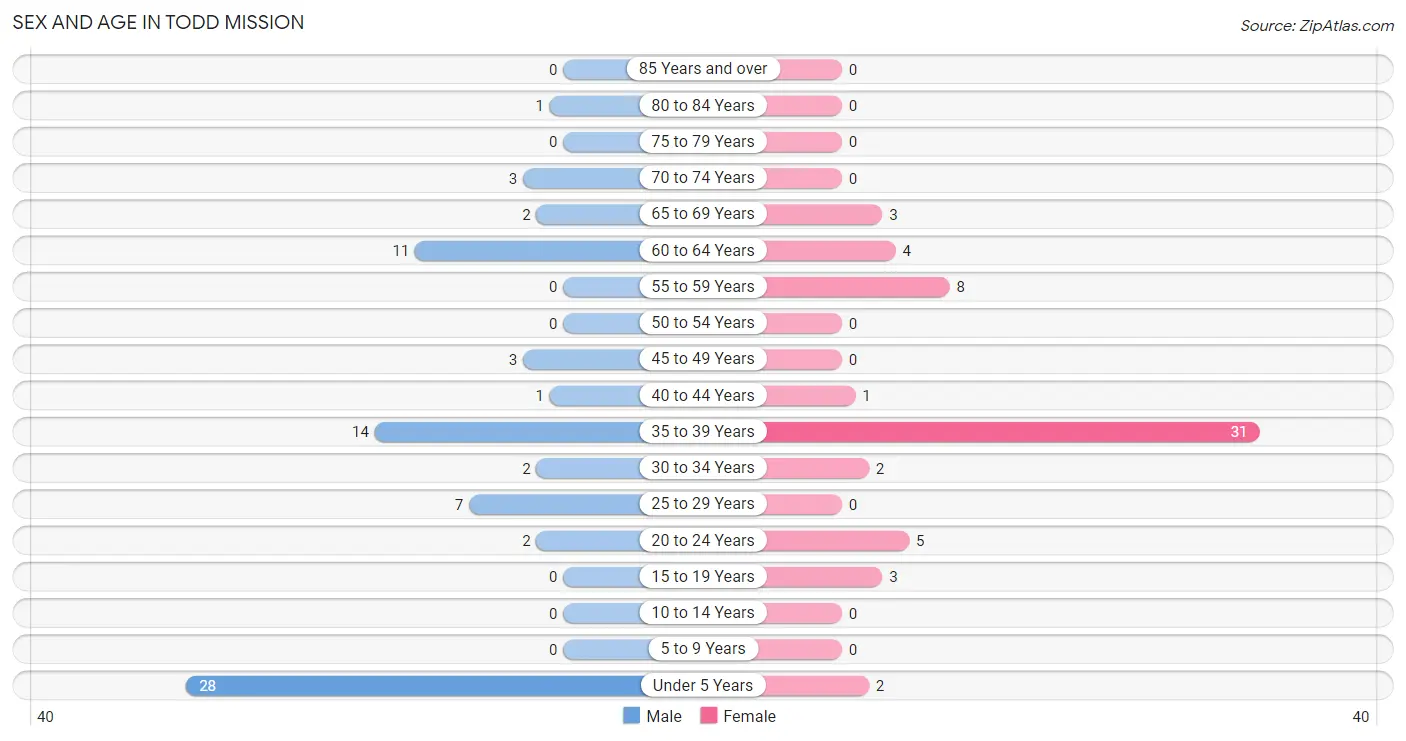
| Age Bracket | Male | Female |
| Under 5 Years | 28 (37.8%) | 2 (3.4%) |
| 5 to 9 Years | 0 (0.0%) | 0 (0.0%) |
| 10 to 14 Years | 0 (0.0%) | 0 (0.0%) |
| 15 to 19 Years | 0 (0.0%) | 3 (5.1%) |
| 20 to 24 Years | 2 (2.7%) | 5 (8.5%) |
| 25 to 29 Years | 7 (9.5%) | 0 (0.0%) |
| 30 to 34 Years | 2 (2.7%) | 2 (3.4%) |
| 35 to 39 Years | 14 (18.9%) | 31 (52.5%) |
| 40 to 44 Years | 1 (1.3%) | 1 (1.7%) |
| 45 to 49 Years | 3 (4.1%) | 0 (0.0%) |
| 50 to 54 Years | 0 (0.0%) | 0 (0.0%) |
| 55 to 59 Years | 0 (0.0%) | 8 (13.6%) |
| 60 to 64 Years | 11 (14.9%) | 4 (6.8%) |
| 65 to 69 Years | 2 (2.7%) | 3 (5.1%) |
| 70 to 74 Years | 3 (4.1%) | 0 (0.0%) |
| 75 to 79 Years | 0 (0.0%) | 0 (0.0%) |
| 80 to 84 Years | 1 (1.3%) | 0 (0.0%) |
| 85 Years and over | 0 (0.0%) | 0 (0.0%) |
| Total | 74 (100.0%) | 59 (100.0%) |
Families and Households in Todd Mission
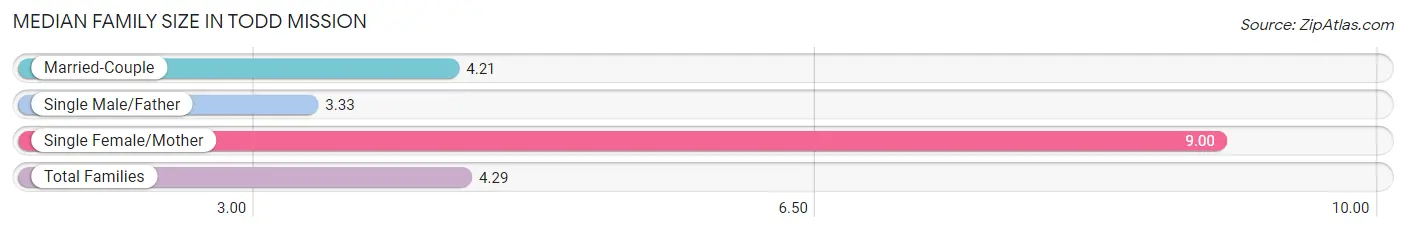
Median Family Size in Todd Mission
The median family size in Todd Mission is 4.29 persons per family, with single female/mother families (1 | 3.6%) accounting for the largest median family size of 9 persons per family. On the other hand, single male/father families (3 | 10.7%) represent the smallest median family size with 3.33 persons per family.
| Family Type | # Families | Family Size |
| Married-Couple | 24 (85.7%) | 4.21 |
| Single Male/Father | 3 (10.7%) | 3.33 |
| Single Female/Mother | 1 (3.6%) | 9.00 |
| Total Families | 28 (100.0%) | 4.29 |
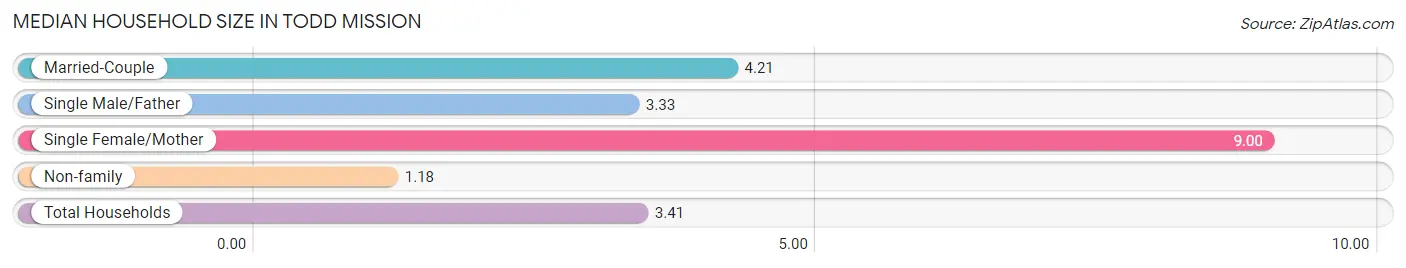
Median Household Size in Todd Mission
The median household size in Todd Mission is 3.41 persons per household, with single female/mother households (1 | 2.6%) accounting for the largest median household size of 9 persons per household. non-family households (11 | 28.2%) represent the smallest median household size with 1.18 persons per household.
| Household Type | # Households | Household Size |
| Married-Couple | 24 (61.5%) | 4.21 |
| Single Male/Father | 3 (7.7%) | 3.33 |
| Single Female/Mother | 1 (2.6%) | 9.00 |
| Non-family | 11 (28.2%) | 1.18 |
| Total Households | 39 (100.0%) | 3.41 |
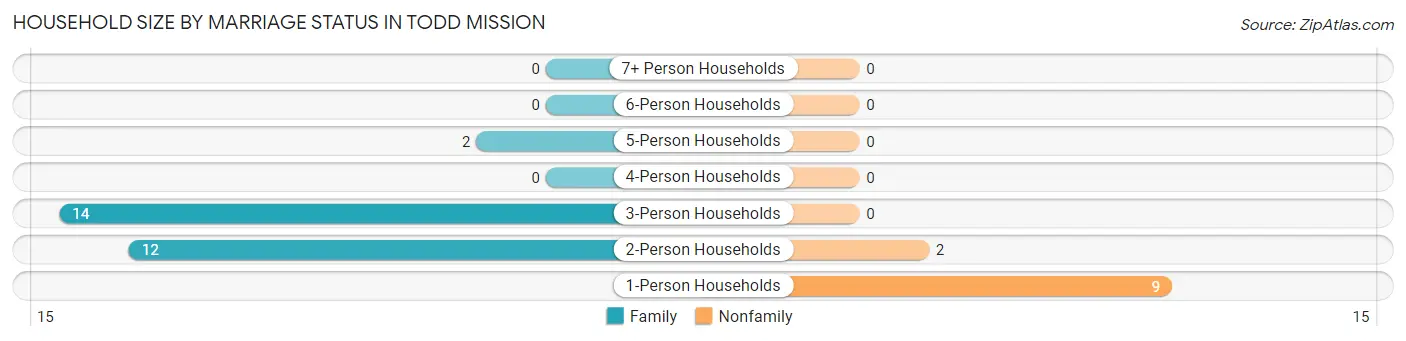
Household Size by Marriage Status in Todd Mission
Out of a total of 39 households in Todd Mission, 28 (71.8%) are family households, while 11 (28.2%) are nonfamily households. The most numerous type of family households are 3-person households, comprising 14, and the most common type of nonfamily households are 1-person households, comprising 9.
| Household Size | Family Households | Nonfamily Households |
| 1-Person Households | - | 9 (23.1%) |
| 2-Person Households | 12 (30.8%) | 2 (5.1%) |
| 3-Person Households | 14 (35.9%) | 0 (0.0%) |
| 4-Person Households | 0 (0.0%) | 0 (0.0%) |
| 5-Person Households | 2 (5.1%) | 0 (0.0%) |
| 6-Person Households | 0 (0.0%) | 0 (0.0%) |
| 7+ Person Households | 0 (0.0%) | 0 (0.0%) |
| Total | 28 (71.8%) | 11 (28.2%) |
Female Fertility in Todd Mission
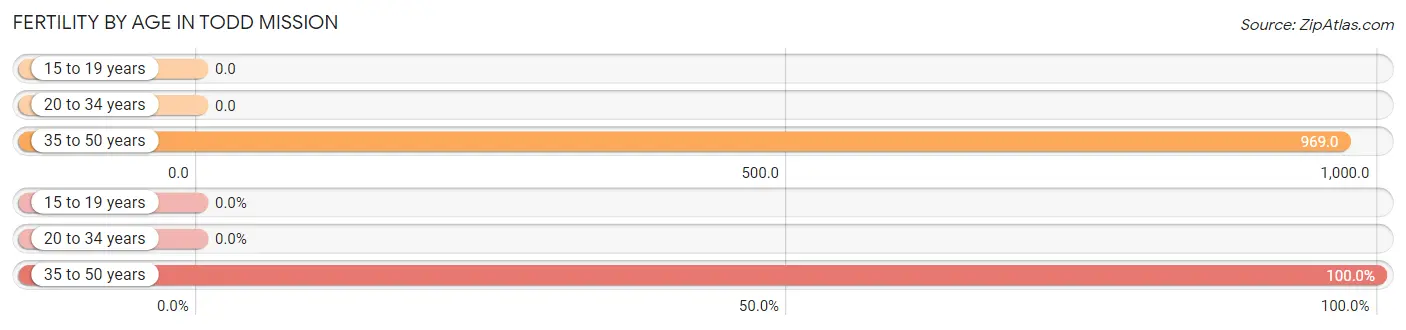
Fertility by Age in Todd Mission
Average fertility rate in Todd Mission is 738.0 births per 1,000 women. Women in the age bracket of 35 to 50 years have the highest fertility rate with 969.0 births per 1,000 women. Women in the age bracket of 35 to 50 years acount for 100.0% of all women with births.
| Age Bracket | Women with Births | Births / 1,000 Women |
| 15 to 19 years | 0 (0.0%) | 0.0 |
| 20 to 34 years | 0 (0.0%) | 0.0 |
| 35 to 50 years | 31 (100.0%) | 969.0 |
| Total | 31 (100.0%) | 738.0 |
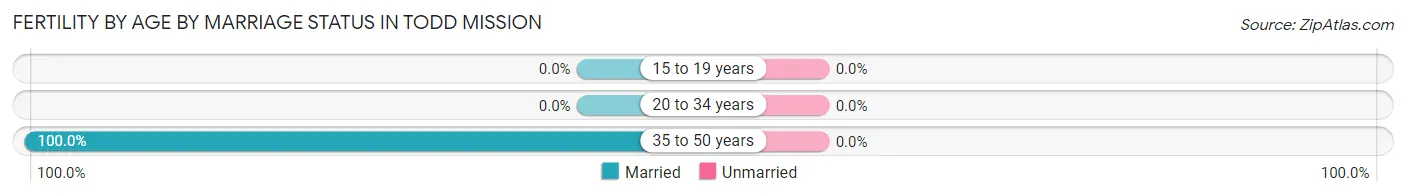
Fertility by Age by Marriage Status in Todd Mission
| Age Bracket | Married | Unmarried |
| 15 to 19 years | 0 (0.0%) | 0 (0.0%) |
| 20 to 34 years | 0 (0.0%) | 0 (0.0%) |
| 35 to 50 years | 31 (100.0%) | 0 (0.0%) |
| Total | 31 (100.0%) | 0 (0.0%) |
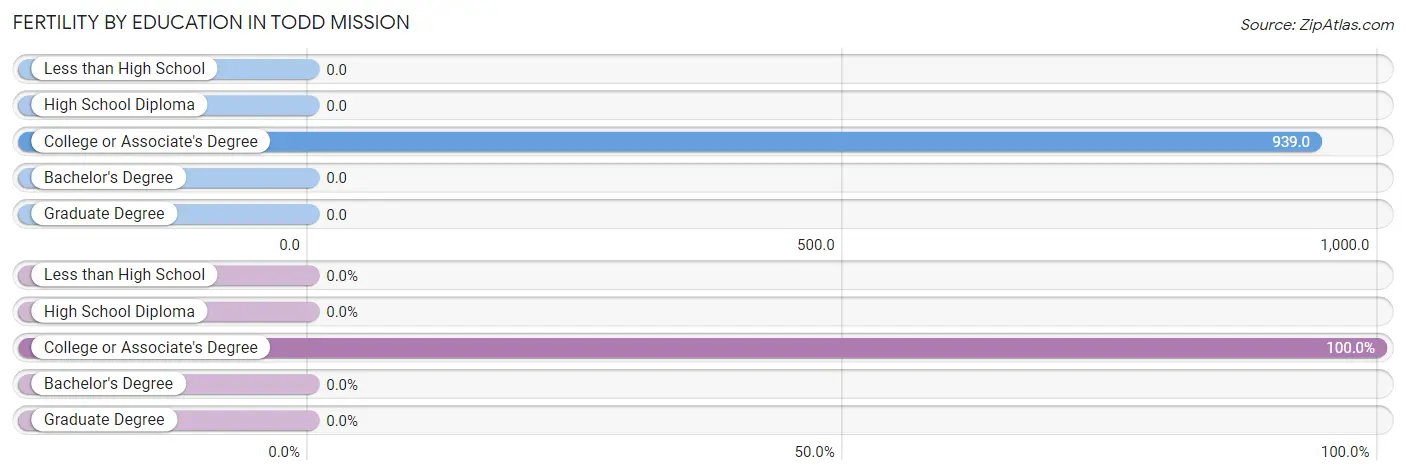
Fertility by Education in Todd Mission
| Educational Attainment | Women with Births | Births / 1,000 Women |
| Less than High School | 0 (0.0%) | 0.0 |
| High School Diploma | 0 (0.0%) | 0.0 |
| College or Associate's Degree | 31 (100.0%) | 939.0 |
| Bachelor's Degree | 0 (0.0%) | 0.0 |
| Graduate Degree | 0 (0.0%) | 0.0 |
| Total | 31 (100.0%) | 738.0 |
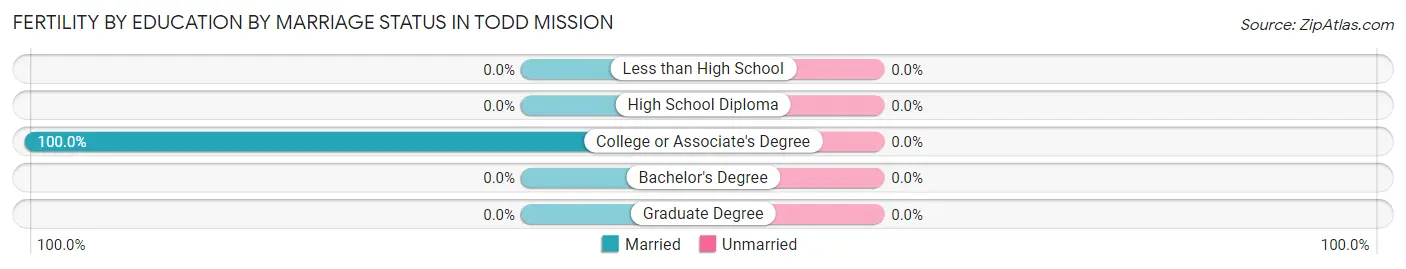
Fertility by Education by Marriage Status in Todd Mission
| Educational Attainment | Married | Unmarried |
| Less than High School | 0 (0.0%) | 0 (0.0%) |
| High School Diploma | 0 (0.0%) | 0 (0.0%) |
| College or Associate's Degree | 31 (100.0%) | 0 (0.0%) |
| Bachelor's Degree | 0 (0.0%) | 0 (0.0%) |
| Graduate Degree | 0 (0.0%) | 0 (0.0%) |
| Total | 31 (100.0%) | 0 (0.0%) |
Income in Todd Mission
Income Overview in Todd Mission
| Characteristic | Number | Measure |
| Per Capita Income | 133 | $50,850 |
| Median Family Income | 28 | $0 |
| Mean Family Income | 28 | $183,479 |
| Median Household Income | 39 | $135,804 |
| Mean Household Income | 39 | $145,508 |
| Income Deficit | 28 | $0 |
| Wage / Income Gap (%) | 133 | 0.00% |
| Wage / Income Gap ($) | 133 | 100.00¢ per $1 |
| Gini / Inequality Index | 133 | 0.40 |
Earnings by Sex in Todd Mission
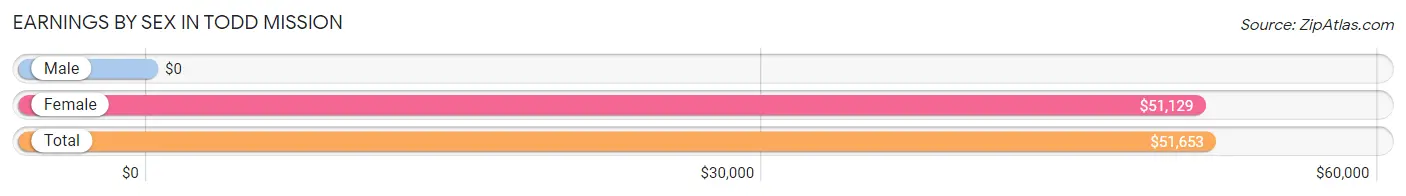
| Sex | Number | Average Earnings |
| Male | 33 (39.8%) | $0 |
| Female | 50 (60.2%) | $51,129 |
| Total | 83 (100.0%) | $51,653 |
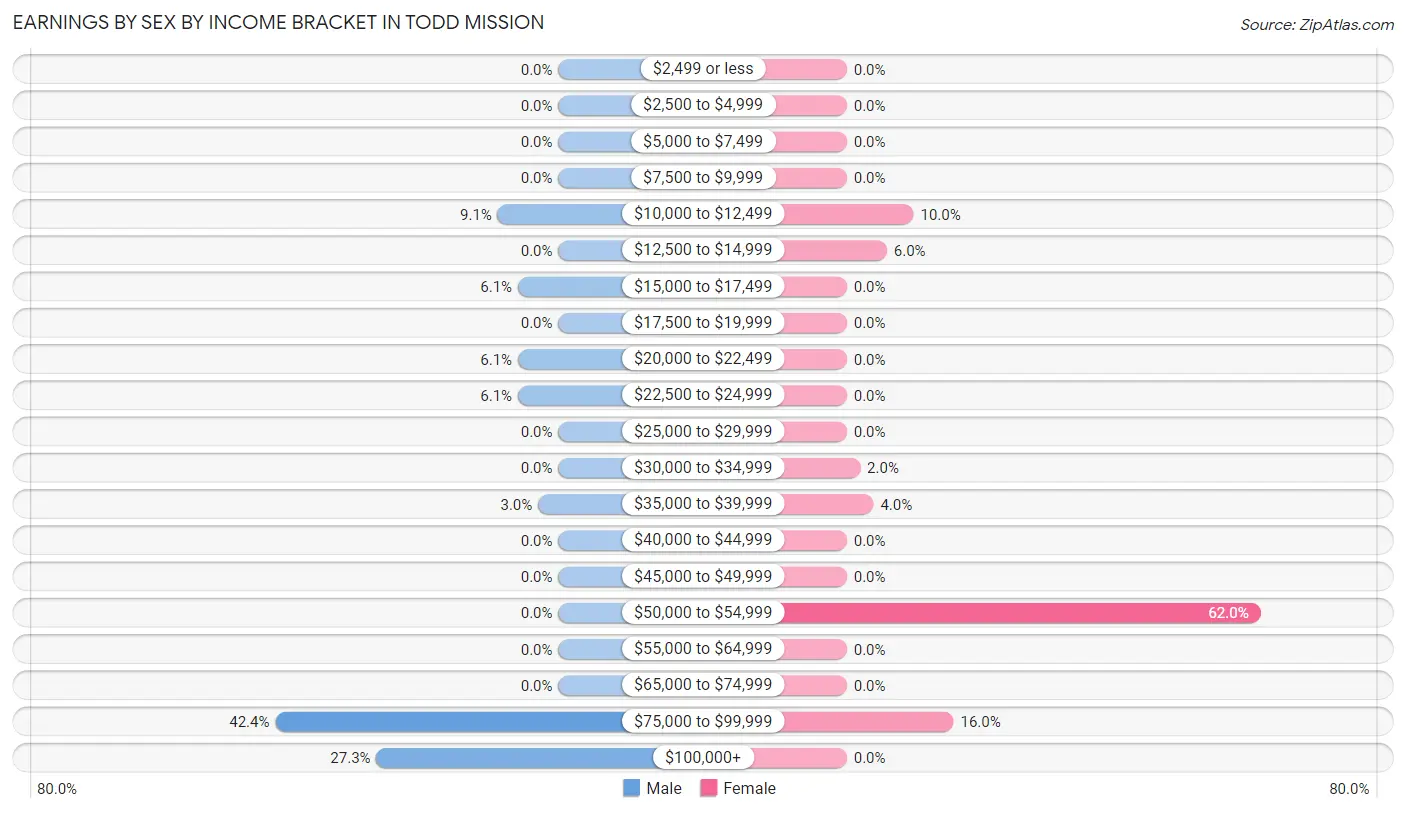
Earnings by Sex by Income Bracket in Todd Mission
The most common earnings brackets in Todd Mission are $75,000 to $99,999 for men (14 | 42.4%) and $50,000 to $54,999 for women (31 | 62.0%).
| Income | Male | Female |
| $2,499 or less | 0 (0.0%) | 0 (0.0%) |
| $2,500 to $4,999 | 0 (0.0%) | 0 (0.0%) |
| $5,000 to $7,499 | 0 (0.0%) | 0 (0.0%) |
| $7,500 to $9,999 | 0 (0.0%) | 0 (0.0%) |
| $10,000 to $12,499 | 3 (9.1%) | 5 (10.0%) |
| $12,500 to $14,999 | 0 (0.0%) | 3 (6.0%) |
| $15,000 to $17,499 | 2 (6.1%) | 0 (0.0%) |
| $17,500 to $19,999 | 0 (0.0%) | 0 (0.0%) |
| $20,000 to $22,499 | 2 (6.1%) | 0 (0.0%) |
| $22,500 to $24,999 | 2 (6.1%) | 0 (0.0%) |
| $25,000 to $29,999 | 0 (0.0%) | 0 (0.0%) |
| $30,000 to $34,999 | 0 (0.0%) | 1 (2.0%) |
| $35,000 to $39,999 | 1 (3.0%) | 2 (4.0%) |
| $40,000 to $44,999 | 0 (0.0%) | 0 (0.0%) |
| $45,000 to $49,999 | 0 (0.0%) | 0 (0.0%) |
| $50,000 to $54,999 | 0 (0.0%) | 31 (62.0%) |
| $55,000 to $64,999 | 0 (0.0%) | 0 (0.0%) |
| $65,000 to $74,999 | 0 (0.0%) | 0 (0.0%) |
| $75,000 to $99,999 | 14 (42.4%) | 8 (16.0%) |
| $100,000+ | 9 (27.3%) | 0 (0.0%) |
| Total | 33 (100.0%) | 50 (100.0%) |
Earnings by Sex by Educational Attainment in Todd Mission
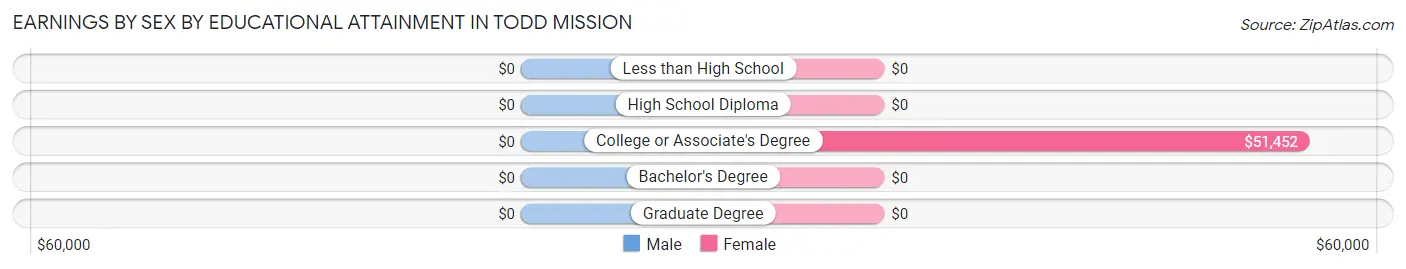
| Educational Attainment | Male Income | Female Income |
| Less than High School | - | - |
| High School Diploma | - | - |
| College or Associate's Degree | - | - |
| Bachelor's Degree | - | - |
| Graduate Degree | - | - |
| Total | - | - |
Family Income in Todd Mission
Family Income Brackets in Todd Mission
According to the Todd Mission family income data, there are 14 families falling into the $100,000 to $149,999 income range, which is the most common income bracket and makes up 50.0% of all families.
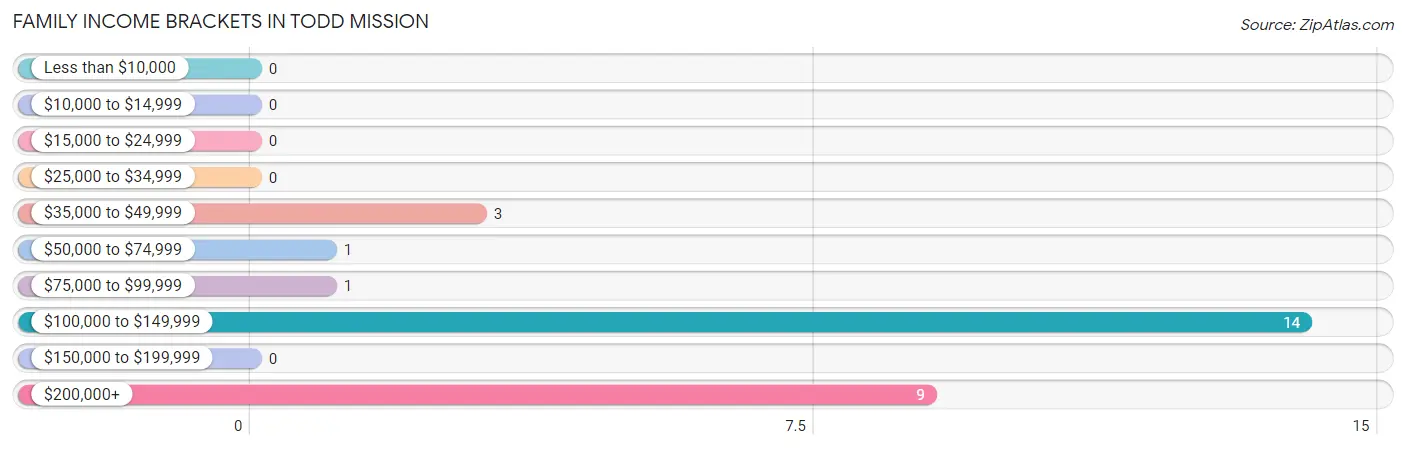
| Income Bracket | # Families | % Families |
| Less than $10,000 | 0 | 0.0% |
| $10,000 to $14,999 | 0 | 0.0% |
| $15,000 to $24,999 | 0 | 0.0% |
| $25,000 to $34,999 | 0 | 0.0% |
| $35,000 to $49,999 | 3 | 10.7% |
| $50,000 to $74,999 | 1 | 3.6% |
| $75,000 to $99,999 | 1 | 3.6% |
| $100,000 to $149,999 | 14 | 50.0% |
| $150,000 to $199,999 | 0 | 0.0% |
| $200,000+ | 9 | 32.1% |
Family Income by Famaliy Size in Todd Mission
2-person families (12 | 42.9%) account for the highest median family income in Todd Mission with $250,001 per family, while 2-person families (12 | 42.9%) have the highest median income of $125,000 per family member.
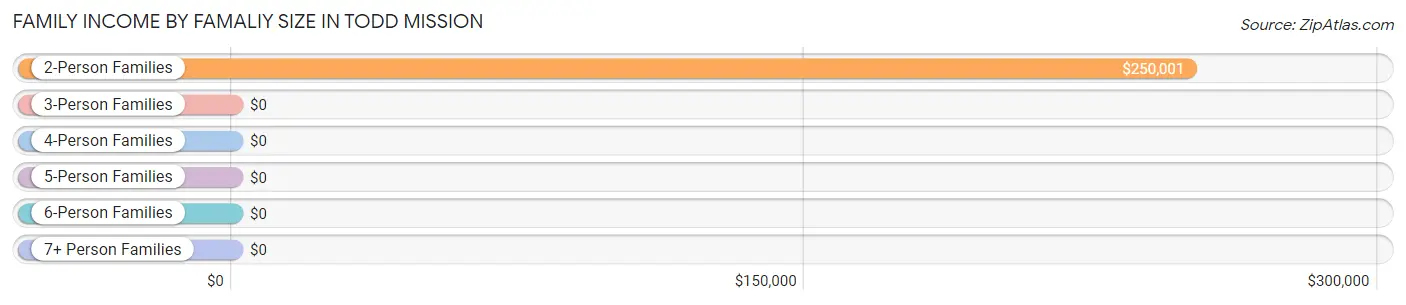
| Income Bracket | # Families | Median Income |
| 2-Person Families | 12 (42.9%) | $250,001 |
| 3-Person Families | 14 (50.0%) | $0 |
| 4-Person Families | 0 (0.0%) | $0 |
| 5-Person Families | 2 (7.1%) | $0 |
| 6-Person Families | 0 (0.0%) | $0 |
| 7+ Person Families | 0 (0.0%) | $0 |
| Total | 28 (100.0%) | $0 |
Family Income by Number of Earners in Todd Mission
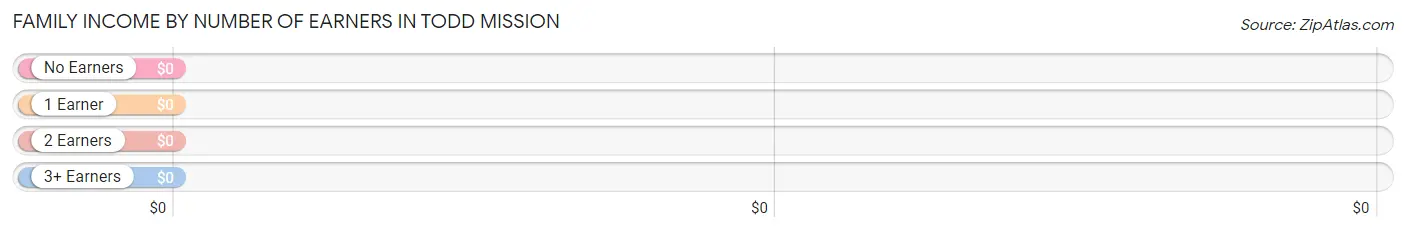
| Number of Earners | # Families | Median Income |
| No Earners | 3 (10.7%) | $0 |
| 1 Earner | 2 (7.1%) | $0 |
| 2 Earners | 22 (78.6%) | $0 |
| 3+ Earners | 1 (3.6%) | $0 |
| Total | 28 (100.0%) | $0 |
Household Income in Todd Mission
Household Income Brackets in Todd Mission
With 15 households falling in the category, the $100,000 to $149,999 income range is the most frequent in Todd Mission, accounting for 38.5% of all households.
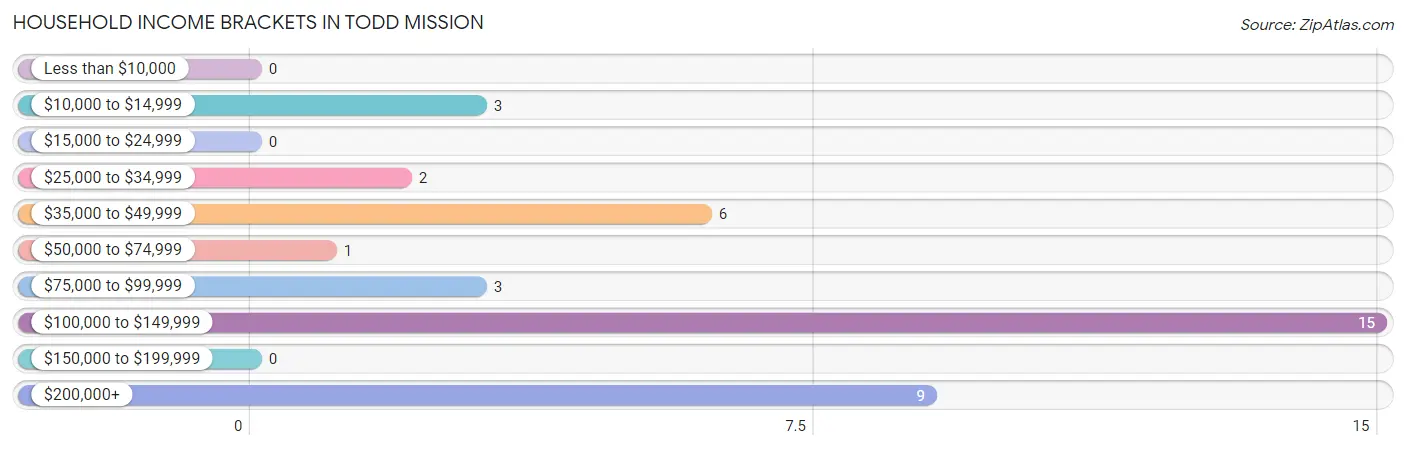
| Income Bracket | # Households | % Households |
| Less than $10,000 | 0 | 0.0% |
| $10,000 to $14,999 | 3 | 7.7% |
| $15,000 to $24,999 | 0 | 0.0% |
| $25,000 to $34,999 | 2 | 5.1% |
| $35,000 to $49,999 | 6 | 15.4% |
| $50,000 to $74,999 | 1 | 2.6% |
| $75,000 to $99,999 | 3 | 7.7% |
| $100,000 to $149,999 | 15 | 38.5% |
| $150,000 to $199,999 | 0 | 0.0% |
| $200,000+ | 9 | 23.1% |
Household Income by Householder Age in Todd Mission
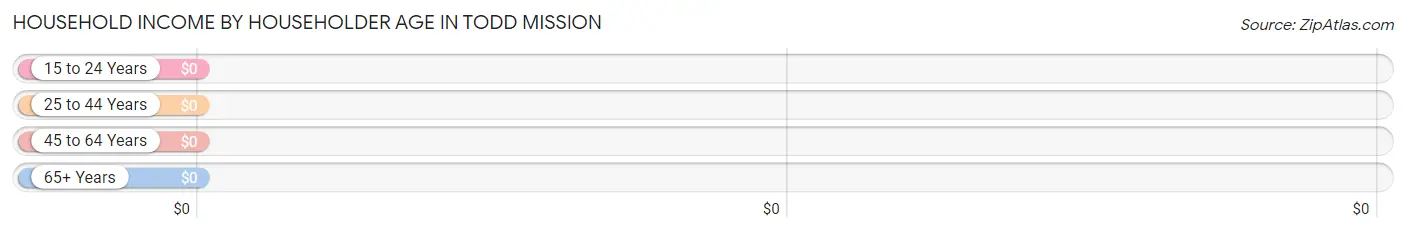
| Income Bracket | # Households | Median Income |
| 15 to 24 Years | 0 (0.0%) | $0 |
| 25 to 44 Years | 15 (38.5%) | $0 |
| 45 to 64 Years | 18 (46.2%) | $0 |
| 65+ Years | 6 (15.4%) | $0 |
| Total | 39 (100.0%) | $135,804 |
Poverty in Todd Mission
Income Below Poverty by Sex and Age in Todd Mission
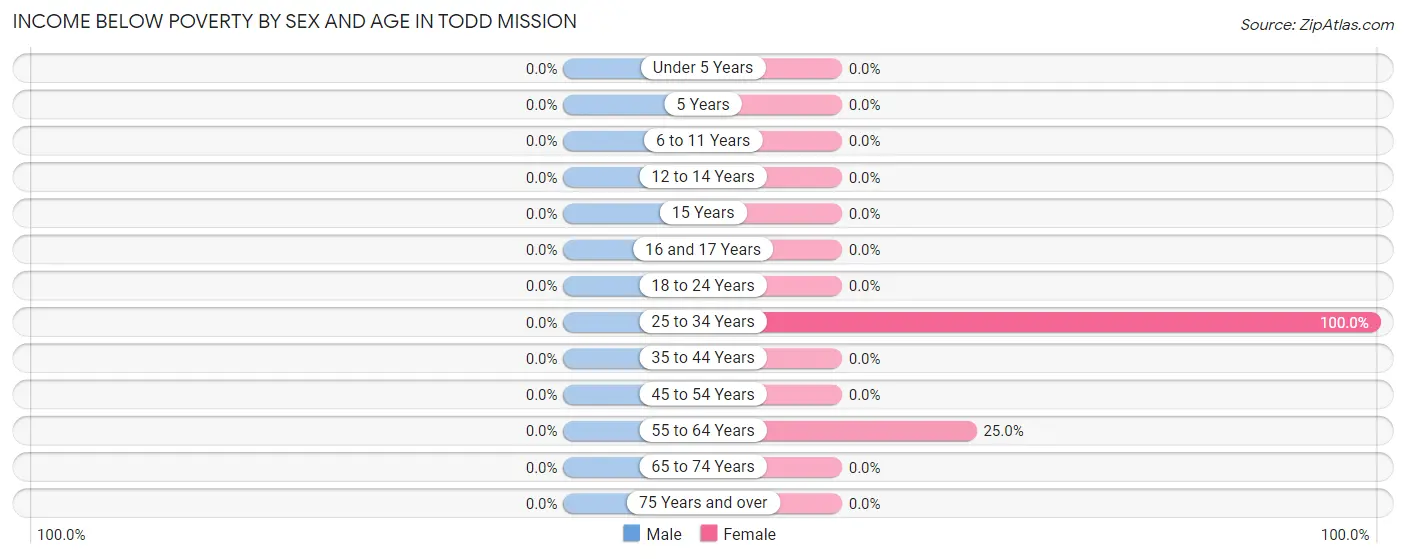
| Age Bracket | Male | Female |
| Under 5 Years | 0 (0.0%) | 0 (0.0%) |
| 5 Years | 0 (0.0%) | 0 (0.0%) |
| 6 to 11 Years | 0 (0.0%) | 0 (0.0%) |
| 12 to 14 Years | 0 (0.0%) | 0 (0.0%) |
| 15 Years | 0 (0.0%) | 0 (0.0%) |
| 16 and 17 Years | 0 (0.0%) | 0 (0.0%) |
| 18 to 24 Years | 0 (0.0%) | 0 (0.0%) |
| 25 to 34 Years | 0 (0.0%) | 2 (100.0%) |
| 35 to 44 Years | 0 (0.0%) | 0 (0.0%) |
| 45 to 54 Years | 0 (0.0%) | 0 (0.0%) |
| 55 to 64 Years | 0 (0.0%) | 3 (25.0%) |
| 65 to 74 Years | 0 (0.0%) | 0 (0.0%) |
| 75 Years and over | 0 (0.0%) | 0 (0.0%) |
| Total | 0 (0.0%) | 5 (8.5%) |
Income Above Poverty by Sex and Age in Todd Mission
According to the poverty statistics in Todd Mission, males aged under 5 years and females aged under 5 years are the age groups that are most secure financially, with 100.0% of males and 100.0% of females in these age groups living above the poverty line.
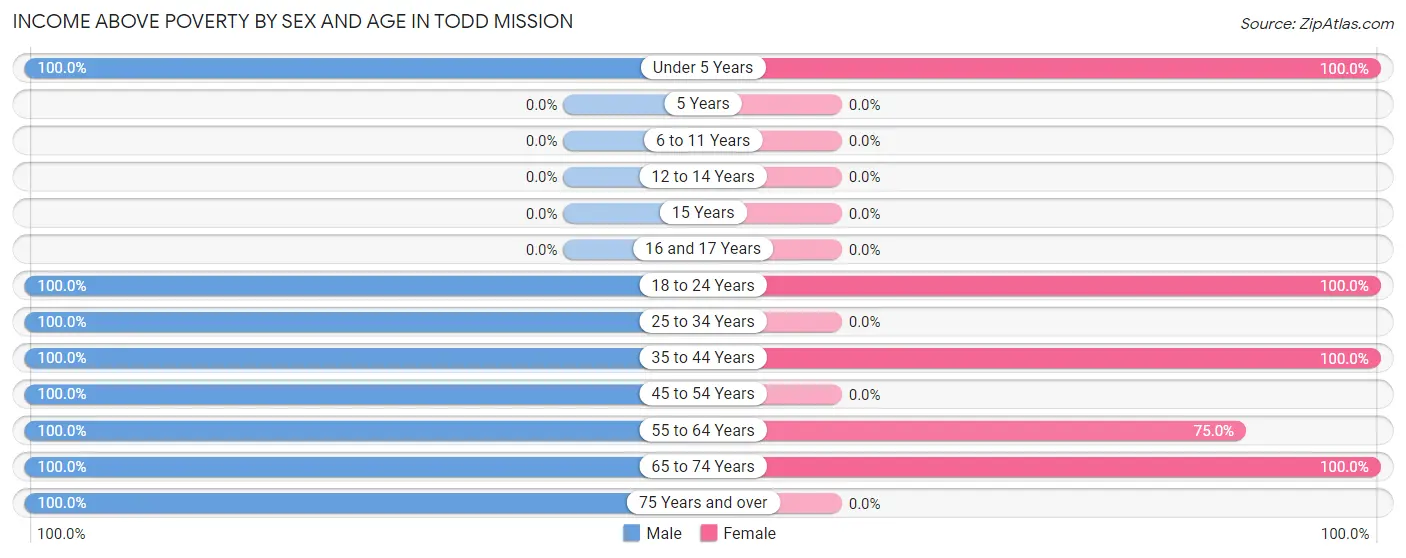
| Age Bracket | Male | Female |
| Under 5 Years | 28 (100.0%) | 2 (100.0%) |
| 5 Years | 0 (0.0%) | 0 (0.0%) |
| 6 to 11 Years | 0 (0.0%) | 0 (0.0%) |
| 12 to 14 Years | 0 (0.0%) | 0 (0.0%) |
| 15 Years | 0 (0.0%) | 0 (0.0%) |
| 16 and 17 Years | 0 (0.0%) | 0 (0.0%) |
| 18 to 24 Years | 2 (100.0%) | 8 (100.0%) |
| 25 to 34 Years | 9 (100.0%) | 0 (0.0%) |
| 35 to 44 Years | 15 (100.0%) | 32 (100.0%) |
| 45 to 54 Years | 3 (100.0%) | 0 (0.0%) |
| 55 to 64 Years | 11 (100.0%) | 9 (75.0%) |
| 65 to 74 Years | 5 (100.0%) | 3 (100.0%) |
| 75 Years and over | 1 (100.0%) | 0 (0.0%) |
| Total | 74 (100.0%) | 54 (91.5%) |
Income Below Poverty Among Married-Couple Families in Todd Mission
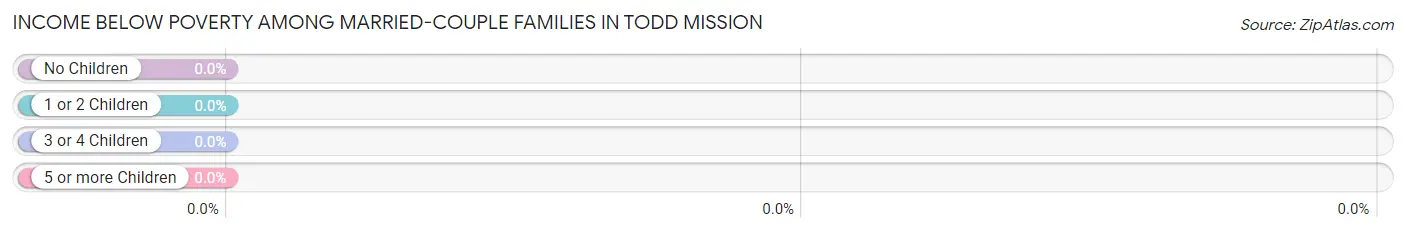
| Children | Above Poverty | Below Poverty |
| No Children | 10 (100.0%) | 0 (0.0%) |
| 1 or 2 Children | 14 (100.0%) | 0 (0.0%) |
| 3 or 4 Children | 0 (0.0%) | 0 (0.0%) |
| 5 or more Children | 0 (0.0%) | 0 (0.0%) |
| Total | 24 (100.0%) | 0 (0.0%) |
Income Below Poverty Among Single-Parent Households in Todd Mission
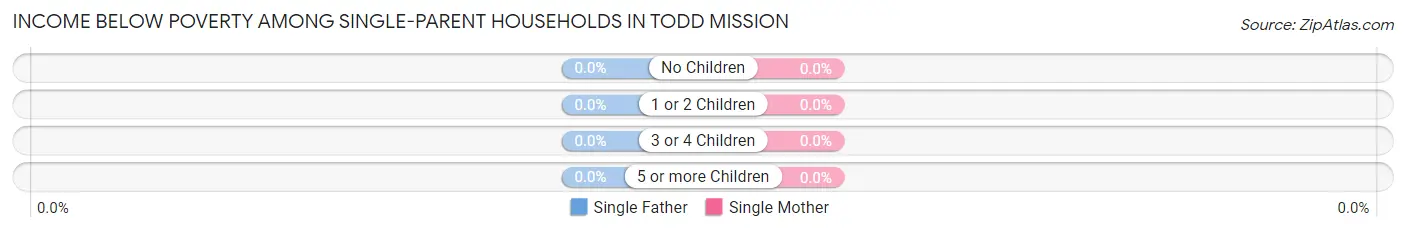
| Children | Single Father | Single Mother |
| No Children | 0 (0.0%) | 0 (0.0%) |
| 1 or 2 Children | 0 (0.0%) | 0 (0.0%) |
| 3 or 4 Children | 0 (0.0%) | 0 (0.0%) |
| 5 or more Children | 0 (0.0%) | 0 (0.0%) |
| Total | 0 (0.0%) | 0 (0.0%) |
Income Below Poverty Among Married-Couple vs Single-Parent Households in Todd Mission
| Children | Married-Couple Families | Single-Parent Households |
| No Children | 0 (0.0%) | 0 (0.0%) |
| 1 or 2 Children | 0 (0.0%) | 0 (0.0%) |
| 3 or 4 Children | 0 (0.0%) | 0 (0.0%) |
| 5 or more Children | 0 (0.0%) | 0 (0.0%) |
| Total | 0 (0.0%) | 0 (0.0%) |
Employment Characteristics in Todd Mission
Employment by Class of Employer in Todd Mission
Among the 42 employed individuals in Todd Mission, private company employees (38 | 90.5%), not-for-profit organizations (3 | 7.1%), and self-employed (not incorporated) (1 | 2.4%) make up the most common classes of employment.
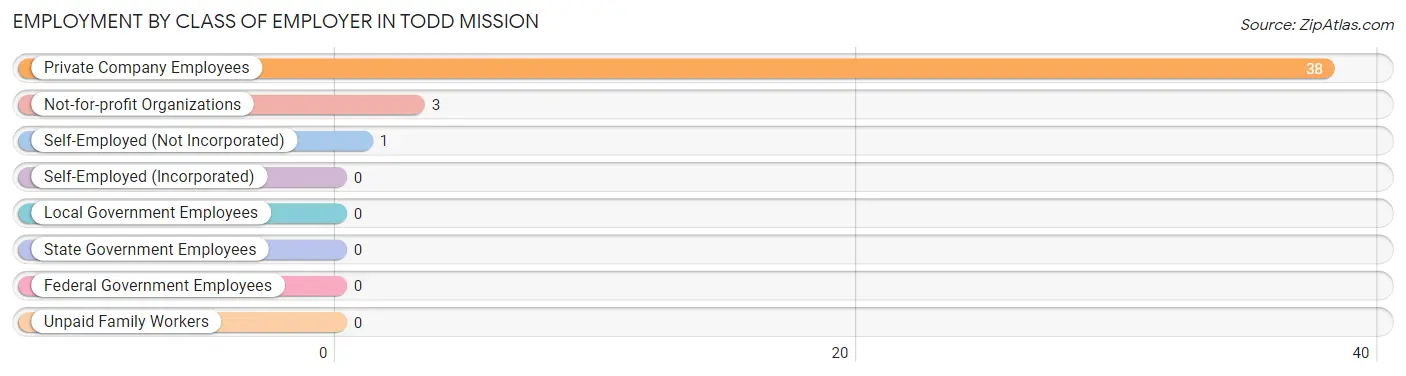
| Employer Class | # Employees | % Employees |
| Private Company Employees | 38 | 90.5% |
| Self-Employed (Incorporated) | 0 | 0.0% |
| Self-Employed (Not Incorporated) | 1 | 2.4% |
| Not-for-profit Organizations | 3 | 7.1% |
| Local Government Employees | 0 | 0.0% |
| State Government Employees | 0 | 0.0% |
| Federal Government Employees | 0 | 0.0% |
| Unpaid Family Workers | 0 | 0.0% |
| Total | 42 | 100.0% |
Employment Status by Age in Todd Mission
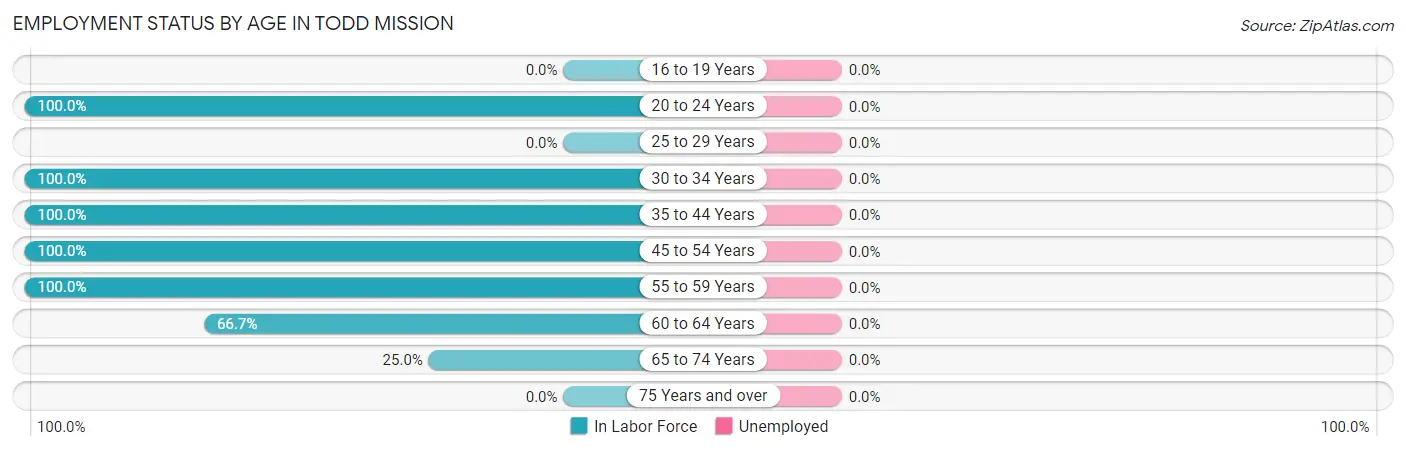
| Age Bracket | In Labor Force | Unemployed |
| 16 to 19 Years | 0 (0.0%) | 0 (0.0%) |
| 20 to 24 Years | 7 (100.0%) | 0 (0.0%) |
| 25 to 29 Years | 0 (0.0%) | 0 (0.0%) |
| 30 to 34 Years | 4 (100.0%) | 0 (0.0%) |
| 35 to 44 Years | 47 (100.0%) | 0 (0.0%) |
| 45 to 54 Years | 3 (100.0%) | 0 (0.0%) |
| 55 to 59 Years | 8 (100.0%) | 0 (0.0%) |
| 60 to 64 Years | 10 (66.7%) | 0 (0.0%) |
| 65 to 74 Years | 2 (25.0%) | 0 (0.0%) |
| 75 Years and over | 0 (0.0%) | 0 (0.0%) |
| Total | 81 (78.6%) | 0 (0.0%) |
Employment Status by Educational Attainment in Todd Mission
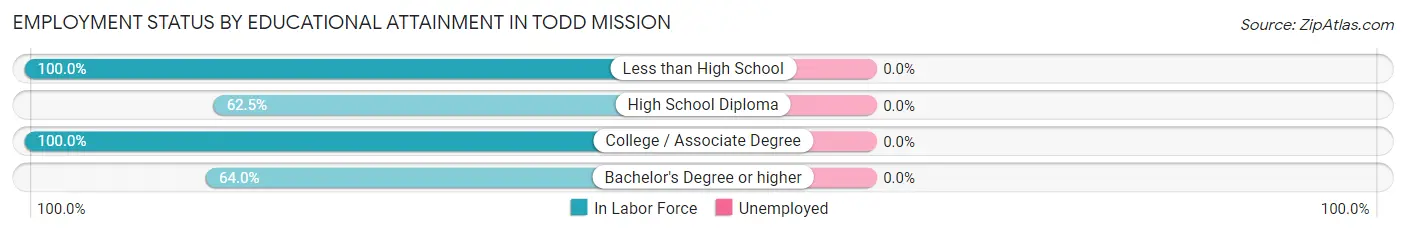
| Educational Attainment | In Labor Force | Unemployed |
| Less than High School | 2 (100.0%) | 0 (0.0%) |
| High School Diploma | 5 (62.5%) | 0 (0.0%) |
| College / Associate Degree | 49 (100.0%) | 0 (0.0%) |
| Bachelor's Degree or higher | 16 (64.0%) | 0 (0.0%) |
| Total | 72 (85.7%) | 0 (0.0%) |
Employment Occupations by Sex in Todd Mission
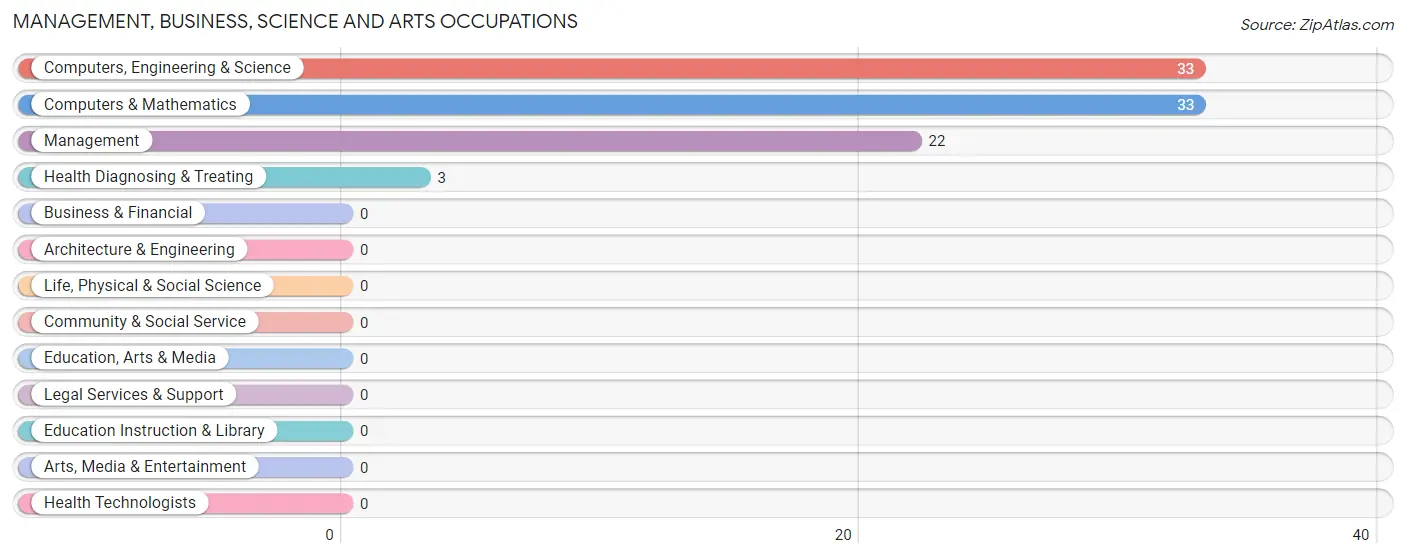
Management, Business, Science and Arts Occupations
The most common Management, Business, Science and Arts occupations in Todd Mission are Computers, Engineering & Science (33 | 40.7%), Computers & Mathematics (33 | 40.7%), Management (22 | 27.2%), and Health Diagnosing & Treating (3 | 3.7%).
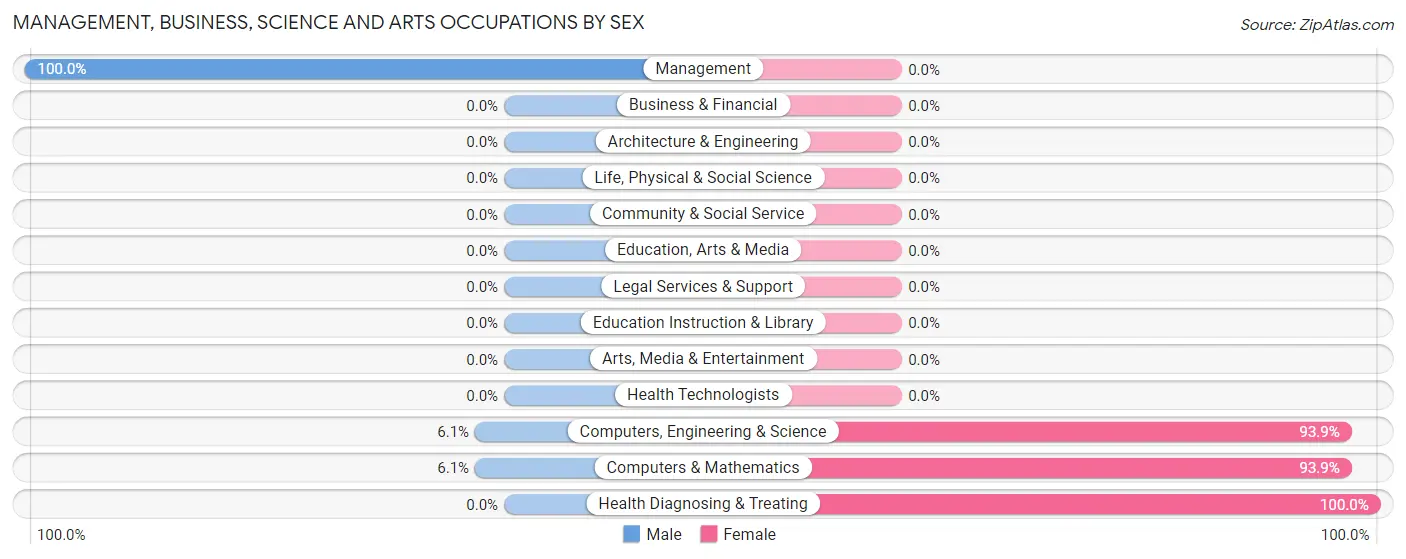
Management, Business, Science and Arts Occupations by Sex
Within the Management, Business, Science and Arts occupations in Todd Mission, the most male-oriented occupations are Management (100.0%), Computers, Engineering & Science (6.1%), and Computers & Mathematics (6.1%), while the most female-oriented occupations are Health Diagnosing & Treating (100.0%), Computers, Engineering & Science (93.9%), and Computers & Mathematics (93.9%).
| Occupation | Male | Female |
| Management | 22 (100.0%) | 0 (0.0%) |
| Business & Financial | 0 (0.0%) | 0 (0.0%) |
| Computers, Engineering & Science | 2 (6.1%) | 31 (93.9%) |
| Computers & Mathematics | 2 (6.1%) | 31 (93.9%) |
| Architecture & Engineering | 0 (0.0%) | 0 (0.0%) |
| Life, Physical & Social Science | 0 (0.0%) | 0 (0.0%) |
| Community & Social Service | 0 (0.0%) | 0 (0.0%) |
| Education, Arts & Media | 0 (0.0%) | 0 (0.0%) |
| Legal Services & Support | 0 (0.0%) | 0 (0.0%) |
| Education Instruction & Library | 0 (0.0%) | 0 (0.0%) |
| Arts, Media & Entertainment | 0 (0.0%) | 0 (0.0%) |
| Health Diagnosing & Treating | 0 (0.0%) | 3 (100.0%) |
| Health Technologists | 0 (0.0%) | 0 (0.0%) |
| Total (Category) | 24 (41.4%) | 34 (58.6%) |
| Total (Overall) | 31 (38.3%) | 50 (61.7%) |
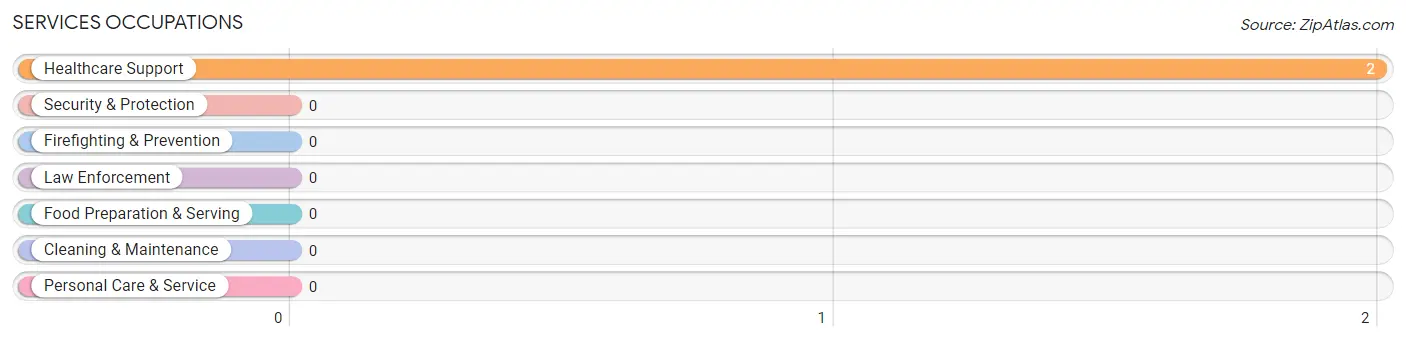
Services Occupations
The most common Services occupations in Todd Mission are , and Healthcare Support (2 | 2.5%).
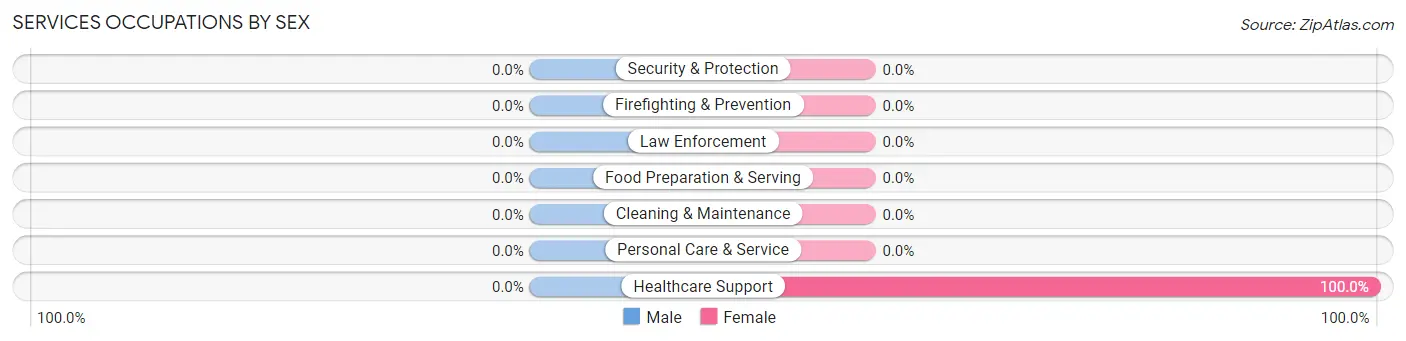
Services Occupations by Sex
| Occupation | Male | Female |
| Healthcare Support | 0 (0.0%) | 2 (100.0%) |
| Security & Protection | 0 (0.0%) | 0 (0.0%) |
| Firefighting & Prevention | 0 (0.0%) | 0 (0.0%) |
| Law Enforcement | 0 (0.0%) | 0 (0.0%) |
| Food Preparation & Serving | 0 (0.0%) | 0 (0.0%) |
| Cleaning & Maintenance | 0 (0.0%) | 0 (0.0%) |
| Personal Care & Service | 0 (0.0%) | 0 (0.0%) |
| Total (Category) | 0 (0.0%) | 2 (100.0%) |
| Total (Overall) | 31 (38.3%) | 50 (61.7%) |
Sales and Office Occupations
The most common Sales and Office occupations in Todd Mission are Office & Administration (11 | 13.6%), and Sales & Related (5 | 6.2%).
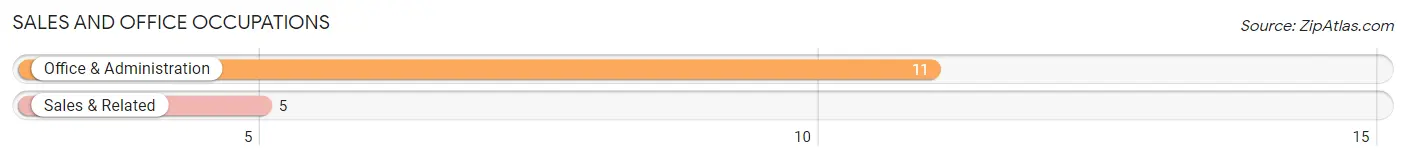
Sales and Office Occupations by Sex
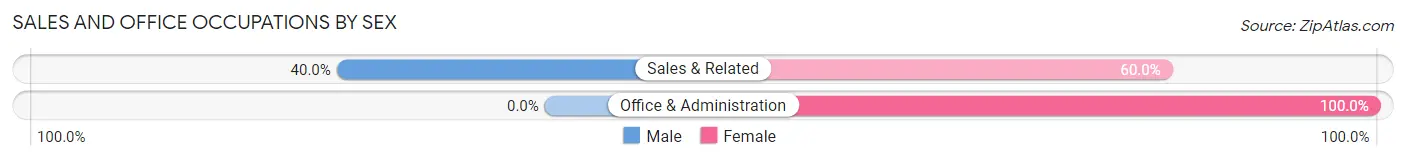
| Occupation | Male | Female |
| Sales & Related | 2 (40.0%) | 3 (60.0%) |
| Office & Administration | 0 (0.0%) | 11 (100.0%) |
| Total (Category) | 2 (12.5%) | 14 (87.5%) |
| Total (Overall) | 31 (38.3%) | 50 (61.7%) |
Natural Resources, Construction and Maintenance Occupations
The most common Natural Resources, Construction and Maintenance occupations in Todd Mission are , and Construction & Extraction (5 | 6.2%).
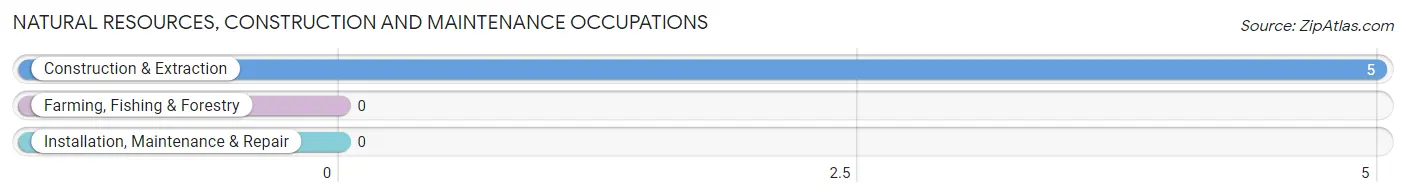
Natural Resources, Construction and Maintenance Occupations by Sex
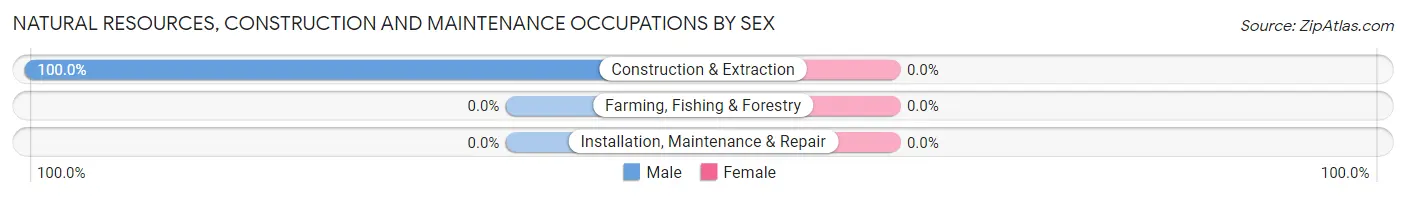
| Occupation | Male | Female |
| Farming, Fishing & Forestry | 0 (0.0%) | 0 (0.0%) |
| Construction & Extraction | 5 (100.0%) | 0 (0.0%) |
| Installation, Maintenance & Repair | 0 (0.0%) | 0 (0.0%) |
| Total (Category) | 5 (100.0%) | 0 (0.0%) |
| Total (Overall) | 31 (38.3%) | 50 (61.7%) |
Production, Transportation and Moving Occupations
Production, Transportation and Moving Occupations by Sex
| Occupation | Male | Female |
| Production | 0 (0.0%) | 0 (0.0%) |
| Transportation | 0 (0.0%) | 0 (0.0%) |
| Material Moving | 0 (0.0%) | 0 (0.0%) |
| Total (Category) | 0 (0.0%) | 0 (0.0%) |
| Total (Overall) | 31 (38.3%) | 50 (61.7%) |
Employment Industries by Sex in Todd Mission
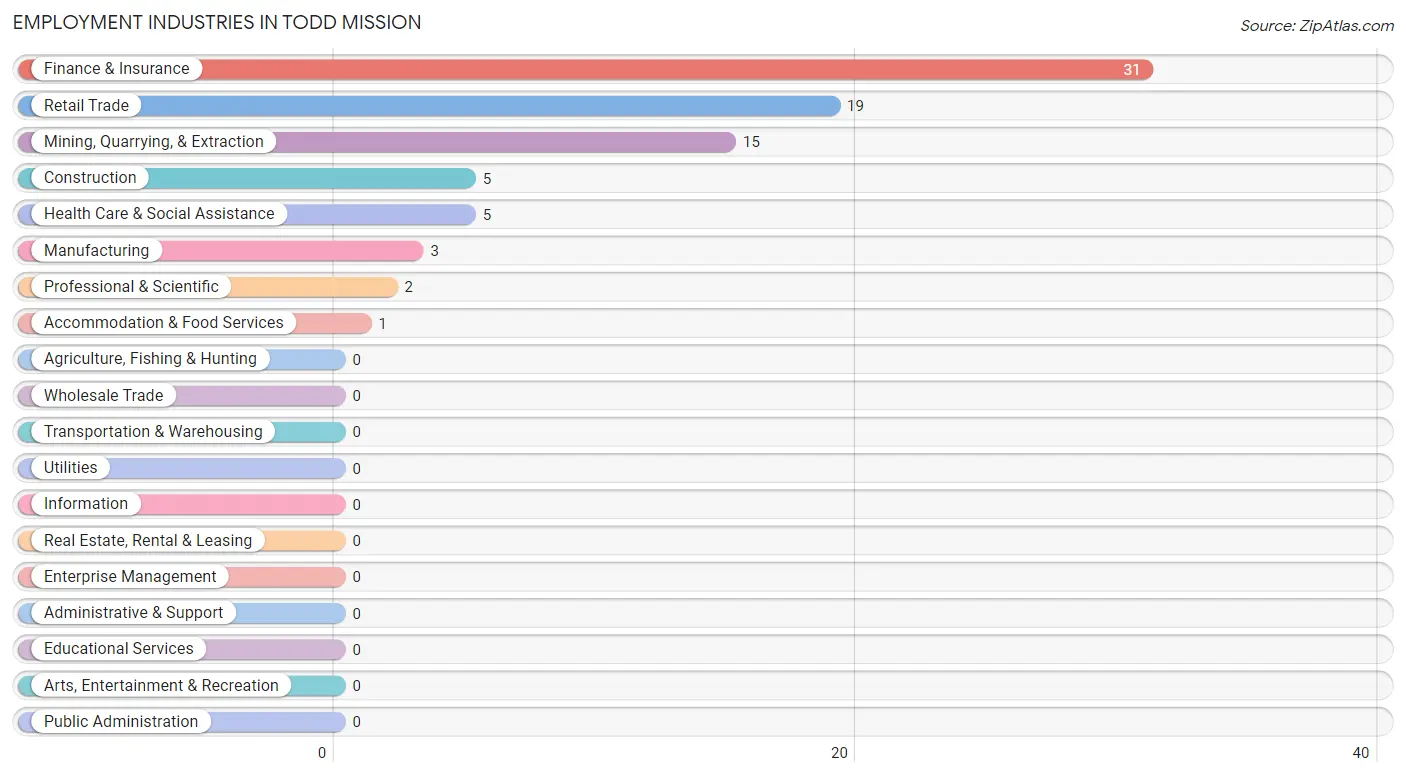
Employment Industries in Todd Mission
The major employment industries in Todd Mission include Finance & Insurance (31 | 38.3%), Retail Trade (19 | 23.5%), Mining, Quarrying, & Extraction (15 | 18.5%), Construction (5 | 6.2%), and Health Care & Social Assistance (5 | 6.2%).
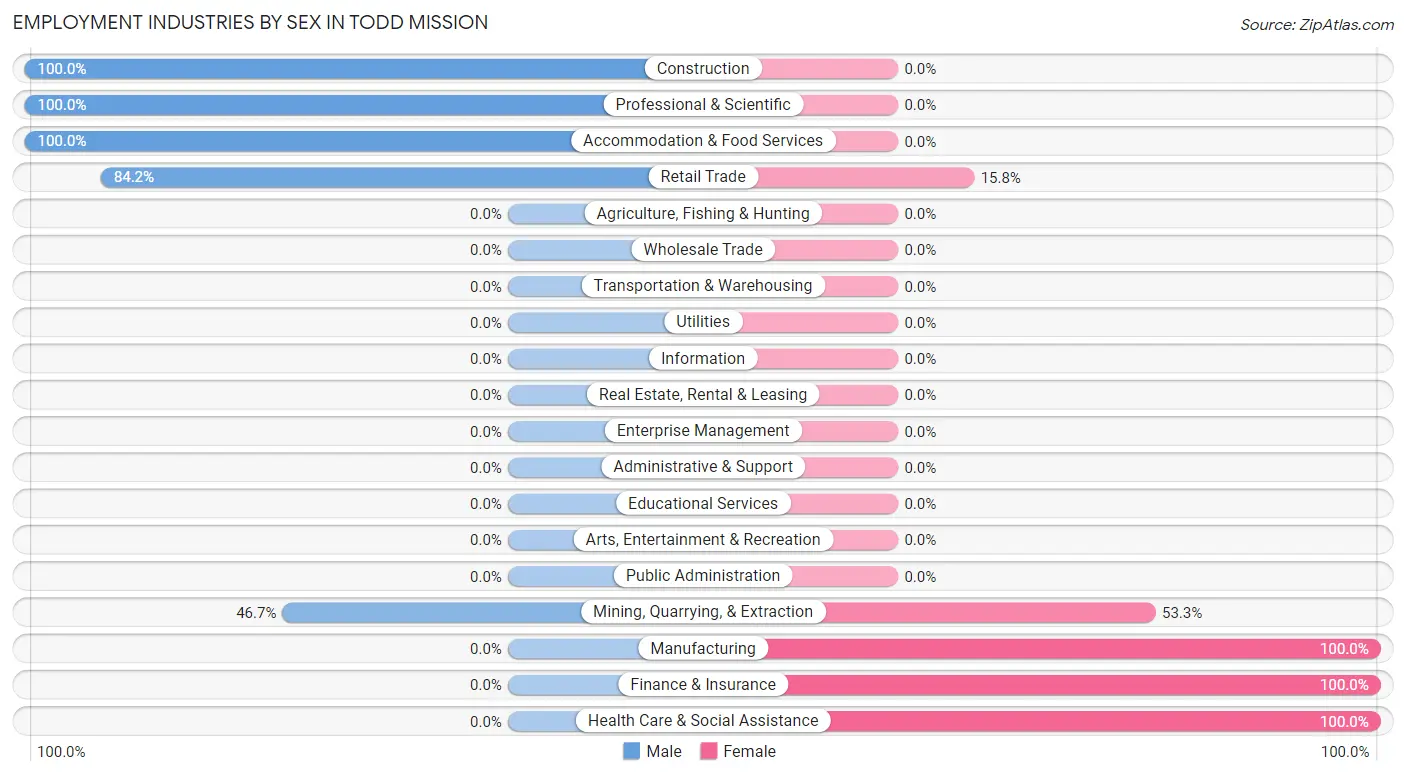
Employment Industries by Sex in Todd Mission
The Todd Mission industries that see more men than women are Construction (100.0%), Professional & Scientific (100.0%), and Accommodation & Food Services (100.0%), whereas the industries that tend to have a higher number of women are Manufacturing (100.0%), Finance & Insurance (100.0%), and Health Care & Social Assistance (100.0%).
| Industry | Male | Female |
| Agriculture, Fishing & Hunting | 0 (0.0%) | 0 (0.0%) |
| Mining, Quarrying, & Extraction | 7 (46.7%) | 8 (53.3%) |
| Construction | 5 (100.0%) | 0 (0.0%) |
| Manufacturing | 0 (0.0%) | 3 (100.0%) |
| Wholesale Trade | 0 (0.0%) | 0 (0.0%) |
| Retail Trade | 16 (84.2%) | 3 (15.8%) |
| Transportation & Warehousing | 0 (0.0%) | 0 (0.0%) |
| Utilities | 0 (0.0%) | 0 (0.0%) |
| Information | 0 (0.0%) | 0 (0.0%) |
| Finance & Insurance | 0 (0.0%) | 31 (100.0%) |
| Real Estate, Rental & Leasing | 0 (0.0%) | 0 (0.0%) |
| Professional & Scientific | 2 (100.0%) | 0 (0.0%) |
| Enterprise Management | 0 (0.0%) | 0 (0.0%) |
| Administrative & Support | 0 (0.0%) | 0 (0.0%) |
| Educational Services | 0 (0.0%) | 0 (0.0%) |
| Health Care & Social Assistance | 0 (0.0%) | 5 (100.0%) |
| Arts, Entertainment & Recreation | 0 (0.0%) | 0 (0.0%) |
| Accommodation & Food Services | 1 (100.0%) | 0 (0.0%) |
| Public Administration | 0 (0.0%) | 0 (0.0%) |
| Total | 31 (38.3%) | 50 (61.7%) |
Education in Todd Mission
School Enrollment in Todd Mission
The most common levels of schooling among the 9 students in Todd Mission are graduate / professional (7 | 77.8%), and college / undergraduate (2 | 22.2%).
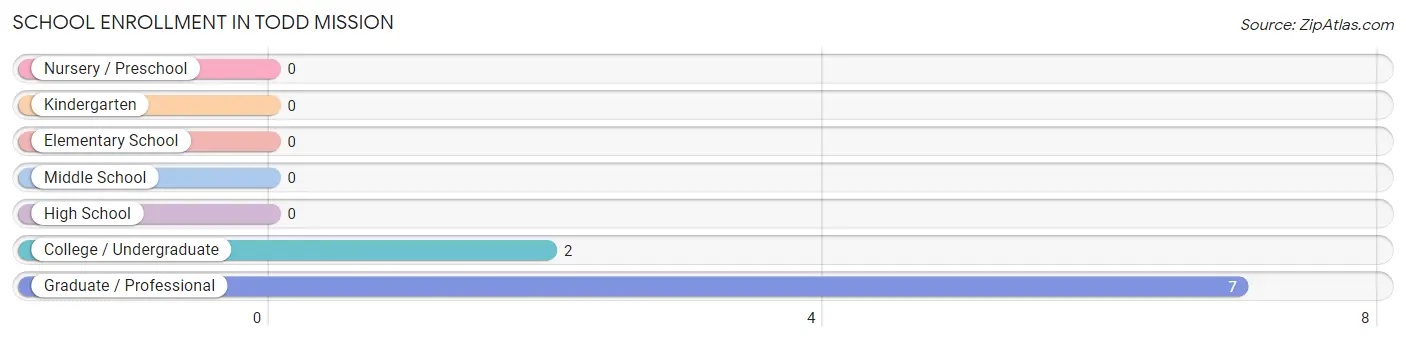
| School Level | # Students | % Students |
| Nursery / Preschool | 0 | 0.0% |
| Kindergarten | 0 | 0.0% |
| Elementary School | 0 | 0.0% |
| Middle School | 0 | 0.0% |
| High School | 0 | 0.0% |
| College / Undergraduate | 2 | 22.2% |
| Graduate / Professional | 7 | 77.8% |
| Total | 9 | 100.0% |
School Enrollment by Age by Funding Source in Todd Mission
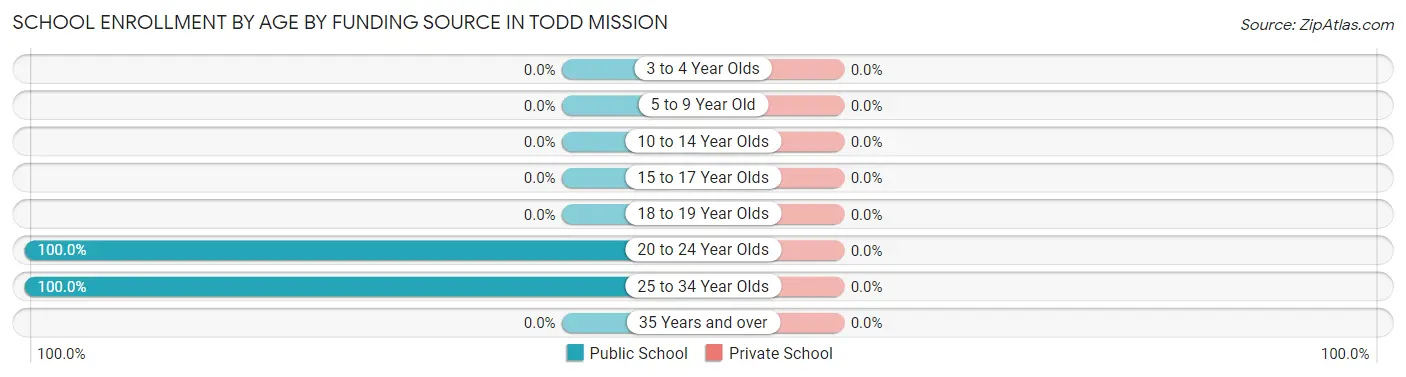
| Age Bracket | Public School | Private School |
| 3 to 4 Year Olds | 0 (0.0%) | 0 (0.0%) |
| 5 to 9 Year Old | 0 (0.0%) | 0 (0.0%) |
| 10 to 14 Year Olds | 0 (0.0%) | 0 (0.0%) |
| 15 to 17 Year Olds | 0 (0.0%) | 0 (0.0%) |
| 18 to 19 Year Olds | 0 (0.0%) | 0 (0.0%) |
| 20 to 24 Year Olds | 2 (100.0%) | 0 (0.0%) |
| 25 to 34 Year Olds | 7 (100.0%) | 0 (0.0%) |
| 35 Years and over | 0 (0.0%) | 0 (0.0%) |
| Total | 9 (100.0%) | 0 (0.0%) |
Educational Attainment by Field of Study in Todd Mission
Computers & mathematics (14 | 53.8%), psychology (7 | 26.9%), social sciences (2 | 7.7%), education (2 | 7.7%), and business (1 | 3.8%) are the most common fields of study among 26 individuals in Todd Mission who have obtained a bachelor's degree or higher.
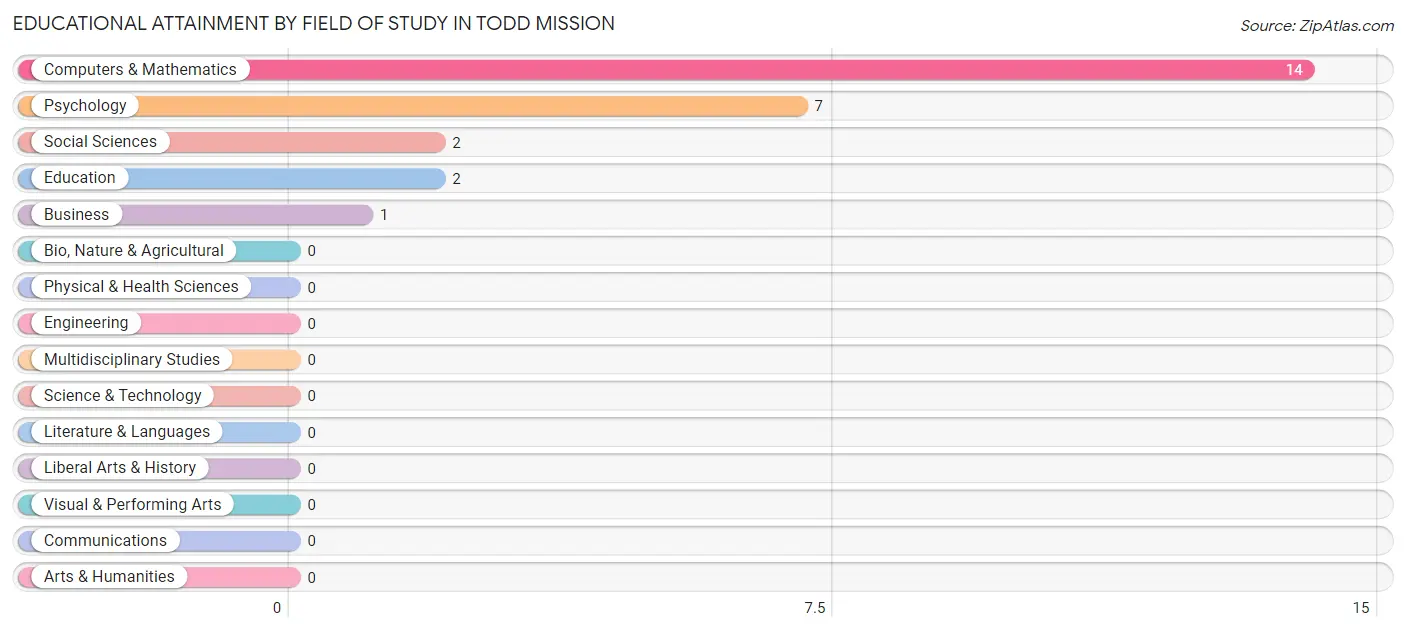
| Field of Study | # Graduates | % Graduates |
| Computers & Mathematics | 14 | 53.8% |
| Bio, Nature & Agricultural | 0 | 0.0% |
| Physical & Health Sciences | 0 | 0.0% |
| Psychology | 7 | 26.9% |
| Social Sciences | 2 | 7.7% |
| Engineering | 0 | 0.0% |
| Multidisciplinary Studies | 0 | 0.0% |
| Science & Technology | 0 | 0.0% |
| Business | 1 | 3.8% |
| Education | 2 | 7.7% |
| Literature & Languages | 0 | 0.0% |
| Liberal Arts & History | 0 | 0.0% |
| Visual & Performing Arts | 0 | 0.0% |
| Communications | 0 | 0.0% |
| Arts & Humanities | 0 | 0.0% |
| Total | 26 | 100.0% |
Transportation & Commute in Todd Mission
Vehicle Availability by Sex in Todd Mission
The most prevalent vehicle ownership categories in Todd Mission are males with 3 vehicles (21, accounting for 84.0%) and females with 3 vehicles (8, making up 123.5%).
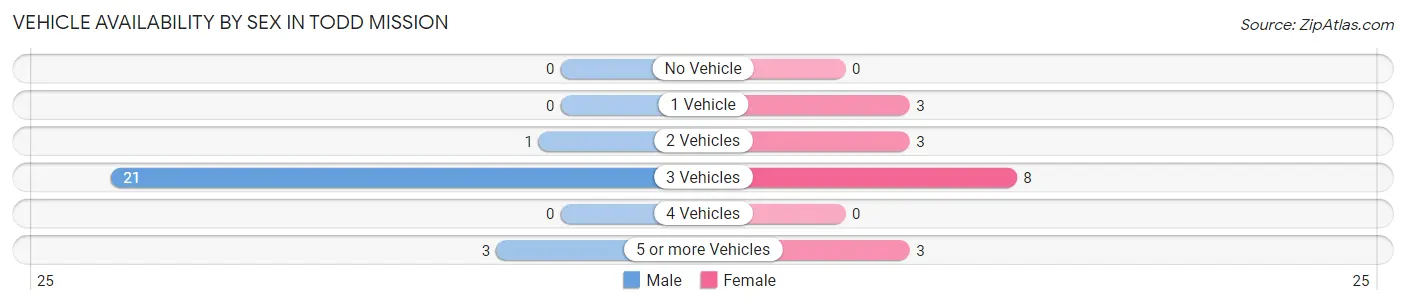
| Vehicles Available | Male | Female |
| No Vehicle | 0 (0.0%) | 0 (0.0%) |
| 1 Vehicle | 0 (0.0%) | 3 (17.6%) |
| 2 Vehicles | 1 (4.0%) | 3 (17.6%) |
| 3 Vehicles | 21 (84.0%) | 8 (47.1%) |
| 4 Vehicles | 0 (0.0%) | 0 (0.0%) |
| 5 or more Vehicles | 3 (12.0%) | 3 (17.6%) |
| Total | 25 (100.0%) | 17 (100.0%) |
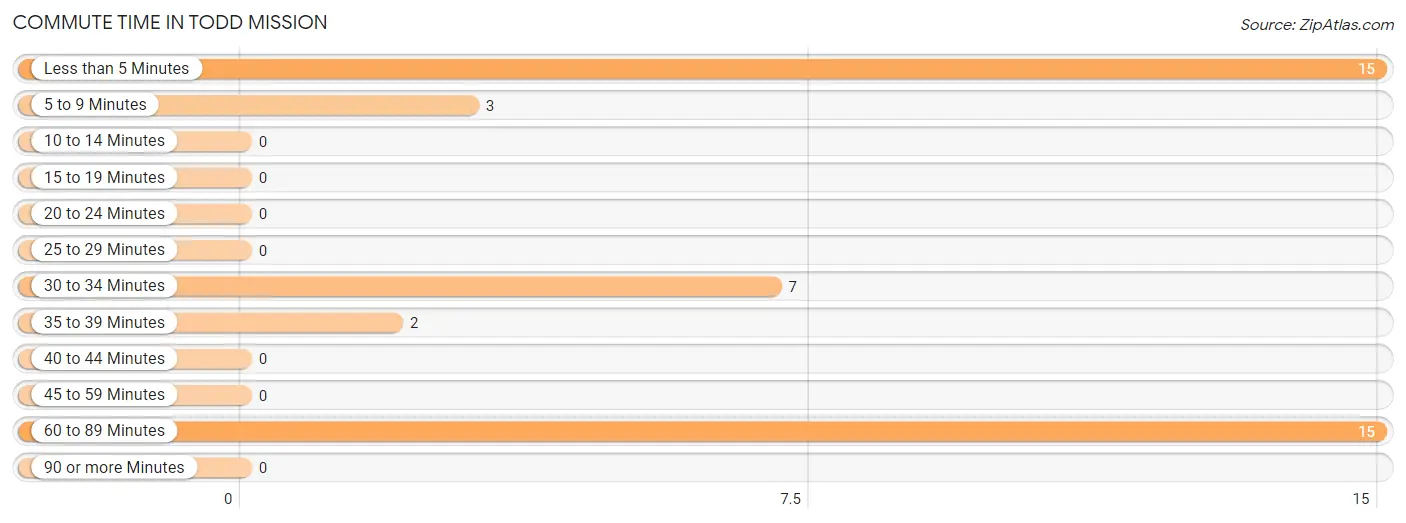
Commute Time in Todd Mission
The most frequently occuring commute durations in Todd Mission are less than 5 minutes (15 commuters, 35.7%), 60 to 89 minutes (15 commuters, 35.7%), and 30 to 34 minutes (7 commuters, 16.7%).
| Commute Time | # Commuters | % Commuters |
| Less than 5 Minutes | 15 | 35.7% |
| 5 to 9 Minutes | 3 | 7.1% |
| 10 to 14 Minutes | 0 | 0.0% |
| 15 to 19 Minutes | 0 | 0.0% |
| 20 to 24 Minutes | 0 | 0.0% |
| 25 to 29 Minutes | 0 | 0.0% |
| 30 to 34 Minutes | 7 | 16.7% |
| 35 to 39 Minutes | 2 | 4.8% |
| 40 to 44 Minutes | 0 | 0.0% |
| 45 to 59 Minutes | 0 | 0.0% |
| 60 to 89 Minutes | 15 | 35.7% |
| 90 or more Minutes | 0 | 0.0% |
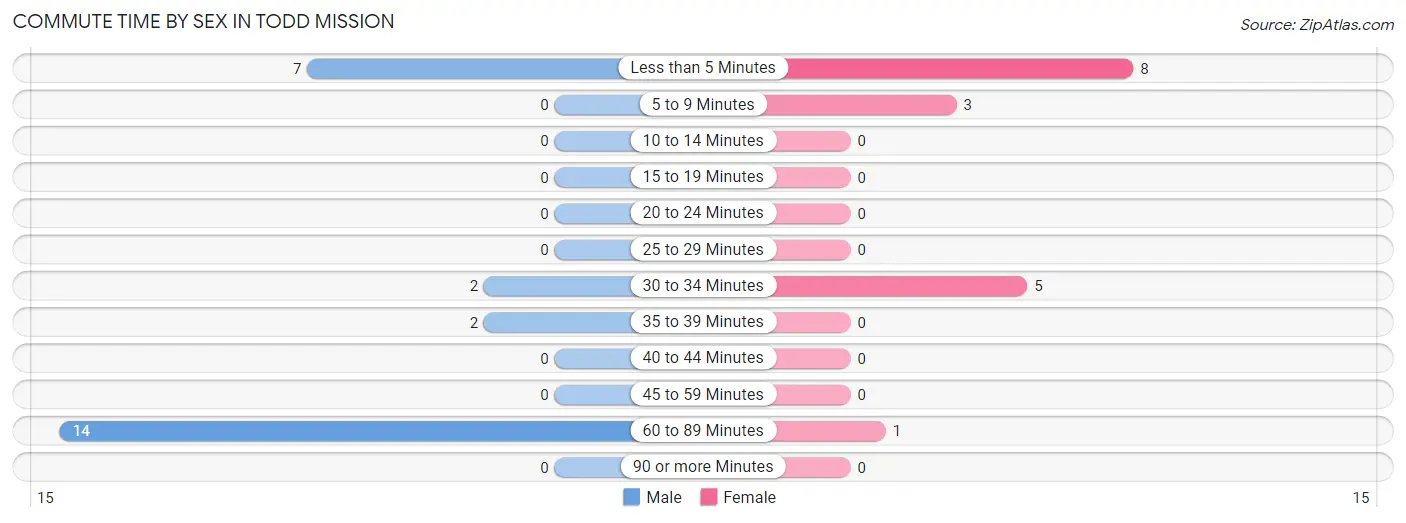
Commute Time by Sex in Todd Mission
The most common commute times in Todd Mission are 60 to 89 minutes (14 commuters, 56.0%) for males and less than 5 minutes (8 commuters, 47.1%) for females.
| Commute Time | Male | Female |
| Less than 5 Minutes | 7 (28.0%) | 8 (47.1%) |
| 5 to 9 Minutes | 0 (0.0%) | 3 (17.6%) |
| 10 to 14 Minutes | 0 (0.0%) | 0 (0.0%) |
| 15 to 19 Minutes | 0 (0.0%) | 0 (0.0%) |
| 20 to 24 Minutes | 0 (0.0%) | 0 (0.0%) |
| 25 to 29 Minutes | 0 (0.0%) | 0 (0.0%) |
| 30 to 34 Minutes | 2 (8.0%) | 5 (29.4%) |
| 35 to 39 Minutes | 2 (8.0%) | 0 (0.0%) |
| 40 to 44 Minutes | 0 (0.0%) | 0 (0.0%) |
| 45 to 59 Minutes | 0 (0.0%) | 0 (0.0%) |
| 60 to 89 Minutes | 14 (56.0%) | 1 (5.9%) |
| 90 or more Minutes | 0 (0.0%) | 0 (0.0%) |
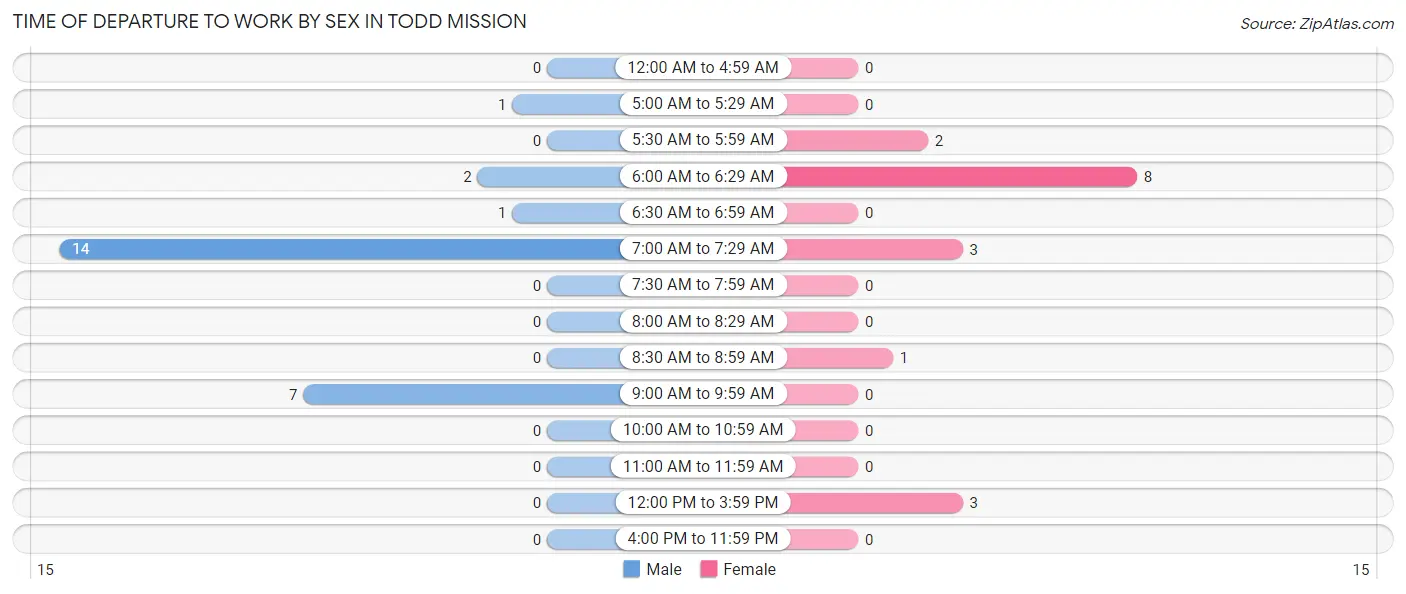
Time of Departure to Work by Sex in Todd Mission
The most frequent times of departure to work in Todd Mission are 7:00 AM to 7:29 AM (14, 56.0%) for males and 6:00 AM to 6:29 AM (8, 47.1%) for females.
| Time of Departure | Male | Female |
| 12:00 AM to 4:59 AM | 0 (0.0%) | 0 (0.0%) |
| 5:00 AM to 5:29 AM | 1 (4.0%) | 0 (0.0%) |
| 5:30 AM to 5:59 AM | 0 (0.0%) | 2 (11.8%) |
| 6:00 AM to 6:29 AM | 2 (8.0%) | 8 (47.1%) |
| 6:30 AM to 6:59 AM | 1 (4.0%) | 0 (0.0%) |
| 7:00 AM to 7:29 AM | 14 (56.0%) | 3 (17.6%) |
| 7:30 AM to 7:59 AM | 0 (0.0%) | 0 (0.0%) |
| 8:00 AM to 8:29 AM | 0 (0.0%) | 0 (0.0%) |
| 8:30 AM to 8:59 AM | 0 (0.0%) | 1 (5.9%) |
| 9:00 AM to 9:59 AM | 7 (28.0%) | 0 (0.0%) |
| 10:00 AM to 10:59 AM | 0 (0.0%) | 0 (0.0%) |
| 11:00 AM to 11:59 AM | 0 (0.0%) | 0 (0.0%) |
| 12:00 PM to 3:59 PM | 0 (0.0%) | 3 (17.6%) |
| 4:00 PM to 11:59 PM | 0 (0.0%) | 0 (0.0%) |
| Total | 25 (100.0%) | 17 (100.0%) |
Housing Occupancy in Todd Mission
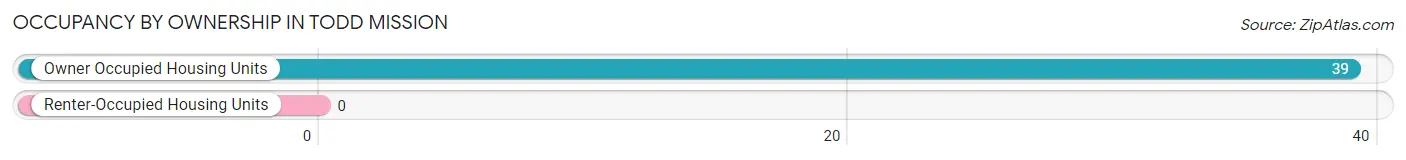
Occupancy by Ownership in Todd Mission
Of the total 39 dwellings in Todd Mission, owner-occupied units account for 39 (100.0%), while renter-occupied units make up 0 (0.0%).
| Occupancy | # Housing Units | % Housing Units |
| Owner Occupied Housing Units | 39 | 100.0% |
| Renter-Occupied Housing Units | 0 | 0.0% |
| Total Occupied Housing Units | 39 | 100.0% |
Occupancy by Household Size in Todd Mission
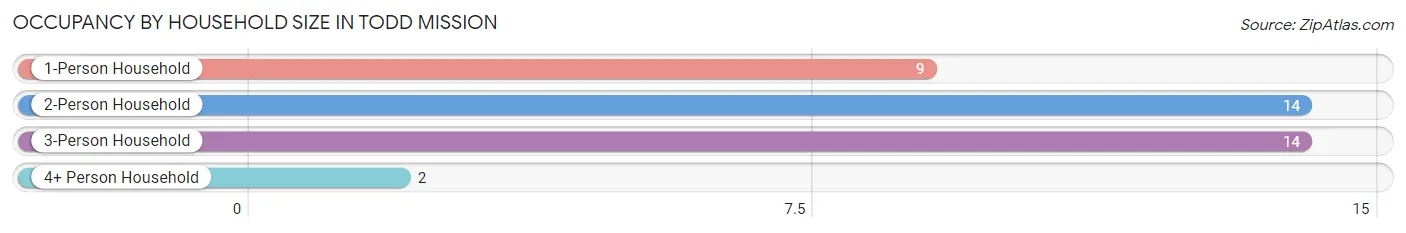
| Household Size | # Housing Units | % Housing Units |
| 1-Person Household | 9 | 23.1% |
| 2-Person Household | 14 | 35.9% |
| 3-Person Household | 14 | 35.9% |
| 4+ Person Household | 2 | 5.1% |
| Total Housing Units | 39 | 100.0% |
Occupancy by Ownership by Household Size in Todd Mission
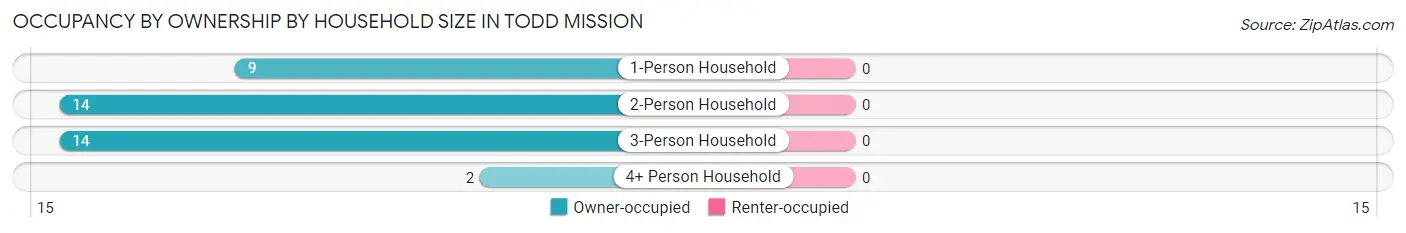
| Household Size | Owner-occupied | Renter-occupied |
| 1-Person Household | 9 (100.0%) | 0 (0.0%) |
| 2-Person Household | 14 (100.0%) | 0 (0.0%) |
| 3-Person Household | 14 (100.0%) | 0 (0.0%) |
| 4+ Person Household | 2 (100.0%) | 0 (0.0%) |
| Total Housing Units | 39 (100.0%) | 0 (0.0%) |
Occupancy by Educational Attainment in Todd Mission
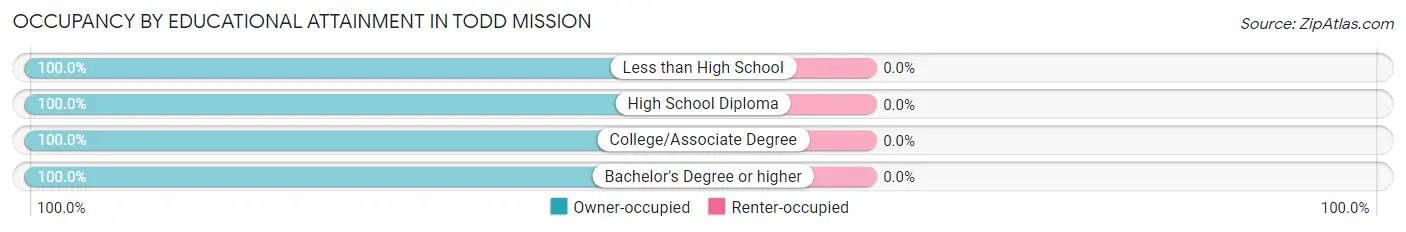
| Household Size | Owner-occupied | Renter-occupied |
| Less than High School | 1 (100.0%) | 0 (0.0%) |
| High School Diploma | 6 (100.0%) | 0 (0.0%) |
| College/Associate Degree | 13 (100.0%) | 0 (0.0%) |
| Bachelor's Degree or higher | 19 (100.0%) | 0 (0.0%) |
Occupancy by Age of Householder in Todd Mission
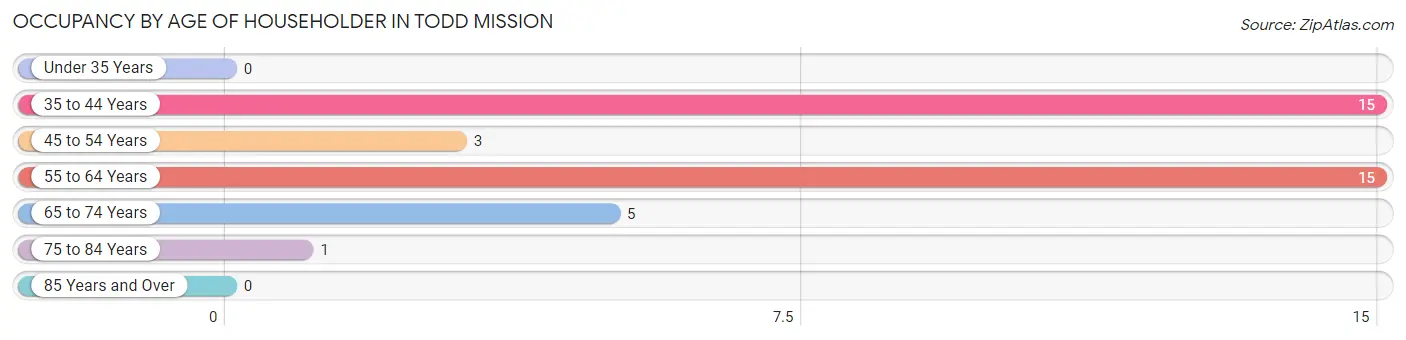
| Age Bracket | # Households | % Households |
| Under 35 Years | 0 | 0.0% |
| 35 to 44 Years | 15 | 38.5% |
| 45 to 54 Years | 3 | 7.7% |
| 55 to 64 Years | 15 | 38.5% |
| 65 to 74 Years | 5 | 12.8% |
| 75 to 84 Years | 1 | 2.6% |
| 85 Years and Over | 0 | 0.0% |
| Total | 39 | 100.0% |
Housing Finances in Todd Mission
Median Income by Occupancy in Todd Mission
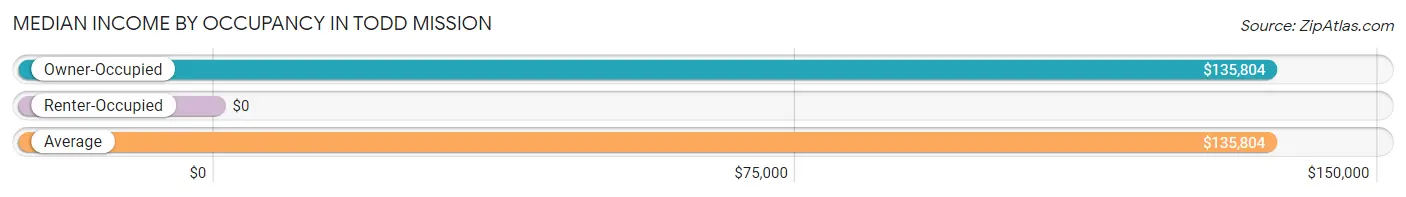
| Occupancy Type | # Households | Median Income |
| Owner-Occupied | 39 (100.0%) | $135,804 |
| Renter-Occupied | 0 (0.0%) | $0 |
| Average | 39 (100.0%) | $135,804 |
Occupancy by Householder Income Bracket in Todd Mission
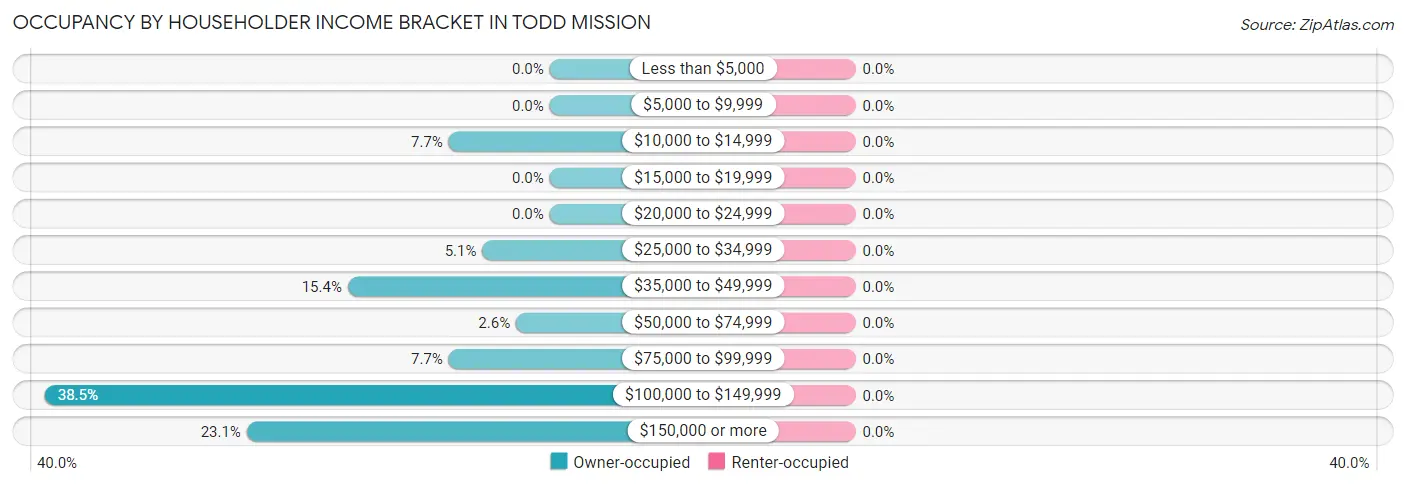
| Income Bracket | Owner-occupied | Renter-occupied |
| Less than $5,000 | 0 (0.0%) | 0 (0.0%) |
| $5,000 to $9,999 | 0 (0.0%) | 0 (0.0%) |
| $10,000 to $14,999 | 3 (7.7%) | 0 (0.0%) |
| $15,000 to $19,999 | 0 (0.0%) | 0 (0.0%) |
| $20,000 to $24,999 | 0 (0.0%) | 0 (0.0%) |
| $25,000 to $34,999 | 2 (5.1%) | 0 (0.0%) |
| $35,000 to $49,999 | 6 (15.4%) | 0 (0.0%) |
| $50,000 to $74,999 | 1 (2.6%) | 0 (0.0%) |
| $75,000 to $99,999 | 3 (7.7%) | 0 (0.0%) |
| $100,000 to $149,999 | 15 (38.5%) | 0 (0.0%) |
| $150,000 or more | 9 (23.1%) | 0 (0.0%) |
| Total | 39 (100.0%) | 0 (0.0%) |
Monthly Housing Cost Tiers in Todd Mission
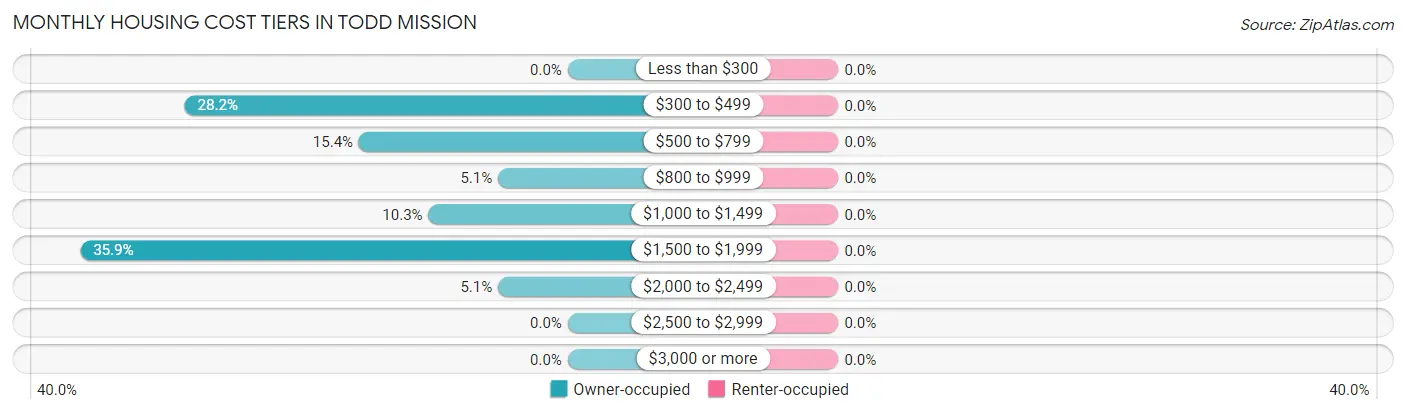
| Monthly Cost | Owner-occupied | Renter-occupied |
| Less than $300 | 0 (0.0%) | 0 (0.0%) |
| $300 to $499 | 11 (28.2%) | 0 (0.0%) |
| $500 to $799 | 6 (15.4%) | 0 (0.0%) |
| $800 to $999 | 2 (5.1%) | 0 (0.0%) |
| $1,000 to $1,499 | 4 (10.3%) | 0 (0.0%) |
| $1,500 to $1,999 | 14 (35.9%) | 0 (0.0%) |
| $2,000 to $2,499 | 2 (5.1%) | 0 (0.0%) |
| $2,500 to $2,999 | 0 (0.0%) | 0 (0.0%) |
| $3,000 or more | 0 (0.0%) | 0 (0.0%) |
| Total | 39 (100.0%) | 0 (0.0%) |
Physical Housing Characteristics in Todd Mission
Housing Structures in Todd Mission
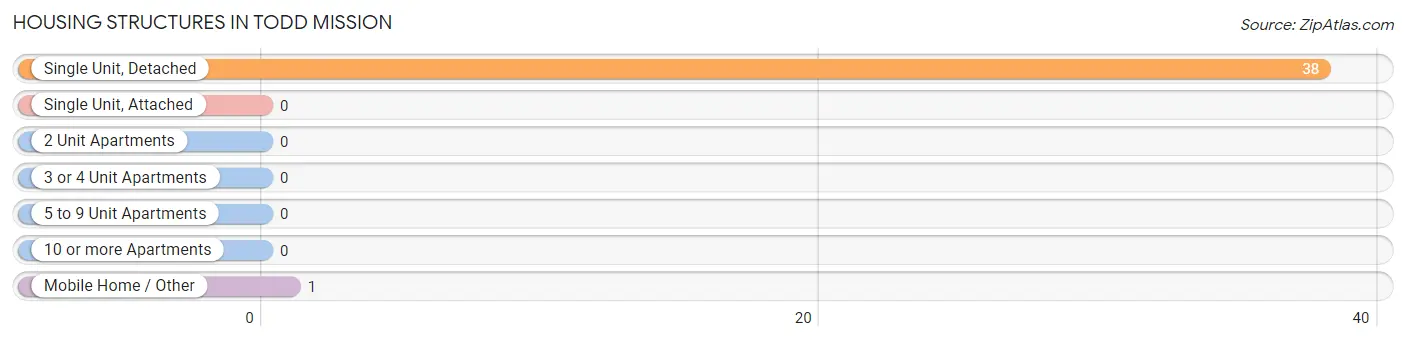
| Structure Type | # Housing Units | % Housing Units |
| Single Unit, Detached | 38 | 97.4% |
| Single Unit, Attached | 0 | 0.0% |
| 2 Unit Apartments | 0 | 0.0% |
| 3 or 4 Unit Apartments | 0 | 0.0% |
| 5 to 9 Unit Apartments | 0 | 0.0% |
| 10 or more Apartments | 0 | 0.0% |
| Mobile Home / Other | 1 | 2.6% |
| Total | 39 | 100.0% |
Housing Structures by Occupancy in Todd Mission
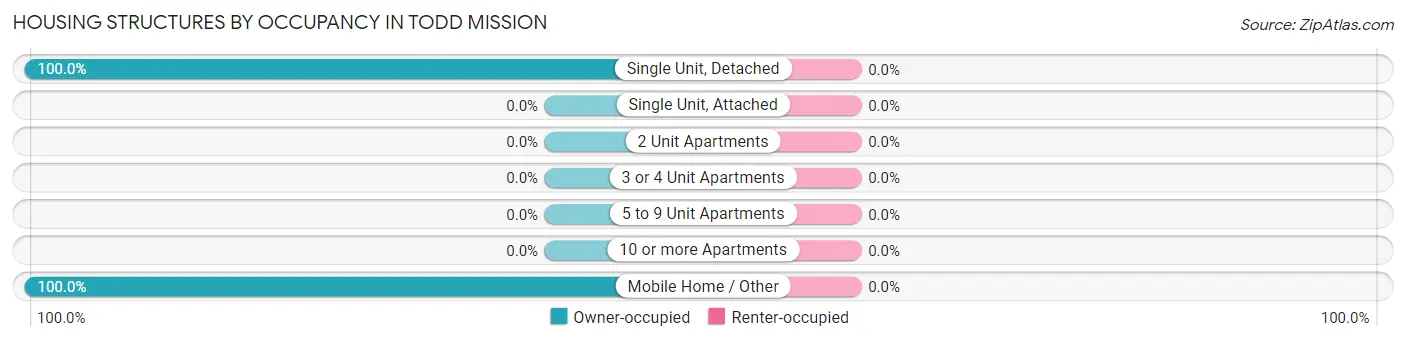
| Structure Type | Owner-occupied | Renter-occupied |
| Single Unit, Detached | 38 (100.0%) | 0 (0.0%) |
| Single Unit, Attached | 0 (0.0%) | 0 (0.0%) |
| 2 Unit Apartments | 0 (0.0%) | 0 (0.0%) |
| 3 or 4 Unit Apartments | 0 (0.0%) | 0 (0.0%) |
| 5 to 9 Unit Apartments | 0 (0.0%) | 0 (0.0%) |
| 10 or more Apartments | 0 (0.0%) | 0 (0.0%) |
| Mobile Home / Other | 1 (100.0%) | 0 (0.0%) |
| Total | 39 (100.0%) | 0 (0.0%) |
Housing Structures by Number of Rooms in Todd Mission
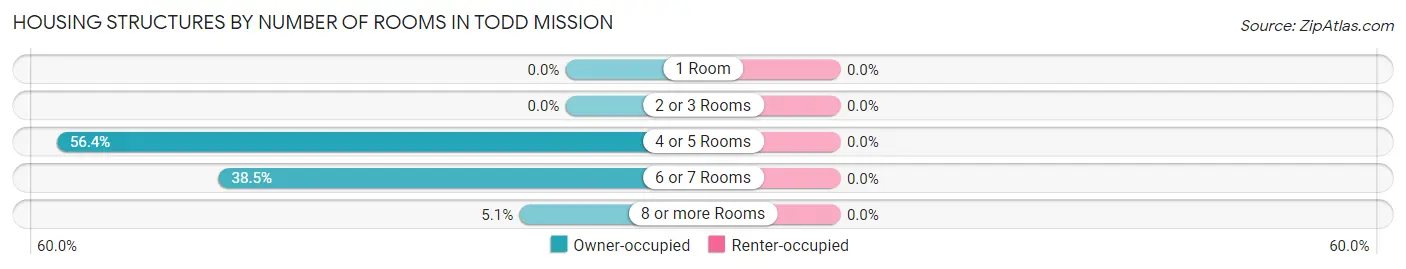
| Number of Rooms | Owner-occupied | Renter-occupied |
| 1 Room | 0 (0.0%) | 0 (0.0%) |
| 2 or 3 Rooms | 0 (0.0%) | 0 (0.0%) |
| 4 or 5 Rooms | 22 (56.4%) | 0 (0.0%) |
| 6 or 7 Rooms | 15 (38.5%) | 0 (0.0%) |
| 8 or more Rooms | 2 (5.1%) | 0 (0.0%) |
| Total | 39 (100.0%) | 0 (0.0%) |
Housing Structure by Heating Type in Todd Mission
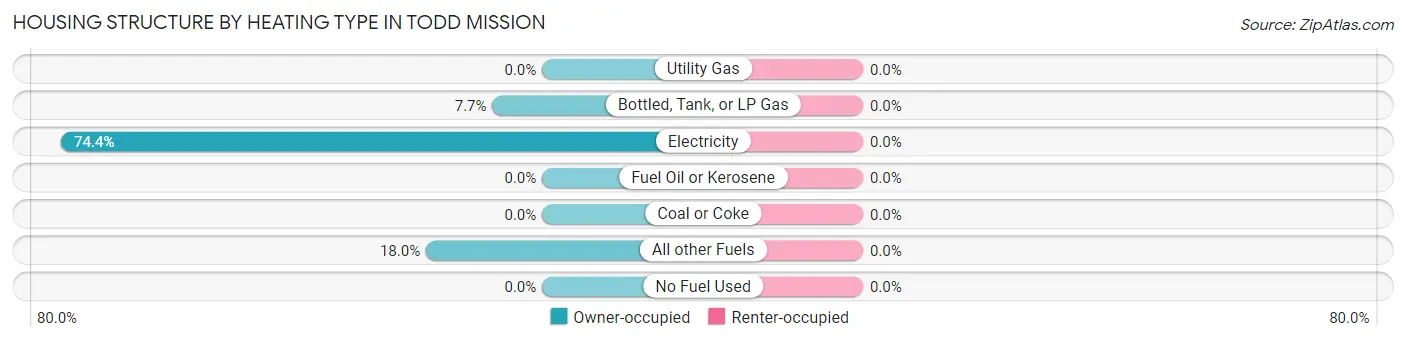
| Heating Type | Owner-occupied | Renter-occupied |
| Utility Gas | 0 (0.0%) | 0 (0.0%) |
| Bottled, Tank, or LP Gas | 3 (7.7%) | 0 (0.0%) |
| Electricity | 29 (74.4%) | 0 (0.0%) |
| Fuel Oil or Kerosene | 0 (0.0%) | 0 (0.0%) |
| Coal or Coke | 0 (0.0%) | 0 (0.0%) |
| All other Fuels | 7 (17.9%) | 0 (0.0%) |
| No Fuel Used | 0 (0.0%) | 0 (0.0%) |
| Total | 39 (100.0%) | 0 (0.0%) |
Household Vehicle Usage in Todd Mission
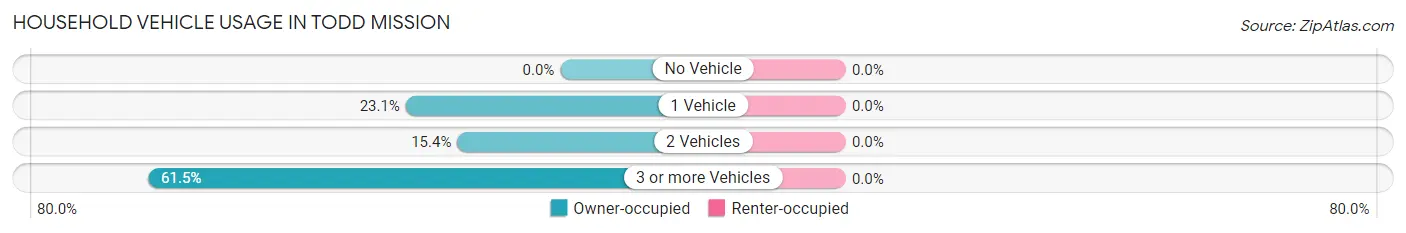
| Vehicles per Household | Owner-occupied | Renter-occupied |
| No Vehicle | 0 (0.0%) | 0 (0.0%) |
| 1 Vehicle | 9 (23.1%) | 0 (0.0%) |
| 2 Vehicles | 6 (15.4%) | 0 (0.0%) |
| 3 or more Vehicles | 24 (61.5%) | 0 (0.0%) |
| Total | 39 (100.0%) | 0 (0.0%) |
Real Estate & Mortgages in Todd Mission
Real Estate and Mortgage Overview in Todd Mission
| Characteristic | Without Mortgage | With Mortgage |
| Housing Units | 18 | 21 |
| Median Property Value | $266,700 | $219,600 |
| Median Household Income | - | - |
| Monthly Housing Costs | $480 | $0 |
| Real Estate Taxes | $1,429 | $0 |
Property Value by Mortgage Status in Todd Mission
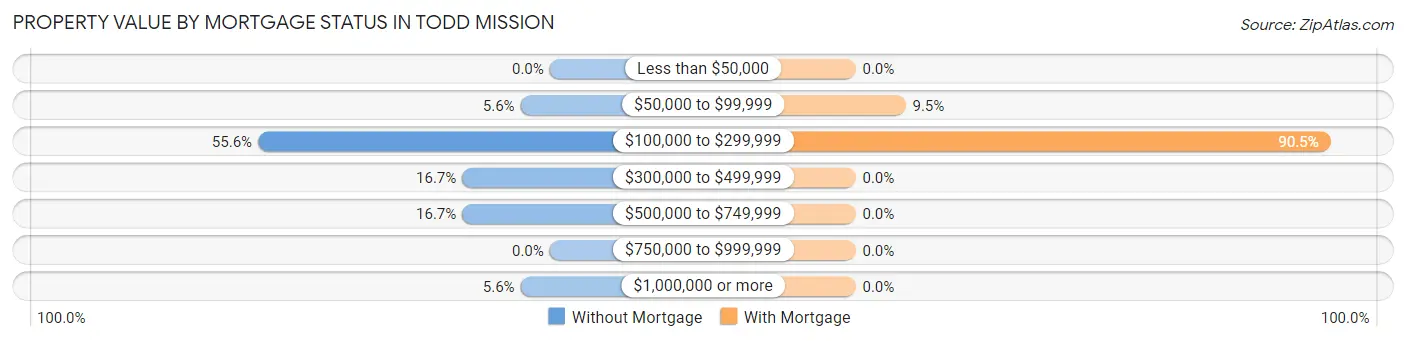
| Property Value | Without Mortgage | With Mortgage |
| Less than $50,000 | 0 (0.0%) | 0 (0.0%) |
| $50,000 to $99,999 | 1 (5.6%) | 2 (9.5%) |
| $100,000 to $299,999 | 10 (55.6%) | 19 (90.5%) |
| $300,000 to $499,999 | 3 (16.7%) | 0 (0.0%) |
| $500,000 to $749,999 | 3 (16.7%) | 0 (0.0%) |
| $750,000 to $999,999 | 0 (0.0%) | 0 (0.0%) |
| $1,000,000 or more | 1 (5.6%) | 0 (0.0%) |
| Total | 18 (100.0%) | 21 (100.0%) |
Household Income by Mortgage Status in Todd Mission
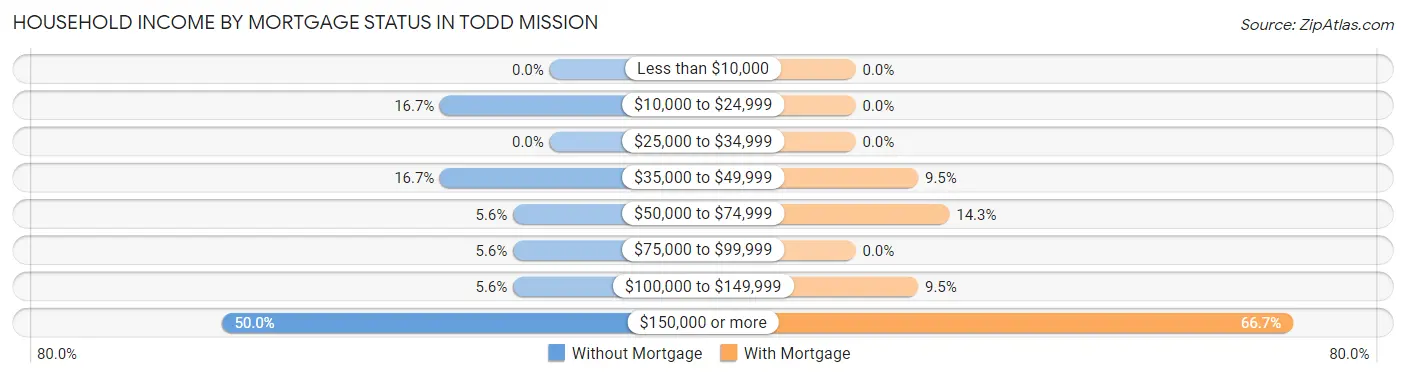
| Household Income | Without Mortgage | With Mortgage |
| Less than $10,000 | 0 (0.0%) | 0 (0.0%) |
| $10,000 to $24,999 | 3 (16.7%) | 0 (0.0%) |
| $25,000 to $34,999 | 0 (0.0%) | 0 (0.0%) |
| $35,000 to $49,999 | 3 (16.7%) | 2 (9.5%) |
| $50,000 to $74,999 | 1 (5.6%) | 3 (14.3%) |
| $75,000 to $99,999 | 1 (5.6%) | 0 (0.0%) |
| $100,000 to $149,999 | 1 (5.6%) | 2 (9.5%) |
| $150,000 or more | 9 (50.0%) | 14 (66.7%) |
| Total | 18 (100.0%) | 21 (100.0%) |
Property Value to Household Income Ratio in Todd Mission
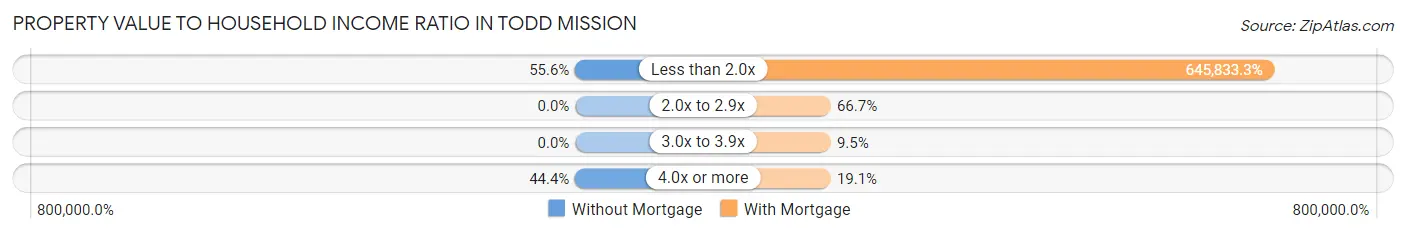
| Value-to-Income Ratio | Without Mortgage | With Mortgage |
| Less than 2.0x | 10 (55.6%) | 135,625 (645,833.3%) |
| 2.0x to 2.9x | 0 (0.0%) | 14 (66.7%) |
| 3.0x to 3.9x | 0 (0.0%) | 2 (9.5%) |
| 4.0x or more | 8 (44.4%) | 4 (19.1%) |
| Total | 18 (100.0%) | 21 (100.0%) |
Real Estate Taxes by Mortgage Status in Todd Mission
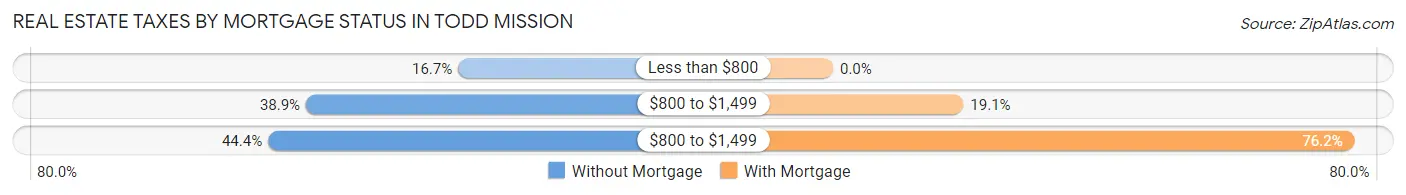
| Property Taxes | Without Mortgage | With Mortgage |
| Less than $800 | 3 (16.7%) | 0 (0.0%) |
| $800 to $1,499 | 7 (38.9%) | 4 (19.1%) |
| $800 to $1,499 | 8 (44.4%) | 16 (76.2%) |
| Total | 18 (100.0%) | 21 (100.0%) |
Health & Disability in Todd Mission
Health Insurance Coverage by Age in Todd Mission
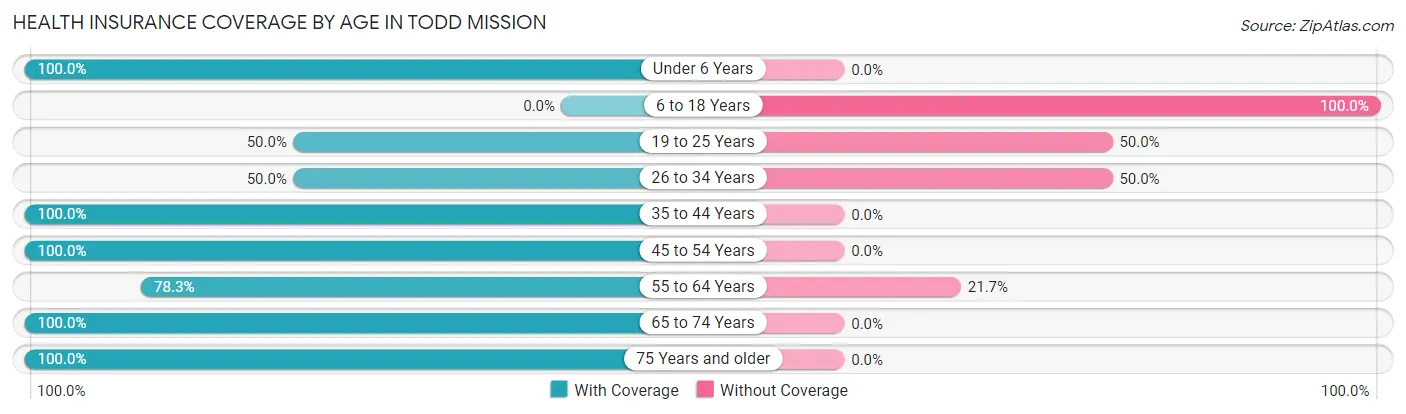
| Age Bracket | With Coverage | Without Coverage |
| Under 6 Years | 30 (100.0%) | 0 (0.0%) |
| 6 to 18 Years | 0 (0.0%) | 3 (100.0%) |
| 19 to 25 Years | 7 (50.0%) | 7 (50.0%) |
| 26 to 34 Years | 2 (50.0%) | 2 (50.0%) |
| 35 to 44 Years | 47 (100.0%) | 0 (0.0%) |
| 45 to 54 Years | 3 (100.0%) | 0 (0.0%) |
| 55 to 64 Years | 18 (78.3%) | 5 (21.7%) |
| 65 to 74 Years | 8 (100.0%) | 0 (0.0%) |
| 75 Years and older | 1 (100.0%) | 0 (0.0%) |
| Total | 116 (87.2%) | 17 (12.8%) |
Health Insurance Coverage by Citizenship Status in Todd Mission
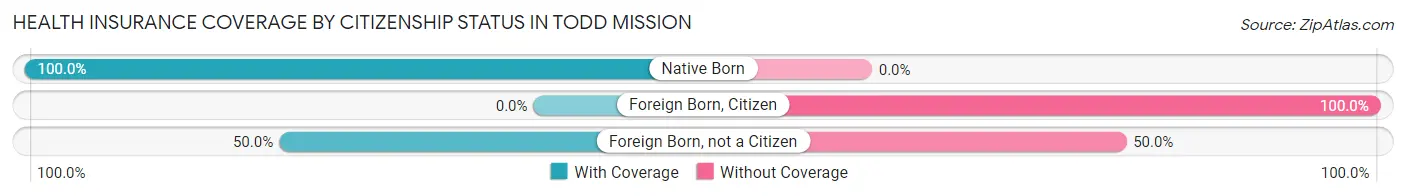
| Citizenship Status | With Coverage | Without Coverage |
| Native Born | 30 (100.0%) | 0 (0.0%) |
| Foreign Born, Citizen | 0 (0.0%) | 3 (100.0%) |
| Foreign Born, not a Citizen | 7 (50.0%) | 7 (50.0%) |
Health Insurance Coverage by Household Income in Todd Mission
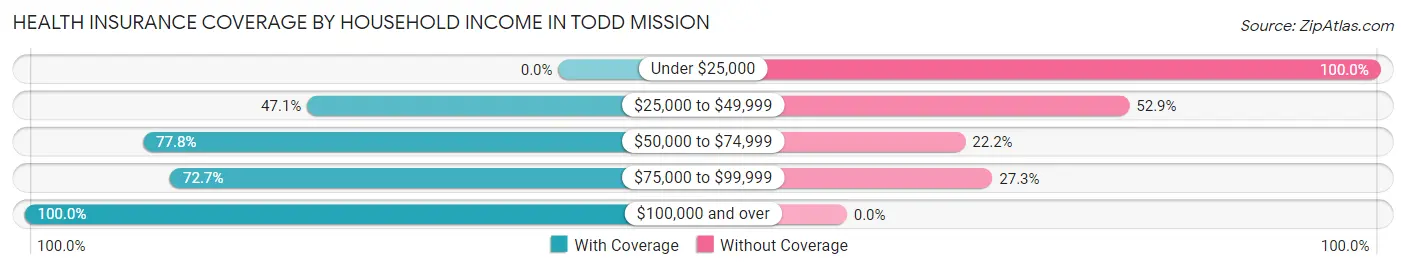
| Household Income | With Coverage | Without Coverage |
| Under $25,000 | 0 (0.0%) | 3 (100.0%) |
| $25,000 to $49,999 | 8 (47.1%) | 9 (52.9%) |
| $50,000 to $74,999 | 7 (77.8%) | 2 (22.2%) |
| $75,000 to $99,999 | 8 (72.7%) | 3 (27.3%) |
| $100,000 and over | 93 (100.0%) | 0 (0.0%) |
Public vs Private Health Insurance Coverage by Age in Todd Mission
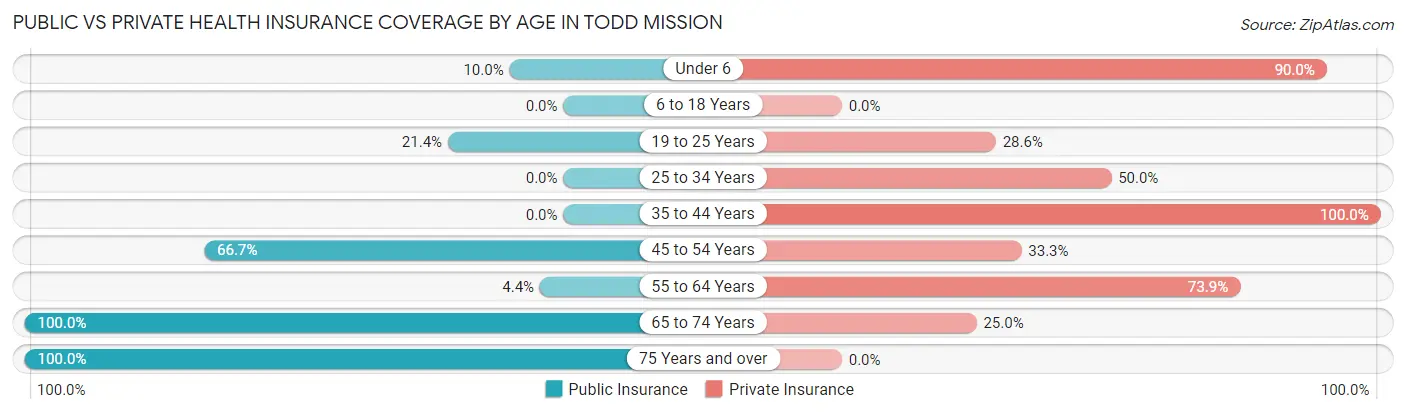
| Age Bracket | Public Insurance | Private Insurance |
| Under 6 | 3 (10.0%) | 27 (90.0%) |
| 6 to 18 Years | 0 (0.0%) | 0 (0.0%) |
| 19 to 25 Years | 3 (21.4%) | 4 (28.6%) |
| 25 to 34 Years | 0 (0.0%) | 2 (50.0%) |
| 35 to 44 Years | 0 (0.0%) | 47 (100.0%) |
| 45 to 54 Years | 2 (66.7%) | 1 (33.3%) |
| 55 to 64 Years | 1 (4.3%) | 17 (73.9%) |
| 65 to 74 Years | 8 (100.0%) | 2 (25.0%) |
| 75 Years and over | 1 (100.0%) | 0 (0.0%) |
| Total | 18 (13.5%) | 100 (75.2%) |
Disability Status by Sex by Age in Todd Mission
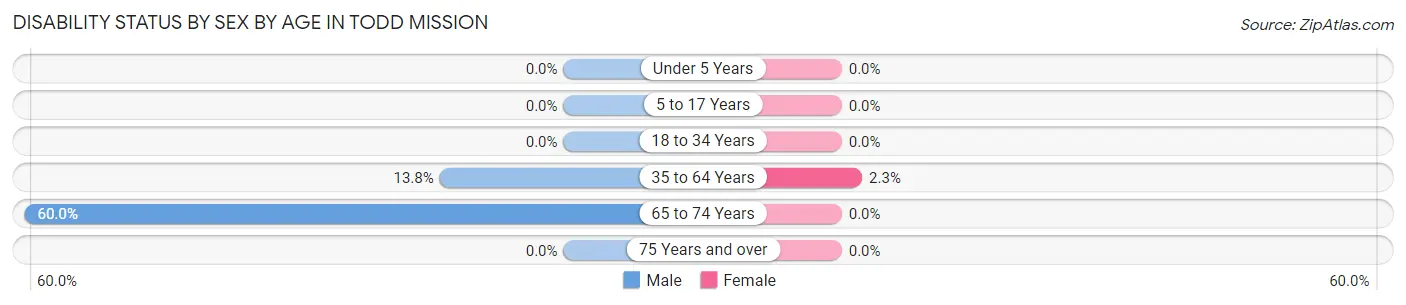
| Age Bracket | Male | Female |
| Under 5 Years | 0 (0.0%) | 0 (0.0%) |
| 5 to 17 Years | 0 (0.0%) | 0 (0.0%) |
| 18 to 34 Years | 0 (0.0%) | 0 (0.0%) |
| 35 to 64 Years | 4 (13.8%) | 1 (2.3%) |
| 65 to 74 Years | 3 (60.0%) | 0 (0.0%) |
| 75 Years and over | 0 (0.0%) | 0 (0.0%) |
Disability Class by Sex by Age in Todd Mission
Disability Class: Hearing Difficulty
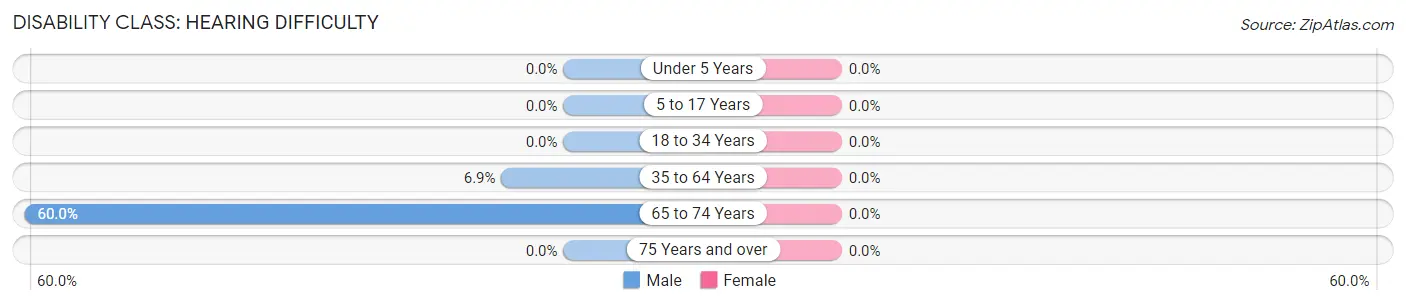
| Age Bracket | Male | Female |
| Under 5 Years | 0 (0.0%) | 0 (0.0%) |
| 5 to 17 Years | 0 (0.0%) | 0 (0.0%) |
| 18 to 34 Years | 0 (0.0%) | 0 (0.0%) |
| 35 to 64 Years | 2 (6.9%) | 0 (0.0%) |
| 65 to 74 Years | 3 (60.0%) | 0 (0.0%) |
| 75 Years and over | 0 (0.0%) | 0 (0.0%) |
Disability Class: Vision Difficulty
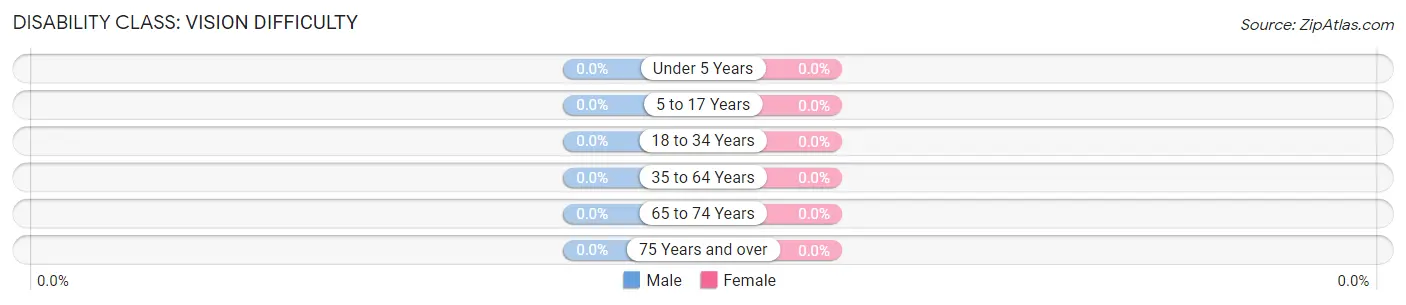
| Age Bracket | Male | Female |
| Under 5 Years | 0 (0.0%) | 0 (0.0%) |
| 5 to 17 Years | 0 (0.0%) | 0 (0.0%) |
| 18 to 34 Years | 0 (0.0%) | 0 (0.0%) |
| 35 to 64 Years | 0 (0.0%) | 0 (0.0%) |
| 65 to 74 Years | 0 (0.0%) | 0 (0.0%) |
| 75 Years and over | 0 (0.0%) | 0 (0.0%) |
Disability Class: Cognitive Difficulty
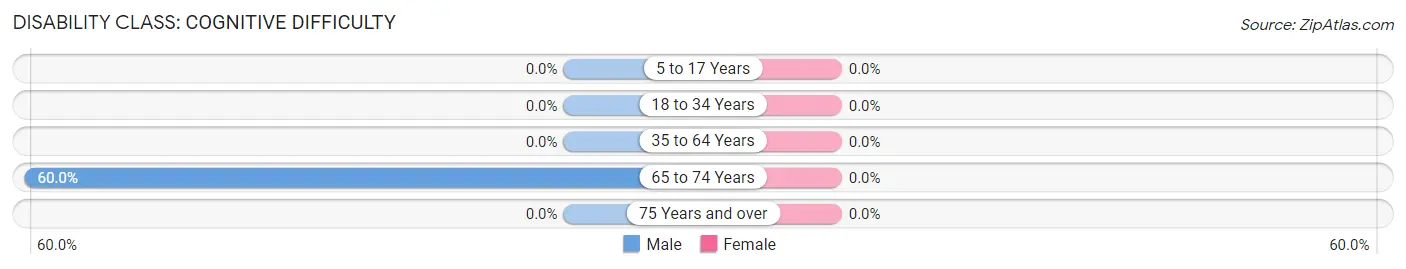
| Age Bracket | Male | Female |
| 5 to 17 Years | 0 (0.0%) | 0 (0.0%) |
| 18 to 34 Years | 0 (0.0%) | 0 (0.0%) |
| 35 to 64 Years | 0 (0.0%) | 0 (0.0%) |
| 65 to 74 Years | 3 (60.0%) | 0 (0.0%) |
| 75 Years and over | 0 (0.0%) | 0 (0.0%) |
Disability Class: Ambulatory Difficulty
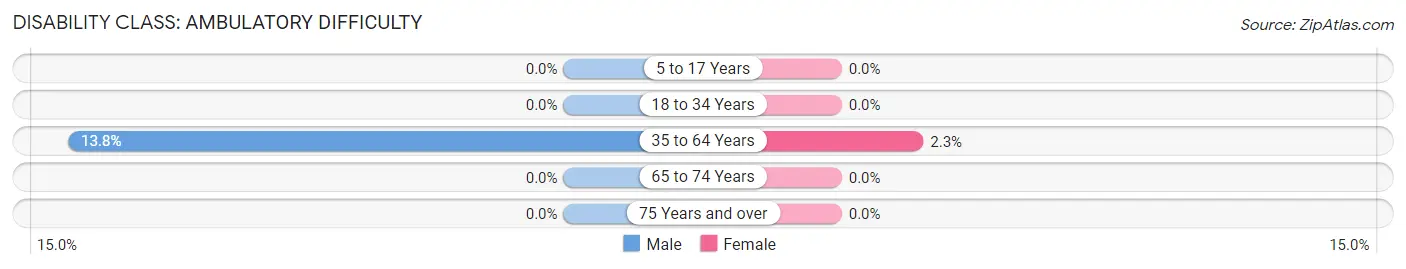
| Age Bracket | Male | Female |
| 5 to 17 Years | 0 (0.0%) | 0 (0.0%) |
| 18 to 34 Years | 0 (0.0%) | 0 (0.0%) |
| 35 to 64 Years | 4 (13.8%) | 1 (2.3%) |
| 65 to 74 Years | 0 (0.0%) | 0 (0.0%) |
| 75 Years and over | 0 (0.0%) | 0 (0.0%) |
Disability Class: Self-Care Difficulty
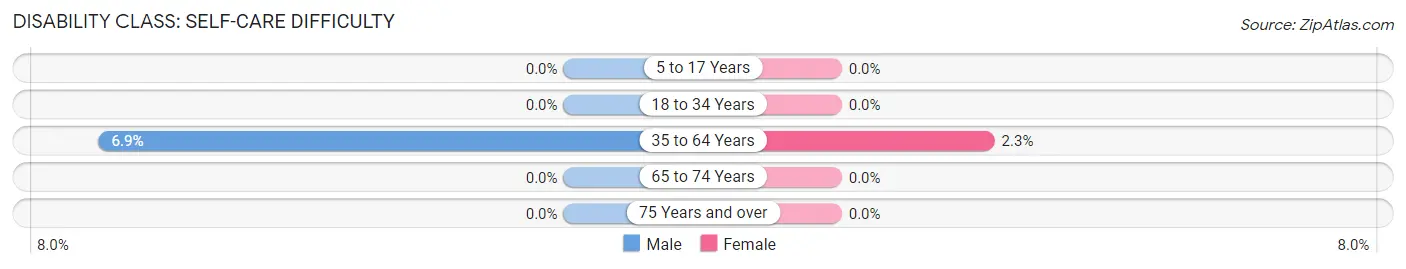
| Age Bracket | Male | Female |
| 5 to 17 Years | 0 (0.0%) | 0 (0.0%) |
| 18 to 34 Years | 0 (0.0%) | 0 (0.0%) |
| 35 to 64 Years | 2 (6.9%) | 1 (2.3%) |
| 65 to 74 Years | 0 (0.0%) | 0 (0.0%) |
| 75 Years and over | 0 (0.0%) | 0 (0.0%) |
Technology Access in Todd Mission
Computing Device Access in Todd Mission
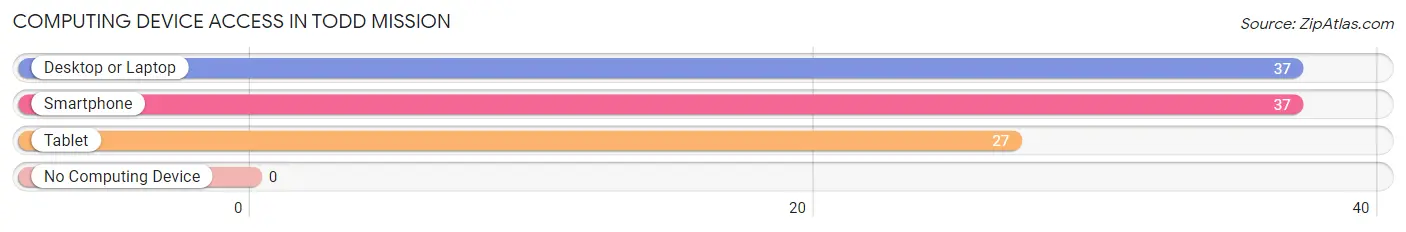
| Device Type | # Households | % Households |
| Desktop or Laptop | 37 | 94.9% |
| Smartphone | 37 | 94.9% |
| Tablet | 27 | 69.2% |
| No Computing Device | 0 | 0.0% |
| Total | 39 | 100.0% |
Internet Access in Todd Mission
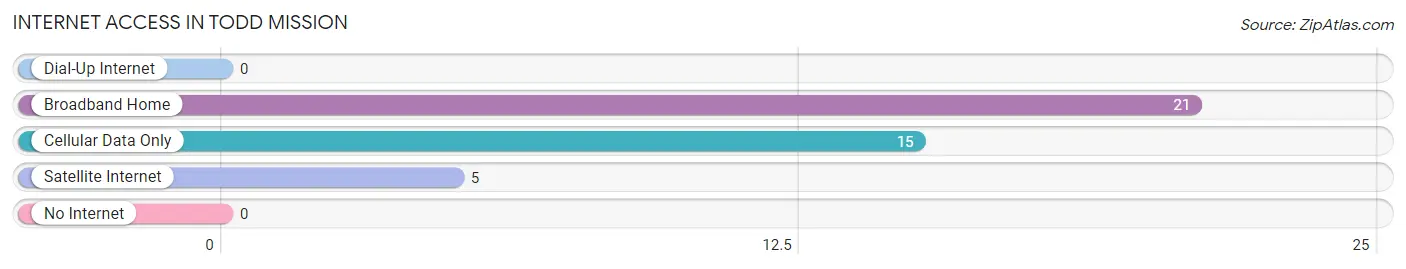
| Internet Type | # Households | % Households |
| Dial-Up Internet | 0 | 0.0% |
| Broadband Home | 21 | 53.8% |
| Cellular Data Only | 15 | 38.5% |
| Satellite Internet | 5 | 12.8% |
| No Internet | 0 | 0.0% |
| Total | 39 | 100.0% |
Todd Mission Summary
Mission, Texas is a city located in Hidalgo County, Texas, United States. It is part of the McAllen–Edinburg–Mission and Reynosa–McAllen metropolitan areas. The population was 77,058 at the 2010 census and an estimated 84,331 in 2019. Mission is one of the principal cities of the McAllen–Edinburg–Mission metropolitan area.
History
Mission was founded in 1846 by settlers from the Rio Grande Valley. The city was named after the Spanish mission Nuestra Señora de Guadalupe de Jesús, which was founded in 1757. The mission was abandoned in 1758, but the city of Mission was established in 1846.
The city was originally part of the Nueces County, but was annexed by Hidalgo County in 1852. In the late 19th century, Mission was a small farming community. The city was incorporated in 1907 and began to grow rapidly in the early 20th century.
Geography
Mission is located at 26°12′N 98°19′W (26.20, -98.32). According to the United States Census Bureau, the city has a total area of 24.2 square miles (62.7 km2), of which 24.1 square miles (62.4 km2) is land and 0.1 square miles (0.3 km2) (0.41%) is water.
Economy
Mission is a major economic center in the Rio Grande Valley. The city is home to several large employers, including Mission Regional Medical Center, Mission Consolidated Independent School District, and Mission Foods. The city is also home to several retail stores, restaurants, and other businesses.
Demographics
As of the 2010 census, there were 77,058 people, 22,845 households, and 18,845 families residing in the city. The population density was 3,189.2 people per square mile (1,228.7/km2). There were 24,844 housing units at an average density of 1,023.3 per square mile (395.2/km2). The racial makeup of the city was 77.2% White, 0.7% African American, 0.5% Native American, 0.5% Asian, 0.1% Pacific Islander, 19.3% from other races, and 2.7% from two or more races. Hispanic or Latino of any race were 93.2% of the population.
Out of the 22,845 households, 44.2% had children under the age of 18 living with them, 57.2% were married couples living together, 16.7% had a female householder with no husband present, and 20.3% were non-families. 16.2% of all households were made up of individuals, and 6.7% had someone living alone who was 65 years of age or older. The average household size was 3.33 and the average family size was 3.76.
In the city, the population was spread out, with 33.2% under the age of 18, 10.7% from 18 to 24, 28.2% from 25 to 44, 18.7% from 45 to 64, and 9.2% who were 65 years of age or older. The median age was 29 years. For every 100 females, there were 93.2 males. For every 100 females age 18 and over, there were 88.7 males.
The median income for a household in the city was $30,917, and the median income for a family was $33,945. Males had a median income of $25,845 versus $20,845 for females. The per capita income for the city was $12,890. About 22.2% of families and 25.3% of the population were below the poverty line, including 33.3% of those under age 18 and 20.2% of those age 65 or over.
Common Questions
What is the Total Population of Todd Mission?
Total Population of Todd Mission is 133.
What is the Total Male Population of Todd Mission?
Total Male Population of Todd Mission is 74.
What is the Total Female Population of Todd Mission?
Total Female Population of Todd Mission is 59.
What is the Ratio of Males per 100 Females in Todd Mission?
There are 125.42 Males per 100 Females in Todd Mission.
What is the Ratio of Females per 100 Males in Todd Mission?
There are 79.73 Females per 100 Males in Todd Mission.
What is the Median Population Age in Todd Mission?
Median Population Age in Todd Mission is 39.0 Years.
What is the Average Family Size in Todd Mission
Average Family Size in Todd Mission is 4.3 People.
What is the Average Household Size in Todd Mission
Average Household Size in Todd Mission is 3.4 People.
What is Per Capita Income in Todd Mission?
Per Capita income in Todd Mission is $50,850.
What is the Median Household income in Todd Mission?
Median Household Income in Todd Mission is $135,804.
What is Inequality or Gini Index in Todd Mission?
Inequality or Gini Index in Todd Mission is 0.40.
How Large is the Labor Force in Todd Mission?
There are 81 People in the Labor Forcein in Todd Mission.
What is the Percentage of People in the Labor Force in Todd Mission?
78.6% of People are in the Labor Force in Todd Mission.