West Livingston, TX
West Livingston Map
West Livingston Overview
7,559
TOTAL POPULATION
5,527
MALE POPULATION
2,032
FEMALE POPULATION
272.00
MALES / 100 FEMALES
36.76
FEMALES / 100 MALES
38.7
MEDIAN AGE
3.2
AVG FAMILY SIZE
2.8
AVG HOUSEHOLD SIZE
$17,135
PER CAPITA INCOME
$66,250
AVG FAMILY INCOME
$62,500
AVG HOUSEHOLD INCOME
16.6%
WAGE / INCOME GAP [ % ]
83.4¢/ $1
WAGE / INCOME GAP [ $ ]
0.47
INEQUALITY / GINI INDEX
1,670
LABOR FORCE [ PEOPLE ]
25.3%
PERCENT IN LABOR FORCE
10.3%
UNEMPLOYMENT RATE
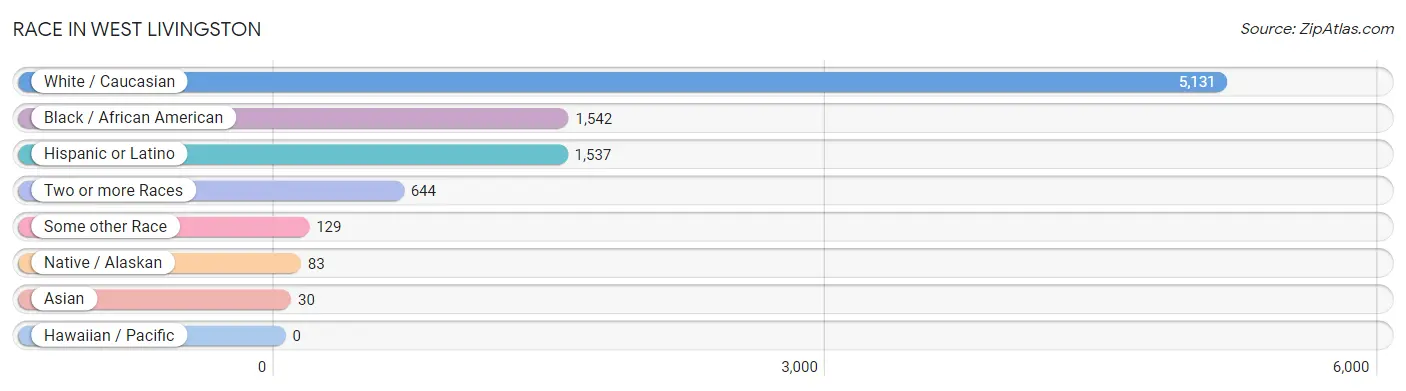
Race in West Livingston
The most populous races in West Livingston are White / Caucasian (5,131 | 67.9%), Black / African American (1,542 | 20.4%), and Hispanic or Latino (1,537 | 20.3%).
| Race | # Population | % Population |
| Asian | 30 | 0.4% |
| Black / African American | 1,542 | 20.4% |
| Hawaiian / Pacific | 0 | 0.0% |
| Hispanic or Latino | 1,537 | 20.3% |
| Native / Alaskan | 83 | 1.1% |
| White / Caucasian | 5,131 | 67.9% |
| Two or more Races | 644 | 8.5% |
| Some other Race | 129 | 1.7% |
| Total | 7,559 | 100.0% |
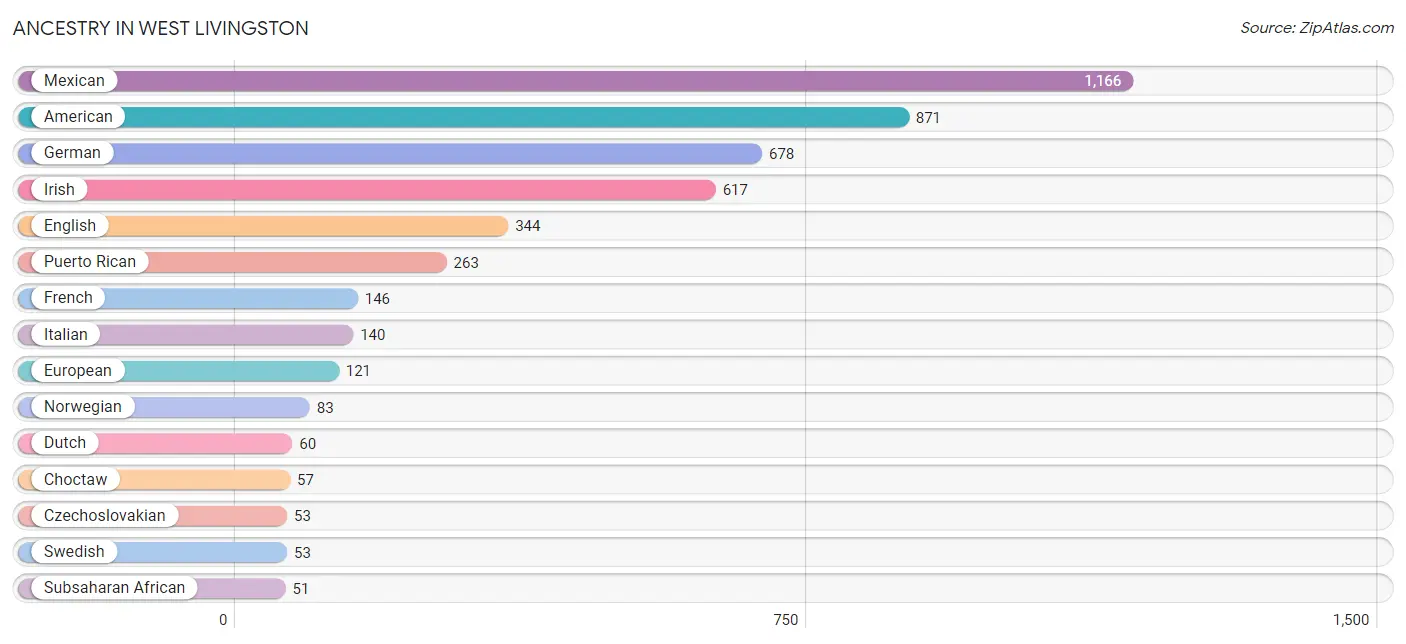
Ancestry in West Livingston
The most populous ancestries reported in West Livingston are Mexican (1,166 | 15.4%), American (871 | 11.5%), German (678 | 9.0%), Irish (617 | 8.2%), and English (344 | 4.5%), together accounting for 48.6% of all West Livingston residents.
| Ancestry | # Population | % Population |
| African | 10 | 0.1% |
| American | 871 | 11.5% |
| Apache | 21 | 0.3% |
| Arab | 22 | 0.3% |
| Blackfeet | 9 | 0.1% |
| British | 23 | 0.3% |
| Central American | 21 | 0.3% |
| Cherokee | 50 | 0.7% |
| Chickasaw | 32 | 0.4% |
| Choctaw | 57 | 0.7% |
| Cuban | 6 | 0.1% |
| Czechoslovakian | 53 | 0.7% |
| Dutch | 60 | 0.8% |
| English | 344 | 4.5% |
| European | 121 | 1.6% |
| French | 146 | 1.9% |
| French Canadian | 22 | 0.3% |
| German | 678 | 9.0% |
| Guatemalan | 15 | 0.2% |
| Guyanese | 11 | 0.2% |
| Haitian | 16 | 0.2% |
| Honduran | 6 | 0.1% |
| Hungarian | 16 | 0.2% |
| Irish | 617 | 8.2% |
| Israeli | 6 | 0.1% |
| Italian | 140 | 1.8% |
| Jamaican | 6 | 0.1% |
| Kenyan | 34 | 0.4% |
| Mexican | 1,166 | 15.4% |
| Moroccan | 22 | 0.3% |
| Norwegian | 83 | 1.1% |
| Pennsylvania German | 7 | 0.1% |
| Polish | 17 | 0.2% |
| Puerto Rican | 263 | 3.5% |
| Russian | 5 | 0.1% |
| Scotch-Irish | 11 | 0.2% |
| Scottish | 37 | 0.5% |
| Somali | 7 | 0.1% |
| Sri Lankan | 30 | 0.4% |
| Subsaharan African | 51 | 0.7% |
| Swedish | 53 | 0.7% |
| Swiss | 25 | 0.3% |
| Thai | 30 | 0.4% |
| Welsh | 24 | 0.3% |
| West Indian | 9 | 0.1% | View All 45 Rows |
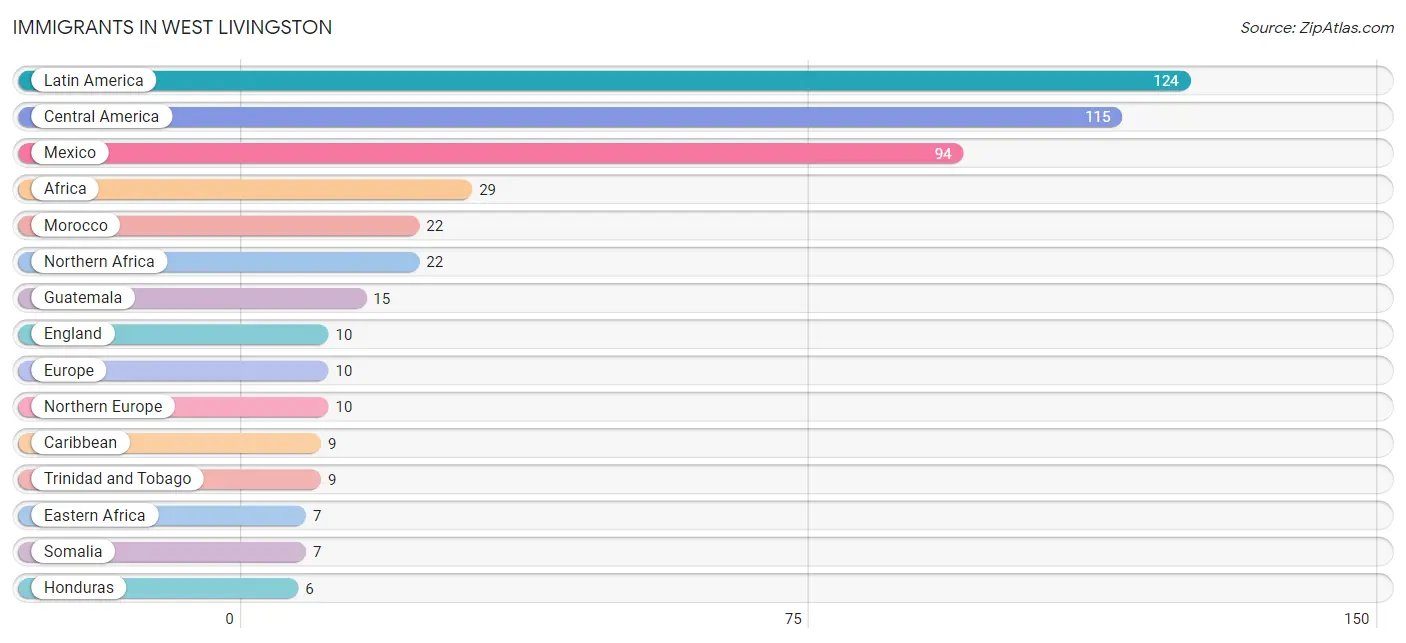
Immigrants in West Livingston
The most numerous immigrant groups reported in West Livingston came from Latin America (124 | 1.6%), Central America (115 | 1.5%), Mexico (94 | 1.2%), Africa (29 | 0.4%), and Morocco (22 | 0.3%), together accounting for 5.1% of all West Livingston residents.
| Immigration Origin | # Population | % Population |
| Africa | 29 | 0.4% |
| Caribbean | 9 | 0.1% |
| Central America | 115 | 1.5% |
| Eastern Africa | 7 | 0.1% |
| England | 10 | 0.1% |
| Europe | 10 | 0.1% |
| Guatemala | 15 | 0.2% |
| Honduras | 6 | 0.1% |
| Latin America | 124 | 1.6% |
| Mexico | 94 | 1.2% |
| Morocco | 22 | 0.3% |
| Northern Africa | 22 | 0.3% |
| Northern Europe | 10 | 0.1% |
| Somalia | 7 | 0.1% |
| Trinidad and Tobago | 9 | 0.1% | View All 15 Rows |
Sex and Age in West Livingston
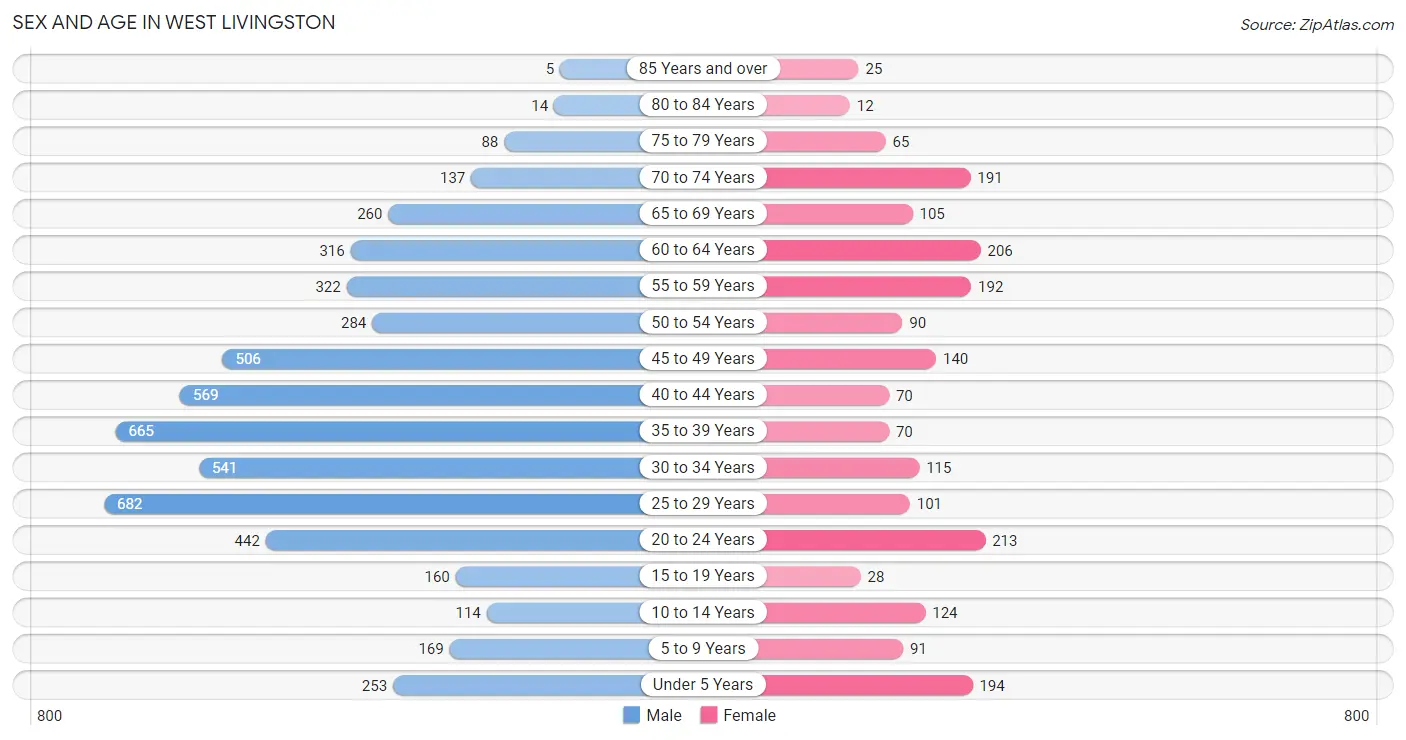
Sex and Age in West Livingston
The most populous age groups in West Livingston are 25 to 29 Years (682 | 12.3%) for men and 20 to 24 Years (213 | 10.5%) for women.
| Age Bracket | Male | Female |
| Under 5 Years | 253 (4.6%) | 194 (9.6%) |
| 5 to 9 Years | 169 (3.1%) | 91 (4.5%) |
| 10 to 14 Years | 114 (2.1%) | 124 (6.1%) |
| 15 to 19 Years | 160 (2.9%) | 28 (1.4%) |
| 20 to 24 Years | 442 (8.0%) | 213 (10.5%) |
| 25 to 29 Years | 682 (12.3%) | 101 (5.0%) |
| 30 to 34 Years | 541 (9.8%) | 115 (5.7%) |
| 35 to 39 Years | 665 (12.0%) | 70 (3.4%) |
| 40 to 44 Years | 569 (10.3%) | 70 (3.4%) |
| 45 to 49 Years | 506 (9.2%) | 140 (6.9%) |
| 50 to 54 Years | 284 (5.1%) | 90 (4.4%) |
| 55 to 59 Years | 322 (5.8%) | 192 (9.5%) |
| 60 to 64 Years | 316 (5.7%) | 206 (10.1%) |
| 65 to 69 Years | 260 (4.7%) | 105 (5.2%) |
| 70 to 74 Years | 137 (2.5%) | 191 (9.4%) |
| 75 to 79 Years | 88 (1.6%) | 65 (3.2%) |
| 80 to 84 Years | 14 (0.3%) | 12 (0.6%) |
| 85 Years and over | 5 (0.1%) | 25 (1.2%) |
| Total | 5,527 (100.0%) | 2,032 (100.0%) |
Families and Households in West Livingston
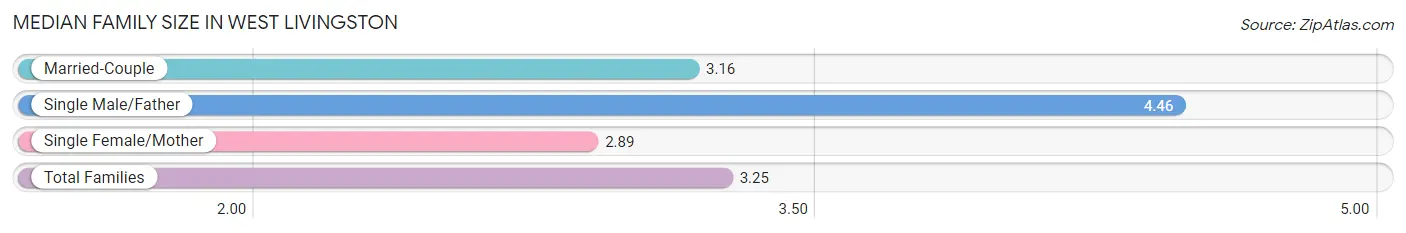
Median Family Size in West Livingston
The median family size in West Livingston is 3.25 persons per family, with single male/father families (115 | 9.9%) accounting for the largest median family size of 4.46 persons per family. On the other hand, single female/mother families (173 | 14.9%) represent the smallest median family size with 2.89 persons per family.
| Family Type | # Families | Family Size |
| Married-Couple | 875 (75.2%) | 3.16 |
| Single Male/Father | 115 (9.9%) | 4.46 |
| Single Female/Mother | 173 (14.9%) | 2.89 |
| Total Families | 1,163 (100.0%) | 3.25 |
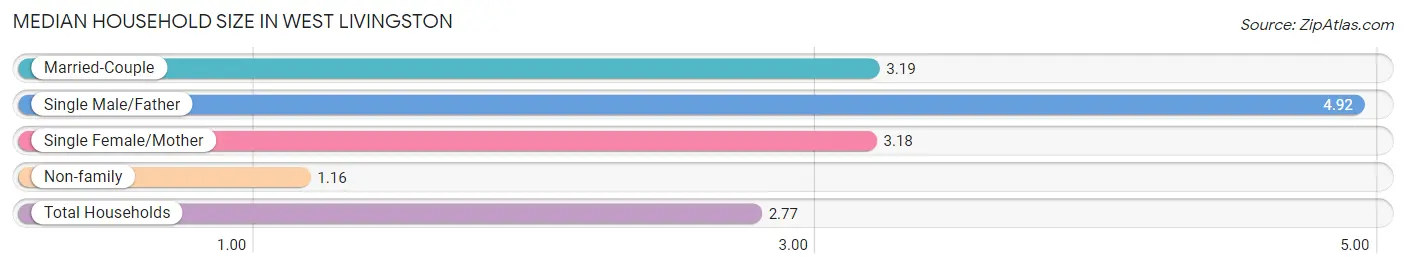
Median Household Size in West Livingston
The median household size in West Livingston is 2.77 persons per household, with single male/father households (115 | 7.3%) accounting for the largest median household size of 4.92 persons per household. non-family households (421 | 26.6%) represent the smallest median household size with 1.16 persons per household.
| Household Type | # Households | Household Size |
| Married-Couple | 875 (55.2%) | 3.19 |
| Single Male/Father | 115 (7.3%) | 4.92 |
| Single Female/Mother | 173 (10.9%) | 3.18 |
| Non-family | 421 (26.6%) | 1.16 |
| Total Households | 1,584 (100.0%) | 2.77 |
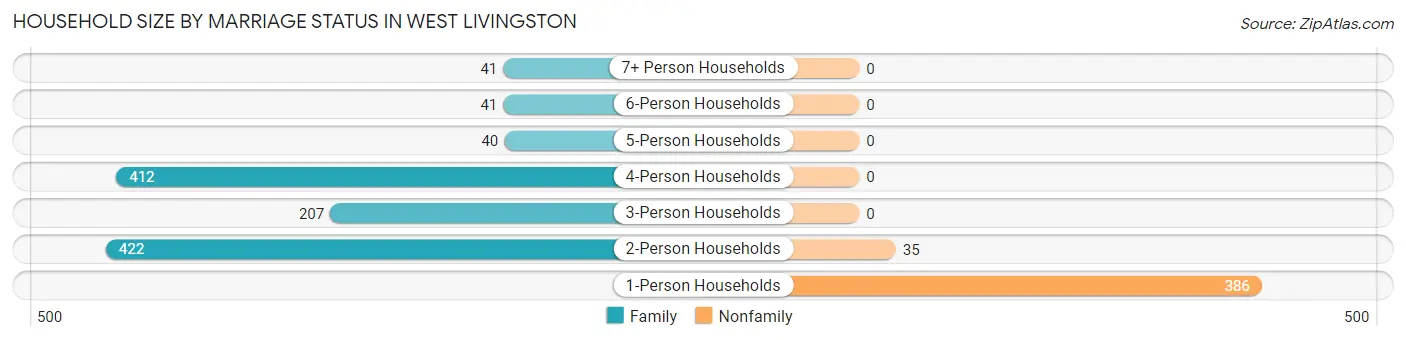
Household Size by Marriage Status in West Livingston
Out of a total of 1,584 households in West Livingston, 1,163 (73.4%) are family households, while 421 (26.6%) are nonfamily households. The most numerous type of family households are 2-person households, comprising 422, and the most common type of nonfamily households are 1-person households, comprising 386.
| Household Size | Family Households | Nonfamily Households |
| 1-Person Households | - | 386 (24.4%) |
| 2-Person Households | 422 (26.6%) | 35 (2.2%) |
| 3-Person Households | 207 (13.1%) | 0 (0.0%) |
| 4-Person Households | 412 (26.0%) | 0 (0.0%) |
| 5-Person Households | 40 (2.5%) | 0 (0.0%) |
| 6-Person Households | 41 (2.6%) | 0 (0.0%) |
| 7+ Person Households | 41 (2.6%) | 0 (0.0%) |
| Total | 1,163 (73.4%) | 421 (26.6%) |
Female Fertility in West Livingston
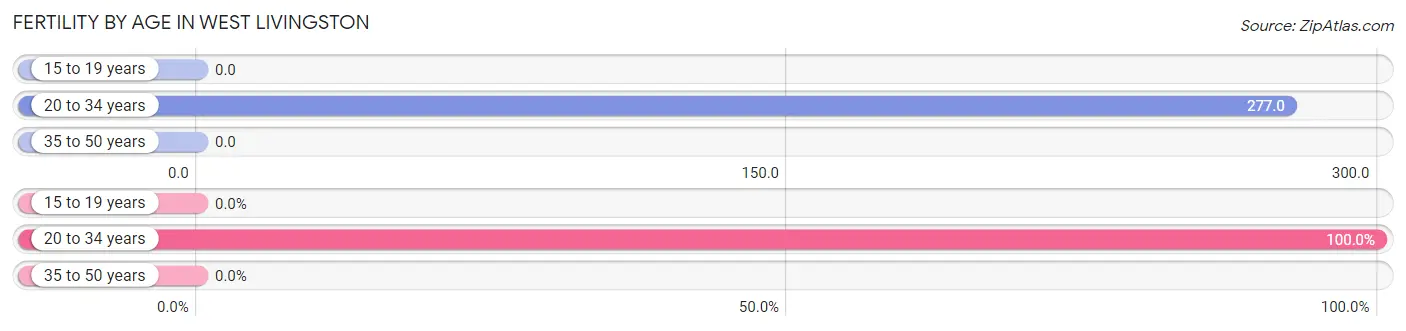
Fertility by Age in West Livingston
Average fertility rate in West Livingston is 161.0 births per 1,000 women. Women in the age bracket of 20 to 34 years have the highest fertility rate with 277.0 births per 1,000 women. Women in the age bracket of 20 to 34 years acount for 100.0% of all women with births.
| Age Bracket | Women with Births | Births / 1,000 Women |
| 15 to 19 years | 0 (0.0%) | 0.0 |
| 20 to 34 years | 119 (100.0%) | 277.0 |
| 35 to 50 years | 0 (0.0%) | 0.0 |
| Total | 119 (100.0%) | 161.0 |
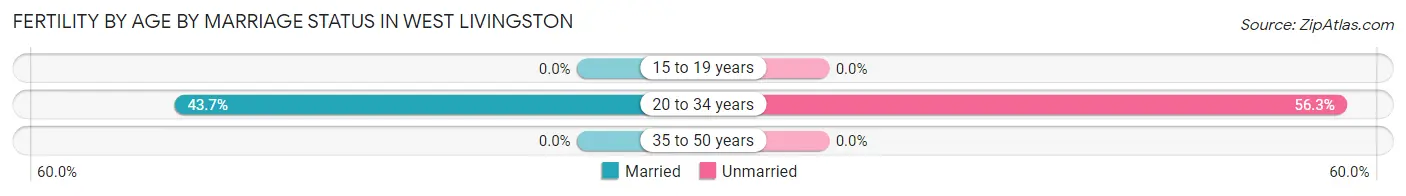
Fertility by Age by Marriage Status in West Livingston
43.7% of women with births (119) in West Livingston are married. The highest percentage of unmarried women with births falls into 20 to 34 years age bracket with 56.3% of them unmarried at the time of birth, while the lowest percentage of unmarried women with births belong to 20 to 34 years age bracket with 56.3% of them unmarried.
| Age Bracket | Married | Unmarried |
| 15 to 19 years | 0 (0.0%) | 0 (0.0%) |
| 20 to 34 years | 52 (43.7%) | 67 (56.3%) |
| 35 to 50 years | 0 (0.0%) | 0 (0.0%) |
| Total | 52 (43.7%) | 67 (56.3%) |
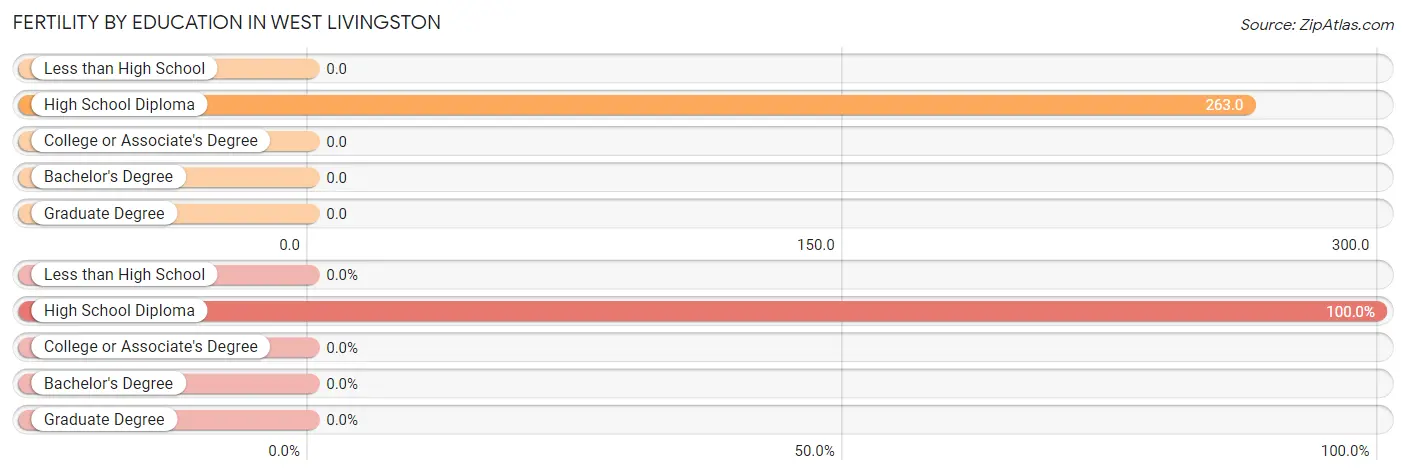
Fertility by Education in West Livingston
| Educational Attainment | Women with Births | Births / 1,000 Women |
| Less than High School | 0 (0.0%) | 0.0 |
| High School Diploma | 119 (100.0%) | 263.0 |
| College or Associate's Degree | 0 (0.0%) | 0.0 |
| Bachelor's Degree | 0 (0.0%) | 0.0 |
| Graduate Degree | 0 (0.0%) | 0.0 |
| Total | 119 (100.0%) | 161.0 |
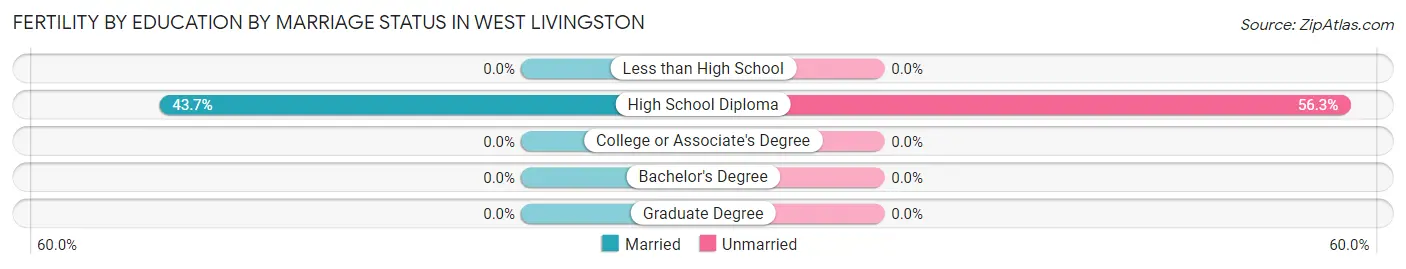
Fertility by Education by Marriage Status in West Livingston
56.3% of women with births in West Livingston are unmarried. Women with the educational attainment of high school diploma are most likely to be married with 43.7% of them married at childbirth, while women with the educational attainment of high school diploma are least likely to be married with 56.3% of them unmarried at childbirth.
| Educational Attainment | Married | Unmarried |
| Less than High School | 0 (0.0%) | 0 (0.0%) |
| High School Diploma | 52 (43.7%) | 67 (56.3%) |
| College or Associate's Degree | 0 (0.0%) | 0 (0.0%) |
| Bachelor's Degree | 0 (0.0%) | 0 (0.0%) |
| Graduate Degree | 0 (0.0%) | 0 (0.0%) |
| Total | 52 (43.7%) | 67 (56.3%) |
Income in West Livingston
Income Overview in West Livingston
Per Capita Income in West Livingston is $17,135, while median incomes of families and households are $66,250 and $62,500 respectively.
| Characteristic | Number | Measure |
| Per Capita Income | 7,559 | $17,135 |
| Median Family Income | 1,163 | $66,250 |
| Mean Family Income | 1,163 | $85,274 |
| Median Household Income | 1,584 | $62,500 |
| Mean Household Income | 1,584 | $74,794 |
| Income Deficit | 1,163 | $0 |
| Wage / Income Gap (%) | 7,559 | 16.59% |
| Wage / Income Gap ($) | 7,559 | 83.41¢ per $1 |
| Gini / Inequality Index | 7,559 | 0.47 |
Earnings by Sex in West Livingston
Average Earnings in West Livingston are $31,829, $28,869 for men and $34,613 for women, a difference of 16.6%.
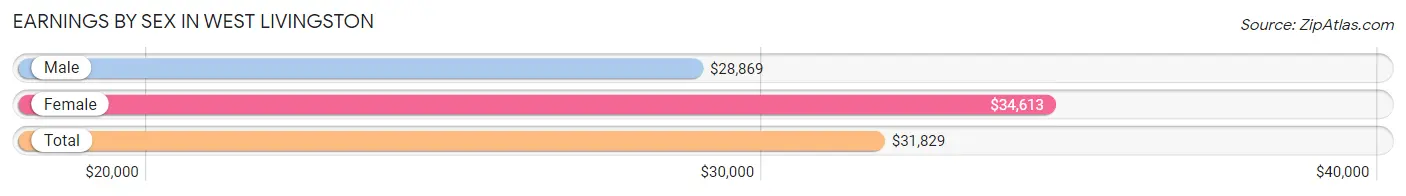
| Sex | Number | Average Earnings |
| Male | 1,216 (66.2%) | $28,869 |
| Female | 620 (33.8%) | $34,613 |
| Total | 1,836 (100.0%) | $31,829 |
Earnings by Sex by Income Bracket in West Livingston
The most common earnings brackets in West Livingston are $100,000+ for men (175 | 14.4%) and $30,000 to $34,999 for women (98 | 15.8%).
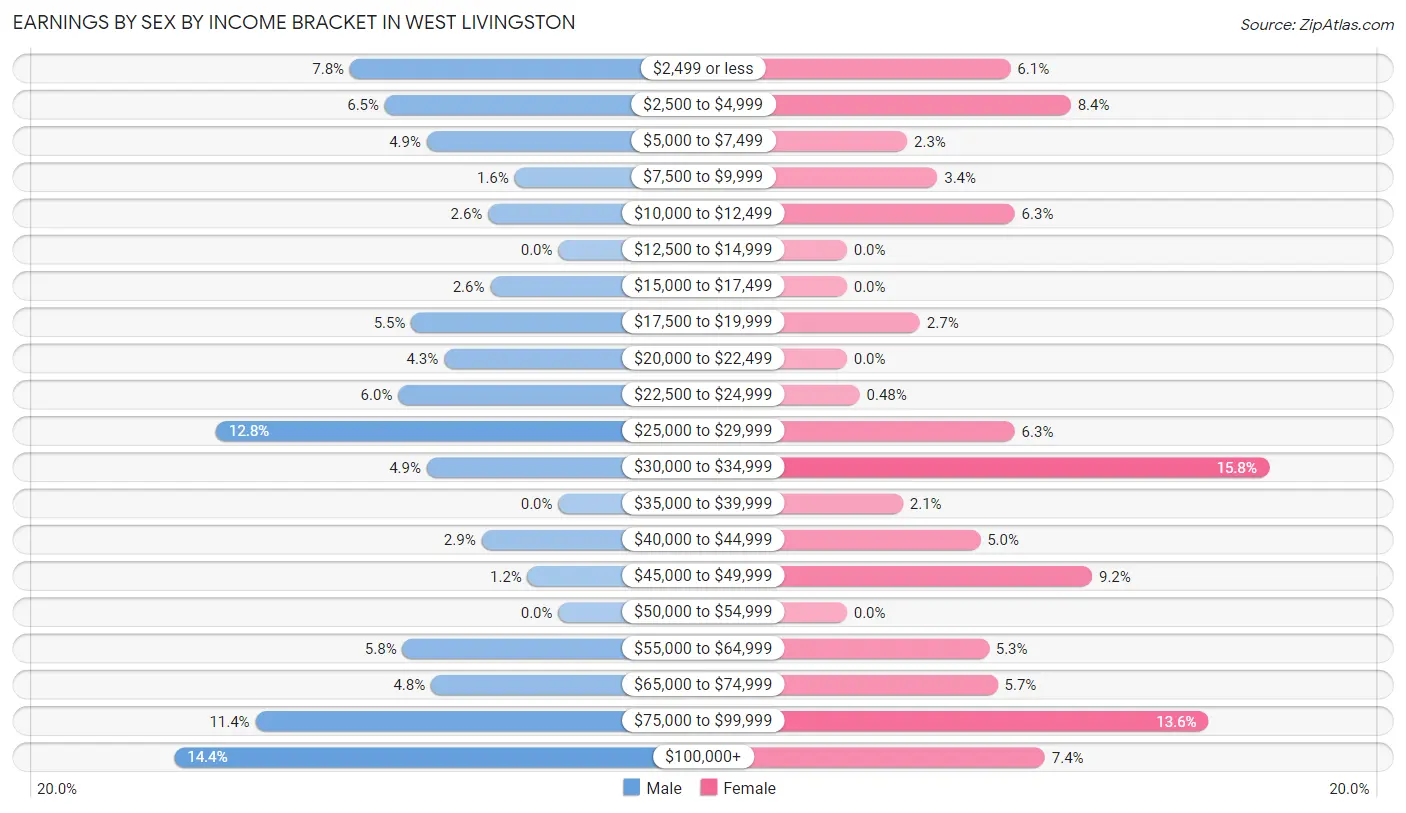
| Income | Male | Female |
| $2,499 or less | 95 (7.8%) | 38 (6.1%) |
| $2,500 to $4,999 | 79 (6.5%) | 52 (8.4%) |
| $5,000 to $7,499 | 60 (4.9%) | 14 (2.3%) |
| $7,500 to $9,999 | 20 (1.6%) | 21 (3.4%) |
| $10,000 to $12,499 | 32 (2.6%) | 39 (6.3%) |
| $12,500 to $14,999 | 0 (0.0%) | 0 (0.0%) |
| $15,000 to $17,499 | 31 (2.5%) | 0 (0.0%) |
| $17,500 to $19,999 | 67 (5.5%) | 17 (2.7%) |
| $20,000 to $22,499 | 52 (4.3%) | 0 (0.0%) |
| $22,500 to $24,999 | 73 (6.0%) | 3 (0.5%) |
| $25,000 to $29,999 | 156 (12.8%) | 39 (6.3%) |
| $30,000 to $34,999 | 60 (4.9%) | 98 (15.8%) |
| $35,000 to $39,999 | 0 (0.0%) | 13 (2.1%) |
| $40,000 to $44,999 | 35 (2.9%) | 31 (5.0%) |
| $45,000 to $49,999 | 14 (1.1%) | 57 (9.2%) |
| $50,000 to $54,999 | 0 (0.0%) | 0 (0.0%) |
| $55,000 to $64,999 | 71 (5.8%) | 33 (5.3%) |
| $65,000 to $74,999 | 58 (4.8%) | 35 (5.7%) |
| $75,000 to $99,999 | 138 (11.4%) | 84 (13.6%) |
| $100,000+ | 175 (14.4%) | 46 (7.4%) |
| Total | 1,216 (100.0%) | 620 (100.0%) |
Earnings by Sex by Educational Attainment in West Livingston
Average earnings in West Livingston are $40,625 for men and $39,038 for women, a difference of 3.9%. Men with an educational attainment of bachelor's degree enjoy the highest average annual earnings of $56,557, while those with less than high school education earn the least with $29,695. Women with an educational attainment of bachelor's degree earn the most with the average annual earnings of $72,875, while those with high school diploma education have the smallest earnings of $31,204.
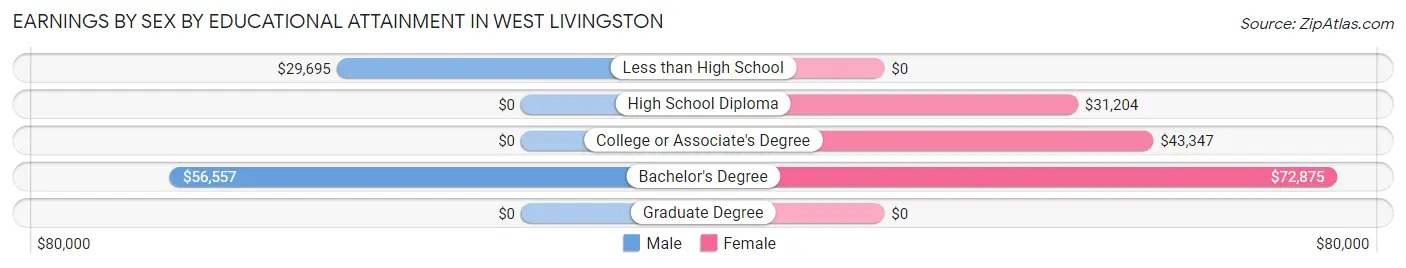
| Educational Attainment | Male Income | Female Income |
| Less than High School | $29,695 | $0 |
| High School Diploma | - | - |
| College or Associate's Degree | - | - |
| Bachelor's Degree | $56,557 | $72,875 |
| Graduate Degree | - | - |
| Total | $40,625 | $39,038 |
Family Income in West Livingston
Family Income Brackets in West Livingston
According to the West Livingston family income data, there are 285 families falling into the $50,000 to $74,999 income range, which is the most common income bracket and makes up 24.5% of all families. Conversely, the less than $10,000 income bracket is the least frequent group with only 10 families (0.9%) belonging to this category.
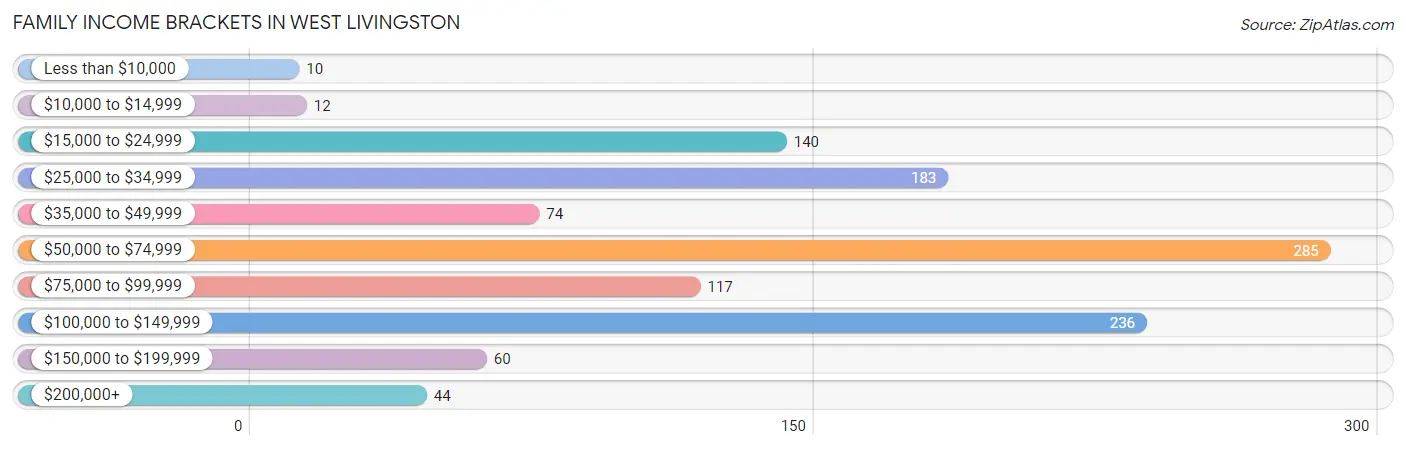
| Income Bracket | # Families | % Families |
| Less than $10,000 | 10 | 0.9% |
| $10,000 to $14,999 | 12 | 1.0% |
| $15,000 to $24,999 | 140 | 12.0% |
| $25,000 to $34,999 | 183 | 15.7% |
| $35,000 to $49,999 | 74 | 6.4% |
| $50,000 to $74,999 | 285 | 24.5% |
| $75,000 to $99,999 | 117 | 10.1% |
| $100,000 to $149,999 | 236 | 20.3% |
| $150,000 to $199,999 | 60 | 5.2% |
| $200,000+ | 44 | 3.8% |
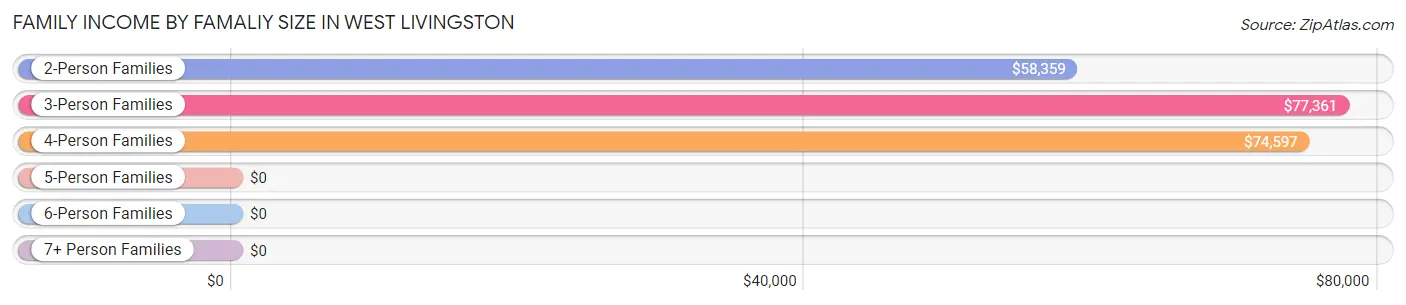
Family Income by Famaliy Size in West Livingston
3-person families (260 | 22.4%) account for the highest median family income in West Livingston with $77,361 per family, while 2-person families (446 | 38.4%) have the highest median income of $29,180 per family member.
| Income Bracket | # Families | Median Income |
| 2-Person Families | 446 (38.4%) | $58,359 |
| 3-Person Families | 260 (22.4%) | $77,361 |
| 4-Person Families | 348 (29.9%) | $74,597 |
| 5-Person Families | 27 (2.3%) | $0 |
| 6-Person Families | 41 (3.5%) | $0 |
| 7+ Person Families | 41 (3.5%) | $0 |
| Total | 1,163 (100.0%) | $66,250 |
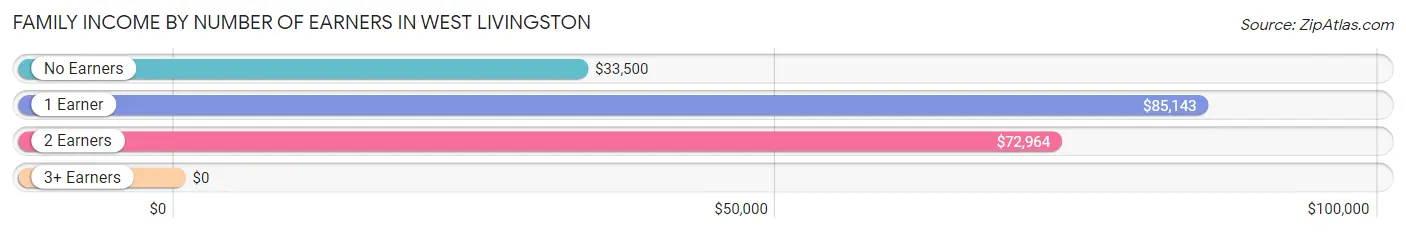
Family Income by Number of Earners in West Livingston
| Number of Earners | # Families | Median Income |
| No Earners | 290 (24.9%) | $33,500 |
| 1 Earner | 390 (33.5%) | $85,143 |
| 2 Earners | 457 (39.3%) | $72,964 |
| 3+ Earners | 26 (2.2%) | $0 |
| Total | 1,163 (100.0%) | $66,250 |
Household Income in West Livingston
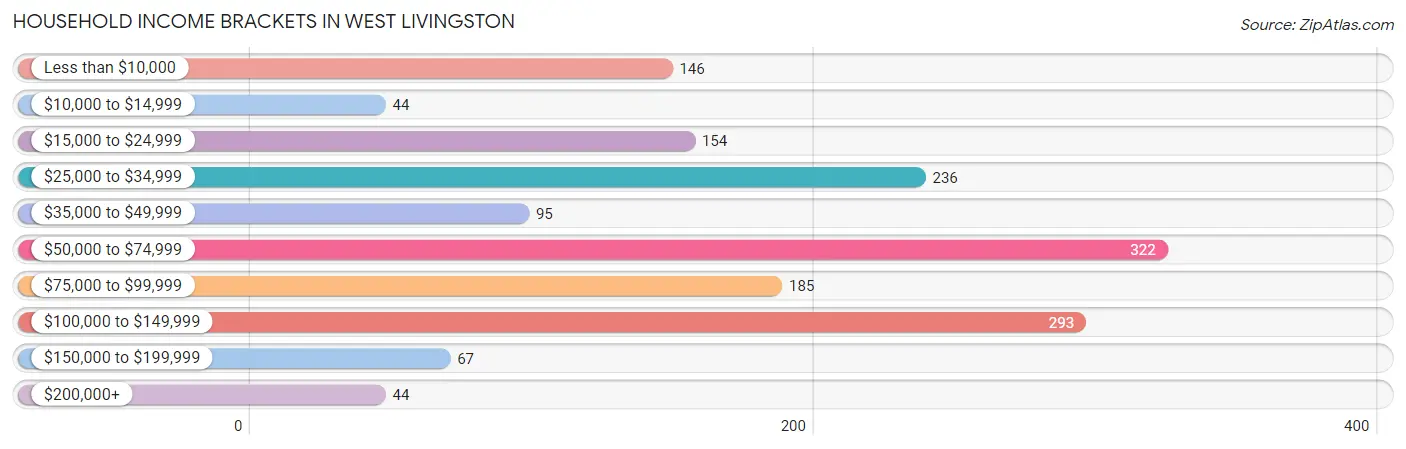
Household Income Brackets in West Livingston
With 322 households falling in the category, the $50,000 to $74,999 income range is the most frequent in West Livingston, accounting for 20.3% of all households. In contrast, only 44 households (2.8%) fall into the $10,000 to $14,999 income bracket, making it the least populous group.
| Income Bracket | # Households | % Households |
| Less than $10,000 | 146 | 9.2% |
| $10,000 to $14,999 | 44 | 2.8% |
| $15,000 to $24,999 | 154 | 9.7% |
| $25,000 to $34,999 | 236 | 14.9% |
| $35,000 to $49,999 | 95 | 6.0% |
| $50,000 to $74,999 | 322 | 20.3% |
| $75,000 to $99,999 | 185 | 11.7% |
| $100,000 to $149,999 | 293 | 18.5% |
| $150,000 to $199,999 | 67 | 4.2% |
| $200,000+ | 44 | 2.8% |
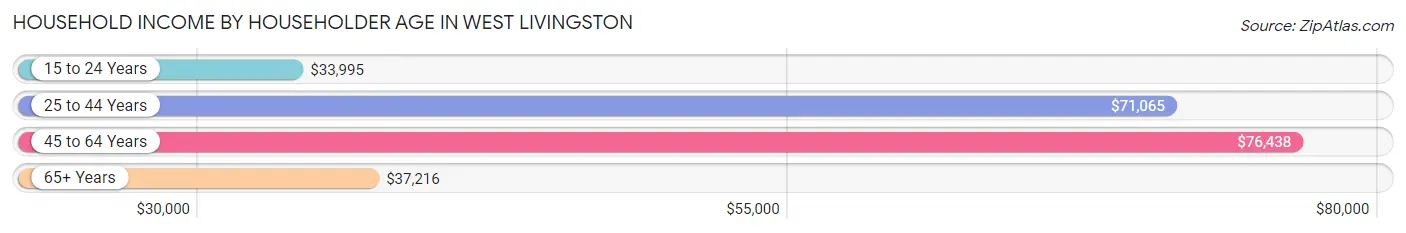
Household Income by Householder Age in West Livingston
The median household income in West Livingston is $62,500, with the highest median household income of $76,438 found in the 45 to 64 years age bracket for the primary householder. A total of 679 households (42.9%) fall into this category. Meanwhile, the 15 to 24 years age bracket for the primary householder has the lowest median household income of $33,995, with 85 households (5.4%) in this group.
| Income Bracket | # Households | Median Income |
| 15 to 24 Years | 85 (5.4%) | $33,995 |
| 25 to 44 Years | 407 (25.7%) | $71,065 |
| 45 to 64 Years | 679 (42.9%) | $76,438 |
| 65+ Years | 413 (26.1%) | $37,216 |
| Total | 1,584 (100.0%) | $62,500 |
Poverty in West Livingston
Income Below Poverty by Sex and Age in West Livingston
With 25.2% poverty level for males and 27.2% for females among the residents of West Livingston, under 5 year old males and 5 year old females are the most vulnerable to poverty, with 155 males (61.3%) and 8 females (100.0%) in their respective age groups living below the poverty level.
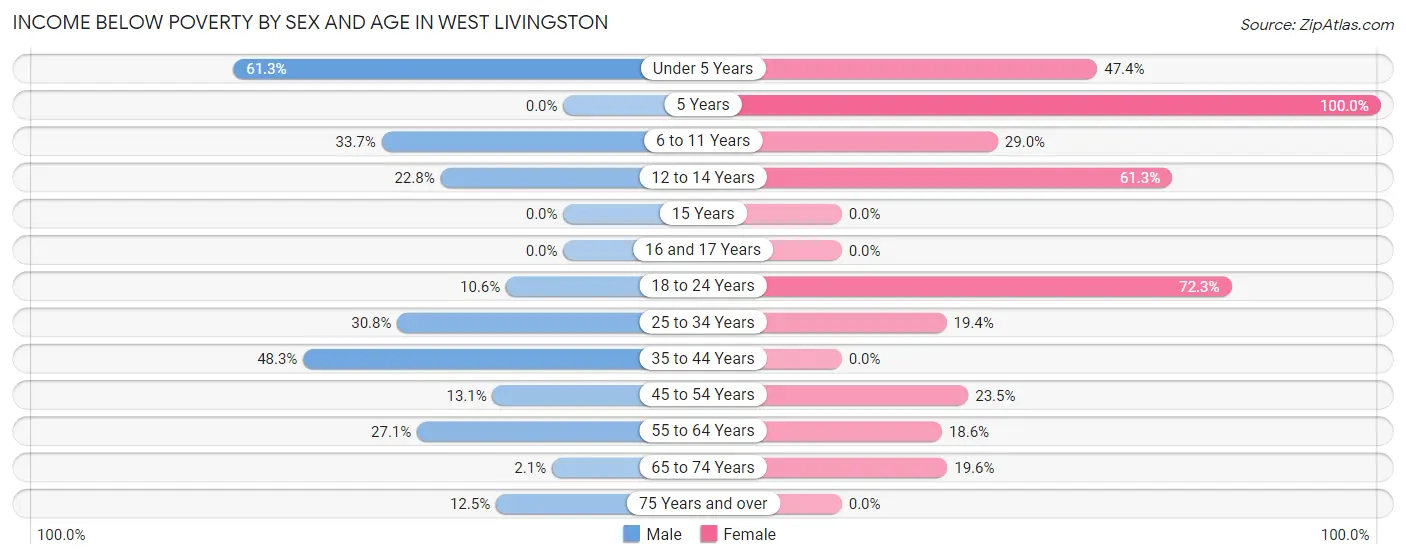
| Age Bracket | Male | Female |
| Under 5 Years | 155 (61.3%) | 92 (47.4%) |
| 5 Years | 0 (0.0%) | 8 (100.0%) |
| 6 to 11 Years | 57 (33.7%) | 51 (29.0%) |
| 12 to 14 Years | 26 (22.8%) | 19 (61.3%) |
| 15 Years | 0 (0.0%) | 0 (0.0%) |
| 16 and 17 Years | 0 (0.0%) | 0 (0.0%) |
| 18 to 24 Years | 31 (10.6%) | 154 (72.3%) |
| 25 to 34 Years | 98 (30.8%) | 42 (19.4%) |
| 35 to 44 Years | 99 (48.3%) | 0 (0.0%) |
| 45 to 54 Years | 41 (13.1%) | 54 (23.5%) |
| 55 to 64 Years | 73 (27.1%) | 74 (18.6%) |
| 65 to 74 Years | 6 (2.1%) | 58 (19.6%) |
| 75 Years and over | 9 (12.5%) | 0 (0.0%) |
| Total | 595 (25.2%) | 552 (27.2%) |
Income Above Poverty by Sex and Age in West Livingston
According to the poverty statistics in West Livingston, males aged 15 years and females aged 16 and 17 years are the age groups that are most secure financially, with 100.0% of males and 100.0% of females in these age groups living above the poverty line.
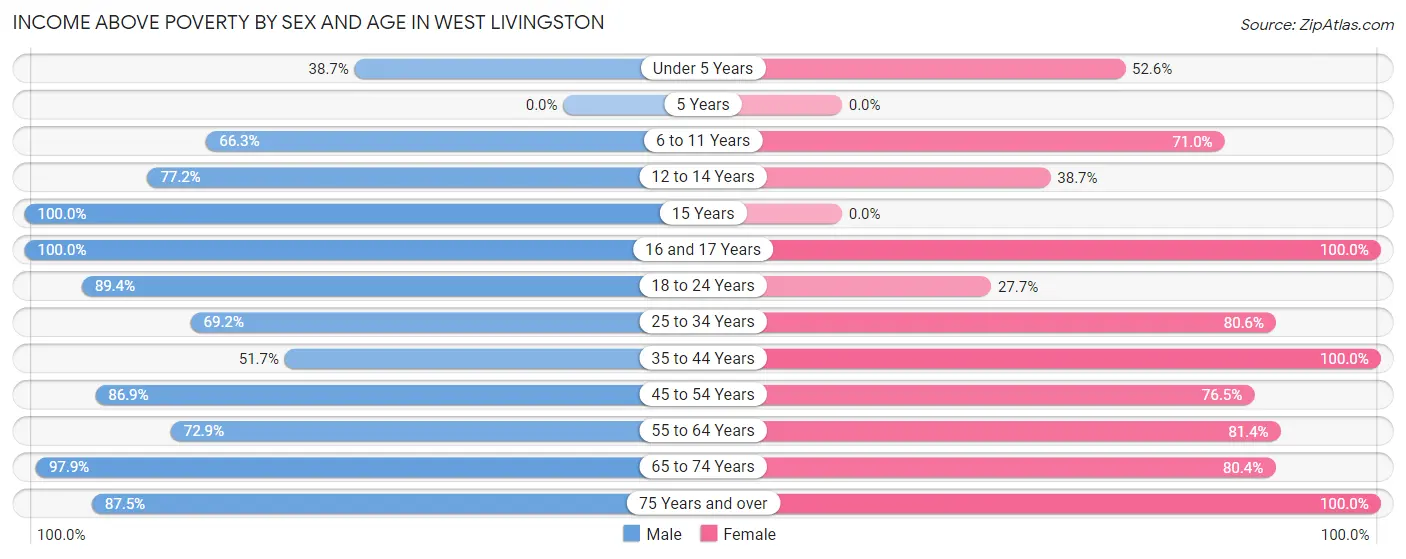
| Age Bracket | Male | Female |
| Under 5 Years | 98 (38.7%) | 102 (52.6%) |
| 5 Years | 0 (0.0%) | 0 (0.0%) |
| 6 to 11 Years | 112 (66.3%) | 125 (71.0%) |
| 12 to 14 Years | 88 (77.2%) | 12 (38.7%) |
| 15 Years | 13 (100.0%) | 0 (0.0%) |
| 16 and 17 Years | 62 (100.0%) | 28 (100.0%) |
| 18 to 24 Years | 261 (89.4%) | 59 (27.7%) |
| 25 to 34 Years | 220 (69.2%) | 174 (80.6%) |
| 35 to 44 Years | 106 (51.7%) | 140 (100.0%) |
| 45 to 54 Years | 271 (86.9%) | 176 (76.5%) |
| 55 to 64 Years | 196 (72.9%) | 324 (81.4%) |
| 65 to 74 Years | 278 (97.9%) | 238 (80.4%) |
| 75 Years and over | 63 (87.5%) | 102 (100.0%) |
| Total | 1,768 (74.8%) | 1,480 (72.8%) |
Income Below Poverty Among Married-Couple Families in West Livingston
The poverty statistics for married-couple families in West Livingston show that 13.5% or 118 of the total 875 families live below the poverty line. Families with 3 or 4 children have the highest poverty rate of 43.6%, comprising of 24 families. On the other hand, families with no children have the lowest poverty rate of 5.3%, which includes 27 families.
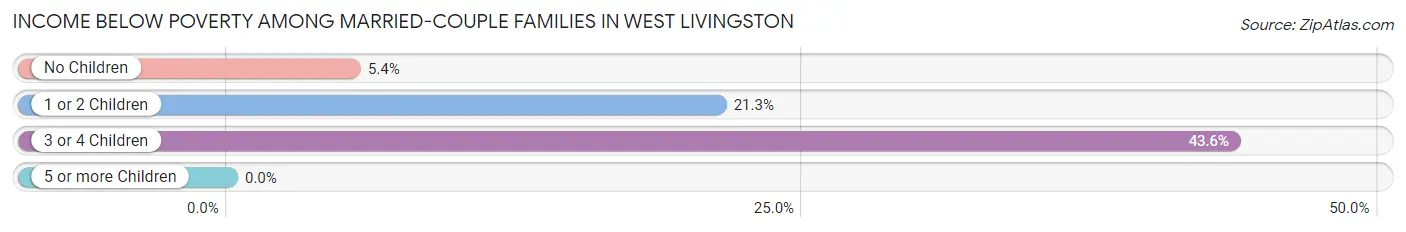
| Children | Above Poverty | Below Poverty |
| No Children | 478 (94.7%) | 27 (5.3%) |
| 1 or 2 Children | 248 (78.7%) | 67 (21.3%) |
| 3 or 4 Children | 31 (56.4%) | 24 (43.6%) |
| 5 or more Children | 0 (0.0%) | 0 (0.0%) |
| Total | 757 (86.5%) | 118 (13.5%) |
Income Below Poverty Among Single-Parent Households in West Livingston
According to the poverty data in West Livingston, 35.6% or 41 single-father households and 16.2% or 28 single-mother households are living below the poverty line. Among single-father households, those with 3 or 4 children have the highest poverty rate, with 41 households (100.0%) experiencing poverty. Likewise, among single-mother households, those with no children have the highest poverty rate, with 12 households (19.4%) falling below the poverty line.
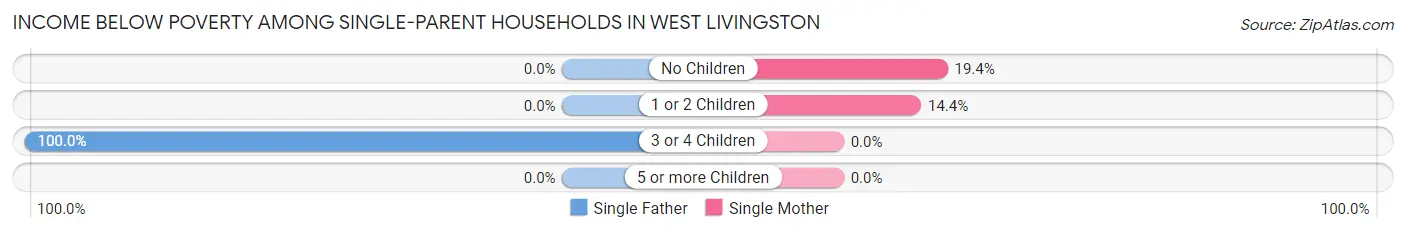
| Children | Single Father | Single Mother |
| No Children | 0 (0.0%) | 12 (19.4%) |
| 1 or 2 Children | 0 (0.0%) | 16 (14.4%) |
| 3 or 4 Children | 41 (100.0%) | 0 (0.0%) |
| 5 or more Children | 0 (0.0%) | 0 (0.0%) |
| Total | 41 (35.6%) | 28 (16.2%) |
Income Below Poverty Among Married-Couple vs Single-Parent Households in West Livingston
The poverty data for West Livingston shows that 118 of the married-couple family households (13.5%) and 69 of the single-parent households (24.0%) are living below the poverty level. Within the married-couple family households, those with 3 or 4 children have the highest poverty rate, with 24 households (43.6%) falling below the poverty line. Among the single-parent households, those with 3 or 4 children have the highest poverty rate, with 41 household (100.0%) living below poverty.
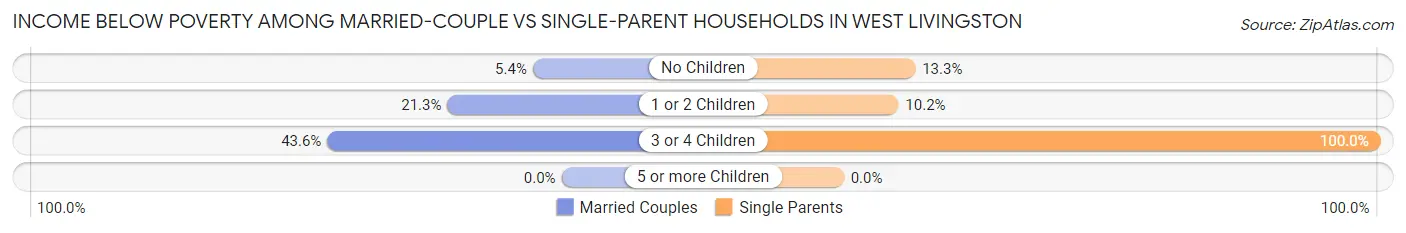
| Children | Married-Couple Families | Single-Parent Households |
| No Children | 27 (5.3%) | 12 (13.3%) |
| 1 or 2 Children | 67 (21.3%) | 16 (10.2%) |
| 3 or 4 Children | 24 (43.6%) | 41 (100.0%) |
| 5 or more Children | 0 (0.0%) | 0 (0.0%) |
| Total | 118 (13.5%) | 69 (24.0%) |
Employment Characteristics in West Livingston
Employment by Class of Employer in West Livingston
Among the 1,452 employed individuals in West Livingston, private company employees (1,126 | 77.5%), not-for-profit organizations (155 | 10.7%), and local government employees (63 | 4.3%) make up the most common classes of employment.
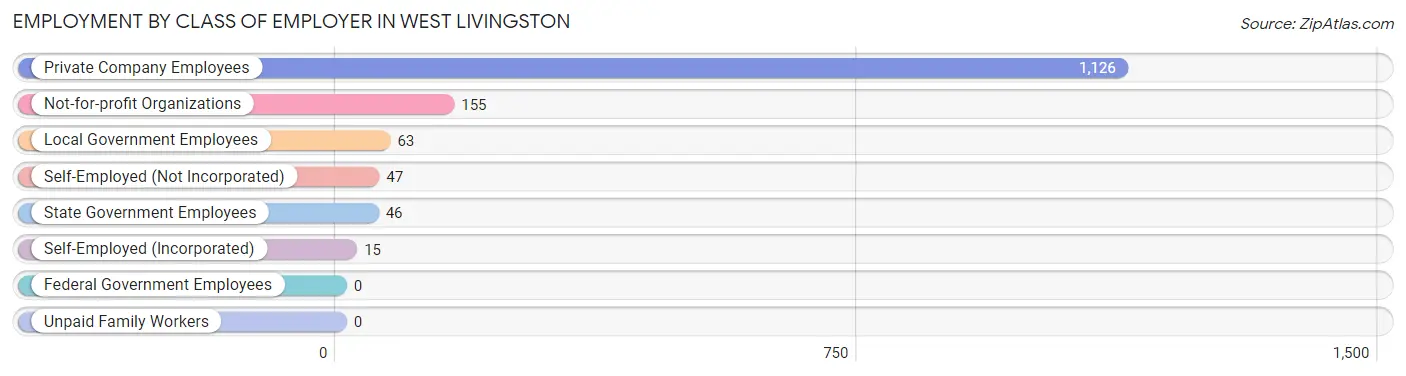
| Employer Class | # Employees | % Employees |
| Private Company Employees | 1,126 | 77.5% |
| Self-Employed (Incorporated) | 15 | 1.0% |
| Self-Employed (Not Incorporated) | 47 | 3.2% |
| Not-for-profit Organizations | 155 | 10.7% |
| Local Government Employees | 63 | 4.3% |
| State Government Employees | 46 | 3.2% |
| Federal Government Employees | 0 | 0.0% |
| Unpaid Family Workers | 0 | 0.0% |
| Total | 1,452 | 100.0% |
Employment Status by Age in West Livingston
According to the labor force statistics for West Livingston, out of the total population over 16 years of age (6,601), 25.3% or 1,670 individuals are in the labor force, with 10.3% or 172 of them unemployed. The age group with the highest labor force participation rate is 45 to 54 years, with 40.3% or 411 individuals in the labor force. Within the labor force, the 30 to 34 years age range has the highest percentage of unemployed individuals, with 30.7% or 59 of them being unemployed.
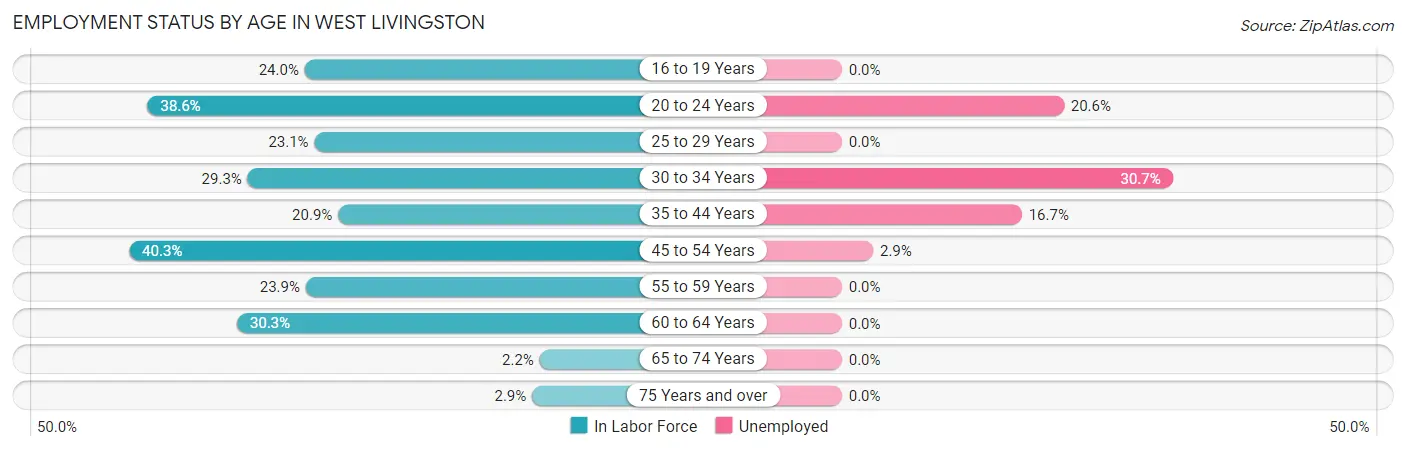
| Age Bracket | In Labor Force | Unemployed |
| 16 to 19 Years | 42 (24.0%) | 0 (0.0%) |
| 20 to 24 Years | 253 (38.6%) | 52 (20.6%) |
| 25 to 29 Years | 181 (23.1%) | 0 (0.0%) |
| 30 to 34 Years | 192 (29.3%) | 59 (30.7%) |
| 35 to 44 Years | 287 (20.9%) | 48 (16.7%) |
| 45 to 54 Years | 411 (40.3%) | 12 (2.9%) |
| 55 to 59 Years | 123 (23.9%) | 0 (0.0%) |
| 60 to 64 Years | 158 (30.3%) | 0 (0.0%) |
| 65 to 74 Years | 15 (2.2%) | 0 (0.0%) |
| 75 Years and over | 6 (2.9%) | 0 (0.0%) |
| Total | 1,670 (25.3%) | 172 (10.3%) |
Employment Status by Educational Attainment in West Livingston
According to labor force statistics for West Livingston, 27.8% of individuals (1,354) out of the total population between 25 and 64 years of age (4,869) are in the labor force, with 8.8% or 119 of them being unemployed. The group with the highest labor force participation rate are those with the educational attainment of bachelor's degree or higher, with 67.6% or 213 individuals in the labor force. Within the labor force, individuals with high school diploma education have the highest percentage of unemployment, with 13.3% or 88 of them being unemployed.
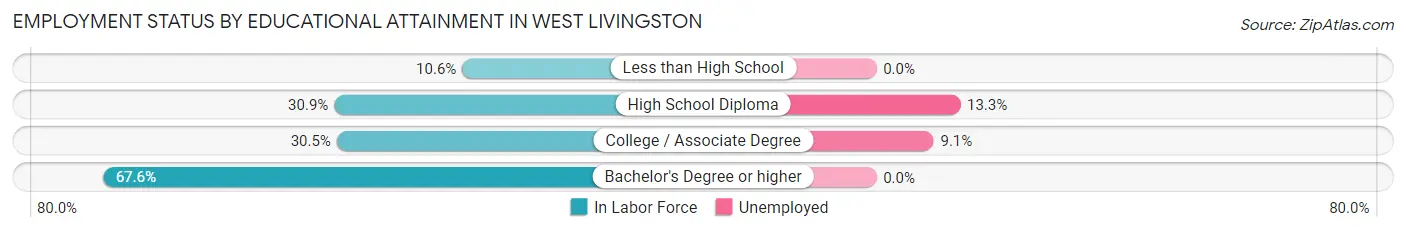
| Educational Attainment | In Labor Force | Unemployed |
| Less than High School | 138 (10.6%) | 0 (0.0%) |
| High School Diploma | 660 (30.9%) | 284 (13.3%) |
| College / Associate Degree | 340 (30.5%) | 101 (9.1%) |
| Bachelor's Degree or higher | 213 (67.6%) | 0 (0.0%) |
| Total | 1,354 (27.8%) | 428 (8.8%) |
Employment Occupations by Sex in West Livingston
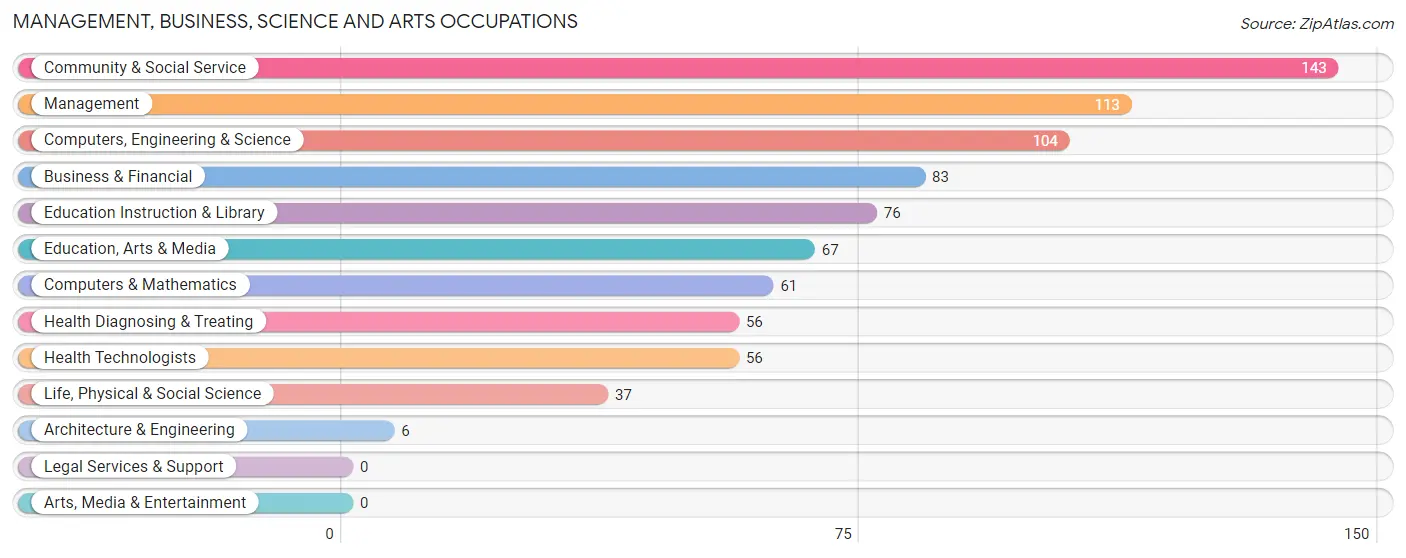
Management, Business, Science and Arts Occupations
The most common Management, Business, Science and Arts occupations in West Livingston are Community & Social Service (143 | 9.6%), Management (113 | 7.5%), Computers, Engineering & Science (104 | 7.0%), Business & Financial (83 | 5.5%), and Education Instruction & Library (76 | 5.1%).
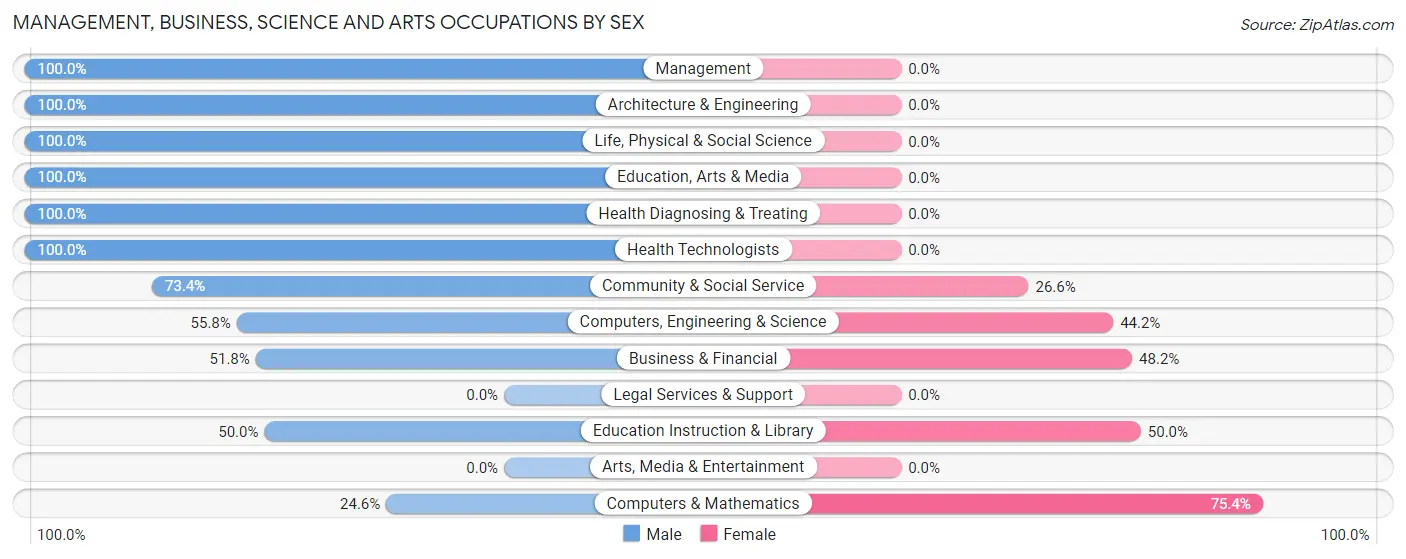
Management, Business, Science and Arts Occupations by Sex
Within the Management, Business, Science and Arts occupations in West Livingston, the most male-oriented occupations are Management (100.0%), Architecture & Engineering (100.0%), and Life, Physical & Social Science (100.0%), while the most female-oriented occupations are Computers & Mathematics (75.4%), Education Instruction & Library (50.0%), and Business & Financial (48.2%).
| Occupation | Male | Female |
| Management | 113 (100.0%) | 0 (0.0%) |
| Business & Financial | 43 (51.8%) | 40 (48.2%) |
| Computers, Engineering & Science | 58 (55.8%) | 46 (44.2%) |
| Computers & Mathematics | 15 (24.6%) | 46 (75.4%) |
| Architecture & Engineering | 6 (100.0%) | 0 (0.0%) |
| Life, Physical & Social Science | 37 (100.0%) | 0 (0.0%) |
| Community & Social Service | 105 (73.4%) | 38 (26.6%) |
| Education, Arts & Media | 67 (100.0%) | 0 (0.0%) |
| Legal Services & Support | 0 (0.0%) | 0 (0.0%) |
| Education Instruction & Library | 38 (50.0%) | 38 (50.0%) |
| Arts, Media & Entertainment | 0 (0.0%) | 0 (0.0%) |
| Health Diagnosing & Treating | 56 (100.0%) | 0 (0.0%) |
| Health Technologists | 56 (100.0%) | 0 (0.0%) |
| Total (Category) | 375 (75.1%) | 124 (24.8%) |
| Total (Overall) | 971 (64.9%) | 526 (35.1%) |
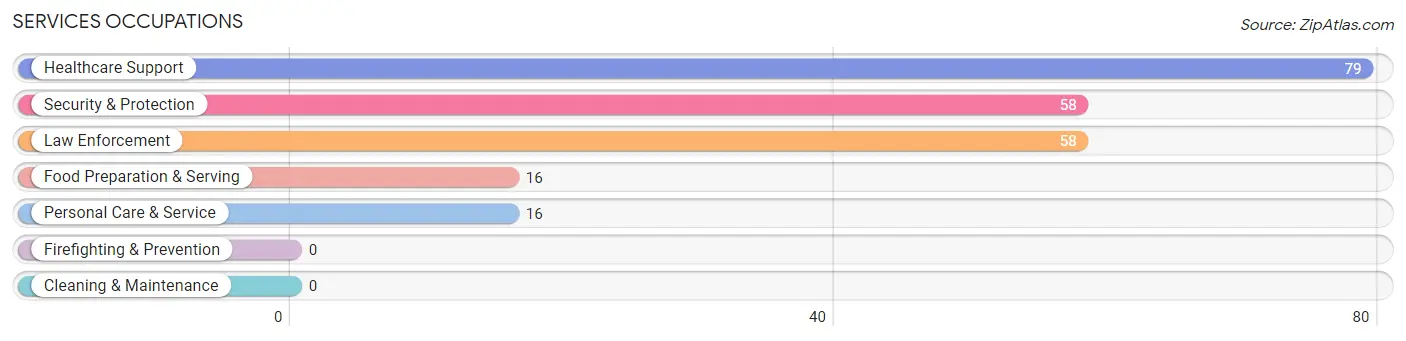
Services Occupations
The most common Services occupations in West Livingston are Healthcare Support (79 | 5.3%), Security & Protection (58 | 3.9%), Law Enforcement (58 | 3.9%), Food Preparation & Serving (16 | 1.1%), and Personal Care & Service (16 | 1.1%).
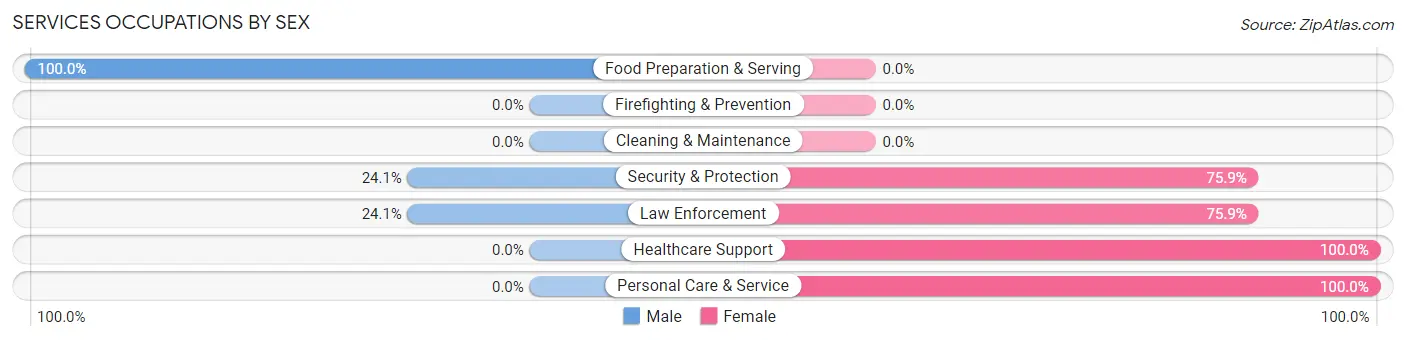
Services Occupations by Sex
Within the Services occupations in West Livingston, the most male-oriented occupations are Food Preparation & Serving (100.0%), Security & Protection (24.1%), and Law Enforcement (24.1%), while the most female-oriented occupations are Healthcare Support (100.0%), Personal Care & Service (100.0%), and Security & Protection (75.9%).
| Occupation | Male | Female |
| Healthcare Support | 0 (0.0%) | 79 (100.0%) |
| Security & Protection | 14 (24.1%) | 44 (75.9%) |
| Firefighting & Prevention | 0 (0.0%) | 0 (0.0%) |
| Law Enforcement | 14 (24.1%) | 44 (75.9%) |
| Food Preparation & Serving | 16 (100.0%) | 0 (0.0%) |
| Cleaning & Maintenance | 0 (0.0%) | 0 (0.0%) |
| Personal Care & Service | 0 (0.0%) | 16 (100.0%) |
| Total (Category) | 30 (17.7%) | 139 (82.3%) |
| Total (Overall) | 971 (64.9%) | 526 (35.1%) |
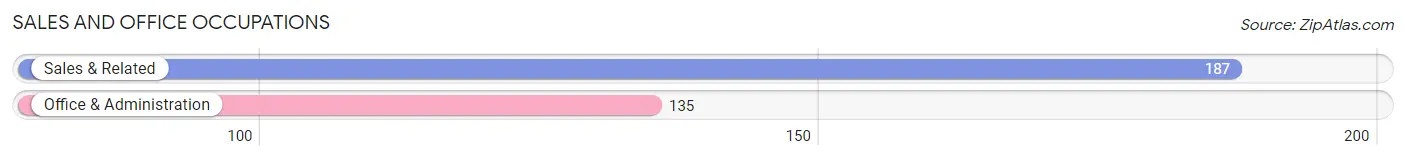
Sales and Office Occupations
The most common Sales and Office occupations in West Livingston are Sales & Related (187 | 12.5%), and Office & Administration (135 | 9.0%).
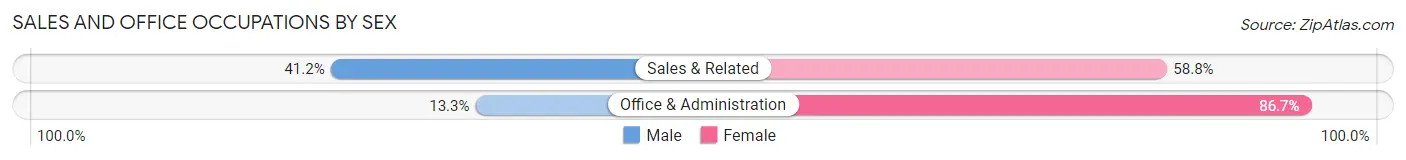
Sales and Office Occupations by Sex
| Occupation | Male | Female |
| Sales & Related | 77 (41.2%) | 110 (58.8%) |
| Office & Administration | 18 (13.3%) | 117 (86.7%) |
| Total (Category) | 95 (29.5%) | 227 (70.5%) |
| Total (Overall) | 971 (64.9%) | 526 (35.1%) |
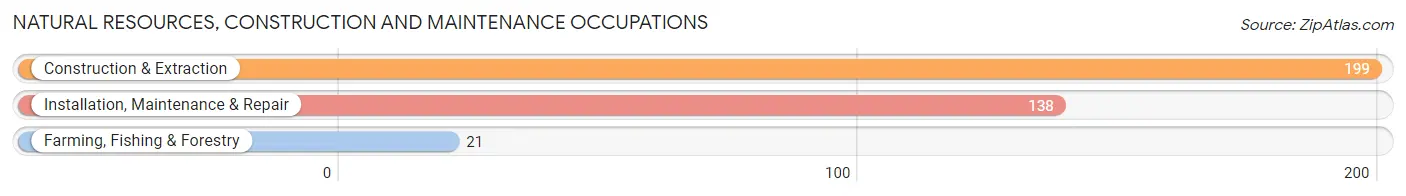
Natural Resources, Construction and Maintenance Occupations
The most common Natural Resources, Construction and Maintenance occupations in West Livingston are Construction & Extraction (199 | 13.3%), Installation, Maintenance & Repair (138 | 9.2%), and Farming, Fishing & Forestry (21 | 1.4%).
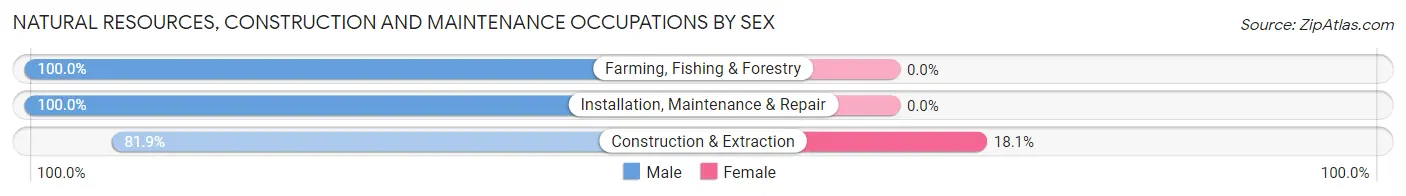
Natural Resources, Construction and Maintenance Occupations by Sex
| Occupation | Male | Female |
| Farming, Fishing & Forestry | 21 (100.0%) | 0 (0.0%) |
| Construction & Extraction | 163 (81.9%) | 36 (18.1%) |
| Installation, Maintenance & Repair | 138 (100.0%) | 0 (0.0%) |
| Total (Category) | 322 (89.9%) | 36 (10.1%) |
| Total (Overall) | 971 (64.9%) | 526 (35.1%) |
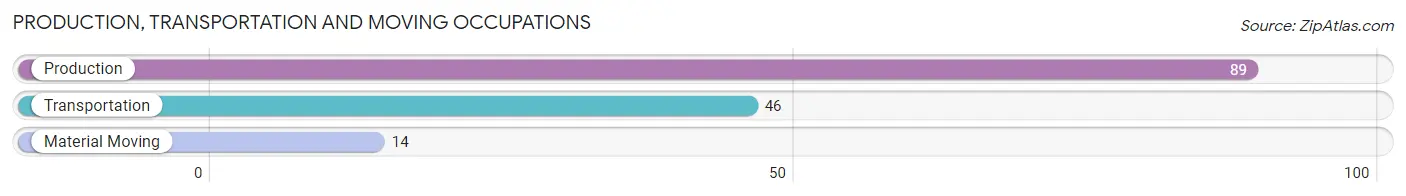
Production, Transportation and Moving Occupations
The most common Production, Transportation and Moving occupations in West Livingston are Production (89 | 5.9%), Transportation (46 | 3.1%), and Material Moving (14 | 0.9%).
Production, Transportation and Moving Occupations by Sex
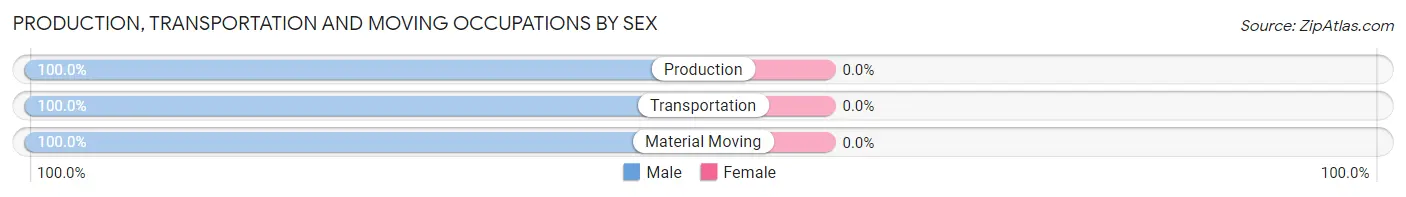
| Occupation | Male | Female |
| Production | 89 (100.0%) | 0 (0.0%) |
| Transportation | 46 (100.0%) | 0 (0.0%) |
| Material Moving | 14 (100.0%) | 0 (0.0%) |
| Total (Category) | 149 (100.0%) | 0 (0.0%) |
| Total (Overall) | 971 (64.9%) | 526 (35.1%) |
Employment Industries by Sex in West Livingston
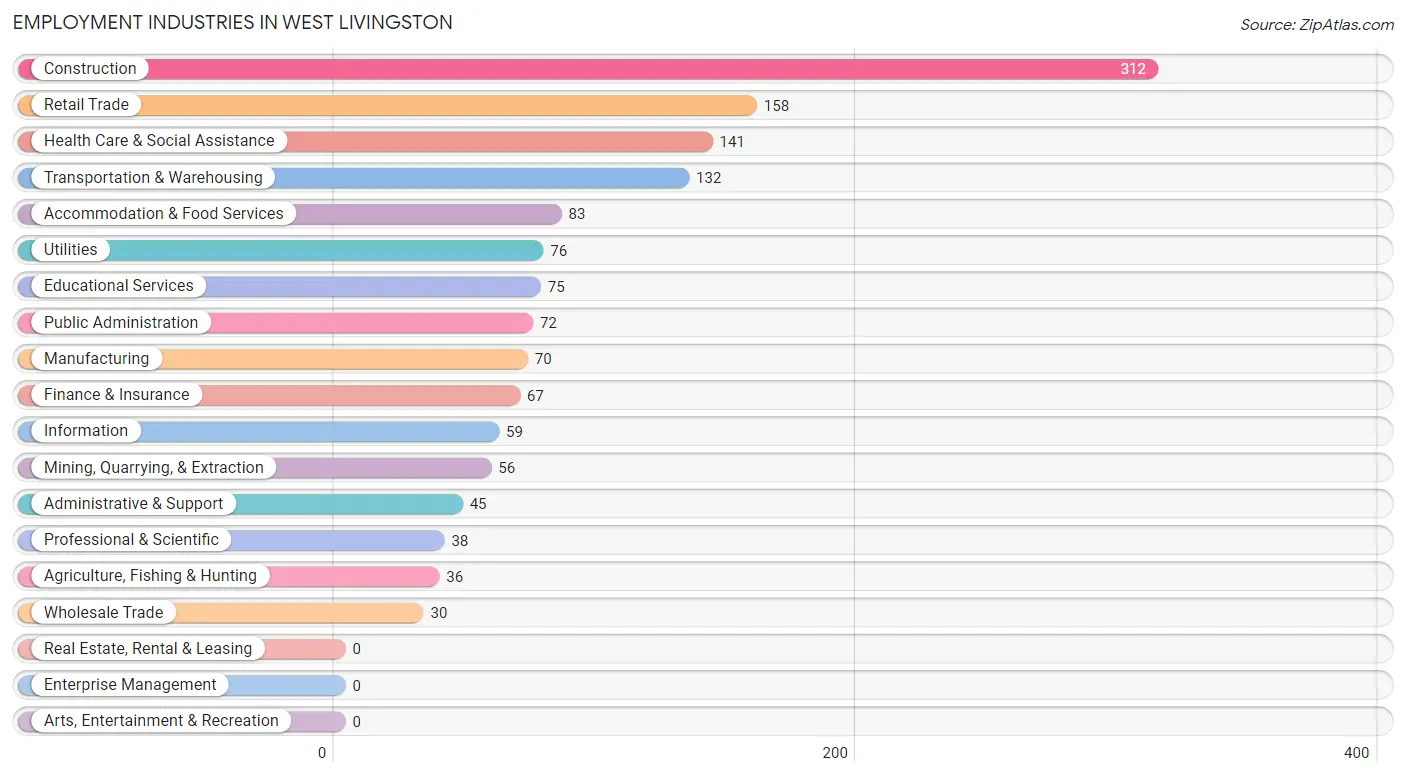
Employment Industries in West Livingston
The major employment industries in West Livingston include Construction (312 | 20.8%), Retail Trade (158 | 10.5%), Health Care & Social Assistance (141 | 9.4%), Transportation & Warehousing (132 | 8.8%), and Accommodation & Food Services (83 | 5.5%).
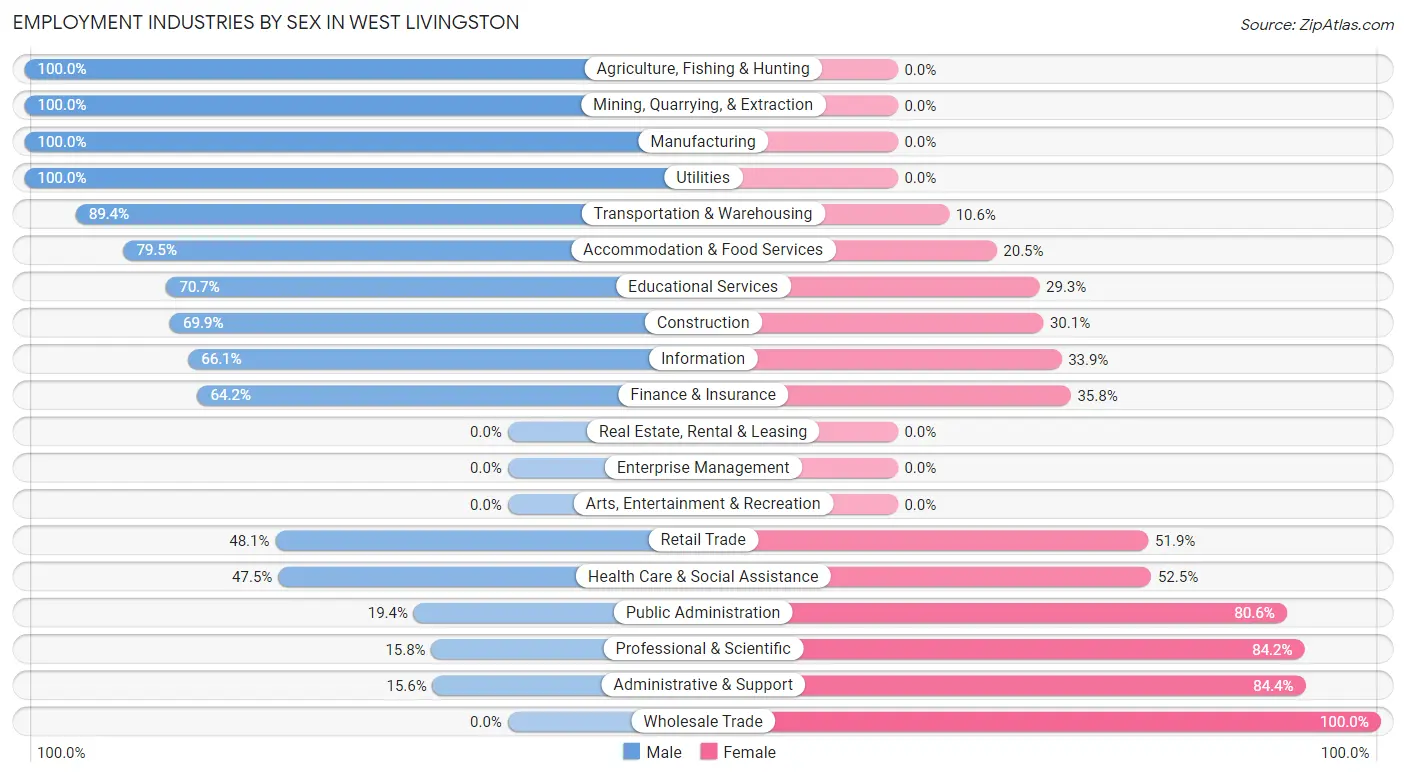
Employment Industries by Sex in West Livingston
The West Livingston industries that see more men than women are Agriculture, Fishing & Hunting (100.0%), Mining, Quarrying, & Extraction (100.0%), and Manufacturing (100.0%), whereas the industries that tend to have a higher number of women are Wholesale Trade (100.0%), Administrative & Support (84.4%), and Professional & Scientific (84.2%).
| Industry | Male | Female |
| Agriculture, Fishing & Hunting | 36 (100.0%) | 0 (0.0%) |
| Mining, Quarrying, & Extraction | 56 (100.0%) | 0 (0.0%) |
| Construction | 218 (69.9%) | 94 (30.1%) |
| Manufacturing | 70 (100.0%) | 0 (0.0%) |
| Wholesale Trade | 0 (0.0%) | 30 (100.0%) |
| Retail Trade | 76 (48.1%) | 82 (51.9%) |
| Transportation & Warehousing | 118 (89.4%) | 14 (10.6%) |
| Utilities | 76 (100.0%) | 0 (0.0%) |
| Information | 39 (66.1%) | 20 (33.9%) |
| Finance & Insurance | 43 (64.2%) | 24 (35.8%) |
| Real Estate, Rental & Leasing | 0 (0.0%) | 0 (0.0%) |
| Professional & Scientific | 6 (15.8%) | 32 (84.2%) |
| Enterprise Management | 0 (0.0%) | 0 (0.0%) |
| Administrative & Support | 7 (15.6%) | 38 (84.4%) |
| Educational Services | 53 (70.7%) | 22 (29.3%) |
| Health Care & Social Assistance | 67 (47.5%) | 74 (52.5%) |
| Arts, Entertainment & Recreation | 0 (0.0%) | 0 (0.0%) |
| Accommodation & Food Services | 66 (79.5%) | 17 (20.5%) |
| Public Administration | 14 (19.4%) | 58 (80.6%) |
| Total | 971 (64.9%) | 526 (35.1%) |
Education in West Livingston
School Enrollment in West Livingston
The most common levels of schooling among the 910 students in West Livingston are college / undergraduate (238 | 26.2%), middle school (225 | 24.7%), and elementary school (215 | 23.6%).
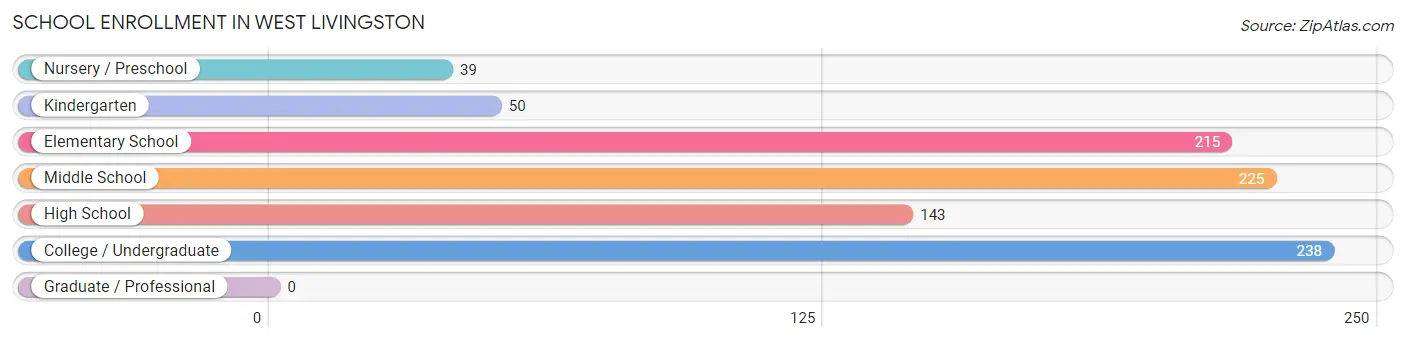
| School Level | # Students | % Students |
| Nursery / Preschool | 39 | 4.3% |
| Kindergarten | 50 | 5.5% |
| Elementary School | 215 | 23.6% |
| Middle School | 225 | 24.7% |
| High School | 143 | 15.7% |
| College / Undergraduate | 238 | 26.2% |
| Graduate / Professional | 0 | 0.0% |
| Total | 910 | 100.0% |
School Enrollment by Age by Funding Source in West Livingston
Out of a total of 910 students who are enrolled in schools in West Livingston, 117 (12.9%) attend a private institution, while the remaining 793 (87.1%) are enrolled in public schools. The age group of 20 to 24 year olds has the highest likelihood of being enrolled in private schools, with 35 (50.7% in the age bracket) enrolled. Conversely, the age group of 3 to 4 year olds has the lowest likelihood of being enrolled in a private school, with 31 (100.0% in the age bracket) attending a public institution.
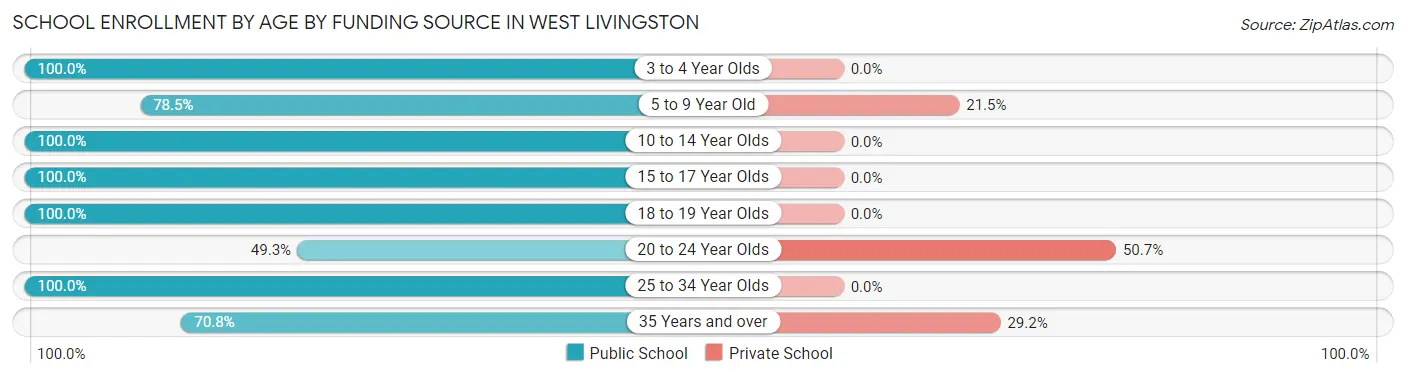
| Age Bracket | Public School | Private School |
| 3 to 4 Year Olds | 31 (100.0%) | 0 (0.0%) |
| 5 to 9 Year Old | 204 (78.5%) | 56 (21.5%) |
| 10 to 14 Year Olds | 238 (100.0%) | 0 (0.0%) |
| 15 to 17 Year Olds | 103 (100.0%) | 0 (0.0%) |
| 18 to 19 Year Olds | 26 (100.0%) | 0 (0.0%) |
| 20 to 24 Year Olds | 34 (49.3%) | 35 (50.7%) |
| 25 to 34 Year Olds | 94 (100.0%) | 0 (0.0%) |
| 35 Years and over | 63 (70.8%) | 26 (29.2%) |
| Total | 793 (87.1%) | 117 (12.9%) |
Educational Attainment by Field of Study in West Livingston
Business (157 | 27.6%), science & technology (84 | 14.8%), education (63 | 11.1%), computers & mathematics (59 | 10.4%), and social sciences (44 | 7.7%) are the most common fields of study among 568 individuals in West Livingston who have obtained a bachelor's degree or higher.
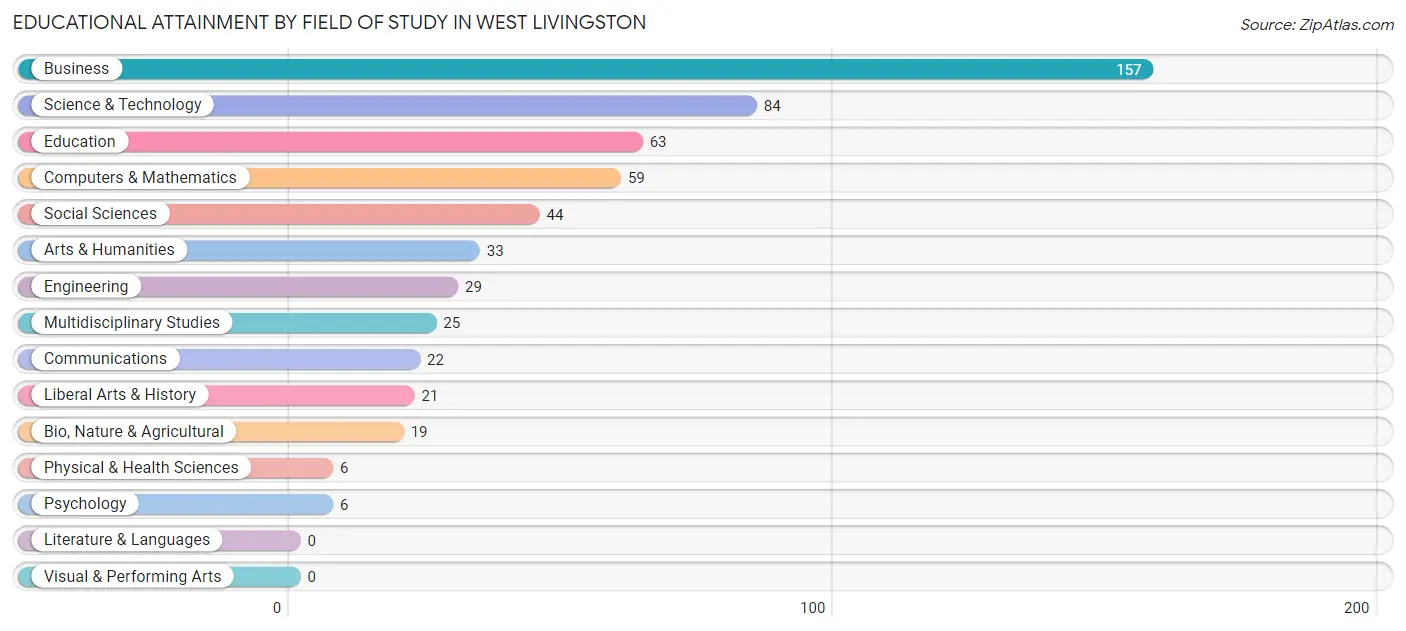
| Field of Study | # Graduates | % Graduates |
| Computers & Mathematics | 59 | 10.4% |
| Bio, Nature & Agricultural | 19 | 3.4% |
| Physical & Health Sciences | 6 | 1.1% |
| Psychology | 6 | 1.1% |
| Social Sciences | 44 | 7.7% |
| Engineering | 29 | 5.1% |
| Multidisciplinary Studies | 25 | 4.4% |
| Science & Technology | 84 | 14.8% |
| Business | 157 | 27.6% |
| Education | 63 | 11.1% |
| Literature & Languages | 0 | 0.0% |
| Liberal Arts & History | 21 | 3.7% |
| Visual & Performing Arts | 0 | 0.0% |
| Communications | 22 | 3.9% |
| Arts & Humanities | 33 | 5.8% |
| Total | 568 | 100.0% |
Transportation & Commute in West Livingston
Vehicle Availability by Sex in West Livingston
The most prevalent vehicle ownership categories in West Livingston are males with 2 vehicles (518, accounting for 53.8%) and females with 2 vehicles (241, making up 105.7%).
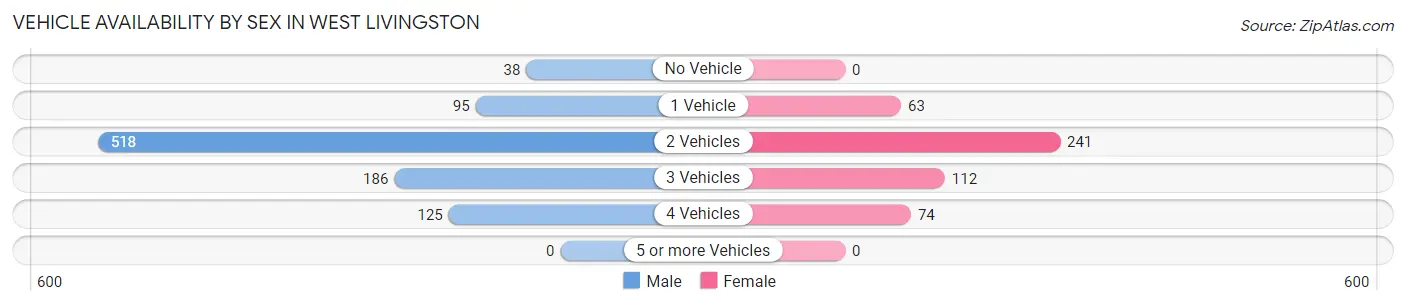
| Vehicles Available | Male | Female |
| No Vehicle | 38 (4.0%) | 0 (0.0%) |
| 1 Vehicle | 95 (9.9%) | 63 (12.9%) |
| 2 Vehicles | 518 (53.8%) | 241 (49.2%) |
| 3 Vehicles | 186 (19.3%) | 112 (22.9%) |
| 4 Vehicles | 125 (13.0%) | 74 (15.1%) |
| 5 or more Vehicles | 0 (0.0%) | 0 (0.0%) |
| Total | 962 (100.0%) | 490 (100.0%) |
Commute Time in West Livingston
The most frequently occuring commute durations in West Livingston are 15 to 19 minutes (217 commuters, 16.5%), 20 to 24 minutes (190 commuters, 14.5%), and 5 to 9 minutes (154 commuters, 11.7%).
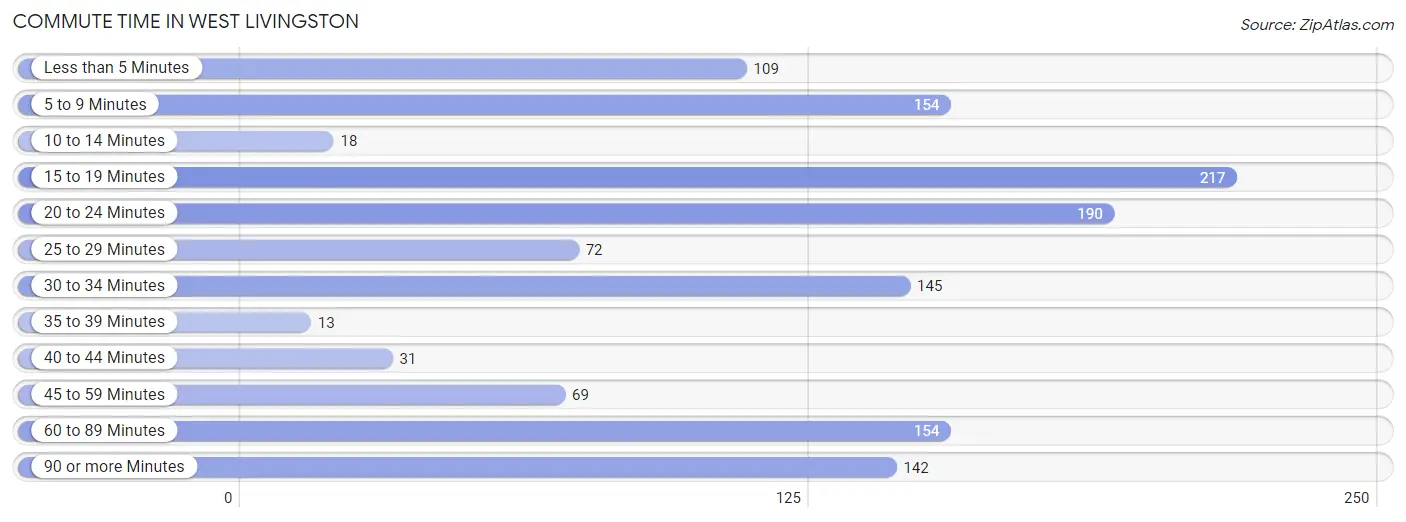
| Commute Time | # Commuters | % Commuters |
| Less than 5 Minutes | 109 | 8.3% |
| 5 to 9 Minutes | 154 | 11.7% |
| 10 to 14 Minutes | 18 | 1.4% |
| 15 to 19 Minutes | 217 | 16.5% |
| 20 to 24 Minutes | 190 | 14.5% |
| 25 to 29 Minutes | 72 | 5.5% |
| 30 to 34 Minutes | 145 | 11.0% |
| 35 to 39 Minutes | 13 | 1.0% |
| 40 to 44 Minutes | 31 | 2.4% |
| 45 to 59 Minutes | 69 | 5.2% |
| 60 to 89 Minutes | 154 | 11.7% |
| 90 or more Minutes | 142 | 10.8% |
Commute Time by Sex in West Livingston
The most common commute times in West Livingston are 90 or more minutes (142 commuters, 15.1%) for males and 15 to 19 minutes (87 commuters, 23.3%) for females.
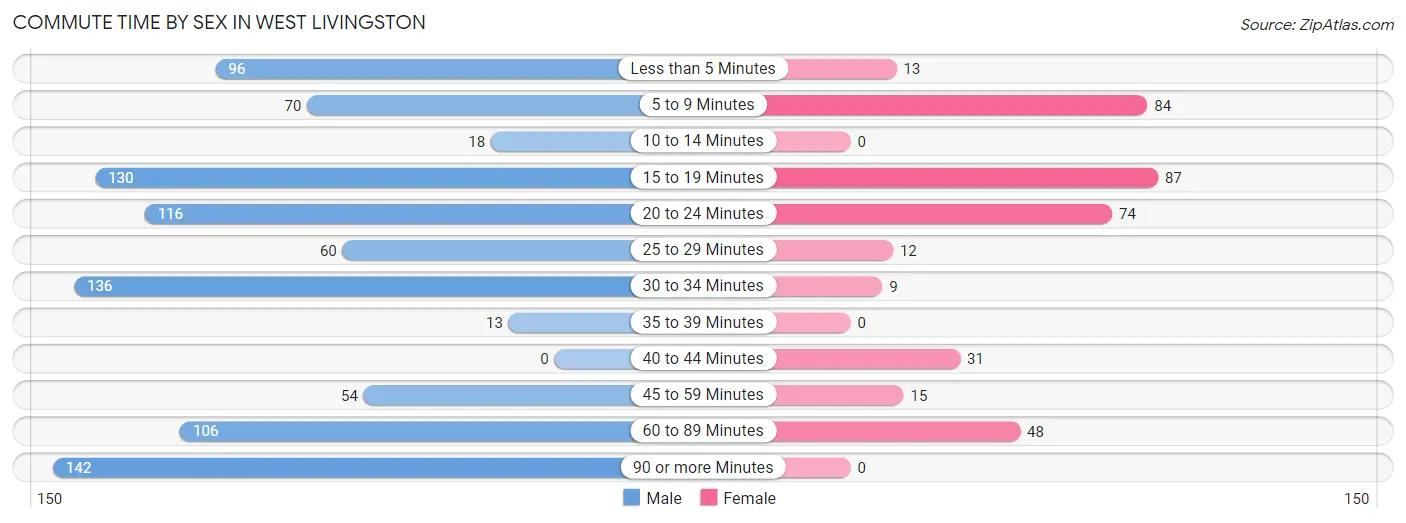
| Commute Time | Male | Female |
| Less than 5 Minutes | 96 (10.2%) | 13 (3.5%) |
| 5 to 9 Minutes | 70 (7.4%) | 84 (22.5%) |
| 10 to 14 Minutes | 18 (1.9%) | 0 (0.0%) |
| 15 to 19 Minutes | 130 (13.8%) | 87 (23.3%) |
| 20 to 24 Minutes | 116 (12.3%) | 74 (19.8%) |
| 25 to 29 Minutes | 60 (6.4%) | 12 (3.2%) |
| 30 to 34 Minutes | 136 (14.4%) | 9 (2.4%) |
| 35 to 39 Minutes | 13 (1.4%) | 0 (0.0%) |
| 40 to 44 Minutes | 0 (0.0%) | 31 (8.3%) |
| 45 to 59 Minutes | 54 (5.7%) | 15 (4.0%) |
| 60 to 89 Minutes | 106 (11.3%) | 48 (12.9%) |
| 90 or more Minutes | 142 (15.1%) | 0 (0.0%) |
Time of Departure to Work by Sex in West Livingston
The most frequent times of departure to work in West Livingston are 12:00 AM to 4:59 AM (206, 21.9%) for males and 7:00 AM to 7:29 AM (79, 21.2%) for females.
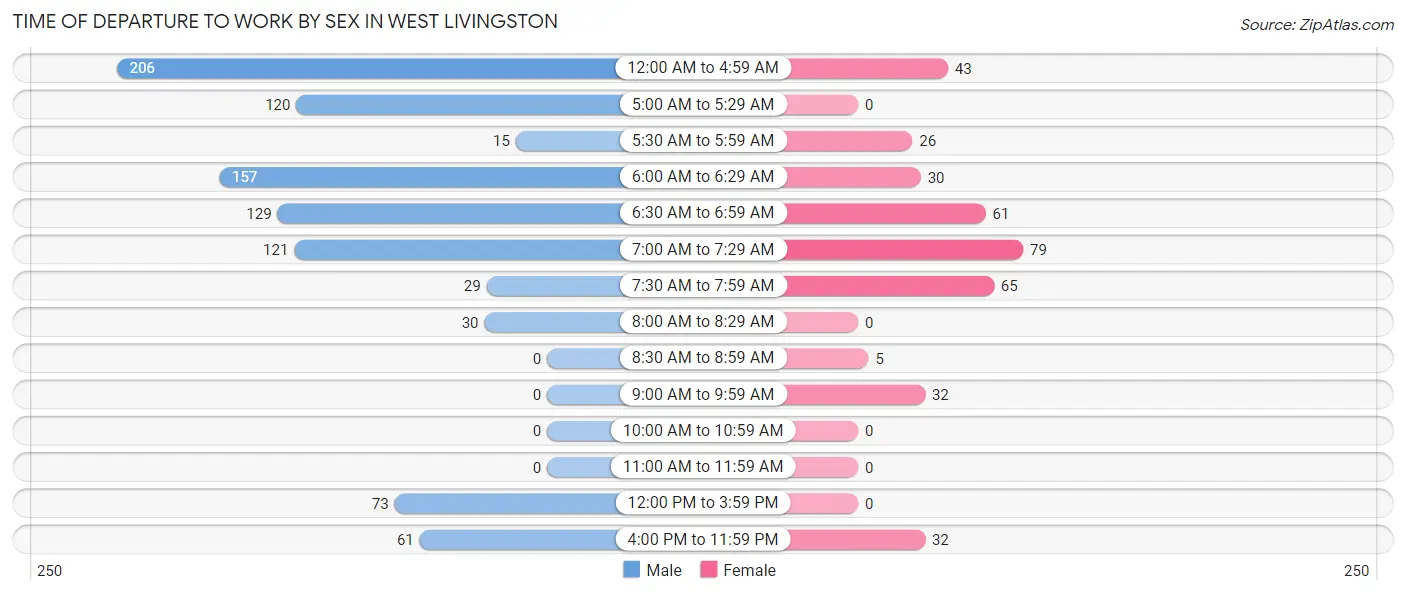
| Time of Departure | Male | Female |
| 12:00 AM to 4:59 AM | 206 (21.9%) | 43 (11.5%) |
| 5:00 AM to 5:29 AM | 120 (12.8%) | 0 (0.0%) |
| 5:30 AM to 5:59 AM | 15 (1.6%) | 26 (7.0%) |
| 6:00 AM to 6:29 AM | 157 (16.7%) | 30 (8.0%) |
| 6:30 AM to 6:59 AM | 129 (13.7%) | 61 (16.4%) |
| 7:00 AM to 7:29 AM | 121 (12.9%) | 79 (21.2%) |
| 7:30 AM to 7:59 AM | 29 (3.1%) | 65 (17.4%) |
| 8:00 AM to 8:29 AM | 30 (3.2%) | 0 (0.0%) |
| 8:30 AM to 8:59 AM | 0 (0.0%) | 5 (1.3%) |
| 9:00 AM to 9:59 AM | 0 (0.0%) | 32 (8.6%) |
| 10:00 AM to 10:59 AM | 0 (0.0%) | 0 (0.0%) |
| 11:00 AM to 11:59 AM | 0 (0.0%) | 0 (0.0%) |
| 12:00 PM to 3:59 PM | 73 (7.8%) | 0 (0.0%) |
| 4:00 PM to 11:59 PM | 61 (6.5%) | 32 (8.6%) |
| Total | 941 (100.0%) | 373 (100.0%) |
Housing Occupancy in West Livingston
Occupancy by Ownership in West Livingston
Of the total 1,584 dwellings in West Livingston, owner-occupied units account for 1,256 (79.3%), while renter-occupied units make up 328 (20.7%).
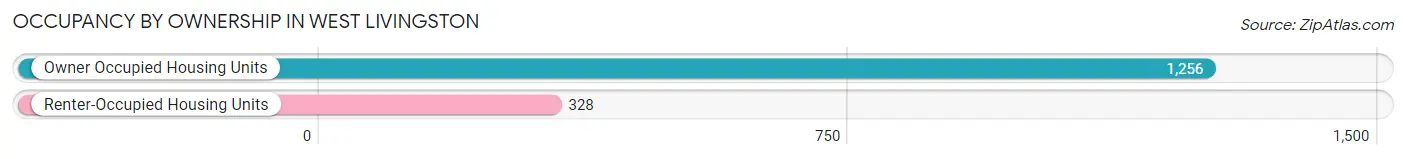
| Occupancy | # Housing Units | % Housing Units |
| Owner Occupied Housing Units | 1,256 | 79.3% |
| Renter-Occupied Housing Units | 328 | 20.7% |
| Total Occupied Housing Units | 1,584 | 100.0% |
Occupancy by Household Size in West Livingston
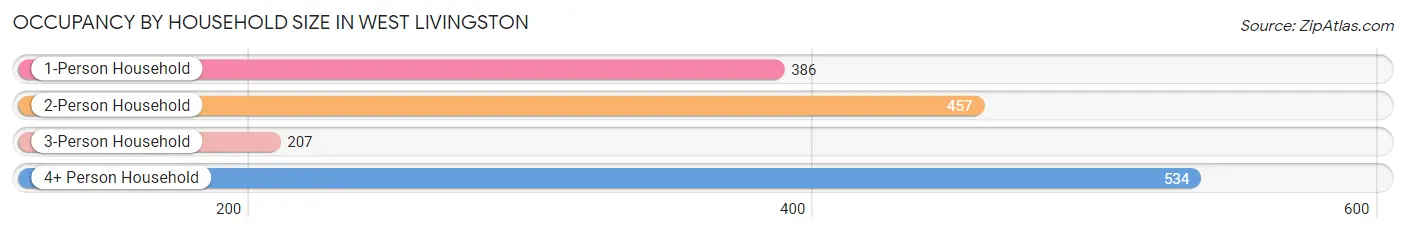
| Household Size | # Housing Units | % Housing Units |
| 1-Person Household | 386 | 24.4% |
| 2-Person Household | 457 | 28.8% |
| 3-Person Household | 207 | 13.1% |
| 4+ Person Household | 534 | 33.7% |
| Total Housing Units | 1,584 | 100.0% |
Occupancy by Ownership by Household Size in West Livingston
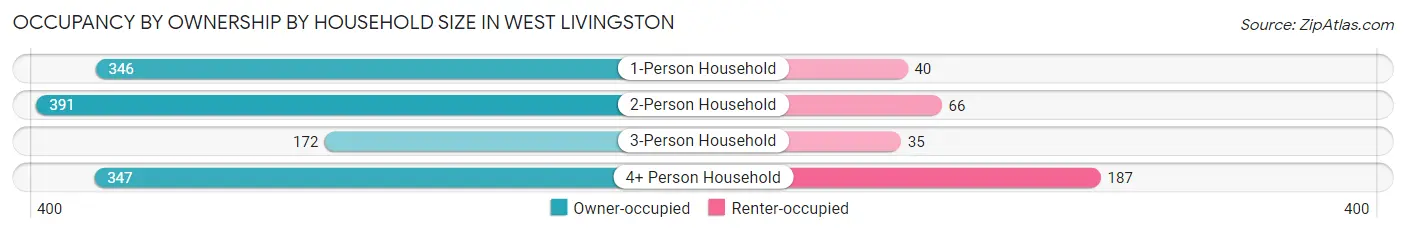
| Household Size | Owner-occupied | Renter-occupied |
| 1-Person Household | 346 (89.6%) | 40 (10.4%) |
| 2-Person Household | 391 (85.6%) | 66 (14.4%) |
| 3-Person Household | 172 (83.1%) | 35 (16.9%) |
| 4+ Person Household | 347 (65.0%) | 187 (35.0%) |
| Total Housing Units | 1,256 (79.3%) | 328 (20.7%) |
Occupancy by Educational Attainment in West Livingston
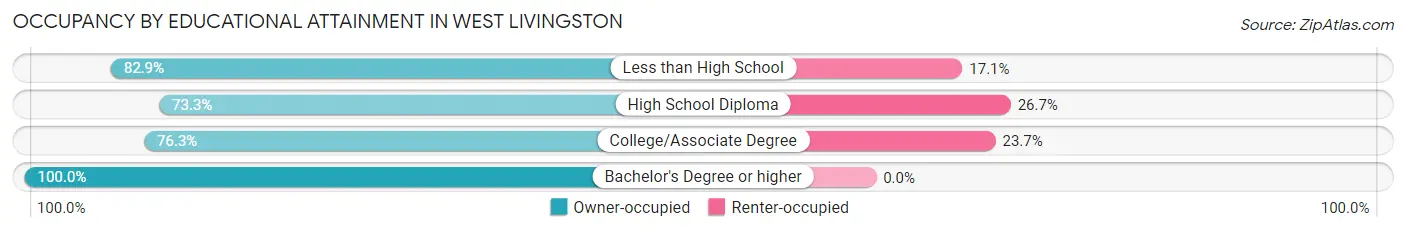
| Household Size | Owner-occupied | Renter-occupied |
| Less than High School | 165 (82.9%) | 34 (17.1%) |
| High School Diploma | 539 (73.3%) | 196 (26.7%) |
| College/Associate Degree | 316 (76.3%) | 98 (23.7%) |
| Bachelor's Degree or higher | 236 (100.0%) | 0 (0.0%) |
Occupancy by Age of Householder in West Livingston
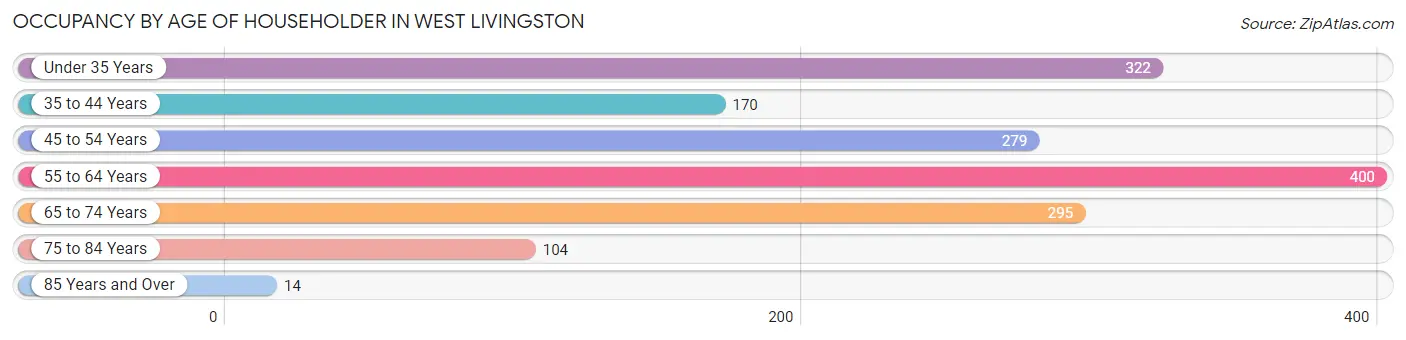
| Age Bracket | # Households | % Households |
| Under 35 Years | 322 | 20.3% |
| 35 to 44 Years | 170 | 10.7% |
| 45 to 54 Years | 279 | 17.6% |
| 55 to 64 Years | 400 | 25.3% |
| 65 to 74 Years | 295 | 18.6% |
| 75 to 84 Years | 104 | 6.6% |
| 85 Years and Over | 14 | 0.9% |
| Total | 1,584 | 100.0% |
Housing Finances in West Livingston
Median Income by Occupancy in West Livingston
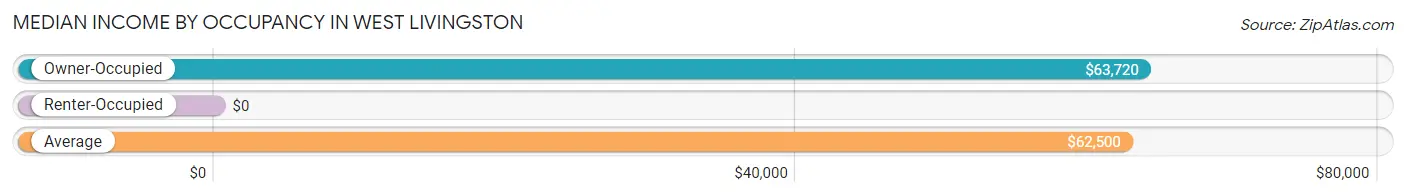
| Occupancy Type | # Households | Median Income |
| Owner-Occupied | 1,256 (79.3%) | $63,720 |
| Renter-Occupied | 328 (20.7%) | $0 |
| Average | 1,584 (100.0%) | $62,500 |
Occupancy by Householder Income Bracket in West Livingston
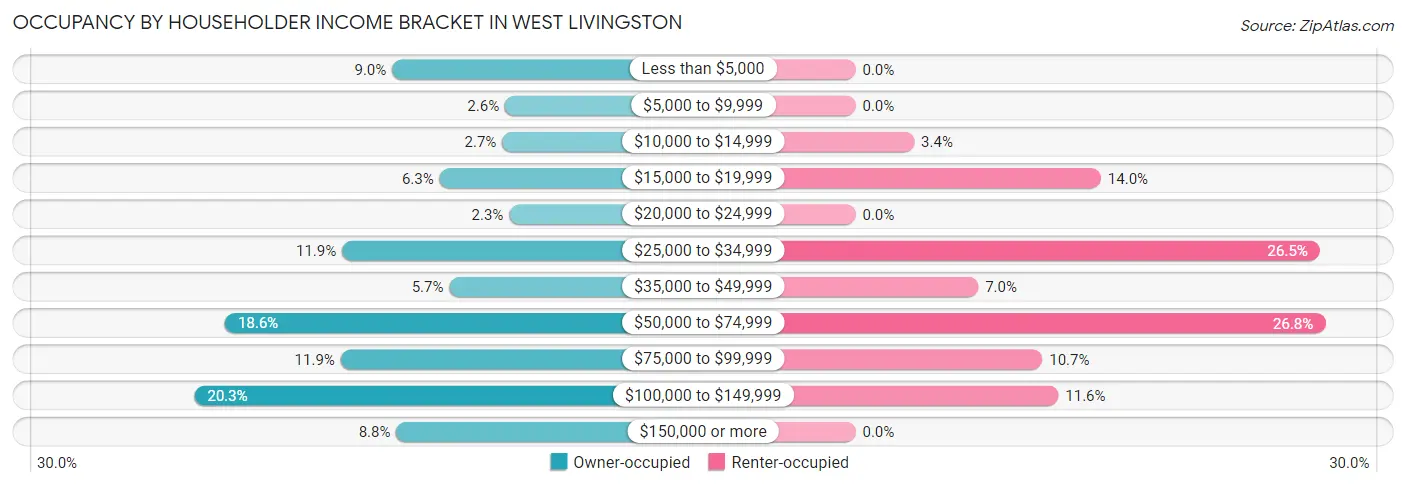
| Income Bracket | Owner-occupied | Renter-occupied |
| Less than $5,000 | 113 (9.0%) | 0 (0.0%) |
| $5,000 to $9,999 | 32 (2.5%) | 0 (0.0%) |
| $10,000 to $14,999 | 34 (2.7%) | 11 (3.4%) |
| $15,000 to $19,999 | 79 (6.3%) | 46 (14.0%) |
| $20,000 to $24,999 | 29 (2.3%) | 0 (0.0%) |
| $25,000 to $34,999 | 149 (11.9%) | 87 (26.5%) |
| $35,000 to $49,999 | 72 (5.7%) | 23 (7.0%) |
| $50,000 to $74,999 | 233 (18.5%) | 88 (26.8%) |
| $75,000 to $99,999 | 150 (11.9%) | 35 (10.7%) |
| $100,000 to $149,999 | 255 (20.3%) | 38 (11.6%) |
| $150,000 or more | 110 (8.8%) | 0 (0.0%) |
| Total | 1,256 (100.0%) | 328 (100.0%) |
Monthly Housing Cost Tiers in West Livingston
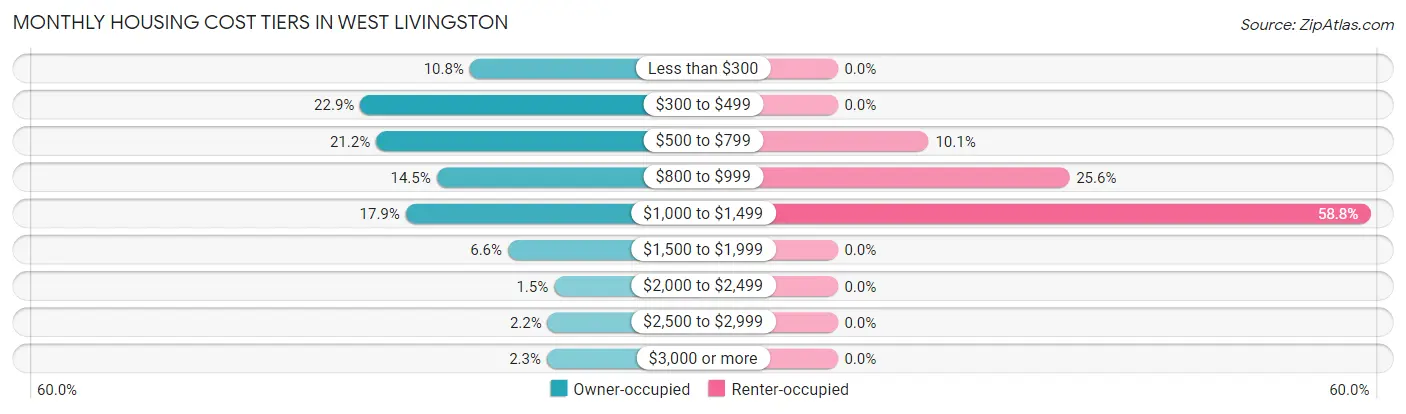
| Monthly Cost | Owner-occupied | Renter-occupied |
| Less than $300 | 136 (10.8%) | 0 (0.0%) |
| $300 to $499 | 288 (22.9%) | 0 (0.0%) |
| $500 to $799 | 266 (21.2%) | 33 (10.1%) |
| $800 to $999 | 182 (14.5%) | 84 (25.6%) |
| $1,000 to $1,499 | 225 (17.9%) | 193 (58.8%) |
| $1,500 to $1,999 | 83 (6.6%) | 0 (0.0%) |
| $2,000 to $2,499 | 19 (1.5%) | 0 (0.0%) |
| $2,500 to $2,999 | 28 (2.2%) | 0 (0.0%) |
| $3,000 or more | 29 (2.3%) | 0 (0.0%) |
| Total | 1,256 (100.0%) | 328 (100.0%) |
Physical Housing Characteristics in West Livingston
Housing Structures in West Livingston
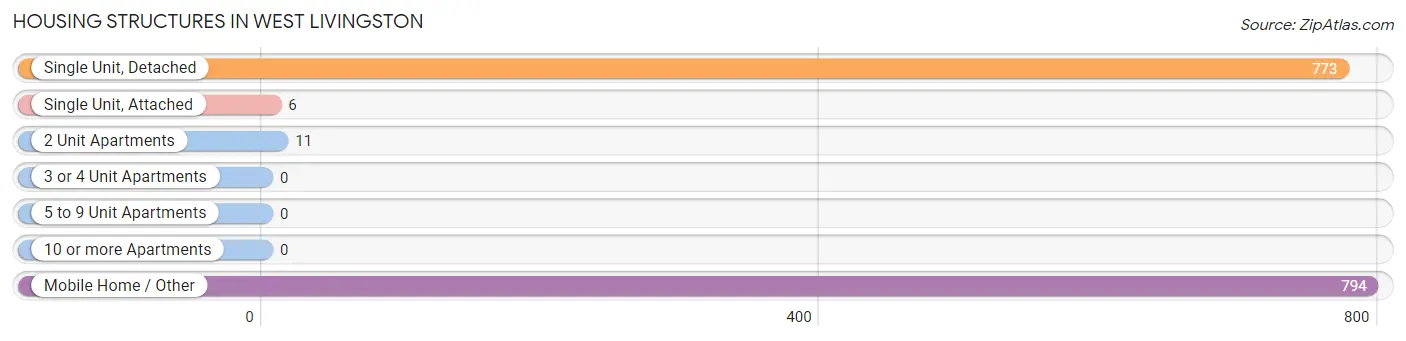
| Structure Type | # Housing Units | % Housing Units |
| Single Unit, Detached | 773 | 48.8% |
| Single Unit, Attached | 6 | 0.4% |
| 2 Unit Apartments | 11 | 0.7% |
| 3 or 4 Unit Apartments | 0 | 0.0% |
| 5 to 9 Unit Apartments | 0 | 0.0% |
| 10 or more Apartments | 0 | 0.0% |
| Mobile Home / Other | 794 | 50.1% |
| Total | 1,584 | 100.0% |
Housing Structures by Occupancy in West Livingston
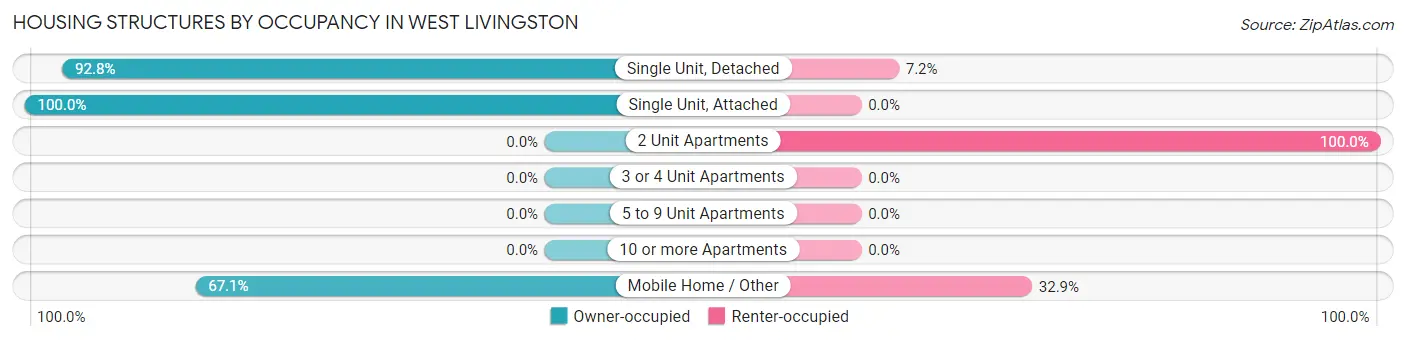
| Structure Type | Owner-occupied | Renter-occupied |
| Single Unit, Detached | 717 (92.8%) | 56 (7.2%) |
| Single Unit, Attached | 6 (100.0%) | 0 (0.0%) |
| 2 Unit Apartments | 0 (0.0%) | 11 (100.0%) |
| 3 or 4 Unit Apartments | 0 (0.0%) | 0 (0.0%) |
| 5 to 9 Unit Apartments | 0 (0.0%) | 0 (0.0%) |
| 10 or more Apartments | 0 (0.0%) | 0 (0.0%) |
| Mobile Home / Other | 533 (67.1%) | 261 (32.9%) |
| Total | 1,256 (79.3%) | 328 (20.7%) |
Housing Structures by Number of Rooms in West Livingston
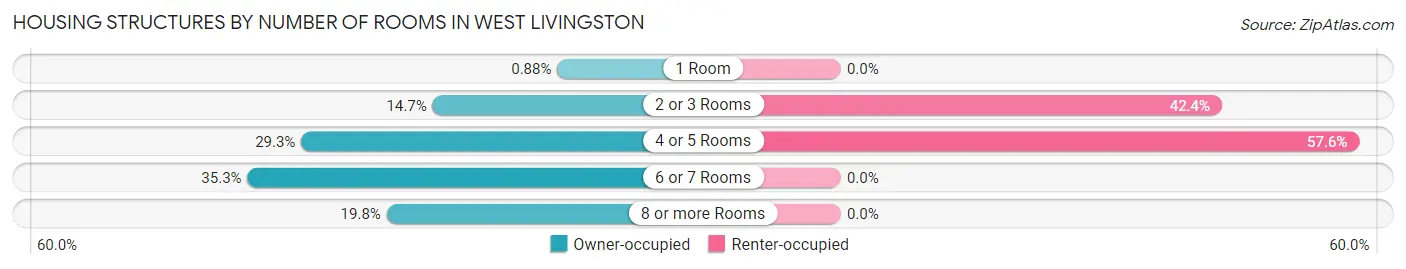
| Number of Rooms | Owner-occupied | Renter-occupied |
| 1 Room | 11 (0.9%) | 0 (0.0%) |
| 2 or 3 Rooms | 185 (14.7%) | 139 (42.4%) |
| 4 or 5 Rooms | 368 (29.3%) | 189 (57.6%) |
| 6 or 7 Rooms | 443 (35.3%) | 0 (0.0%) |
| 8 or more Rooms | 249 (19.8%) | 0 (0.0%) |
| Total | 1,256 (100.0%) | 328 (100.0%) |
Housing Structure by Heating Type in West Livingston
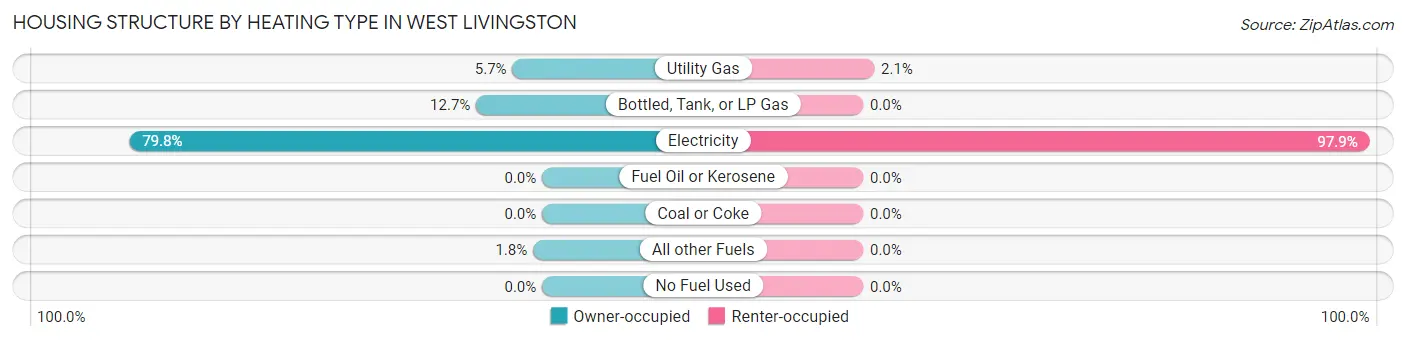
| Heating Type | Owner-occupied | Renter-occupied |
| Utility Gas | 72 (5.7%) | 7 (2.1%) |
| Bottled, Tank, or LP Gas | 160 (12.7%) | 0 (0.0%) |
| Electricity | 1,002 (79.8%) | 321 (97.9%) |
| Fuel Oil or Kerosene | 0 (0.0%) | 0 (0.0%) |
| Coal or Coke | 0 (0.0%) | 0 (0.0%) |
| All other Fuels | 22 (1.8%) | 0 (0.0%) |
| No Fuel Used | 0 (0.0%) | 0 (0.0%) |
| Total | 1,256 (100.0%) | 328 (100.0%) |
Household Vehicle Usage in West Livingston
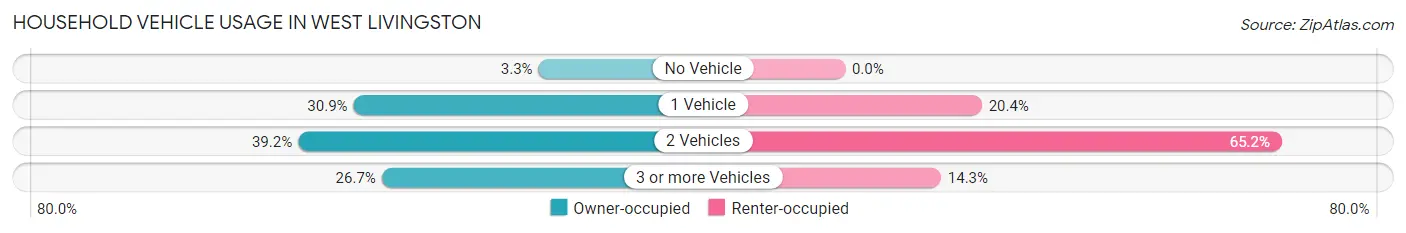
| Vehicles per Household | Owner-occupied | Renter-occupied |
| No Vehicle | 41 (3.3%) | 0 (0.0%) |
| 1 Vehicle | 388 (30.9%) | 67 (20.4%) |
| 2 Vehicles | 492 (39.2%) | 214 (65.2%) |
| 3 or more Vehicles | 335 (26.7%) | 47 (14.3%) |
| Total | 1,256 (100.0%) | 328 (100.0%) |
Real Estate & Mortgages in West Livingston
Real Estate and Mortgage Overview in West Livingston
| Characteristic | Without Mortgage | With Mortgage |
| Housing Units | 788 | 468 |
| Median Property Value | $136,400 | $103,400 |
| Median Household Income | $41,250 | $63 |
| Monthly Housing Costs | $478 | $29 |
| Real Estate Taxes | $1,203 | $58 |
Property Value by Mortgage Status in West Livingston
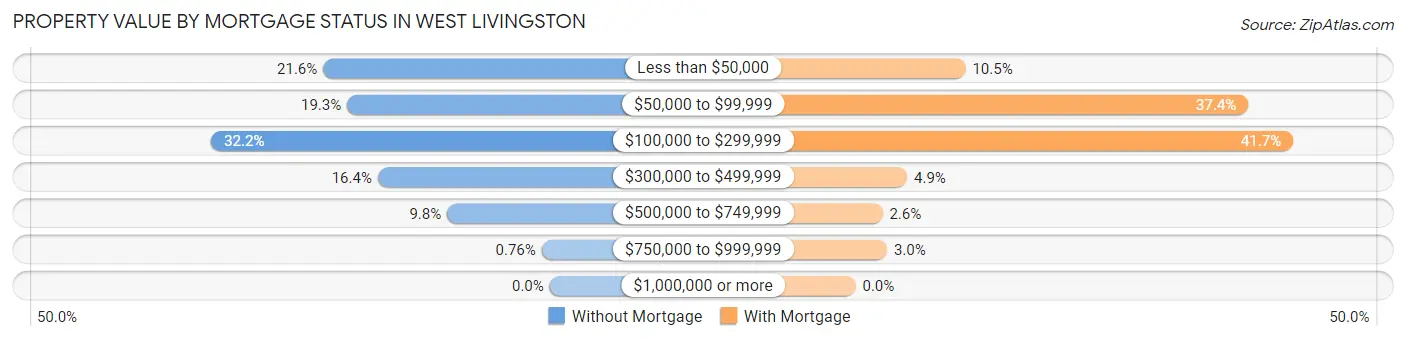
| Property Value | Without Mortgage | With Mortgage |
| Less than $50,000 | 170 (21.6%) | 49 (10.5%) |
| $50,000 to $99,999 | 152 (19.3%) | 175 (37.4%) |
| $100,000 to $299,999 | 254 (32.2%) | 195 (41.7%) |
| $300,000 to $499,999 | 129 (16.4%) | 23 (4.9%) |
| $500,000 to $749,999 | 77 (9.8%) | 12 (2.6%) |
| $750,000 to $999,999 | 6 (0.8%) | 14 (3.0%) |
| $1,000,000 or more | 0 (0.0%) | 0 (0.0%) |
| Total | 788 (100.0%) | 468 (100.0%) |
Household Income by Mortgage Status in West Livingston
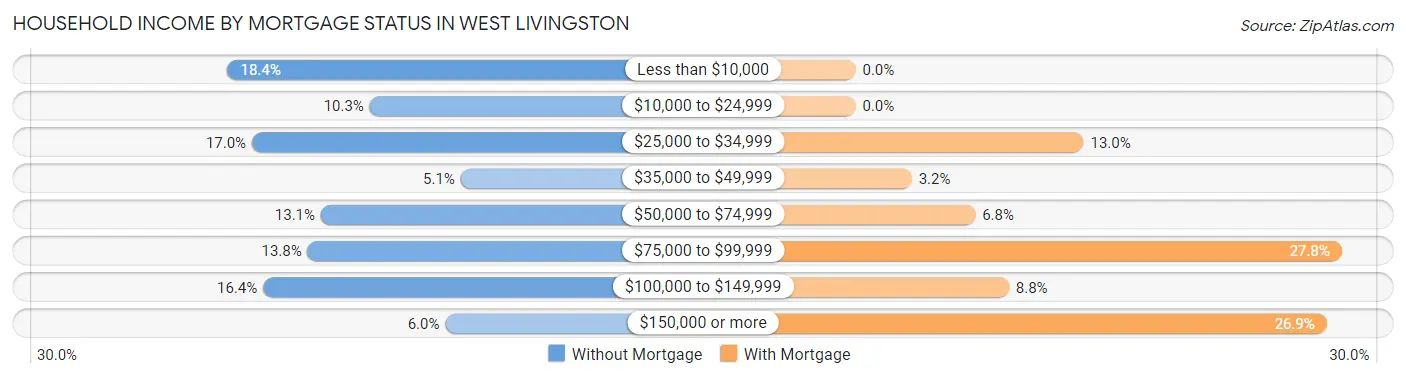
| Household Income | Without Mortgage | With Mortgage |
| Less than $10,000 | 145 (18.4%) | 0 (0.0%) |
| $10,000 to $24,999 | 81 (10.3%) | 0 (0.0%) |
| $25,000 to $34,999 | 134 (17.0%) | 61 (13.0%) |
| $35,000 to $49,999 | 40 (5.1%) | 15 (3.2%) |
| $50,000 to $74,999 | 103 (13.1%) | 32 (6.8%) |
| $75,000 to $99,999 | 109 (13.8%) | 130 (27.8%) |
| $100,000 to $149,999 | 129 (16.4%) | 41 (8.8%) |
| $150,000 or more | 47 (6.0%) | 126 (26.9%) |
| Total | 788 (100.0%) | 468 (100.0%) |
Property Value to Household Income Ratio in West Livingston
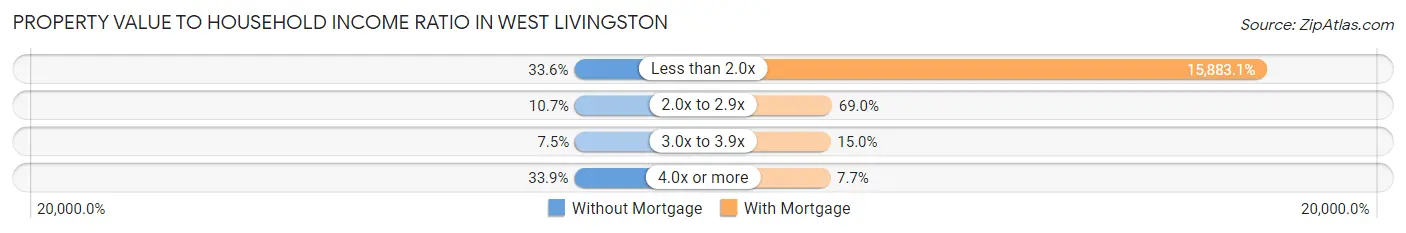
| Value-to-Income Ratio | Without Mortgage | With Mortgage |
| Less than 2.0x | 265 (33.6%) | 74,333 (15,883.1%) |
| 2.0x to 2.9x | 84 (10.7%) | 323 (69.0%) |
| 3.0x to 3.9x | 59 (7.5%) | 70 (15.0%) |
| 4.0x or more | 267 (33.9%) | 36 (7.7%) |
| Total | 788 (100.0%) | 468 (100.0%) |
Real Estate Taxes by Mortgage Status in West Livingston
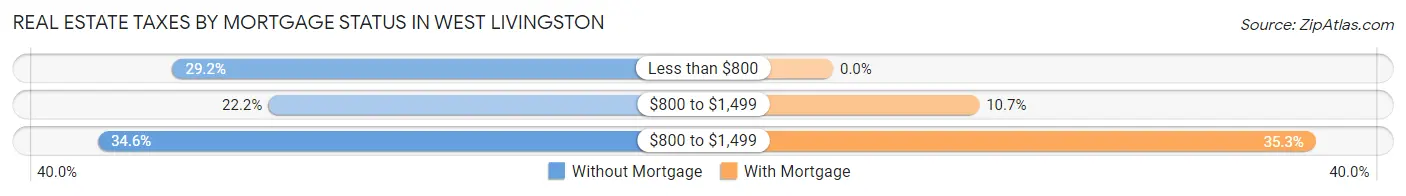
| Property Taxes | Without Mortgage | With Mortgage |
| Less than $800 | 230 (29.2%) | 0 (0.0%) |
| $800 to $1,499 | 175 (22.2%) | 50 (10.7%) |
| $800 to $1,499 | 273 (34.6%) | 165 (35.3%) |
| Total | 788 (100.0%) | 468 (100.0%) |
Health & Disability in West Livingston
Health Insurance Coverage by Age in West Livingston
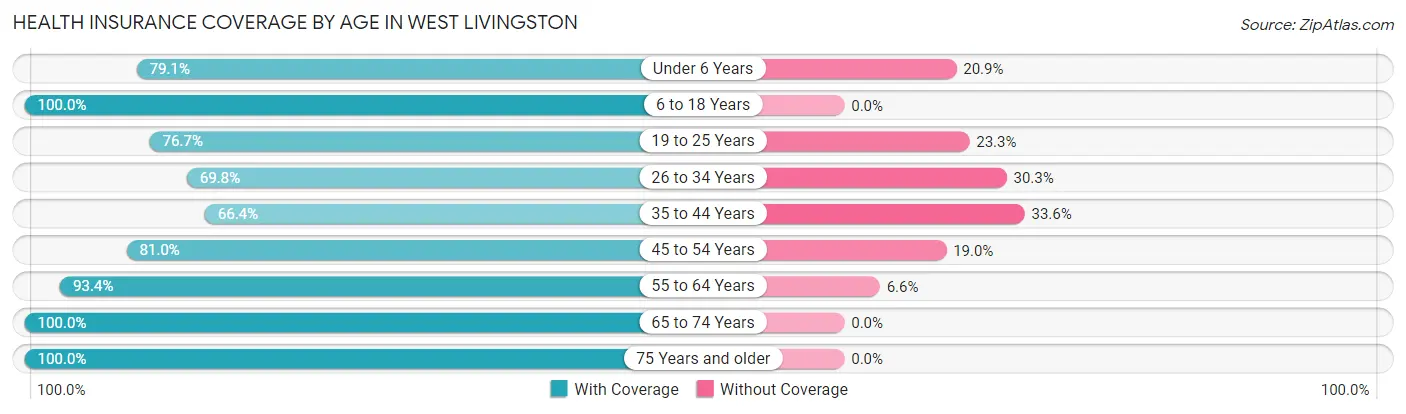
| Age Bracket | With Coverage | Without Coverage |
| Under 6 Years | 360 (79.1%) | 95 (20.9%) |
| 6 to 18 Years | 627 (100.0%) | 0 (0.0%) |
| 19 to 25 Years | 398 (76.7%) | 121 (23.3%) |
| 26 to 34 Years | 339 (69.8%) | 147 (30.2%) |
| 35 to 44 Years | 229 (66.4%) | 116 (33.6%) |
| 45 to 54 Years | 439 (81.0%) | 103 (19.0%) |
| 55 to 64 Years | 623 (93.4%) | 44 (6.6%) |
| 65 to 74 Years | 580 (100.0%) | 0 (0.0%) |
| 75 Years and older | 174 (100.0%) | 0 (0.0%) |
| Total | 3,769 (85.8%) | 626 (14.2%) |
Health Insurance Coverage by Citizenship Status in West Livingston
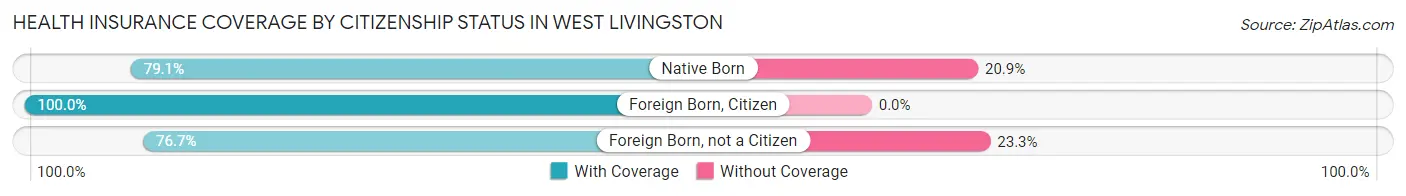
| Citizenship Status | With Coverage | Without Coverage |
| Native Born | 360 (79.1%) | 95 (20.9%) |
| Foreign Born, Citizen | 627 (100.0%) | 0 (0.0%) |
| Foreign Born, not a Citizen | 398 (76.7%) | 121 (23.3%) |
Health Insurance Coverage by Household Income in West Livingston
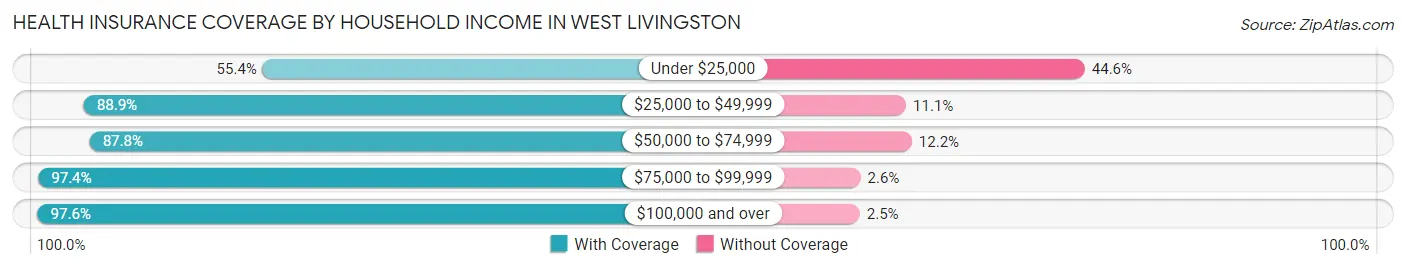
| Household Income | With Coverage | Without Coverage |
| Under $25,000 | 446 (55.4%) | 359 (44.6%) |
| $25,000 to $49,999 | 871 (88.9%) | 109 (11.1%) |
| $50,000 to $74,999 | 842 (87.8%) | 117 (12.2%) |
| $75,000 to $99,999 | 414 (97.4%) | 11 (2.6%) |
| $100,000 and over | 1,196 (97.6%) | 30 (2.5%) |
Public vs Private Health Insurance Coverage by Age in West Livingston
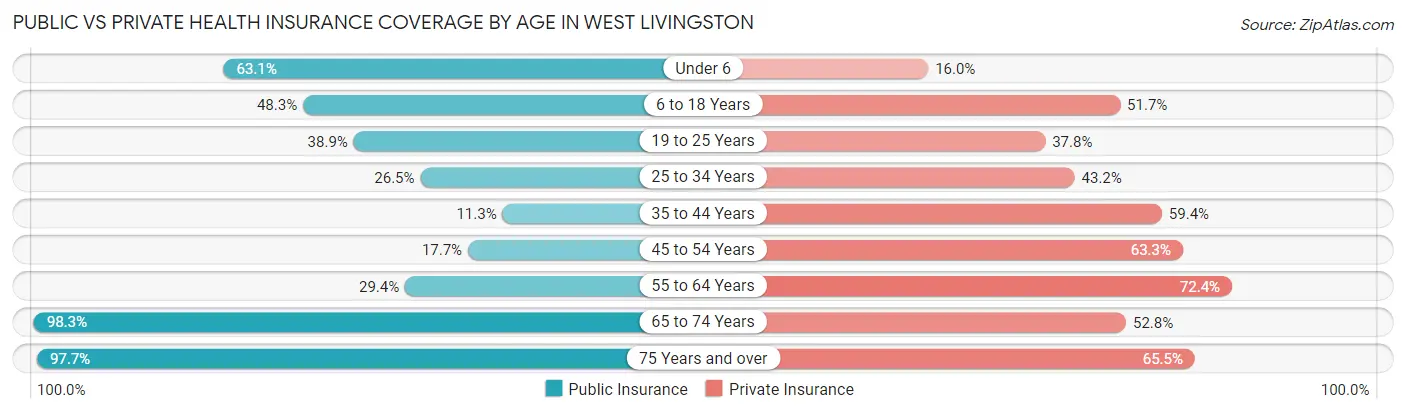
| Age Bracket | Public Insurance | Private Insurance |
| Under 6 | 287 (63.1%) | 73 (16.0%) |
| 6 to 18 Years | 303 (48.3%) | 324 (51.7%) |
| 19 to 25 Years | 202 (38.9%) | 196 (37.8%) |
| 25 to 34 Years | 129 (26.5%) | 210 (43.2%) |
| 35 to 44 Years | 39 (11.3%) | 205 (59.4%) |
| 45 to 54 Years | 96 (17.7%) | 343 (63.3%) |
| 55 to 64 Years | 196 (29.4%) | 483 (72.4%) |
| 65 to 74 Years | 570 (98.3%) | 306 (52.8%) |
| 75 Years and over | 170 (97.7%) | 114 (65.5%) |
| Total | 1,992 (45.3%) | 2,254 (51.3%) |
Disability Status by Sex by Age in West Livingston
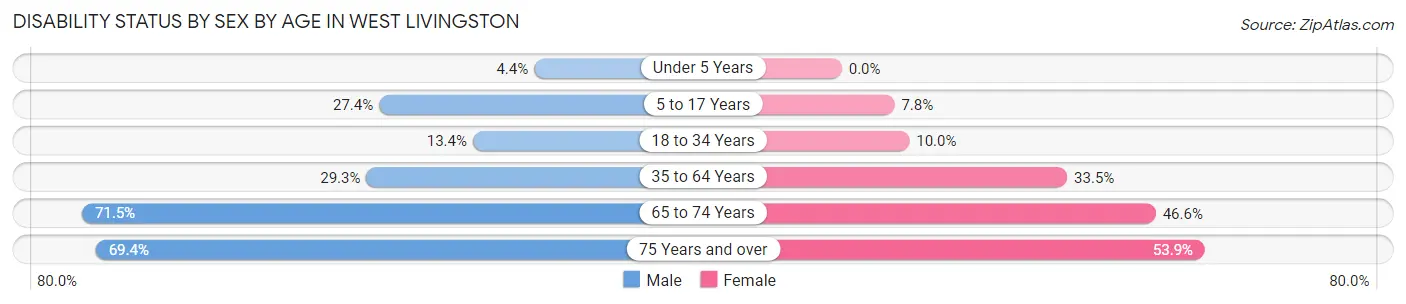
| Age Bracket | Male | Female |
| Under 5 Years | 11 (4.3%) | 0 (0.0%) |
| 5 to 17 Years | 98 (27.4%) | 19 (7.8%) |
| 18 to 34 Years | 82 (13.4%) | 43 (10.0%) |
| 35 to 64 Years | 230 (29.3%) | 257 (33.5%) |
| 65 to 74 Years | 203 (71.5%) | 138 (46.6%) |
| 75 Years and over | 50 (69.4%) | 55 (53.9%) |
Disability Class by Sex by Age in West Livingston
Disability Class: Hearing Difficulty
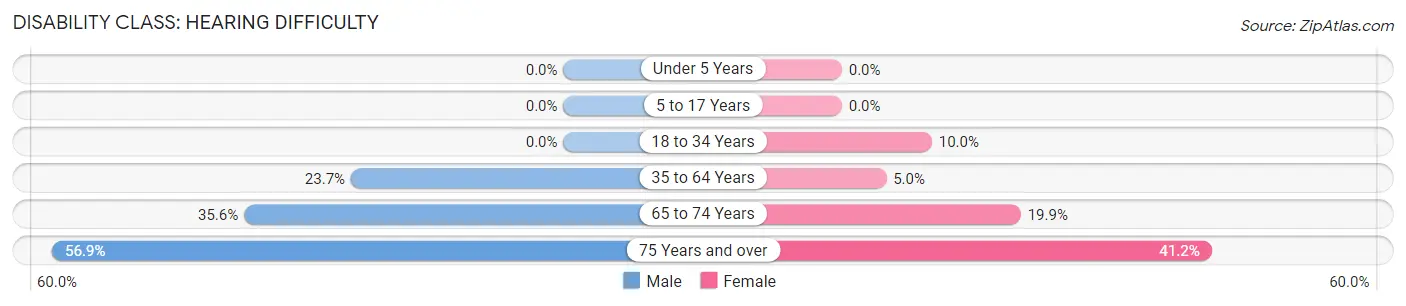
| Age Bracket | Male | Female |
| Under 5 Years | 0 (0.0%) | 0 (0.0%) |
| 5 to 17 Years | 0 (0.0%) | 0 (0.0%) |
| 18 to 34 Years | 0 (0.0%) | 43 (10.0%) |
| 35 to 64 Years | 186 (23.7%) | 38 (5.0%) |
| 65 to 74 Years | 101 (35.6%) | 59 (19.9%) |
| 75 Years and over | 41 (56.9%) | 42 (41.2%) |
Disability Class: Vision Difficulty
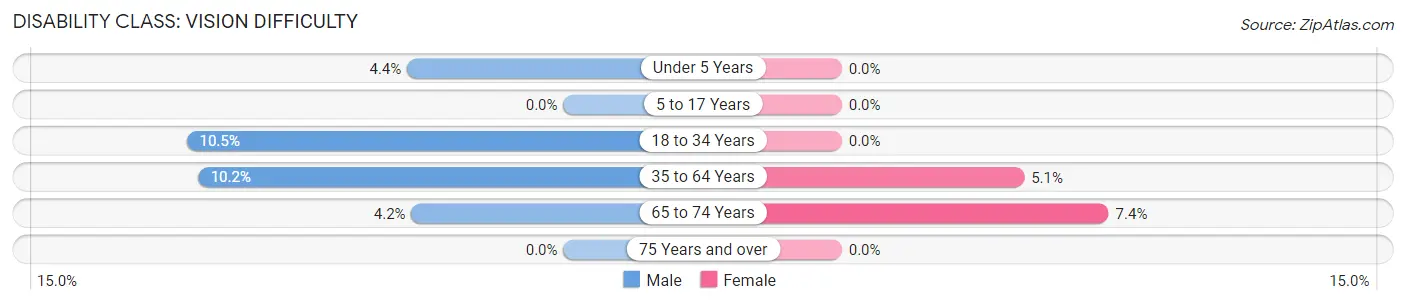
| Age Bracket | Male | Female |
| Under 5 Years | 11 (4.3%) | 0 (0.0%) |
| 5 to 17 Years | 0 (0.0%) | 0 (0.0%) |
| 18 to 34 Years | 64 (10.5%) | 0 (0.0%) |
| 35 to 64 Years | 80 (10.2%) | 39 (5.1%) |
| 65 to 74 Years | 12 (4.2%) | 22 (7.4%) |
| 75 Years and over | 0 (0.0%) | 0 (0.0%) |
Disability Class: Cognitive Difficulty
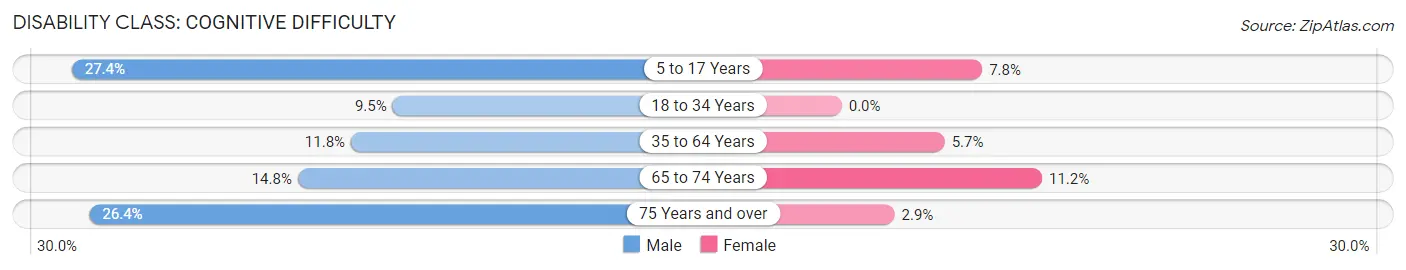
| Age Bracket | Male | Female |
| 5 to 17 Years | 98 (27.4%) | 19 (7.8%) |
| 18 to 34 Years | 58 (9.5%) | 0 (0.0%) |
| 35 to 64 Years | 93 (11.8%) | 44 (5.7%) |
| 65 to 74 Years | 42 (14.8%) | 33 (11.2%) |
| 75 Years and over | 19 (26.4%) | 3 (2.9%) |
Disability Class: Ambulatory Difficulty
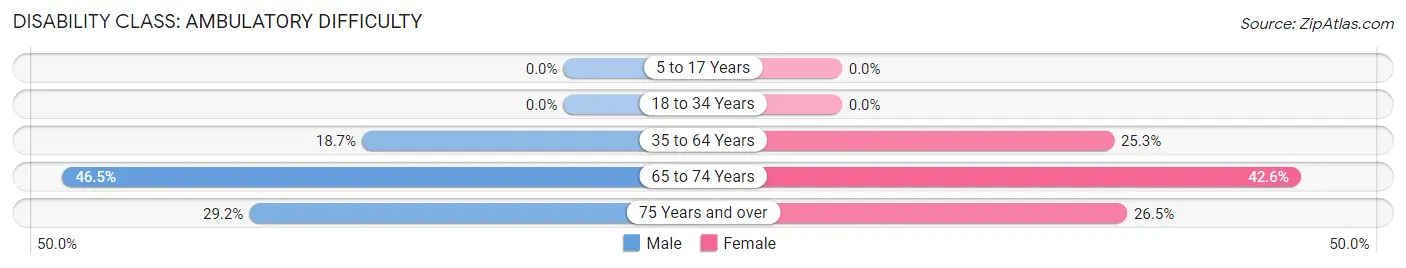
| Age Bracket | Male | Female |
| 5 to 17 Years | 0 (0.0%) | 0 (0.0%) |
| 18 to 34 Years | 0 (0.0%) | 0 (0.0%) |
| 35 to 64 Years | 147 (18.7%) | 194 (25.3%) |
| 65 to 74 Years | 132 (46.5%) | 126 (42.6%) |
| 75 Years and over | 21 (29.2%) | 27 (26.5%) |
Disability Class: Self-Care Difficulty
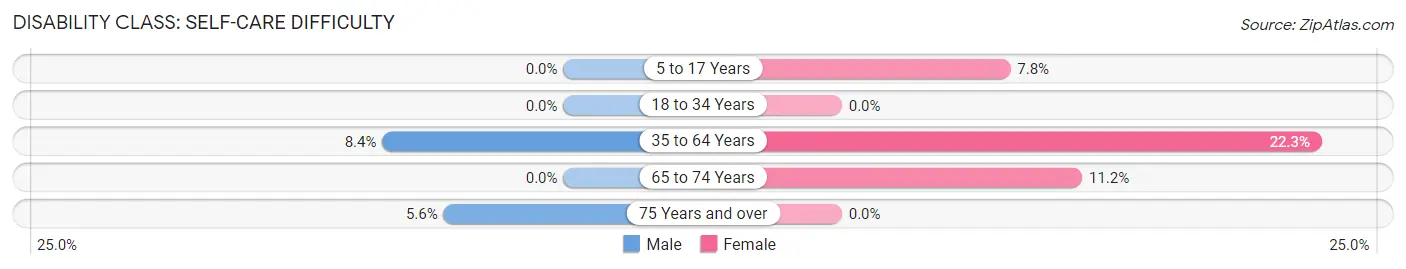
| Age Bracket | Male | Female |
| 5 to 17 Years | 0 (0.0%) | 19 (7.8%) |
| 18 to 34 Years | 0 (0.0%) | 0 (0.0%) |
| 35 to 64 Years | 66 (8.4%) | 171 (22.3%) |
| 65 to 74 Years | 0 (0.0%) | 33 (11.2%) |
| 75 Years and over | 4 (5.6%) | 0 (0.0%) |
Technology Access in West Livingston
Computing Device Access in West Livingston
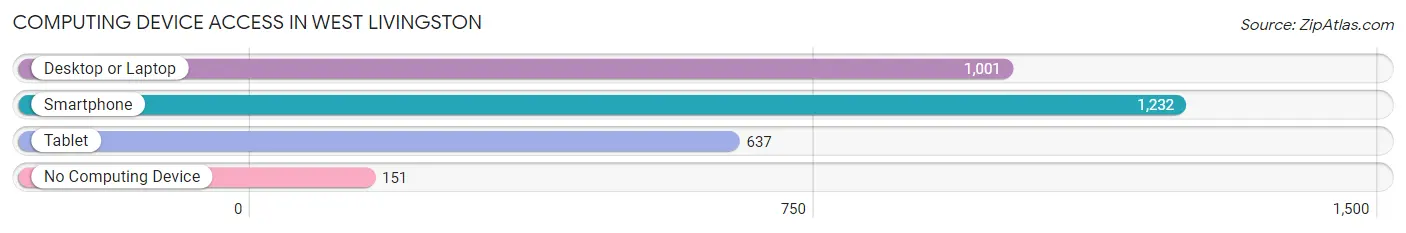
| Device Type | # Households | % Households |
| Desktop or Laptop | 1,001 | 63.2% |
| Smartphone | 1,232 | 77.8% |
| Tablet | 637 | 40.2% |
| No Computing Device | 151 | 9.5% |
| Total | 1,584 | 100.0% |
Internet Access in West Livingston
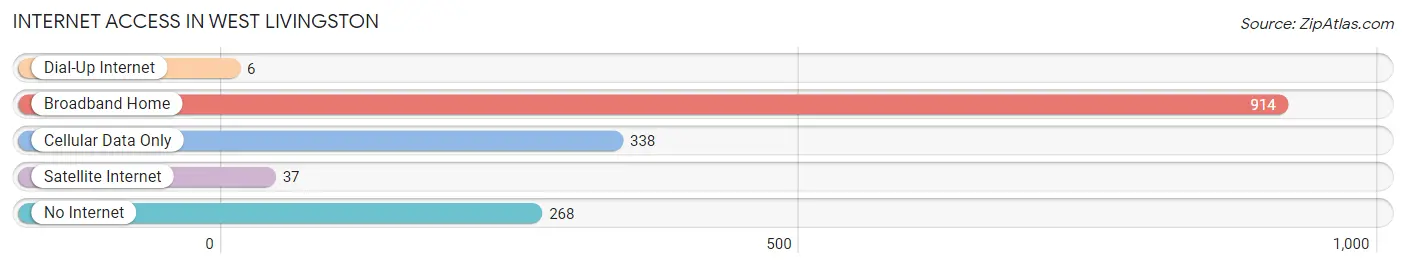
| Internet Type | # Households | % Households |
| Dial-Up Internet | 6 | 0.4% |
| Broadband Home | 914 | 57.7% |
| Cellular Data Only | 338 | 21.3% |
| Satellite Internet | 37 | 2.3% |
| No Internet | 268 | 16.9% |
| Total | 1,584 | 100.0% |
West Livingston Summary
Livingston is a city located in Polk County, Texas, United States. The population was 5,335 at the 2010 census. It is the county seat of Polk County.
History
The area that is now Livingston was first settled in the early 1830s by settlers from the United States and Mexico. The town was originally known as Springfield, but was renamed Livingston in 1846 after Edward Livingston, a former mayor of New York City.
In 1853, the Houston and Great Northern Railroad was built through the town, and the town began to grow. By the late 1800s, Livingston had become a major shipping point for cotton, lumber, and other goods.
In the early 1900s, the town was home to several sawmills, a cotton gin, and a brick factory. The town also had a number of stores, churches, and a bank.
In the 1920s, the town was home to a number of oil wells, and the population began to grow rapidly. By the 1930s, the town had a population of over 2,000 people.
In the 1950s, the town was home to a number of manufacturing plants, including a paper mill, a furniture factory, and a canning factory. The town also had a number of stores, churches, and a bank.
In the 1960s, the town was home to a number of oil wells, and the population began to decline. By the 1970s, the population had dropped to around 1,500 people.
In the 1980s, the town was home to a number of manufacturing plants, including a paper mill, a furniture factory, and a canning factory. The town also had a number of stores, churches, and a bank.
In the 1990s, the town was home to a number of oil wells, and the population began to increase. By the 2000s, the population had grown to over 5,000 people.
Geography
Livingston is located at 30 45 25 North 94 55 17 West 30 756944 94 921389
According to the United States Census Bureau, the city has a total area of 4.3 square miles (11.2 km2), all of it land.
Economy
The economy of Livingston is largely based on the oil and gas industry. The town is home to a number of oil wells, and the town is also home to a number of manufacturing plants, including a paper mill, a furniture factory, and a canning factory.
The town is also home to a number of stores churches and a bank
Demographics
As of the census of 2000, there were 5,335 people, 1,945 households, and 1,364 families residing in the city. The population density was 1,238.2 people per square mile (477.7/km2). There were 2,093 housing units at an average density of 484.2 per square mile (186.9/km2). The racial makeup of the city was 73.17% White, 17.90% African American, 0.45% Native American, 0.45% Asian, 0.02% Pacific Islander, 6.45% from other races, and 1.56% from two or more races. Hispanic or Latino of any race were 12.90% of the population.
There were 1,945 households, out of which 33.2% had children under the age of 18 living with them, 48.2% were married couples living together, 16.2% had a female householder with no husband present, and 30.7% were non-families. 27.2% of all households were made up of individuals, and 14.2% had someone living alone who was 65 years of age or older. The average household size was 2.63 and the average family size was 3.20.
In the city, the population was spread out, with 28.2% under the age of 18, 8.7% from 18 to 24, 25.2% from 25 to 44, 21.2% from 45 to 64, and 16.7% who were 65 years of age or older. The median age was 36 years. For every 100 females, there were 91.2 males. For every 100 females age 18 and over, there were 86.2 males.
The median income for a household in the city was $26,944, and the median income for a family was $32,917. Males had a median income of $27,917 versus $20,000 for females. The per capita income for the city was $14,845. About 17.2% of families and 20.2% of the population were below the poverty line, including 28.2% of those under age 18 and 14.2% of those age 65 or over.
Common Questions
What is the Total Population of West Livingston?
Total Population of West Livingston is 7,559.
What is the Total Male Population of West Livingston?
Total Male Population of West Livingston is 5,527.
What is the Total Female Population of West Livingston?
Total Female Population of West Livingston is 2,032.
What is the Ratio of Males per 100 Females in West Livingston?
There are 272.00 Males per 100 Females in West Livingston.
What is the Ratio of Females per 100 Males in West Livingston?
There are 36.76 Females per 100 Males in West Livingston.
What is the Median Population Age in West Livingston?
Median Population Age in West Livingston is 38.7 Years.
What is the Average Family Size in West Livingston
Average Family Size in West Livingston is 3.2 People.
What is the Average Household Size in West Livingston
Average Household Size in West Livingston is 2.8 People.
What is Per Capita Income in West Livingston?
Per Capita income in West Livingston is $17,135.
What is the Median Family Income in West Livingston?
Median Family Income in West Livingston is $66,250.
What is the Median Household income in West Livingston?
Median Household Income in West Livingston is $62,500.
What is Income or Wage Gap in West Livingston?
Income or Wage Gap in West Livingston is 16.6%.
Women in West Livingston earn 83.4 cents for every dollar earned by a man.
What is Inequality or Gini Index in West Livingston?
Inequality or Gini Index in West Livingston is 0.47.
How Large is the Labor Force in West Livingston?
There are 1,670 People in the Labor Forcein in West Livingston.
What is the Percentage of People in the Labor Force in West Livingston?
25.3% of People are in the Labor Force in West Livingston.
What is the Unemployment Rate in West Livingston?
Unemployment Rate in West Livingston is 10.3%.