Warrensburg, NY
Warrensburg Map
Warrensburg Overview
3,307
TOTAL POPULATION
1,699
MALE POPULATION
1,608
FEMALE POPULATION
105.66
MALES / 100 FEMALES
94.64
FEMALES / 100 MALES
41.3
MEDIAN AGE
2.8
AVG FAMILY SIZE
2.1
AVG HOUSEHOLD SIZE
$31,962
PER CAPITA INCOME
$85,907
AVG FAMILY INCOME
$55,278
AVG HOUSEHOLD INCOME
8.7%
WAGE / INCOME GAP [ % ]
91.3¢/ $1
WAGE / INCOME GAP [ $ ]
0.39
INEQUALITY / GINI INDEX
1,540
LABOR FORCE [ PEOPLE ]
57.3%
PERCENT IN LABOR FORCE
Warrensburg Zip Codes
Warrensburg Area Codes
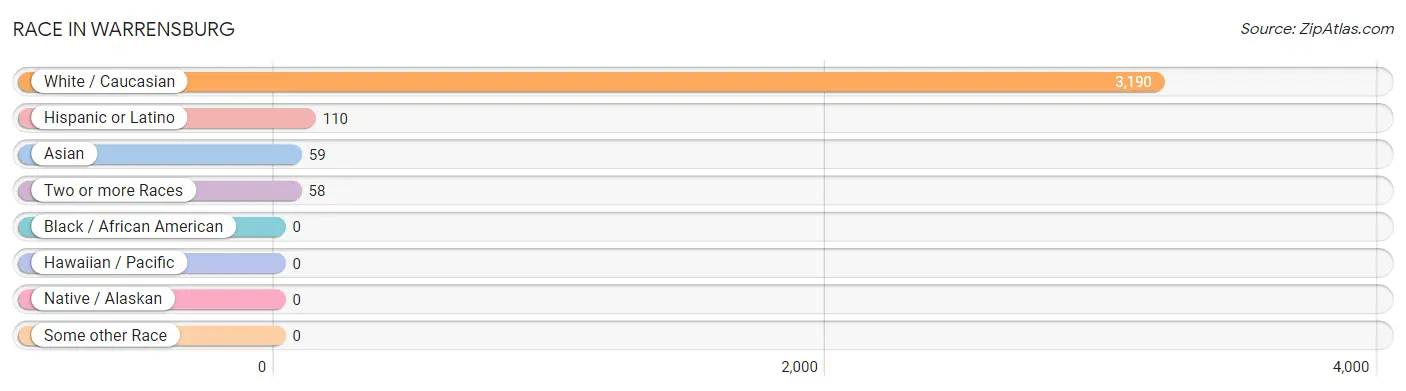
Race in Warrensburg
The most populous races in Warrensburg are White / Caucasian (3,190 | 96.5%), Hispanic or Latino (110 | 3.3%), and Asian (59 | 1.8%).
| Race | # Population | % Population |
| Asian | 59 | 1.8% |
| Black / African American | 0 | 0.0% |
| Hawaiian / Pacific | 0 | 0.0% |
| Hispanic or Latino | 110 | 3.3% |
| Native / Alaskan | 0 | 0.0% |
| White / Caucasian | 3,190 | 96.5% |
| Two or more Races | 58 | 1.8% |
| Some other Race | 0 | 0.0% |
| Total | 3,307 | 100.0% |
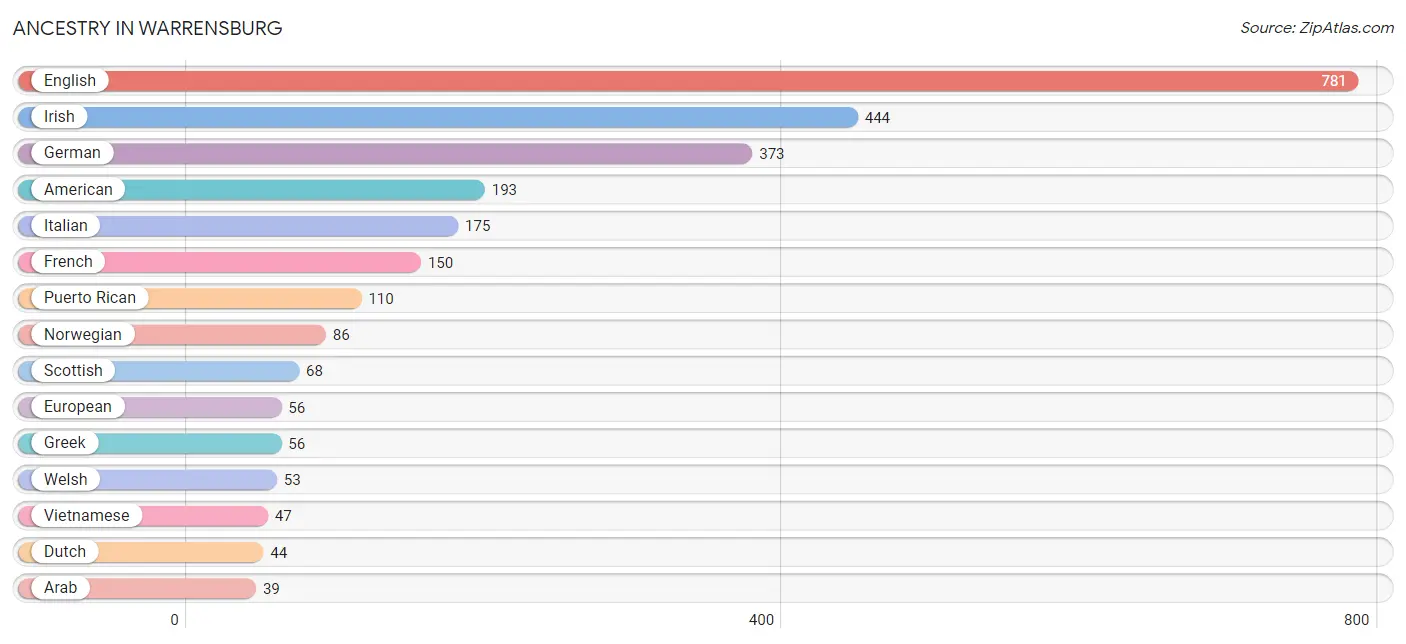
Ancestry in Warrensburg
The most populous ancestries reported in Warrensburg are English (781 | 23.6%), Irish (444 | 13.4%), German (373 | 11.3%), American (193 | 5.8%), and Italian (175 | 5.3%), together accounting for 59.5% of all Warrensburg residents.
| Ancestry | # Population | % Population |
| American | 193 | 5.8% |
| Arab | 39 | 1.2% |
| Austrian | 24 | 0.7% |
| Bhutanese | 12 | 0.4% |
| Blackfeet | 25 | 0.8% |
| British | 8 | 0.2% |
| Canadian | 11 | 0.3% |
| Czech | 31 | 0.9% |
| Czechoslovakian | 7 | 0.2% |
| Dutch | 44 | 1.3% |
| English | 781 | 23.6% |
| European | 56 | 1.7% |
| Finnish | 6 | 0.2% |
| French | 150 | 4.5% |
| French Canadian | 19 | 0.6% |
| German | 373 | 11.3% |
| Greek | 56 | 1.7% |
| Hungarian | 6 | 0.2% |
| Irish | 444 | 13.4% |
| Italian | 175 | 5.3% |
| Norwegian | 86 | 2.6% |
| Polish | 38 | 1.1% |
| Puerto Rican | 110 | 3.3% |
| Romanian | 16 | 0.5% |
| Russian | 14 | 0.4% |
| Scotch-Irish | 10 | 0.3% |
| Scottish | 68 | 2.1% |
| Swedish | 22 | 0.7% |
| Syrian | 39 | 1.2% |
| Turkish | 13 | 0.4% |
| Vietnamese | 47 | 1.4% |
| Welsh | 53 | 1.6% | View All 32 Rows |
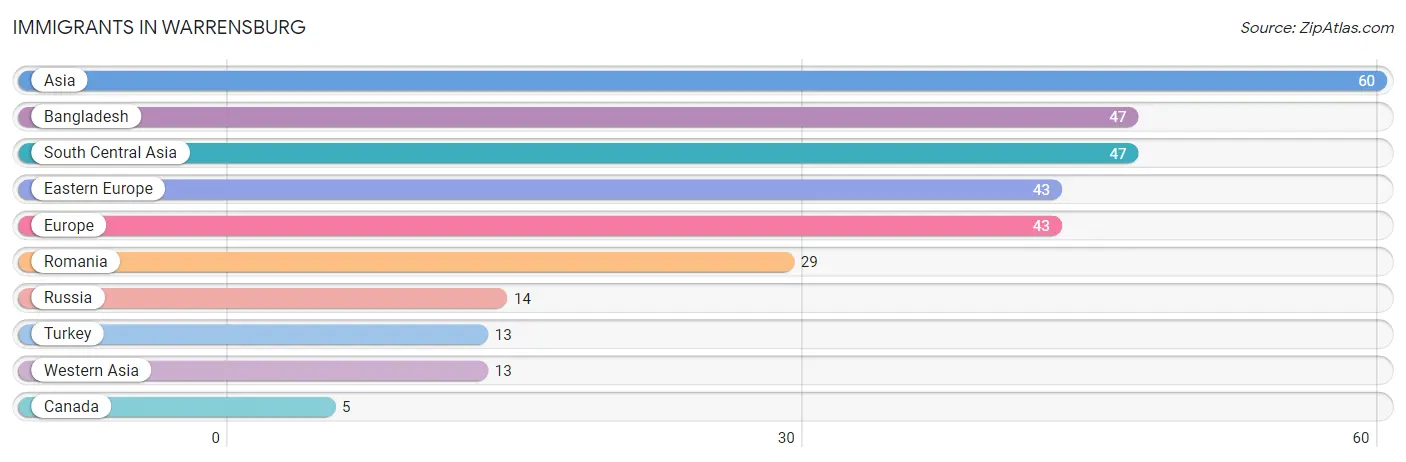
Immigrants in Warrensburg
The most numerous immigrant groups reported in Warrensburg came from Asia (60 | 1.8%), Bangladesh (47 | 1.4%), South Central Asia (47 | 1.4%), Eastern Europe (43 | 1.3%), and Europe (43 | 1.3%), together accounting for 7.2% of all Warrensburg residents.
| Immigration Origin | # Population | % Population |
| Asia | 60 | 1.8% |
| Bangladesh | 47 | 1.4% |
| Canada | 5 | 0.2% |
| Eastern Europe | 43 | 1.3% |
| Europe | 43 | 1.3% |
| Romania | 29 | 0.9% |
| Russia | 14 | 0.4% |
| South Central Asia | 47 | 1.4% |
| Turkey | 13 | 0.4% |
| Western Asia | 13 | 0.4% | View All 10 Rows |
Sex and Age in Warrensburg
Sex and Age in Warrensburg
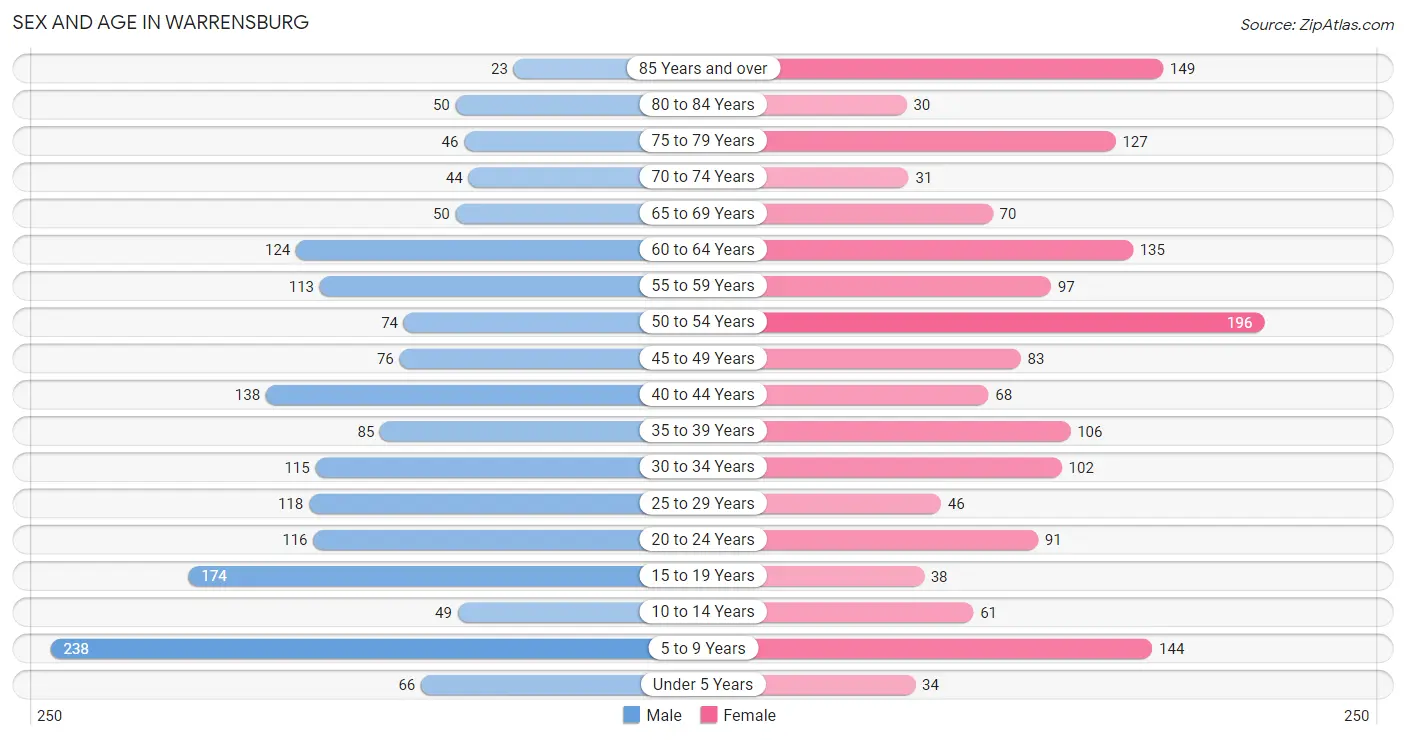
The most populous age groups in Warrensburg are 5 to 9 Years (238 | 14.0%) for men and 50 to 54 Years (196 | 12.2%) for women.
| Age Bracket | Male | Female |
| Under 5 Years | 66 (3.9%) | 34 (2.1%) |
| 5 to 9 Years | 238 (14.0%) | 144 (9.0%) |
| 10 to 14 Years | 49 (2.9%) | 61 (3.8%) |
| 15 to 19 Years | 174 (10.2%) | 38 (2.4%) |
| 20 to 24 Years | 116 (6.8%) | 91 (5.7%) |
| 25 to 29 Years | 118 (7.0%) | 46 (2.9%) |
| 30 to 34 Years | 115 (6.8%) | 102 (6.3%) |
| 35 to 39 Years | 85 (5.0%) | 106 (6.6%) |
| 40 to 44 Years | 138 (8.1%) | 68 (4.2%) |
| 45 to 49 Years | 76 (4.5%) | 83 (5.2%) |
| 50 to 54 Years | 74 (4.4%) | 196 (12.2%) |
| 55 to 59 Years | 113 (6.7%) | 97 (6.0%) |
| 60 to 64 Years | 124 (7.3%) | 135 (8.4%) |
| 65 to 69 Years | 50 (2.9%) | 70 (4.3%) |
| 70 to 74 Years | 44 (2.6%) | 31 (1.9%) |
| 75 to 79 Years | 46 (2.7%) | 127 (7.9%) |
| 80 to 84 Years | 50 (2.9%) | 30 (1.9%) |
| 85 Years and over | 23 (1.3%) | 149 (9.3%) |
| Total | 1,699 (100.0%) | 1,608 (100.0%) |
Families and Households in Warrensburg
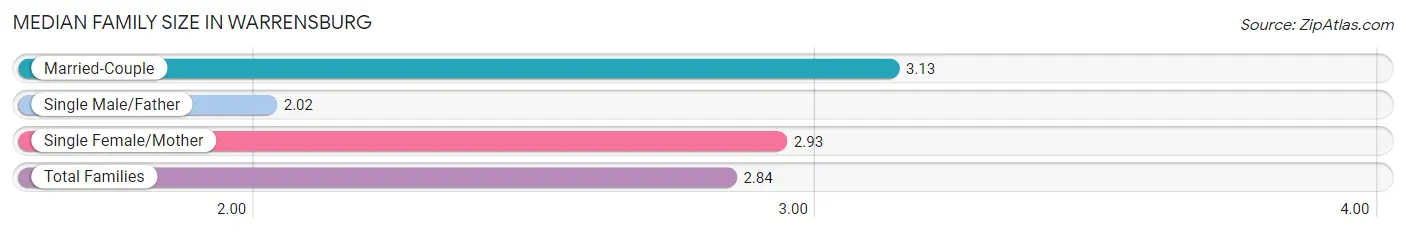
Median Family Size in Warrensburg
The median family size in Warrensburg is 2.84 persons per family, with married-couple families (491 | 64.5%) accounting for the largest median family size of 3.13 persons per family. On the other hand, single male/father families (183 | 24.0%) represent the smallest median family size with 2.02 persons per family.
| Family Type | # Families | Family Size |
| Married-Couple | 491 (64.5%) | 3.13 |
| Single Male/Father | 183 (24.0%) | 2.02 |
| Single Female/Mother | 87 (11.4%) | 2.93 |
| Total Families | 761 (100.0%) | 2.84 |
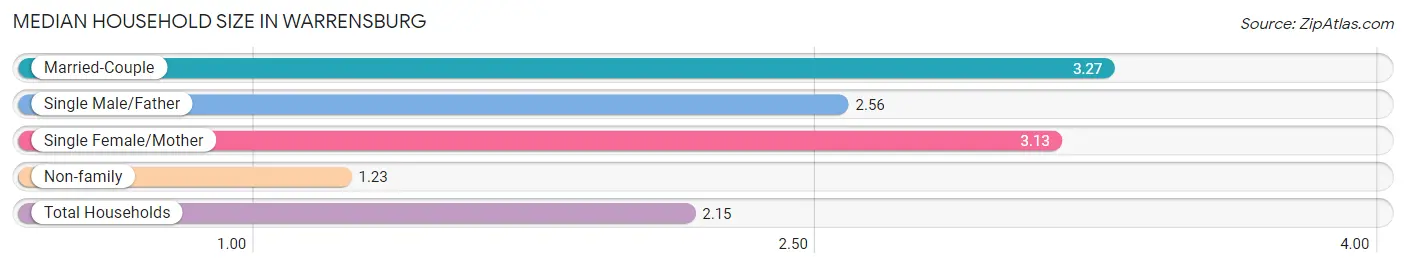
Median Household Size in Warrensburg
The median household size in Warrensburg is 2.15 persons per household, with married-couple households (491 | 32.1%) accounting for the largest median household size of 3.27 persons per household. non-family households (767 | 50.2%) represent the smallest median household size with 1.23 persons per household.
| Household Type | # Households | Household Size |
| Married-Couple | 491 (32.1%) | 3.27 |
| Single Male/Father | 183 (12.0%) | 2.56 |
| Single Female/Mother | 87 (5.7%) | 3.13 |
| Non-family | 767 (50.2%) | 1.23 |
| Total Households | 1,528 (100.0%) | 2.15 |
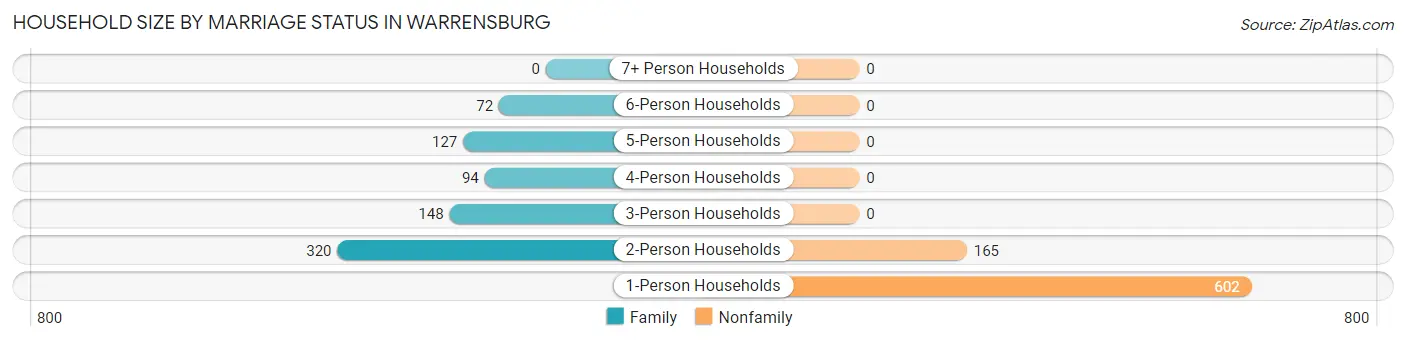
Household Size by Marriage Status in Warrensburg
Out of a total of 1,528 households in Warrensburg, 761 (49.8%) are family households, while 767 (50.2%) are nonfamily households. The most numerous type of family households are 2-person households, comprising 320, and the most common type of nonfamily households are 1-person households, comprising 602.
| Household Size | Family Households | Nonfamily Households |
| 1-Person Households | - | 602 (39.4%) |
| 2-Person Households | 320 (20.9%) | 165 (10.8%) |
| 3-Person Households | 148 (9.7%) | 0 (0.0%) |
| 4-Person Households | 94 (6.1%) | 0 (0.0%) |
| 5-Person Households | 127 (8.3%) | 0 (0.0%) |
| 6-Person Households | 72 (4.7%) | 0 (0.0%) |
| 7+ Person Households | 0 (0.0%) | 0 (0.0%) |
| Total | 761 (49.8%) | 767 (50.2%) |
Female Fertility in Warrensburg
Fertility by Age in Warrensburg
Average fertility rate in Warrensburg is 15.0 births per 1,000 women. Women in the age bracket of 35 to 50 years have the highest fertility rate with 27.0 births per 1,000 women. Women in the age bracket of 35 to 50 years acount for 100.0% of all women with births.
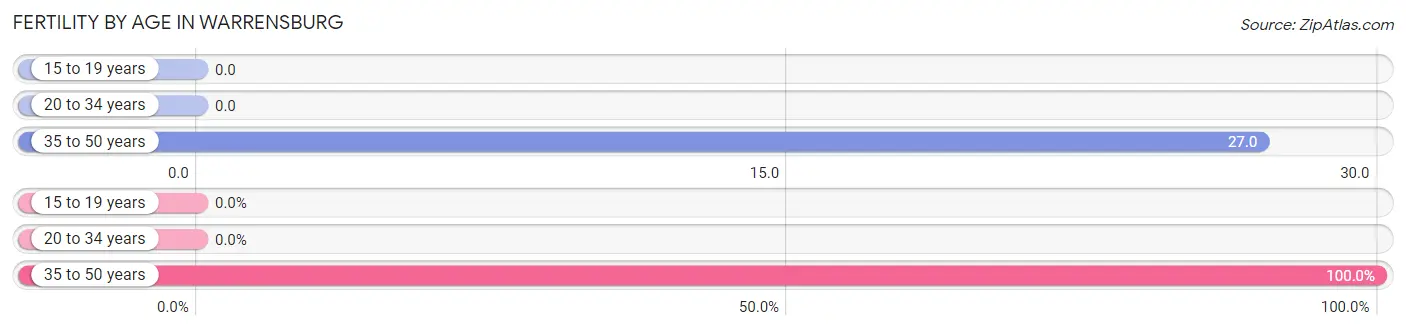
| Age Bracket | Women with Births | Births / 1,000 Women |
| 15 to 19 years | 0 (0.0%) | 0.0 |
| 20 to 34 years | 0 (0.0%) | 0.0 |
| 35 to 50 years | 9 (100.0%) | 27.0 |
| Total | 9 (100.0%) | 15.0 |
Fertility by Age by Marriage Status in Warrensburg
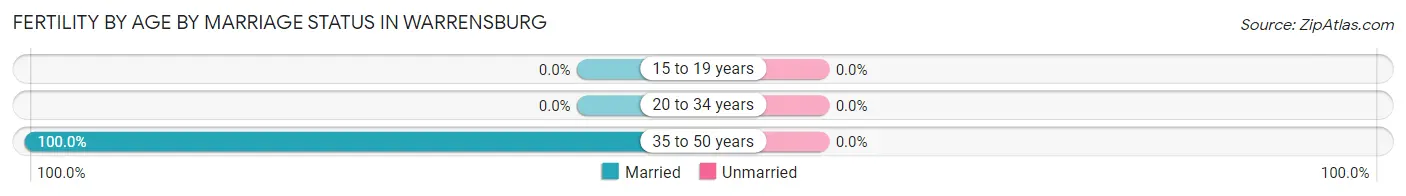
| Age Bracket | Married | Unmarried |
| 15 to 19 years | 0 (0.0%) | 0 (0.0%) |
| 20 to 34 years | 0 (0.0%) | 0 (0.0%) |
| 35 to 50 years | 9 (100.0%) | 0 (0.0%) |
| Total | 9 (100.0%) | 0 (0.0%) |
Fertility by Education in Warrensburg
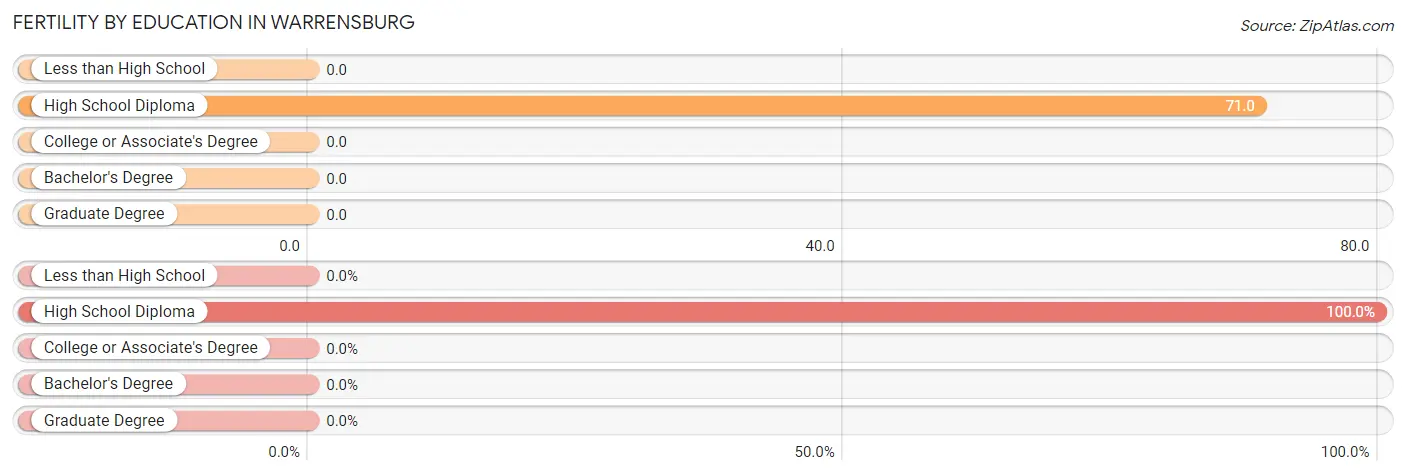
| Educational Attainment | Women with Births | Births / 1,000 Women |
| Less than High School | 0 (0.0%) | 0.0 |
| High School Diploma | 9 (100.0%) | 71.0 |
| College or Associate's Degree | 0 (0.0%) | 0.0 |
| Bachelor's Degree | 0 (0.0%) | 0.0 |
| Graduate Degree | 0 (0.0%) | 0.0 |
| Total | 9 (100.0%) | 15.0 |
Fertility by Education by Marriage Status in Warrensburg
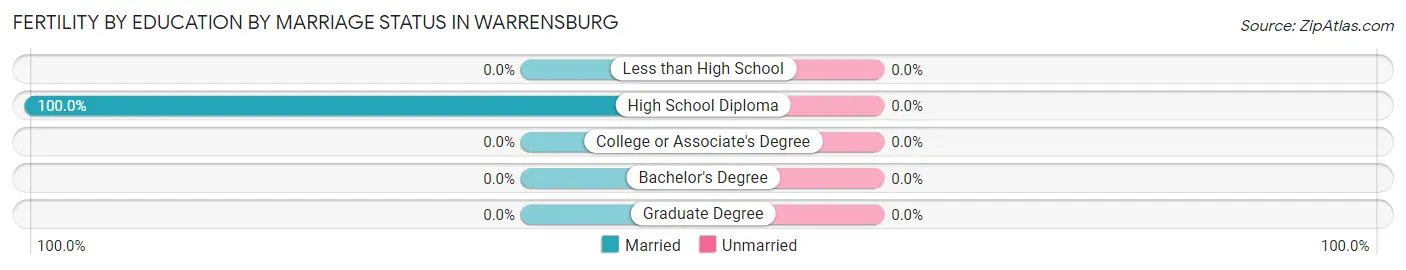
| Educational Attainment | Married | Unmarried |
| Less than High School | 0 (0.0%) | 0 (0.0%) |
| High School Diploma | 9 (100.0%) | 0 (0.0%) |
| College or Associate's Degree | 0 (0.0%) | 0 (0.0%) |
| Bachelor's Degree | 0 (0.0%) | 0 (0.0%) |
| Graduate Degree | 0 (0.0%) | 0 (0.0%) |
| Total | 9 (100.0%) | 0 (0.0%) |
Income in Warrensburg
Income Overview in Warrensburg
Per Capita Income in Warrensburg is $31,962, while median incomes of families and households are $85,907 and $55,278 respectively.
| Characteristic | Number | Measure |
| Per Capita Income | 3,307 | $31,962 |
| Median Family Income | 761 | $85,907 |
| Mean Family Income | 761 | $86,492 |
| Median Household Income | 1,528 | $55,278 |
| Mean Household Income | 1,528 | $69,739 |
| Income Deficit | 761 | $0 |
| Wage / Income Gap (%) | 3,307 | 8.67% |
| Wage / Income Gap ($) | 3,307 | 91.33¢ per $1 |
| Gini / Inequality Index | 3,307 | 0.39 |
Earnings by Sex in Warrensburg
Average Earnings in Warrensburg are $46,565, $49,190 for men and $44,924 for women, a difference of 8.7%.
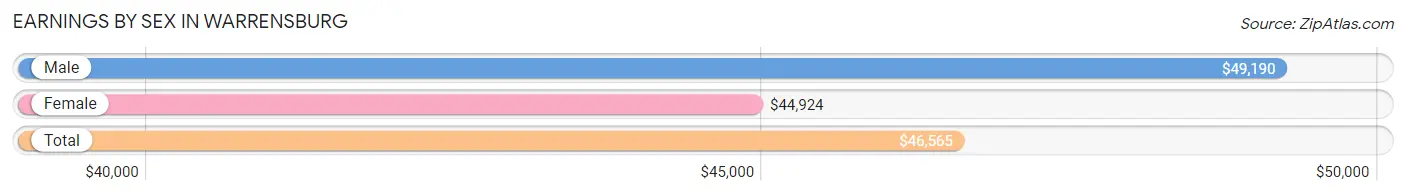
| Sex | Number | Average Earnings |
| Male | 915 (52.4%) | $49,190 |
| Female | 831 (47.6%) | $44,924 |
| Total | 1,746 (100.0%) | $46,565 |
Earnings by Sex by Income Bracket in Warrensburg
The most common earnings brackets in Warrensburg are $55,000 to $64,999 for men (179 | 19.6%) and $45,000 to $49,999 for women (169 | 20.3%).
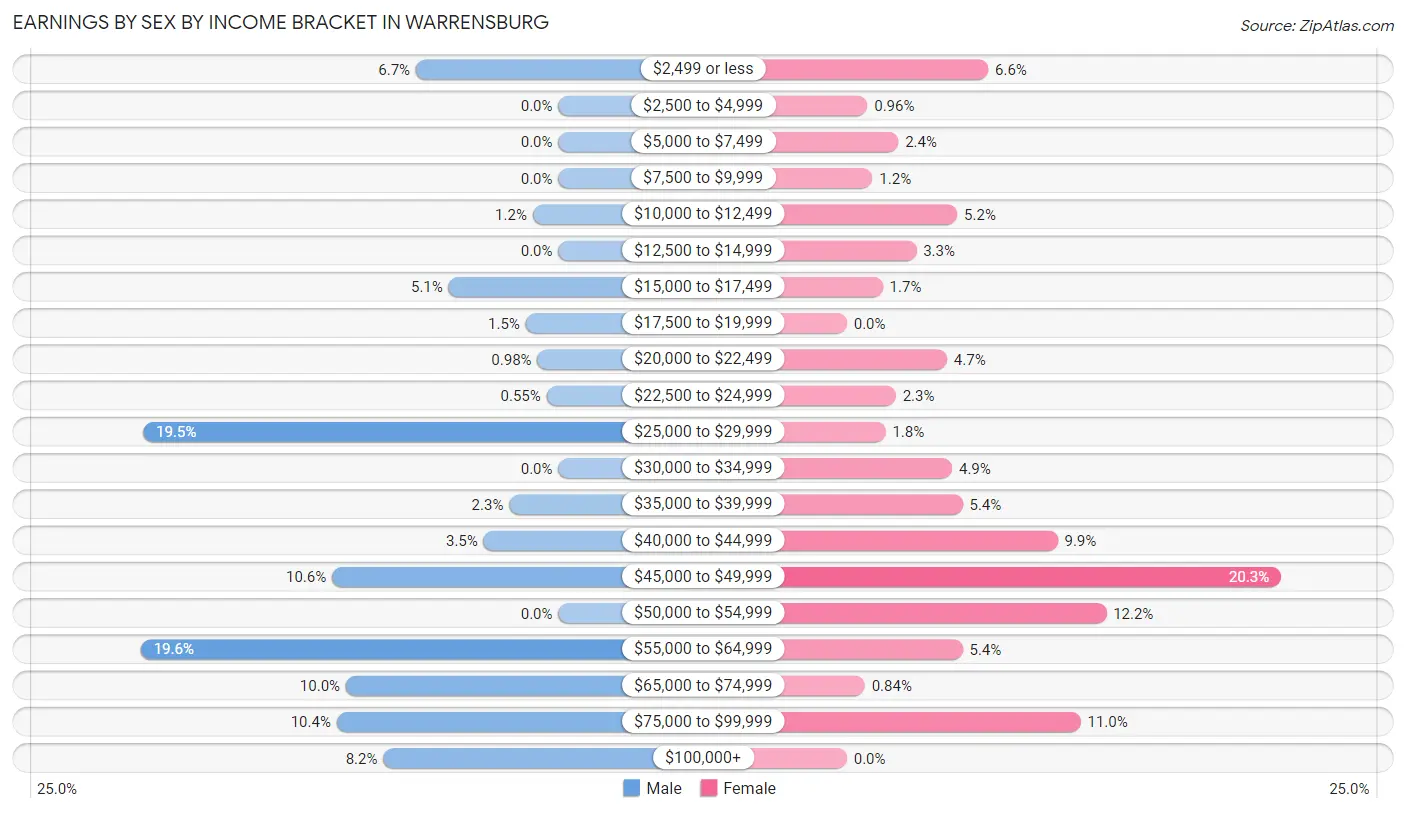
| Income | Male | Female |
| $2,499 or less | 61 (6.7%) | 55 (6.6%) |
| $2,500 to $4,999 | 0 (0.0%) | 8 (1.0%) |
| $5,000 to $7,499 | 0 (0.0%) | 20 (2.4%) |
| $7,500 to $9,999 | 0 (0.0%) | 10 (1.2%) |
| $10,000 to $12,499 | 11 (1.2%) | 43 (5.2%) |
| $12,500 to $14,999 | 0 (0.0%) | 27 (3.3%) |
| $15,000 to $17,499 | 47 (5.1%) | 14 (1.7%) |
| $17,500 to $19,999 | 14 (1.5%) | 0 (0.0%) |
| $20,000 to $22,499 | 9 (1.0%) | 39 (4.7%) |
| $22,500 to $24,999 | 5 (0.5%) | 19 (2.3%) |
| $25,000 to $29,999 | 178 (19.5%) | 15 (1.8%) |
| $30,000 to $34,999 | 0 (0.0%) | 41 (4.9%) |
| $35,000 to $39,999 | 21 (2.3%) | 45 (5.4%) |
| $40,000 to $44,999 | 32 (3.5%) | 82 (9.9%) |
| $45,000 to $49,999 | 97 (10.6%) | 169 (20.3%) |
| $50,000 to $54,999 | 0 (0.0%) | 101 (12.1%) |
| $55,000 to $64,999 | 179 (19.6%) | 45 (5.4%) |
| $65,000 to $74,999 | 91 (10.0%) | 7 (0.8%) |
| $75,000 to $99,999 | 95 (10.4%) | 91 (11.0%) |
| $100,000+ | 75 (8.2%) | 0 (0.0%) |
| Total | 915 (100.0%) | 831 (100.0%) |
Earnings by Sex by Educational Attainment in Warrensburg
Average earnings in Warrensburg are $56,199 for men and $45,344 for women, a difference of 19.3%. Men with an educational attainment of bachelor's degree enjoy the highest average annual earnings of $99,412, while those with college or associate's degree education earn the least with $48,954. Women with an educational attainment of graduate degree earn the most with the average annual earnings of $53,705, while those with less than high school education have the smallest earnings of $43,583.
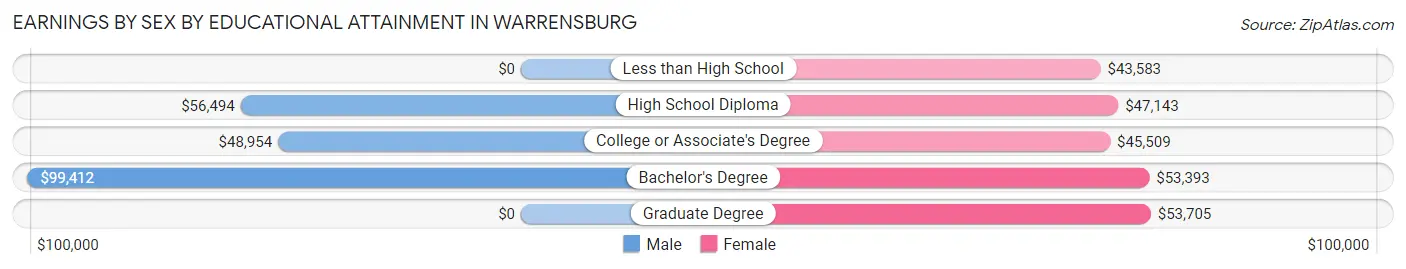
| Educational Attainment | Male Income | Female Income |
| Less than High School | - | - |
| High School Diploma | $56,494 | $47,143 |
| College or Associate's Degree | $48,954 | $45,509 |
| Bachelor's Degree | $99,412 | $53,393 |
| Graduate Degree | - | - |
| Total | $56,199 | $45,344 |
Family Income in Warrensburg
Family Income Brackets in Warrensburg
According to the Warrensburg family income data, there are 157 families falling into the $75,000 to $99,999 income range, which is the most common income bracket and makes up 20.6% of all families. Conversely, the $15,000 to $24,999 income bracket is the least frequent group with only 14 families (1.8%) belonging to this category.
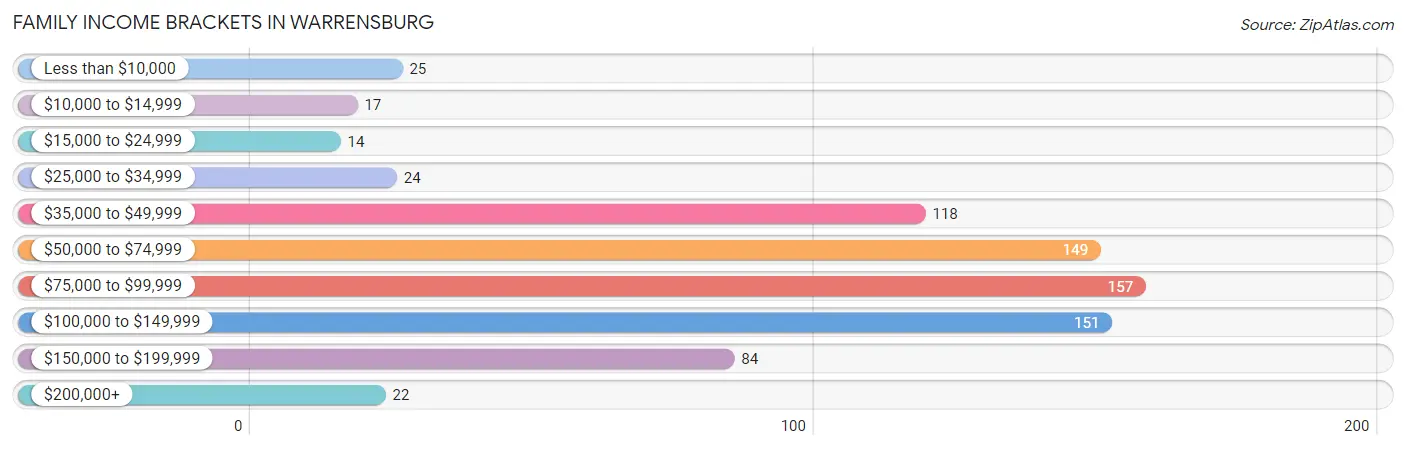
| Income Bracket | # Families | % Families |
| Less than $10,000 | 25 | 3.3% |
| $10,000 to $14,999 | 17 | 2.2% |
| $15,000 to $24,999 | 14 | 1.8% |
| $25,000 to $34,999 | 24 | 3.2% |
| $35,000 to $49,999 | 118 | 15.5% |
| $50,000 to $74,999 | 149 | 19.6% |
| $75,000 to $99,999 | 157 | 20.6% |
| $100,000 to $149,999 | 151 | 19.8% |
| $150,000 to $199,999 | 84 | 11.0% |
| $200,000+ | 22 | 2.9% |
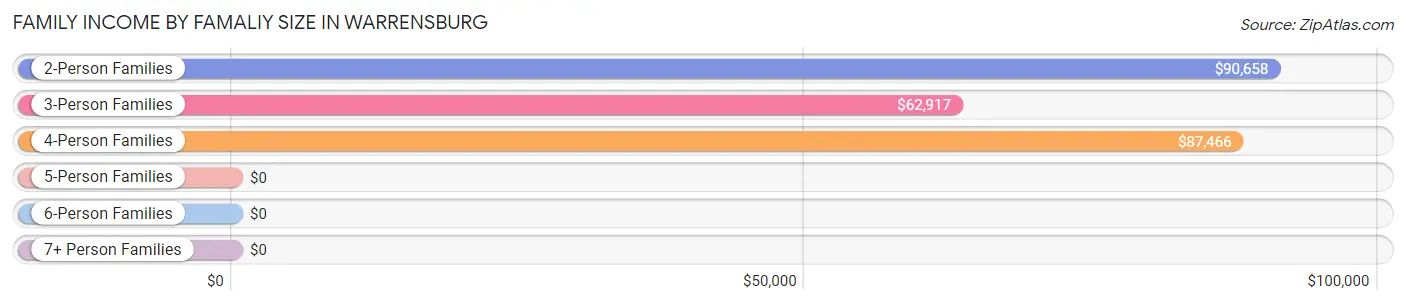
Family Income by Famaliy Size in Warrensburg
2-person families (394 | 51.8%) account for the highest median family income in Warrensburg with $90,658 per family, while 2-person families (394 | 51.8%) have the highest median income of $45,329 per family member.
| Income Bracket | # Families | Median Income |
| 2-Person Families | 394 (51.8%) | $90,658 |
| 3-Person Families | 111 (14.6%) | $62,917 |
| 4-Person Families | 113 (14.8%) | $87,466 |
| 5-Person Families | 82 (10.8%) | $0 |
| 6-Person Families | 61 (8.0%) | $0 |
| 7+ Person Families | 0 (0.0%) | $0 |
| Total | 761 (100.0%) | $85,907 |
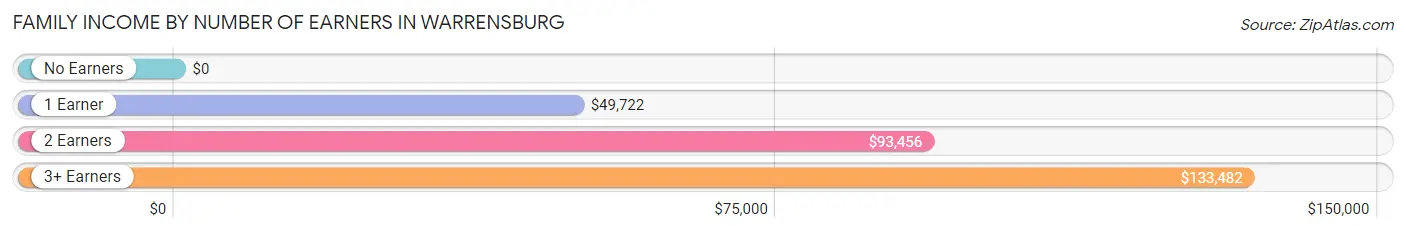
Family Income by Number of Earners in Warrensburg
| Number of Earners | # Families | Median Income |
| No Earners | 94 (12.3%) | $0 |
| 1 Earner | 174 (22.9%) | $49,722 |
| 2 Earners | 438 (57.6%) | $93,456 |
| 3+ Earners | 55 (7.2%) | $133,482 |
| Total | 761 (100.0%) | $85,907 |
Household Income in Warrensburg
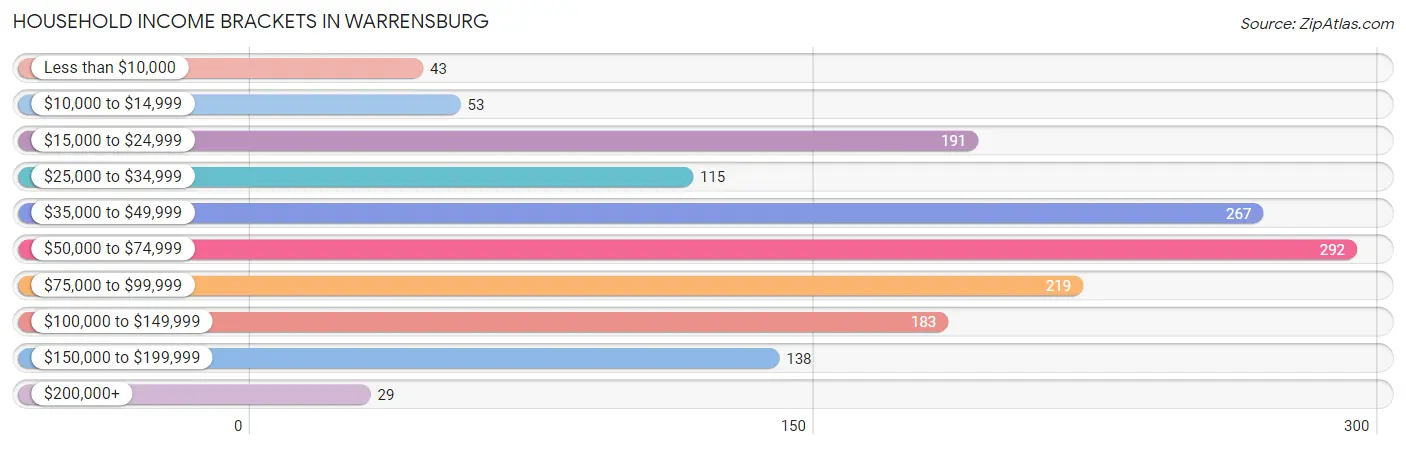
Household Income Brackets in Warrensburg
With 292 households falling in the category, the $50,000 to $74,999 income range is the most frequent in Warrensburg, accounting for 19.1% of all households. In contrast, only 29 households (1.9%) fall into the $200,000+ income bracket, making it the least populous group.
| Income Bracket | # Households | % Households |
| Less than $10,000 | 43 | 2.8% |
| $10,000 to $14,999 | 53 | 3.5% |
| $15,000 to $24,999 | 191 | 12.5% |
| $25,000 to $34,999 | 115 | 7.5% |
| $35,000 to $49,999 | 267 | 17.5% |
| $50,000 to $74,999 | 292 | 19.1% |
| $75,000 to $99,999 | 219 | 14.3% |
| $100,000 to $149,999 | 183 | 12.0% |
| $150,000 to $199,999 | 138 | 9.0% |
| $200,000+ | 29 | 1.9% |
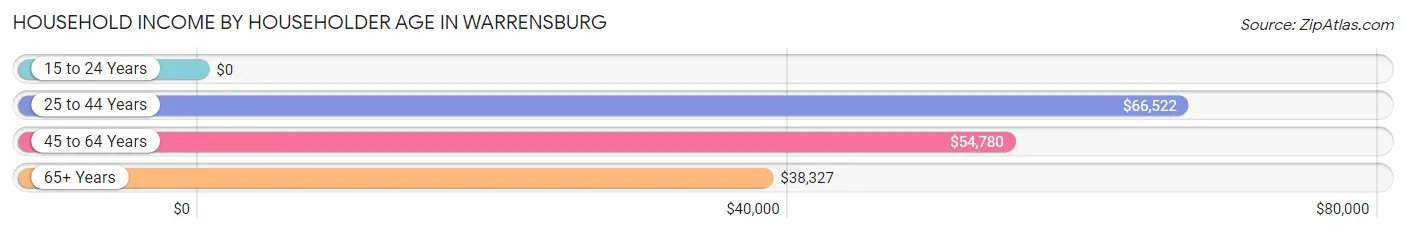
Household Income by Householder Age in Warrensburg
The median household income in Warrensburg is $55,278, with the highest median household income of $66,522 found in the 25 to 44 years age bracket for the primary householder. A total of 428 households (28.0%) fall into this category. Meanwhile, the 15 to 24 years age bracket for the primary householder has the lowest median household income of $0, with 50 households (3.3%) in this group.
| Income Bracket | # Households | Median Income |
| 15 to 24 Years | 50 (3.3%) | $0 |
| 25 to 44 Years | 428 (28.0%) | $66,522 |
| 45 to 64 Years | 525 (34.4%) | $54,780 |
| 65+ Years | 525 (34.4%) | $38,327 |
| Total | 1,528 (100.0%) | $55,278 |
Poverty in Warrensburg
Income Below Poverty by Sex and Age in Warrensburg
With 10.5% poverty level for males and 12.2% for females among the residents of Warrensburg, 15 year old males and 12 to 14 year old females are the most vulnerable to poverty, with 15 males (53.6%) and 27 females (58.7%) in their respective age groups living below the poverty level.
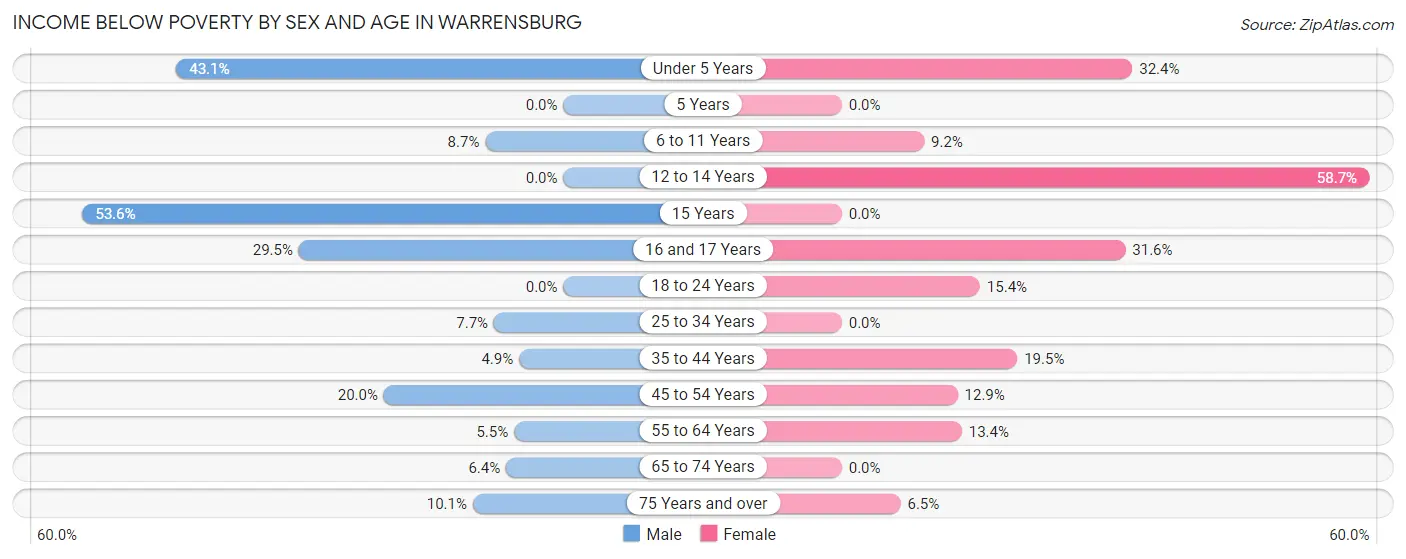
| Age Bracket | Male | Female |
| Under 5 Years | 25 (43.1%) | 11 (32.4%) |
| 5 Years | 0 (0.0%) | 0 (0.0%) |
| 6 to 11 Years | 14 (8.7%) | 10 (9.2%) |
| 12 to 14 Years | 0 (0.0%) | 27 (58.7%) |
| 15 Years | 15 (53.6%) | 0 (0.0%) |
| 16 and 17 Years | 33 (29.5%) | 12 (31.6%) |
| 18 to 24 Years | 0 (0.0%) | 14 (15.4%) |
| 25 to 34 Years | 18 (7.7%) | 0 (0.0%) |
| 35 to 44 Years | 11 (4.9%) | 34 (19.5%) |
| 45 to 54 Years | 30 (20.0%) | 36 (12.9%) |
| 55 to 64 Years | 13 (5.5%) | 31 (13.4%) |
| 65 to 74 Years | 6 (6.4%) | 0 (0.0%) |
| 75 Years and over | 12 (10.1%) | 20 (6.5%) |
| Total | 177 (10.5%) | 195 (12.2%) |
Income Above Poverty by Sex and Age in Warrensburg
According to the poverty statistics in Warrensburg, males aged 5 years and females aged 5 years are the age groups that are most secure financially, with 100.0% of males and 100.0% of females in these age groups living above the poverty line.
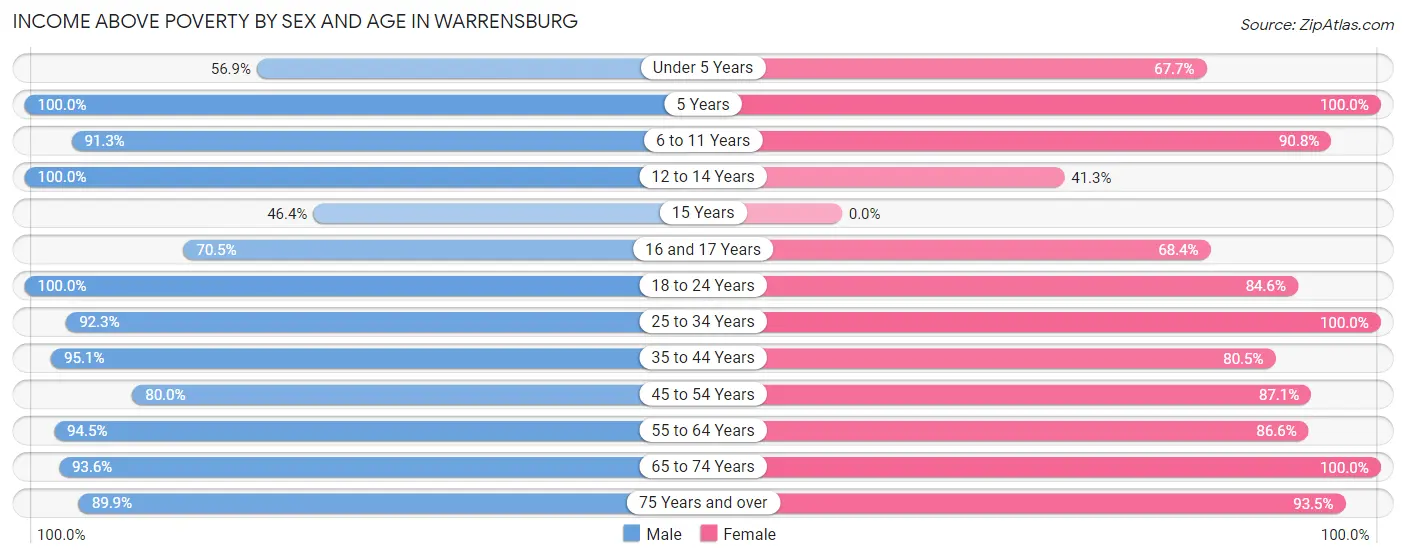
| Age Bracket | Male | Female |
| Under 5 Years | 33 (56.9%) | 23 (67.6%) |
| 5 Years | 109 (100.0%) | 40 (100.0%) |
| 6 to 11 Years | 147 (91.3%) | 99 (90.8%) |
| 12 to 14 Years | 17 (100.0%) | 19 (41.3%) |
| 15 Years | 13 (46.4%) | 0 (0.0%) |
| 16 and 17 Years | 79 (70.5%) | 26 (68.4%) |
| 18 to 24 Years | 150 (100.0%) | 77 (84.6%) |
| 25 to 34 Years | 215 (92.3%) | 148 (100.0%) |
| 35 to 44 Years | 212 (95.1%) | 140 (80.5%) |
| 45 to 54 Years | 120 (80.0%) | 243 (87.1%) |
| 55 to 64 Years | 224 (94.5%) | 201 (86.6%) |
| 65 to 74 Years | 88 (93.6%) | 101 (100.0%) |
| 75 Years and over | 107 (89.9%) | 286 (93.5%) |
| Total | 1,514 (89.5%) | 1,403 (87.8%) |
Income Below Poverty Among Married-Couple Families in Warrensburg
The poverty statistics for married-couple families in Warrensburg show that 7.7% or 38 of the total 491 families live below the poverty line. Families with 3 or 4 children have the highest poverty rate of 19.1%, comprising of 26 families. On the other hand, families with 1 or 2 children have the lowest poverty rate of 0.0%, which includes 0 families.
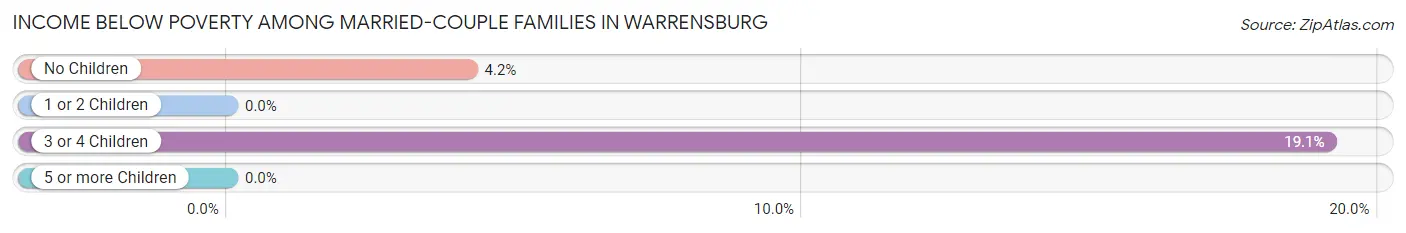
| Children | Above Poverty | Below Poverty |
| No Children | 276 (95.8%) | 12 (4.2%) |
| 1 or 2 Children | 67 (100.0%) | 0 (0.0%) |
| 3 or 4 Children | 110 (80.9%) | 26 (19.1%) |
| 5 or more Children | 0 (0.0%) | 0 (0.0%) |
| Total | 453 (92.3%) | 38 (7.7%) |
Income Below Poverty Among Single-Parent Households in Warrensburg
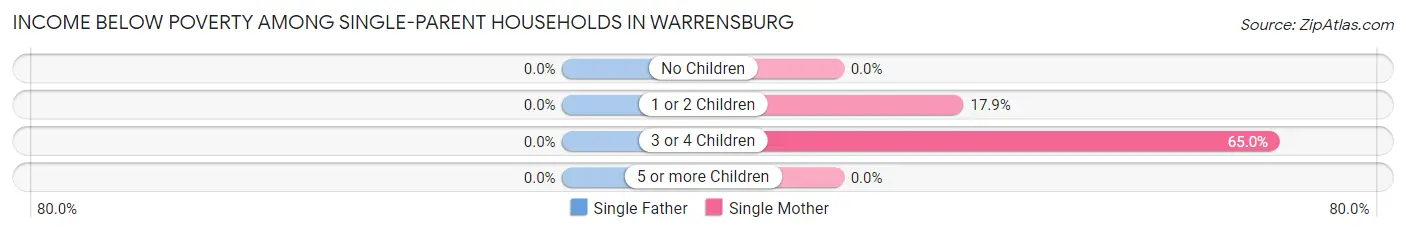
| Children | Single Father | Single Mother |
| No Children | 0 (0.0%) | 0 (0.0%) |
| 1 or 2 Children | 0 (0.0%) | 5 (17.9%) |
| 3 or 4 Children | 0 (0.0%) | 13 (65.0%) |
| 5 or more Children | 0 (0.0%) | 0 (0.0%) |
| Total | 0 (0.0%) | 18 (20.7%) |
Income Below Poverty Among Married-Couple vs Single-Parent Households in Warrensburg
The poverty data for Warrensburg shows that 38 of the married-couple family households (7.7%) and 18 of the single-parent households (6.7%) are living below the poverty level. Within the married-couple family households, those with 3 or 4 children have the highest poverty rate, with 26 households (19.1%) falling below the poverty line. Among the single-parent households, those with 3 or 4 children have the highest poverty rate, with 13 household (65.0%) living below poverty.
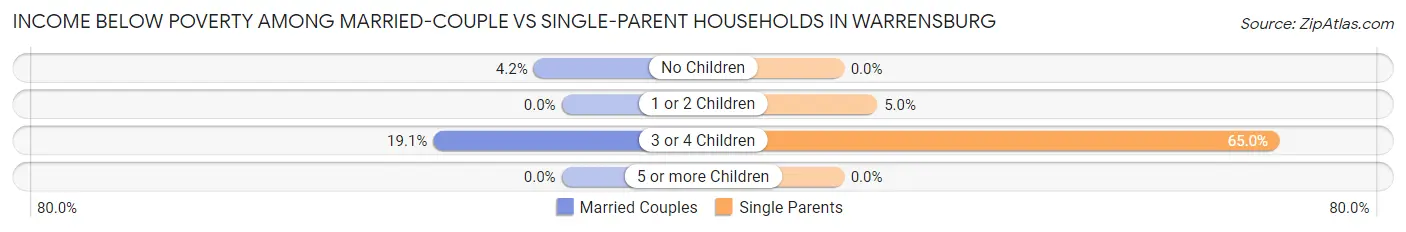
| Children | Married-Couple Families | Single-Parent Households |
| No Children | 12 (4.2%) | 0 (0.0%) |
| 1 or 2 Children | 0 (0.0%) | 5 (5.0%) |
| 3 or 4 Children | 26 (19.1%) | 13 (65.0%) |
| 5 or more Children | 0 (0.0%) | 0 (0.0%) |
| Total | 38 (7.7%) | 18 (6.7%) |
Employment Characteristics in Warrensburg
Employment by Class of Employer in Warrensburg
Among the 1,539 employed individuals in Warrensburg, private company employees (944 | 61.3%), state government employees (167 | 10.8%), and not-for-profit organizations (141 | 9.2%) make up the most common classes of employment.
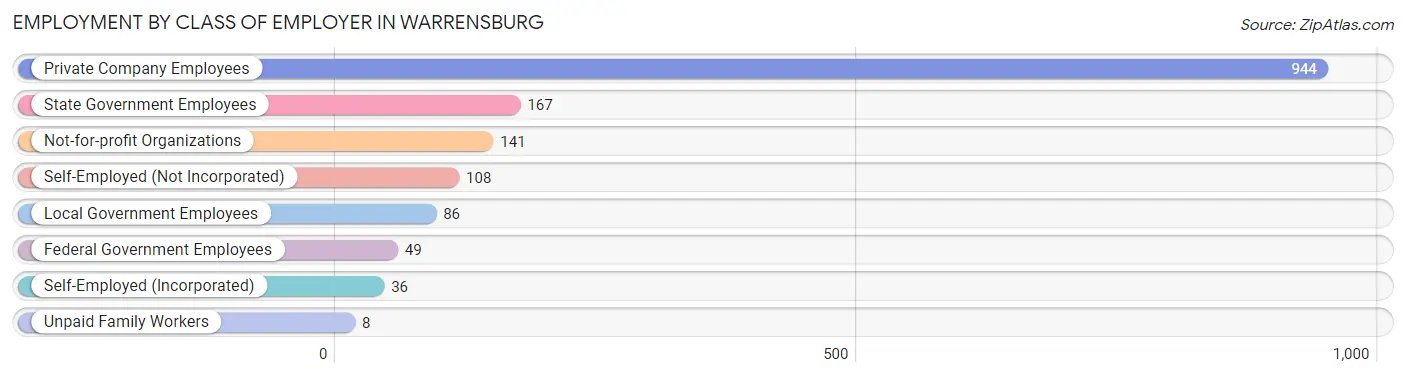
| Employer Class | # Employees | % Employees |
| Private Company Employees | 944 | 61.3% |
| Self-Employed (Incorporated) | 36 | 2.3% |
| Self-Employed (Not Incorporated) | 108 | 7.0% |
| Not-for-profit Organizations | 141 | 9.2% |
| Local Government Employees | 86 | 5.6% |
| State Government Employees | 167 | 10.8% |
| Federal Government Employees | 49 | 3.2% |
| Unpaid Family Workers | 8 | 0.5% |
| Total | 1,539 | 100.0% |
Employment Status by Age in Warrensburg
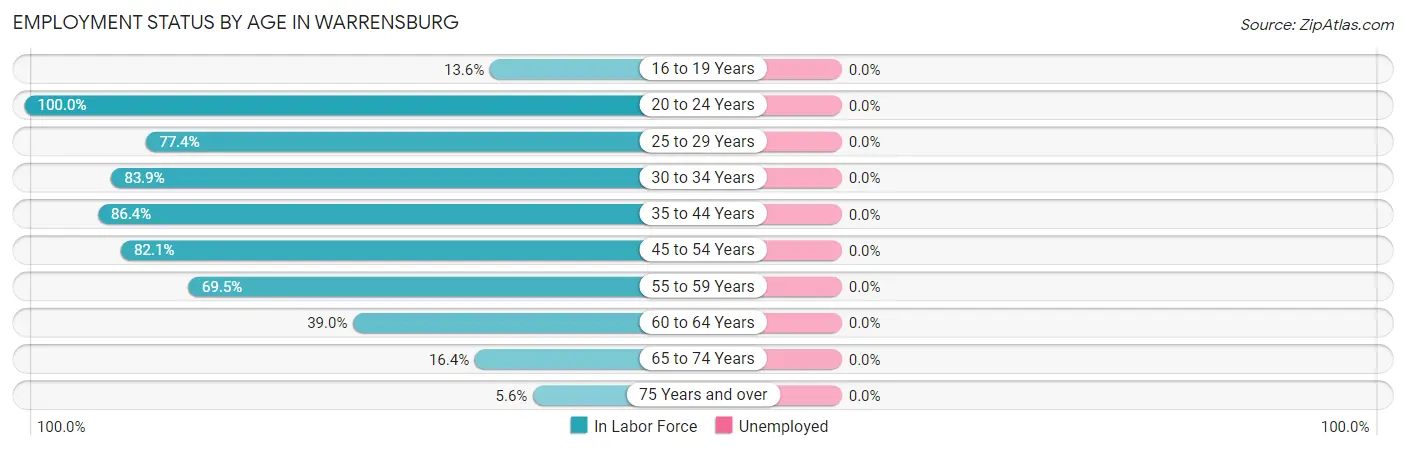
| Age Bracket | In Labor Force | Unemployed |
| 16 to 19 Years | 25 (13.6%) | 0 (0.0%) |
| 20 to 24 Years | 207 (100.0%) | 0 (0.0%) |
| 25 to 29 Years | 127 (77.4%) | 0 (0.0%) |
| 30 to 34 Years | 182 (83.9%) | 0 (0.0%) |
| 35 to 44 Years | 343 (86.4%) | 0 (0.0%) |
| 45 to 54 Years | 352 (82.1%) | 0 (0.0%) |
| 55 to 59 Years | 146 (69.5%) | 0 (0.0%) |
| 60 to 64 Years | 101 (39.0%) | 0 (0.0%) |
| 65 to 74 Years | 32 (16.4%) | 0 (0.0%) |
| 75 Years and over | 24 (5.6%) | 0 (0.0%) |
| Total | 1,540 (57.3%) | 0 (0.0%) |
Employment Status by Educational Attainment in Warrensburg
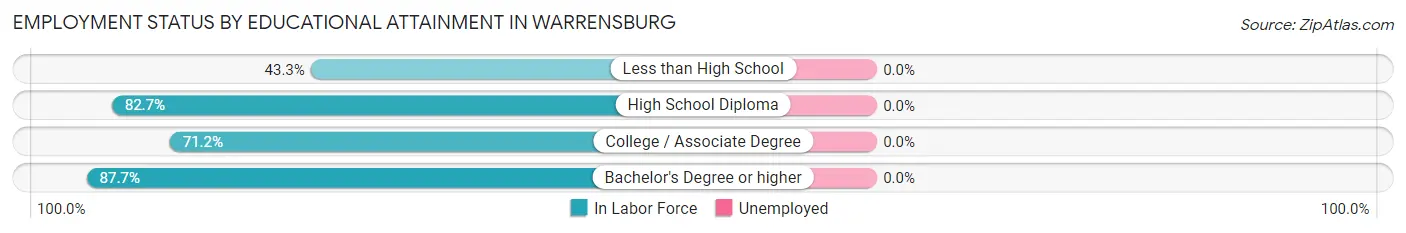
| Educational Attainment | In Labor Force | Unemployed |
| Less than High School | 93 (43.3%) | 0 (0.0%) |
| High School Diploma | 556 (82.7%) | 0 (0.0%) |
| College / Associate Degree | 388 (71.2%) | 0 (0.0%) |
| Bachelor's Degree or higher | 214 (87.7%) | 0 (0.0%) |
| Total | 1,250 (74.6%) | 0 (0.0%) |
Employment Occupations by Sex in Warrensburg
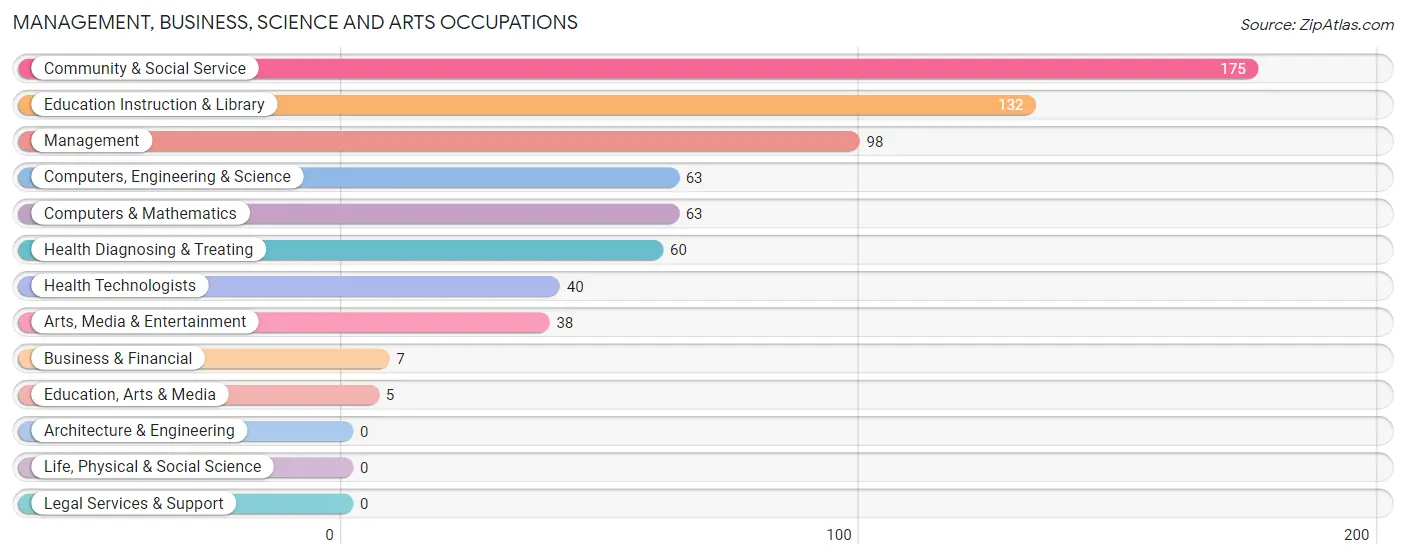
Management, Business, Science and Arts Occupations
The most common Management, Business, Science and Arts occupations in Warrensburg are Community & Social Service (175 | 11.4%), Education Instruction & Library (132 | 8.6%), Management (98 | 6.4%), Computers, Engineering & Science (63 | 4.1%), and Computers & Mathematics (63 | 4.1%).
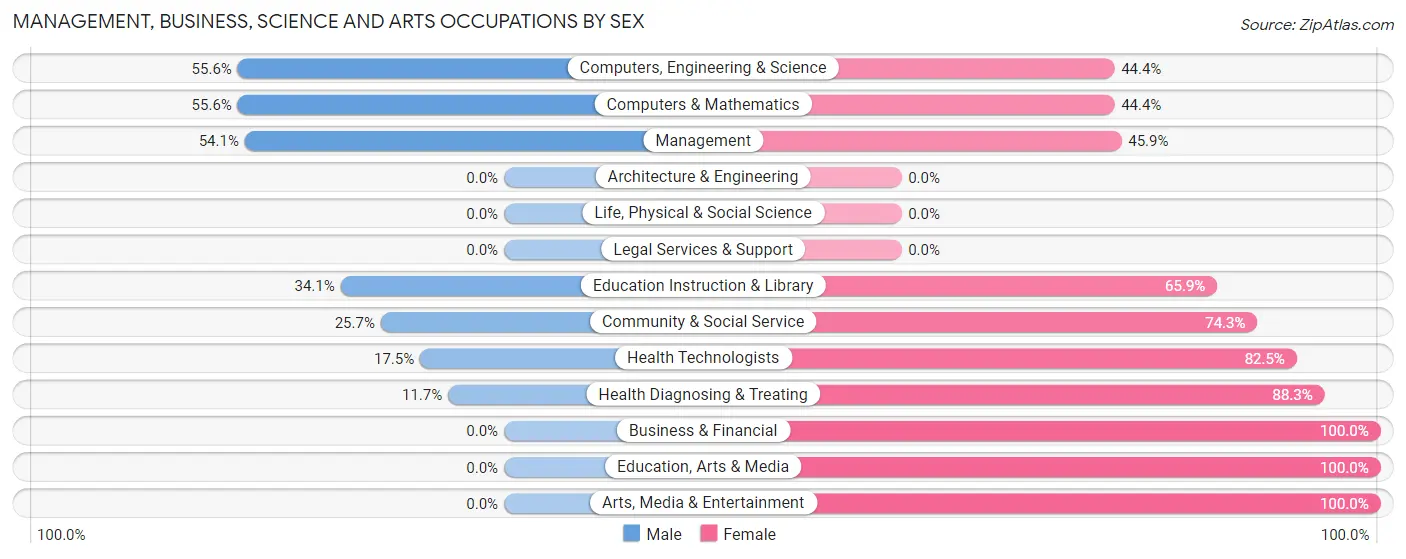
Management, Business, Science and Arts Occupations by Sex
Within the Management, Business, Science and Arts occupations in Warrensburg, the most male-oriented occupations are Computers, Engineering & Science (55.6%), Computers & Mathematics (55.6%), and Management (54.1%), while the most female-oriented occupations are Business & Financial (100.0%), Education, Arts & Media (100.0%), and Arts, Media & Entertainment (100.0%).
| Occupation | Male | Female |
| Management | 53 (54.1%) | 45 (45.9%) |
| Business & Financial | 0 (0.0%) | 7 (100.0%) |
| Computers, Engineering & Science | 35 (55.6%) | 28 (44.4%) |
| Computers & Mathematics | 35 (55.6%) | 28 (44.4%) |
| Architecture & Engineering | 0 (0.0%) | 0 (0.0%) |
| Life, Physical & Social Science | 0 (0.0%) | 0 (0.0%) |
| Community & Social Service | 45 (25.7%) | 130 (74.3%) |
| Education, Arts & Media | 0 (0.0%) | 5 (100.0%) |
| Legal Services & Support | 0 (0.0%) | 0 (0.0%) |
| Education Instruction & Library | 45 (34.1%) | 87 (65.9%) |
| Arts, Media & Entertainment | 0 (0.0%) | 38 (100.0%) |
| Health Diagnosing & Treating | 7 (11.7%) | 53 (88.3%) |
| Health Technologists | 7 (17.5%) | 33 (82.5%) |
| Total (Category) | 140 (34.7%) | 263 (65.3%) |
| Total (Overall) | 812 (52.8%) | 727 (47.2%) |
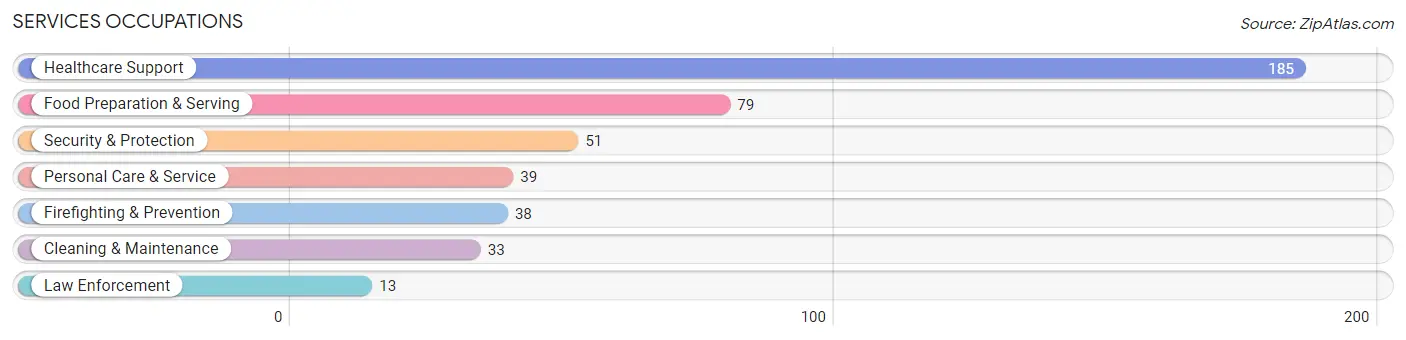
Services Occupations
The most common Services occupations in Warrensburg are Healthcare Support (185 | 12.0%), Food Preparation & Serving (79 | 5.1%), Security & Protection (51 | 3.3%), Personal Care & Service (39 | 2.5%), and Firefighting & Prevention (38 | 2.5%).
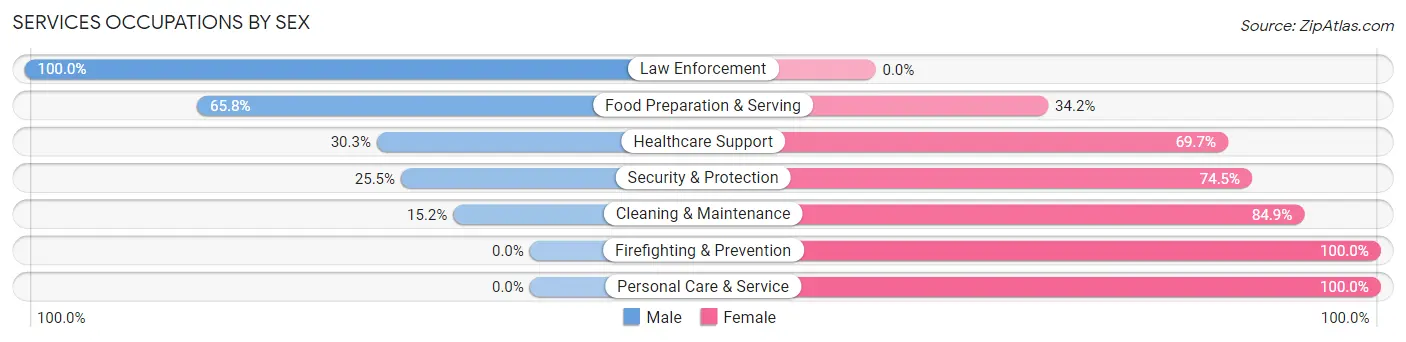
Services Occupations by Sex
Within the Services occupations in Warrensburg, the most male-oriented occupations are Law Enforcement (100.0%), Food Preparation & Serving (65.8%), and Healthcare Support (30.3%), while the most female-oriented occupations are Firefighting & Prevention (100.0%), Personal Care & Service (100.0%), and Cleaning & Maintenance (84.9%).
| Occupation | Male | Female |
| Healthcare Support | 56 (30.3%) | 129 (69.7%) |
| Security & Protection | 13 (25.5%) | 38 (74.5%) |
| Firefighting & Prevention | 0 (0.0%) | 38 (100.0%) |
| Law Enforcement | 13 (100.0%) | 0 (0.0%) |
| Food Preparation & Serving | 52 (65.8%) | 27 (34.2%) |
| Cleaning & Maintenance | 5 (15.1%) | 28 (84.9%) |
| Personal Care & Service | 0 (0.0%) | 39 (100.0%) |
| Total (Category) | 126 (32.6%) | 261 (67.4%) |
| Total (Overall) | 812 (52.8%) | 727 (47.2%) |
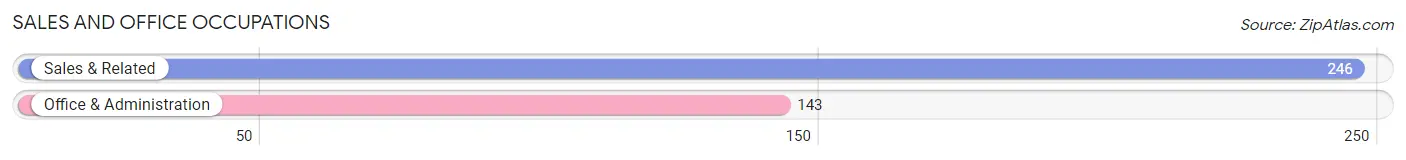
Sales and Office Occupations
The most common Sales and Office occupations in Warrensburg are Sales & Related (246 | 16.0%), and Office & Administration (143 | 9.3%).
Sales and Office Occupations by Sex
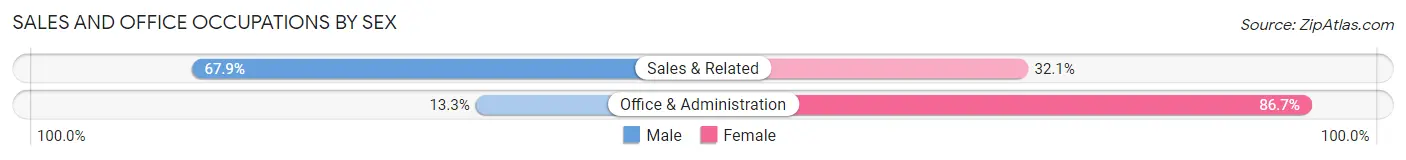
| Occupation | Male | Female |
| Sales & Related | 167 (67.9%) | 79 (32.1%) |
| Office & Administration | 19 (13.3%) | 124 (86.7%) |
| Total (Category) | 186 (47.8%) | 203 (52.2%) |
| Total (Overall) | 812 (52.8%) | 727 (47.2%) |
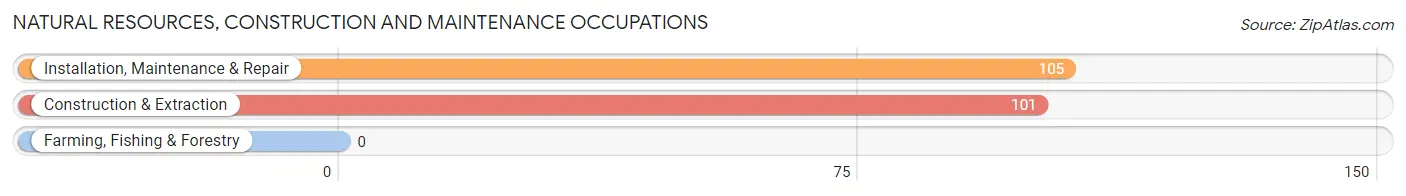
Natural Resources, Construction and Maintenance Occupations
The most common Natural Resources, Construction and Maintenance occupations in Warrensburg are Installation, Maintenance & Repair (105 | 6.8%), and Construction & Extraction (101 | 6.6%).
Natural Resources, Construction and Maintenance Occupations by Sex
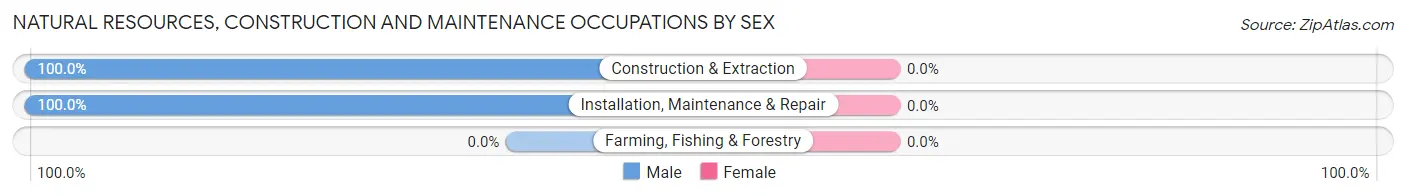
| Occupation | Male | Female |
| Farming, Fishing & Forestry | 0 (0.0%) | 0 (0.0%) |
| Construction & Extraction | 101 (100.0%) | 0 (0.0%) |
| Installation, Maintenance & Repair | 105 (100.0%) | 0 (0.0%) |
| Total (Category) | 206 (100.0%) | 0 (0.0%) |
| Total (Overall) | 812 (52.8%) | 727 (47.2%) |
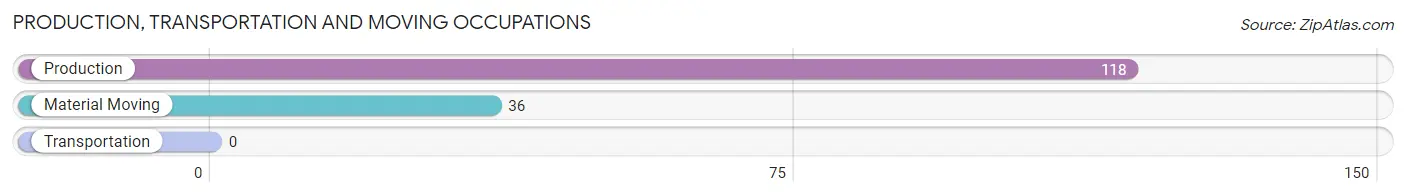
Production, Transportation and Moving Occupations
The most common Production, Transportation and Moving occupations in Warrensburg are Production (118 | 7.7%), and Material Moving (36 | 2.3%).
Production, Transportation and Moving Occupations by Sex
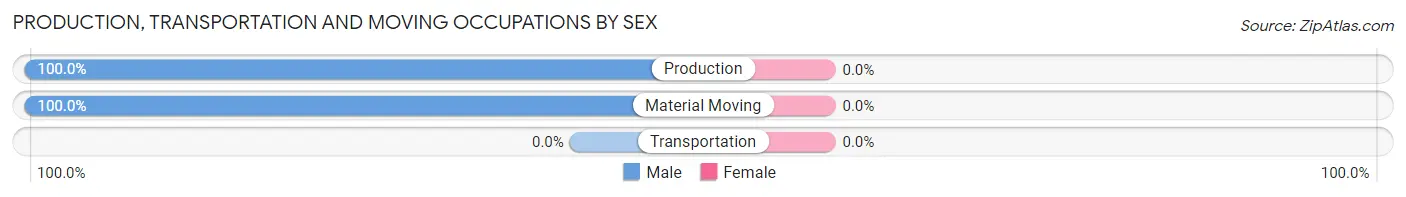
| Occupation | Male | Female |
| Production | 118 (100.0%) | 0 (0.0%) |
| Transportation | 0 (0.0%) | 0 (0.0%) |
| Material Moving | 36 (100.0%) | 0 (0.0%) |
| Total (Category) | 154 (100.0%) | 0 (0.0%) |
| Total (Overall) | 812 (52.8%) | 727 (47.2%) |
Employment Industries by Sex in Warrensburg
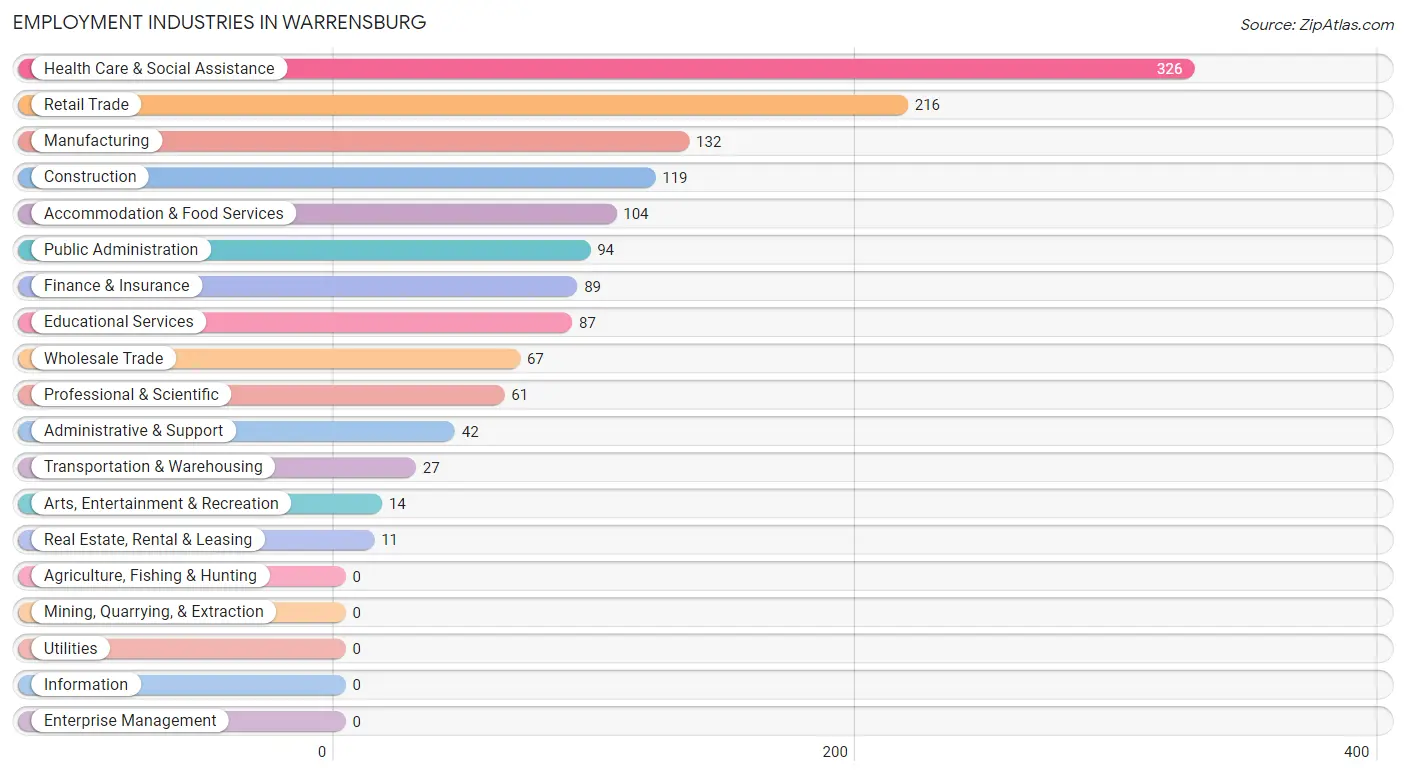
Employment Industries in Warrensburg
The major employment industries in Warrensburg include Health Care & Social Assistance (326 | 21.2%), Retail Trade (216 | 14.0%), Manufacturing (132 | 8.6%), Construction (119 | 7.7%), and Accommodation & Food Services (104 | 6.8%).
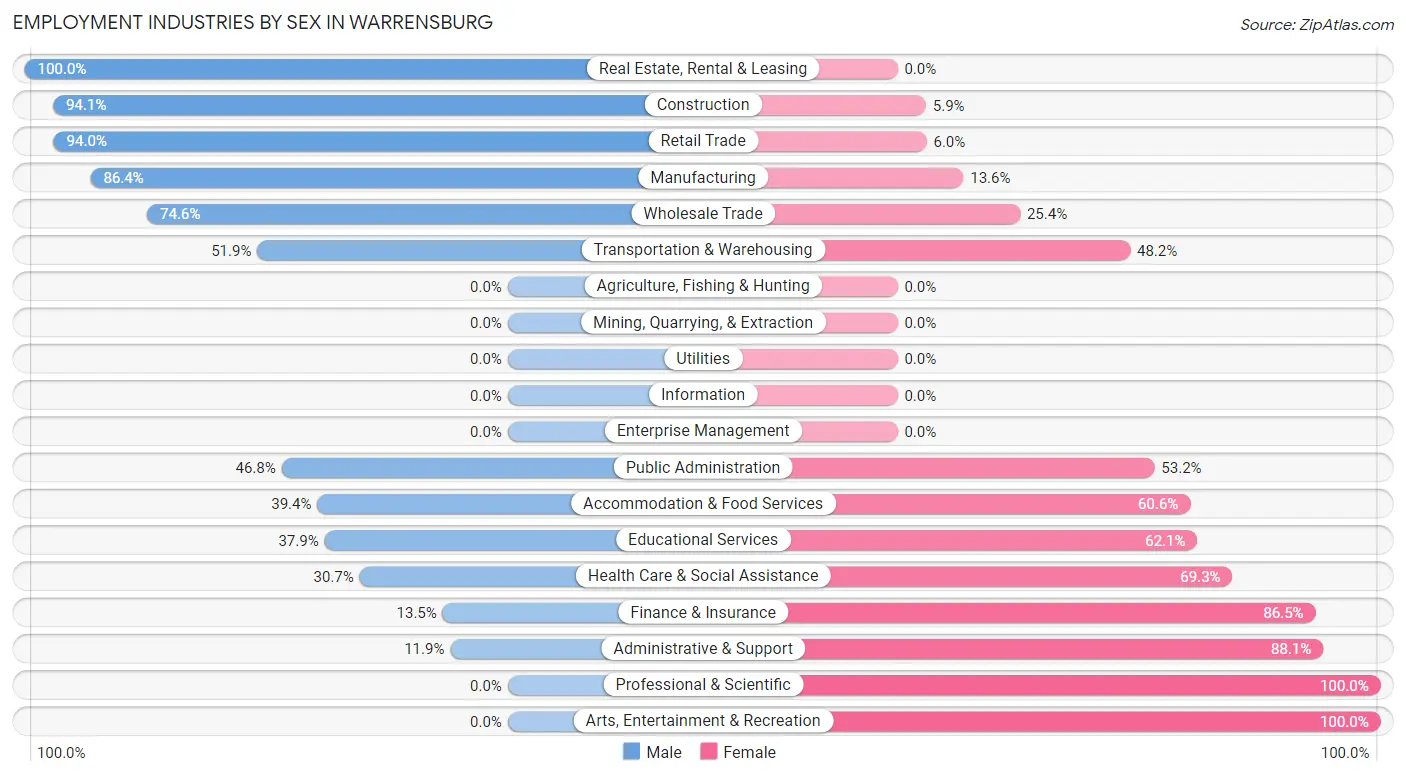
Employment Industries by Sex in Warrensburg
The Warrensburg industries that see more men than women are Real Estate, Rental & Leasing (100.0%), Construction (94.1%), and Retail Trade (94.0%), whereas the industries that tend to have a higher number of women are Professional & Scientific (100.0%), Arts, Entertainment & Recreation (100.0%), and Administrative & Support (88.1%).
| Industry | Male | Female |
| Agriculture, Fishing & Hunting | 0 (0.0%) | 0 (0.0%) |
| Mining, Quarrying, & Extraction | 0 (0.0%) | 0 (0.0%) |
| Construction | 112 (94.1%) | 7 (5.9%) |
| Manufacturing | 114 (86.4%) | 18 (13.6%) |
| Wholesale Trade | 50 (74.6%) | 17 (25.4%) |
| Retail Trade | 203 (94.0%) | 13 (6.0%) |
| Transportation & Warehousing | 14 (51.8%) | 13 (48.1%) |
| Utilities | 0 (0.0%) | 0 (0.0%) |
| Information | 0 (0.0%) | 0 (0.0%) |
| Finance & Insurance | 12 (13.5%) | 77 (86.5%) |
| Real Estate, Rental & Leasing | 11 (100.0%) | 0 (0.0%) |
| Professional & Scientific | 0 (0.0%) | 61 (100.0%) |
| Enterprise Management | 0 (0.0%) | 0 (0.0%) |
| Administrative & Support | 5 (11.9%) | 37 (88.1%) |
| Educational Services | 33 (37.9%) | 54 (62.1%) |
| Health Care & Social Assistance | 100 (30.7%) | 226 (69.3%) |
| Arts, Entertainment & Recreation | 0 (0.0%) | 14 (100.0%) |
| Accommodation & Food Services | 41 (39.4%) | 63 (60.6%) |
| Public Administration | 44 (46.8%) | 50 (53.2%) |
| Total | 812 (52.8%) | 727 (47.2%) |
Education in Warrensburg
School Enrollment in Warrensburg
The most common levels of schooling among the 757 students in Warrensburg are elementary school (263 | 34.7%), high school (193 | 25.5%), and kindergarten (97 | 12.8%).
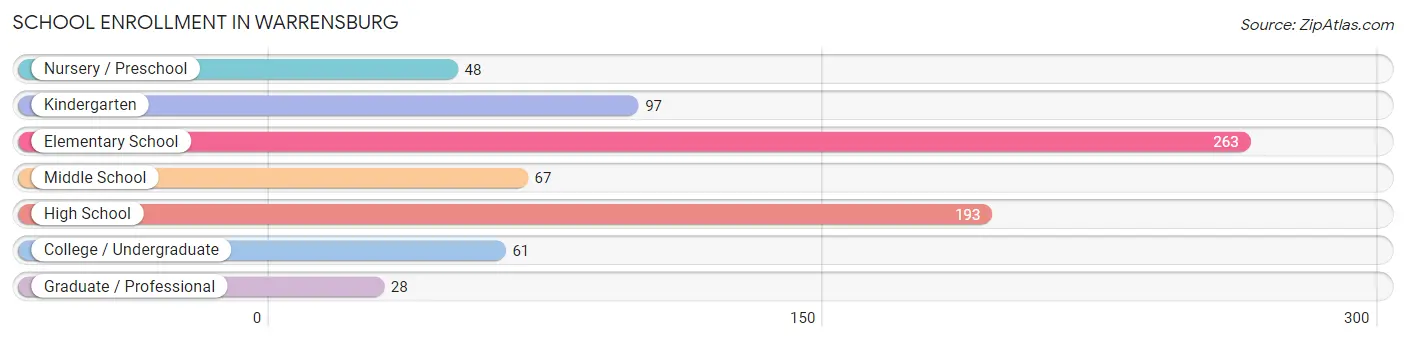
| School Level | # Students | % Students |
| Nursery / Preschool | 48 | 6.3% |
| Kindergarten | 97 | 12.8% |
| Elementary School | 263 | 34.7% |
| Middle School | 67 | 8.8% |
| High School | 193 | 25.5% |
| College / Undergraduate | 61 | 8.1% |
| Graduate / Professional | 28 | 3.7% |
| Total | 757 | 100.0% |
School Enrollment by Age by Funding Source in Warrensburg
Out of a total of 757 students who are enrolled in schools in Warrensburg, 71 (9.4%) attend a private institution, while the remaining 686 (90.6%) are enrolled in public schools. The age group of 35 years and over has the highest likelihood of being enrolled in private schools, with 28 (49.1% in the age bracket) enrolled. Conversely, the age group of 3 to 4 year olds has the lowest likelihood of being enrolled in a private school, with 8 (100.0% in the age bracket) attending a public institution.
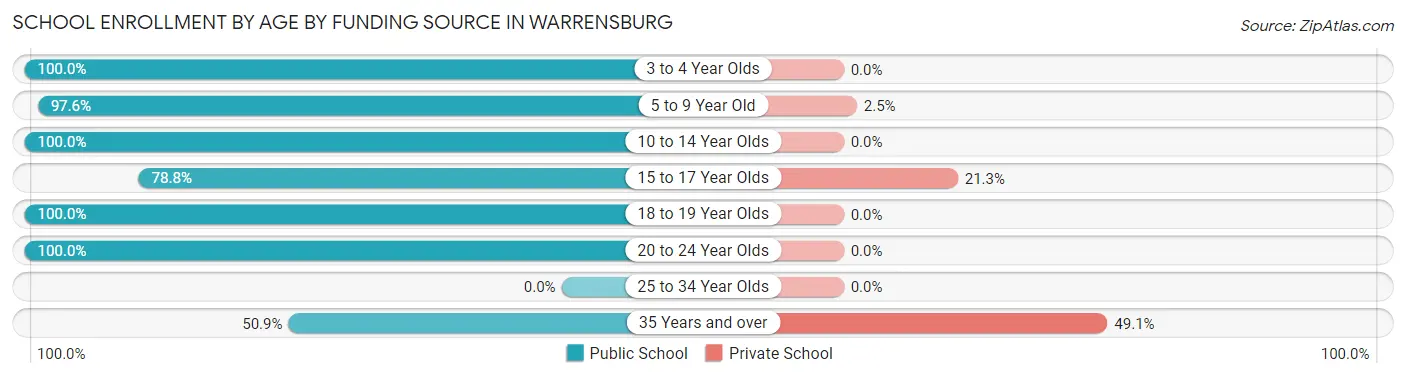
| Age Bracket | Public School | Private School |
| 3 to 4 Year Olds | 8 (100.0%) | 0 (0.0%) |
| 5 to 9 Year Old | 359 (97.6%) | 9 (2.5%) |
| 10 to 14 Year Olds | 110 (100.0%) | 0 (0.0%) |
| 15 to 17 Year Olds | 126 (78.7%) | 34 (21.2%) |
| 18 to 19 Year Olds | 34 (100.0%) | 0 (0.0%) |
| 20 to 24 Year Olds | 20 (100.0%) | 0 (0.0%) |
| 25 to 34 Year Olds | 0 (0.0%) | 0 (0.0%) |
| 35 Years and over | 29 (50.9%) | 28 (49.1%) |
| Total | 686 (90.6%) | 71 (9.4%) |
Educational Attainment by Field of Study in Warrensburg
Education (87 | 30.0%), business (60 | 20.7%), science & technology (46 | 15.9%), bio, nature & agricultural (25 | 8.6%), and communications (18 | 6.2%) are the most common fields of study among 290 individuals in Warrensburg who have obtained a bachelor's degree or higher.
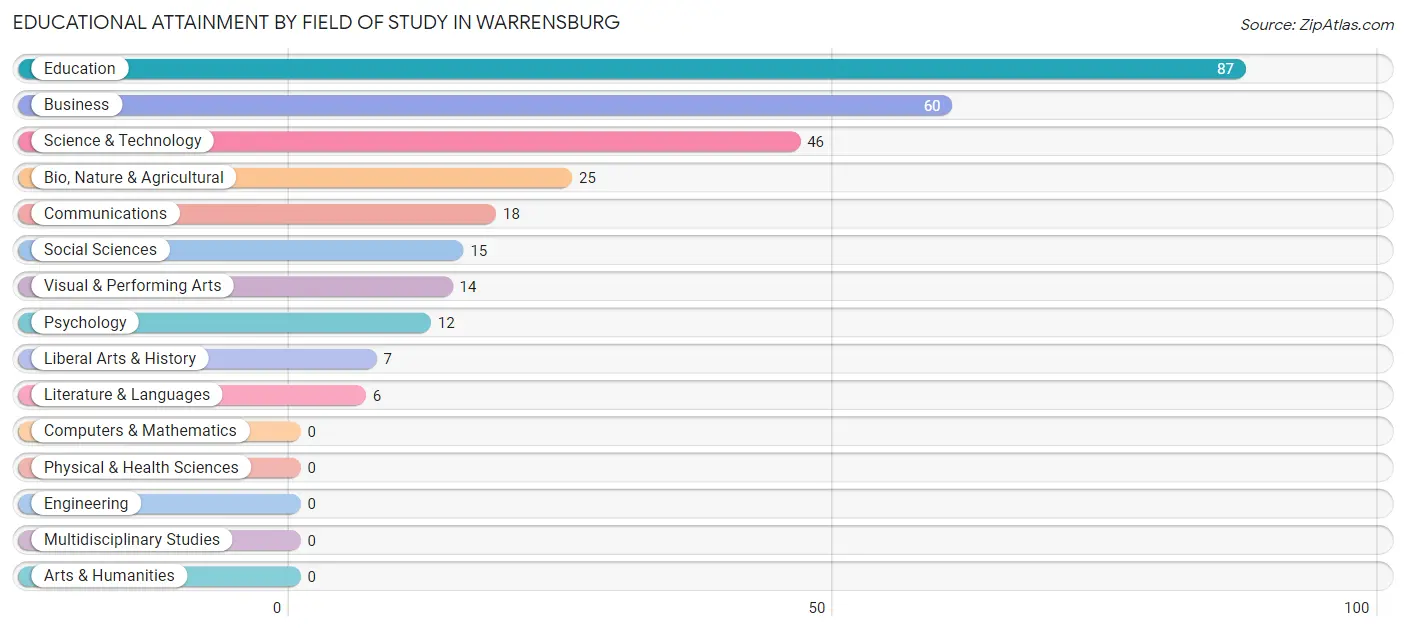
| Field of Study | # Graduates | % Graduates |
| Computers & Mathematics | 0 | 0.0% |
| Bio, Nature & Agricultural | 25 | 8.6% |
| Physical & Health Sciences | 0 | 0.0% |
| Psychology | 12 | 4.1% |
| Social Sciences | 15 | 5.2% |
| Engineering | 0 | 0.0% |
| Multidisciplinary Studies | 0 | 0.0% |
| Science & Technology | 46 | 15.9% |
| Business | 60 | 20.7% |
| Education | 87 | 30.0% |
| Literature & Languages | 6 | 2.1% |
| Liberal Arts & History | 7 | 2.4% |
| Visual & Performing Arts | 14 | 4.8% |
| Communications | 18 | 6.2% |
| Arts & Humanities | 0 | 0.0% |
| Total | 290 | 100.0% |
Transportation & Commute in Warrensburg
Vehicle Availability by Sex in Warrensburg
The most prevalent vehicle ownership categories in Warrensburg are males with 2 vehicles (362, accounting for 44.6%) and females with 2 vehicles (309, making up 49.8%).
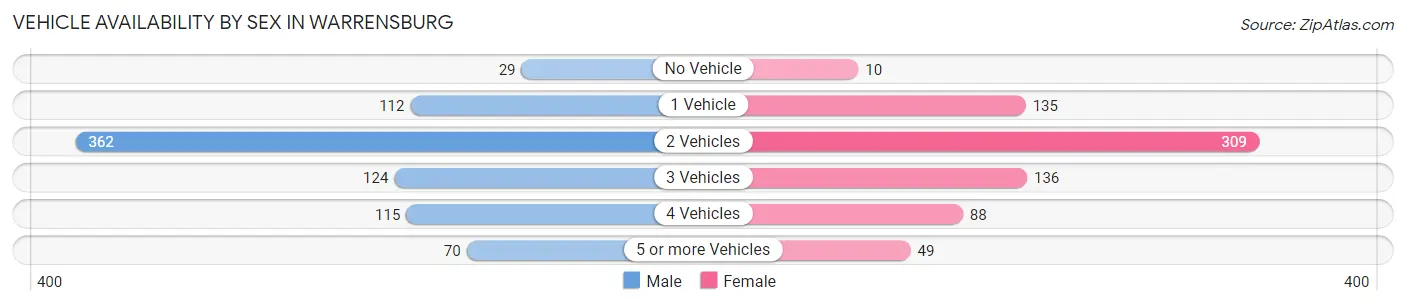
| Vehicles Available | Male | Female |
| No Vehicle | 29 (3.6%) | 10 (1.4%) |
| 1 Vehicle | 112 (13.8%) | 135 (18.6%) |
| 2 Vehicles | 362 (44.6%) | 309 (42.5%) |
| 3 Vehicles | 124 (15.3%) | 136 (18.7%) |
| 4 Vehicles | 115 (14.2%) | 88 (12.1%) |
| 5 or more Vehicles | 70 (8.6%) | 49 (6.7%) |
| Total | 812 (100.0%) | 727 (100.0%) |
Commute Time in Warrensburg
The most frequently occuring commute durations in Warrensburg are less than 5 minutes (339 commuters, 24.5%), 5 to 9 minutes (193 commuters, 14.0%), and 35 to 39 minutes (154 commuters, 11.2%).
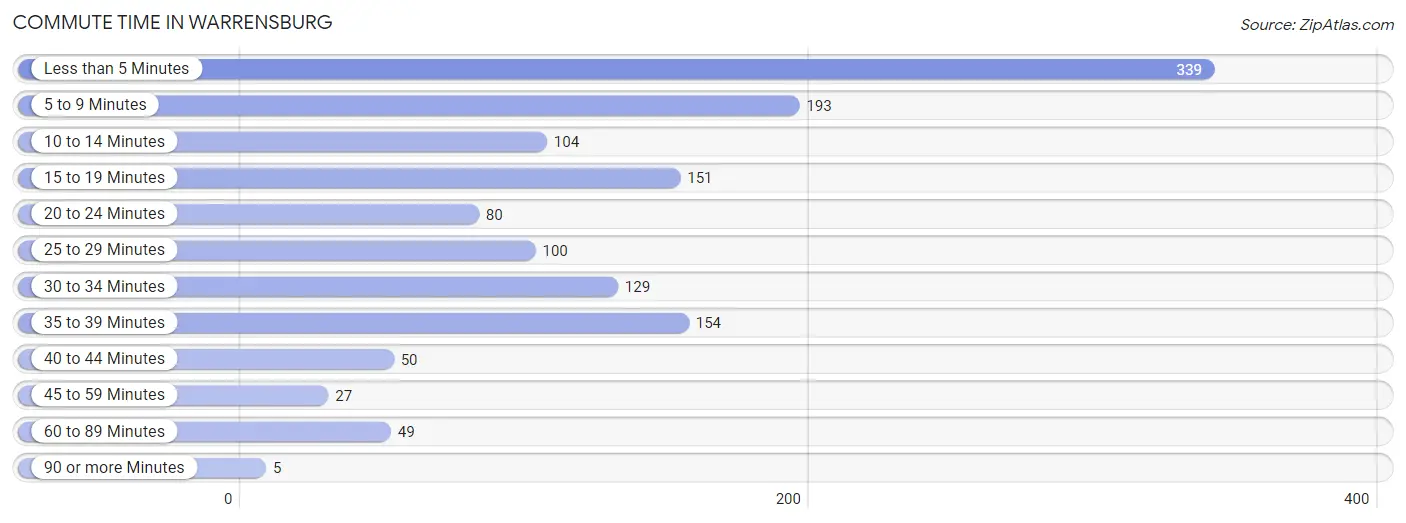
| Commute Time | # Commuters | % Commuters |
| Less than 5 Minutes | 339 | 24.5% |
| 5 to 9 Minutes | 193 | 14.0% |
| 10 to 14 Minutes | 104 | 7.5% |
| 15 to 19 Minutes | 151 | 10.9% |
| 20 to 24 Minutes | 80 | 5.8% |
| 25 to 29 Minutes | 100 | 7.2% |
| 30 to 34 Minutes | 129 | 9.3% |
| 35 to 39 Minutes | 154 | 11.2% |
| 40 to 44 Minutes | 50 | 3.6% |
| 45 to 59 Minutes | 27 | 2.0% |
| 60 to 89 Minutes | 49 | 3.5% |
| 90 or more Minutes | 5 | 0.4% |
Commute Time by Sex in Warrensburg
The most common commute times in Warrensburg are less than 5 minutes (216 commuters, 27.5%) for males and 5 to 9 minutes (126 commuters, 21.2%) for females.
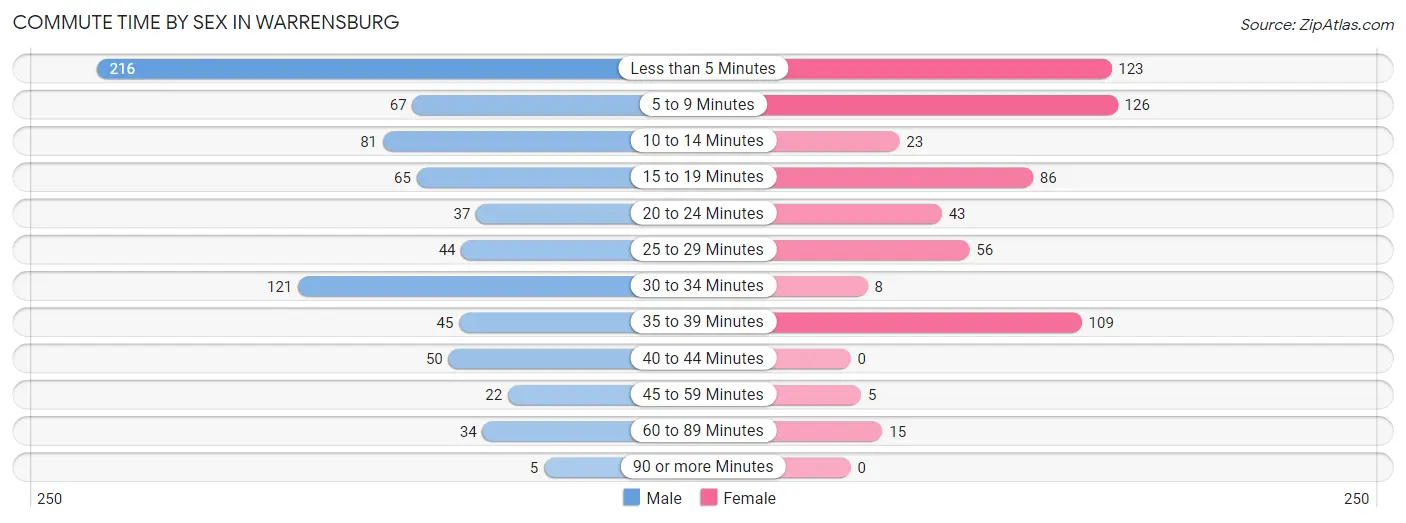
| Commute Time | Male | Female |
| Less than 5 Minutes | 216 (27.5%) | 123 (20.7%) |
| 5 to 9 Minutes | 67 (8.5%) | 126 (21.2%) |
| 10 to 14 Minutes | 81 (10.3%) | 23 (3.9%) |
| 15 to 19 Minutes | 65 (8.3%) | 86 (14.5%) |
| 20 to 24 Minutes | 37 (4.7%) | 43 (7.2%) |
| 25 to 29 Minutes | 44 (5.6%) | 56 (9.4%) |
| 30 to 34 Minutes | 121 (15.4%) | 8 (1.3%) |
| 35 to 39 Minutes | 45 (5.7%) | 109 (18.3%) |
| 40 to 44 Minutes | 50 (6.4%) | 0 (0.0%) |
| 45 to 59 Minutes | 22 (2.8%) | 5 (0.8%) |
| 60 to 89 Minutes | 34 (4.3%) | 15 (2.5%) |
| 90 or more Minutes | 5 (0.6%) | 0 (0.0%) |
Time of Departure to Work by Sex in Warrensburg
The most frequent times of departure to work in Warrensburg are 7:00 AM to 7:29 AM (125, 15.9%) for males and 6:30 AM to 6:59 AM (124, 20.9%) for females.
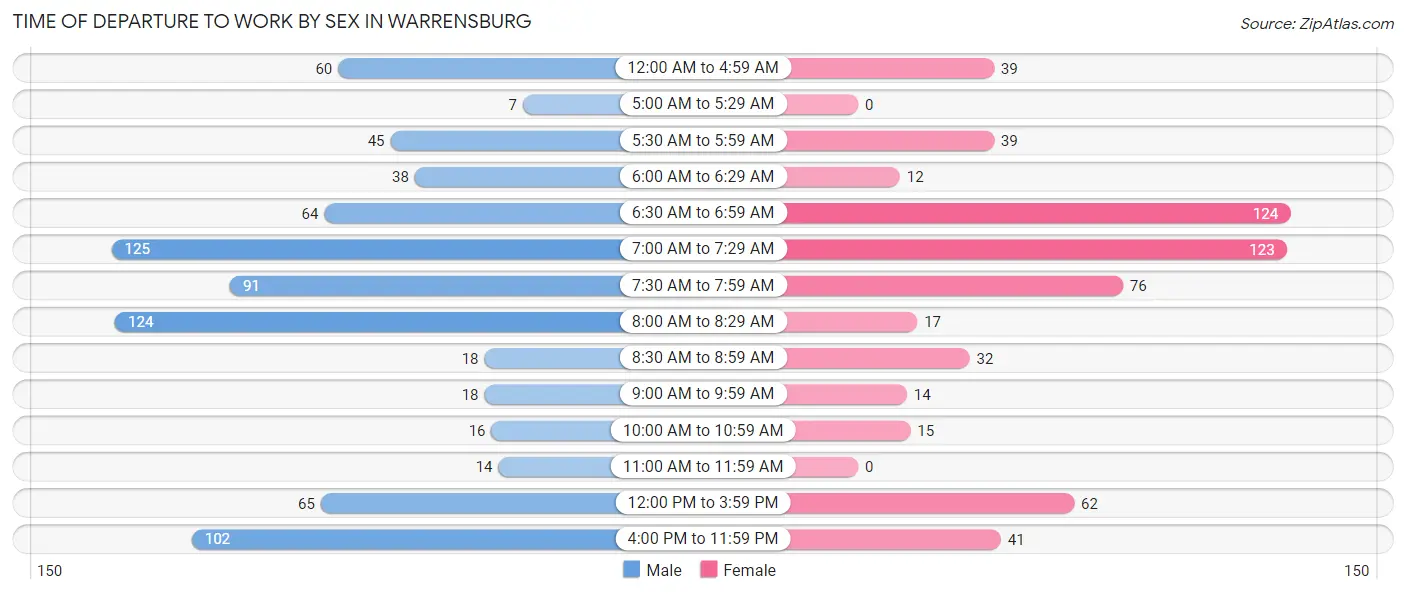
| Time of Departure | Male | Female |
| 12:00 AM to 4:59 AM | 60 (7.6%) | 39 (6.6%) |
| 5:00 AM to 5:29 AM | 7 (0.9%) | 0 (0.0%) |
| 5:30 AM to 5:59 AM | 45 (5.7%) | 39 (6.6%) |
| 6:00 AM to 6:29 AM | 38 (4.8%) | 12 (2.0%) |
| 6:30 AM to 6:59 AM | 64 (8.1%) | 124 (20.9%) |
| 7:00 AM to 7:29 AM | 125 (15.9%) | 123 (20.7%) |
| 7:30 AM to 7:59 AM | 91 (11.6%) | 76 (12.8%) |
| 8:00 AM to 8:29 AM | 124 (15.8%) | 17 (2.9%) |
| 8:30 AM to 8:59 AM | 18 (2.3%) | 32 (5.4%) |
| 9:00 AM to 9:59 AM | 18 (2.3%) | 14 (2.4%) |
| 10:00 AM to 10:59 AM | 16 (2.0%) | 15 (2.5%) |
| 11:00 AM to 11:59 AM | 14 (1.8%) | 0 (0.0%) |
| 12:00 PM to 3:59 PM | 65 (8.3%) | 62 (10.4%) |
| 4:00 PM to 11:59 PM | 102 (13.0%) | 41 (6.9%) |
| Total | 787 (100.0%) | 594 (100.0%) |
Housing Occupancy in Warrensburg
Occupancy by Ownership in Warrensburg
Of the total 1,528 dwellings in Warrensburg, owner-occupied units account for 1,040 (68.1%), while renter-occupied units make up 488 (31.9%).
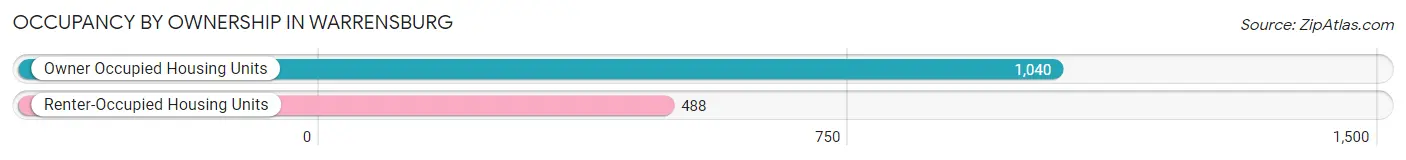
| Occupancy | # Housing Units | % Housing Units |
| Owner Occupied Housing Units | 1,040 | 68.1% |
| Renter-Occupied Housing Units | 488 | 31.9% |
| Total Occupied Housing Units | 1,528 | 100.0% |
Occupancy by Household Size in Warrensburg
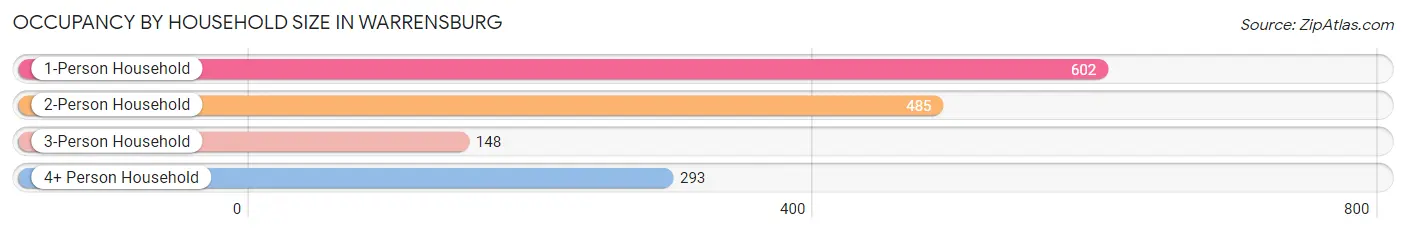
| Household Size | # Housing Units | % Housing Units |
| 1-Person Household | 602 | 39.4% |
| 2-Person Household | 485 | 31.7% |
| 3-Person Household | 148 | 9.7% |
| 4+ Person Household | 293 | 19.2% |
| Total Housing Units | 1,528 | 100.0% |
Occupancy by Ownership by Household Size in Warrensburg
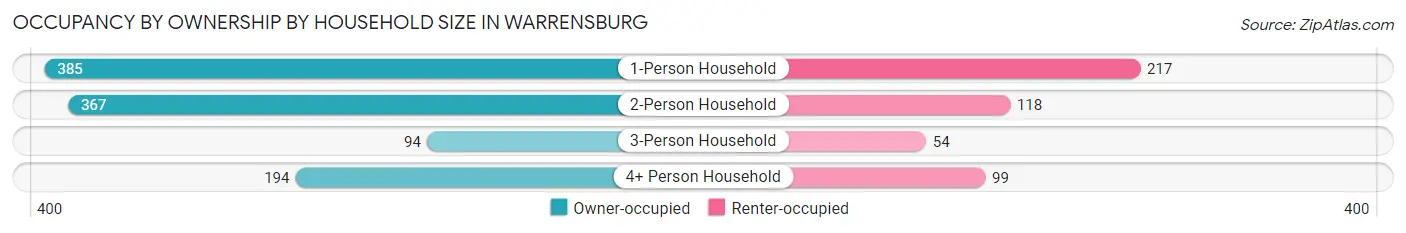
| Household Size | Owner-occupied | Renter-occupied |
| 1-Person Household | 385 (63.9%) | 217 (36.0%) |
| 2-Person Household | 367 (75.7%) | 118 (24.3%) |
| 3-Person Household | 94 (63.5%) | 54 (36.5%) |
| 4+ Person Household | 194 (66.2%) | 99 (33.8%) |
| Total Housing Units | 1,040 (68.1%) | 488 (31.9%) |
Occupancy by Educational Attainment in Warrensburg
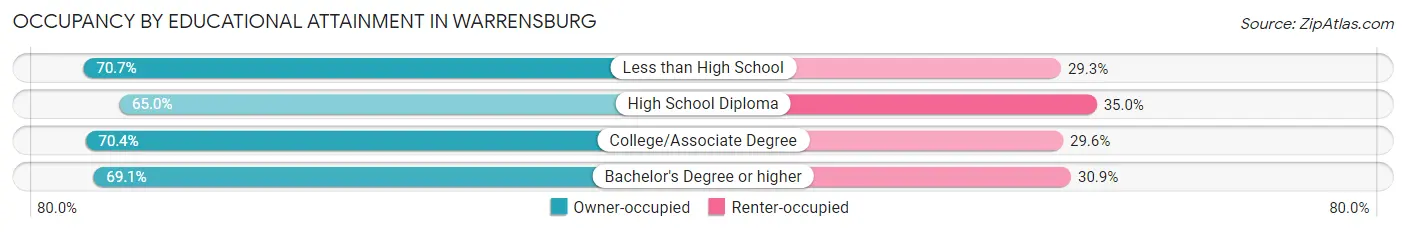
| Household Size | Owner-occupied | Renter-occupied |
| Less than High School | 123 (70.7%) | 51 (29.3%) |
| High School Diploma | 409 (65.0%) | 220 (35.0%) |
| College/Associate Degree | 394 (70.4%) | 166 (29.6%) |
| Bachelor's Degree or higher | 114 (69.1%) | 51 (30.9%) |
Occupancy by Age of Householder in Warrensburg
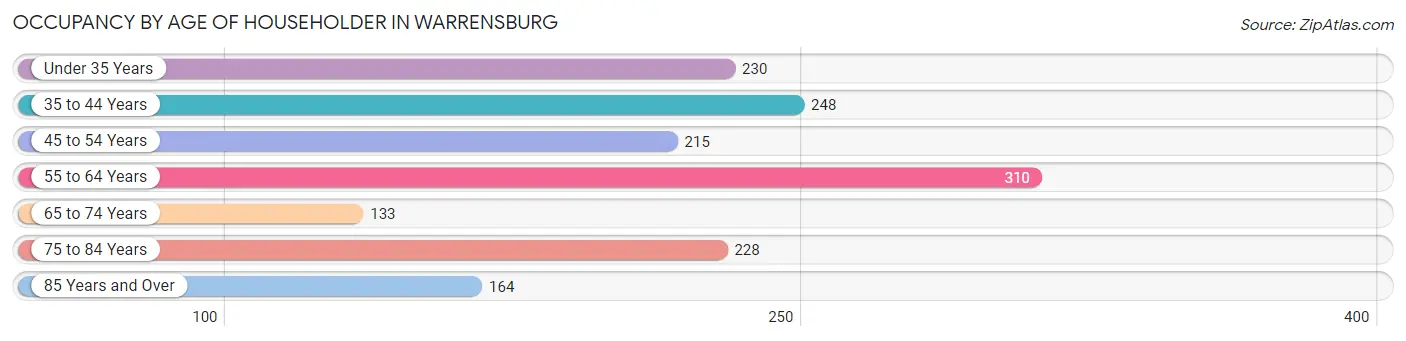
| Age Bracket | # Households | % Households |
| Under 35 Years | 230 | 15.0% |
| 35 to 44 Years | 248 | 16.2% |
| 45 to 54 Years | 215 | 14.1% |
| 55 to 64 Years | 310 | 20.3% |
| 65 to 74 Years | 133 | 8.7% |
| 75 to 84 Years | 228 | 14.9% |
| 85 Years and Over | 164 | 10.7% |
| Total | 1,528 | 100.0% |
Housing Finances in Warrensburg
Median Income by Occupancy in Warrensburg
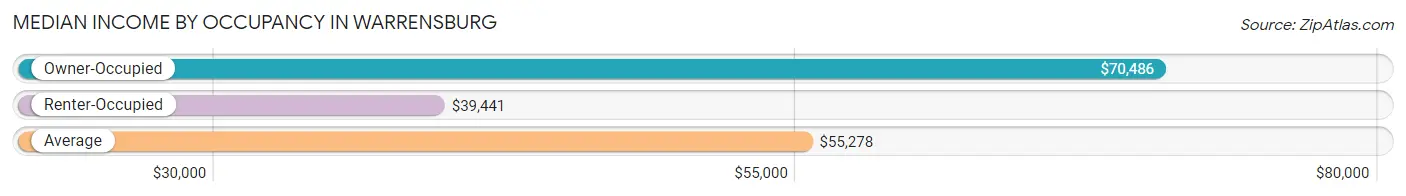
| Occupancy Type | # Households | Median Income |
| Owner-Occupied | 1,040 (68.1%) | $70,486 |
| Renter-Occupied | 488 (31.9%) | $39,441 |
| Average | 1,528 (100.0%) | $55,278 |
Occupancy by Householder Income Bracket in Warrensburg
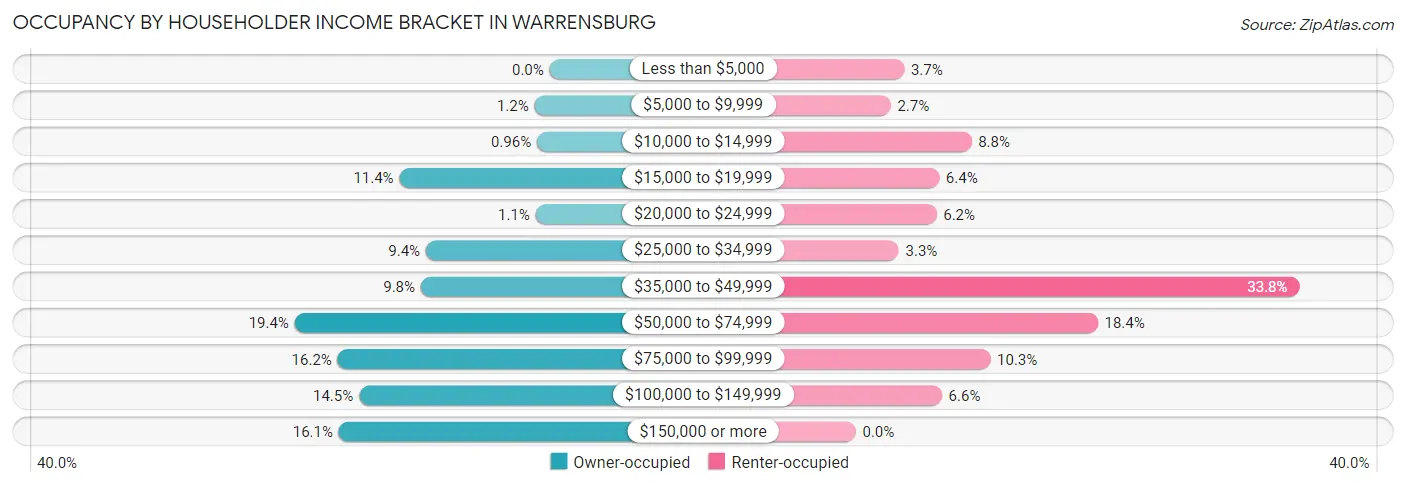
| Income Bracket | Owner-occupied | Renter-occupied |
| Less than $5,000 | 0 (0.0%) | 18 (3.7%) |
| $5,000 to $9,999 | 12 (1.1%) | 13 (2.7%) |
| $10,000 to $14,999 | 10 (1.0%) | 43 (8.8%) |
| $15,000 to $19,999 | 119 (11.4%) | 31 (6.4%) |
| $20,000 to $24,999 | 11 (1.1%) | 30 (6.1%) |
| $25,000 to $34,999 | 98 (9.4%) | 16 (3.3%) |
| $35,000 to $49,999 | 102 (9.8%) | 165 (33.8%) |
| $50,000 to $74,999 | 202 (19.4%) | 90 (18.4%) |
| $75,000 to $99,999 | 168 (16.2%) | 50 (10.2%) |
| $100,000 to $149,999 | 151 (14.5%) | 32 (6.6%) |
| $150,000 or more | 167 (16.1%) | 0 (0.0%) |
| Total | 1,040 (100.0%) | 488 (100.0%) |
Monthly Housing Cost Tiers in Warrensburg
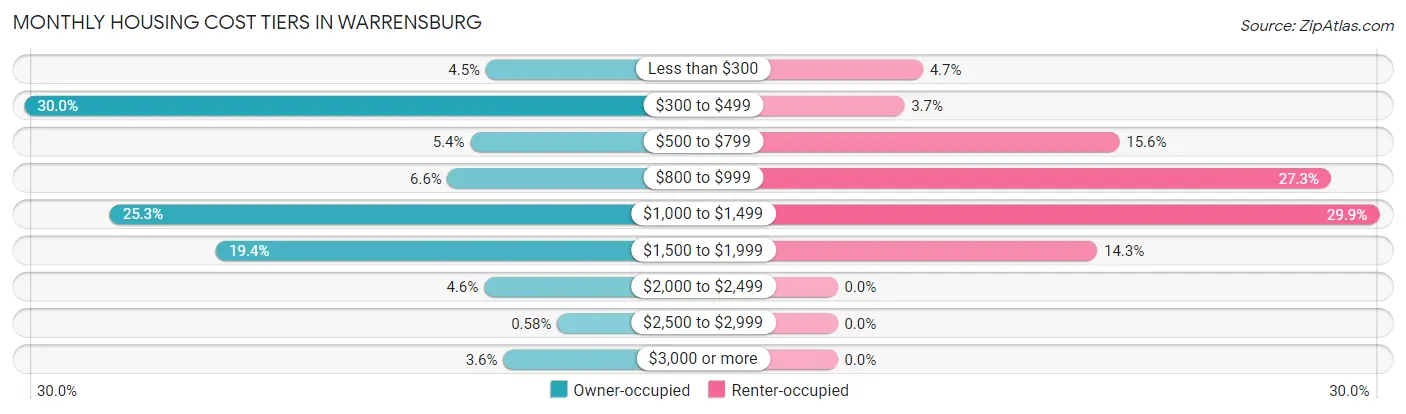
| Monthly Cost | Owner-occupied | Renter-occupied |
| Less than $300 | 47 (4.5%) | 23 (4.7%) |
| $300 to $499 | 312 (30.0%) | 18 (3.7%) |
| $500 to $799 | 56 (5.4%) | 76 (15.6%) |
| $800 to $999 | 69 (6.6%) | 133 (27.3%) |
| $1,000 to $1,499 | 263 (25.3%) | 146 (29.9%) |
| $1,500 to $1,999 | 202 (19.4%) | 70 (14.3%) |
| $2,000 to $2,499 | 48 (4.6%) | 0 (0.0%) |
| $2,500 to $2,999 | 6 (0.6%) | 0 (0.0%) |
| $3,000 or more | 37 (3.6%) | 0 (0.0%) |
| Total | 1,040 (100.0%) | 488 (100.0%) |
Physical Housing Characteristics in Warrensburg
Housing Structures in Warrensburg
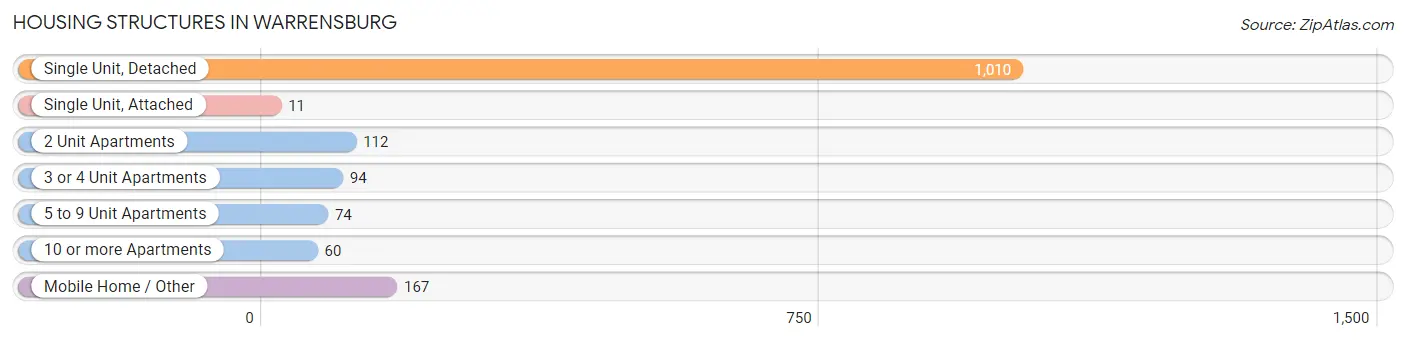
| Structure Type | # Housing Units | % Housing Units |
| Single Unit, Detached | 1,010 | 66.1% |
| Single Unit, Attached | 11 | 0.7% |
| 2 Unit Apartments | 112 | 7.3% |
| 3 or 4 Unit Apartments | 94 | 6.1% |
| 5 to 9 Unit Apartments | 74 | 4.8% |
| 10 or more Apartments | 60 | 3.9% |
| Mobile Home / Other | 167 | 10.9% |
| Total | 1,528 | 100.0% |
Housing Structures by Occupancy in Warrensburg
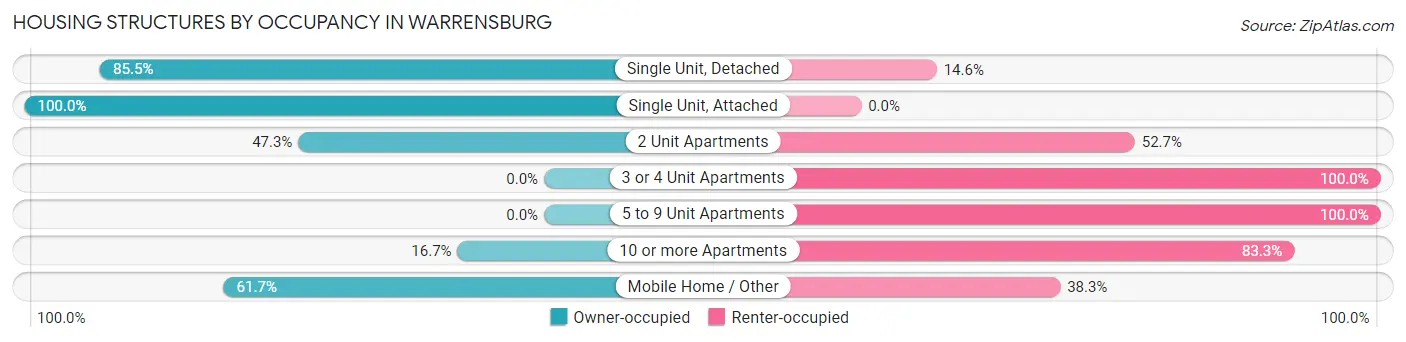
| Structure Type | Owner-occupied | Renter-occupied |
| Single Unit, Detached | 863 (85.5%) | 147 (14.5%) |
| Single Unit, Attached | 11 (100.0%) | 0 (0.0%) |
| 2 Unit Apartments | 53 (47.3%) | 59 (52.7%) |
| 3 or 4 Unit Apartments | 0 (0.0%) | 94 (100.0%) |
| 5 to 9 Unit Apartments | 0 (0.0%) | 74 (100.0%) |
| 10 or more Apartments | 10 (16.7%) | 50 (83.3%) |
| Mobile Home / Other | 103 (61.7%) | 64 (38.3%) |
| Total | 1,040 (68.1%) | 488 (31.9%) |
Housing Structures by Number of Rooms in Warrensburg
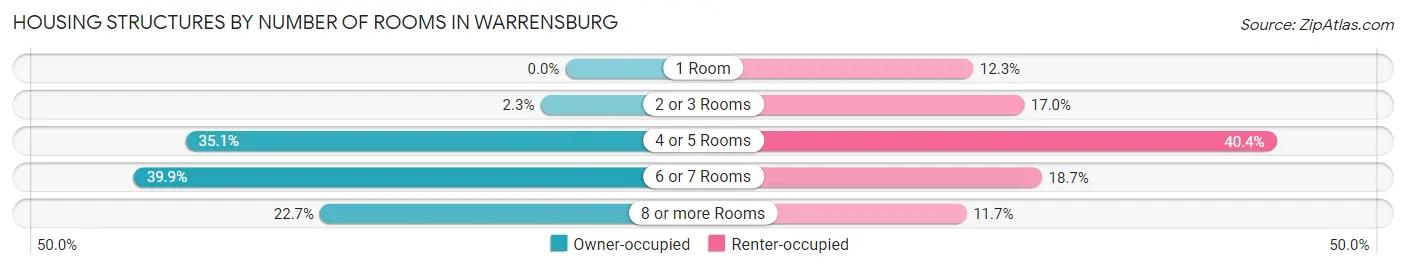
| Number of Rooms | Owner-occupied | Renter-occupied |
| 1 Room | 0 (0.0%) | 60 (12.3%) |
| 2 or 3 Rooms | 24 (2.3%) | 83 (17.0%) |
| 4 or 5 Rooms | 365 (35.1%) | 197 (40.4%) |
| 6 or 7 Rooms | 415 (39.9%) | 91 (18.6%) |
| 8 or more Rooms | 236 (22.7%) | 57 (11.7%) |
| Total | 1,040 (100.0%) | 488 (100.0%) |
Housing Structure by Heating Type in Warrensburg
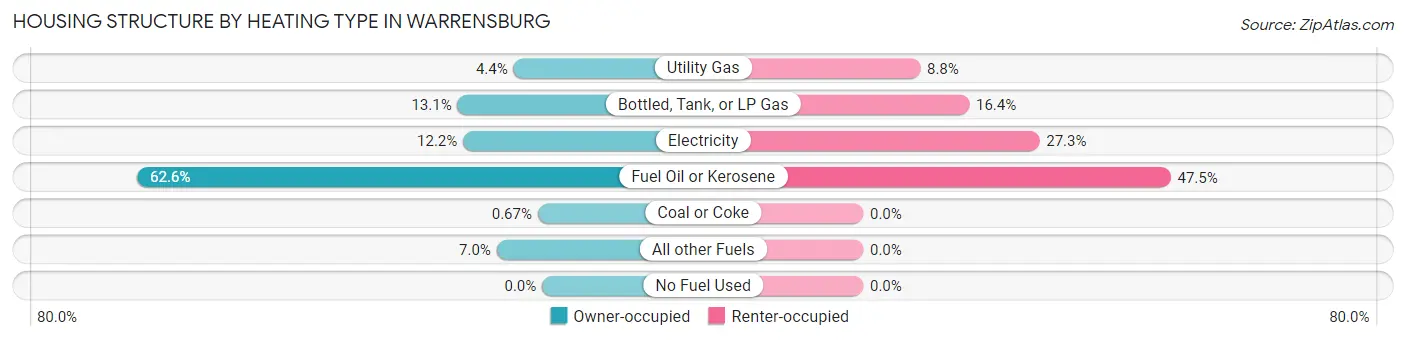
| Heating Type | Owner-occupied | Renter-occupied |
| Utility Gas | 46 (4.4%) | 43 (8.8%) |
| Bottled, Tank, or LP Gas | 136 (13.1%) | 80 (16.4%) |
| Electricity | 127 (12.2%) | 133 (27.3%) |
| Fuel Oil or Kerosene | 651 (62.6%) | 232 (47.5%) |
| Coal or Coke | 7 (0.7%) | 0 (0.0%) |
| All other Fuels | 73 (7.0%) | 0 (0.0%) |
| No Fuel Used | 0 (0.0%) | 0 (0.0%) |
| Total | 1,040 (100.0%) | 488 (100.0%) |
Household Vehicle Usage in Warrensburg
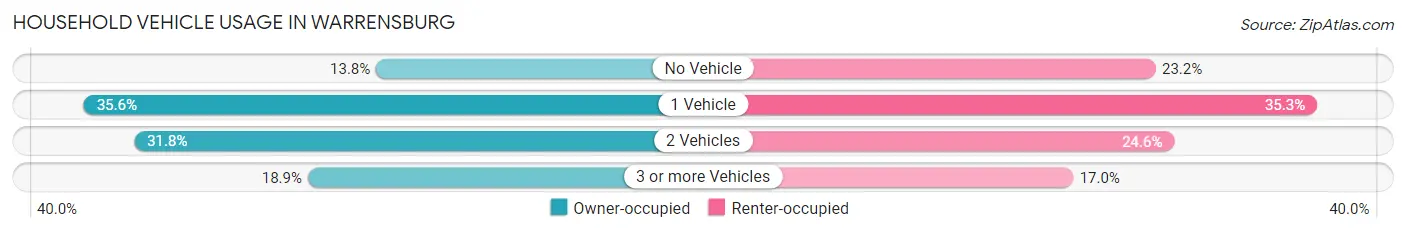
| Vehicles per Household | Owner-occupied | Renter-occupied |
| No Vehicle | 143 (13.8%) | 113 (23.2%) |
| 1 Vehicle | 370 (35.6%) | 172 (35.2%) |
| 2 Vehicles | 331 (31.8%) | 120 (24.6%) |
| 3 or more Vehicles | 196 (18.9%) | 83 (17.0%) |
| Total | 1,040 (100.0%) | 488 (100.0%) |
Real Estate & Mortgages in Warrensburg
Real Estate and Mortgage Overview in Warrensburg
| Characteristic | Without Mortgage | With Mortgage |
| Housing Units | 465 | 575 |
| Median Property Value | $140,500 | $145,000 |
| Median Household Income | $38,618 | $138 |
| Monthly Housing Costs | $368 | $37 |
| Real Estate Taxes | $1,844 | $0 |
Property Value by Mortgage Status in Warrensburg
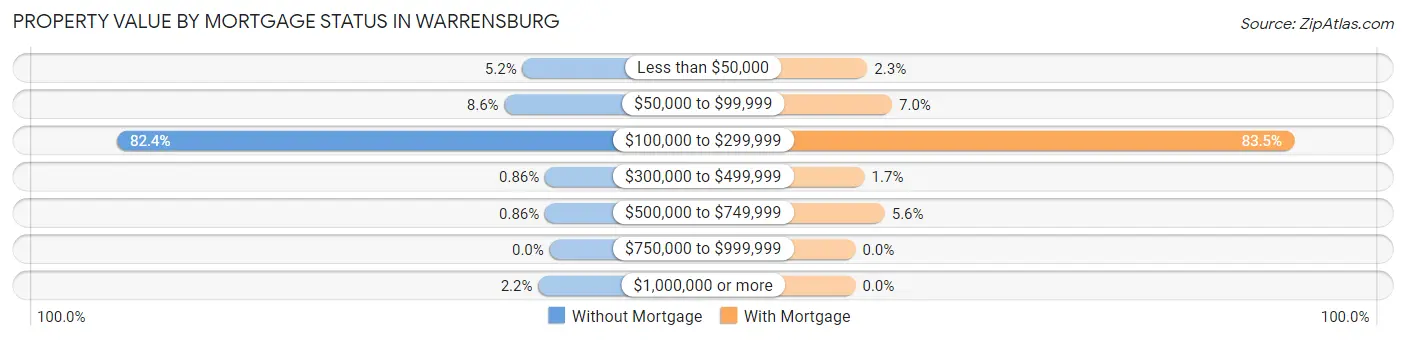
| Property Value | Without Mortgage | With Mortgage |
| Less than $50,000 | 24 (5.2%) | 13 (2.3%) |
| $50,000 to $99,999 | 40 (8.6%) | 40 (7.0%) |
| $100,000 to $299,999 | 383 (82.4%) | 480 (83.5%) |
| $300,000 to $499,999 | 4 (0.9%) | 10 (1.7%) |
| $500,000 to $749,999 | 4 (0.9%) | 32 (5.6%) |
| $750,000 to $999,999 | 0 (0.0%) | 0 (0.0%) |
| $1,000,000 or more | 10 (2.1%) | 0 (0.0%) |
| Total | 465 (100.0%) | 575 (100.0%) |
Household Income by Mortgage Status in Warrensburg
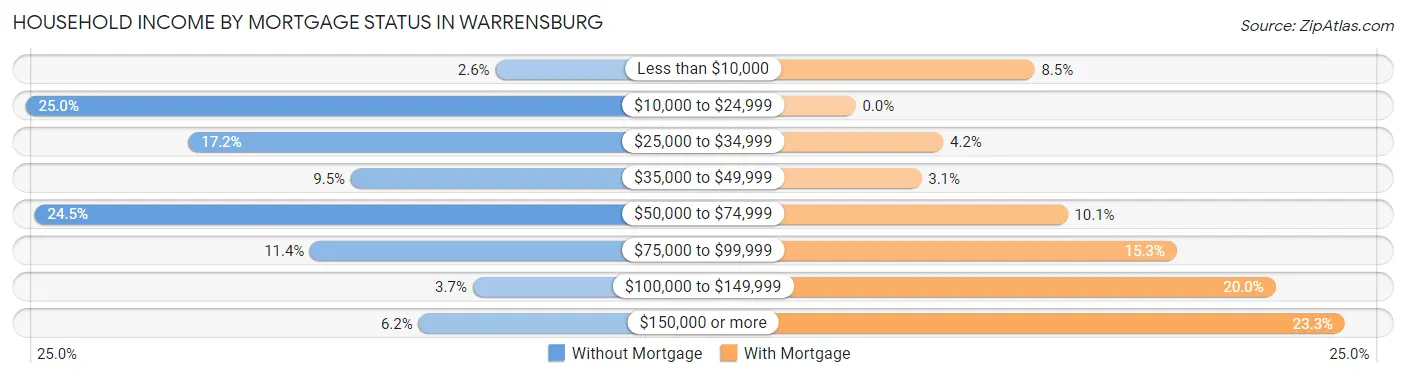
| Household Income | Without Mortgage | With Mortgage |
| Less than $10,000 | 12 (2.6%) | 49 (8.5%) |
| $10,000 to $24,999 | 116 (24.9%) | 0 (0.0%) |
| $25,000 to $34,999 | 80 (17.2%) | 24 (4.2%) |
| $35,000 to $49,999 | 44 (9.5%) | 18 (3.1%) |
| $50,000 to $74,999 | 114 (24.5%) | 58 (10.1%) |
| $75,000 to $99,999 | 53 (11.4%) | 88 (15.3%) |
| $100,000 to $149,999 | 17 (3.7%) | 115 (20.0%) |
| $150,000 or more | 29 (6.2%) | 134 (23.3%) |
| Total | 465 (100.0%) | 575 (100.0%) |
Property Value to Household Income Ratio in Warrensburg
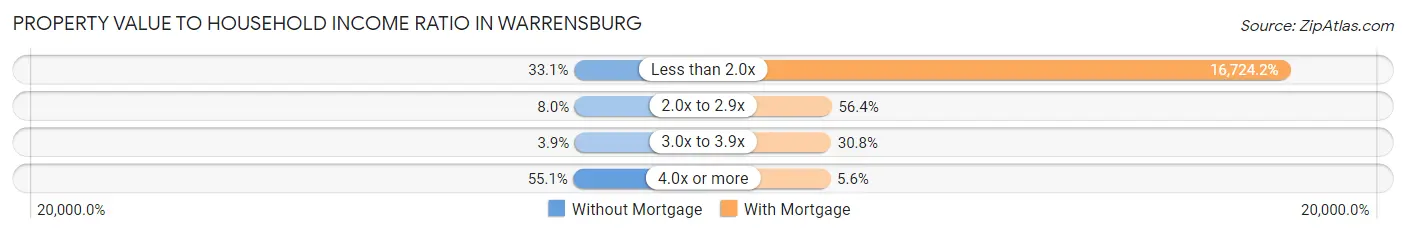
| Value-to-Income Ratio | Without Mortgage | With Mortgage |
| Less than 2.0x | 154 (33.1%) | 96,164 (16,724.2%) |
| 2.0x to 2.9x | 37 (8.0%) | 324 (56.4%) |
| 3.0x to 3.9x | 18 (3.9%) | 177 (30.8%) |
| 4.0x or more | 256 (55.0%) | 32 (5.6%) |
| Total | 465 (100.0%) | 575 (100.0%) |
Real Estate Taxes by Mortgage Status in Warrensburg
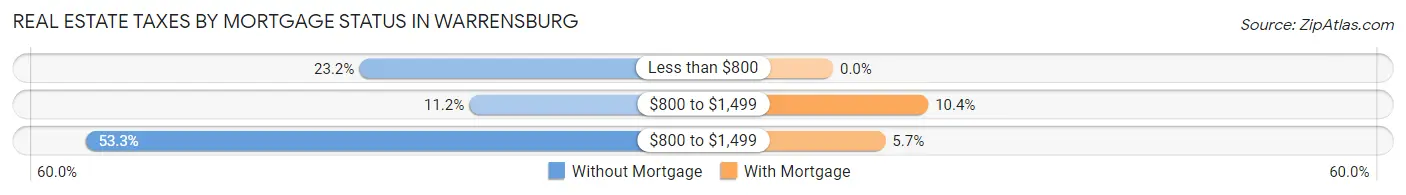
| Property Taxes | Without Mortgage | With Mortgage |
| Less than $800 | 108 (23.2%) | 0 (0.0%) |
| $800 to $1,499 | 52 (11.2%) | 60 (10.4%) |
| $800 to $1,499 | 248 (53.3%) | 33 (5.7%) |
| Total | 465 (100.0%) | 575 (100.0%) |
Health & Disability in Warrensburg
Health Insurance Coverage by Age in Warrensburg
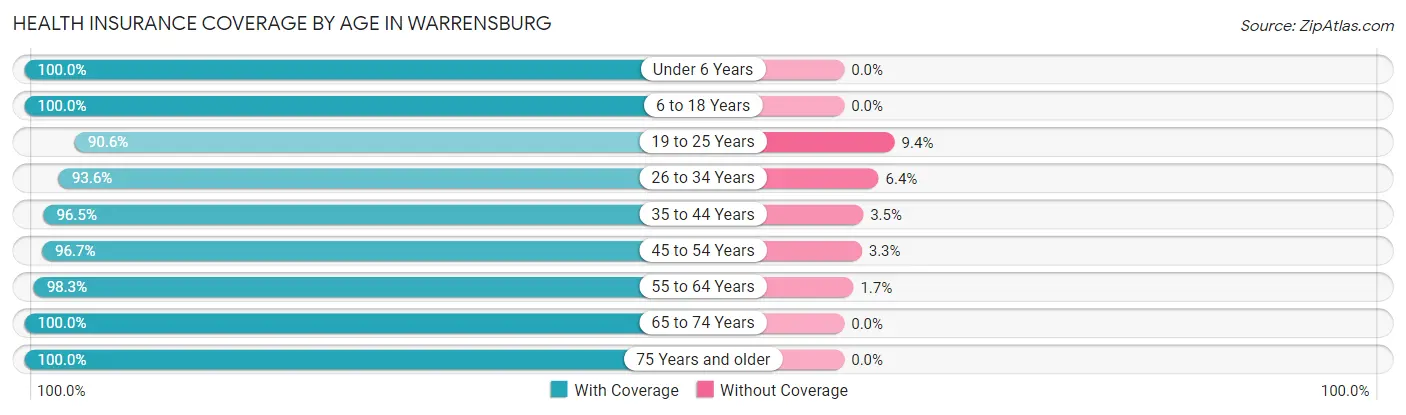
| Age Bracket | With Coverage | Without Coverage |
| Under 6 Years | 259 (100.0%) | 0 (0.0%) |
| 6 to 18 Years | 545 (100.0%) | 0 (0.0%) |
| 19 to 25 Years | 193 (90.6%) | 20 (9.4%) |
| 26 to 34 Years | 351 (93.6%) | 24 (6.4%) |
| 35 to 44 Years | 383 (96.5%) | 14 (3.5%) |
| 45 to 54 Years | 415 (96.7%) | 14 (3.3%) |
| 55 to 64 Years | 461 (98.3%) | 8 (1.7%) |
| 65 to 74 Years | 195 (100.0%) | 0 (0.0%) |
| 75 Years and older | 425 (100.0%) | 0 (0.0%) |
| Total | 3,227 (97.6%) | 80 (2.4%) |
Health Insurance Coverage by Citizenship Status in Warrensburg
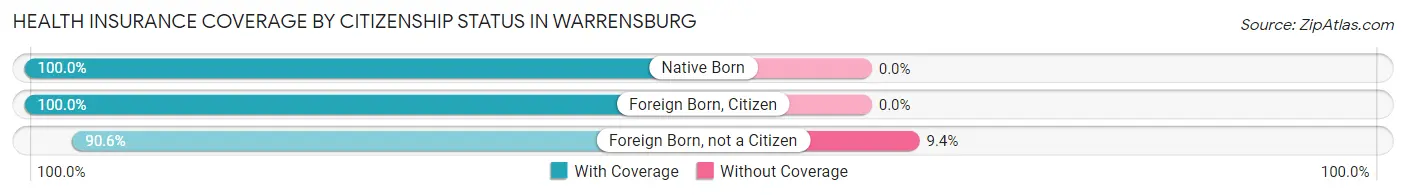
| Citizenship Status | With Coverage | Without Coverage |
| Native Born | 259 (100.0%) | 0 (0.0%) |
| Foreign Born, Citizen | 545 (100.0%) | 0 (0.0%) |
| Foreign Born, not a Citizen | 193 (90.6%) | 20 (9.4%) |
Health Insurance Coverage by Household Income in Warrensburg
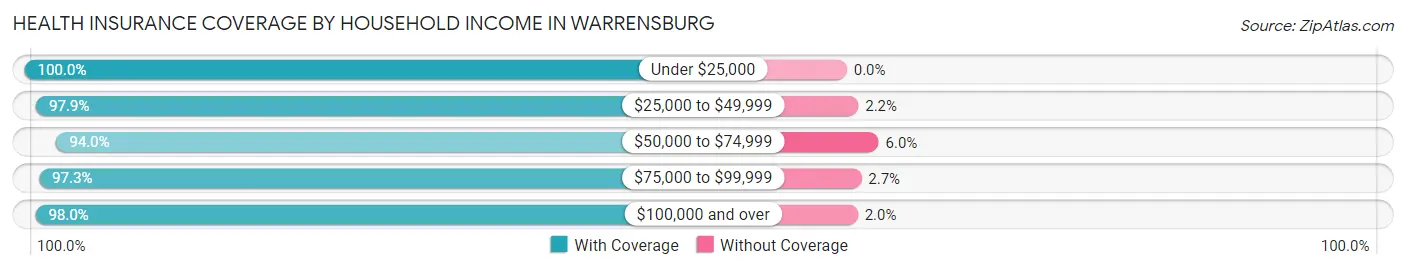
| Household Income | With Coverage | Without Coverage |
| Under $25,000 | 484 (100.0%) | 0 (0.0%) |
| $25,000 to $49,999 | 636 (97.9%) | 14 (2.1%) |
| $50,000 to $74,999 | 442 (94.0%) | 28 (6.0%) |
| $75,000 to $99,999 | 499 (97.3%) | 14 (2.7%) |
| $100,000 and over | 1,150 (98.0%) | 24 (2.0%) |
Public vs Private Health Insurance Coverage by Age in Warrensburg
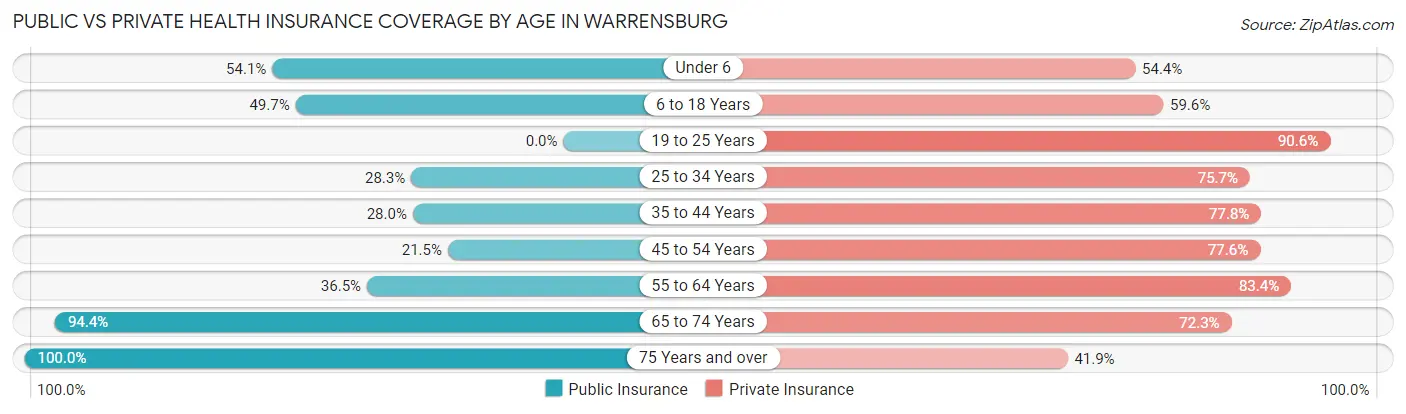
| Age Bracket | Public Insurance | Private Insurance |
| Under 6 | 140 (54.0%) | 141 (54.4%) |
| 6 to 18 Years | 271 (49.7%) | 325 (59.6%) |
| 19 to 25 Years | 0 (0.0%) | 193 (90.6%) |
| 25 to 34 Years | 106 (28.3%) | 284 (75.7%) |
| 35 to 44 Years | 111 (28.0%) | 309 (77.8%) |
| 45 to 54 Years | 92 (21.4%) | 333 (77.6%) |
| 55 to 64 Years | 171 (36.5%) | 391 (83.4%) |
| 65 to 74 Years | 184 (94.4%) | 141 (72.3%) |
| 75 Years and over | 425 (100.0%) | 178 (41.9%) |
| Total | 1,500 (45.4%) | 2,295 (69.4%) |
Disability Status by Sex by Age in Warrensburg
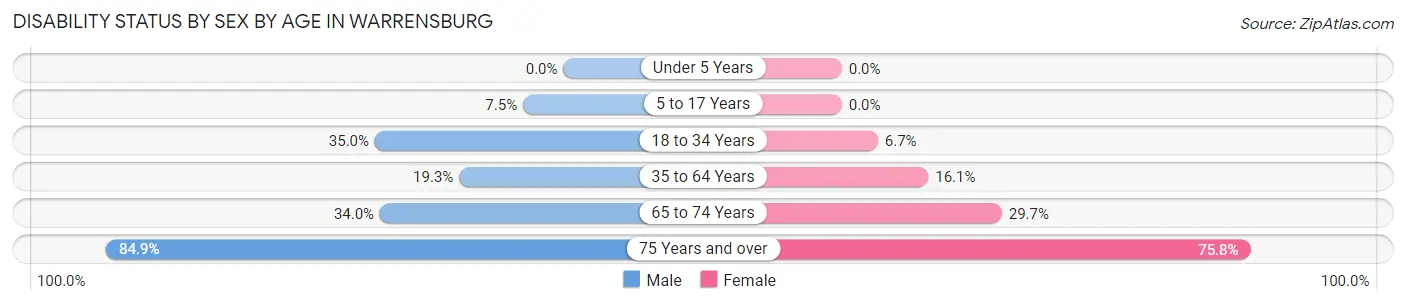
| Age Bracket | Male | Female |
| Under 5 Years | 0 (0.0%) | 0 (0.0%) |
| 5 to 17 Years | 32 (7.5%) | 0 (0.0%) |
| 18 to 34 Years | 134 (35.0%) | 16 (6.7%) |
| 35 to 64 Years | 118 (19.3%) | 110 (16.1%) |
| 65 to 74 Years | 32 (34.0%) | 30 (29.7%) |
| 75 Years and over | 101 (84.9%) | 232 (75.8%) |
Disability Class by Sex by Age in Warrensburg
Disability Class: Hearing Difficulty
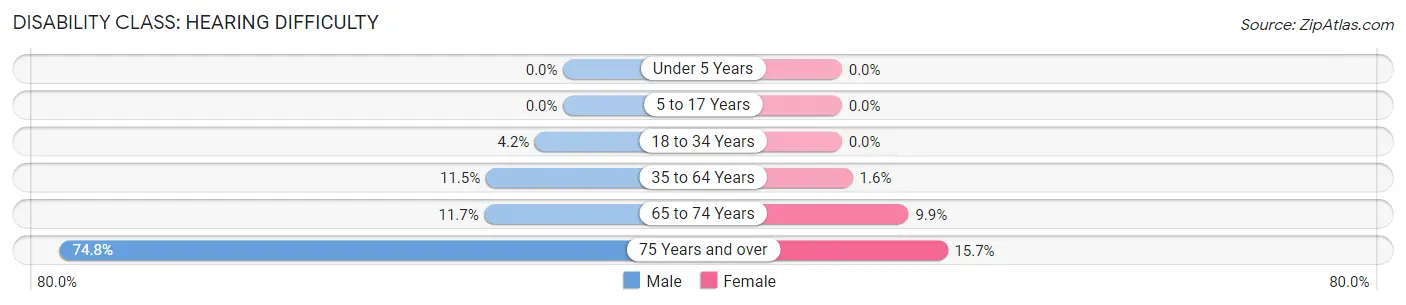
| Age Bracket | Male | Female |
| Under 5 Years | 0 (0.0%) | 0 (0.0%) |
| 5 to 17 Years | 0 (0.0%) | 0 (0.0%) |
| 18 to 34 Years | 16 (4.2%) | 0 (0.0%) |
| 35 to 64 Years | 70 (11.5%) | 11 (1.6%) |
| 65 to 74 Years | 11 (11.7%) | 10 (9.9%) |
| 75 Years and over | 89 (74.8%) | 48 (15.7%) |
Disability Class: Vision Difficulty
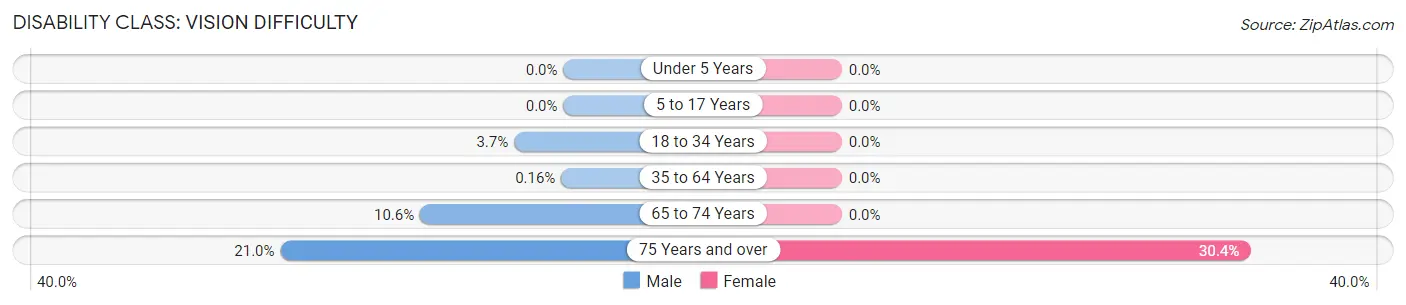
| Age Bracket | Male | Female |
| Under 5 Years | 0 (0.0%) | 0 (0.0%) |
| 5 to 17 Years | 0 (0.0%) | 0 (0.0%) |
| 18 to 34 Years | 14 (3.7%) | 0 (0.0%) |
| 35 to 64 Years | 1 (0.2%) | 0 (0.0%) |
| 65 to 74 Years | 10 (10.6%) | 0 (0.0%) |
| 75 Years and over | 25 (21.0%) | 93 (30.4%) |
Disability Class: Cognitive Difficulty
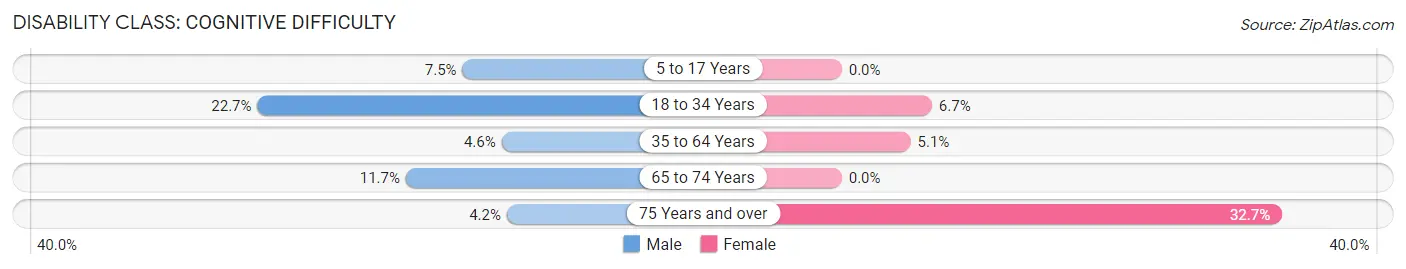
| Age Bracket | Male | Female |
| 5 to 17 Years | 32 (7.5%) | 0 (0.0%) |
| 18 to 34 Years | 87 (22.7%) | 16 (6.7%) |
| 35 to 64 Years | 28 (4.6%) | 35 (5.1%) |
| 65 to 74 Years | 11 (11.7%) | 0 (0.0%) |
| 75 Years and over | 5 (4.2%) | 100 (32.7%) |
Disability Class: Ambulatory Difficulty
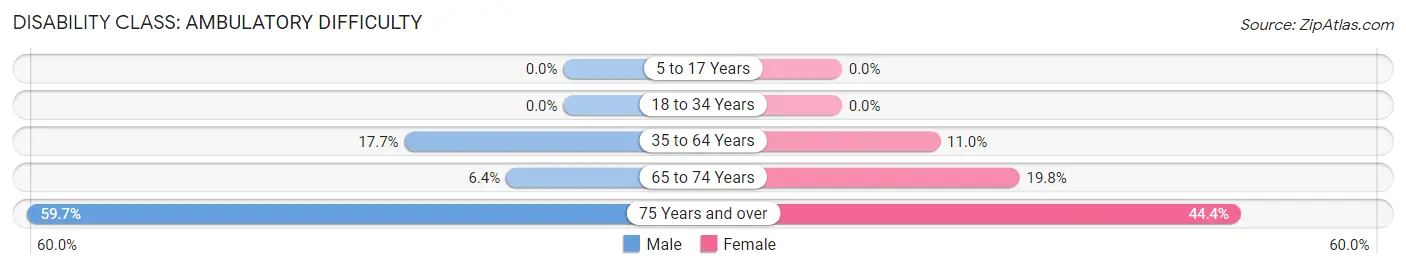
| Age Bracket | Male | Female |
| 5 to 17 Years | 0 (0.0%) | 0 (0.0%) |
| 18 to 34 Years | 0 (0.0%) | 0 (0.0%) |
| 35 to 64 Years | 108 (17.7%) | 75 (11.0%) |
| 65 to 74 Years | 6 (6.4%) | 20 (19.8%) |
| 75 Years and over | 71 (59.7%) | 136 (44.4%) |
Disability Class: Self-Care Difficulty
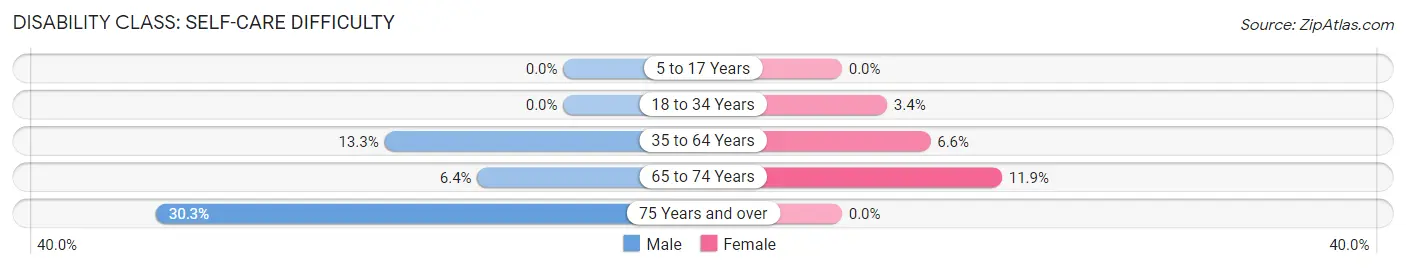
| Age Bracket | Male | Female |
| 5 to 17 Years | 0 (0.0%) | 0 (0.0%) |
| 18 to 34 Years | 0 (0.0%) | 8 (3.4%) |
| 35 to 64 Years | 81 (13.3%) | 45 (6.6%) |
| 65 to 74 Years | 6 (6.4%) | 12 (11.9%) |
| 75 Years and over | 36 (30.2%) | 0 (0.0%) |
Technology Access in Warrensburg
Computing Device Access in Warrensburg
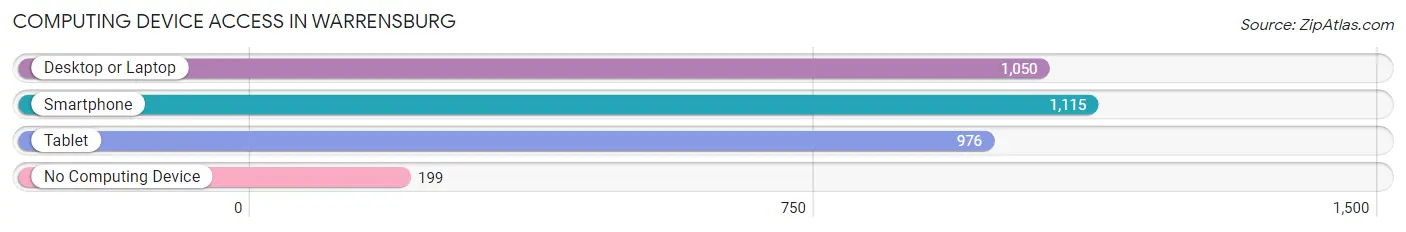
| Device Type | # Households | % Households |
| Desktop or Laptop | 1,050 | 68.7% |
| Smartphone | 1,115 | 73.0% |
| Tablet | 976 | 63.9% |
| No Computing Device | 199 | 13.0% |
| Total | 1,528 | 100.0% |
Internet Access in Warrensburg
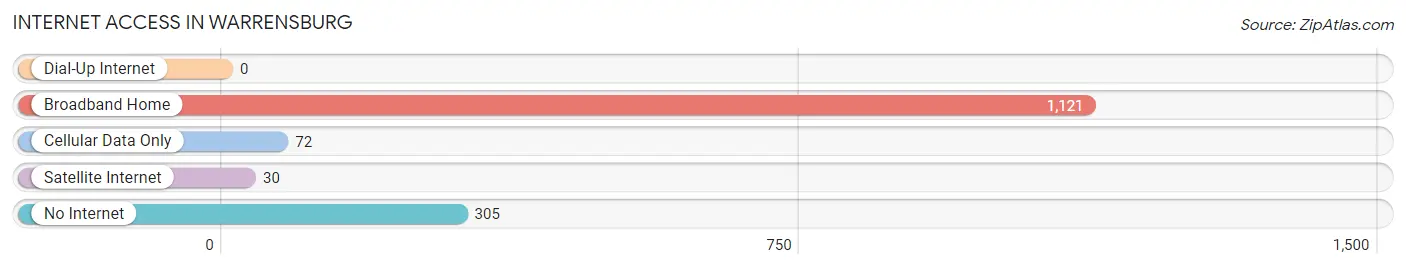
| Internet Type | # Households | % Households |
| Dial-Up Internet | 0 | 0.0% |
| Broadband Home | 1,121 | 73.4% |
| Cellular Data Only | 72 | 4.7% |
| Satellite Internet | 30 | 2.0% |
| No Internet | 305 | 20.0% |
| Total | 1,528 | 100.0% |
Warrensburg Summary
Warrensburg is a town located in the Adirondack Mountains of New York State, in the county of Warren. It is situated on the Schroon River, and is the largest town in the county. The town was first settled in 1786, and was incorporated in 1813.
Geography
Warrensburg is located in the Adirondack Mountains of New York State, in the county of Warren. It is situated on the Schroon River, and is the largest town in the county. The town is bordered by the towns of Thurman to the north, Bolton to the east, Chester to the south, and Lake George to the west. The town has a total area of 97.2 square miles, of which 96.9 square miles is land and 0.3 square miles is water. The highest point in the town is Crane Mountain, with an elevation of 2,890 feet.
The town is home to several lakes, including Lake George, Lake Luzerne, and Lake Vanare. The Schroon River runs through the town, and is a popular destination for fishing and boating. The town is also home to several state parks, including the Lake George State Park, the Lake Luzerne State Park, and the Warrensburg State Park.
Economy
The economy of Warrensburg is largely based on tourism. The town is home to several resorts and hotels, as well as restaurants and other businesses catering to tourists. The town is also home to several manufacturing companies, including a paper mill and a furniture factory.
The town is also home to several farms, which produce a variety of crops, including apples, corn, and hay. The town is also home to several wineries, which produce a variety of wines.
Demographics
As of the 2010 census, the town had a population of 4,945. The racial makeup of the town was 97.2% White, 0.7% African American, 0.3% Native American, 0.4% Asian, 0.1% Pacific Islander, 0.3% from other races, and 1.0% from two or more races. Hispanic or Latino of any race were 1.7% of the population.
The median income for a household in the town was $41,944, and the median income for a family was $50,917. The per capita income for the town was $20,945. About 8.2% of families and 11.2% of the population were below the poverty line, including 15.2% of those under age 18 and 6.2% of those age 65 or over.
Conclusion
Warrensburg is a town located in the Adirondack Mountains of New York State, in the county of Warren. It is situated on the Schroon River, and is the largest town in the county. The town was first settled in 1786, and was incorporated in 1813. The economy of Warrensburg is largely based on tourism, with several resorts and hotels, as well as restaurants and other businesses catering to tourists. The town is also home to several manufacturing companies, farms, and wineries. As of the 2010 census, the town had a population of 4,945. The median income for a household in the town was $41,944, and the median income for a family was $50,917.
Common Questions
What is the Total Population of Warrensburg?
Total Population of Warrensburg is 3,307.
What is the Total Male Population of Warrensburg?
Total Male Population of Warrensburg is 1,699.
What is the Total Female Population of Warrensburg?
Total Female Population of Warrensburg is 1,608.
What is the Ratio of Males per 100 Females in Warrensburg?
There are 105.66 Males per 100 Females in Warrensburg.
What is the Ratio of Females per 100 Males in Warrensburg?
There are 94.64 Females per 100 Males in Warrensburg.
What is the Median Population Age in Warrensburg?
Median Population Age in Warrensburg is 41.3 Years.
What is the Average Family Size in Warrensburg
Average Family Size in Warrensburg is 2.8 People.
What is the Average Household Size in Warrensburg
Average Household Size in Warrensburg is 2.1 People.
What is Per Capita Income in Warrensburg?
Per Capita income in Warrensburg is $31,962.
What is the Median Family Income in Warrensburg?
Median Family Income in Warrensburg is $85,907.
What is the Median Household income in Warrensburg?
Median Household Income in Warrensburg is $55,278.
What is Income or Wage Gap in Warrensburg?
Income or Wage Gap in Warrensburg is 8.7%.
Women in Warrensburg earn 91.3 cents for every dollar earned by a man.
What is Inequality or Gini Index in Warrensburg?
Inequality or Gini Index in Warrensburg is 0.39.
How Large is the Labor Force in Warrensburg?
There are 1,540 People in the Labor Forcein in Warrensburg.
What is the Percentage of People in the Labor Force in Warrensburg?
57.3% of People are in the Labor Force in Warrensburg.