Massena, NY
Massena Map
Massena Overview
10,218
TOTAL POPULATION
4,695
MALE POPULATION
5,523
FEMALE POPULATION
85.01
MALES / 100 FEMALES
117.64
FEMALES / 100 MALES
41.8
MEDIAN AGE
2.8
AVG FAMILY SIZE
2.1
AVG HOUSEHOLD SIZE
$31,452
PER CAPITA INCOME
$62,104
AVG FAMILY INCOME
$48,161
AVG HOUSEHOLD INCOME
13.1%
WAGE / INCOME GAP [ % ]
86.9¢/ $1
WAGE / INCOME GAP [ $ ]
0.48
INEQUALITY / GINI INDEX
4,688
LABOR FORCE [ PEOPLE ]
55.7%
PERCENT IN LABOR FORCE
6.7%
UNEMPLOYMENT RATE
Massena Zip Codes
Massena Area Codes
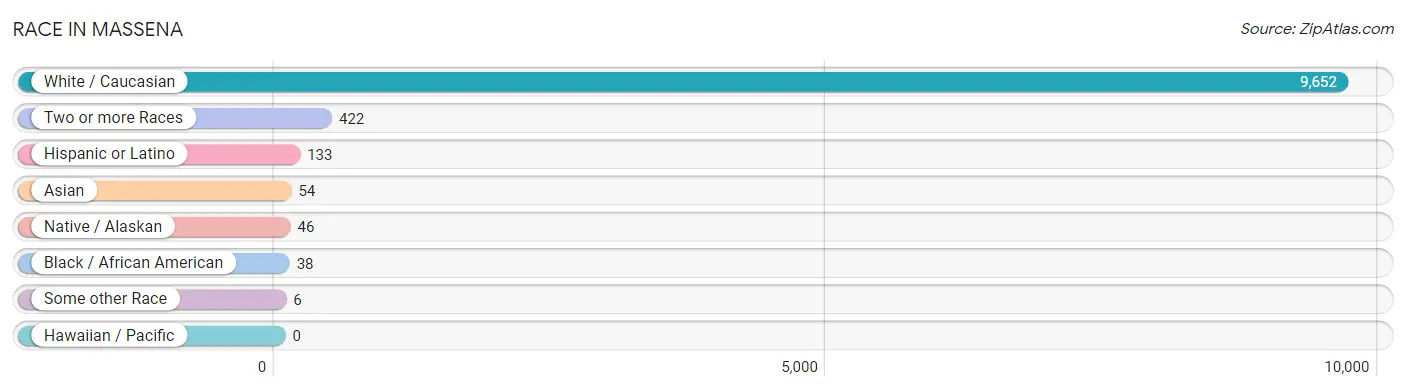
Race in Massena
The most populous races in Massena are White / Caucasian (9,652 | 94.5%), Two or more Races (422 | 4.1%), and Hispanic or Latino (133 | 1.3%).
| Race | # Population | % Population |
| Asian | 54 | 0.5% |
| Black / African American | 38 | 0.4% |
| Hawaiian / Pacific | 0 | 0.0% |
| Hispanic or Latino | 133 | 1.3% |
| Native / Alaskan | 46 | 0.4% |
| White / Caucasian | 9,652 | 94.5% |
| Two or more Races | 422 | 4.1% |
| Some other Race | 6 | 0.1% |
| Total | 10,218 | 100.0% |
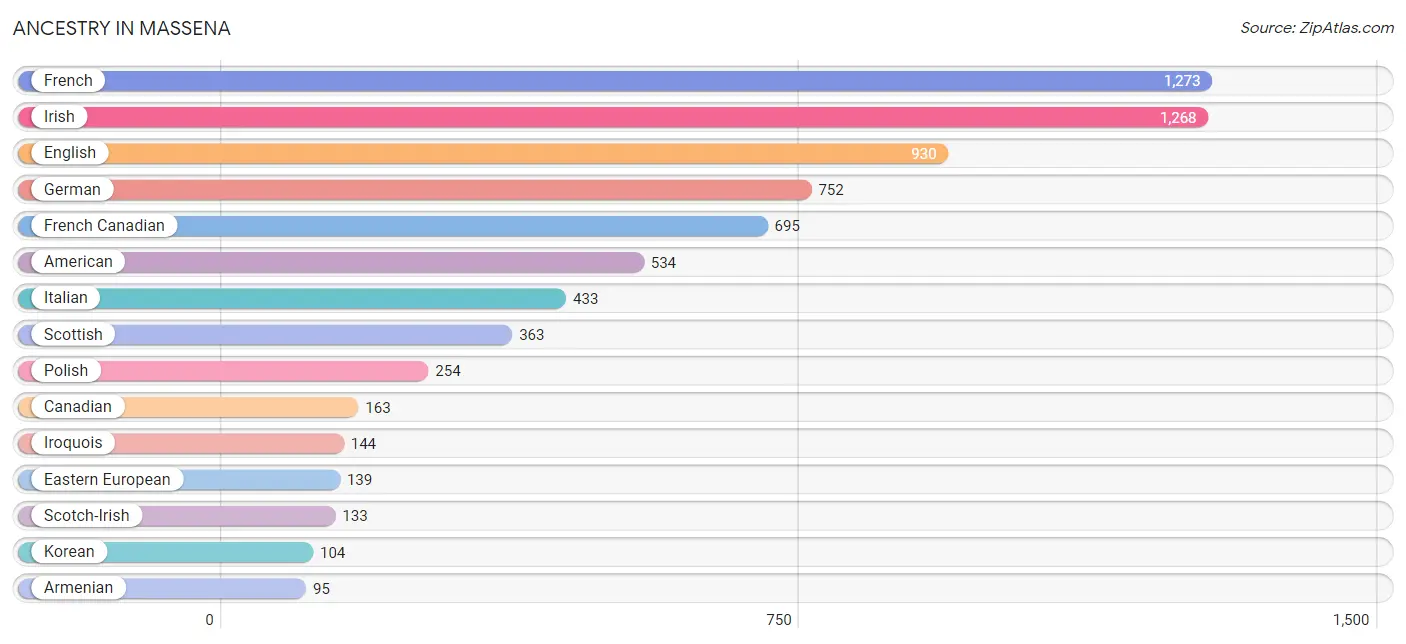
Ancestry in Massena
The most populous ancestries reported in Massena are French (1,273 | 12.5%), Irish (1,268 | 12.4%), English (930 | 9.1%), German (752 | 7.4%), and French Canadian (695 | 6.8%), together accounting for 48.1% of all Massena residents.
| Ancestry | # Population | % Population |
| African | 12 | 0.1% |
| American | 534 | 5.2% |
| Arab | 69 | 0.7% |
| Armenian | 95 | 0.9% |
| Austrian | 2 | 0.0% |
| Bhutanese | 19 | 0.2% |
| Bulgarian | 20 | 0.2% |
| Canadian | 163 | 1.6% |
| Dominican | 39 | 0.4% |
| Dutch | 21 | 0.2% |
| Eastern European | 139 | 1.4% |
| Ecuadorian | 17 | 0.2% |
| English | 930 | 9.1% |
| Estonian | 39 | 0.4% |
| European | 18 | 0.2% |
| French | 1,273 | 12.5% |
| French Canadian | 695 | 6.8% |
| German | 752 | 7.4% |
| Greek | 7 | 0.1% |
| Hungarian | 32 | 0.3% |
| Indian (Asian) | 26 | 0.3% |
| Iranian | 20 | 0.2% |
| Irish | 1,268 | 12.4% |
| Iroquois | 144 | 1.4% |
| Israeli | 1 | 0.0% |
| Italian | 433 | 4.2% |
| Jamaican | 13 | 0.1% |
| Korean | 104 | 1.0% |
| Lebanese | 14 | 0.1% |
| Lithuanian | 8 | 0.1% |
| Mexican | 6 | 0.1% |
| Native Hawaiian | 19 | 0.2% |
| Northern European | 15 | 0.2% |
| Norwegian | 8 | 0.1% |
| Pakistani | 10 | 0.1% |
| Pennsylvania German | 39 | 0.4% |
| Peruvian | 4 | 0.0% |
| Polish | 254 | 2.5% |
| Portuguese | 47 | 0.5% |
| Puerto Rican | 44 | 0.4% |
| Romanian | 79 | 0.8% |
| Russian | 32 | 0.3% |
| Scandinavian | 89 | 0.9% |
| Scotch-Irish | 133 | 1.3% |
| Scottish | 363 | 3.5% |
| South American | 21 | 0.2% |
| Spaniard | 2 | 0.0% |
| Spanish | 15 | 0.2% |
| Spanish American | 6 | 0.1% |
| Subsaharan African | 12 | 0.1% |
| Swedish | 37 | 0.4% |
| Syrian | 55 | 0.5% |
| Thai | 19 | 0.2% |
| Ukrainian | 18 | 0.2% |
| Welsh | 31 | 0.3% | View All 55 Rows |
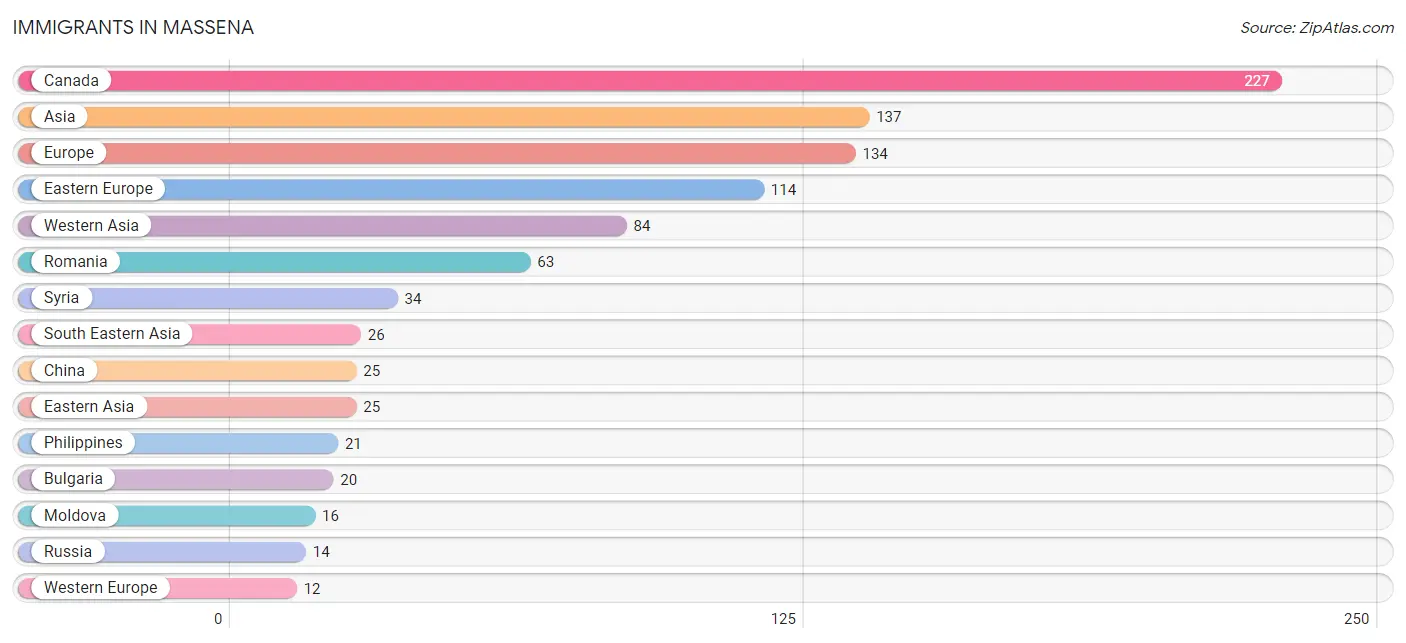
Immigrants in Massena
The most numerous immigrant groups reported in Massena came from Canada (227 | 2.2%), Asia (137 | 1.3%), Europe (134 | 1.3%), Eastern Europe (114 | 1.1%), and Western Asia (84 | 0.8%), together accounting for 6.8% of all Massena residents.
| Immigration Origin | # Population | % Population |
| Asia | 137 | 1.3% |
| Austria | 1 | 0.0% |
| Bulgaria | 20 | 0.2% |
| Canada | 227 | 2.2% |
| China | 25 | 0.2% |
| Eastern Asia | 25 | 0.2% |
| Eastern Europe | 114 | 1.1% |
| Europe | 134 | 1.3% |
| Germany | 11 | 0.1% |
| Greece | 7 | 0.1% |
| India | 2 | 0.0% |
| Israel | 1 | 0.0% |
| Italy | 1 | 0.0% |
| Latin America | 4 | 0.0% |
| Lithuania | 1 | 0.0% |
| Moldova | 16 | 0.2% |
| Peru | 4 | 0.0% |
| Philippines | 21 | 0.2% |
| Romania | 63 | 0.6% |
| Russia | 14 | 0.1% |
| South America | 4 | 0.0% |
| South Central Asia | 2 | 0.0% |
| South Eastern Asia | 26 | 0.3% |
| Southern Europe | 8 | 0.1% |
| Syria | 34 | 0.3% |
| Thailand | 5 | 0.1% |
| Western Asia | 84 | 0.8% |
| Western Europe | 12 | 0.1% | View All 28 Rows |
Sex and Age in Massena
Sex and Age in Massena
The most populous age groups in Massena are 50 to 54 Years (479 | 10.2%) for men and 70 to 74 Years (480 | 8.7%) for women.
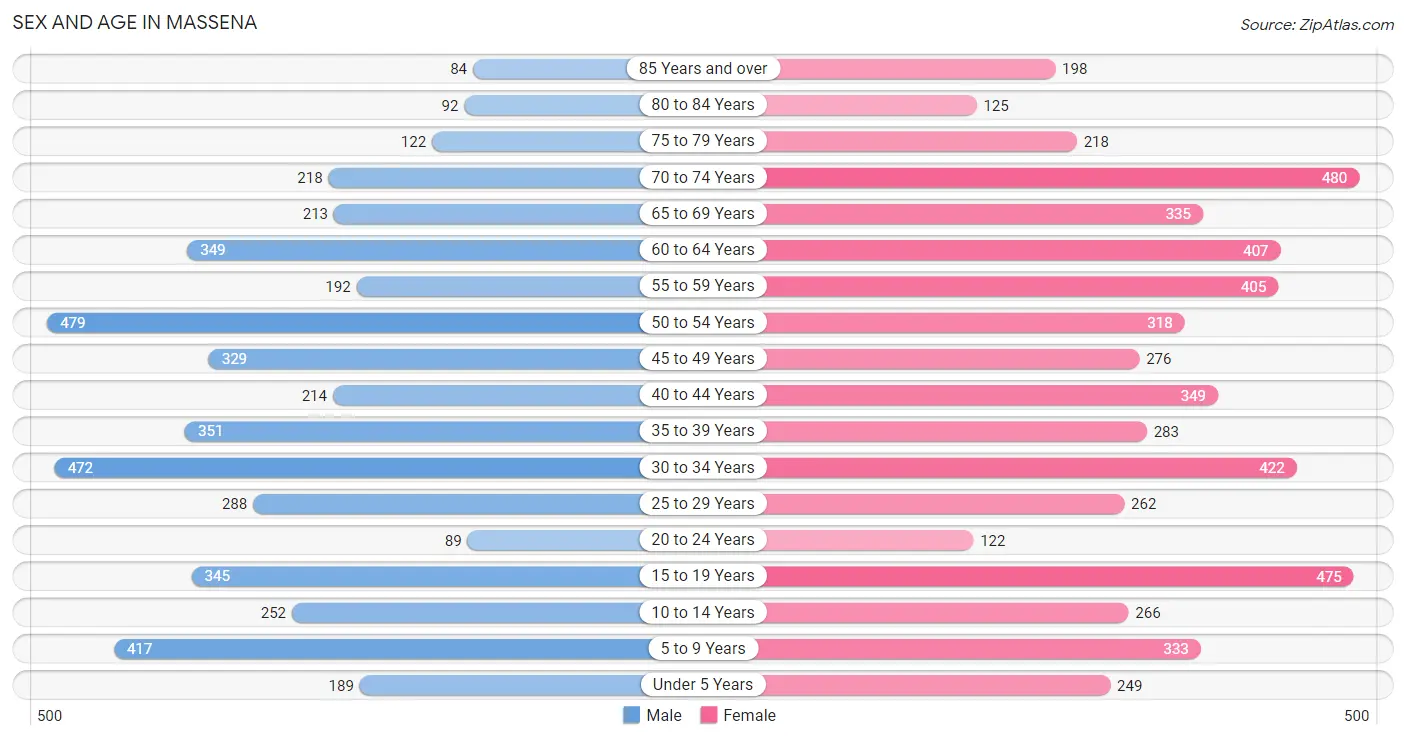
| Age Bracket | Male | Female |
| Under 5 Years | 189 (4.0%) | 249 (4.5%) |
| 5 to 9 Years | 417 (8.9%) | 333 (6.0%) |
| 10 to 14 Years | 252 (5.4%) | 266 (4.8%) |
| 15 to 19 Years | 345 (7.3%) | 475 (8.6%) |
| 20 to 24 Years | 89 (1.9%) | 122 (2.2%) |
| 25 to 29 Years | 288 (6.1%) | 262 (4.7%) |
| 30 to 34 Years | 472 (10.1%) | 422 (7.6%) |
| 35 to 39 Years | 351 (7.5%) | 283 (5.1%) |
| 40 to 44 Years | 214 (4.6%) | 349 (6.3%) |
| 45 to 49 Years | 329 (7.0%) | 276 (5.0%) |
| 50 to 54 Years | 479 (10.2%) | 318 (5.8%) |
| 55 to 59 Years | 192 (4.1%) | 405 (7.3%) |
| 60 to 64 Years | 349 (7.4%) | 407 (7.4%) |
| 65 to 69 Years | 213 (4.5%) | 335 (6.1%) |
| 70 to 74 Years | 218 (4.6%) | 480 (8.7%) |
| 75 to 79 Years | 122 (2.6%) | 218 (4.0%) |
| 80 to 84 Years | 92 (2.0%) | 125 (2.3%) |
| 85 Years and over | 84 (1.8%) | 198 (3.6%) |
| Total | 4,695 (100.0%) | 5,523 (100.0%) |
Families and Households in Massena
Median Family Size in Massena
The median family size in Massena is 2.77 persons per family, with single female/mother families (526 | 22.8%) accounting for the largest median family size of 3.06 persons per family. On the other hand, single male/father families (258 | 11.2%) represent the smallest median family size with 2.46 persons per family.
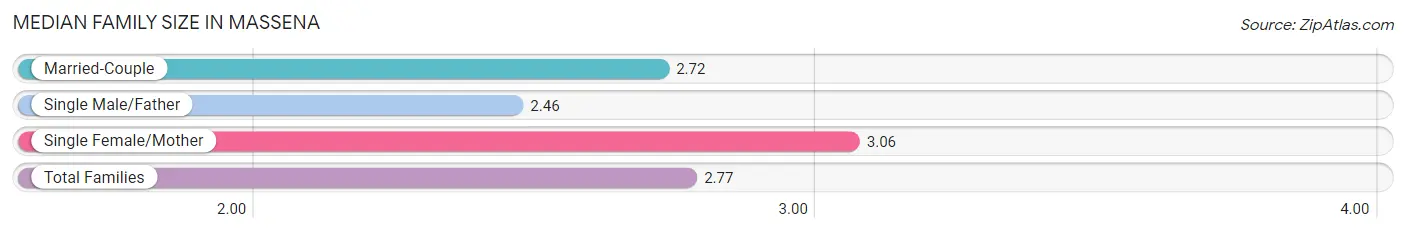
| Family Type | # Families | Family Size |
| Married-Couple | 1,525 (66.0%) | 2.72 |
| Single Male/Father | 258 (11.2%) | 2.46 |
| Single Female/Mother | 526 (22.8%) | 3.06 |
| Total Families | 2,309 (100.0%) | 2.77 |
Median Household Size in Massena
The median household size in Massena is 2.06 persons per household, with single female/mother households (526 | 10.9%) accounting for the largest median household size of 3.62 persons per household. non-family households (2,536 | 52.3%) represent the smallest median household size with 1.27 persons per household.
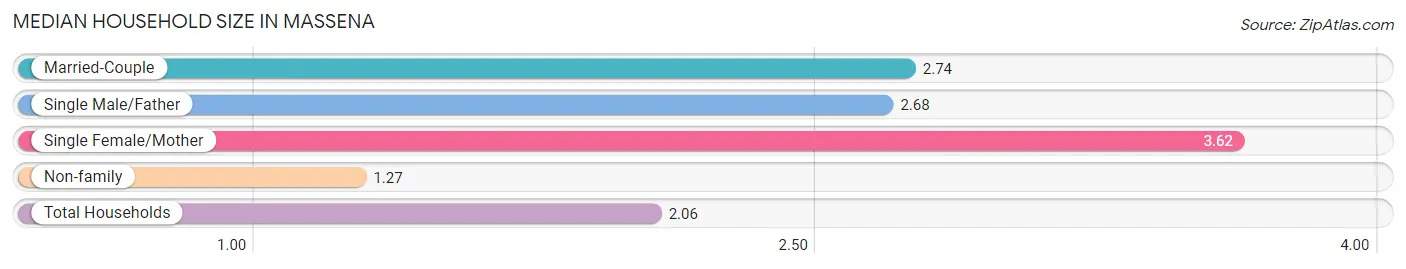
| Household Type | # Households | Household Size |
| Married-Couple | 1,525 (31.5%) | 2.74 |
| Single Male/Father | 258 (5.3%) | 2.68 |
| Single Female/Mother | 526 (10.9%) | 3.62 |
| Non-family | 2,536 (52.3%) | 1.27 |
| Total Households | 4,845 (100.0%) | 2.06 |
Household Size by Marriage Status in Massena
Out of a total of 4,845 households in Massena, 2,309 (47.7%) are family households, while 2,536 (52.3%) are nonfamily households. The most numerous type of family households are 2-person households, comprising 1,097, and the most common type of nonfamily households are 1-person households, comprising 2,152.
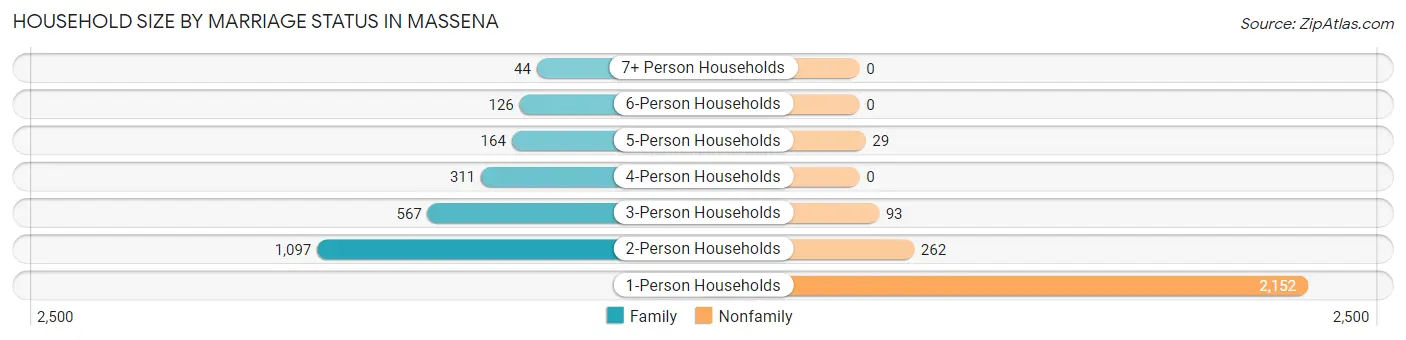
| Household Size | Family Households | Nonfamily Households |
| 1-Person Households | - | 2,152 (44.4%) |
| 2-Person Households | 1,097 (22.6%) | 262 (5.4%) |
| 3-Person Households | 567 (11.7%) | 93 (1.9%) |
| 4-Person Households | 311 (6.4%) | 0 (0.0%) |
| 5-Person Households | 164 (3.4%) | 29 (0.6%) |
| 6-Person Households | 126 (2.6%) | 0 (0.0%) |
| 7+ Person Households | 44 (0.9%) | 0 (0.0%) |
| Total | 2,309 (47.7%) | 2,536 (52.3%) |
Female Fertility in Massena
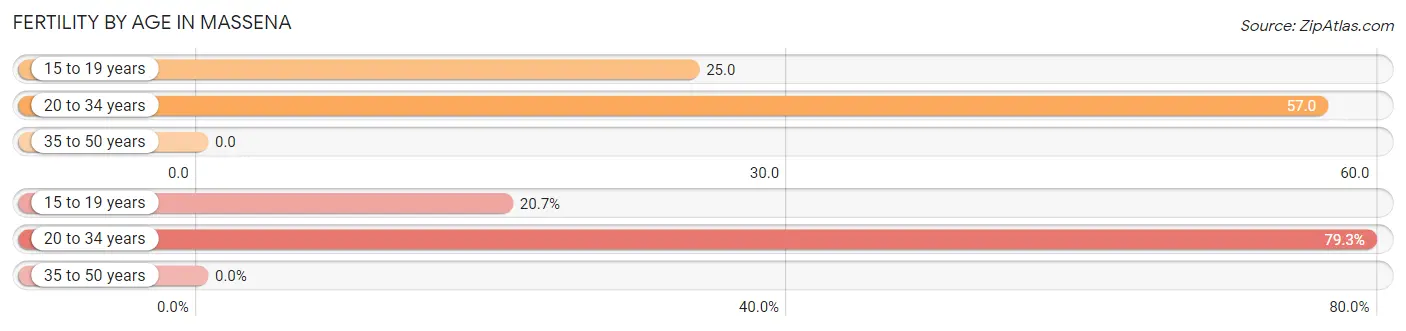
Fertility by Age in Massena
Average fertility rate in Massena is 26.0 births per 1,000 women. Women in the age bracket of 20 to 34 years have the highest fertility rate with 57.0 births per 1,000 women. Women in the age bracket of 20 to 34 years acount for 79.3% of all women with births.
| Age Bracket | Women with Births | Births / 1,000 Women |
| 15 to 19 years | 12 (20.7%) | 25.0 |
| 20 to 34 years | 46 (79.3%) | 57.0 |
| 35 to 50 years | 0 (0.0%) | 0.0 |
| Total | 58 (100.0%) | 26.0 |
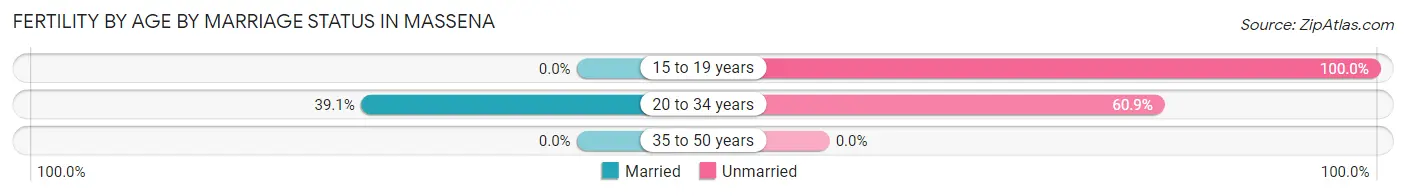
Fertility by Age by Marriage Status in Massena
31.0% of women with births (58) in Massena are married. The highest percentage of unmarried women with births falls into 15 to 19 years age bracket with 100.0% of them unmarried at the time of birth, while the lowest percentage of unmarried women with births belong to 20 to 34 years age bracket with 60.9% of them unmarried.
| Age Bracket | Married | Unmarried |
| 15 to 19 years | 0 (0.0%) | 12 (100.0%) |
| 20 to 34 years | 18 (39.1%) | 28 (60.9%) |
| 35 to 50 years | 0 (0.0%) | 0 (0.0%) |
| Total | 18 (31.0%) | 40 (69.0%) |
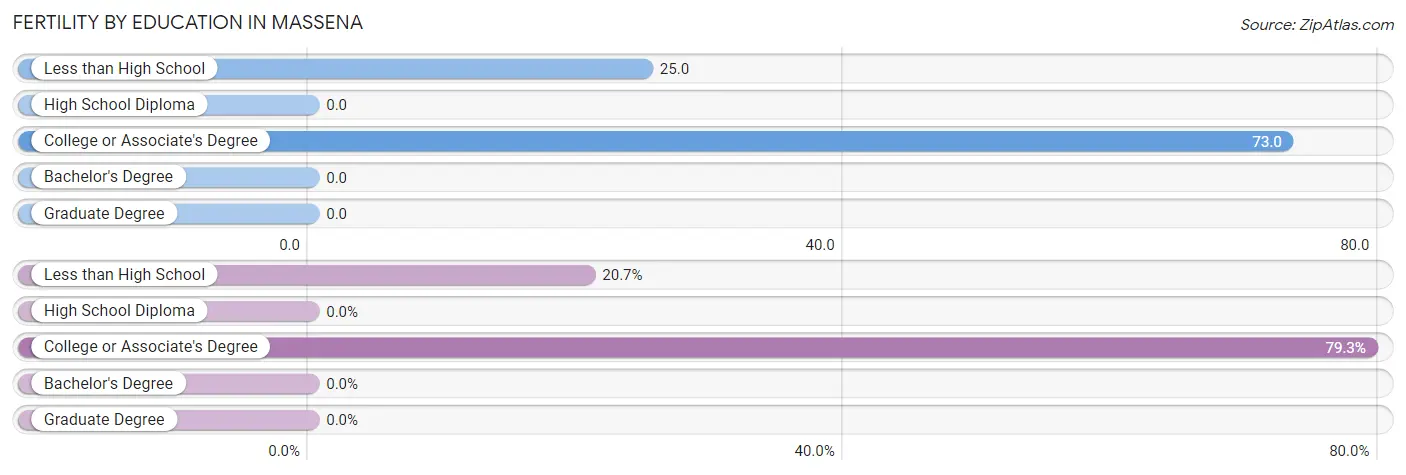
Fertility by Education in Massena
| Educational Attainment | Women with Births | Births / 1,000 Women |
| Less than High School | 12 (20.7%) | 25.0 |
| High School Diploma | 0 (0.0%) | 0.0 |
| College or Associate's Degree | 46 (79.3%) | 73.0 |
| Bachelor's Degree | 0 (0.0%) | 0.0 |
| Graduate Degree | 0 (0.0%) | 0.0 |
| Total | 58 (100.0%) | 26.0 |
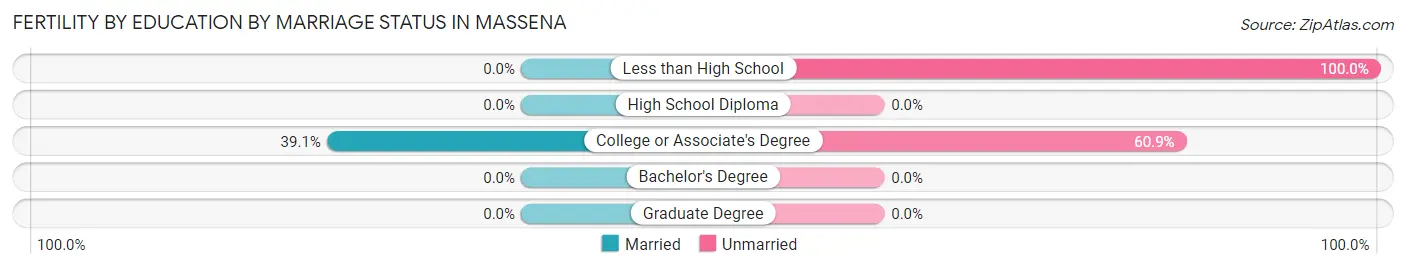
Fertility by Education by Marriage Status in Massena
69.0% of women with births in Massena are unmarried. Women with the educational attainment of college or associate's degree are most likely to be married with 39.1% of them married at childbirth, while women with the educational attainment of less than high school are least likely to be married with 100.0% of them unmarried at childbirth.
| Educational Attainment | Married | Unmarried |
| Less than High School | 0 (0.0%) | 12 (100.0%) |
| High School Diploma | 0 (0.0%) | 0 (0.0%) |
| College or Associate's Degree | 18 (39.1%) | 28 (60.9%) |
| Bachelor's Degree | 0 (0.0%) | 0 (0.0%) |
| Graduate Degree | 0 (0.0%) | 0 (0.0%) |
| Total | 18 (31.0%) | 40 (69.0%) |
Income in Massena
Income Overview in Massena
Per Capita Income in Massena is $31,452, while median incomes of families and households are $62,104 and $48,161 respectively.
| Characteristic | Number | Measure |
| Per Capita Income | 10,218 | $31,452 |
| Median Family Income | 2,309 | $62,104 |
| Mean Family Income | 2,309 | $86,347 |
| Median Household Income | 4,845 | $48,161 |
| Mean Household Income | 4,845 | $64,649 |
| Income Deficit | 2,309 | $0 |
| Wage / Income Gap (%) | 10,218 | 13.07% |
| Wage / Income Gap ($) | 10,218 | 86.93¢ per $1 |
| Gini / Inequality Index | 10,218 | 0.48 |
Earnings by Sex in Massena
Average Earnings in Massena are $33,481, $35,259 for men and $30,651 for women, a difference of 13.1%.
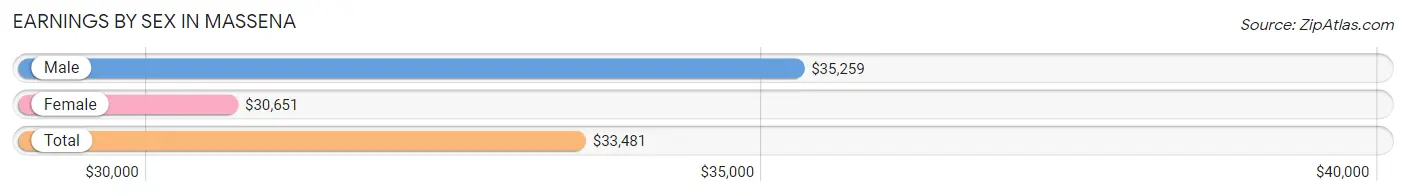
| Sex | Number | Average Earnings |
| Male | 2,582 (51.7%) | $35,259 |
| Female | 2,409 (48.3%) | $30,651 |
| Total | 4,991 (100.0%) | $33,481 |
Earnings by Sex by Income Bracket in Massena
The most common earnings brackets in Massena are $30,000 to $34,999 for men (280 | 10.8%) and $2,499 or less for women (278 | 11.5%).
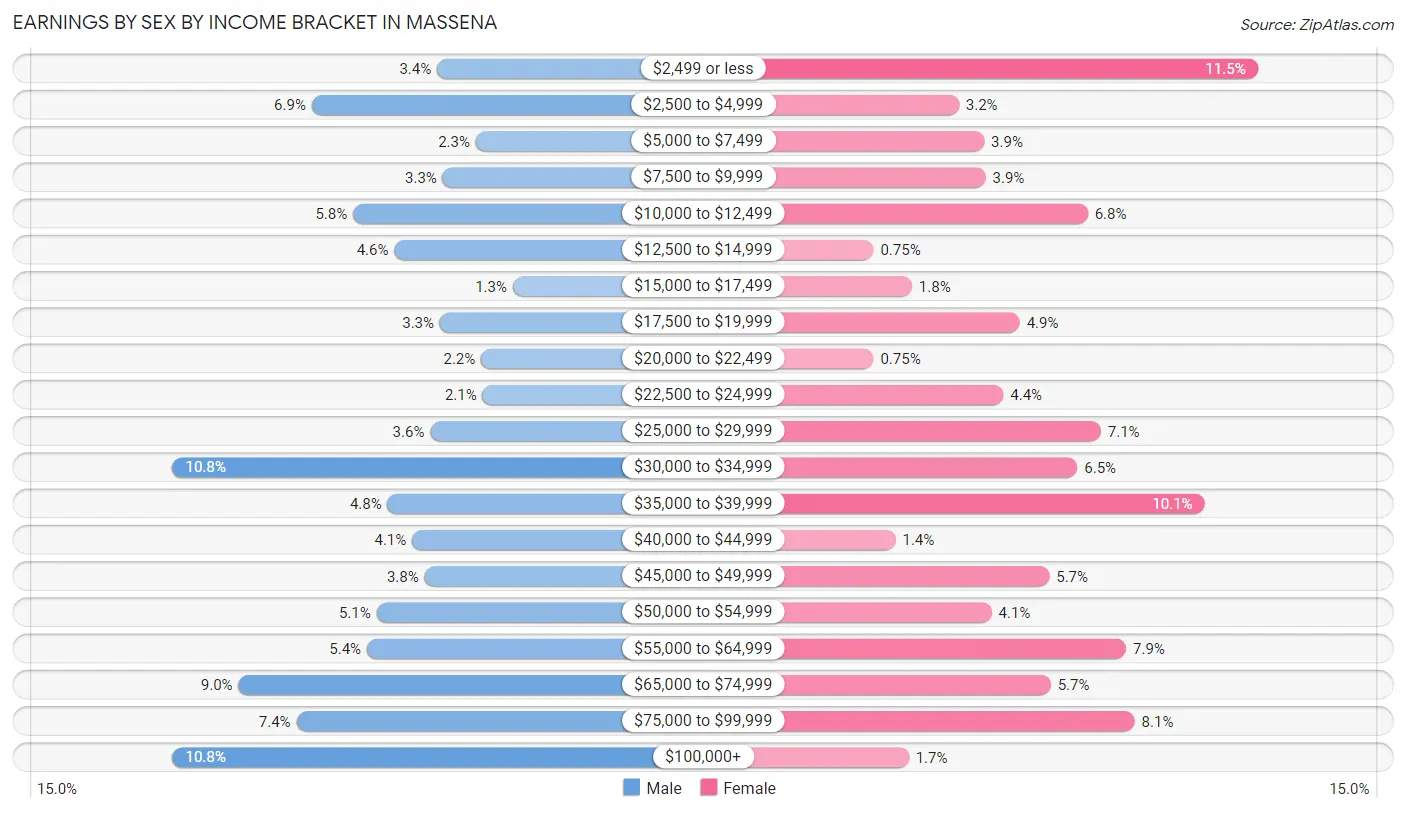
| Income | Male | Female |
| $2,499 or less | 88 (3.4%) | 278 (11.5%) |
| $2,500 to $4,999 | 179 (6.9%) | 76 (3.2%) |
| $5,000 to $7,499 | 60 (2.3%) | 93 (3.9%) |
| $7,500 to $9,999 | 84 (3.3%) | 94 (3.9%) |
| $10,000 to $12,499 | 149 (5.8%) | 163 (6.8%) |
| $12,500 to $14,999 | 119 (4.6%) | 18 (0.7%) |
| $15,000 to $17,499 | 33 (1.3%) | 44 (1.8%) |
| $17,500 to $19,999 | 86 (3.3%) | 117 (4.9%) |
| $20,000 to $22,499 | 56 (2.2%) | 18 (0.7%) |
| $22,500 to $24,999 | 55 (2.1%) | 106 (4.4%) |
| $25,000 to $29,999 | 93 (3.6%) | 172 (7.1%) |
| $30,000 to $34,999 | 280 (10.8%) | 156 (6.5%) |
| $35,000 to $39,999 | 124 (4.8%) | 242 (10.1%) |
| $40,000 to $44,999 | 106 (4.1%) | 33 (1.4%) |
| $45,000 to $49,999 | 97 (3.8%) | 137 (5.7%) |
| $50,000 to $54,999 | 132 (5.1%) | 98 (4.1%) |
| $55,000 to $64,999 | 139 (5.4%) | 189 (7.9%) |
| $65,000 to $74,999 | 232 (9.0%) | 138 (5.7%) |
| $75,000 to $99,999 | 190 (7.4%) | 195 (8.1%) |
| $100,000+ | 280 (10.8%) | 42 (1.7%) |
| Total | 2,582 (100.0%) | 2,409 (100.0%) |
Earnings by Sex by Educational Attainment in Massena
Average earnings in Massena are $40,181 for men and $33,384 for women, a difference of 16.9%. Men with an educational attainment of graduate degree enjoy the highest average annual earnings of $76,563, while those with high school diploma education earn the least with $31,294. Women with an educational attainment of graduate degree earn the most with the average annual earnings of $63,672, while those with less than high school education have the smallest earnings of $6,339.
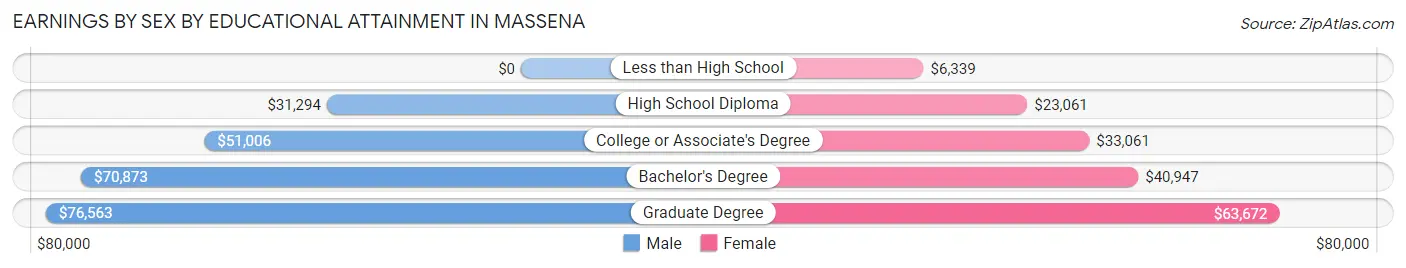
| Educational Attainment | Male Income | Female Income |
| Less than High School | - | - |
| High School Diploma | $31,294 | $23,061 |
| College or Associate's Degree | $51,006 | $33,061 |
| Bachelor's Degree | $70,873 | $40,947 |
| Graduate Degree | $76,563 | $63,672 |
| Total | $40,181 | $33,384 |
Family Income in Massena
Family Income Brackets in Massena
According to the Massena family income data, there are 432 families falling into the $50,000 to $74,999 income range, which is the most common income bracket and makes up 18.7% of all families. Conversely, the less than $10,000 income bracket is the least frequent group with only 67 families (2.9%) belonging to this category.
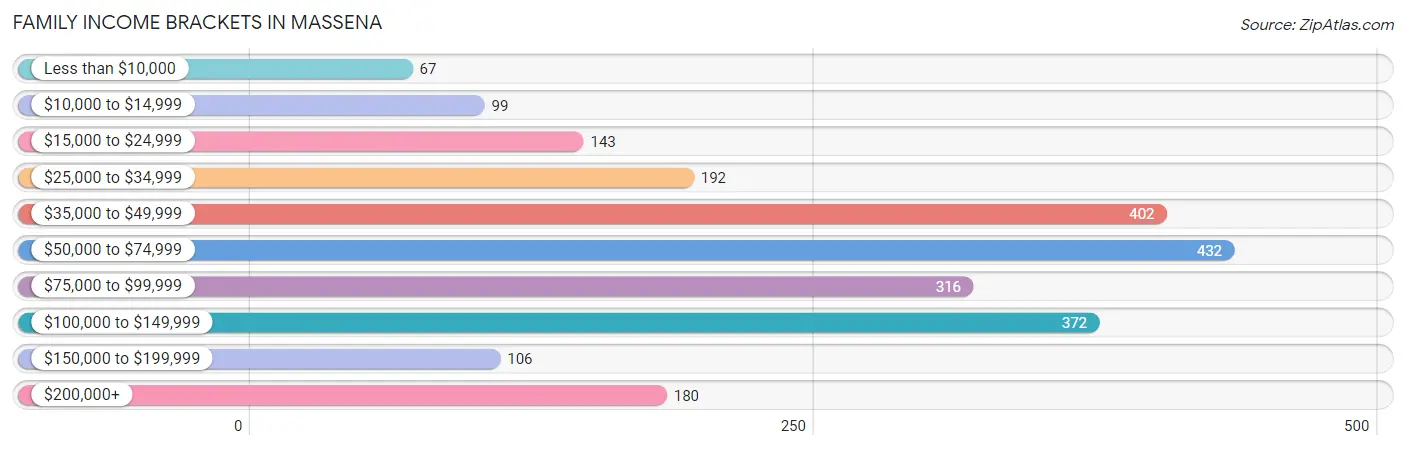
| Income Bracket | # Families | % Families |
| Less than $10,000 | 67 | 2.9% |
| $10,000 to $14,999 | 99 | 4.3% |
| $15,000 to $24,999 | 143 | 6.2% |
| $25,000 to $34,999 | 192 | 8.3% |
| $35,000 to $49,999 | 402 | 17.4% |
| $50,000 to $74,999 | 432 | 18.7% |
| $75,000 to $99,999 | 316 | 13.7% |
| $100,000 to $149,999 | 372 | 16.1% |
| $150,000 to $199,999 | 106 | 4.6% |
| $200,000+ | 180 | 7.8% |
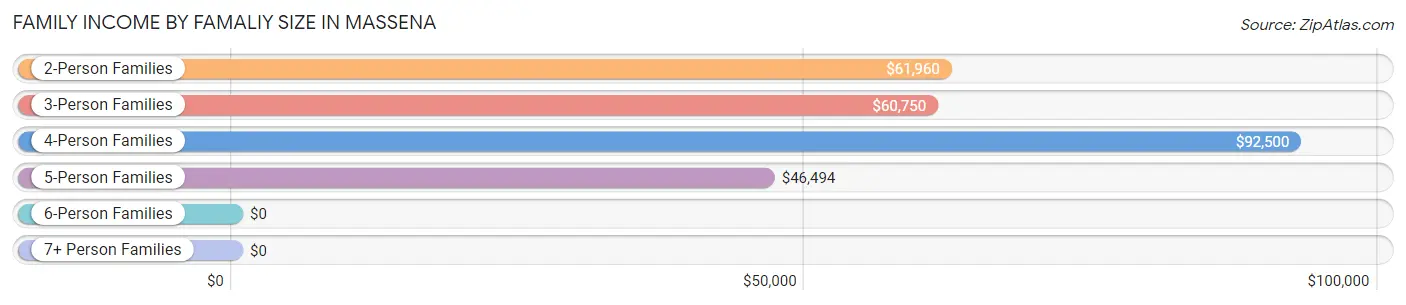
Family Income by Famaliy Size in Massena
4-person families (334 | 14.5%) account for the highest median family income in Massena with $92,500 per family, while 2-person families (1,255 | 54.3%) have the highest median income of $30,980 per family member.
| Income Bracket | # Families | Median Income |
| 2-Person Families | 1,255 (54.3%) | $61,960 |
| 3-Person Families | 463 (20.1%) | $60,750 |
| 4-Person Families | 334 (14.5%) | $92,500 |
| 5-Person Families | 147 (6.4%) | $46,494 |
| 6-Person Families | 94 (4.1%) | $0 |
| 7+ Person Families | 16 (0.7%) | $0 |
| Total | 2,309 (100.0%) | $62,104 |
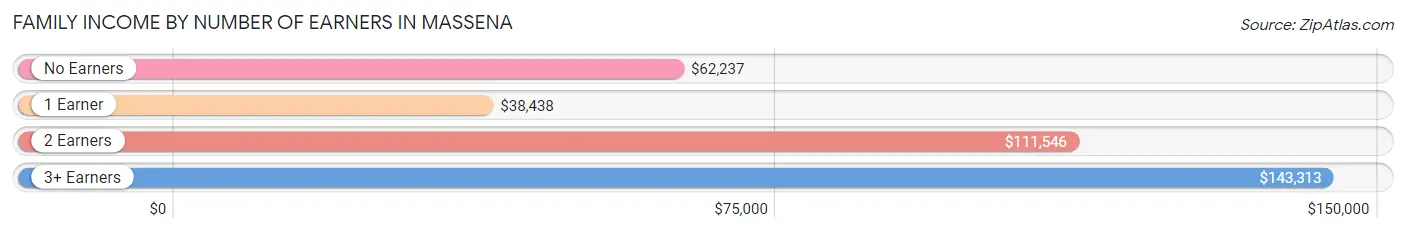
Family Income by Number of Earners in Massena
The median family income in Massena is $62,104, with families comprising 3+ earners (59) having the highest median family income of $143,313, while families with 1 earner (873) have the lowest median family income of $38,438, accounting for 2.6% and 37.8% of families, respectively.
| Number of Earners | # Families | Median Income |
| No Earners | 464 (20.1%) | $62,237 |
| 1 Earner | 873 (37.8%) | $38,438 |
| 2 Earners | 913 (39.5%) | $111,546 |
| 3+ Earners | 59 (2.6%) | $143,313 |
| Total | 2,309 (100.0%) | $62,104 |
Household Income in Massena
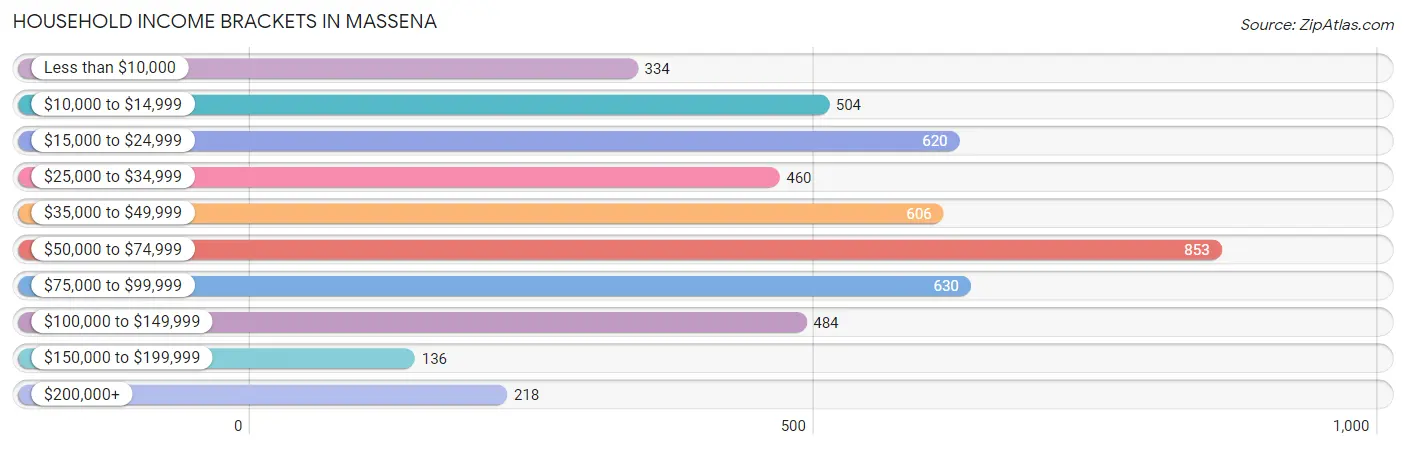
Household Income Brackets in Massena
With 853 households falling in the category, the $50,000 to $74,999 income range is the most frequent in Massena, accounting for 17.6% of all households. In contrast, only 136 households (2.8%) fall into the $150,000 to $199,999 income bracket, making it the least populous group.
| Income Bracket | # Households | % Households |
| Less than $10,000 | 334 | 6.9% |
| $10,000 to $14,999 | 504 | 10.4% |
| $15,000 to $24,999 | 620 | 12.8% |
| $25,000 to $34,999 | 460 | 9.5% |
| $35,000 to $49,999 | 606 | 12.5% |
| $50,000 to $74,999 | 853 | 17.6% |
| $75,000 to $99,999 | 630 | 13.0% |
| $100,000 to $149,999 | 484 | 10.0% |
| $150,000 to $199,999 | 136 | 2.8% |
| $200,000+ | 218 | 4.5% |
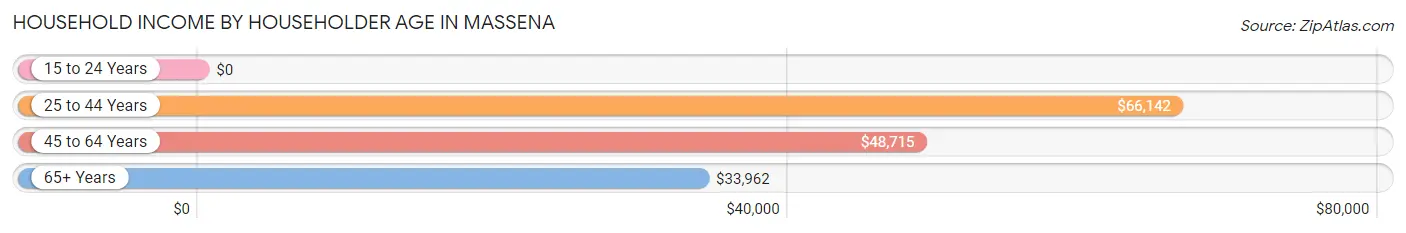
Household Income by Householder Age in Massena
The median household income in Massena is $48,161, with the highest median household income of $66,142 found in the 25 to 44 years age bracket for the primary householder. A total of 1,541 households (31.8%) fall into this category. Meanwhile, the 15 to 24 years age bracket for the primary householder has the lowest median household income of $0, with 132 households (2.7%) in this group.
| Income Bracket | # Households | Median Income |
| 15 to 24 Years | 132 (2.7%) | $0 |
| 25 to 44 Years | 1,541 (31.8%) | $66,142 |
| 45 to 64 Years | 1,663 (34.3%) | $48,715 |
| 65+ Years | 1,509 (31.1%) | $33,962 |
| Total | 4,845 (100.0%) | $48,161 |
Poverty in Massena
Income Below Poverty by Sex and Age in Massena
With 19.6% poverty level for males and 23.5% for females among the residents of Massena, under 5 year old males and 18 to 24 year old females are the most vulnerable to poverty, with 99 males (55.0%) and 265 females (75.9%) in their respective age groups living below the poverty level.
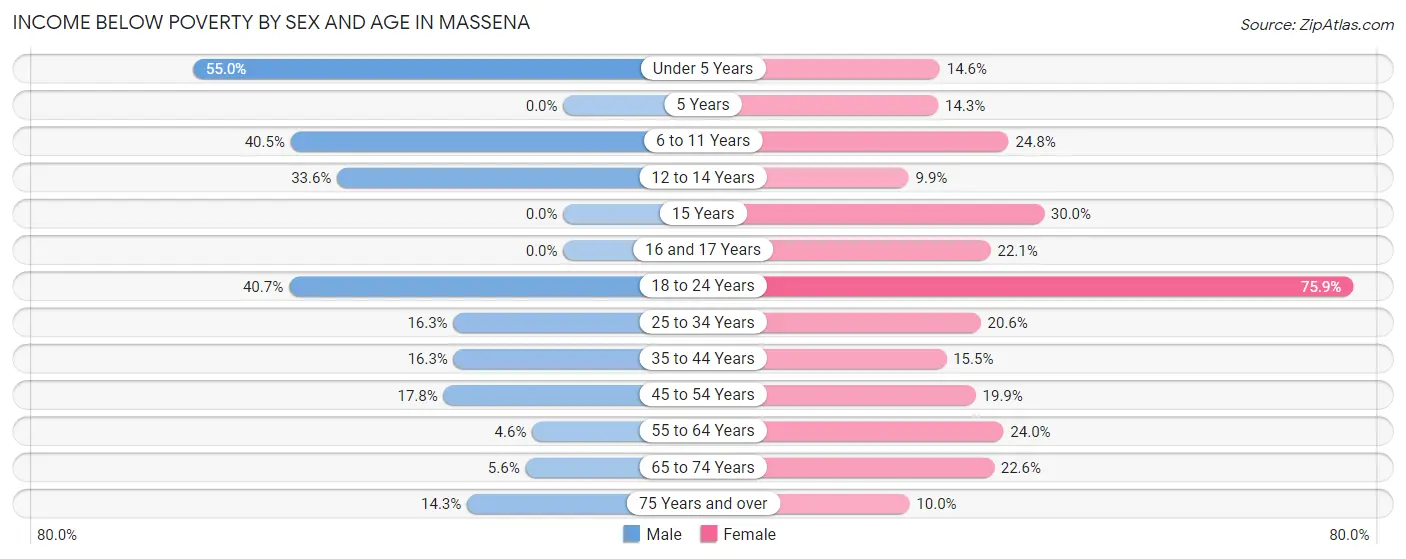
| Age Bracket | Male | Female |
| Under 5 Years | 99 (55.0%) | 23 (14.6%) |
| 5 Years | 0 (0.0%) | 4 (14.3%) |
| 6 to 11 Years | 185 (40.5%) | 80 (24.8%) |
| 12 to 14 Years | 45 (33.6%) | 13 (9.9%) |
| 15 Years | 0 (0.0%) | 24 (30.0%) |
| 16 and 17 Years | 0 (0.0%) | 36 (22.1%) |
| 18 to 24 Years | 132 (40.7%) | 265 (75.9%) |
| 25 to 34 Years | 124 (16.3%) | 141 (20.6%) |
| 35 to 44 Years | 92 (16.3%) | 98 (15.5%) |
| 45 to 54 Years | 143 (17.8%) | 118 (19.9%) |
| 55 to 64 Years | 25 (4.6%) | 193 (24.0%) |
| 65 to 74 Years | 24 (5.6%) | 181 (22.6%) |
| 75 Years and over | 40 (14.3%) | 46 (10.0%) |
| Total | 909 (19.6%) | 1,222 (23.5%) |
Income Above Poverty by Sex and Age in Massena
According to the poverty statistics in Massena, males aged 5 years and females aged 12 to 14 years are the age groups that are most secure financially, with 100.0% of males and 90.1% of females in these age groups living above the poverty line.
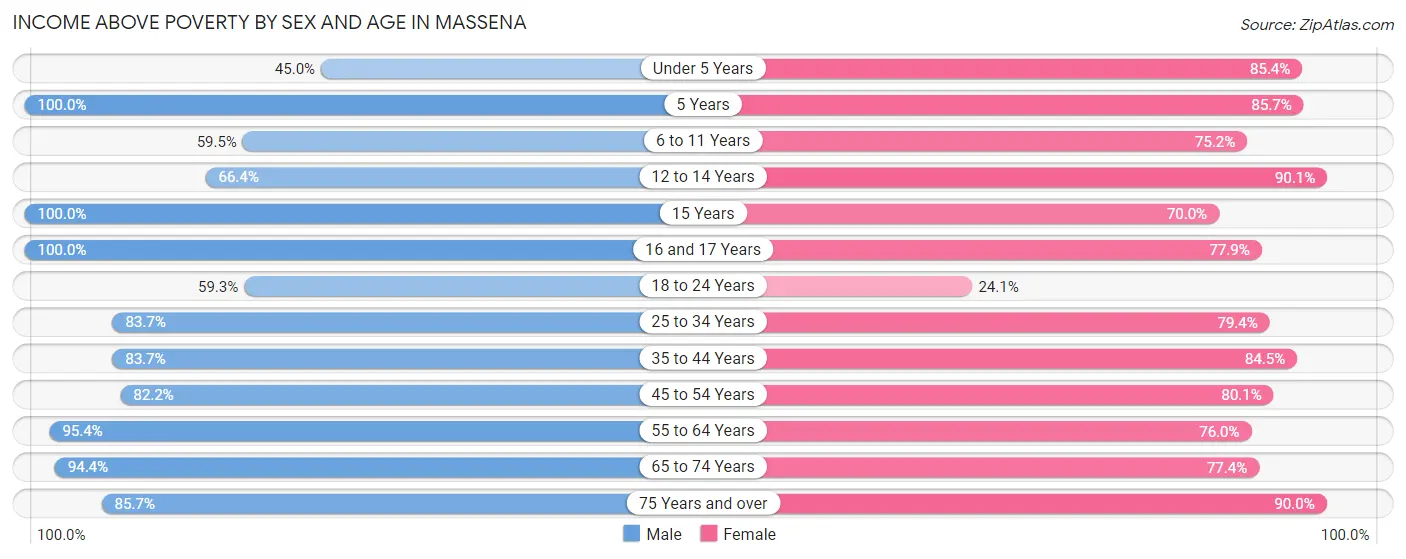
| Age Bracket | Male | Female |
| Under 5 Years | 81 (45.0%) | 135 (85.4%) |
| 5 Years | 66 (100.0%) | 24 (85.7%) |
| 6 to 11 Years | 272 (59.5%) | 243 (75.2%) |
| 12 to 14 Years | 89 (66.4%) | 118 (90.1%) |
| 15 Years | 14 (100.0%) | 56 (70.0%) |
| 16 and 17 Years | 90 (100.0%) | 127 (77.9%) |
| 18 to 24 Years | 192 (59.3%) | 84 (24.1%) |
| 25 to 34 Years | 636 (83.7%) | 543 (79.4%) |
| 35 to 44 Years | 473 (83.7%) | 534 (84.5%) |
| 45 to 54 Years | 661 (82.2%) | 476 (80.1%) |
| 55 to 64 Years | 516 (95.4%) | 611 (76.0%) |
| 65 to 74 Years | 403 (94.4%) | 621 (77.4%) |
| 75 Years and over | 240 (85.7%) | 412 (90.0%) |
| Total | 3,733 (80.4%) | 3,984 (76.5%) |
Income Below Poverty Among Married-Couple Families in Massena
The poverty statistics for married-couple families in Massena show that 6.8% or 104 of the total 1,525 families live below the poverty line. Families with 3 or 4 children have the highest poverty rate of 33.1%, comprising of 39 families. On the other hand, families with 5 or more children have the lowest poverty rate of 0.0%, which includes 0 families.
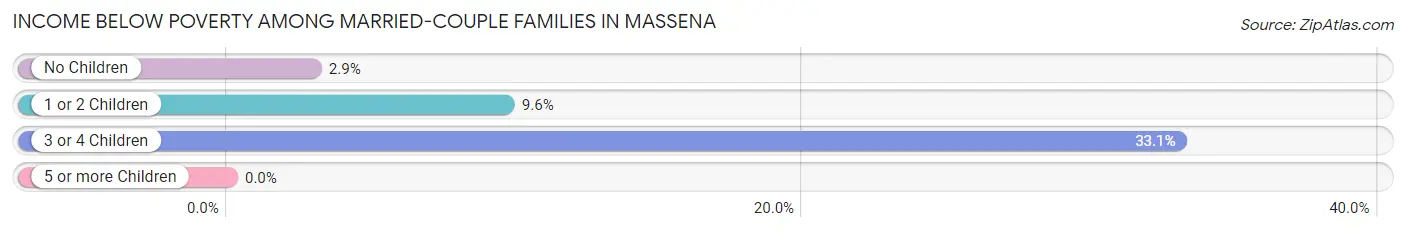
| Children | Above Poverty | Below Poverty |
| No Children | 998 (97.1%) | 30 (2.9%) |
| 1 or 2 Children | 328 (90.4%) | 35 (9.6%) |
| 3 or 4 Children | 79 (66.9%) | 39 (33.1%) |
| 5 or more Children | 16 (100.0%) | 0 (0.0%) |
| Total | 1,421 (93.2%) | 104 (6.8%) |
Income Below Poverty Among Single-Parent Households in Massena
According to the poverty data in Massena, 26.4% or 68 single-father households and 32.5% or 171 single-mother households are living below the poverty line. Among single-father households, those with 1 or 2 children have the highest poverty rate, with 68 households (49.6%) experiencing poverty. Likewise, among single-mother households, those with 3 or 4 children have the highest poverty rate, with 43 households (41.3%) falling below the poverty line.
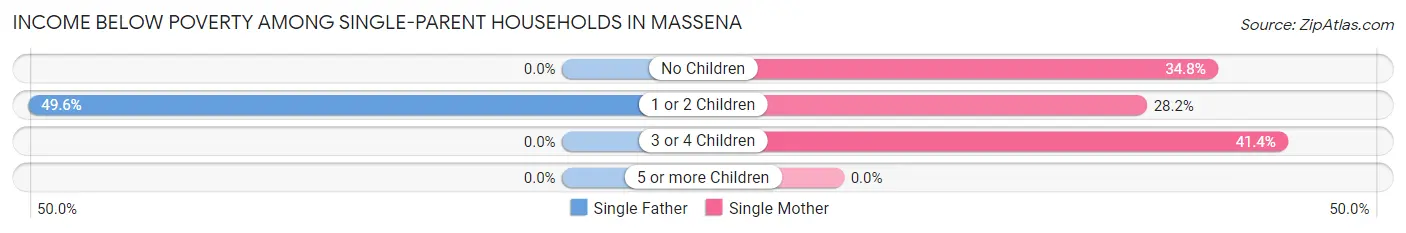
| Children | Single Father | Single Mother |
| No Children | 0 (0.0%) | 47 (34.8%) |
| 1 or 2 Children | 68 (49.6%) | 81 (28.2%) |
| 3 or 4 Children | 0 (0.0%) | 43 (41.3%) |
| 5 or more Children | 0 (0.0%) | 0 (0.0%) |
| Total | 68 (26.4%) | 171 (32.5%) |
Income Below Poverty Among Married-Couple vs Single-Parent Households in Massena
The poverty data for Massena shows that 104 of the married-couple family households (6.8%) and 239 of the single-parent households (30.5%) are living below the poverty level. Within the married-couple family households, those with 3 or 4 children have the highest poverty rate, with 39 households (33.1%) falling below the poverty line. Among the single-parent households, those with 1 or 2 children have the highest poverty rate, with 149 household (35.1%) living below poverty.
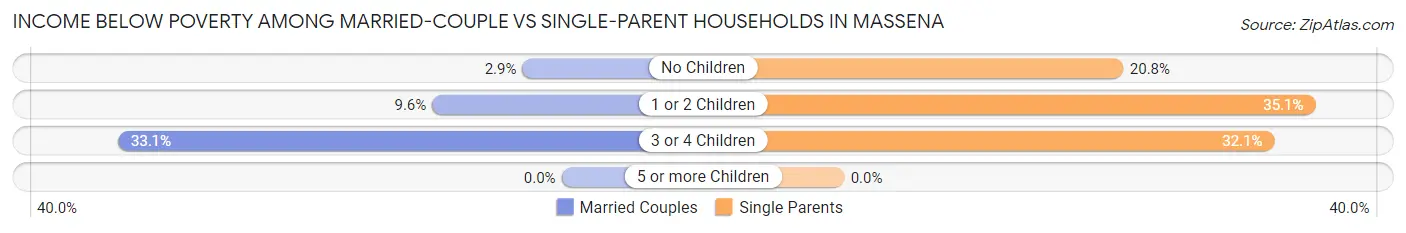
| Children | Married-Couple Families | Single-Parent Households |
| No Children | 30 (2.9%) | 47 (20.8%) |
| 1 or 2 Children | 35 (9.6%) | 149 (35.1%) |
| 3 or 4 Children | 39 (33.1%) | 43 (32.1%) |
| 5 or more Children | 0 (0.0%) | 0 (0.0%) |
| Total | 104 (6.8%) | 239 (30.5%) |
Employment Characteristics in Massena
Employment by Class of Employer in Massena
Among the 4,255 employed individuals in Massena, private company employees (2,366 | 55.6%), local government employees (483 | 11.4%), and state government employees (477 | 11.2%) make up the most common classes of employment.
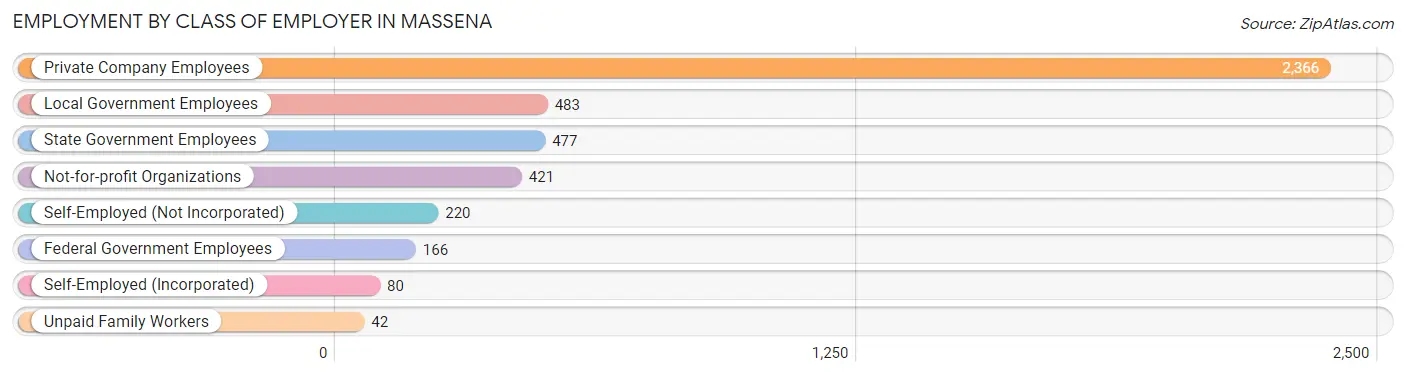
| Employer Class | # Employees | % Employees |
| Private Company Employees | 2,366 | 55.6% |
| Self-Employed (Incorporated) | 80 | 1.9% |
| Self-Employed (Not Incorporated) | 220 | 5.2% |
| Not-for-profit Organizations | 421 | 9.9% |
| Local Government Employees | 483 | 11.4% |
| State Government Employees | 477 | 11.2% |
| Federal Government Employees | 166 | 3.9% |
| Unpaid Family Workers | 42 | 1.0% |
| Total | 4,255 | 100.0% |
Employment Status by Age in Massena
According to the labor force statistics for Massena, out of the total population over 16 years of age (8,416), 55.7% or 4,688 individuals are in the labor force, with 6.7% or 314 of them unemployed. The age group with the highest labor force participation rate is 25 to 29 years, with 94.5% or 520 individuals in the labor force. Within the labor force, the 16 to 19 years age range has the highest percentage of unemployed individuals, with 16.6% or 33 of them being unemployed.
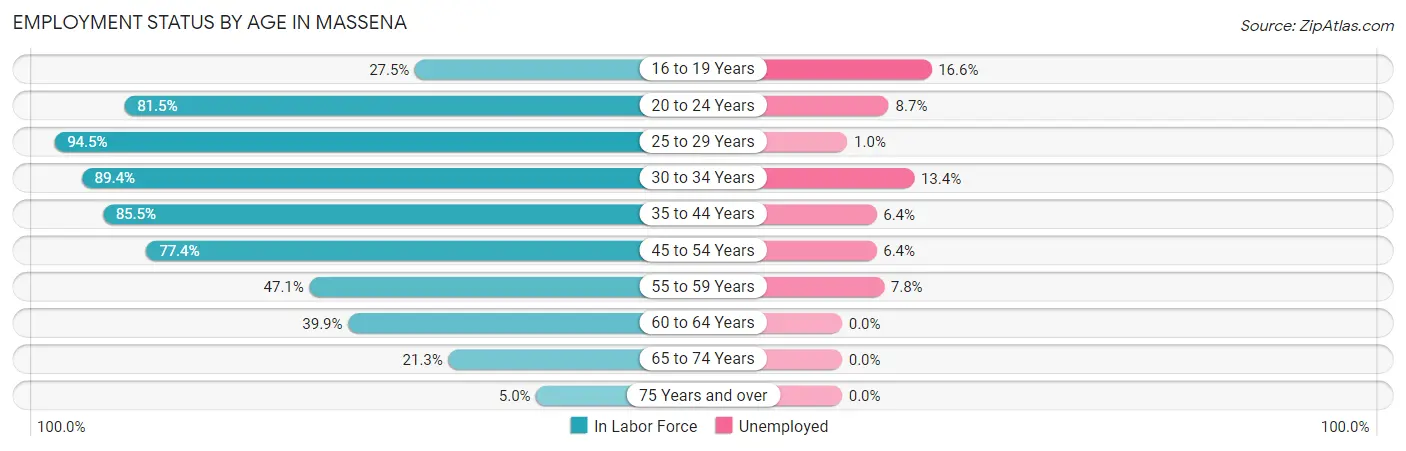
| Age Bracket | In Labor Force | Unemployed |
| 16 to 19 Years | 199 (27.5%) | 33 (16.6%) |
| 20 to 24 Years | 172 (81.5%) | 15 (8.7%) |
| 25 to 29 Years | 520 (94.5%) | 5 (1.0%) |
| 30 to 34 Years | 799 (89.4%) | 107 (13.4%) |
| 35 to 44 Years | 1,023 (85.5%) | 65 (6.4%) |
| 45 to 54 Years | 1,085 (77.4%) | 69 (6.4%) |
| 55 to 59 Years | 281 (47.1%) | 22 (7.8%) |
| 60 to 64 Years | 302 (39.9%) | 0 (0.0%) |
| 65 to 74 Years | 265 (21.3%) | 0 (0.0%) |
| 75 Years and over | 42 (5.0%) | 0 (0.0%) |
| Total | 4,688 (55.7%) | 314 (6.7%) |
Employment Status by Educational Attainment in Massena
According to labor force statistics for Massena, 74.3% of individuals (4,009) out of the total population between 25 and 64 years of age (5,396) are in the labor force, with 6.7% or 269 of them being unemployed. The group with the highest labor force participation rate are those with the educational attainment of high school diploma, with 79.7% or 1,246 individuals in the labor force. Within the labor force, individuals with less than high school education have the highest percentage of unemployment, with 15.0% or 31 of them being unemployed.
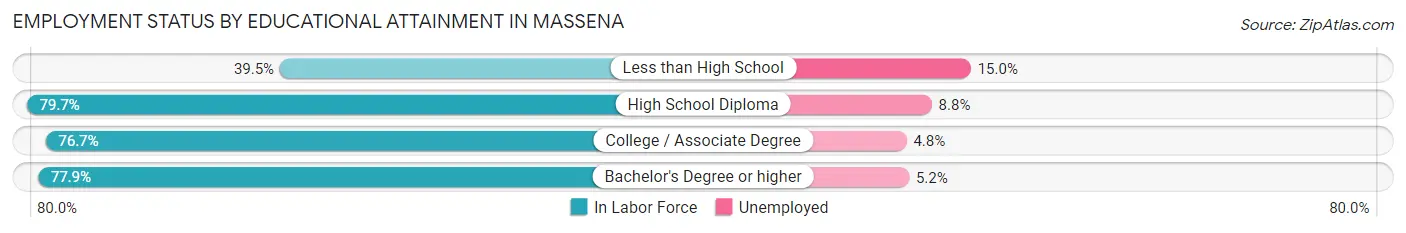
| Educational Attainment | In Labor Force | Unemployed |
| Less than High School | 206 (39.5%) | 78 (15.0%) |
| High School Diploma | 1,246 (79.7%) | 138 (8.8%) |
| College / Associate Degree | 1,280 (76.7%) | 80 (4.8%) |
| Bachelor's Degree or higher | 1,279 (77.9%) | 85 (5.2%) |
| Total | 4,009 (74.3%) | 362 (6.7%) |
Employment Occupations by Sex in Massena
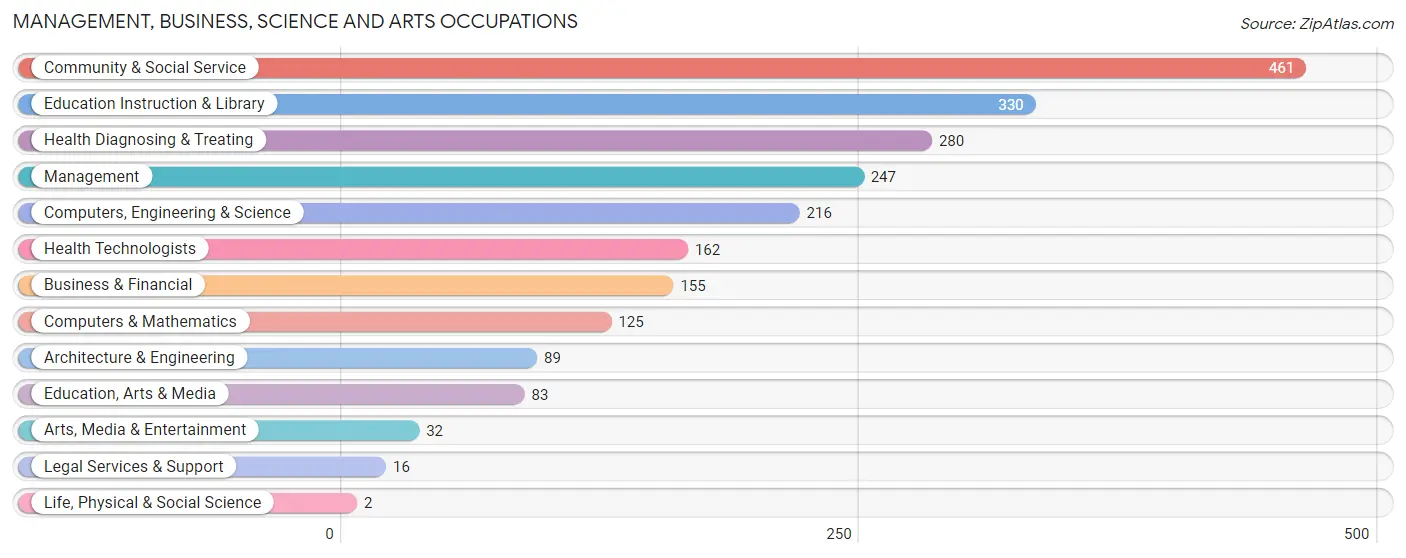
Management, Business, Science and Arts Occupations
The most common Management, Business, Science and Arts occupations in Massena are Community & Social Service (461 | 10.5%), Education Instruction & Library (330 | 7.5%), Health Diagnosing & Treating (280 | 6.4%), Management (247 | 5.7%), and Computers, Engineering & Science (216 | 4.9%).
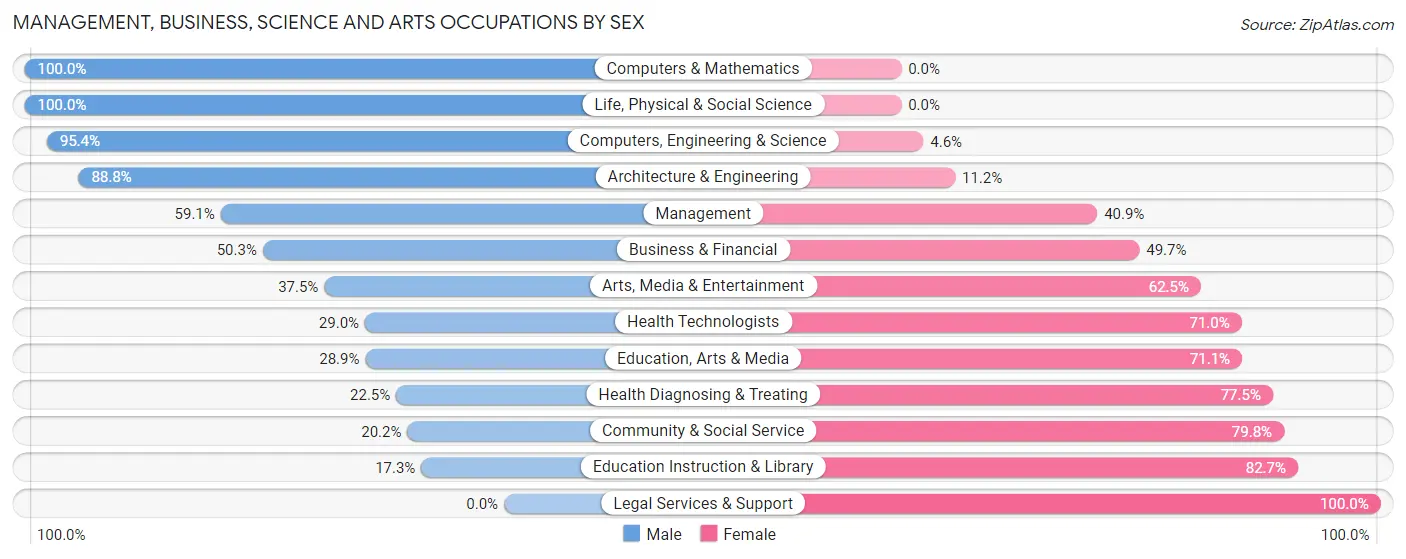
Management, Business, Science and Arts Occupations by Sex
Within the Management, Business, Science and Arts occupations in Massena, the most male-oriented occupations are Computers & Mathematics (100.0%), Life, Physical & Social Science (100.0%), and Computers, Engineering & Science (95.4%), while the most female-oriented occupations are Legal Services & Support (100.0%), Education Instruction & Library (82.7%), and Community & Social Service (79.8%).
| Occupation | Male | Female |
| Management | 146 (59.1%) | 101 (40.9%) |
| Business & Financial | 78 (50.3%) | 77 (49.7%) |
| Computers, Engineering & Science | 206 (95.4%) | 10 (4.6%) |
| Computers & Mathematics | 125 (100.0%) | 0 (0.0%) |
| Architecture & Engineering | 79 (88.8%) | 10 (11.2%) |
| Life, Physical & Social Science | 2 (100.0%) | 0 (0.0%) |
| Community & Social Service | 93 (20.2%) | 368 (79.8%) |
| Education, Arts & Media | 24 (28.9%) | 59 (71.1%) |
| Legal Services & Support | 0 (0.0%) | 16 (100.0%) |
| Education Instruction & Library | 57 (17.3%) | 273 (82.7%) |
| Arts, Media & Entertainment | 12 (37.5%) | 20 (62.5%) |
| Health Diagnosing & Treating | 63 (22.5%) | 217 (77.5%) |
| Health Technologists | 47 (29.0%) | 115 (71.0%) |
| Total (Category) | 586 (43.1%) | 773 (56.9%) |
| Total (Overall) | 2,267 (51.8%) | 2,105 (48.1%) |
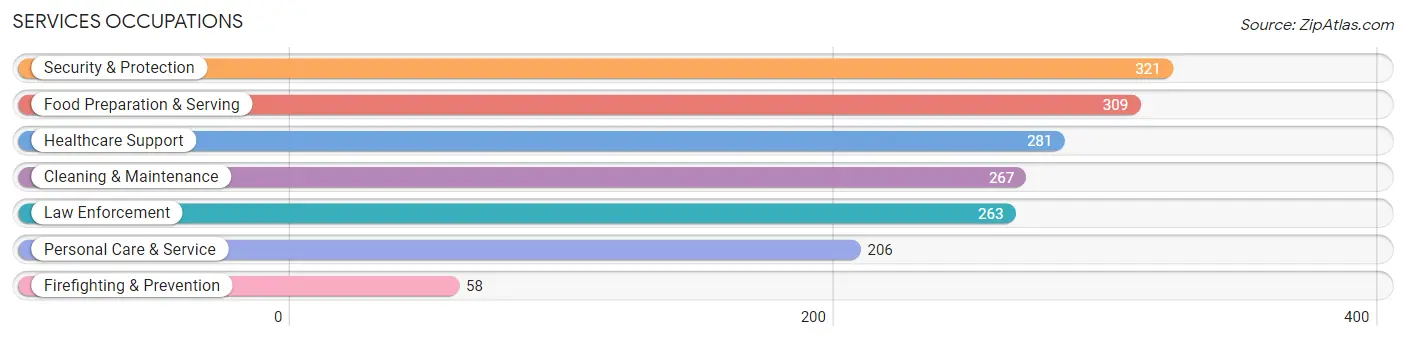
Services Occupations
The most common Services occupations in Massena are Security & Protection (321 | 7.3%), Food Preparation & Serving (309 | 7.1%), Healthcare Support (281 | 6.4%), Cleaning & Maintenance (267 | 6.1%), and Law Enforcement (263 | 6.0%).
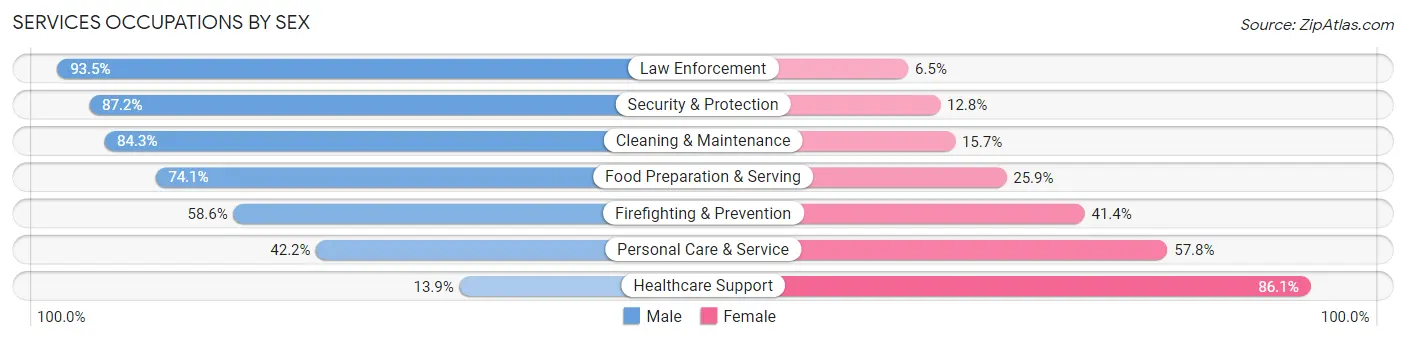
Services Occupations by Sex
Within the Services occupations in Massena, the most male-oriented occupations are Law Enforcement (93.5%), Security & Protection (87.2%), and Cleaning & Maintenance (84.3%), while the most female-oriented occupations are Healthcare Support (86.1%), Personal Care & Service (57.8%), and Firefighting & Prevention (41.4%).
| Occupation | Male | Female |
| Healthcare Support | 39 (13.9%) | 242 (86.1%) |
| Security & Protection | 280 (87.2%) | 41 (12.8%) |
| Firefighting & Prevention | 34 (58.6%) | 24 (41.4%) |
| Law Enforcement | 246 (93.5%) | 17 (6.5%) |
| Food Preparation & Serving | 229 (74.1%) | 80 (25.9%) |
| Cleaning & Maintenance | 225 (84.3%) | 42 (15.7%) |
| Personal Care & Service | 87 (42.2%) | 119 (57.8%) |
| Total (Category) | 860 (62.1%) | 524 (37.9%) |
| Total (Overall) | 2,267 (51.8%) | 2,105 (48.1%) |
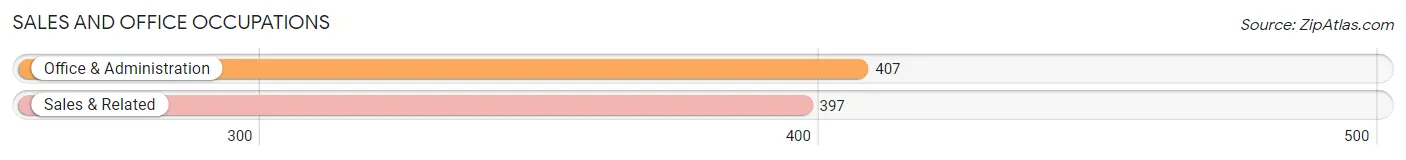
Sales and Office Occupations
The most common Sales and Office occupations in Massena are Office & Administration (407 | 9.3%), and Sales & Related (397 | 9.1%).
Sales and Office Occupations by Sex
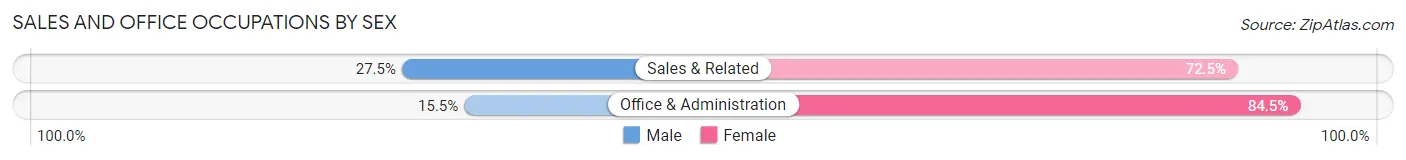
| Occupation | Male | Female |
| Sales & Related | 109 (27.5%) | 288 (72.5%) |
| Office & Administration | 63 (15.5%) | 344 (84.5%) |
| Total (Category) | 172 (21.4%) | 632 (78.6%) |
| Total (Overall) | 2,267 (51.8%) | 2,105 (48.1%) |
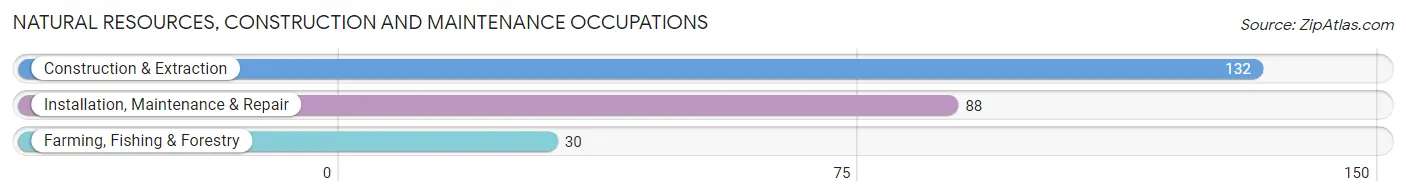
Natural Resources, Construction and Maintenance Occupations
The most common Natural Resources, Construction and Maintenance occupations in Massena are Construction & Extraction (132 | 3.0%), Installation, Maintenance & Repair (88 | 2.0%), and Farming, Fishing & Forestry (30 | 0.7%).
Natural Resources, Construction and Maintenance Occupations by Sex
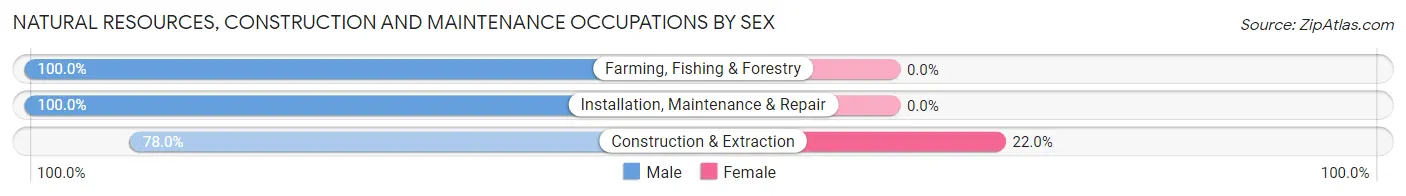
| Occupation | Male | Female |
| Farming, Fishing & Forestry | 30 (100.0%) | 0 (0.0%) |
| Construction & Extraction | 103 (78.0%) | 29 (22.0%) |
| Installation, Maintenance & Repair | 88 (100.0%) | 0 (0.0%) |
| Total (Category) | 221 (88.4%) | 29 (11.6%) |
| Total (Overall) | 2,267 (51.8%) | 2,105 (48.1%) |
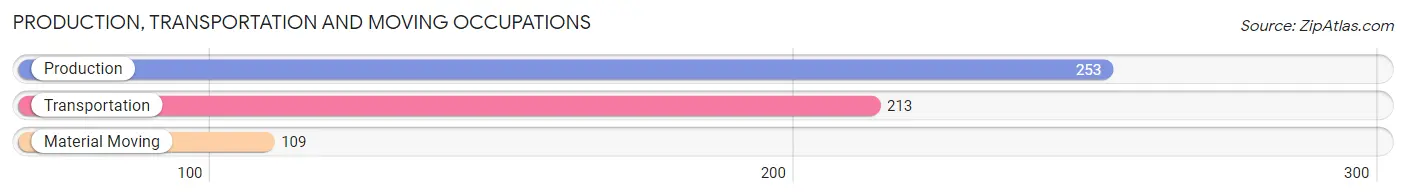
Production, Transportation and Moving Occupations
The most common Production, Transportation and Moving occupations in Massena are Production (253 | 5.8%), Transportation (213 | 4.9%), and Material Moving (109 | 2.5%).
Production, Transportation and Moving Occupations by Sex
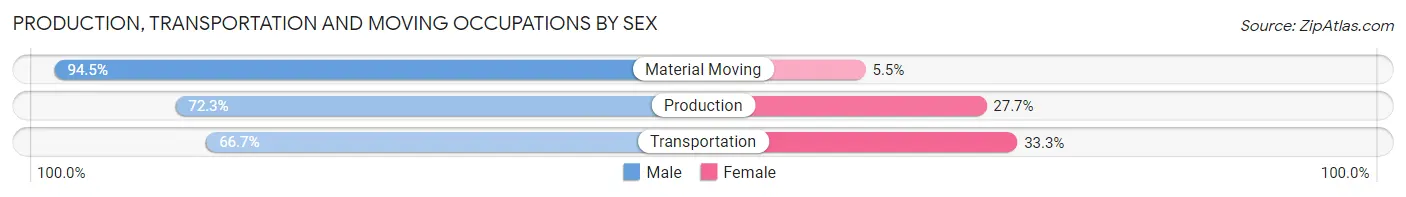
| Occupation | Male | Female |
| Production | 183 (72.3%) | 70 (27.7%) |
| Transportation | 142 (66.7%) | 71 (33.3%) |
| Material Moving | 103 (94.5%) | 6 (5.5%) |
| Total (Category) | 428 (74.4%) | 147 (25.6%) |
| Total (Overall) | 2,267 (51.8%) | 2,105 (48.1%) |
Employment Industries by Sex in Massena
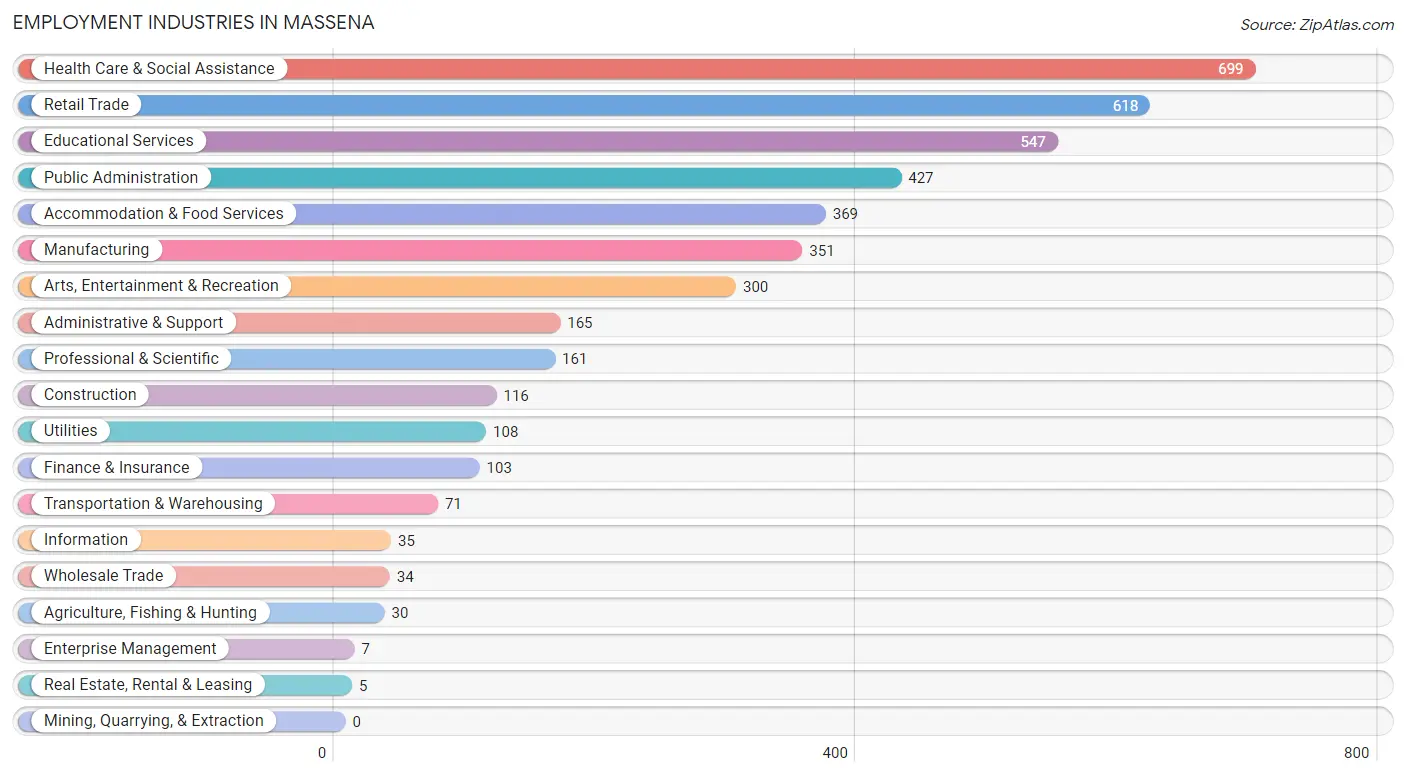
Employment Industries in Massena
The major employment industries in Massena include Health Care & Social Assistance (699 | 16.0%), Retail Trade (618 | 14.1%), Educational Services (547 | 12.5%), Public Administration (427 | 9.8%), and Accommodation & Food Services (369 | 8.4%).
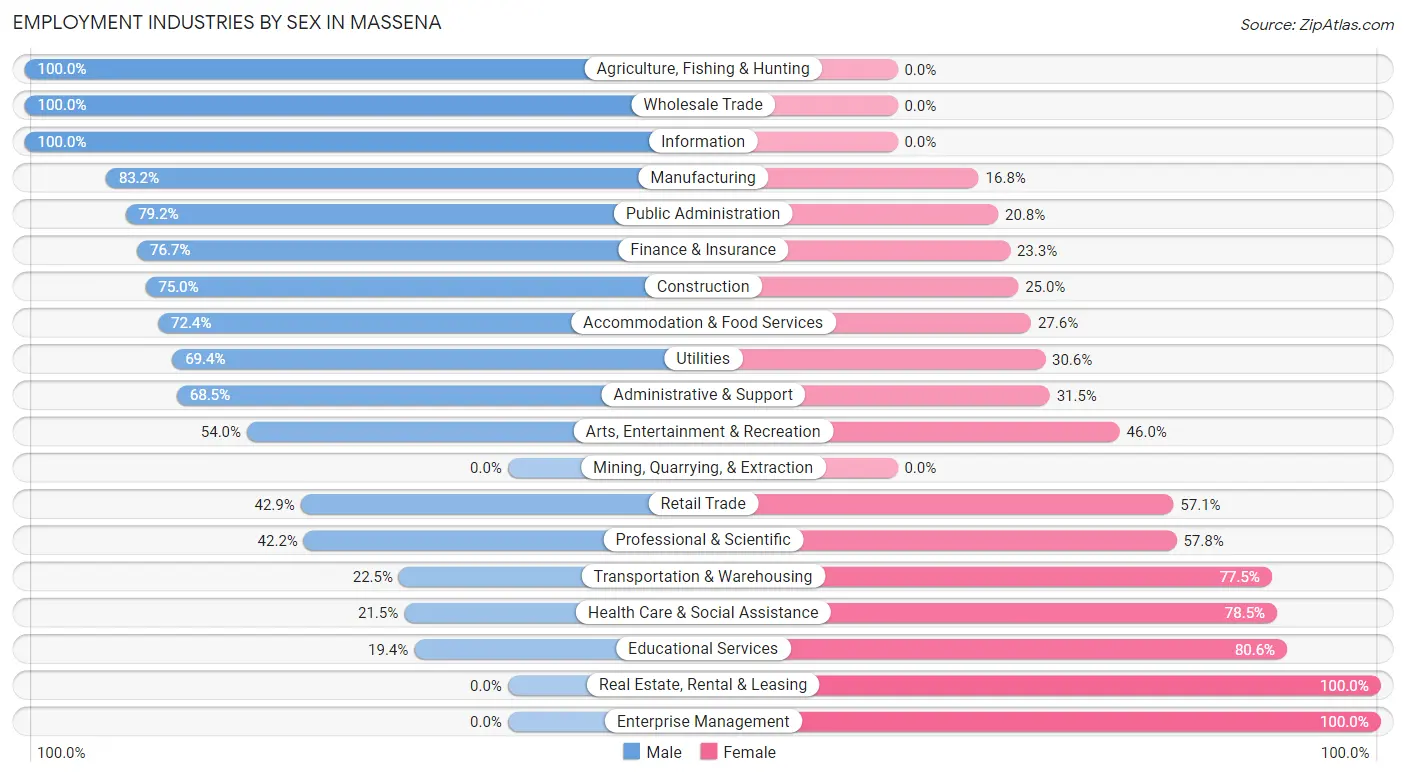
Employment Industries by Sex in Massena
The Massena industries that see more men than women are Agriculture, Fishing & Hunting (100.0%), Wholesale Trade (100.0%), and Information (100.0%), whereas the industries that tend to have a higher number of women are Real Estate, Rental & Leasing (100.0%), Enterprise Management (100.0%), and Educational Services (80.6%).
| Industry | Male | Female |
| Agriculture, Fishing & Hunting | 30 (100.0%) | 0 (0.0%) |
| Mining, Quarrying, & Extraction | 0 (0.0%) | 0 (0.0%) |
| Construction | 87 (75.0%) | 29 (25.0%) |
| Manufacturing | 292 (83.2%) | 59 (16.8%) |
| Wholesale Trade | 34 (100.0%) | 0 (0.0%) |
| Retail Trade | 265 (42.9%) | 353 (57.1%) |
| Transportation & Warehousing | 16 (22.5%) | 55 (77.5%) |
| Utilities | 75 (69.4%) | 33 (30.6%) |
| Information | 35 (100.0%) | 0 (0.0%) |
| Finance & Insurance | 79 (76.7%) | 24 (23.3%) |
| Real Estate, Rental & Leasing | 0 (0.0%) | 5 (100.0%) |
| Professional & Scientific | 68 (42.2%) | 93 (57.8%) |
| Enterprise Management | 0 (0.0%) | 7 (100.0%) |
| Administrative & Support | 113 (68.5%) | 52 (31.5%) |
| Educational Services | 106 (19.4%) | 441 (80.6%) |
| Health Care & Social Assistance | 150 (21.5%) | 549 (78.5%) |
| Arts, Entertainment & Recreation | 162 (54.0%) | 138 (46.0%) |
| Accommodation & Food Services | 267 (72.4%) | 102 (27.6%) |
| Public Administration | 338 (79.2%) | 89 (20.8%) |
| Total | 2,267 (51.8%) | 2,105 (48.1%) |
Education in Massena
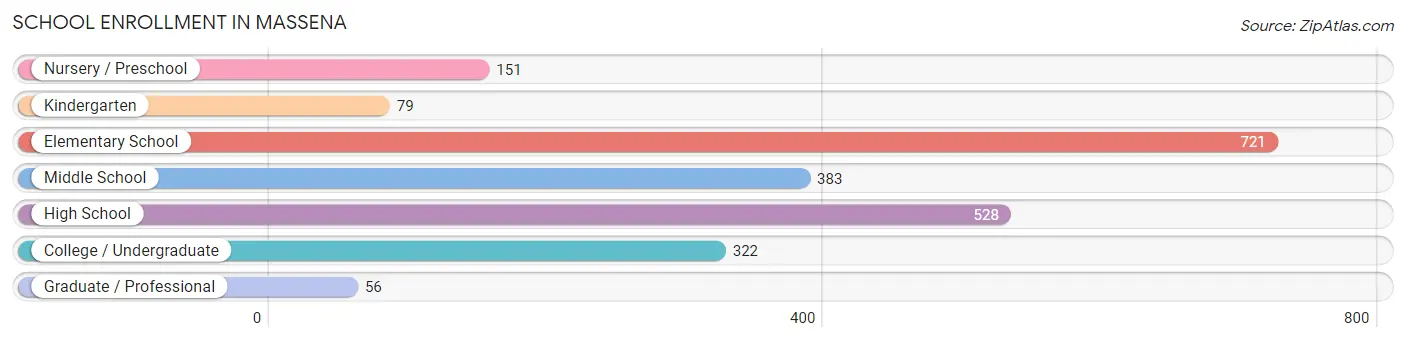
School Enrollment in Massena
The most common levels of schooling among the 2,240 students in Massena are elementary school (721 | 32.2%), high school (528 | 23.6%), and middle school (383 | 17.1%).
| School Level | # Students | % Students |
| Nursery / Preschool | 151 | 6.7% |
| Kindergarten | 79 | 3.5% |
| Elementary School | 721 | 32.2% |
| Middle School | 383 | 17.1% |
| High School | 528 | 23.6% |
| College / Undergraduate | 322 | 14.4% |
| Graduate / Professional | 56 | 2.5% |
| Total | 2,240 | 100.0% |
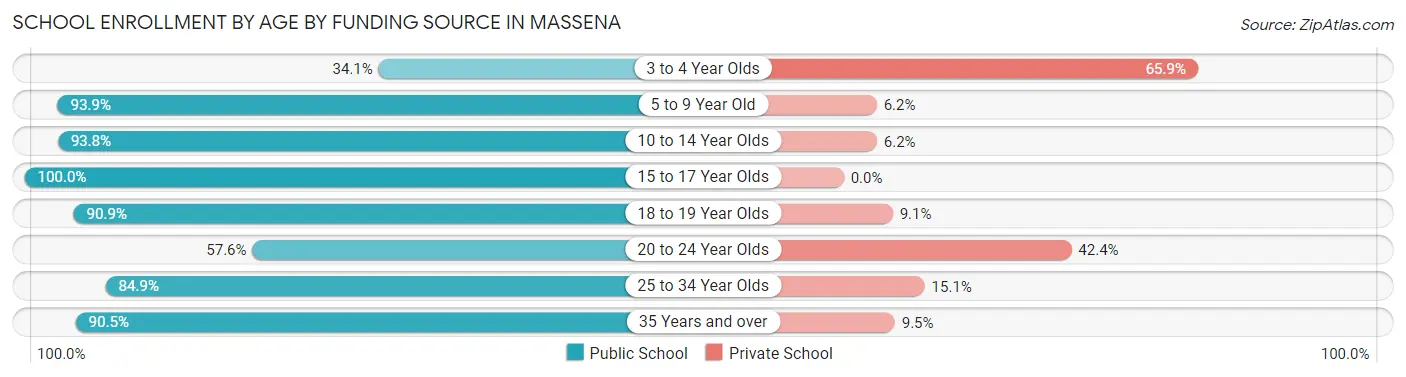
School Enrollment by Age by Funding Source in Massena
Out of a total of 2,240 students who are enrolled in schools in Massena, 242 (10.8%) attend a private institution, while the remaining 1,998 (89.2%) are enrolled in public schools. The age group of 3 to 4 year olds has the highest likelihood of being enrolled in private schools, with 91 (65.9% in the age bracket) enrolled. Conversely, the age group of 15 to 17 year olds has the lowest likelihood of being enrolled in a private school, with 357 (100.0% in the age bracket) attending a public institution.
| Age Bracket | Public School | Private School |
| 3 to 4 Year Olds | 47 (34.1%) | 91 (65.9%) |
| 5 to 9 Year Old | 687 (93.9%) | 45 (6.1%) |
| 10 to 14 Year Olds | 486 (93.8%) | 32 (6.2%) |
| 15 to 17 Year Olds | 357 (100.0%) | 0 (0.0%) |
| 18 to 19 Year Olds | 199 (90.9%) | 20 (9.1%) |
| 20 to 24 Year Olds | 38 (57.6%) | 28 (42.4%) |
| 25 to 34 Year Olds | 107 (84.9%) | 19 (15.1%) |
| 35 Years and over | 76 (90.5%) | 8 (9.5%) |
| Total | 1,998 (89.2%) | 242 (10.8%) |
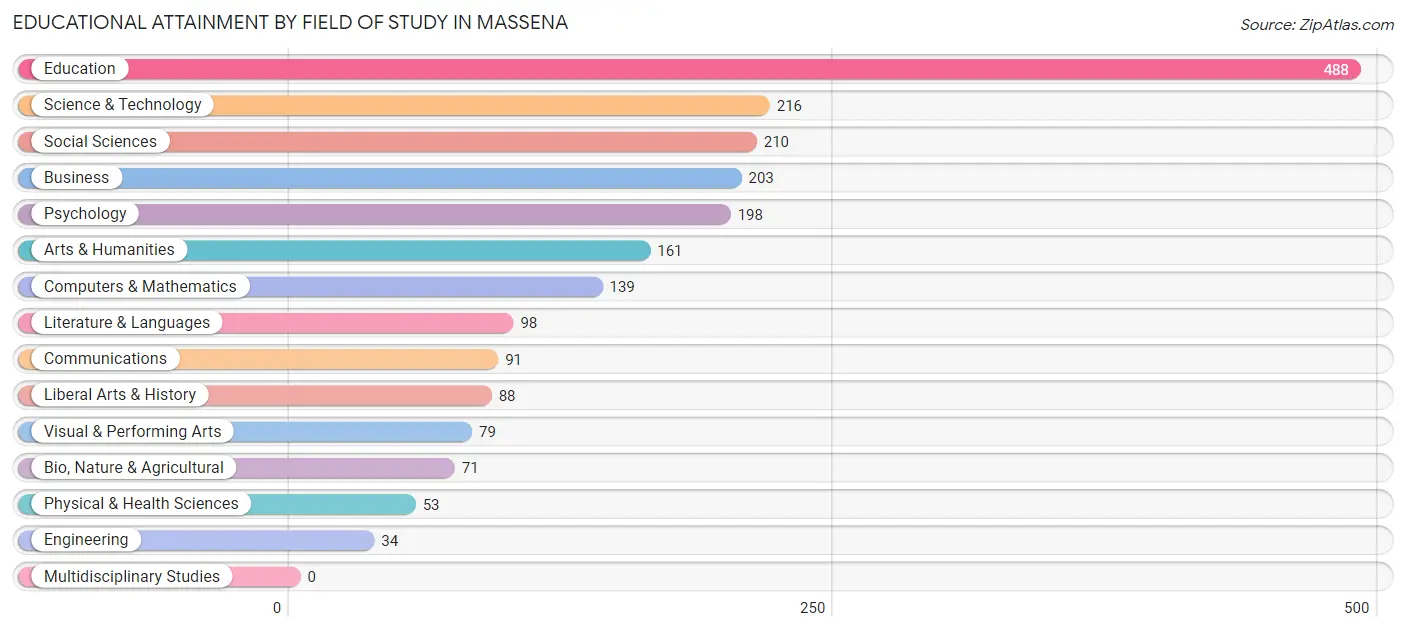
Educational Attainment by Field of Study in Massena
Education (488 | 22.9%), science & technology (216 | 10.2%), social sciences (210 | 9.9%), business (203 | 9.5%), and psychology (198 | 9.3%) are the most common fields of study among 2,129 individuals in Massena who have obtained a bachelor's degree or higher.
| Field of Study | # Graduates | % Graduates |
| Computers & Mathematics | 139 | 6.5% |
| Bio, Nature & Agricultural | 71 | 3.3% |
| Physical & Health Sciences | 53 | 2.5% |
| Psychology | 198 | 9.3% |
| Social Sciences | 210 | 9.9% |
| Engineering | 34 | 1.6% |
| Multidisciplinary Studies | 0 | 0.0% |
| Science & Technology | 216 | 10.2% |
| Business | 203 | 9.5% |
| Education | 488 | 22.9% |
| Literature & Languages | 98 | 4.6% |
| Liberal Arts & History | 88 | 4.1% |
| Visual & Performing Arts | 79 | 3.7% |
| Communications | 91 | 4.3% |
| Arts & Humanities | 161 | 7.6% |
| Total | 2,129 | 100.0% |
Transportation & Commute in Massena
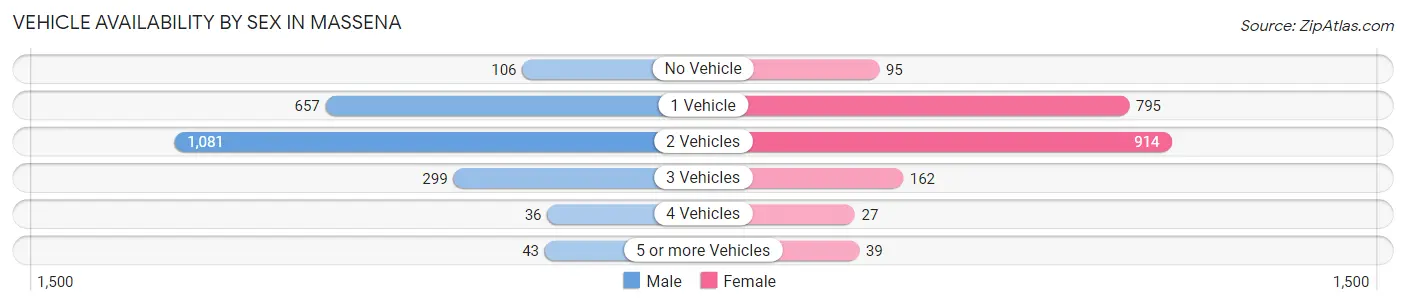
Vehicle Availability by Sex in Massena
The most prevalent vehicle ownership categories in Massena are males with 2 vehicles (1,081, accounting for 48.6%) and females with 2 vehicles (914, making up 53.2%).
| Vehicles Available | Male | Female |
| No Vehicle | 106 (4.8%) | 95 (4.7%) |
| 1 Vehicle | 657 (29.6%) | 795 (39.1%) |
| 2 Vehicles | 1,081 (48.6%) | 914 (45.0%) |
| 3 Vehicles | 299 (13.5%) | 162 (8.0%) |
| 4 Vehicles | 36 (1.6%) | 27 (1.3%) |
| 5 or more Vehicles | 43 (1.9%) | 39 (1.9%) |
| Total | 2,222 (100.0%) | 2,032 (100.0%) |
Commute Time in Massena
The most frequently occuring commute durations in Massena are 5 to 9 minutes (1,299 commuters, 31.7%), 10 to 14 minutes (680 commuters, 16.6%), and less than 5 minutes (459 commuters, 11.2%).
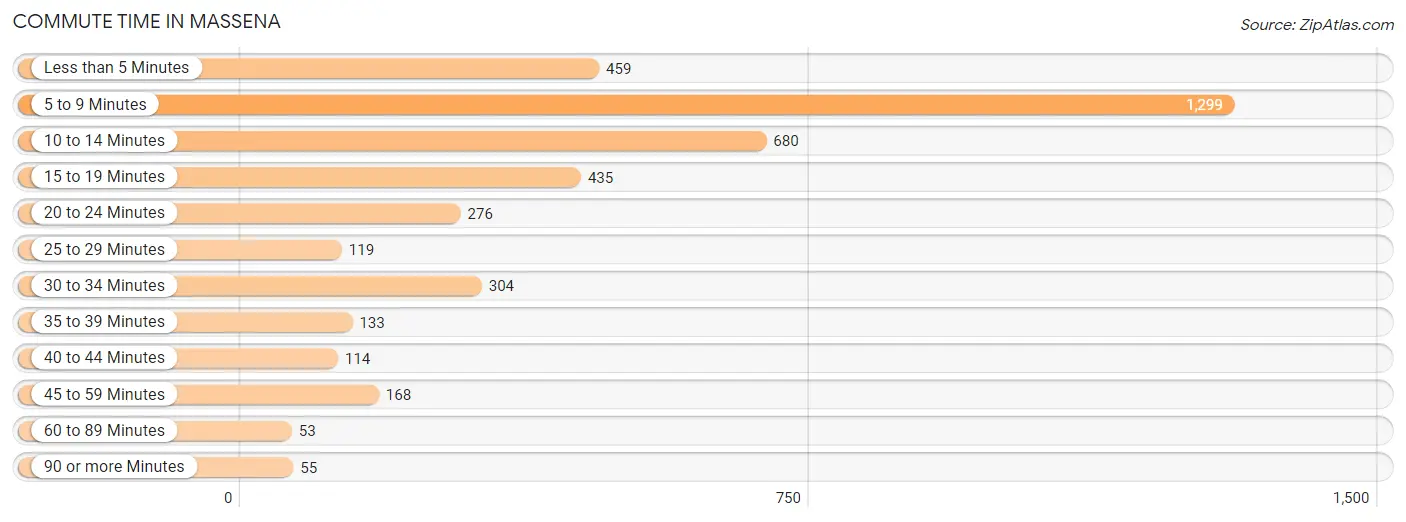
| Commute Time | # Commuters | % Commuters |
| Less than 5 Minutes | 459 | 11.2% |
| 5 to 9 Minutes | 1,299 | 31.7% |
| 10 to 14 Minutes | 680 | 16.6% |
| 15 to 19 Minutes | 435 | 10.6% |
| 20 to 24 Minutes | 276 | 6.7% |
| 25 to 29 Minutes | 119 | 2.9% |
| 30 to 34 Minutes | 304 | 7.4% |
| 35 to 39 Minutes | 133 | 3.3% |
| 40 to 44 Minutes | 114 | 2.8% |
| 45 to 59 Minutes | 168 | 4.1% |
| 60 to 89 Minutes | 53 | 1.3% |
| 90 or more Minutes | 55 | 1.3% |
Commute Time by Sex in Massena
The most common commute times in Massena are 5 to 9 minutes (619 commuters, 28.0%) for males and 5 to 9 minutes (680 commuters, 36.1%) for females.
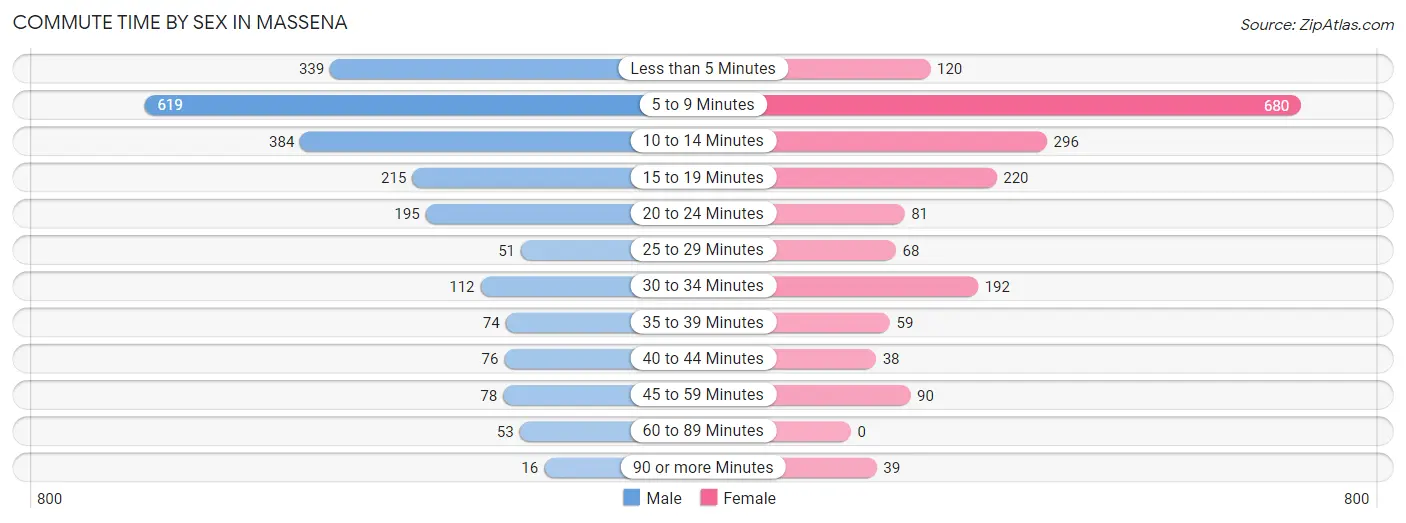
| Commute Time | Male | Female |
| Less than 5 Minutes | 339 (15.3%) | 120 (6.4%) |
| 5 to 9 Minutes | 619 (28.0%) | 680 (36.1%) |
| 10 to 14 Minutes | 384 (17.4%) | 296 (15.7%) |
| 15 to 19 Minutes | 215 (9.7%) | 220 (11.7%) |
| 20 to 24 Minutes | 195 (8.8%) | 81 (4.3%) |
| 25 to 29 Minutes | 51 (2.3%) | 68 (3.6%) |
| 30 to 34 Minutes | 112 (5.1%) | 192 (10.2%) |
| 35 to 39 Minutes | 74 (3.4%) | 59 (3.1%) |
| 40 to 44 Minutes | 76 (3.4%) | 38 (2.0%) |
| 45 to 59 Minutes | 78 (3.5%) | 90 (4.8%) |
| 60 to 89 Minutes | 53 (2.4%) | 0 (0.0%) |
| 90 or more Minutes | 16 (0.7%) | 39 (2.1%) |
Time of Departure to Work by Sex in Massena
The most frequent times of departure to work in Massena are 5:30 AM to 5:59 AM (316, 14.3%) for males and 6:30 AM to 6:59 AM (297, 15.8%) for females.
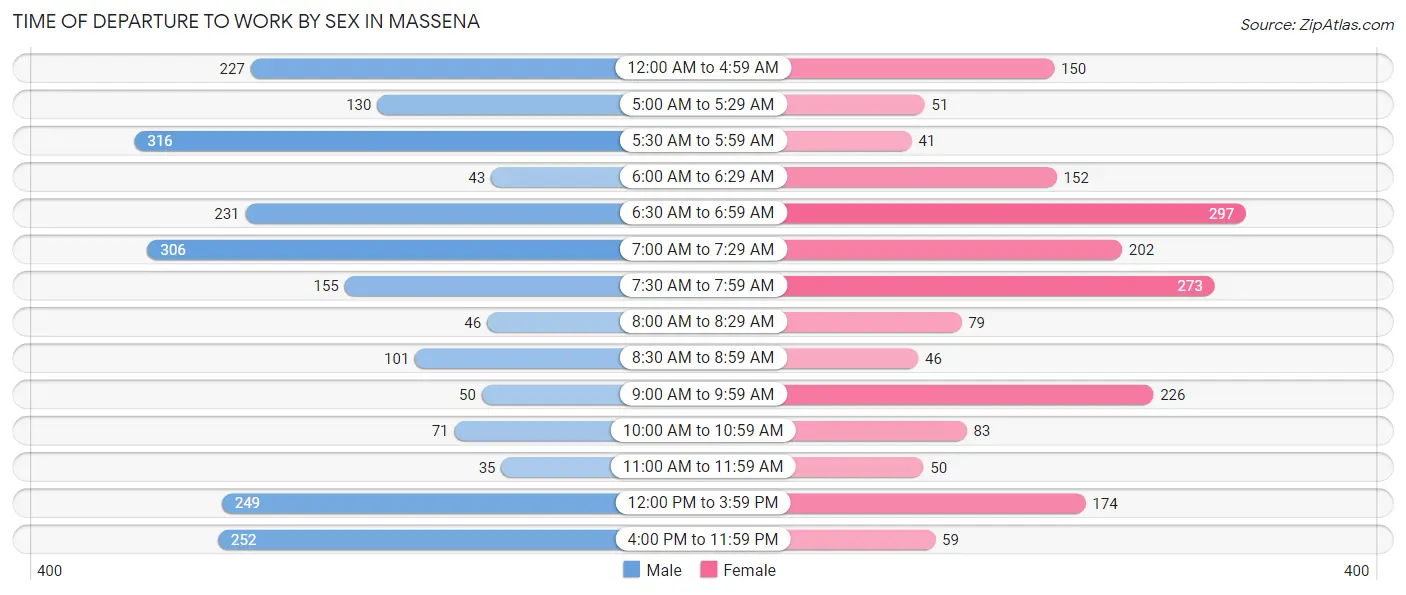
| Time of Departure | Male | Female |
| 12:00 AM to 4:59 AM | 227 (10.3%) | 150 (8.0%) |
| 5:00 AM to 5:29 AM | 130 (5.9%) | 51 (2.7%) |
| 5:30 AM to 5:59 AM | 316 (14.3%) | 41 (2.2%) |
| 6:00 AM to 6:29 AM | 43 (1.9%) | 152 (8.1%) |
| 6:30 AM to 6:59 AM | 231 (10.4%) | 297 (15.8%) |
| 7:00 AM to 7:29 AM | 306 (13.8%) | 202 (10.7%) |
| 7:30 AM to 7:59 AM | 155 (7.0%) | 273 (14.5%) |
| 8:00 AM to 8:29 AM | 46 (2.1%) | 79 (4.2%) |
| 8:30 AM to 8:59 AM | 101 (4.6%) | 46 (2.4%) |
| 9:00 AM to 9:59 AM | 50 (2.3%) | 226 (12.0%) |
| 10:00 AM to 10:59 AM | 71 (3.2%) | 83 (4.4%) |
| 11:00 AM to 11:59 AM | 35 (1.6%) | 50 (2.7%) |
| 12:00 PM to 3:59 PM | 249 (11.3%) | 174 (9.2%) |
| 4:00 PM to 11:59 PM | 252 (11.4%) | 59 (3.1%) |
| Total | 2,212 (100.0%) | 1,883 (100.0%) |
Housing Occupancy in Massena
Occupancy by Ownership in Massena
Of the total 4,845 dwellings in Massena, owner-occupied units account for 2,778 (57.3%), while renter-occupied units make up 2,067 (42.7%).
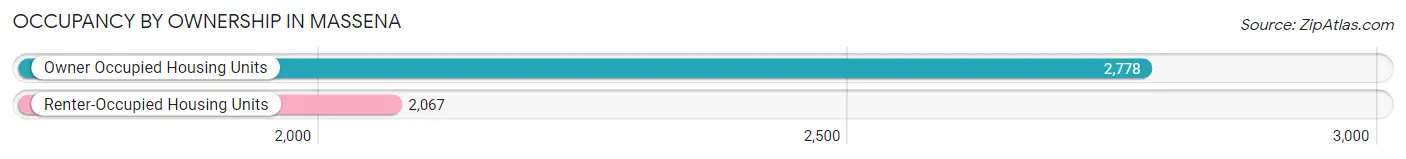
| Occupancy | # Housing Units | % Housing Units |
| Owner Occupied Housing Units | 2,778 | 57.3% |
| Renter-Occupied Housing Units | 2,067 | 42.7% |
| Total Occupied Housing Units | 4,845 | 100.0% |
Occupancy by Household Size in Massena
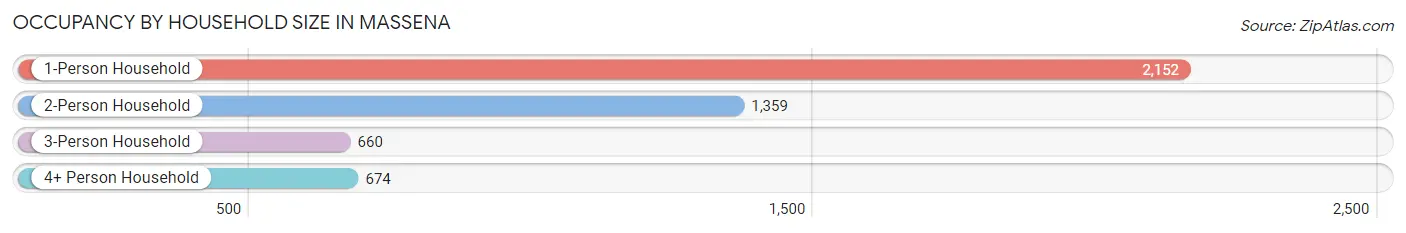
| Household Size | # Housing Units | % Housing Units |
| 1-Person Household | 2,152 | 44.4% |
| 2-Person Household | 1,359 | 28.1% |
| 3-Person Household | 660 | 13.6% |
| 4+ Person Household | 674 | 13.9% |
| Total Housing Units | 4,845 | 100.0% |
Occupancy by Ownership by Household Size in Massena
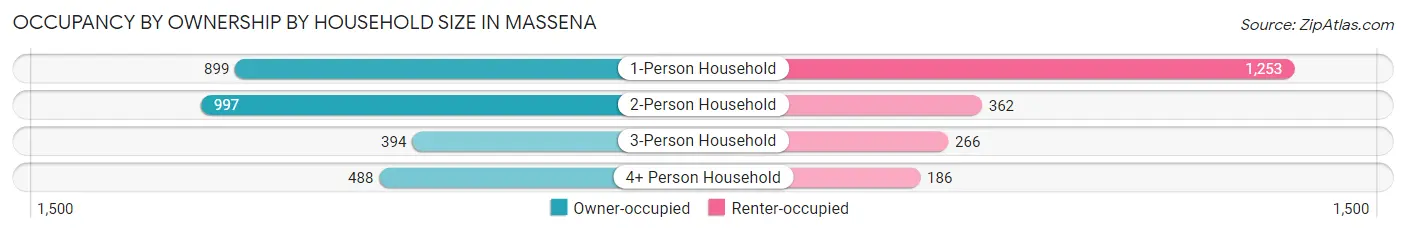
| Household Size | Owner-occupied | Renter-occupied |
| 1-Person Household | 899 (41.8%) | 1,253 (58.2%) |
| 2-Person Household | 997 (73.4%) | 362 (26.6%) |
| 3-Person Household | 394 (59.7%) | 266 (40.3%) |
| 4+ Person Household | 488 (72.4%) | 186 (27.6%) |
| Total Housing Units | 2,778 (57.3%) | 2,067 (42.7%) |
Occupancy by Educational Attainment in Massena
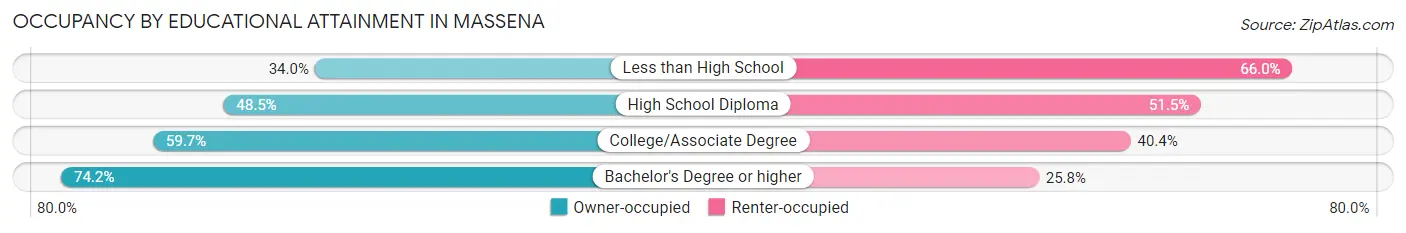
| Household Size | Owner-occupied | Renter-occupied |
| Less than High School | 141 (34.0%) | 274 (66.0%) |
| High School Diploma | 879 (48.5%) | 935 (51.5%) |
| College/Associate Degree | 751 (59.7%) | 508 (40.4%) |
| Bachelor's Degree or higher | 1,007 (74.2%) | 350 (25.8%) |
Occupancy by Age of Householder in Massena
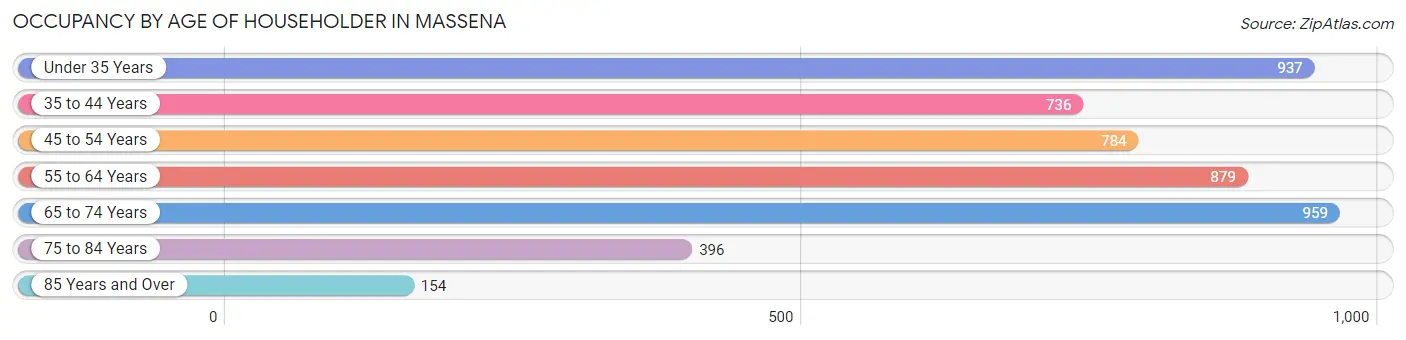
| Age Bracket | # Households | % Households |
| Under 35 Years | 937 | 19.3% |
| 35 to 44 Years | 736 | 15.2% |
| 45 to 54 Years | 784 | 16.2% |
| 55 to 64 Years | 879 | 18.1% |
| 65 to 74 Years | 959 | 19.8% |
| 75 to 84 Years | 396 | 8.2% |
| 85 Years and Over | 154 | 3.2% |
| Total | 4,845 | 100.0% |
Housing Finances in Massena
Median Income by Occupancy in Massena
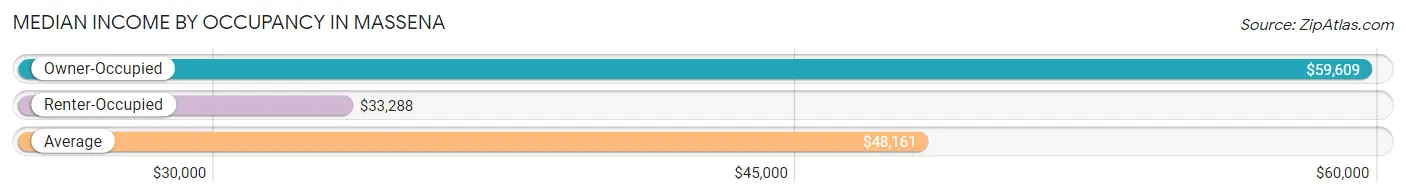
| Occupancy Type | # Households | Median Income |
| Owner-Occupied | 2,778 (57.3%) | $59,609 |
| Renter-Occupied | 2,067 (42.7%) | $33,288 |
| Average | 4,845 (100.0%) | $48,161 |
Occupancy by Householder Income Bracket in Massena
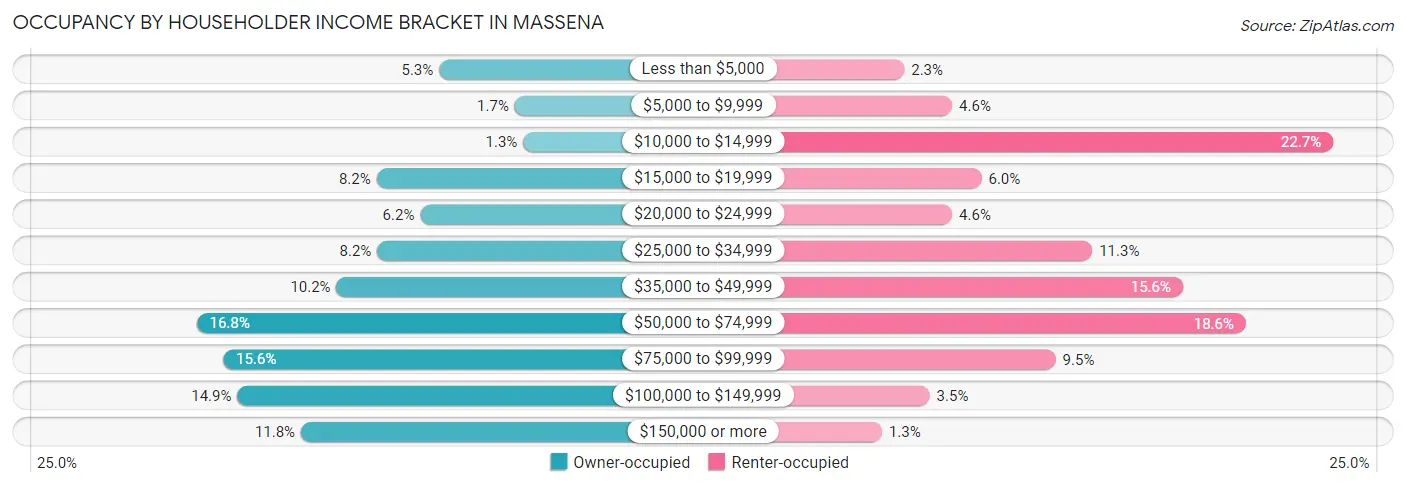
| Income Bracket | Owner-occupied | Renter-occupied |
| Less than $5,000 | 146 (5.3%) | 48 (2.3%) |
| $5,000 to $9,999 | 46 (1.7%) | 95 (4.6%) |
| $10,000 to $14,999 | 35 (1.3%) | 470 (22.7%) |
| $15,000 to $19,999 | 229 (8.2%) | 124 (6.0%) |
| $20,000 to $24,999 | 171 (6.2%) | 95 (4.6%) |
| $25,000 to $34,999 | 228 (8.2%) | 233 (11.3%) |
| $35,000 to $49,999 | 282 (10.2%) | 322 (15.6%) |
| $50,000 to $74,999 | 467 (16.8%) | 384 (18.6%) |
| $75,000 to $99,999 | 432 (15.5%) | 197 (9.5%) |
| $100,000 to $149,999 | 413 (14.9%) | 73 (3.5%) |
| $150,000 or more | 329 (11.8%) | 26 (1.3%) |
| Total | 2,778 (100.0%) | 2,067 (100.0%) |
Monthly Housing Cost Tiers in Massena
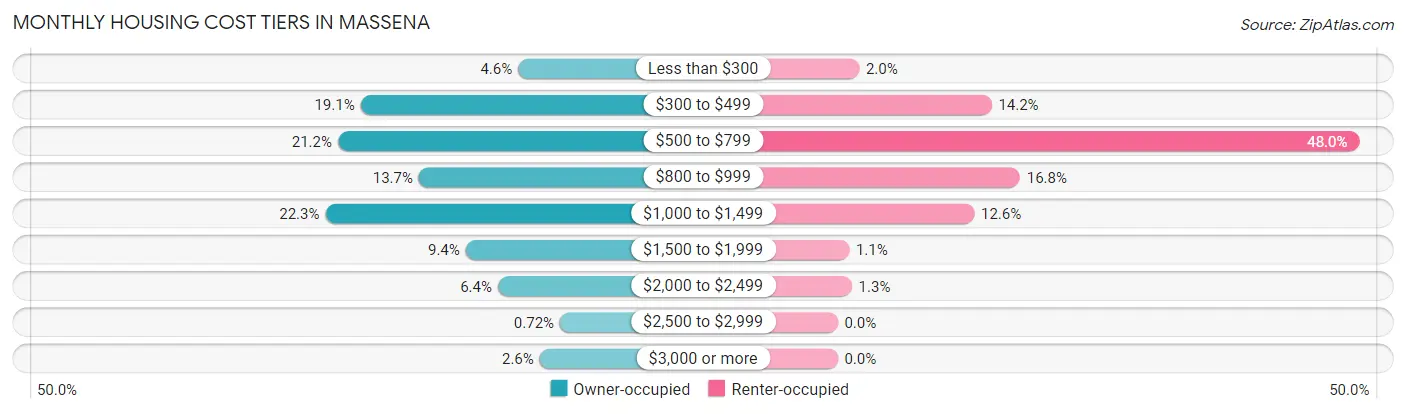
| Monthly Cost | Owner-occupied | Renter-occupied |
| Less than $300 | 127 (4.6%) | 41 (2.0%) |
| $300 to $499 | 530 (19.1%) | 293 (14.2%) |
| $500 to $799 | 588 (21.2%) | 993 (48.0%) |
| $800 to $999 | 381 (13.7%) | 347 (16.8%) |
| $1,000 to $1,499 | 620 (22.3%) | 260 (12.6%) |
| $1,500 to $1,999 | 261 (9.4%) | 22 (1.1%) |
| $2,000 to $2,499 | 179 (6.4%) | 27 (1.3%) |
| $2,500 to $2,999 | 20 (0.7%) | 0 (0.0%) |
| $3,000 or more | 72 (2.6%) | 0 (0.0%) |
| Total | 2,778 (100.0%) | 2,067 (100.0%) |
Physical Housing Characteristics in Massena
Housing Structures in Massena
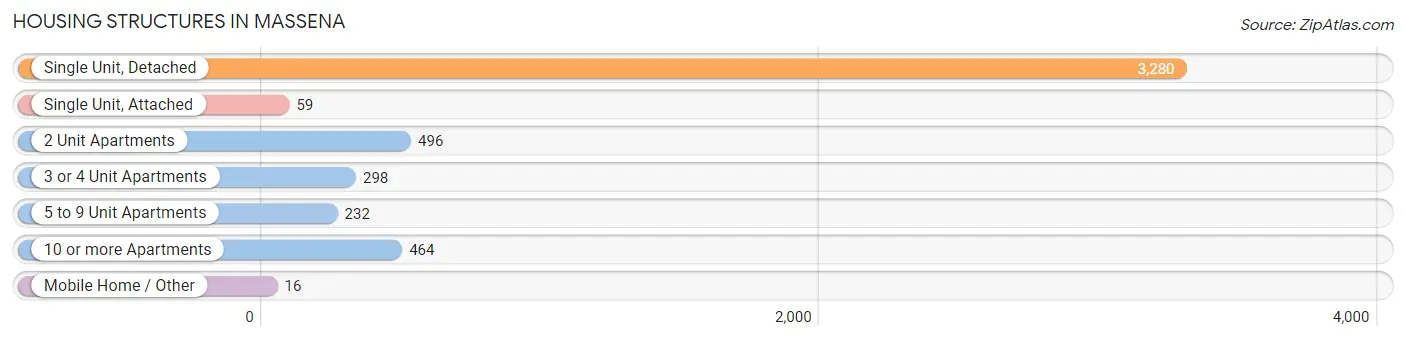
| Structure Type | # Housing Units | % Housing Units |
| Single Unit, Detached | 3,280 | 67.7% |
| Single Unit, Attached | 59 | 1.2% |
| 2 Unit Apartments | 496 | 10.2% |
| 3 or 4 Unit Apartments | 298 | 6.1% |
| 5 to 9 Unit Apartments | 232 | 4.8% |
| 10 or more Apartments | 464 | 9.6% |
| Mobile Home / Other | 16 | 0.3% |
| Total | 4,845 | 100.0% |
Housing Structures by Occupancy in Massena
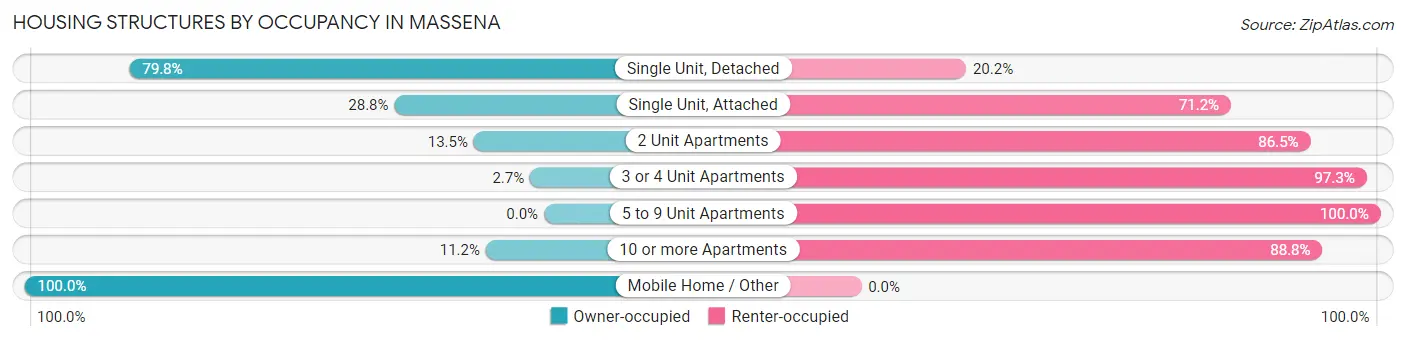
| Structure Type | Owner-occupied | Renter-occupied |
| Single Unit, Detached | 2,618 (79.8%) | 662 (20.2%) |
| Single Unit, Attached | 17 (28.8%) | 42 (71.2%) |
| 2 Unit Apartments | 67 (13.5%) | 429 (86.5%) |
| 3 or 4 Unit Apartments | 8 (2.7%) | 290 (97.3%) |
| 5 to 9 Unit Apartments | 0 (0.0%) | 232 (100.0%) |
| 10 or more Apartments | 52 (11.2%) | 412 (88.8%) |
| Mobile Home / Other | 16 (100.0%) | 0 (0.0%) |
| Total | 2,778 (57.3%) | 2,067 (42.7%) |
Housing Structures by Number of Rooms in Massena
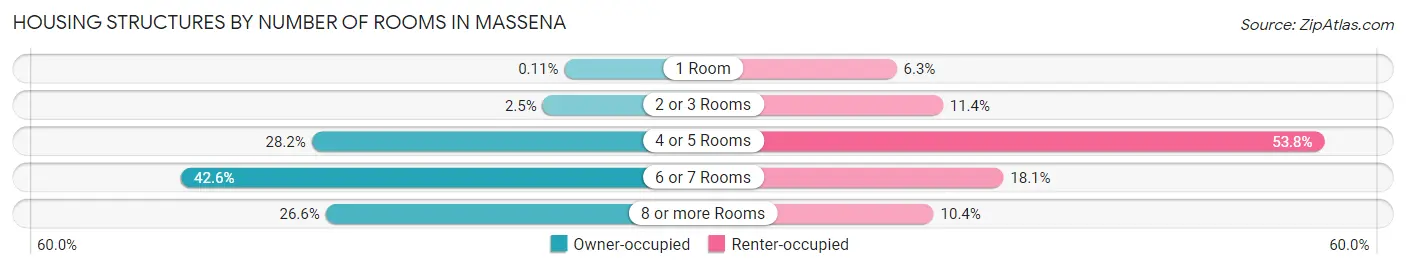
| Number of Rooms | Owner-occupied | Renter-occupied |
| 1 Room | 3 (0.1%) | 130 (6.3%) |
| 2 or 3 Rooms | 70 (2.5%) | 236 (11.4%) |
| 4 or 5 Rooms | 782 (28.1%) | 1,111 (53.7%) |
| 6 or 7 Rooms | 1,184 (42.6%) | 375 (18.1%) |
| 8 or more Rooms | 739 (26.6%) | 215 (10.4%) |
| Total | 2,778 (100.0%) | 2,067 (100.0%) |
Housing Structure by Heating Type in Massena
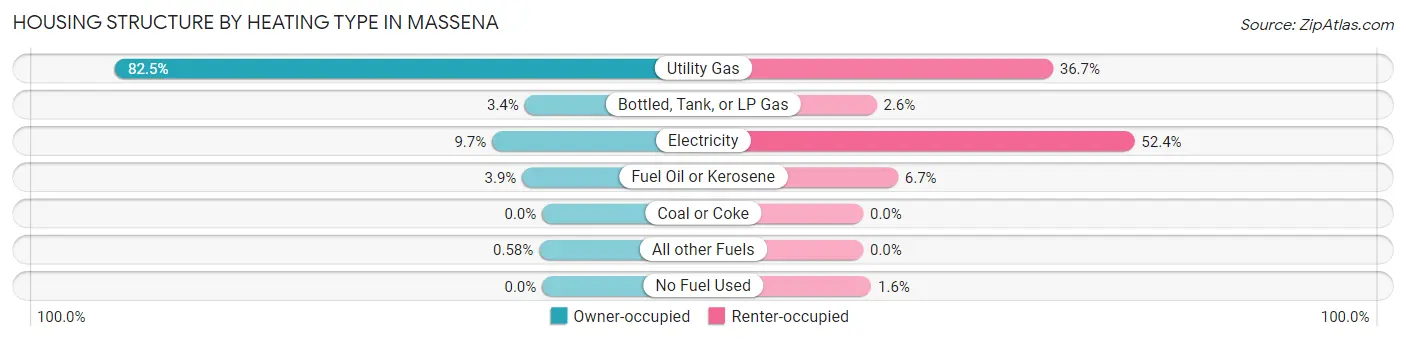
| Heating Type | Owner-occupied | Renter-occupied |
| Utility Gas | 2,292 (82.5%) | 758 (36.7%) |
| Bottled, Tank, or LP Gas | 94 (3.4%) | 54 (2.6%) |
| Electricity | 269 (9.7%) | 1,084 (52.4%) |
| Fuel Oil or Kerosene | 107 (3.8%) | 139 (6.7%) |
| Coal or Coke | 0 (0.0%) | 0 (0.0%) |
| All other Fuels | 16 (0.6%) | 0 (0.0%) |
| No Fuel Used | 0 (0.0%) | 32 (1.5%) |
| Total | 2,778 (100.0%) | 2,067 (100.0%) |
Household Vehicle Usage in Massena
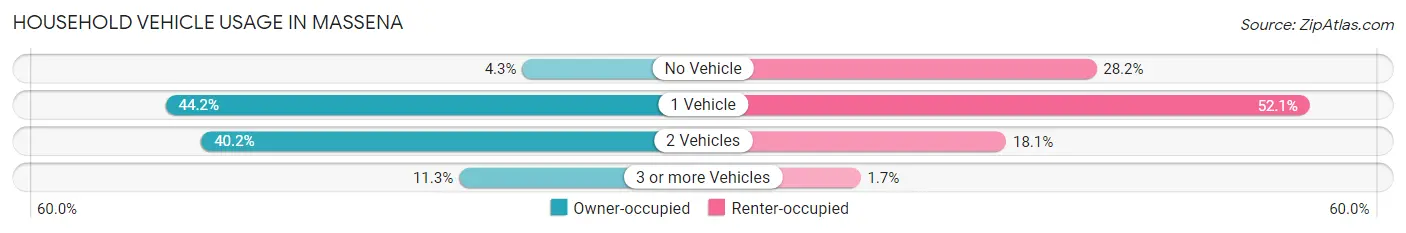
| Vehicles per Household | Owner-occupied | Renter-occupied |
| No Vehicle | 118 (4.3%) | 582 (28.2%) |
| 1 Vehicle | 1,228 (44.2%) | 1,076 (52.1%) |
| 2 Vehicles | 1,117 (40.2%) | 373 (18.0%) |
| 3 or more Vehicles | 315 (11.3%) | 36 (1.7%) |
| Total | 2,778 (100.0%) | 2,067 (100.0%) |
Real Estate & Mortgages in Massena
Real Estate and Mortgage Overview in Massena
| Characteristic | Without Mortgage | With Mortgage |
| Housing Units | 1,145 | 1,633 |
| Median Property Value | $75,600 | $107,800 |
| Median Household Income | $38,845 | $288 |
| Monthly Housing Costs | $479 | $72 |
| Real Estate Taxes | $2,086 | $9 |
Property Value by Mortgage Status in Massena
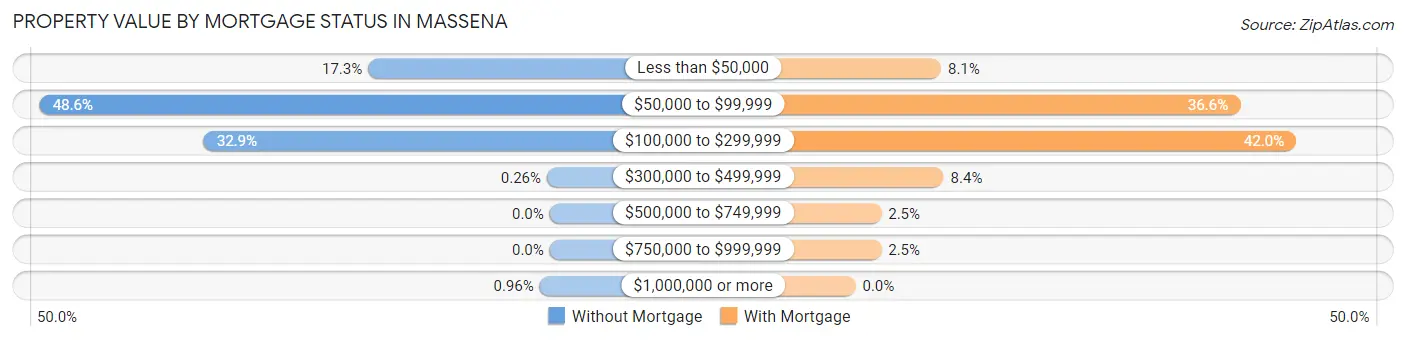
| Property Value | Without Mortgage | With Mortgage |
| Less than $50,000 | 198 (17.3%) | 133 (8.1%) |
| $50,000 to $99,999 | 556 (48.6%) | 598 (36.6%) |
| $100,000 to $299,999 | 377 (32.9%) | 685 (41.9%) |
| $300,000 to $499,999 | 3 (0.3%) | 137 (8.4%) |
| $500,000 to $749,999 | 0 (0.0%) | 40 (2.5%) |
| $750,000 to $999,999 | 0 (0.0%) | 40 (2.5%) |
| $1,000,000 or more | 11 (1.0%) | 0 (0.0%) |
| Total | 1,145 (100.0%) | 1,633 (100.0%) |
Household Income by Mortgage Status in Massena
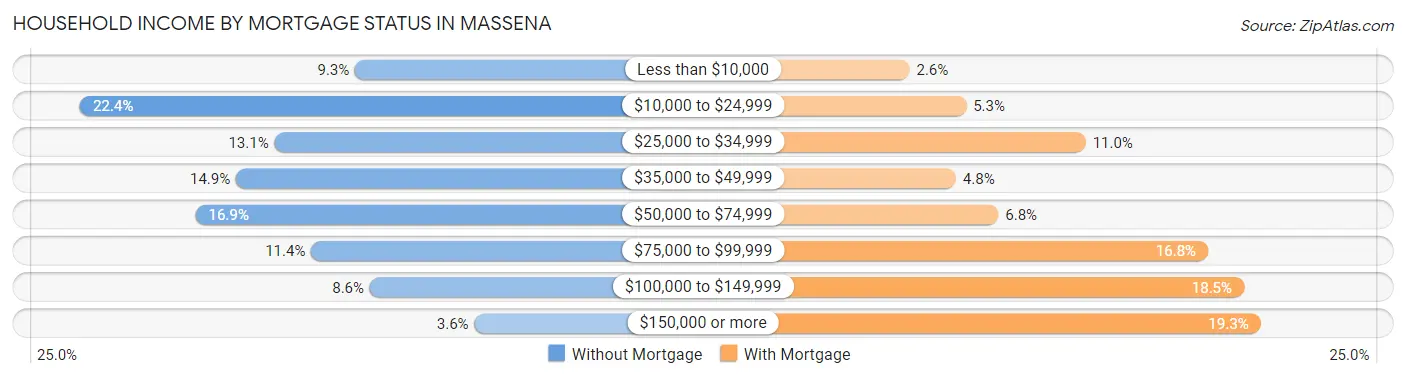
| Household Income | Without Mortgage | With Mortgage |
| Less than $10,000 | 106 (9.3%) | 42 (2.6%) |
| $10,000 to $24,999 | 256 (22.4%) | 86 (5.3%) |
| $25,000 to $34,999 | 150 (13.1%) | 179 (11.0%) |
| $35,000 to $49,999 | 171 (14.9%) | 78 (4.8%) |
| $50,000 to $74,999 | 193 (16.9%) | 111 (6.8%) |
| $75,000 to $99,999 | 130 (11.4%) | 274 (16.8%) |
| $100,000 to $149,999 | 98 (8.6%) | 302 (18.5%) |
| $150,000 or more | 41 (3.6%) | 315 (19.3%) |
| Total | 1,145 (100.0%) | 1,633 (100.0%) |
Property Value to Household Income Ratio in Massena
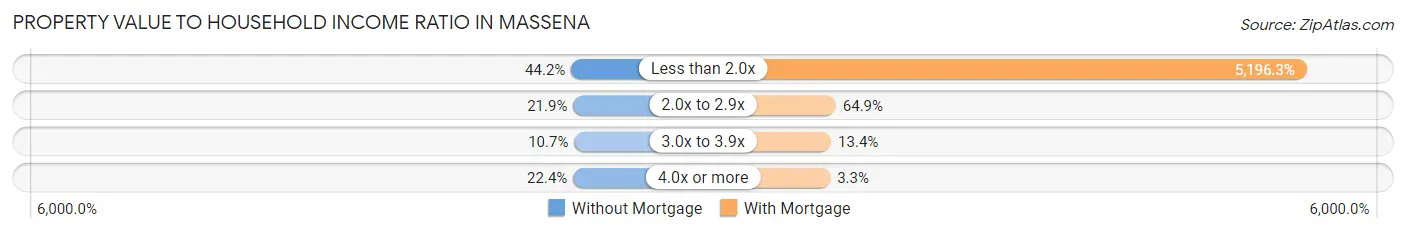
| Value-to-Income Ratio | Without Mortgage | With Mortgage |
| Less than 2.0x | 506 (44.2%) | 84,856 (5,196.3%) |
| 2.0x to 2.9x | 251 (21.9%) | 1,060 (64.9%) |
| 3.0x to 3.9x | 122 (10.7%) | 219 (13.4%) |
| 4.0x or more | 256 (22.4%) | 54 (3.3%) |
| Total | 1,145 (100.0%) | 1,633 (100.0%) |
Real Estate Taxes by Mortgage Status in Massena
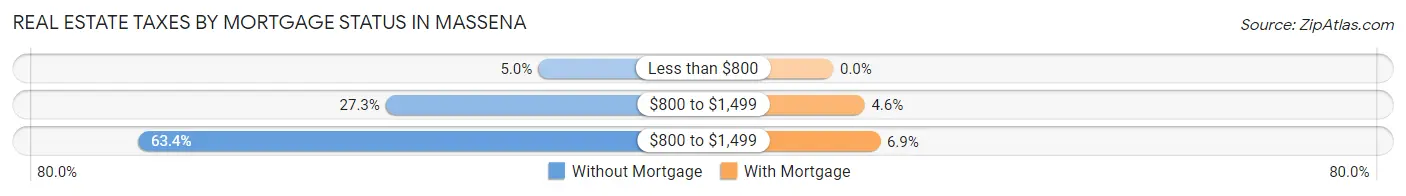
| Property Taxes | Without Mortgage | With Mortgage |
| Less than $800 | 57 (5.0%) | 0 (0.0%) |
| $800 to $1,499 | 312 (27.3%) | 75 (4.6%) |
| $800 to $1,499 | 726 (63.4%) | 112 (6.9%) |
| Total | 1,145 (100.0%) | 1,633 (100.0%) |
Health & Disability in Massena
Health Insurance Coverage by Age in Massena
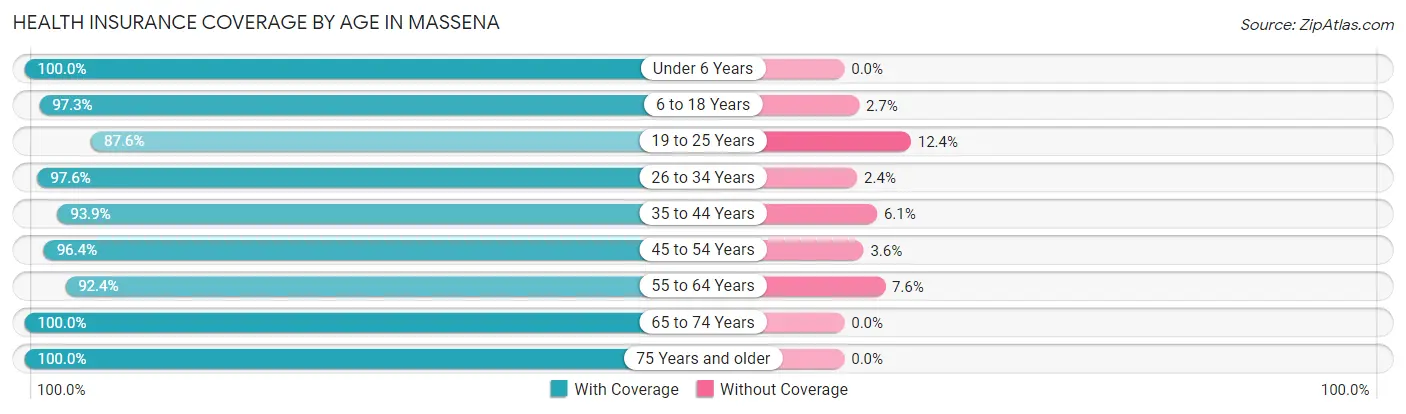
| Age Bracket | With Coverage | Without Coverage |
| Under 6 Years | 532 (100.0%) | 0 (0.0%) |
| 6 to 18 Years | 1,605 (97.3%) | 45 (2.7%) |
| 19 to 25 Years | 537 (87.6%) | 76 (12.4%) |
| 26 to 34 Years | 1,340 (97.6%) | 33 (2.4%) |
| 35 to 44 Years | 1,124 (93.9%) | 73 (6.1%) |
| 45 to 54 Years | 1,348 (96.4%) | 50 (3.6%) |
| 55 to 64 Years | 1,243 (92.4%) | 102 (7.6%) |
| 65 to 74 Years | 1,229 (100.0%) | 0 (0.0%) |
| 75 Years and older | 738 (100.0%) | 0 (0.0%) |
| Total | 9,696 (96.2%) | 379 (3.8%) |
Health Insurance Coverage by Citizenship Status in Massena
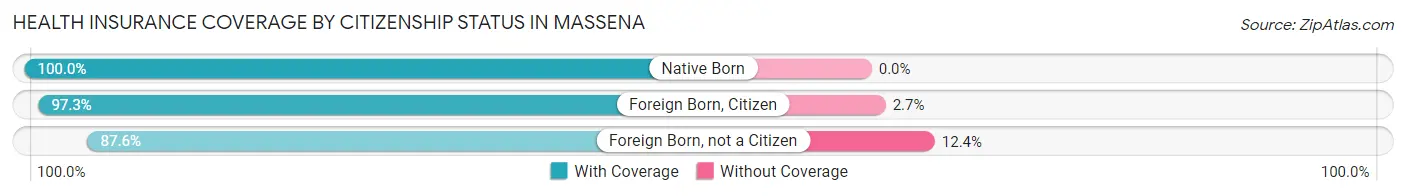
| Citizenship Status | With Coverage | Without Coverage |
| Native Born | 532 (100.0%) | 0 (0.0%) |
| Foreign Born, Citizen | 1,605 (97.3%) | 45 (2.7%) |
| Foreign Born, not a Citizen | 537 (87.6%) | 76 (12.4%) |
Health Insurance Coverage by Household Income in Massena
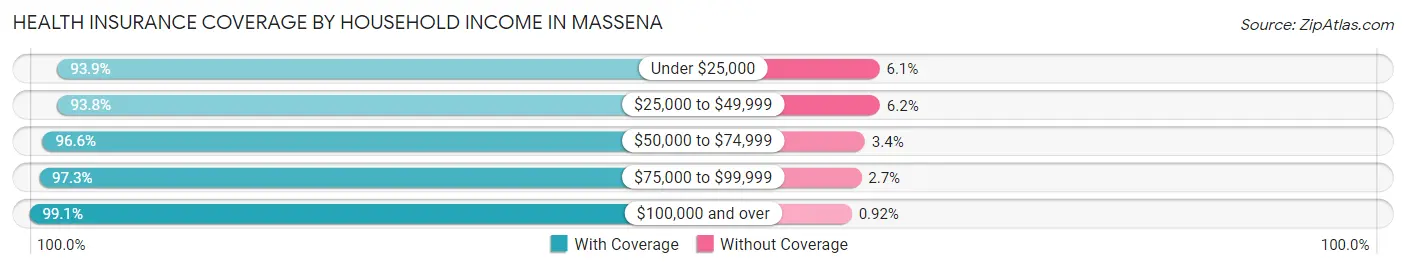
| Household Income | With Coverage | Without Coverage |
| Under $25,000 | 1,912 (93.9%) | 125 (6.1%) |
| $25,000 to $49,999 | 1,815 (93.8%) | 120 (6.2%) |
| $50,000 to $74,999 | 1,879 (96.6%) | 66 (3.4%) |
| $75,000 to $99,999 | 1,533 (97.3%) | 43 (2.7%) |
| $100,000 and over | 2,472 (99.1%) | 23 (0.9%) |
Public vs Private Health Insurance Coverage by Age in Massena
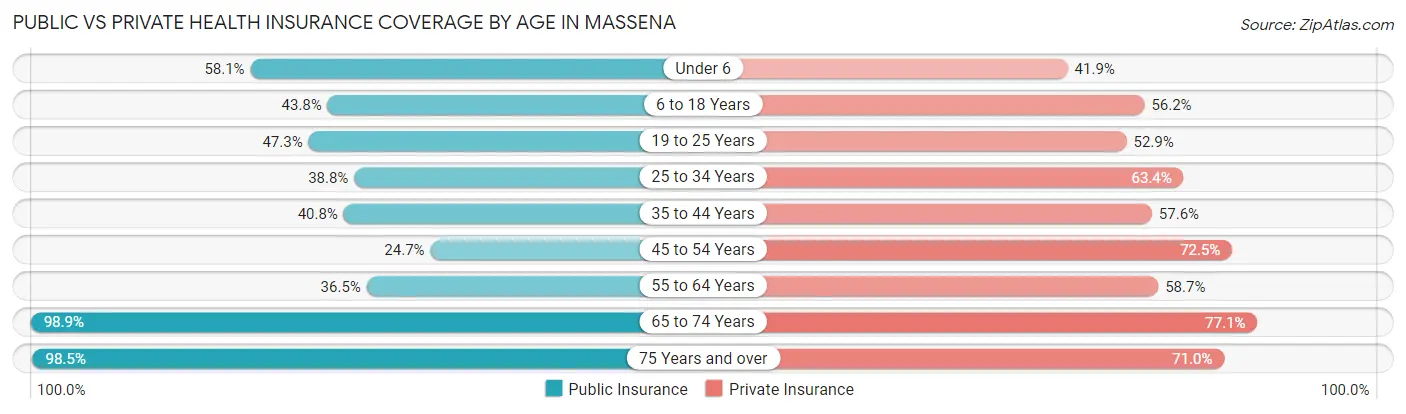
| Age Bracket | Public Insurance | Private Insurance |
| Under 6 | 309 (58.1%) | 223 (41.9%) |
| 6 to 18 Years | 722 (43.8%) | 927 (56.2%) |
| 19 to 25 Years | 290 (47.3%) | 324 (52.8%) |
| 25 to 34 Years | 533 (38.8%) | 871 (63.4%) |
| 35 to 44 Years | 488 (40.8%) | 689 (57.6%) |
| 45 to 54 Years | 345 (24.7%) | 1,013 (72.5%) |
| 55 to 64 Years | 491 (36.5%) | 790 (58.7%) |
| 65 to 74 Years | 1,215 (98.9%) | 948 (77.1%) |
| 75 Years and over | 727 (98.5%) | 524 (71.0%) |
| Total | 5,120 (50.8%) | 6,309 (62.6%) |
Disability Status by Sex by Age in Massena
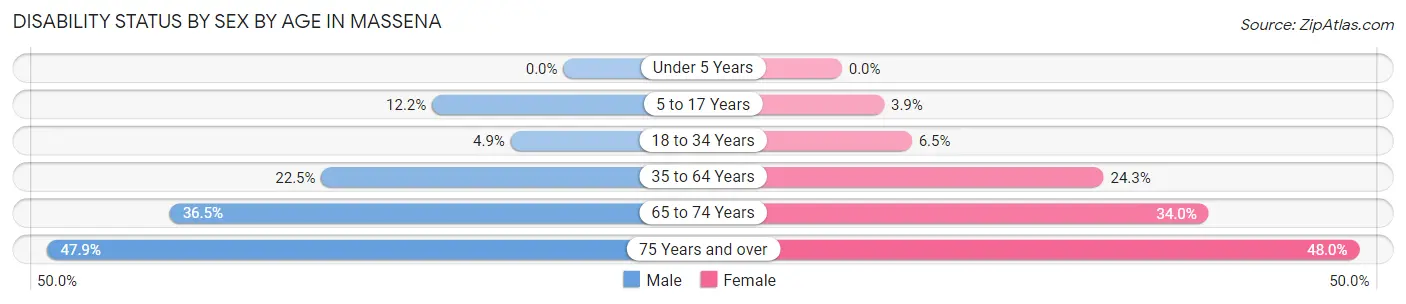
| Age Bracket | Male | Female |
| Under 5 Years | 0 (0.0%) | 0 (0.0%) |
| 5 to 17 Years | 94 (12.2%) | 33 (3.9%) |
| 18 to 34 Years | 53 (4.9%) | 67 (6.5%) |
| 35 to 64 Years | 429 (22.5%) | 493 (24.3%) |
| 65 to 74 Years | 156 (36.5%) | 273 (34.0%) |
| 75 Years and over | 134 (47.9%) | 220 (48.0%) |
Disability Class by Sex by Age in Massena
Disability Class: Hearing Difficulty
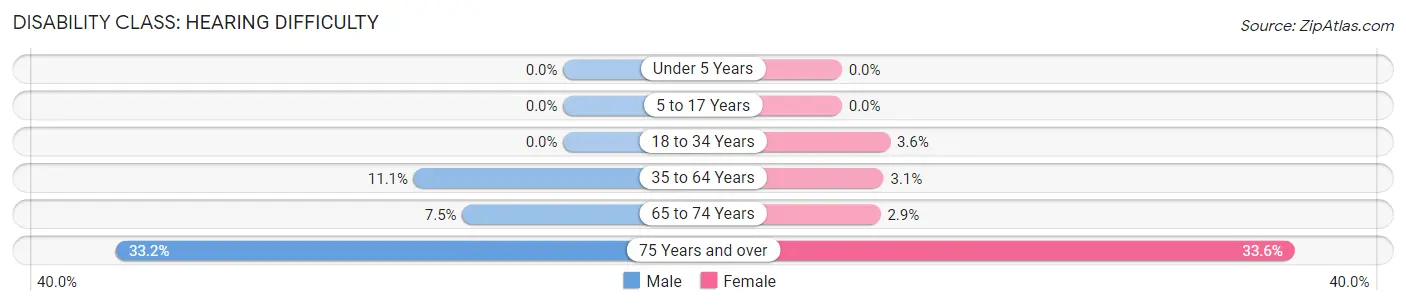
| Age Bracket | Male | Female |
| Under 5 Years | 0 (0.0%) | 0 (0.0%) |
| 5 to 17 Years | 0 (0.0%) | 0 (0.0%) |
| 18 to 34 Years | 0 (0.0%) | 37 (3.6%) |
| 35 to 64 Years | 212 (11.1%) | 63 (3.1%) |
| 65 to 74 Years | 32 (7.5%) | 23 (2.9%) |
| 75 Years and over | 93 (33.2%) | 154 (33.6%) |
Disability Class: Vision Difficulty
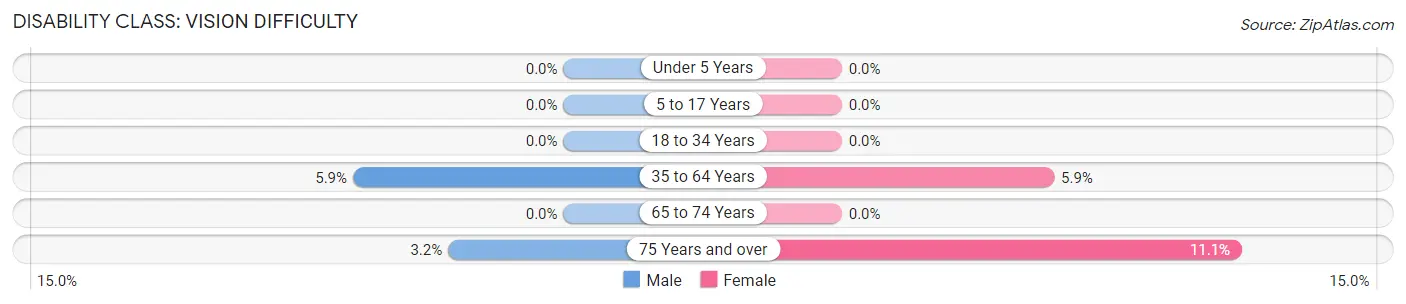
| Age Bracket | Male | Female |
| Under 5 Years | 0 (0.0%) | 0 (0.0%) |
| 5 to 17 Years | 0 (0.0%) | 0 (0.0%) |
| 18 to 34 Years | 0 (0.0%) | 0 (0.0%) |
| 35 to 64 Years | 112 (5.9%) | 120 (5.9%) |
| 65 to 74 Years | 0 (0.0%) | 0 (0.0%) |
| 75 Years and over | 9 (3.2%) | 51 (11.1%) |
Disability Class: Cognitive Difficulty
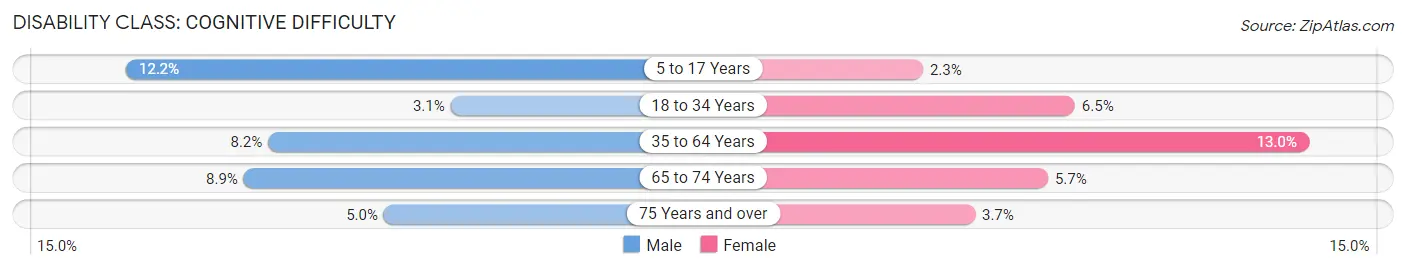
| Age Bracket | Male | Female |
| 5 to 17 Years | 94 (12.2%) | 19 (2.3%) |
| 18 to 34 Years | 34 (3.1%) | 67 (6.5%) |
| 35 to 64 Years | 157 (8.2%) | 264 (13.0%) |
| 65 to 74 Years | 38 (8.9%) | 46 (5.7%) |
| 75 Years and over | 14 (5.0%) | 17 (3.7%) |
Disability Class: Ambulatory Difficulty
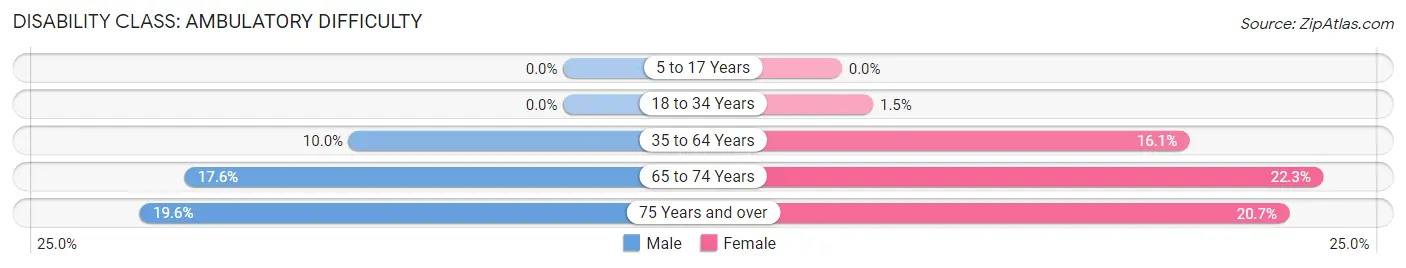
| Age Bracket | Male | Female |
| 5 to 17 Years | 0 (0.0%) | 0 (0.0%) |
| 18 to 34 Years | 0 (0.0%) | 15 (1.5%) |
| 35 to 64 Years | 190 (10.0%) | 327 (16.1%) |
| 65 to 74 Years | 75 (17.6%) | 179 (22.3%) |
| 75 Years and over | 55 (19.6%) | 95 (20.7%) |
Disability Class: Self-Care Difficulty
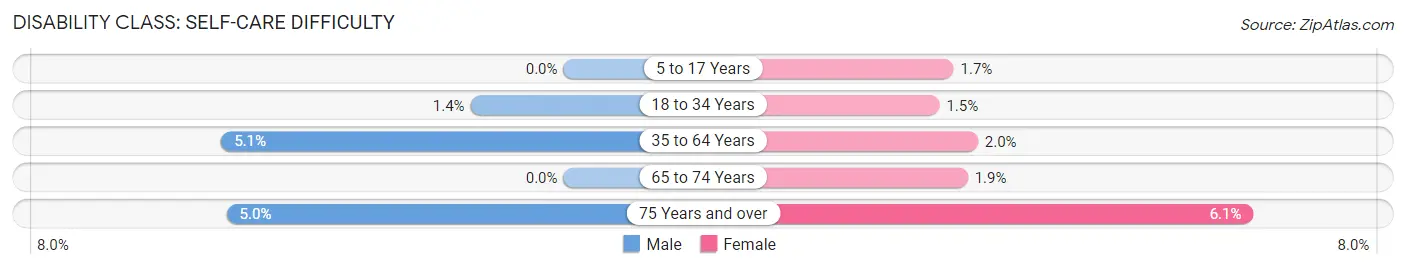
| Age Bracket | Male | Female |
| 5 to 17 Years | 0 (0.0%) | 14 (1.7%) |
| 18 to 34 Years | 15 (1.4%) | 15 (1.5%) |
| 35 to 64 Years | 97 (5.1%) | 41 (2.0%) |
| 65 to 74 Years | 0 (0.0%) | 15 (1.9%) |
| 75 Years and over | 14 (5.0%) | 28 (6.1%) |
Technology Access in Massena
Computing Device Access in Massena
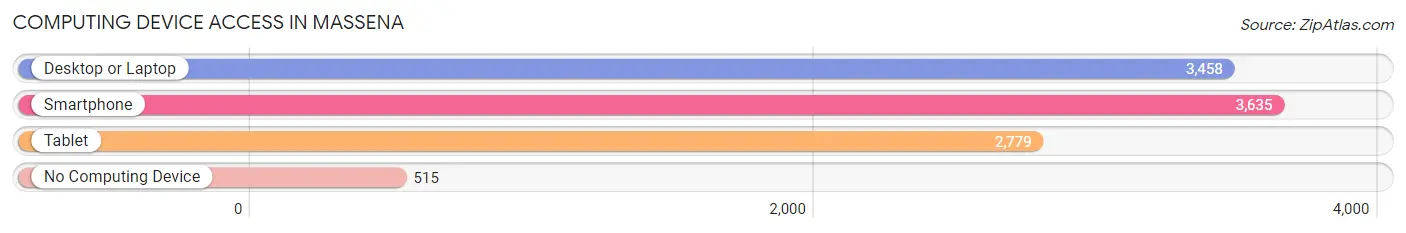
| Device Type | # Households | % Households |
| Desktop or Laptop | 3,458 | 71.4% |
| Smartphone | 3,635 | 75.0% |
| Tablet | 2,779 | 57.4% |
| No Computing Device | 515 | 10.6% |
| Total | 4,845 | 100.0% |
Internet Access in Massena
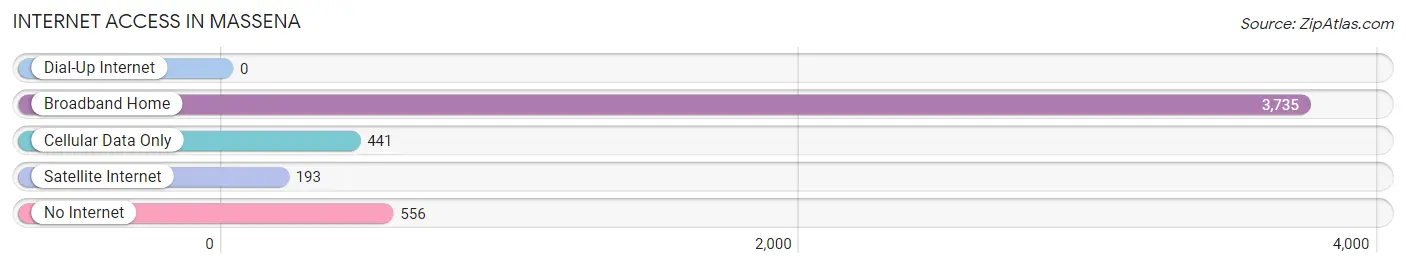
| Internet Type | # Households | % Households |
| Dial-Up Internet | 0 | 0.0% |
| Broadband Home | 3,735 | 77.1% |
| Cellular Data Only | 441 | 9.1% |
| Satellite Internet | 193 | 4.0% |
| No Internet | 556 | 11.5% |
| Total | 4,845 | 100.0% |
Massena Summary
History
The town of Massena, New York is located in St. Lawrence County, in the northern part of the state. It is situated on the St. Lawrence River, near the Canadian border. The town was first settled in 1796 by a group of French-Canadian immigrants, who named it after their leader, Jean-Baptiste Massena. The town was incorporated in 1802, and it quickly became an important trading center for the region.
In the early 19th century, Massena was a major port for the shipping of timber and other goods. It was also a major center for the production of iron ore, which was mined in the nearby Adirondack Mountains. The iron ore was used to make tools and weapons for the military.
In the late 19th century, Massena became an important industrial center. The St. Lawrence River was used to transport goods to and from the Great Lakes, and the town became a major hub for the shipping of goods. The town also became a major center for the production of paper, and it was home to several large paper mills.
In the early 20th century, Massena was a major center for the production of aluminum. The Aluminum Company of America (Alcoa) opened a large plant in the town in 1902, and it quickly became the largest employer in the area. The plant was responsible for the production of aluminum for the military during World War II.
In the late 20th century, Massena experienced a decline in its industrial base. The paper mills and aluminum plant closed, and the town’s economy shifted to tourism and retail. The town is now home to several large retail stores, as well as a casino and a racetrack.
Geography
Massena is located in the northern part of New York State, in St. Lawrence County. It is situated on the St. Lawrence River, near the Canadian border. The town is bordered by the towns of Norfolk to the north, Louisville to the east, and Brasher to the south. The town covers an area of approximately 25 square miles, and it has a population of approximately 10,000 people.
The town is located in a region of rolling hills and forests. The St. Lawrence River forms the western border of the town, and the Grasse River forms the eastern border. The town is home to several small lakes, including Lake Massena and Lake St. Lawrence.
Economy
The economy of Massena is largely based on tourism and retail. The town is home to several large retail stores, including Walmart, Target, and Lowe’s. The town is also home to a casino and a racetrack.
The town is also home to several manufacturing companies, including a paper mill and a plastics factory. The town is also home to a large aluminum plant, which is owned by Alcoa.
Demographics
As of the 2010 census, the population of Massena was 10,085. The racial makeup of the town was 94.3% White, 1.3% African American, 0.7% Native American, 0.7% Asian, 0.1% Pacific Islander, and 2.9% from other races. Hispanic or Latino of any race were 4.2% of the population.
The median household income in Massena was $37,917, and the median family income was $45,938. The per capita income was $19,945. About 16.2% of the population was below the poverty line.
Common Questions
What is the Total Population of Massena?
Total Population of Massena is 10,218.
What is the Total Male Population of Massena?
Total Male Population of Massena is 4,695.
What is the Total Female Population of Massena?
Total Female Population of Massena is 5,523.
What is the Ratio of Males per 100 Females in Massena?
There are 85.01 Males per 100 Females in Massena.
What is the Ratio of Females per 100 Males in Massena?
There are 117.64 Females per 100 Males in Massena.
What is the Median Population Age in Massena?
Median Population Age in Massena is 41.8 Years.
What is the Average Family Size in Massena
Average Family Size in Massena is 2.8 People.
What is the Average Household Size in Massena
Average Household Size in Massena is 2.1 People.
What is Per Capita Income in Massena?
Per Capita income in Massena is $31,452.
What is the Median Family Income in Massena?
Median Family Income in Massena is $62,104.
What is the Median Household income in Massena?
Median Household Income in Massena is $48,161.
What is Income or Wage Gap in Massena?
Income or Wage Gap in Massena is 13.1%.
Women in Massena earn 86.9 cents for every dollar earned by a man.
What is Inequality or Gini Index in Massena?
Inequality or Gini Index in Massena is 0.48.
How Large is the Labor Force in Massena?
There are 4,688 People in the Labor Forcein in Massena.
What is the Percentage of People in the Labor Force in Massena?
55.7% of People are in the Labor Force in Massena.
What is the Unemployment Rate in Massena?
Unemployment Rate in Massena is 6.7%.