Briarcliff Manor, NY
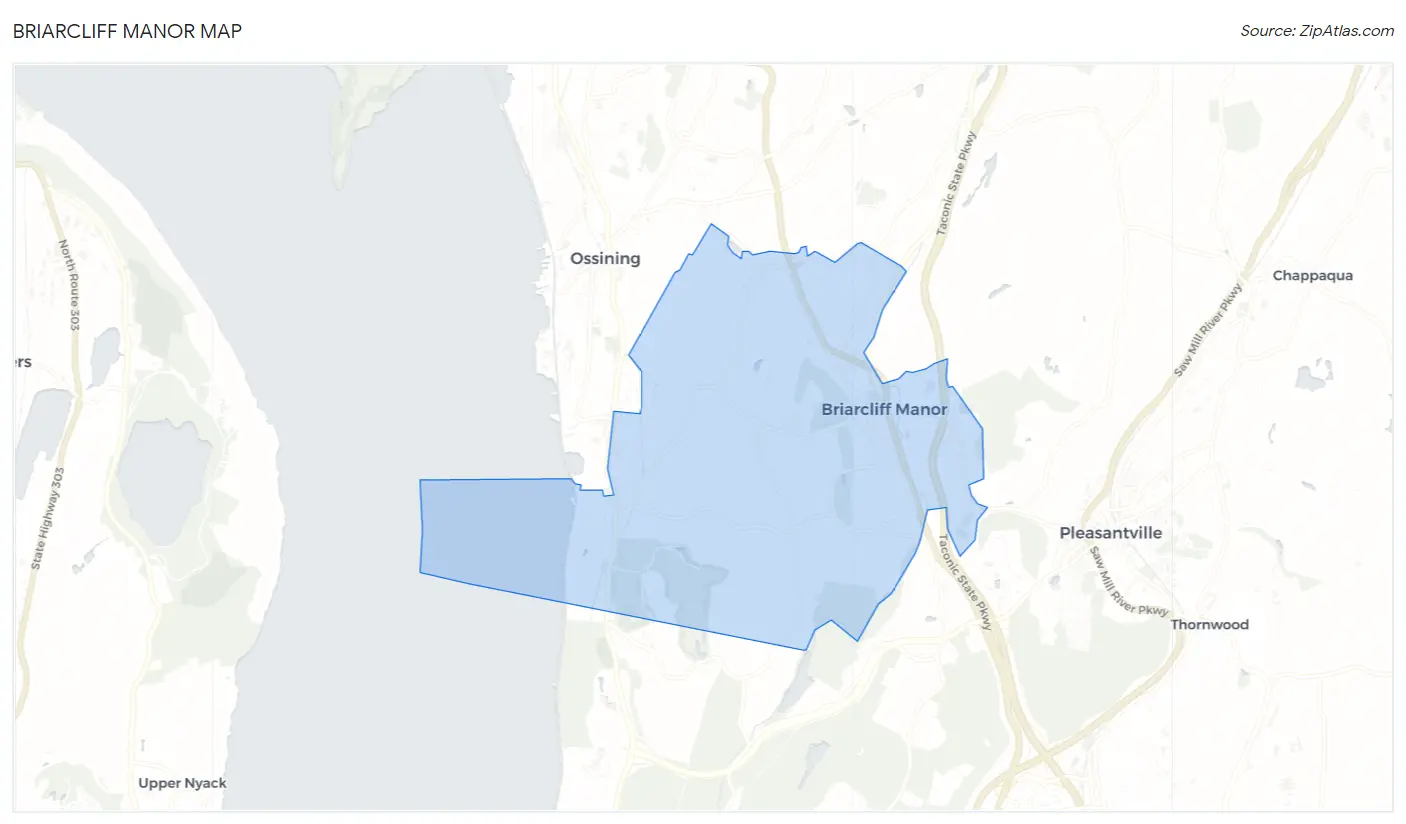
Briarcliff Manor Map
Briarcliff Manor Overview
7,395
TOTAL POPULATION
3,772
MALE POPULATION
3,623
FEMALE POPULATION
104.11
MALES / 100 FEMALES
96.05
FEMALES / 100 MALES
47.7
MEDIAN AGE
3.0
AVG FAMILY SIZE
2.6
AVG HOUSEHOLD SIZE
$111,008
PER CAPITA INCOME
$250,001
AVG FAMILY INCOME
$208,988
AVG HOUSEHOLD INCOME
40.3%
WAGE / INCOME GAP [ % ]
59.7¢/ $1
WAGE / INCOME GAP [ $ ]
$9,725
FAMILY INCOME DEFICIT
0.51
INEQUALITY / GINI INDEX
3,815
LABOR FORCE [ PEOPLE ]
62.3%
PERCENT IN LABOR FORCE
4.0%
UNEMPLOYMENT RATE
Briarcliff Manor Zip Codes
Briarcliff Manor Area Codes
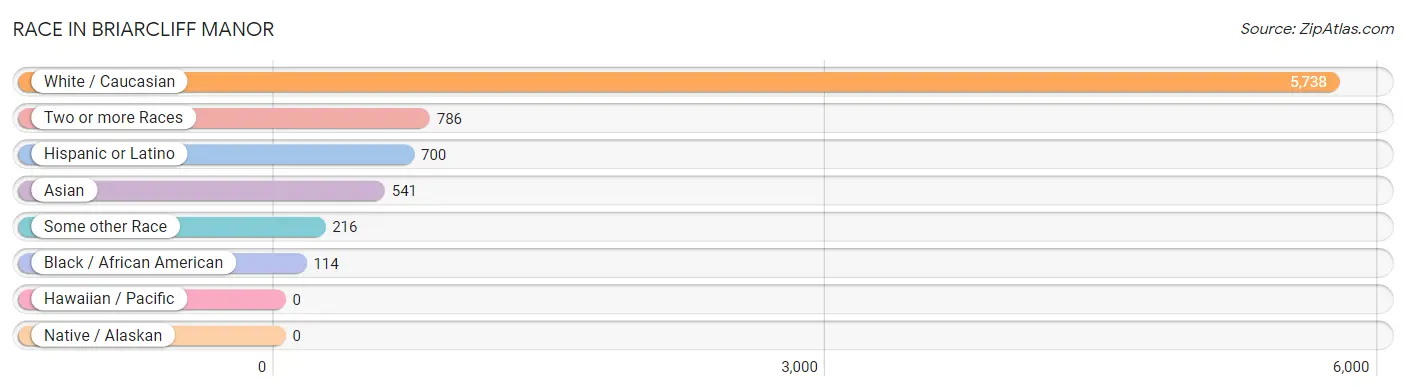
Race in Briarcliff Manor
The most populous races in Briarcliff Manor are White / Caucasian (5,738 | 77.6%), Two or more Races (786 | 10.6%), and Hispanic or Latino (700 | 9.5%).
| Race | # Population | % Population |
| Asian | 541 | 7.3% |
| Black / African American | 114 | 1.5% |
| Hawaiian / Pacific | 0 | 0.0% |
| Hispanic or Latino | 700 | 9.5% |
| Native / Alaskan | 0 | 0.0% |
| White / Caucasian | 5,738 | 77.6% |
| Two or more Races | 786 | 10.6% |
| Some other Race | 216 | 2.9% |
| Total | 7,395 | 100.0% |
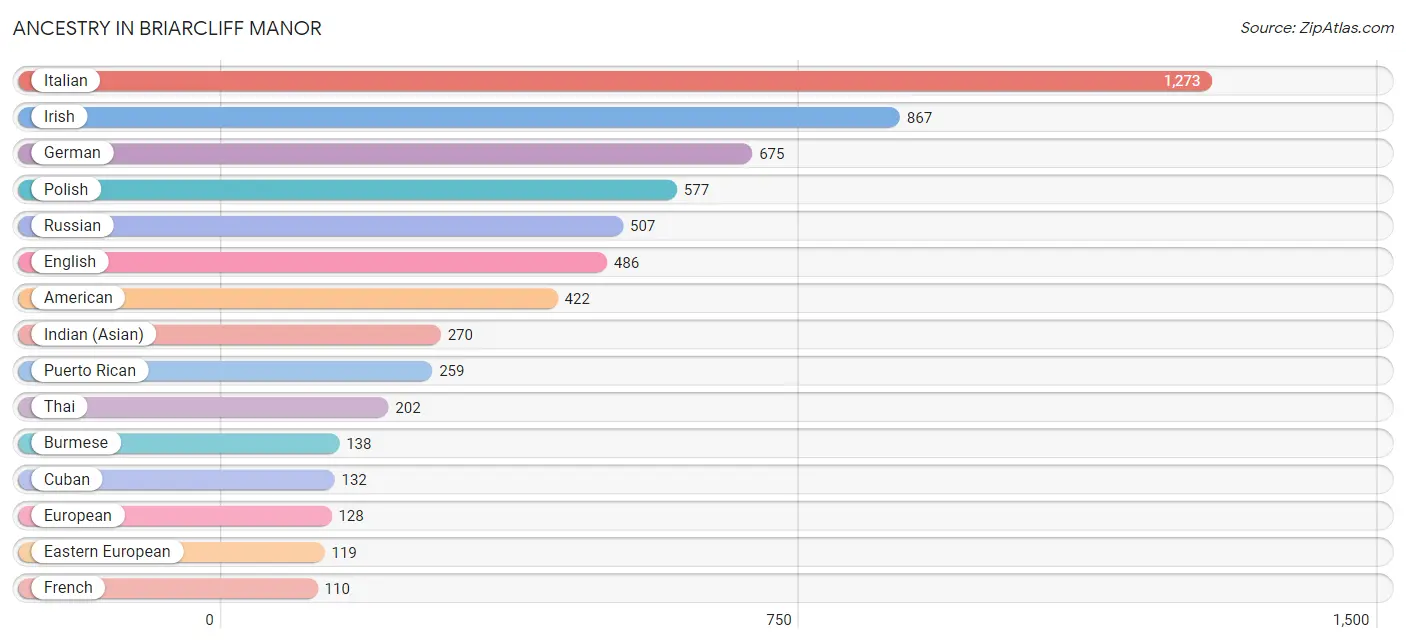
Ancestry in Briarcliff Manor
The most populous ancestries reported in Briarcliff Manor are Italian (1,273 | 17.2%), Irish (867 | 11.7%), German (675 | 9.1%), Polish (577 | 7.8%), and Russian (507 | 6.9%), together accounting for 52.7% of all Briarcliff Manor residents.
| Ancestry | # Population | % Population |
| Albanian | 82 | 1.1% |
| American | 422 | 5.7% |
| Arab | 62 | 0.8% |
| Argentinean | 21 | 0.3% |
| Armenian | 22 | 0.3% |
| Australian | 21 | 0.3% |
| Austrian | 51 | 0.7% |
| Belgian | 34 | 0.5% |
| Bhutanese | 54 | 0.7% |
| Bolivian | 21 | 0.3% |
| Brazilian | 70 | 0.9% |
| British | 91 | 1.2% |
| Burmese | 138 | 1.9% |
| Canadian | 7 | 0.1% |
| Celtic | 10 | 0.1% |
| Central American | 38 | 0.5% |
| Colombian | 14 | 0.2% |
| Croatian | 4 | 0.1% |
| Cuban | 132 | 1.8% |
| Danish | 37 | 0.5% |
| Dominican | 2 | 0.0% |
| Dutch | 63 | 0.9% |
| Eastern European | 119 | 1.6% |
| Ecuadorian | 26 | 0.4% |
| English | 486 | 6.6% |
| European | 128 | 1.7% |
| French | 110 | 1.5% |
| French Canadian | 19 | 0.3% |
| German | 675 | 9.1% |
| Greek | 8 | 0.1% |
| Guatemalan | 38 | 0.5% |
| Guyanese | 12 | 0.2% |
| Haitian | 45 | 0.6% |
| Hungarian | 85 | 1.1% |
| Indian (Asian) | 270 | 3.6% |
| Iranian | 71 | 1.0% |
| Irish | 867 | 11.7% |
| Italian | 1,273 | 17.2% |
| Jamaican | 7 | 0.1% |
| Korean | 8 | 0.1% |
| Laotian | 10 | 0.1% |
| Lebanese | 17 | 0.2% |
| Lithuanian | 74 | 1.0% |
| Mexican | 68 | 0.9% |
| Norwegian | 72 | 1.0% |
| Palestinian | 35 | 0.5% |
| Polish | 577 | 7.8% |
| Portuguese | 108 | 1.5% |
| Puerto Rican | 259 | 3.5% |
| Romanian | 82 | 1.1% |
| Russian | 507 | 6.9% |
| Scotch-Irish | 37 | 0.5% |
| Scottish | 110 | 1.5% |
| Serbian | 8 | 0.1% |
| Slovak | 21 | 0.3% |
| Slovene | 7 | 0.1% |
| South American | 82 | 1.1% |
| Spaniard | 71 | 1.0% |
| Swedish | 16 | 0.2% |
| Thai | 202 | 2.7% |
| Turkish | 33 | 0.4% |
| Ukrainian | 19 | 0.3% |
| Welsh | 33 | 0.4% |
| West Indian | 3 | 0.0% |
| Yugoslavian | 18 | 0.2% | View All 65 Rows |
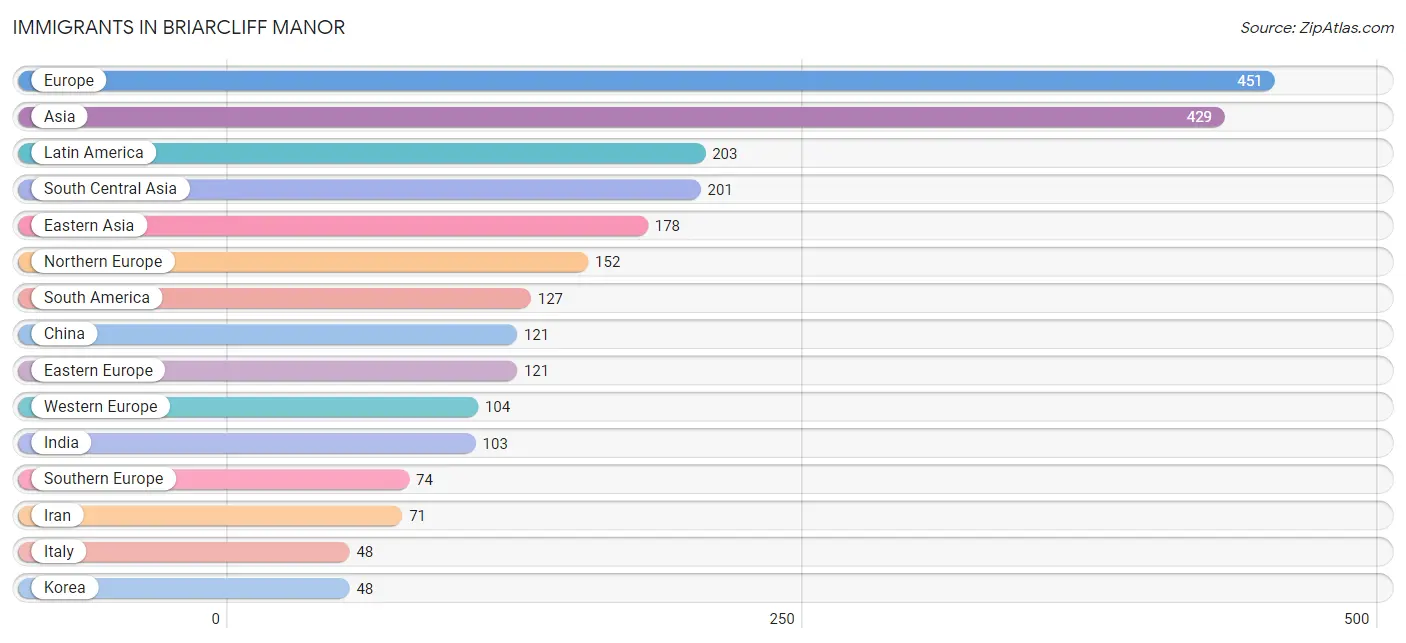
Immigrants in Briarcliff Manor
The most numerous immigrant groups reported in Briarcliff Manor came from Europe (451 | 6.1%), Asia (429 | 5.8%), Latin America (203 | 2.8%), South Central Asia (201 | 2.7%), and Eastern Asia (178 | 2.4%), together accounting for 19.8% of all Briarcliff Manor residents.
| Immigration Origin | # Population | % Population |
| Africa | 29 | 0.4% |
| Argentina | 11 | 0.2% |
| Asia | 429 | 5.8% |
| Austria | 11 | 0.2% |
| Barbados | 3 | 0.0% |
| Belgium | 8 | 0.1% |
| Bolivia | 20 | 0.3% |
| Brazil | 30 | 0.4% |
| Canada | 17 | 0.2% |
| Caribbean | 30 | 0.4% |
| Central America | 46 | 0.6% |
| China | 121 | 1.6% |
| Colombia | 24 | 0.3% |
| Cuba | 13 | 0.2% |
| Eastern Asia | 178 | 2.4% |
| Eastern Europe | 121 | 1.6% |
| Ecuador | 9 | 0.1% |
| El Salvador | 14 | 0.2% |
| England | 29 | 0.4% |
| Europe | 451 | 6.1% |
| France | 42 | 0.6% |
| Germany | 43 | 0.6% |
| Greece | 8 | 0.1% |
| Guatemala | 24 | 0.3% |
| Guyana | 7 | 0.1% |
| Hong Kong | 21 | 0.3% |
| India | 103 | 1.4% |
| Iran | 71 | 1.0% |
| Ireland | 8 | 0.1% |
| Italy | 48 | 0.6% |
| Jamaica | 7 | 0.1% |
| Japan | 9 | 0.1% |
| Jordan | 5 | 0.1% |
| Korea | 48 | 0.6% |
| Latin America | 203 | 2.8% |
| Mexico | 8 | 0.1% |
| Middle Africa | 29 | 0.4% |
| Northern Europe | 152 | 2.1% |
| Norway | 4 | 0.1% |
| Pakistan | 15 | 0.2% |
| Philippines | 8 | 0.1% |
| Poland | 36 | 0.5% |
| Portugal | 18 | 0.2% |
| Romania | 12 | 0.2% |
| Russia | 31 | 0.4% |
| Serbia | 8 | 0.1% |
| Singapore | 6 | 0.1% |
| South America | 127 | 1.7% |
| South Central Asia | 201 | 2.7% |
| South Eastern Asia | 14 | 0.2% |
| Southern Europe | 74 | 1.0% |
| Sri Lanka | 12 | 0.2% |
| Taiwan | 38 | 0.5% |
| Trinidad and Tobago | 7 | 0.1% |
| Turkey | 21 | 0.3% |
| Venezuela | 26 | 0.4% |
| Western Asia | 26 | 0.4% |
| Western Europe | 104 | 1.4% |
| Zaire | 10 | 0.1% | View All 59 Rows |
Sex and Age in Briarcliff Manor
Sex and Age in Briarcliff Manor
The most populous age groups in Briarcliff Manor are 15 to 19 Years (337 | 8.9%) for men and 50 to 54 Years (358 | 9.9%) for women.
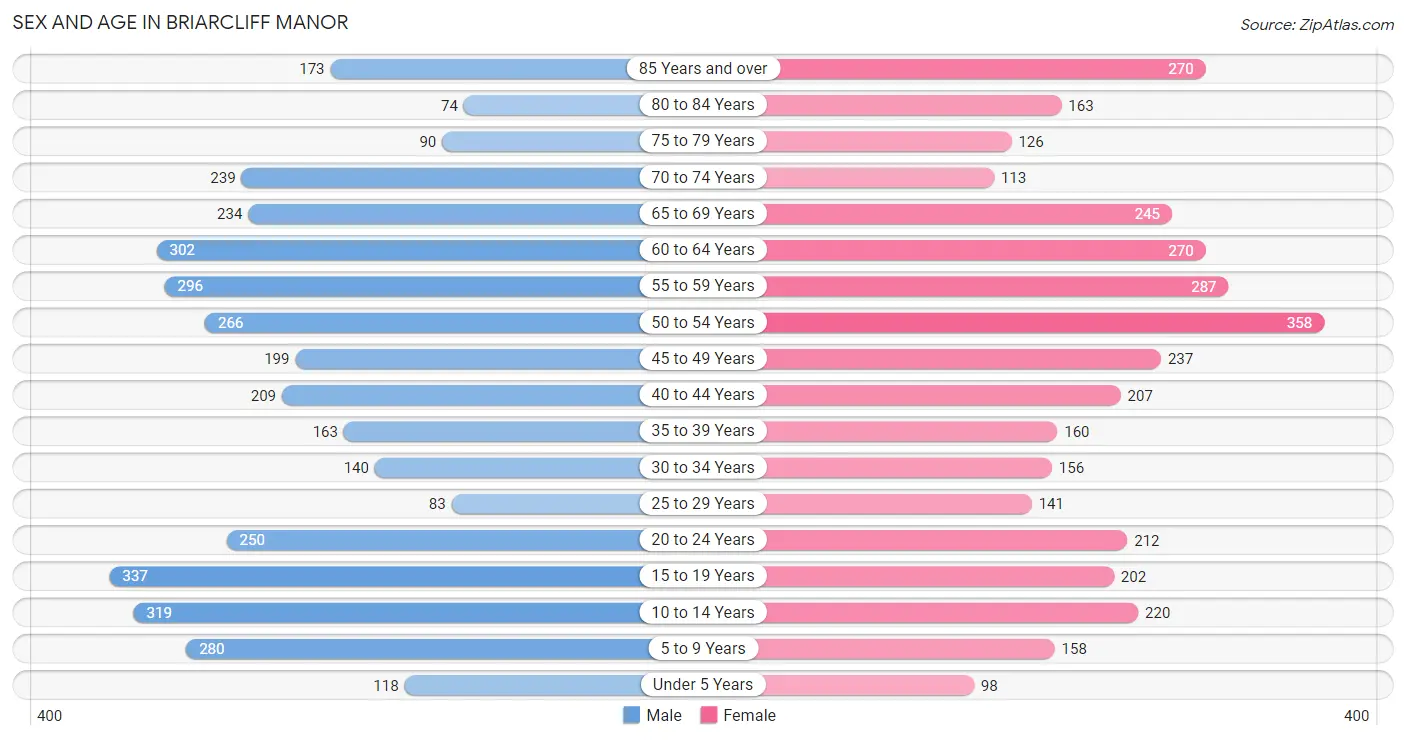
| Age Bracket | Male | Female |
| Under 5 Years | 118 (3.1%) | 98 (2.7%) |
| 5 to 9 Years | 280 (7.4%) | 158 (4.4%) |
| 10 to 14 Years | 319 (8.5%) | 220 (6.1%) |
| 15 to 19 Years | 337 (8.9%) | 202 (5.6%) |
| 20 to 24 Years | 250 (6.6%) | 212 (5.9%) |
| 25 to 29 Years | 83 (2.2%) | 141 (3.9%) |
| 30 to 34 Years | 140 (3.7%) | 156 (4.3%) |
| 35 to 39 Years | 163 (4.3%) | 160 (4.4%) |
| 40 to 44 Years | 209 (5.5%) | 207 (5.7%) |
| 45 to 49 Years | 199 (5.3%) | 237 (6.5%) |
| 50 to 54 Years | 266 (7.0%) | 358 (9.9%) |
| 55 to 59 Years | 296 (7.9%) | 287 (7.9%) |
| 60 to 64 Years | 302 (8.0%) | 270 (7.4%) |
| 65 to 69 Years | 234 (6.2%) | 245 (6.8%) |
| 70 to 74 Years | 239 (6.3%) | 113 (3.1%) |
| 75 to 79 Years | 90 (2.4%) | 126 (3.5%) |
| 80 to 84 Years | 74 (2.0%) | 163 (4.5%) |
| 85 Years and over | 173 (4.6%) | 270 (7.4%) |
| Total | 3,772 (100.0%) | 3,623 (100.0%) |
Families and Households in Briarcliff Manor
Median Family Size in Briarcliff Manor
The median family size in Briarcliff Manor is 3.03 persons per family, with married-couple families (1,923 | 89.7%) accounting for the largest median family size of 3.06 persons per family. On the other hand, single male/father families (97 | 4.5%) represent the smallest median family size with 2.45 persons per family.
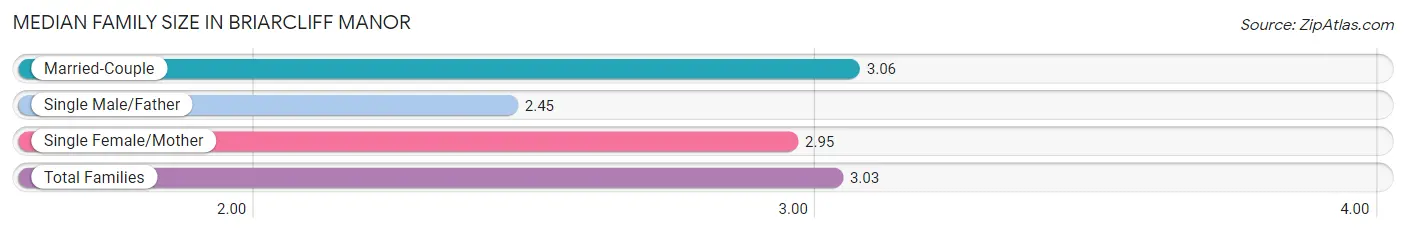
| Family Type | # Families | Family Size |
| Married-Couple | 1,923 (89.7%) | 3.06 |
| Single Male/Father | 97 (4.5%) | 2.45 |
| Single Female/Mother | 123 (5.7%) | 2.95 |
| Total Families | 2,143 (100.0%) | 3.03 |
Median Household Size in Briarcliff Manor
The median household size in Briarcliff Manor is 2.63 persons per household, with married-couple households (1,923 | 71.0%) accounting for the largest median household size of 3.07 persons per household. non-family households (566 | 20.9%) represent the smallest median household size with 1.10 persons per household.
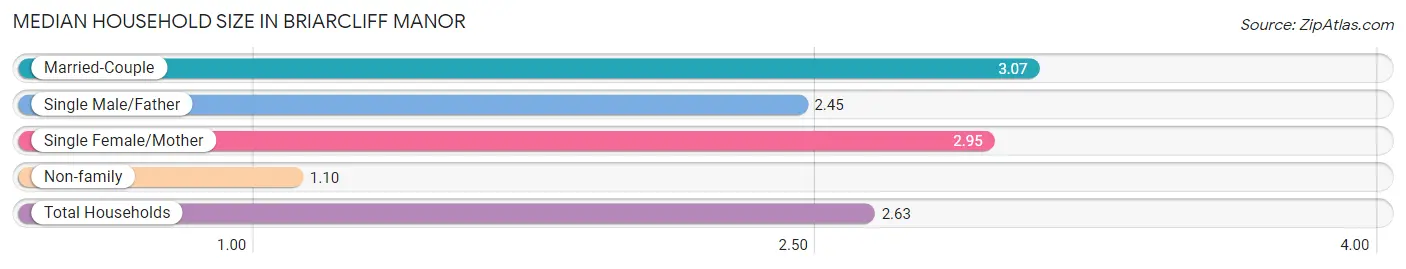
| Household Type | # Households | Household Size |
| Married-Couple | 1,923 (71.0%) | 3.07 |
| Single Male/Father | 97 (3.6%) | 2.45 |
| Single Female/Mother | 123 (4.5%) | 2.95 |
| Non-family | 566 (20.9%) | 1.10 |
| Total Households | 2,709 (100.0%) | 2.63 |
Household Size by Marriage Status in Briarcliff Manor
Out of a total of 2,709 households in Briarcliff Manor, 2,143 (79.1%) are family households, while 566 (20.9%) are nonfamily households. The most numerous type of family households are 2-person households, comprising 926, and the most common type of nonfamily households are 1-person households, comprising 512.
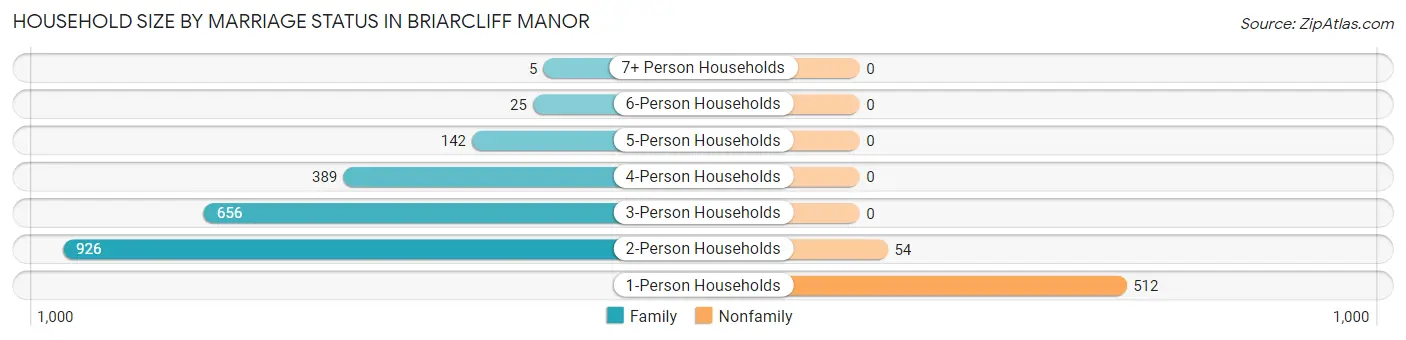
| Household Size | Family Households | Nonfamily Households |
| 1-Person Households | - | 512 (18.9%) |
| 2-Person Households | 926 (34.2%) | 54 (2.0%) |
| 3-Person Households | 656 (24.2%) | 0 (0.0%) |
| 4-Person Households | 389 (14.4%) | 0 (0.0%) |
| 5-Person Households | 142 (5.2%) | 0 (0.0%) |
| 6-Person Households | 25 (0.9%) | 0 (0.0%) |
| 7+ Person Households | 5 (0.2%) | 0 (0.0%) |
| Total | 2,143 (79.1%) | 566 (20.9%) |
Female Fertility in Briarcliff Manor
Fertility by Age in Briarcliff Manor
Average fertility rate in Briarcliff Manor is 26.0 births per 1,000 women. Women in the age bracket of 20 to 34 years have the highest fertility rate with 45.0 births per 1,000 women. Women in the age bracket of 20 to 34 years acount for 65.7% of all women with births.
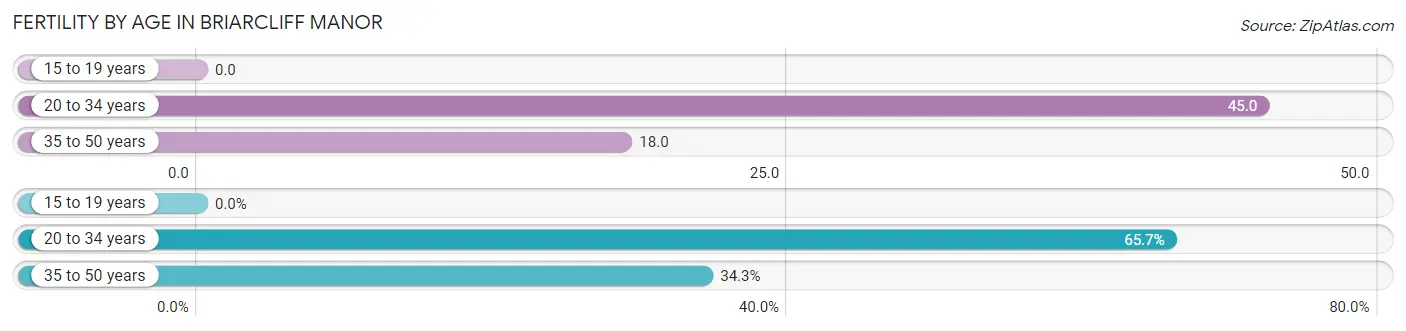
| Age Bracket | Women with Births | Births / 1,000 Women |
| 15 to 19 years | 0 (0.0%) | 0.0 |
| 20 to 34 years | 23 (65.7%) | 45.0 |
| 35 to 50 years | 12 (34.3%) | 18.0 |
| Total | 35 (100.0%) | 26.0 |
Fertility by Age by Marriage Status in Briarcliff Manor
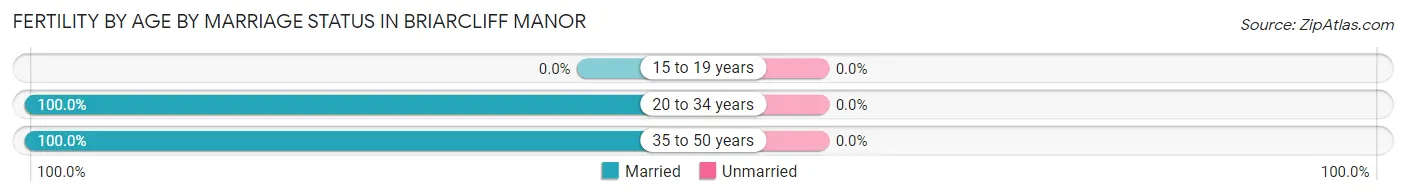
| Age Bracket | Married | Unmarried |
| 15 to 19 years | 0 (0.0%) | 0 (0.0%) |
| 20 to 34 years | 23 (100.0%) | 0 (0.0%) |
| 35 to 50 years | 12 (100.0%) | 0 (0.0%) |
| Total | 35 (100.0%) | 0 (0.0%) |
Fertility by Education in Briarcliff Manor
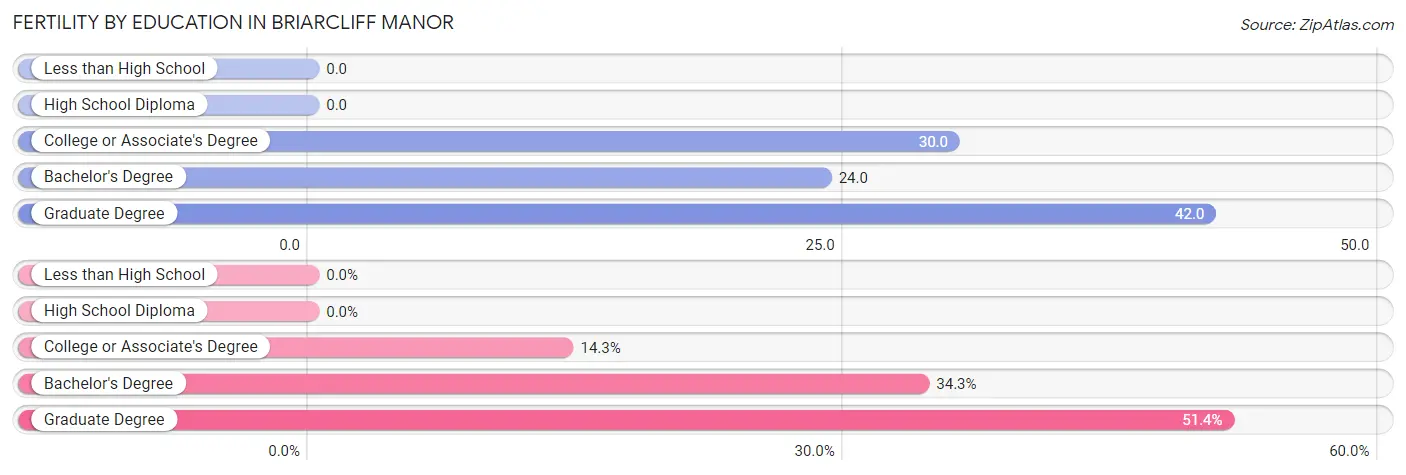
| Educational Attainment | Women with Births | Births / 1,000 Women |
| Less than High School | 0 (0.0%) | 0.0 |
| High School Diploma | 0 (0.0%) | 0.0 |
| College or Associate's Degree | 5 (14.3%) | 30.0 |
| Bachelor's Degree | 12 (34.3%) | 24.0 |
| Graduate Degree | 18 (51.4%) | 42.0 |
| Total | 35 (100.0%) | 26.0 |
Fertility by Education by Marriage Status in Briarcliff Manor
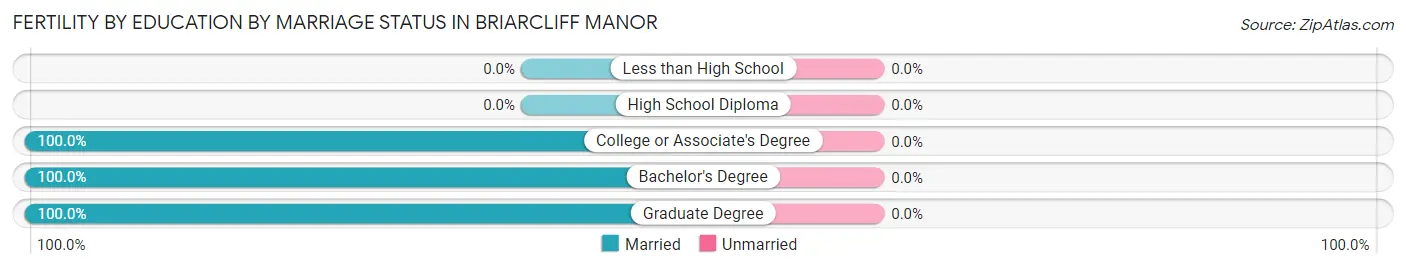
| Educational Attainment | Married | Unmarried |
| Less than High School | 0 (0.0%) | 0 (0.0%) |
| High School Diploma | 0 (0.0%) | 0 (0.0%) |
| College or Associate's Degree | 5 (100.0%) | 0 (0.0%) |
| Bachelor's Degree | 12 (100.0%) | 0 (0.0%) |
| Graduate Degree | 18 (100.0%) | 0 (0.0%) |
| Total | 35 (100.0%) | 0 (0.0%) |
Income in Briarcliff Manor
Income Overview in Briarcliff Manor
Per Capita Income in Briarcliff Manor is $111,008, while median incomes of families and households are $250,001 and $208,988 respectively.
| Characteristic | Number | Measure |
| Per Capita Income | 7,395 | $111,008 |
| Median Family Income | 2,143 | $250,001 |
| Mean Family Income | 2,143 | $344,249 |
| Median Household Income | 2,709 | $208,988 |
| Mean Household Income | 2,709 | $297,882 |
| Income Deficit | 2,143 | $9,725 |
| Wage / Income Gap (%) | 7,395 | 40.27% |
| Wage / Income Gap ($) | 7,395 | 59.73¢ per $1 |
| Gini / Inequality Index | 7,395 | 0.51 |
Earnings by Sex in Briarcliff Manor
Average Earnings in Briarcliff Manor are $101,218, $118,073 for men and $70,529 for women, a difference of 40.3%.
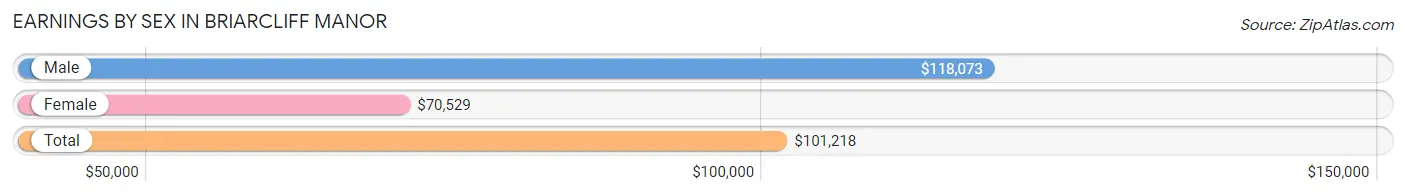
| Sex | Number | Average Earnings |
| Male | 2,197 (54.7%) | $118,073 |
| Female | 1,817 (45.3%) | $70,529 |
| Total | 4,014 (100.0%) | $101,218 |
Earnings by Sex by Income Bracket in Briarcliff Manor
The most common earnings brackets in Briarcliff Manor are $100,000+ for men (1,335 | 60.8%) and $100,000+ for women (691 | 38.0%).
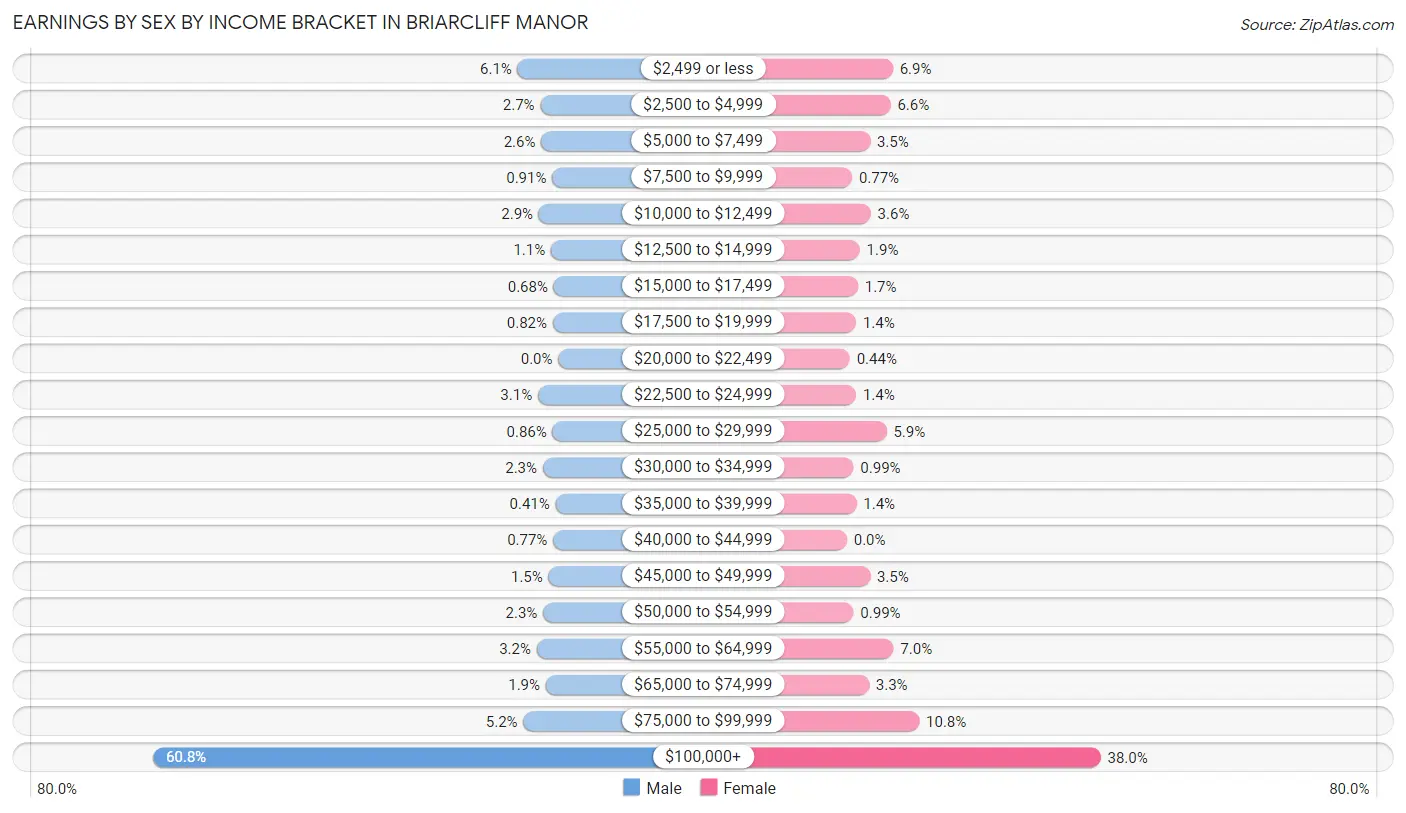
| Income | Male | Female |
| $2,499 or less | 134 (6.1%) | 125 (6.9%) |
| $2,500 to $4,999 | 59 (2.7%) | 119 (6.6%) |
| $5,000 to $7,499 | 56 (2.5%) | 63 (3.5%) |
| $7,500 to $9,999 | 20 (0.9%) | 14 (0.8%) |
| $10,000 to $12,499 | 64 (2.9%) | 65 (3.6%) |
| $12,500 to $14,999 | 24 (1.1%) | 35 (1.9%) |
| $15,000 to $17,499 | 15 (0.7%) | 30 (1.7%) |
| $17,500 to $19,999 | 18 (0.8%) | 25 (1.4%) |
| $20,000 to $22,499 | 0 (0.0%) | 8 (0.4%) |
| $22,500 to $24,999 | 67 (3.0%) | 25 (1.4%) |
| $25,000 to $29,999 | 19 (0.9%) | 108 (5.9%) |
| $30,000 to $34,999 | 51 (2.3%) | 18 (1.0%) |
| $35,000 to $39,999 | 9 (0.4%) | 26 (1.4%) |
| $40,000 to $44,999 | 17 (0.8%) | 0 (0.0%) |
| $45,000 to $49,999 | 32 (1.5%) | 63 (3.5%) |
| $50,000 to $54,999 | 50 (2.3%) | 18 (1.0%) |
| $55,000 to $64,999 | 71 (3.2%) | 127 (7.0%) |
| $65,000 to $74,999 | 41 (1.9%) | 60 (3.3%) |
| $75,000 to $99,999 | 115 (5.2%) | 197 (10.8%) |
| $100,000+ | 1,335 (60.8%) | 691 (38.0%) |
| Total | 2,197 (100.0%) | 1,817 (100.0%) |
Earnings by Sex by Educational Attainment in Briarcliff Manor
Average earnings in Briarcliff Manor are $157,132 for men and $92,847 for women, a difference of 40.9%. Men with an educational attainment of graduate degree enjoy the highest average annual earnings of $227,031, while those with college or associate's degree education earn the least with $115,673. Women with an educational attainment of graduate degree earn the most with the average annual earnings of $143,162, while those with high school diploma education have the smallest earnings of $30,000.
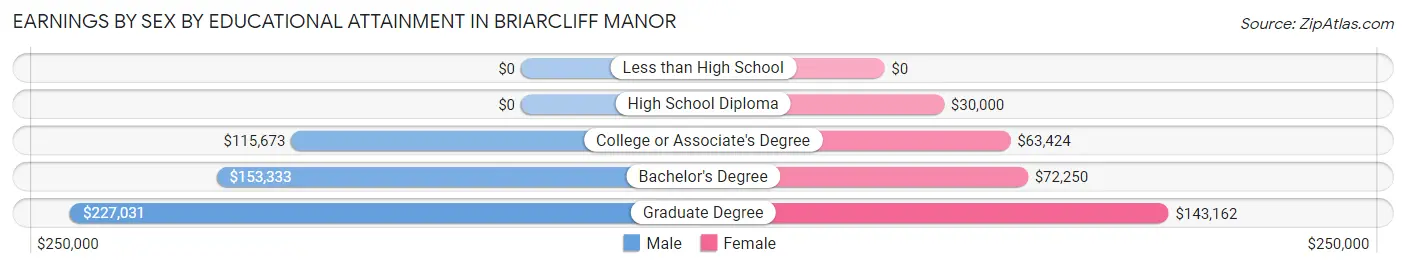
| Educational Attainment | Male Income | Female Income |
| Less than High School | - | - |
| High School Diploma | - | - |
| College or Associate's Degree | $115,673 | $63,424 |
| Bachelor's Degree | $153,333 | $72,250 |
| Graduate Degree | $227,031 | $143,162 |
| Total | $157,132 | $92,847 |
Family Income in Briarcliff Manor
Family Income Brackets in Briarcliff Manor
According to the Briarcliff Manor family income data, there are 1,292 families falling into the $200,000+ income range, which is the most common income bracket and makes up 60.3% of all families. Conversely, the $10,000 to $14,999 income bracket is the least frequent group with only 9 families (0.4%) belonging to this category.
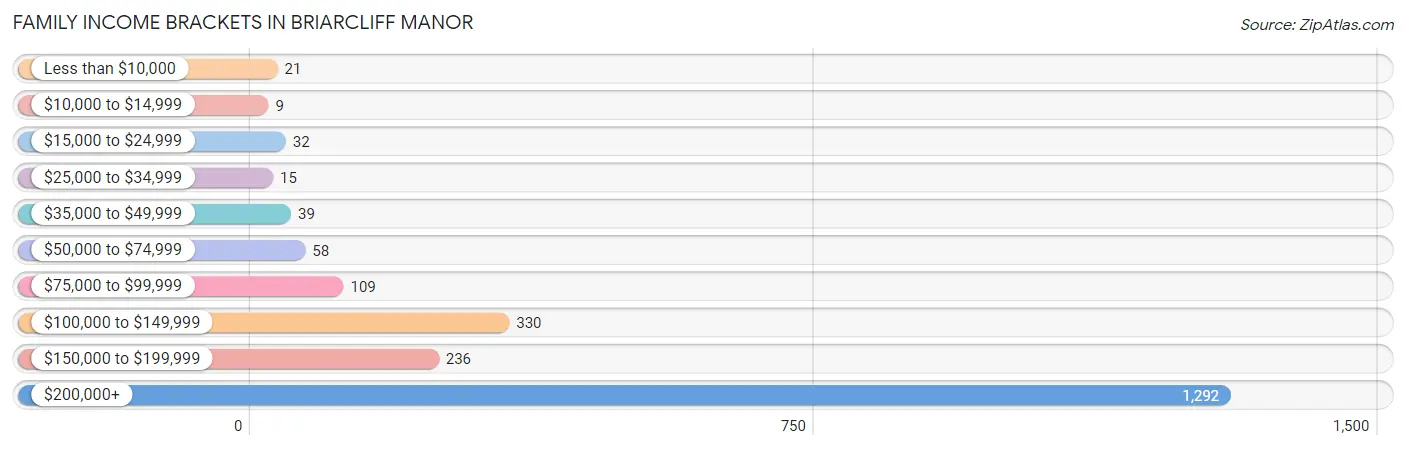
| Income Bracket | # Families | % Families |
| Less than $10,000 | 21 | 1.0% |
| $10,000 to $14,999 | 9 | 0.4% |
| $15,000 to $24,999 | 32 | 1.5% |
| $25,000 to $34,999 | 15 | 0.7% |
| $35,000 to $49,999 | 39 | 1.8% |
| $50,000 to $74,999 | 58 | 2.7% |
| $75,000 to $99,999 | 109 | 5.1% |
| $100,000 to $149,999 | 330 | 15.4% |
| $150,000 to $199,999 | 236 | 11.0% |
| $200,000+ | 1,292 | 60.3% |
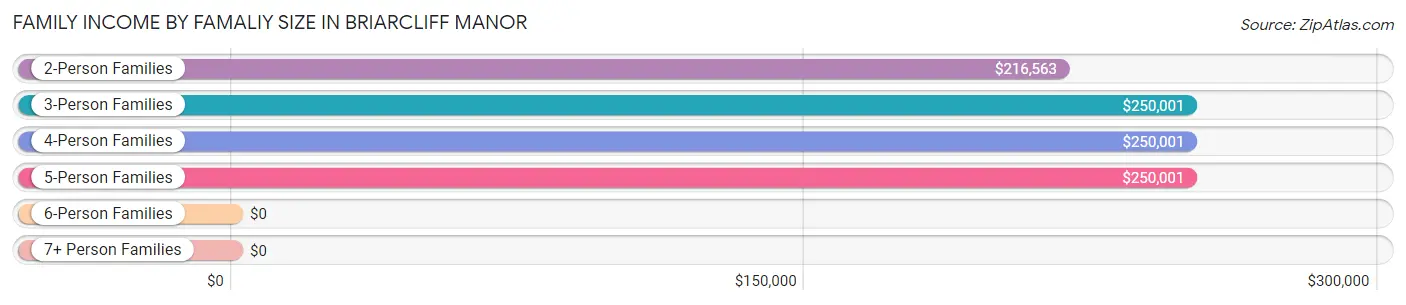
Family Income by Famaliy Size in Briarcliff Manor
3-person families (669 | 31.2%) account for the highest median family income in Briarcliff Manor with $250,001 per family, while 2-person families (926 | 43.2%) have the highest median income of $108,282 per family member.
| Income Bracket | # Families | Median Income |
| 2-Person Families | 926 (43.2%) | $216,563 |
| 3-Person Families | 669 (31.2%) | $250,001 |
| 4-Person Families | 376 (17.5%) | $250,001 |
| 5-Person Families | 142 (6.6%) | $250,001 |
| 6-Person Families | 25 (1.2%) | $0 |
| 7+ Person Families | 5 (0.2%) | $0 |
| Total | 2,143 (100.0%) | $250,001 |
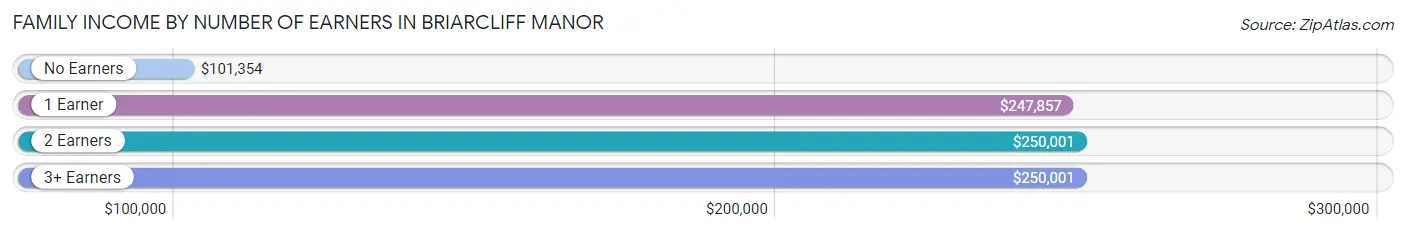
Family Income by Number of Earners in Briarcliff Manor
The median family income in Briarcliff Manor is $250,001, with families comprising 2 earners (871) having the highest median family income of $250,001, while families with no earners (296) have the lowest median family income of $101,354, accounting for 40.6% and 13.8% of families, respectively.
| Number of Earners | # Families | Median Income |
| No Earners | 296 (13.8%) | $101,354 |
| 1 Earner | 636 (29.7%) | $247,857 |
| 2 Earners | 871 (40.6%) | $250,001 |
| 3+ Earners | 340 (15.9%) | $250,001 |
| Total | 2,143 (100.0%) | $250,001 |
Household Income in Briarcliff Manor
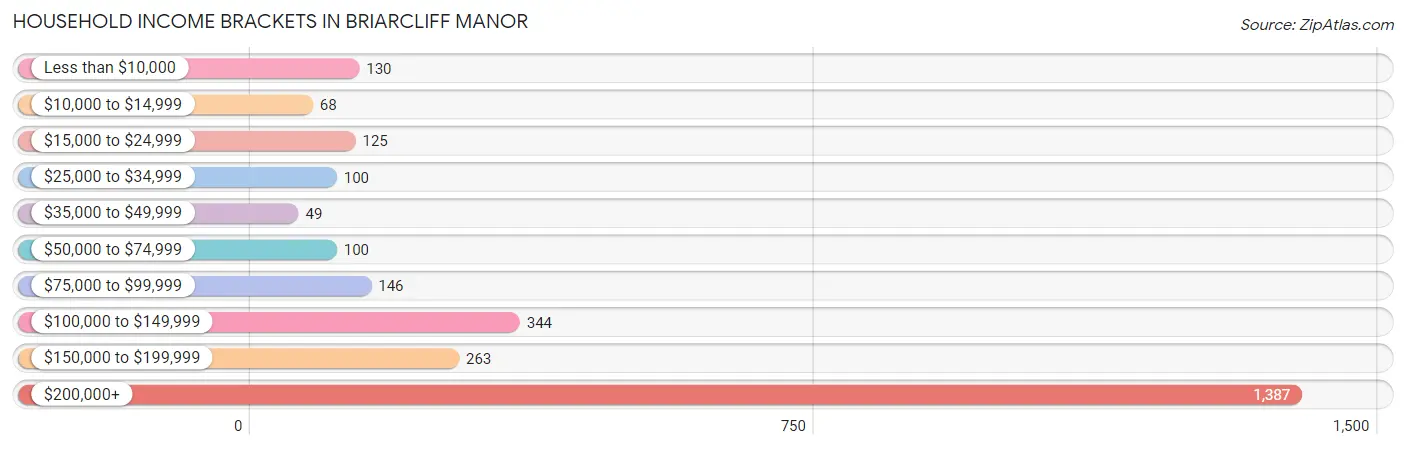
Household Income Brackets in Briarcliff Manor
With 1,387 households falling in the category, the $200,000+ income range is the most frequent in Briarcliff Manor, accounting for 51.2% of all households. In contrast, only 49 households (1.8%) fall into the $35,000 to $49,999 income bracket, making it the least populous group.
| Income Bracket | # Households | % Households |
| Less than $10,000 | 130 | 4.8% |
| $10,000 to $14,999 | 68 | 2.5% |
| $15,000 to $24,999 | 125 | 4.6% |
| $25,000 to $34,999 | 100 | 3.7% |
| $35,000 to $49,999 | 49 | 1.8% |
| $50,000 to $74,999 | 100 | 3.7% |
| $75,000 to $99,999 | 146 | 5.4% |
| $100,000 to $149,999 | 344 | 12.7% |
| $150,000 to $199,999 | 263 | 9.7% |
| $200,000+ | 1,387 | 51.2% |
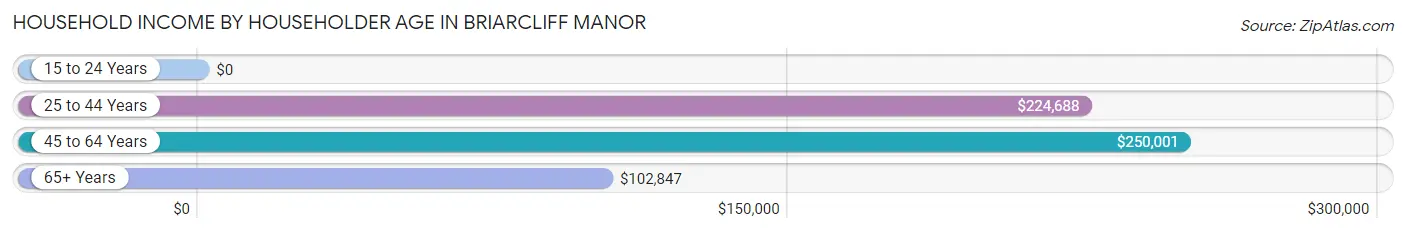
Household Income by Householder Age in Briarcliff Manor
The median household income in Briarcliff Manor is $208,988, with the highest median household income of $250,001 found in the 45 to 64 years age bracket for the primary householder. A total of 1,207 households (44.6%) fall into this category.
| Income Bracket | # Households | Median Income |
| 15 to 24 Years | 0 (0.0%) | $0 |
| 25 to 44 Years | 505 (18.6%) | $224,688 |
| 45 to 64 Years | 1,207 (44.6%) | $250,001 |
| 65+ Years | 997 (36.8%) | $102,847 |
| Total | 2,709 (100.0%) | $208,988 |
Poverty in Briarcliff Manor
Income Below Poverty by Sex and Age in Briarcliff Manor
With 5.7% poverty level for males and 7.2% for females among the residents of Briarcliff Manor, 5 year old males and 75 year old and over females are the most vulnerable to poverty, with 45 males (39.5%) and 84 females (16.3%) in their respective age groups living below the poverty level.
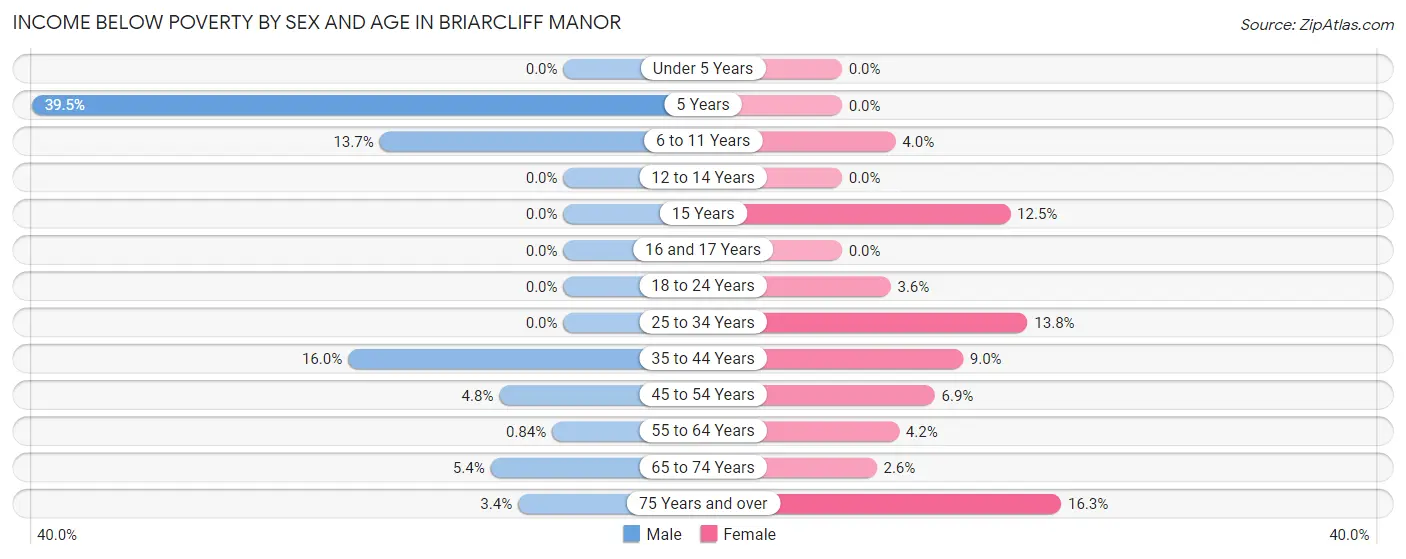
| Age Bracket | Male | Female |
| Under 5 Years | 0 (0.0%) | 0 (0.0%) |
| 5 Years | 45 (39.5%) | 0 (0.0%) |
| 6 to 11 Years | 43 (13.7%) | 8 (4.0%) |
| 12 to 14 Years | 0 (0.0%) | 0 (0.0%) |
| 15 Years | 0 (0.0%) | 7 (12.5%) |
| 16 and 17 Years | 0 (0.0%) | 0 (0.0%) |
| 18 to 24 Years | 0 (0.0%) | 8 (3.6%) |
| 25 to 34 Years | 0 (0.0%) | 39 (13.8%) |
| 35 to 44 Years | 59 (16.0%) | 33 (9.0%) |
| 45 to 54 Years | 22 (4.8%) | 41 (6.9%) |
| 55 to 64 Years | 5 (0.8%) | 23 (4.2%) |
| 65 to 74 Years | 24 (5.4%) | 9 (2.6%) |
| 75 Years and over | 11 (3.4%) | 84 (16.3%) |
| Total | 209 (5.7%) | 252 (7.2%) |
Income Above Poverty by Sex and Age in Briarcliff Manor
According to the poverty statistics in Briarcliff Manor, males aged under 5 years and females aged under 5 years are the age groups that are most secure financially, with 100.0% of males and 100.0% of females in these age groups living above the poverty line.
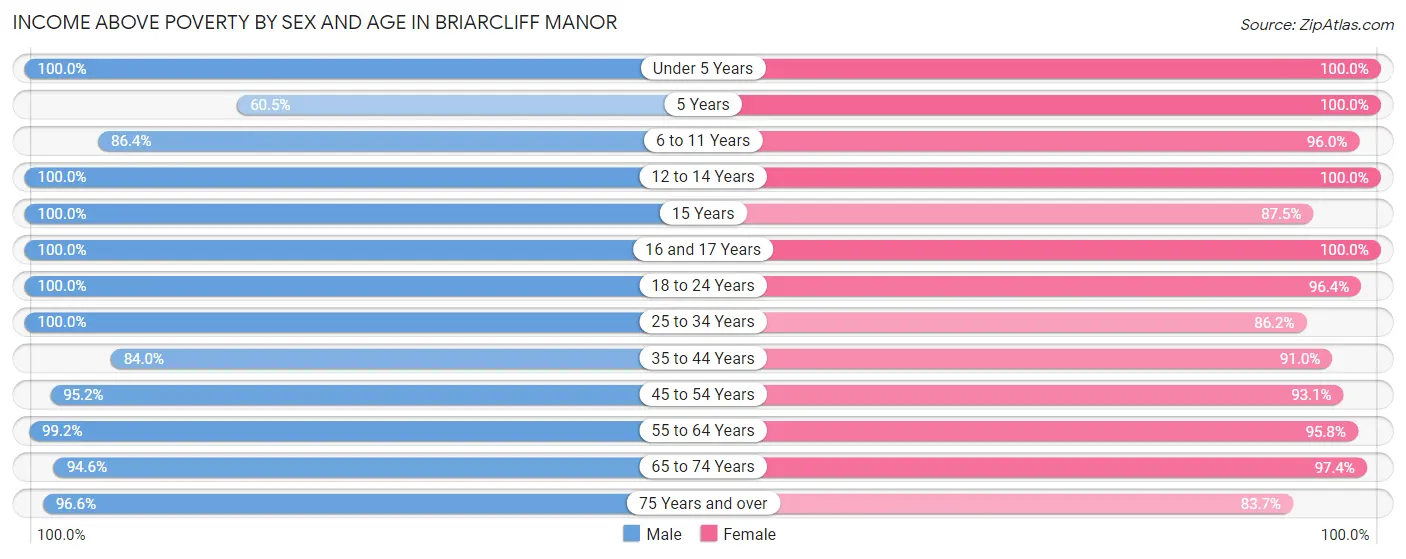
| Age Bracket | Male | Female |
| Under 5 Years | 118 (100.0%) | 98 (100.0%) |
| 5 Years | 69 (60.5%) | 77 (100.0%) |
| 6 to 11 Years | 272 (86.4%) | 193 (96.0%) |
| 12 to 14 Years | 170 (100.0%) | 100 (100.0%) |
| 15 Years | 23 (100.0%) | 49 (87.5%) |
| 16 and 17 Years | 177 (100.0%) | 112 (100.0%) |
| 18 to 24 Years | 308 (100.0%) | 213 (96.4%) |
| 25 to 34 Years | 217 (100.0%) | 244 (86.2%) |
| 35 to 44 Years | 310 (84.0%) | 334 (91.0%) |
| 45 to 54 Years | 440 (95.2%) | 554 (93.1%) |
| 55 to 64 Years | 593 (99.2%) | 519 (95.8%) |
| 65 to 74 Years | 420 (94.6%) | 340 (97.4%) |
| 75 Years and over | 315 (96.6%) | 432 (83.7%) |
| Total | 3,432 (94.3%) | 3,265 (92.8%) |
Income Below Poverty Among Married-Couple Families in Briarcliff Manor
The poverty statistics for married-couple families in Briarcliff Manor show that 3.3% or 63 of the total 1,923 families live below the poverty line. Families with 1 or 2 children have the highest poverty rate of 6.1%, comprising of 43 families. On the other hand, families with 3 or 4 children have the lowest poverty rate of 0.0%, which includes 0 families.
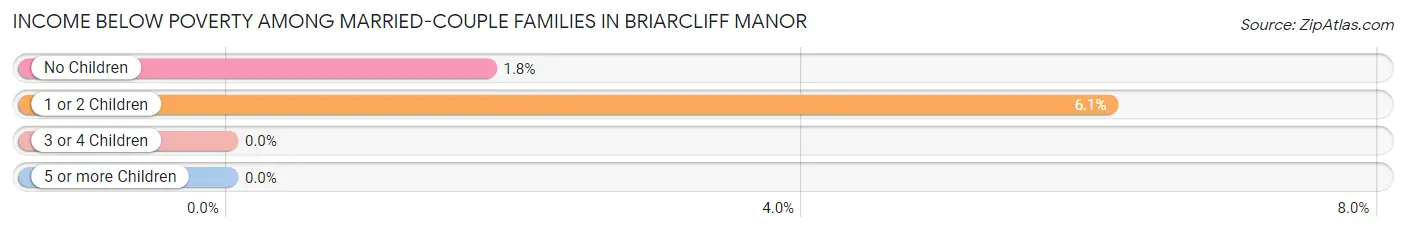
| Children | Above Poverty | Below Poverty |
| No Children | 1,094 (98.2%) | 20 (1.8%) |
| 1 or 2 Children | 658 (93.9%) | 43 (6.1%) |
| 3 or 4 Children | 108 (100.0%) | 0 (0.0%) |
| 5 or more Children | 0 (0.0%) | 0 (0.0%) |
| Total | 1,860 (96.7%) | 63 (3.3%) |
Income Below Poverty Among Single-Parent Households in Briarcliff Manor
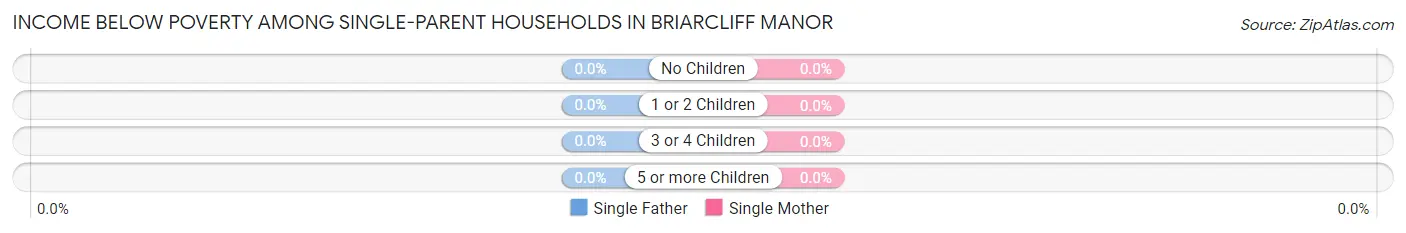
| Children | Single Father | Single Mother |
| No Children | 0 (0.0%) | 0 (0.0%) |
| 1 or 2 Children | 0 (0.0%) | 0 (0.0%) |
| 3 or 4 Children | 0 (0.0%) | 0 (0.0%) |
| 5 or more Children | 0 (0.0%) | 0 (0.0%) |
| Total | 0 (0.0%) | 0 (0.0%) |
Income Below Poverty Among Married-Couple vs Single-Parent Households in Briarcliff Manor
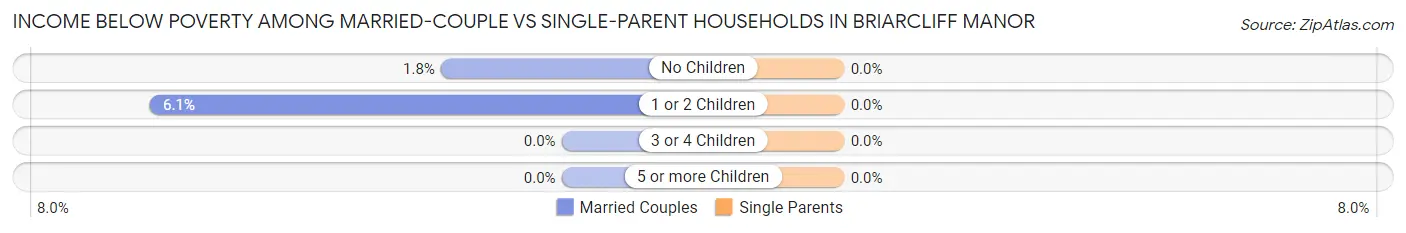
| Children | Married-Couple Families | Single-Parent Households |
| No Children | 20 (1.8%) | 0 (0.0%) |
| 1 or 2 Children | 43 (6.1%) | 0 (0.0%) |
| 3 or 4 Children | 0 (0.0%) | 0 (0.0%) |
| 5 or more Children | 0 (0.0%) | 0 (0.0%) |
| Total | 63 (3.3%) | 0 (0.0%) |
Employment Characteristics in Briarcliff Manor
Employment by Class of Employer in Briarcliff Manor
Among the 3,585 employed individuals in Briarcliff Manor, private company employees (2,191 | 61.1%), not-for-profit organizations (410 | 11.4%), and self-employed (not incorporated) (339 | 9.5%) make up the most common classes of employment.
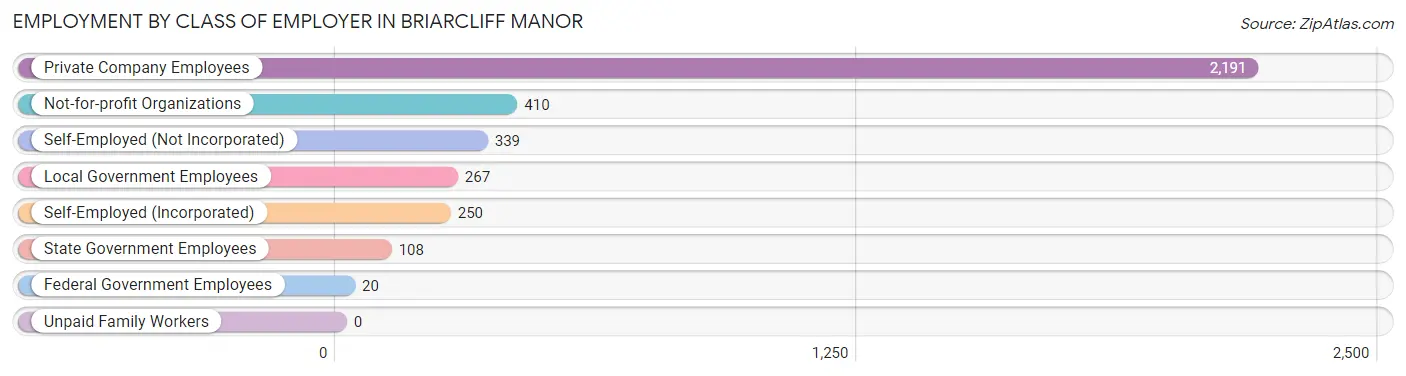
| Employer Class | # Employees | % Employees |
| Private Company Employees | 2,191 | 61.1% |
| Self-Employed (Incorporated) | 250 | 7.0% |
| Self-Employed (Not Incorporated) | 339 | 9.5% |
| Not-for-profit Organizations | 410 | 11.4% |
| Local Government Employees | 267 | 7.4% |
| State Government Employees | 108 | 3.0% |
| Federal Government Employees | 20 | 0.6% |
| Unpaid Family Workers | 0 | 0.0% |
| Total | 3,585 | 100.0% |
Employment Status by Age in Briarcliff Manor
According to the labor force statistics for Briarcliff Manor, out of the total population over 16 years of age (6,123), 62.3% or 3,815 individuals are in the labor force, with 4.0% or 153 of them unemployed. The age group with the highest labor force participation rate is 30 to 34 years, with 93.6% or 277 individuals in the labor force. Within the labor force, the 25 to 29 years age range has the highest percentage of unemployed individuals, with 18.8% or 37 of them being unemployed.
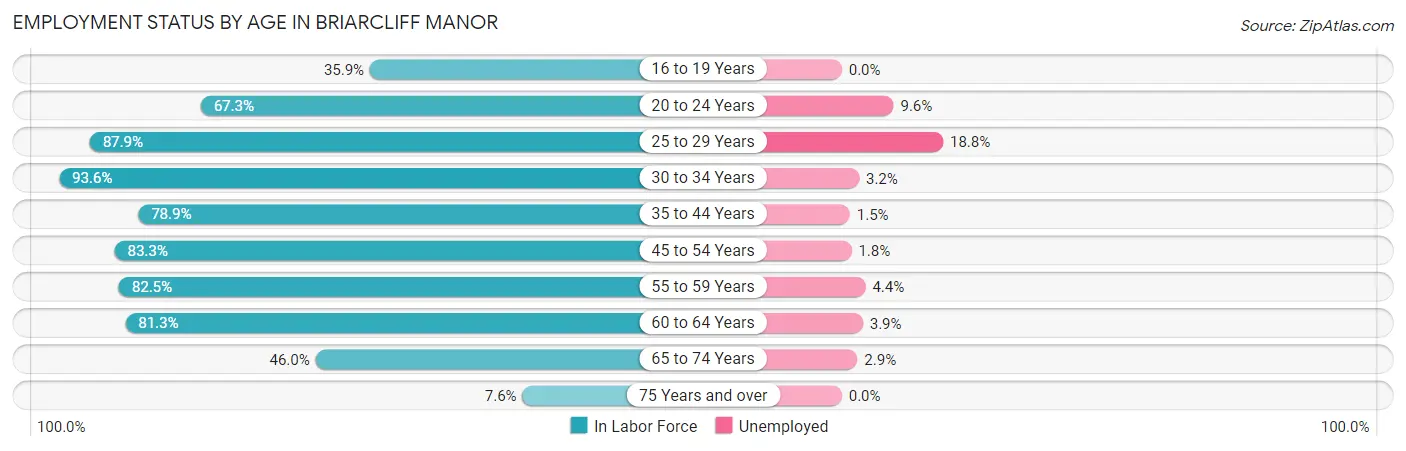
| Age Bracket | In Labor Force | Unemployed |
| 16 to 19 Years | 165 (35.9%) | 0 (0.0%) |
| 20 to 24 Years | 311 (67.3%) | 30 (9.6%) |
| 25 to 29 Years | 197 (87.9%) | 37 (18.8%) |
| 30 to 34 Years | 277 (93.6%) | 9 (3.2%) |
| 35 to 44 Years | 583 (78.9%) | 9 (1.5%) |
| 45 to 54 Years | 883 (83.3%) | 16 (1.8%) |
| 55 to 59 Years | 481 (82.5%) | 21 (4.4%) |
| 60 to 64 Years | 465 (81.3%) | 18 (3.9%) |
| 65 to 74 Years | 382 (46.0%) | 11 (2.9%) |
| 75 Years and over | 68 (7.6%) | 0 (0.0%) |
| Total | 3,815 (62.3%) | 153 (4.0%) |
Employment Status by Educational Attainment in Briarcliff Manor
According to labor force statistics for Briarcliff Manor, 83.1% of individuals (2,887) out of the total population between 25 and 64 years of age (3,474) are in the labor force, with 3.8% or 110 of them being unemployed. The group with the highest labor force participation rate are those with the educational attainment of college / associate degree, with 85.0% or 307 individuals in the labor force. Within the labor force, individuals with bachelor's degree or higher education have the highest percentage of unemployment, with 4.6% or 111 of them being unemployed.
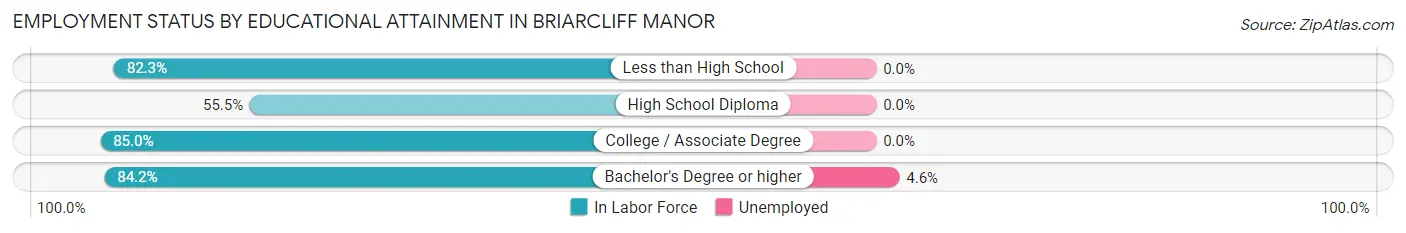
| Educational Attainment | In Labor Force | Unemployed |
| Less than High School | 93 (82.3%) | 0 (0.0%) |
| High School Diploma | 76 (55.5%) | 0 (0.0%) |
| College / Associate Degree | 307 (85.0%) | 0 (0.0%) |
| Bachelor's Degree or higher | 2,411 (84.2%) | 132 (4.6%) |
| Total | 2,887 (83.1%) | 132 (3.8%) |
Employment Occupations by Sex in Briarcliff Manor
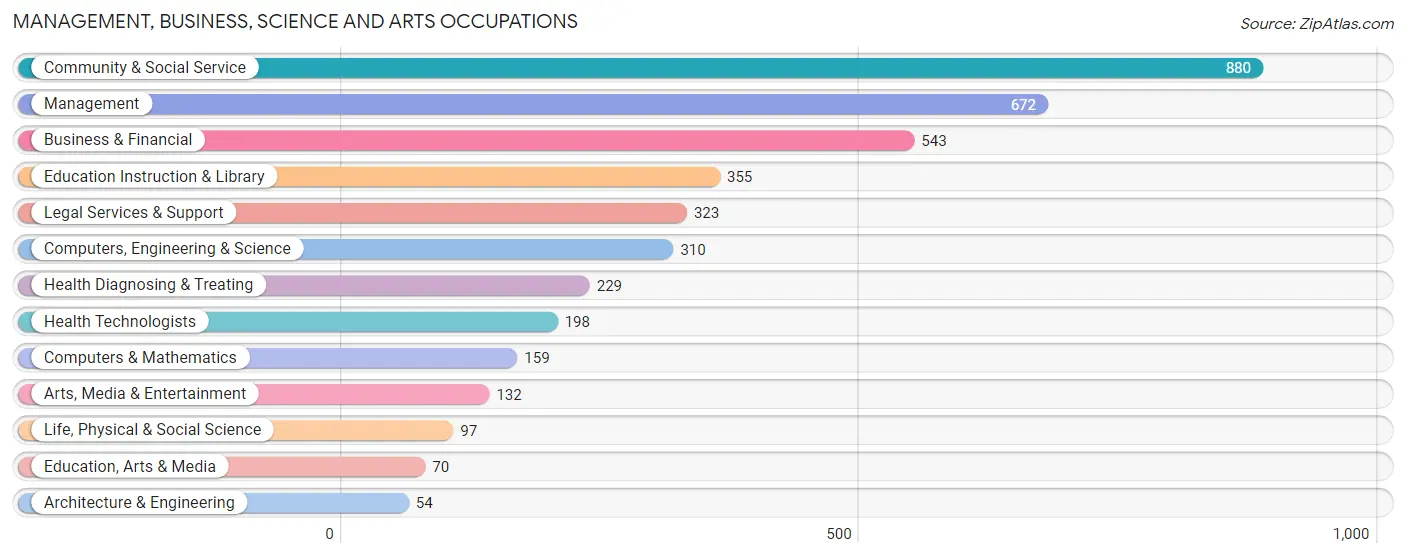
Management, Business, Science and Arts Occupations
The most common Management, Business, Science and Arts occupations in Briarcliff Manor are Community & Social Service (880 | 24.0%), Management (672 | 18.4%), Business & Financial (543 | 14.8%), Education Instruction & Library (355 | 9.7%), and Legal Services & Support (323 | 8.8%).
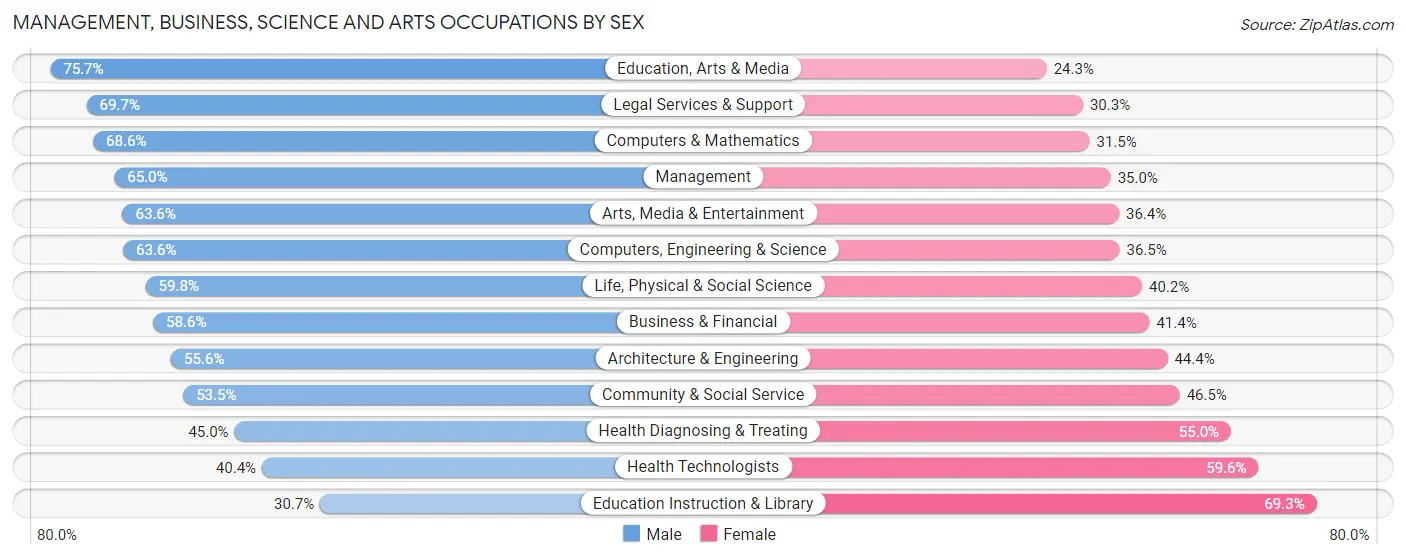
Management, Business, Science and Arts Occupations by Sex
Within the Management, Business, Science and Arts occupations in Briarcliff Manor, the most male-oriented occupations are Education, Arts & Media (75.7%), Legal Services & Support (69.7%), and Computers & Mathematics (68.5%), while the most female-oriented occupations are Education Instruction & Library (69.3%), Health Technologists (59.6%), and Health Diagnosing & Treating (55.0%).
| Occupation | Male | Female |
| Management | 437 (65.0%) | 235 (35.0%) |
| Business & Financial | 318 (58.6%) | 225 (41.4%) |
| Computers, Engineering & Science | 197 (63.5%) | 113 (36.4%) |
| Computers & Mathematics | 109 (68.5%) | 50 (31.5%) |
| Architecture & Engineering | 30 (55.6%) | 24 (44.4%) |
| Life, Physical & Social Science | 58 (59.8%) | 39 (40.2%) |
| Community & Social Service | 471 (53.5%) | 409 (46.5%) |
| Education, Arts & Media | 53 (75.7%) | 17 (24.3%) |
| Legal Services & Support | 225 (69.7%) | 98 (30.3%) |
| Education Instruction & Library | 109 (30.7%) | 246 (69.3%) |
| Arts, Media & Entertainment | 84 (63.6%) | 48 (36.4%) |
| Health Diagnosing & Treating | 103 (45.0%) | 126 (55.0%) |
| Health Technologists | 80 (40.4%) | 118 (59.6%) |
| Total (Category) | 1,526 (57.9%) | 1,108 (42.1%) |
| Total (Overall) | 1,997 (54.5%) | 1,664 (45.5%) |
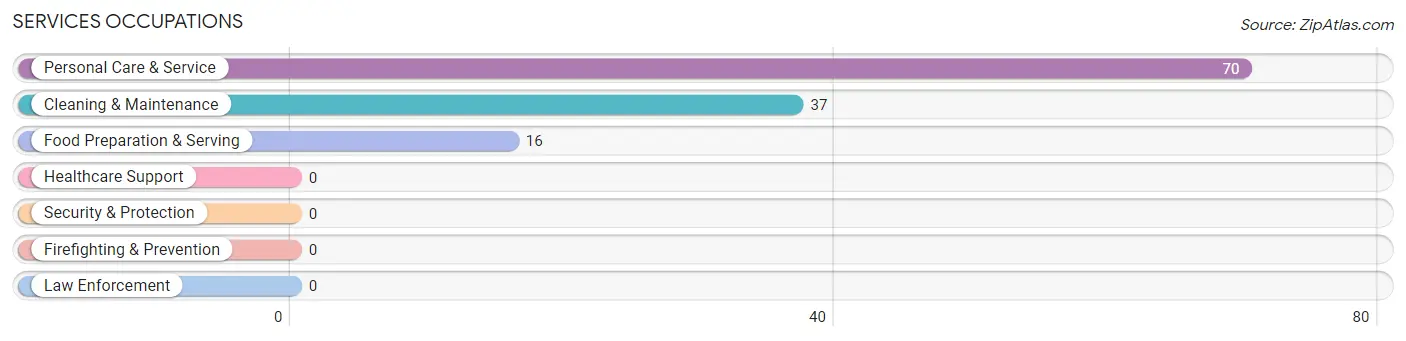
Services Occupations
The most common Services occupations in Briarcliff Manor are Personal Care & Service (70 | 1.9%), Cleaning & Maintenance (37 | 1.0%), and Food Preparation & Serving (16 | 0.4%).
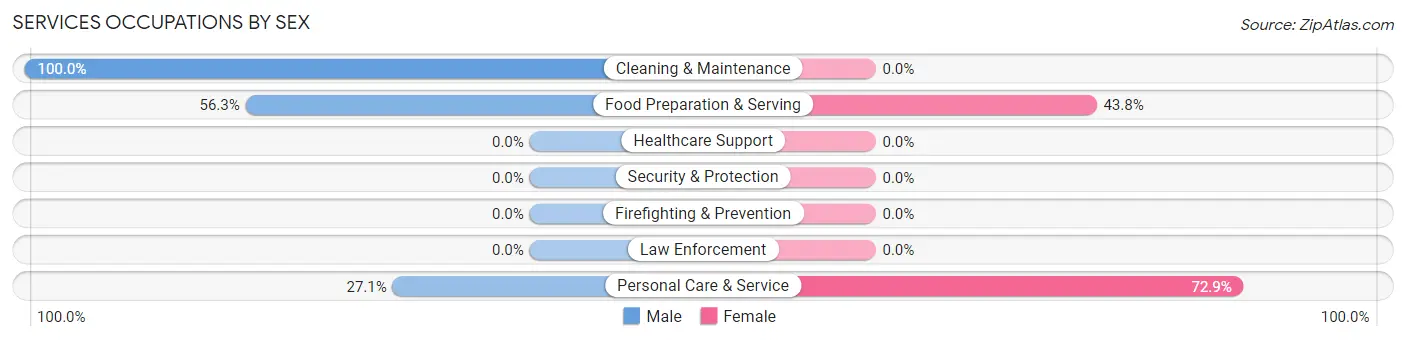
Services Occupations by Sex
Within the Services occupations in Briarcliff Manor, the most male-oriented occupations are Cleaning & Maintenance (100.0%), Food Preparation & Serving (56.2%), and Personal Care & Service (27.1%), while the most female-oriented occupations are Personal Care & Service (72.9%), and Food Preparation & Serving (43.8%).
| Occupation | Male | Female |
| Healthcare Support | 0 (0.0%) | 0 (0.0%) |
| Security & Protection | 0 (0.0%) | 0 (0.0%) |
| Firefighting & Prevention | 0 (0.0%) | 0 (0.0%) |
| Law Enforcement | 0 (0.0%) | 0 (0.0%) |
| Food Preparation & Serving | 9 (56.2%) | 7 (43.8%) |
| Cleaning & Maintenance | 37 (100.0%) | 0 (0.0%) |
| Personal Care & Service | 19 (27.1%) | 51 (72.9%) |
| Total (Category) | 65 (52.8%) | 58 (47.1%) |
| Total (Overall) | 1,997 (54.5%) | 1,664 (45.5%) |
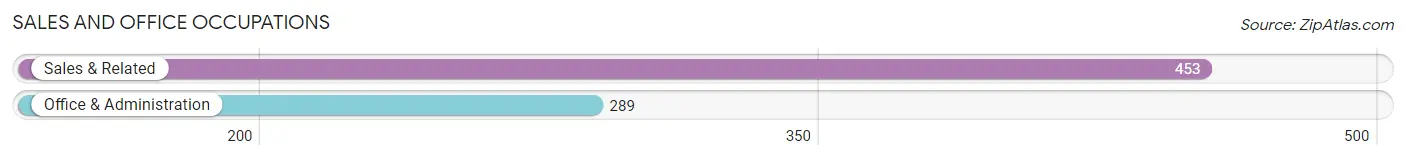
Sales and Office Occupations
The most common Sales and Office occupations in Briarcliff Manor are Sales & Related (453 | 12.4%), and Office & Administration (289 | 7.9%).
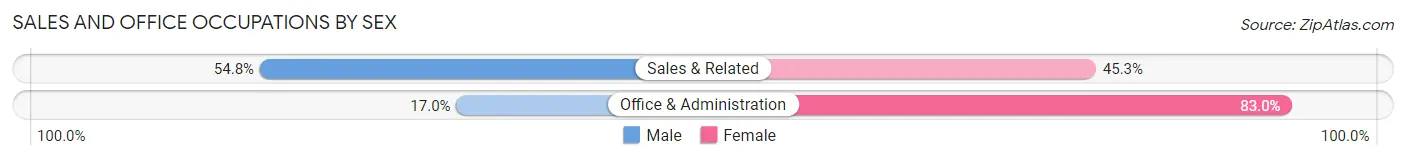
Sales and Office Occupations by Sex
| Occupation | Male | Female |
| Sales & Related | 248 (54.7%) | 205 (45.3%) |
| Office & Administration | 49 (17.0%) | 240 (83.0%) |
| Total (Category) | 297 (40.0%) | 445 (60.0%) |
| Total (Overall) | 1,997 (54.5%) | 1,664 (45.5%) |
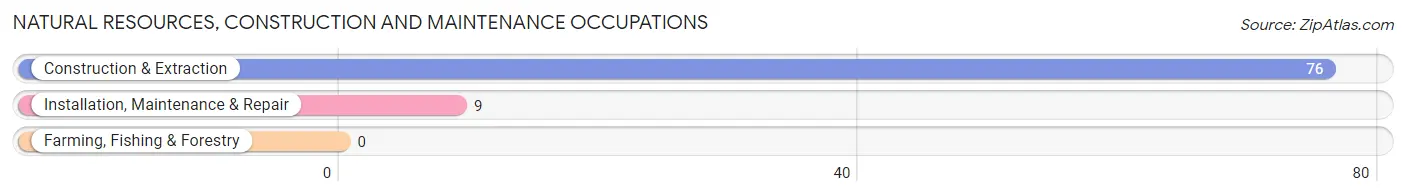
Natural Resources, Construction and Maintenance Occupations
The most common Natural Resources, Construction and Maintenance occupations in Briarcliff Manor are Construction & Extraction (76 | 2.1%), and Installation, Maintenance & Repair (9 | 0.3%).
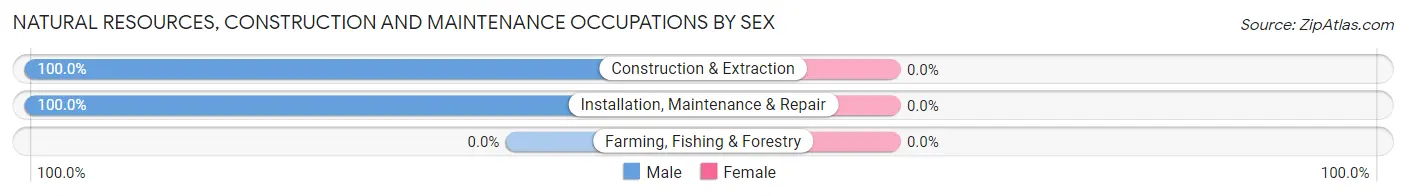
Natural Resources, Construction and Maintenance Occupations by Sex
| Occupation | Male | Female |
| Farming, Fishing & Forestry | 0 (0.0%) | 0 (0.0%) |
| Construction & Extraction | 76 (100.0%) | 0 (0.0%) |
| Installation, Maintenance & Repair | 9 (100.0%) | 0 (0.0%) |
| Total (Category) | 85 (100.0%) | 0 (0.0%) |
| Total (Overall) | 1,997 (54.5%) | 1,664 (45.5%) |
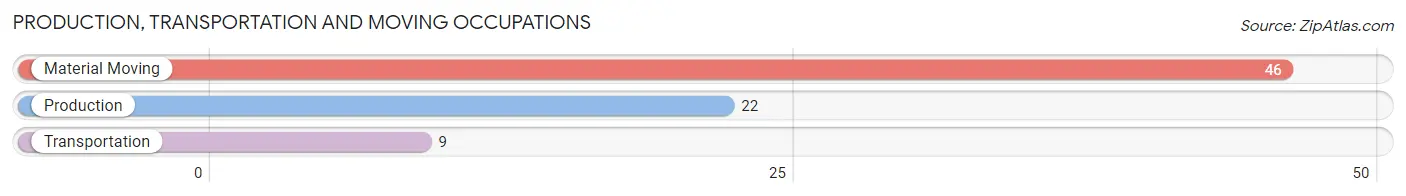
Production, Transportation and Moving Occupations
The most common Production, Transportation and Moving occupations in Briarcliff Manor are Material Moving (46 | 1.3%), Production (22 | 0.6%), and Transportation (9 | 0.3%).
Production, Transportation and Moving Occupations by Sex
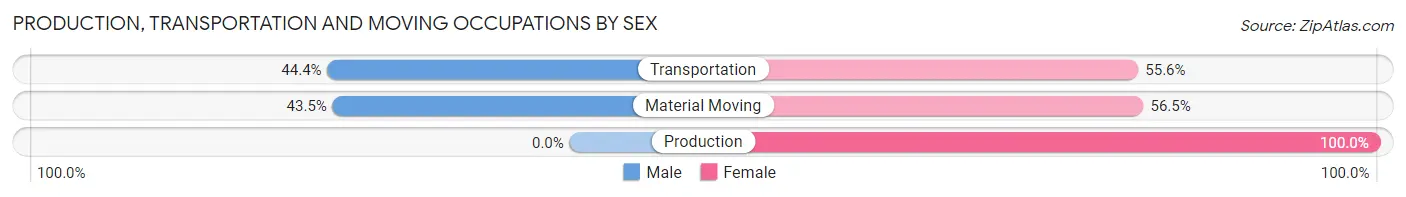
| Occupation | Male | Female |
| Production | 0 (0.0%) | 22 (100.0%) |
| Transportation | 4 (44.4%) | 5 (55.6%) |
| Material Moving | 20 (43.5%) | 26 (56.5%) |
| Total (Category) | 24 (31.2%) | 53 (68.8%) |
| Total (Overall) | 1,997 (54.5%) | 1,664 (45.5%) |
Employment Industries by Sex in Briarcliff Manor
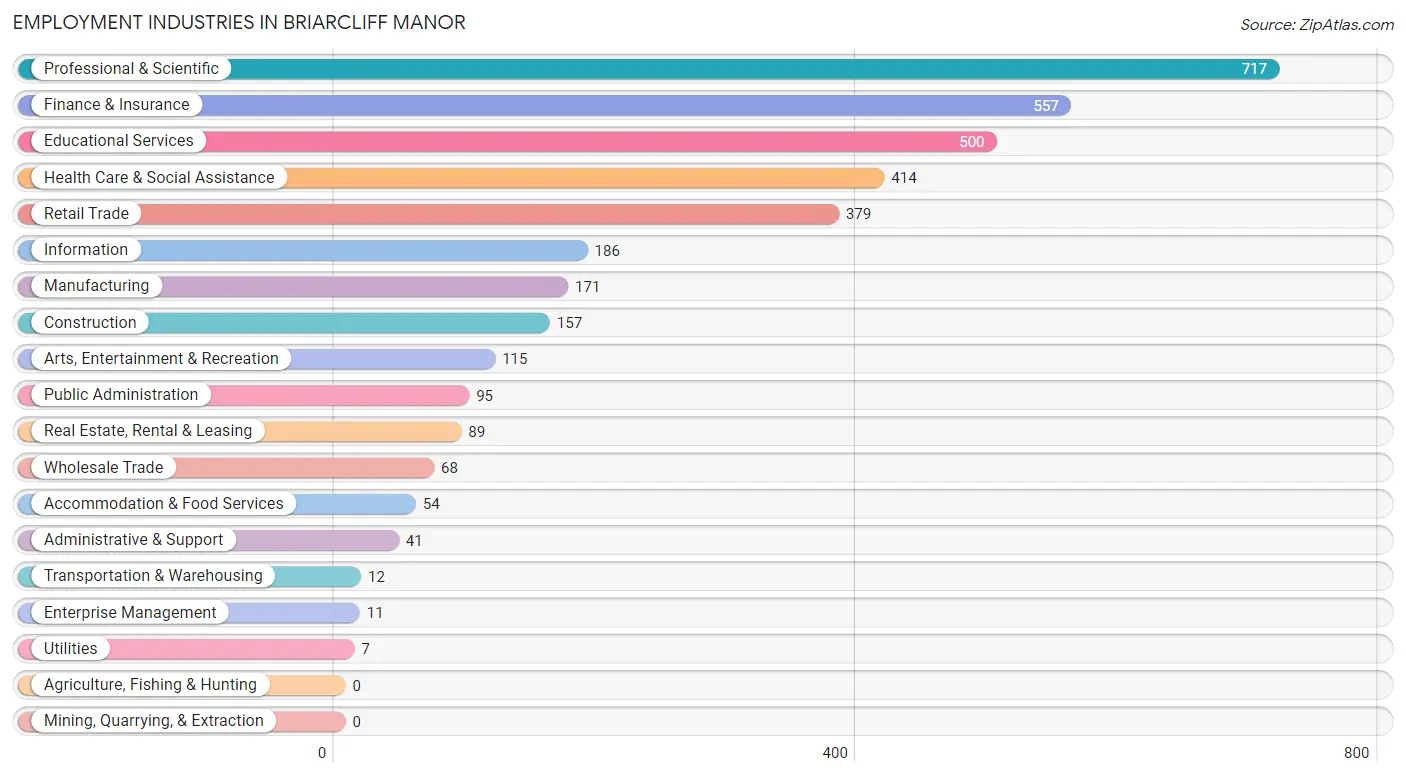
Employment Industries in Briarcliff Manor
The major employment industries in Briarcliff Manor include Professional & Scientific (717 | 19.6%), Finance & Insurance (557 | 15.2%), Educational Services (500 | 13.7%), Health Care & Social Assistance (414 | 11.3%), and Retail Trade (379 | 10.3%).
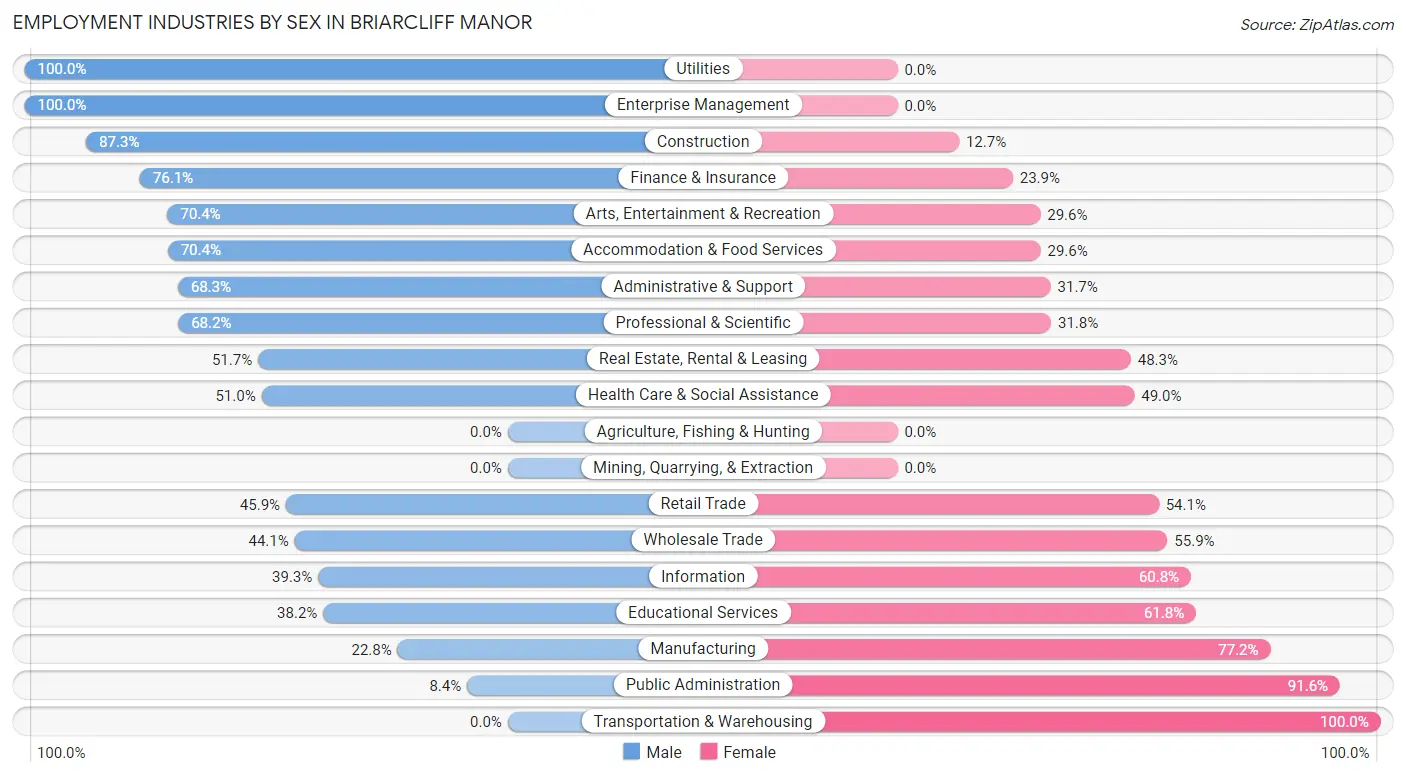
Employment Industries by Sex in Briarcliff Manor
The Briarcliff Manor industries that see more men than women are Utilities (100.0%), Enterprise Management (100.0%), and Construction (87.3%), whereas the industries that tend to have a higher number of women are Transportation & Warehousing (100.0%), Public Administration (91.6%), and Manufacturing (77.2%).
| Industry | Male | Female |
| Agriculture, Fishing & Hunting | 0 (0.0%) | 0 (0.0%) |
| Mining, Quarrying, & Extraction | 0 (0.0%) | 0 (0.0%) |
| Construction | 137 (87.3%) | 20 (12.7%) |
| Manufacturing | 39 (22.8%) | 132 (77.2%) |
| Wholesale Trade | 30 (44.1%) | 38 (55.9%) |
| Retail Trade | 174 (45.9%) | 205 (54.1%) |
| Transportation & Warehousing | 0 (0.0%) | 12 (100.0%) |
| Utilities | 7 (100.0%) | 0 (0.0%) |
| Information | 73 (39.3%) | 113 (60.8%) |
| Finance & Insurance | 424 (76.1%) | 133 (23.9%) |
| Real Estate, Rental & Leasing | 46 (51.7%) | 43 (48.3%) |
| Professional & Scientific | 489 (68.2%) | 228 (31.8%) |
| Enterprise Management | 11 (100.0%) | 0 (0.0%) |
| Administrative & Support | 28 (68.3%) | 13 (31.7%) |
| Educational Services | 191 (38.2%) | 309 (61.8%) |
| Health Care & Social Assistance | 211 (51.0%) | 203 (49.0%) |
| Arts, Entertainment & Recreation | 81 (70.4%) | 34 (29.6%) |
| Accommodation & Food Services | 38 (70.4%) | 16 (29.6%) |
| Public Administration | 8 (8.4%) | 87 (91.6%) |
| Total | 1,997 (54.5%) | 1,664 (45.5%) |
Education in Briarcliff Manor
School Enrollment in Briarcliff Manor
The most common levels of schooling among the 1,887 students in Briarcliff Manor are high school (478 | 25.3%), middle school (472 | 25.0%), and college / undergraduate (331 | 17.5%).
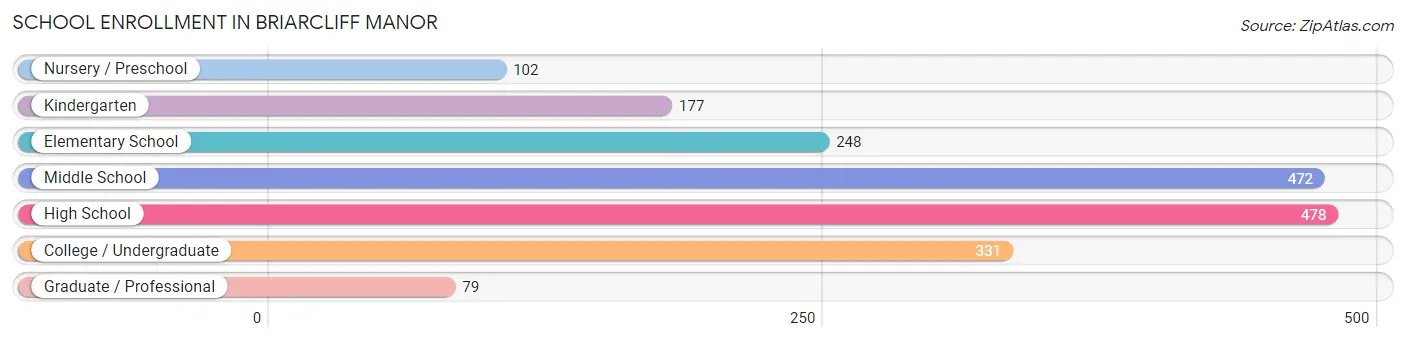
| School Level | # Students | % Students |
| Nursery / Preschool | 102 | 5.4% |
| Kindergarten | 177 | 9.4% |
| Elementary School | 248 | 13.1% |
| Middle School | 472 | 25.0% |
| High School | 478 | 25.3% |
| College / Undergraduate | 331 | 17.5% |
| Graduate / Professional | 79 | 4.2% |
| Total | 1,887 | 100.0% |
School Enrollment by Age by Funding Source in Briarcliff Manor
Out of a total of 1,887 students who are enrolled in schools in Briarcliff Manor, 500 (26.5%) attend a private institution, while the remaining 1,387 (73.5%) are enrolled in public schools. The age group of 20 to 24 year olds has the highest likelihood of being enrolled in private schools, with 122 (77.2% in the age bracket) enrolled. Conversely, the age group of 15 to 17 year olds has the lowest likelihood of being enrolled in a private school, with 316 (88.0% in the age bracket) attending a public institution.
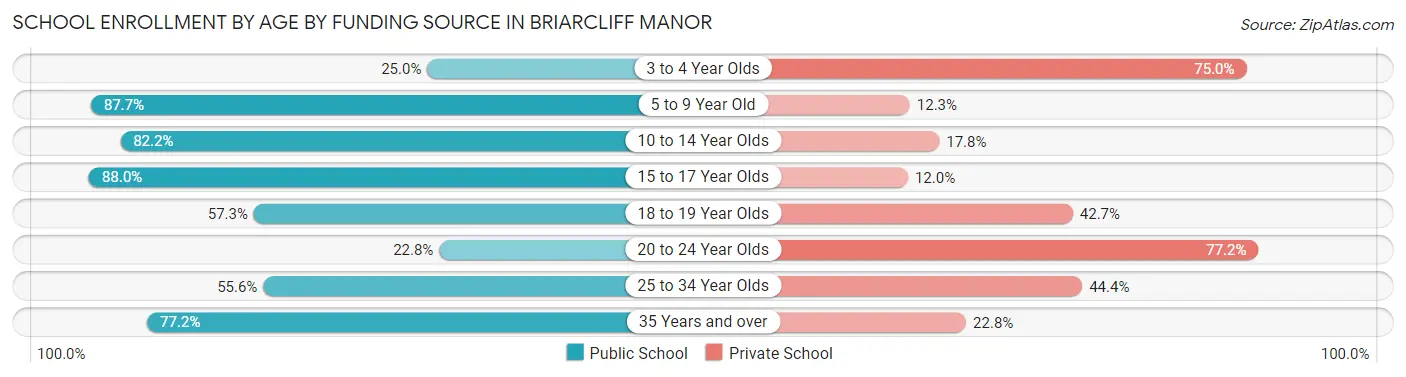
| Age Bracket | Public School | Private School |
| 3 to 4 Year Olds | 21 (25.0%) | 63 (75.0%) |
| 5 to 9 Year Old | 384 (87.7%) | 54 (12.3%) |
| 10 to 14 Year Olds | 443 (82.2%) | 96 (17.8%) |
| 15 to 17 Year Olds | 316 (88.0%) | 43 (12.0%) |
| 18 to 19 Year Olds | 98 (57.3%) | 73 (42.7%) |
| 20 to 24 Year Olds | 36 (22.8%) | 122 (77.2%) |
| 25 to 34 Year Olds | 45 (55.6%) | 36 (44.4%) |
| 35 Years and over | 44 (77.2%) | 13 (22.8%) |
| Total | 1,387 (73.5%) | 500 (26.5%) |
Educational Attainment by Field of Study in Briarcliff Manor
Business (959 | 20.8%), social sciences (673 | 14.6%), literature & languages (462 | 10.0%), liberal arts & history (369 | 8.0%), and engineering (290 | 6.3%) are the most common fields of study among 4,618 individuals in Briarcliff Manor who have obtained a bachelor's degree or higher.
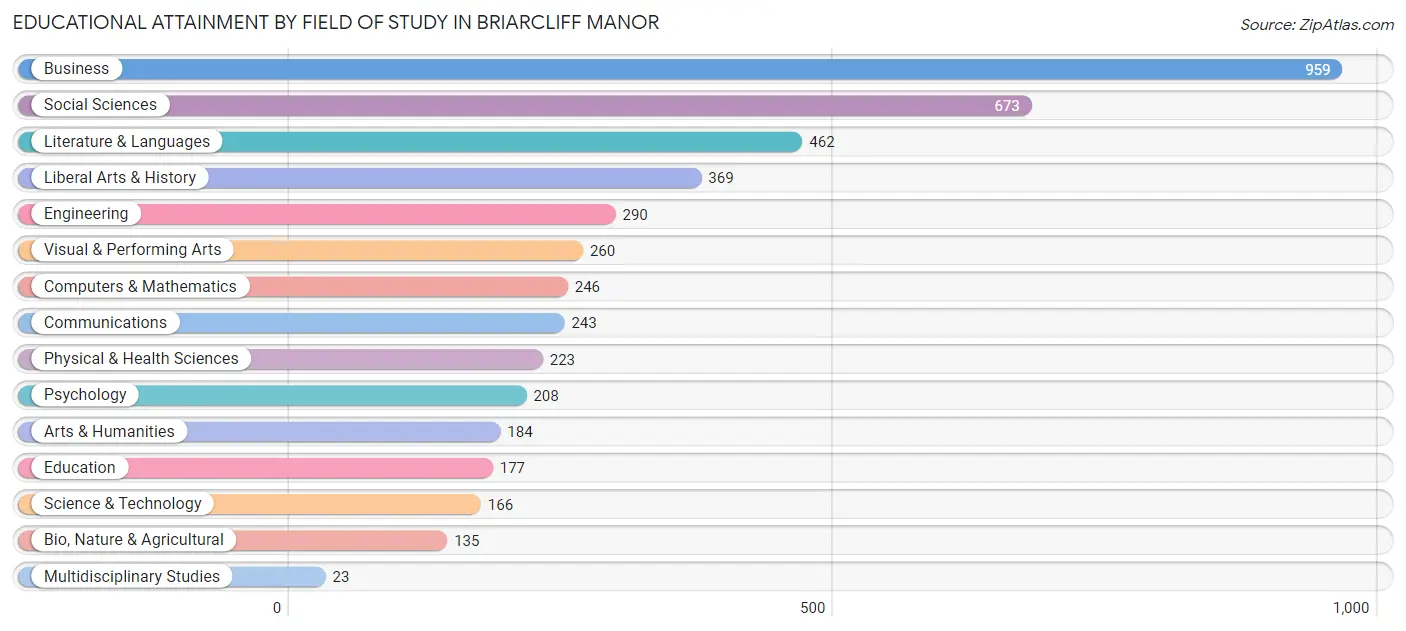
| Field of Study | # Graduates | % Graduates |
| Computers & Mathematics | 246 | 5.3% |
| Bio, Nature & Agricultural | 135 | 2.9% |
| Physical & Health Sciences | 223 | 4.8% |
| Psychology | 208 | 4.5% |
| Social Sciences | 673 | 14.6% |
| Engineering | 290 | 6.3% |
| Multidisciplinary Studies | 23 | 0.5% |
| Science & Technology | 166 | 3.6% |
| Business | 959 | 20.8% |
| Education | 177 | 3.8% |
| Literature & Languages | 462 | 10.0% |
| Liberal Arts & History | 369 | 8.0% |
| Visual & Performing Arts | 260 | 5.6% |
| Communications | 243 | 5.3% |
| Arts & Humanities | 184 | 4.0% |
| Total | 4,618 | 100.0% |
Transportation & Commute in Briarcliff Manor
Vehicle Availability by Sex in Briarcliff Manor
The most prevalent vehicle ownership categories in Briarcliff Manor are males with 2 vehicles (814, accounting for 42.1%) and females with 2 vehicles (565, making up 51.1%).
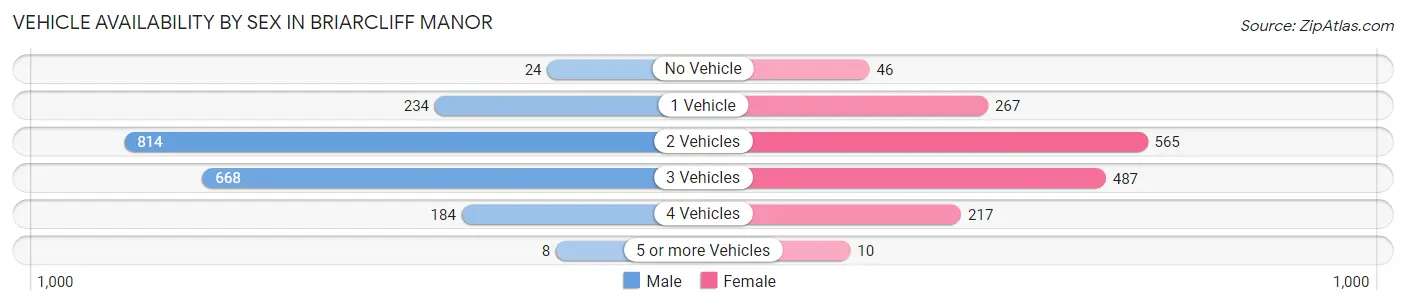
| Vehicles Available | Male | Female |
| No Vehicle | 24 (1.2%) | 46 (2.9%) |
| 1 Vehicle | 234 (12.1%) | 267 (16.8%) |
| 2 Vehicles | 814 (42.1%) | 565 (35.5%) |
| 3 Vehicles | 668 (34.6%) | 487 (30.6%) |
| 4 Vehicles | 184 (9.5%) | 217 (13.6%) |
| 5 or more Vehicles | 8 (0.4%) | 10 (0.6%) |
| Total | 1,932 (100.0%) | 1,592 (100.0%) |
Commute Time in Briarcliff Manor
The most frequently occuring commute durations in Briarcliff Manor are 60 to 89 minutes (558 commuters, 19.6%), 20 to 24 minutes (400 commuters, 14.0%), and 45 to 59 minutes (330 commuters, 11.6%).
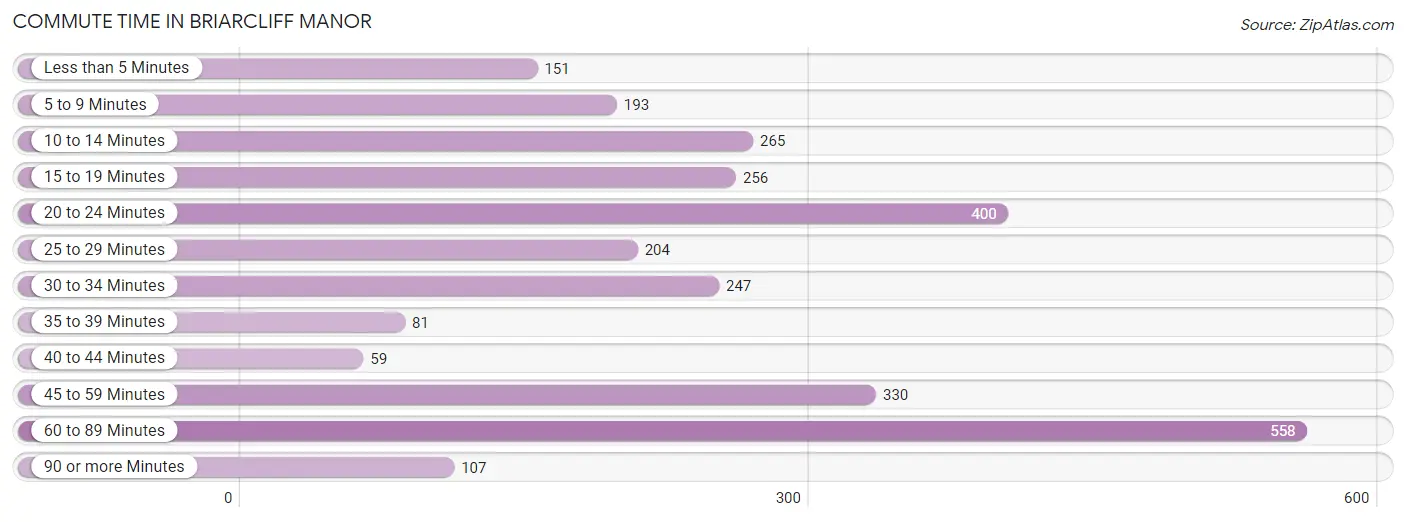
| Commute Time | # Commuters | % Commuters |
| Less than 5 Minutes | 151 | 5.3% |
| 5 to 9 Minutes | 193 | 6.8% |
| 10 to 14 Minutes | 265 | 9.3% |
| 15 to 19 Minutes | 256 | 9.0% |
| 20 to 24 Minutes | 400 | 14.0% |
| 25 to 29 Minutes | 204 | 7.2% |
| 30 to 34 Minutes | 247 | 8.7% |
| 35 to 39 Minutes | 81 | 2.8% |
| 40 to 44 Minutes | 59 | 2.1% |
| 45 to 59 Minutes | 330 | 11.6% |
| 60 to 89 Minutes | 558 | 19.6% |
| 90 or more Minutes | 107 | 3.7% |
Commute Time by Sex in Briarcliff Manor
The most common commute times in Briarcliff Manor are 60 to 89 minutes (387 commuters, 24.9%) for males and 20 to 24 minutes (252 commuters, 19.4%) for females.
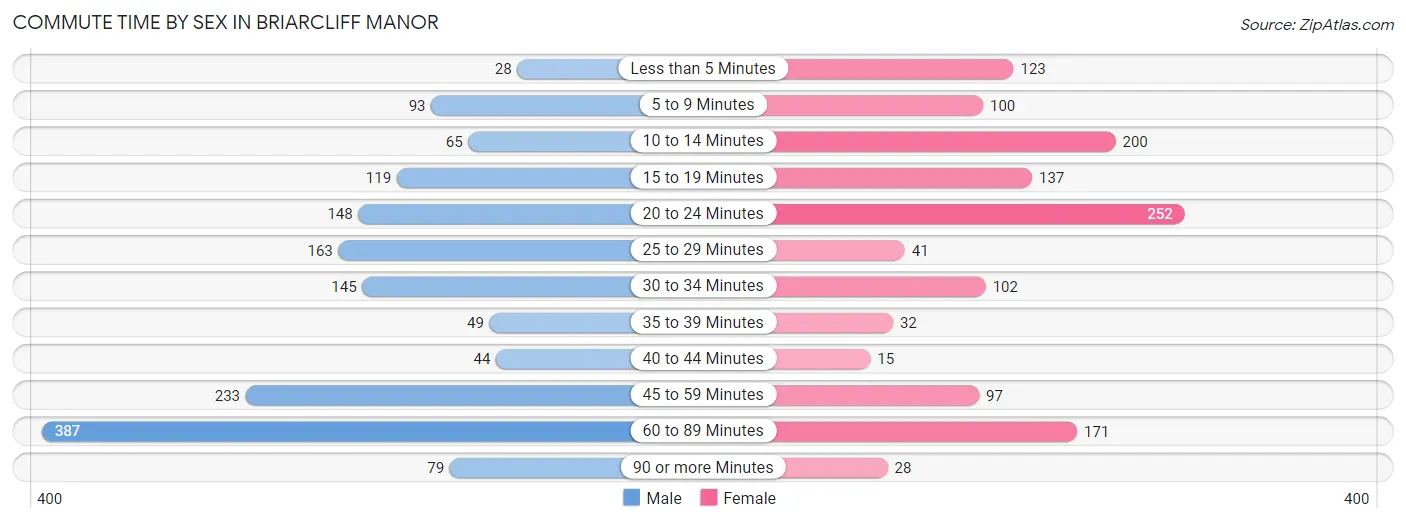
| Commute Time | Male | Female |
| Less than 5 Minutes | 28 (1.8%) | 123 (9.5%) |
| 5 to 9 Minutes | 93 (6.0%) | 100 (7.7%) |
| 10 to 14 Minutes | 65 (4.2%) | 200 (15.4%) |
| 15 to 19 Minutes | 119 (7.7%) | 137 (10.5%) |
| 20 to 24 Minutes | 148 (9.5%) | 252 (19.4%) |
| 25 to 29 Minutes | 163 (10.5%) | 41 (3.2%) |
| 30 to 34 Minutes | 145 (9.3%) | 102 (7.9%) |
| 35 to 39 Minutes | 49 (3.2%) | 32 (2.5%) |
| 40 to 44 Minutes | 44 (2.8%) | 15 (1.2%) |
| 45 to 59 Minutes | 233 (15.0%) | 97 (7.5%) |
| 60 to 89 Minutes | 387 (24.9%) | 171 (13.2%) |
| 90 or more Minutes | 79 (5.1%) | 28 (2.2%) |
Time of Departure to Work by Sex in Briarcliff Manor
The most frequent times of departure to work in Briarcliff Manor are 8:00 AM to 8:29 AM (348, 22.4%) for males and 7:00 AM to 7:29 AM (316, 24.3%) for females.
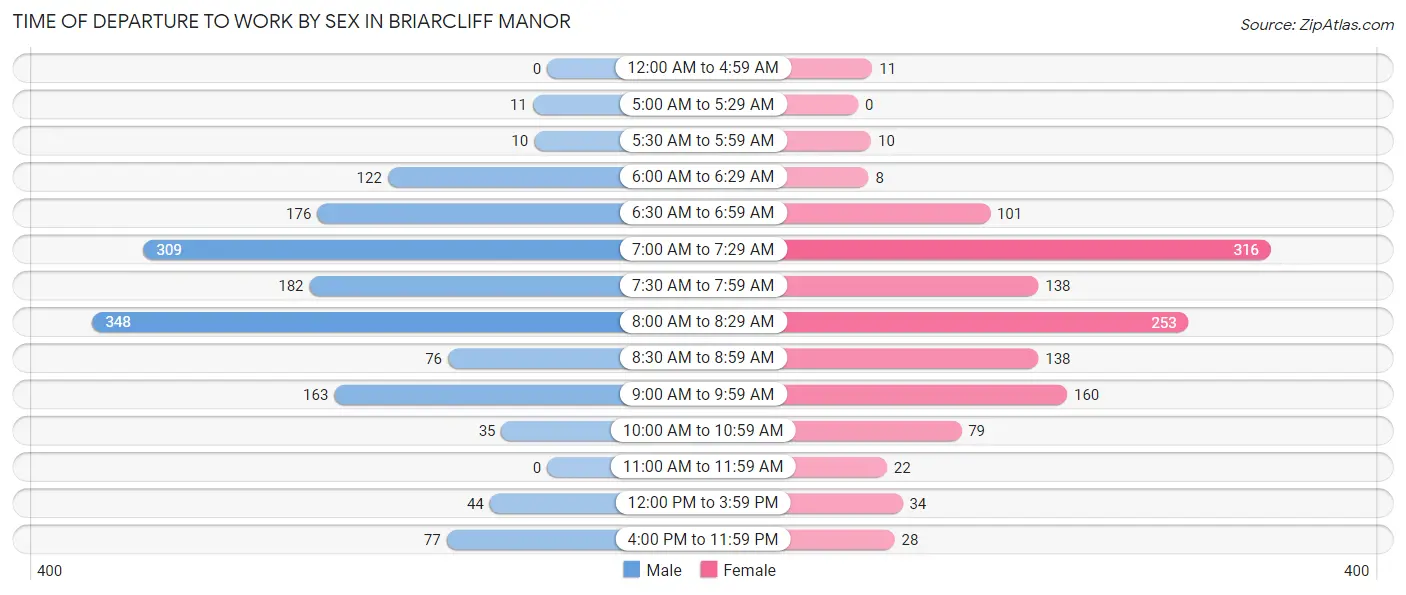
| Time of Departure | Male | Female |
| 12:00 AM to 4:59 AM | 0 (0.0%) | 11 (0.9%) |
| 5:00 AM to 5:29 AM | 11 (0.7%) | 0 (0.0%) |
| 5:30 AM to 5:59 AM | 10 (0.6%) | 10 (0.8%) |
| 6:00 AM to 6:29 AM | 122 (7.9%) | 8 (0.6%) |
| 6:30 AM to 6:59 AM | 176 (11.3%) | 101 (7.8%) |
| 7:00 AM to 7:29 AM | 309 (19.9%) | 316 (24.3%) |
| 7:30 AM to 7:59 AM | 182 (11.7%) | 138 (10.6%) |
| 8:00 AM to 8:29 AM | 348 (22.4%) | 253 (19.5%) |
| 8:30 AM to 8:59 AM | 76 (4.9%) | 138 (10.6%) |
| 9:00 AM to 9:59 AM | 163 (10.5%) | 160 (12.3%) |
| 10:00 AM to 10:59 AM | 35 (2.2%) | 79 (6.1%) |
| 11:00 AM to 11:59 AM | 0 (0.0%) | 22 (1.7%) |
| 12:00 PM to 3:59 PM | 44 (2.8%) | 34 (2.6%) |
| 4:00 PM to 11:59 PM | 77 (5.0%) | 28 (2.2%) |
| Total | 1,553 (100.0%) | 1,298 (100.0%) |
Housing Occupancy in Briarcliff Manor
Occupancy by Ownership in Briarcliff Manor
Of the total 2,709 dwellings in Briarcliff Manor, owner-occupied units account for 2,183 (80.6%), while renter-occupied units make up 526 (19.4%).
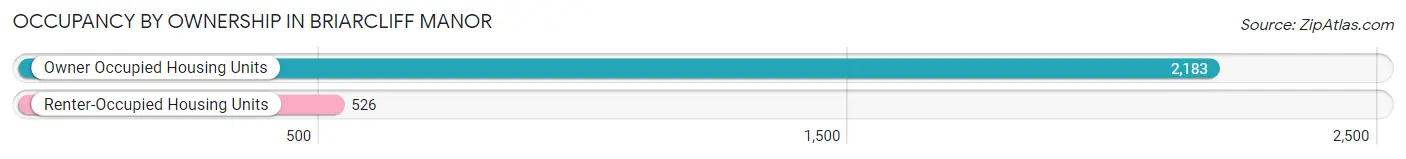
| Occupancy | # Housing Units | % Housing Units |
| Owner Occupied Housing Units | 2,183 | 80.6% |
| Renter-Occupied Housing Units | 526 | 19.4% |
| Total Occupied Housing Units | 2,709 | 100.0% |
Occupancy by Household Size in Briarcliff Manor
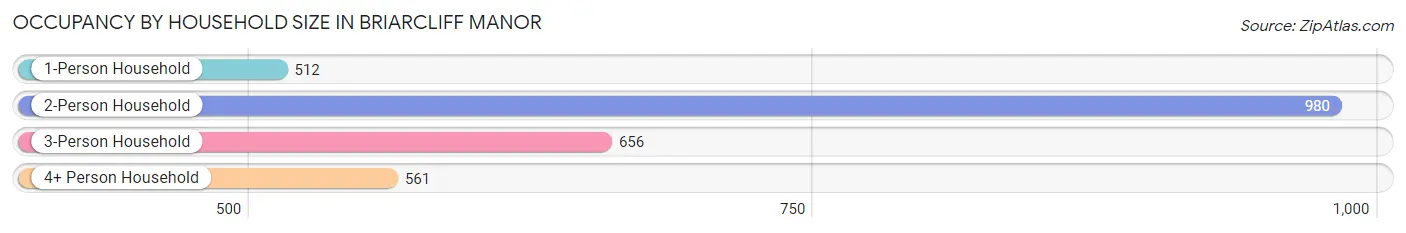
| Household Size | # Housing Units | % Housing Units |
| 1-Person Household | 512 | 18.9% |
| 2-Person Household | 980 | 36.2% |
| 3-Person Household | 656 | 24.2% |
| 4+ Person Household | 561 | 20.7% |
| Total Housing Units | 2,709 | 100.0% |
Occupancy by Ownership by Household Size in Briarcliff Manor
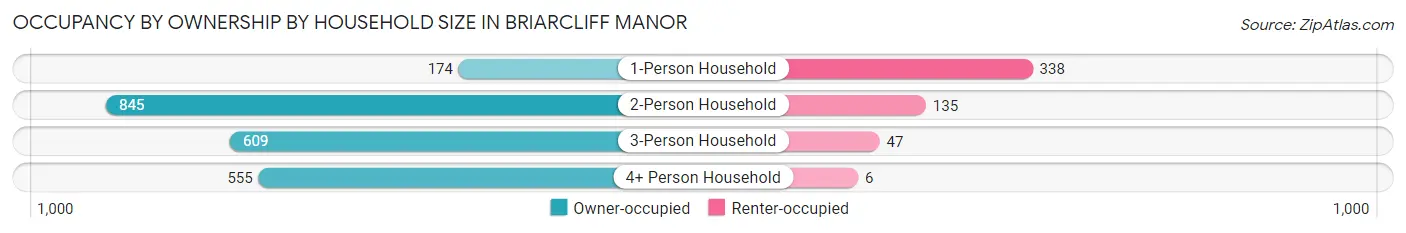
| Household Size | Owner-occupied | Renter-occupied |
| 1-Person Household | 174 (34.0%) | 338 (66.0%) |
| 2-Person Household | 845 (86.2%) | 135 (13.8%) |
| 3-Person Household | 609 (92.8%) | 47 (7.2%) |
| 4+ Person Household | 555 (98.9%) | 6 (1.1%) |
| Total Housing Units | 2,183 (80.6%) | 526 (19.4%) |
Occupancy by Educational Attainment in Briarcliff Manor
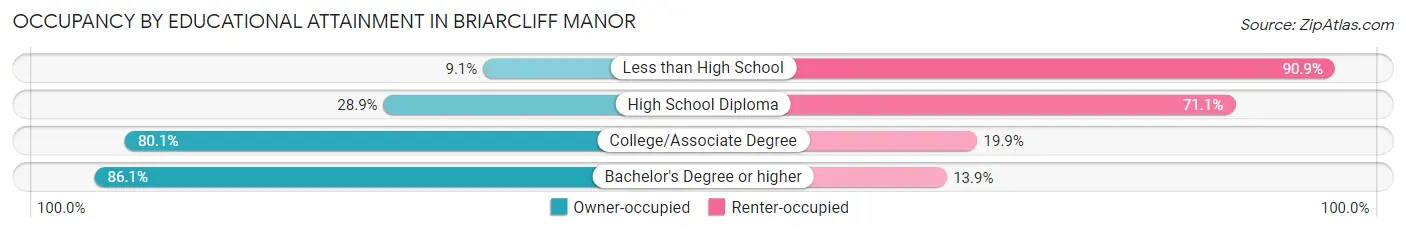
| Household Size | Owner-occupied | Renter-occupied |
| Less than High School | 6 (9.1%) | 60 (90.9%) |
| High School Diploma | 43 (28.9%) | 106 (71.1%) |
| College/Associate Degree | 181 (80.1%) | 45 (19.9%) |
| Bachelor's Degree or higher | 1,953 (86.1%) | 315 (13.9%) |
Occupancy by Age of Householder in Briarcliff Manor
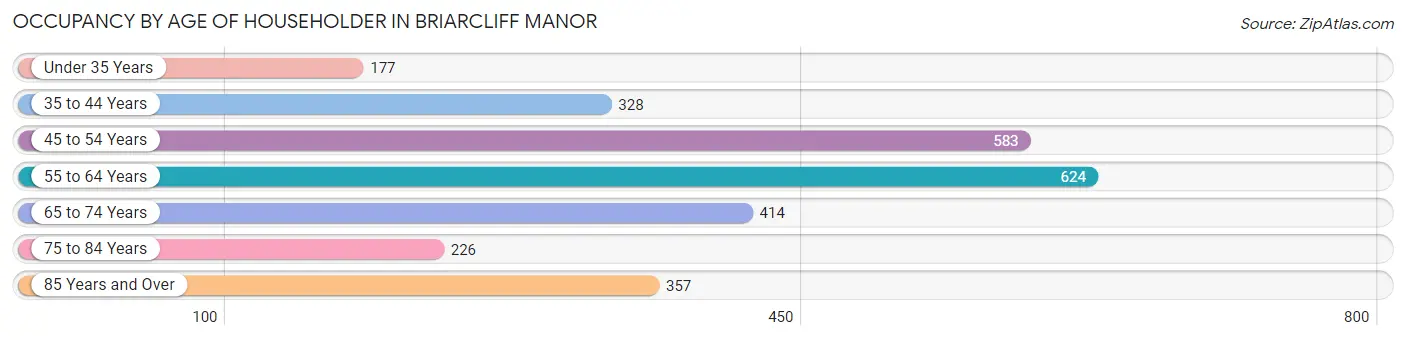
| Age Bracket | # Households | % Households |
| Under 35 Years | 177 | 6.5% |
| 35 to 44 Years | 328 | 12.1% |
| 45 to 54 Years | 583 | 21.5% |
| 55 to 64 Years | 624 | 23.0% |
| 65 to 74 Years | 414 | 15.3% |
| 75 to 84 Years | 226 | 8.3% |
| 85 Years and Over | 357 | 13.2% |
| Total | 2,709 | 100.0% |
Housing Finances in Briarcliff Manor
Median Income by Occupancy in Briarcliff Manor
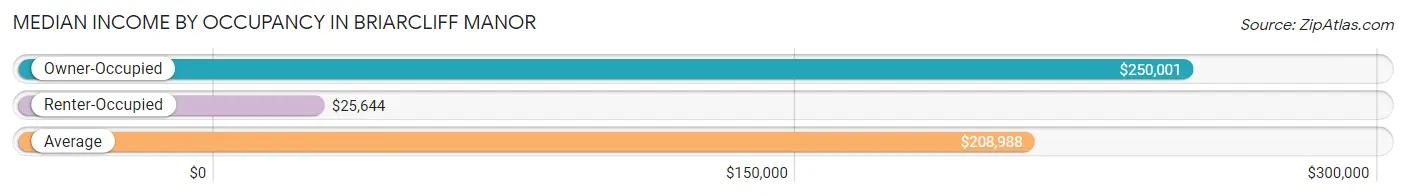
| Occupancy Type | # Households | Median Income |
| Owner-Occupied | 2,183 (80.6%) | $250,001 |
| Renter-Occupied | 526 (19.4%) | $25,644 |
| Average | 2,709 (100.0%) | $208,988 |
Occupancy by Householder Income Bracket in Briarcliff Manor
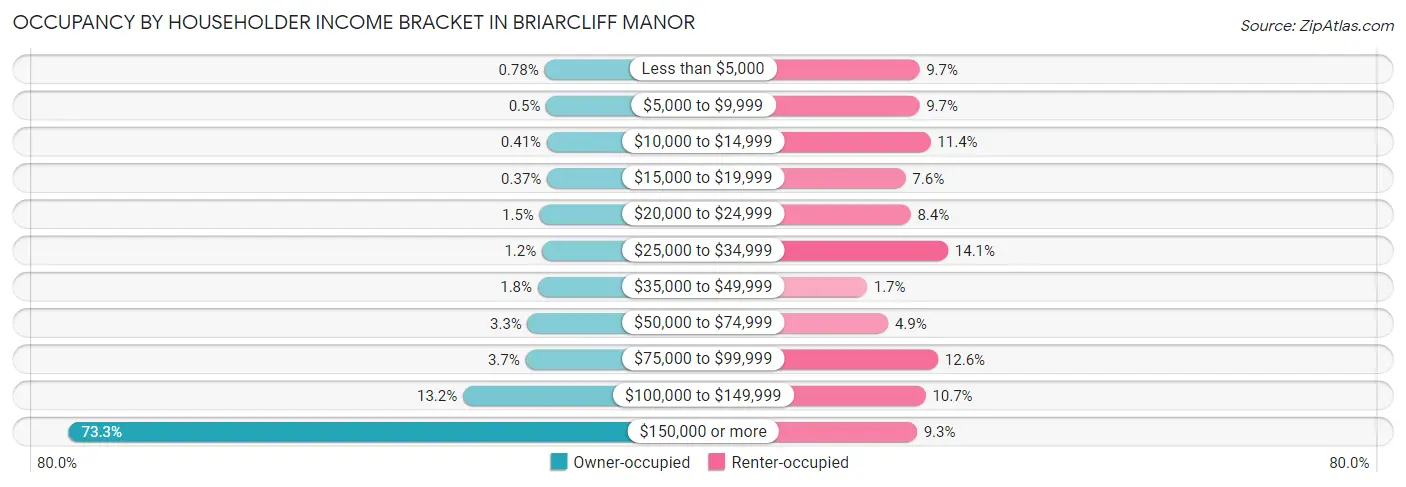
| Income Bracket | Owner-occupied | Renter-occupied |
| Less than $5,000 | 17 (0.8%) | 51 (9.7%) |
| $5,000 to $9,999 | 11 (0.5%) | 51 (9.7%) |
| $10,000 to $14,999 | 9 (0.4%) | 60 (11.4%) |
| $15,000 to $19,999 | 8 (0.4%) | 40 (7.6%) |
| $20,000 to $24,999 | 33 (1.5%) | 44 (8.4%) |
| $25,000 to $34,999 | 25 (1.1%) | 74 (14.1%) |
| $35,000 to $49,999 | 39 (1.8%) | 9 (1.7%) |
| $50,000 to $74,999 | 73 (3.3%) | 26 (4.9%) |
| $75,000 to $99,999 | 80 (3.7%) | 66 (12.6%) |
| $100,000 to $149,999 | 288 (13.2%) | 56 (10.6%) |
| $150,000 or more | 1,600 (73.3%) | 49 (9.3%) |
| Total | 2,183 (100.0%) | 526 (100.0%) |
Monthly Housing Cost Tiers in Briarcliff Manor
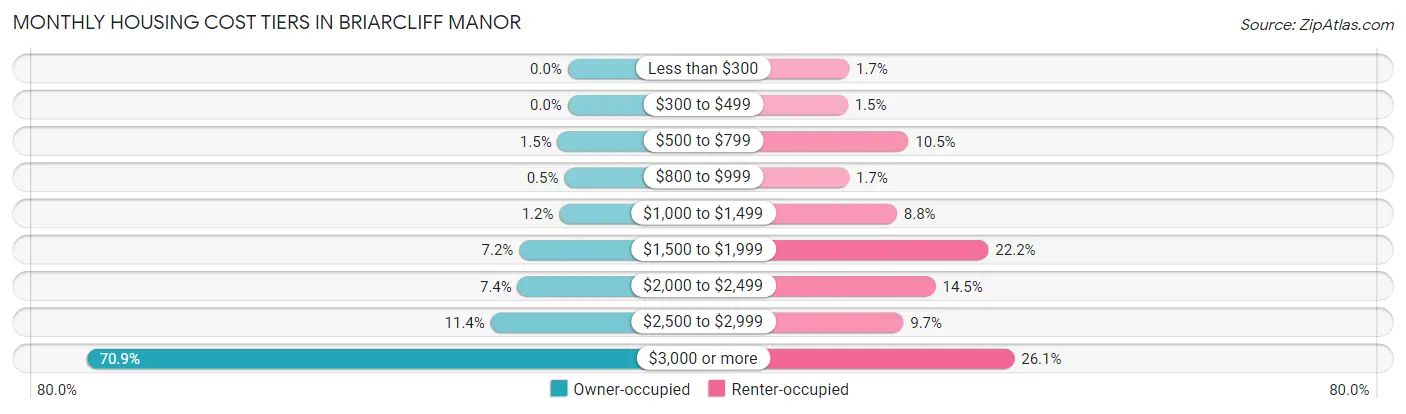
| Monthly Cost | Owner-occupied | Renter-occupied |
| Less than $300 | 0 (0.0%) | 9 (1.7%) |
| $300 to $499 | 0 (0.0%) | 8 (1.5%) |
| $500 to $799 | 33 (1.5%) | 55 (10.5%) |
| $800 to $999 | 11 (0.5%) | 9 (1.7%) |
| $1,000 to $1,499 | 27 (1.2%) | 46 (8.7%) |
| $1,500 to $1,999 | 156 (7.1%) | 117 (22.2%) |
| $2,000 to $2,499 | 161 (7.4%) | 76 (14.4%) |
| $2,500 to $2,999 | 248 (11.4%) | 51 (9.7%) |
| $3,000 or more | 1,547 (70.9%) | 137 (26.1%) |
| Total | 2,183 (100.0%) | 526 (100.0%) |
Physical Housing Characteristics in Briarcliff Manor
Housing Structures in Briarcliff Manor
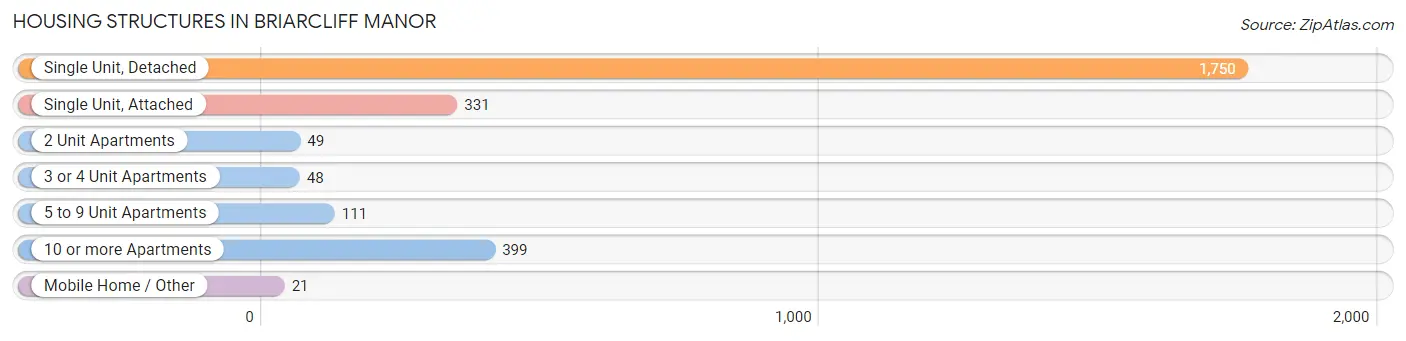
| Structure Type | # Housing Units | % Housing Units |
| Single Unit, Detached | 1,750 | 64.6% |
| Single Unit, Attached | 331 | 12.2% |
| 2 Unit Apartments | 49 | 1.8% |
| 3 or 4 Unit Apartments | 48 | 1.8% |
| 5 to 9 Unit Apartments | 111 | 4.1% |
| 10 or more Apartments | 399 | 14.7% |
| Mobile Home / Other | 21 | 0.8% |
| Total | 2,709 | 100.0% |
Housing Structures by Occupancy in Briarcliff Manor
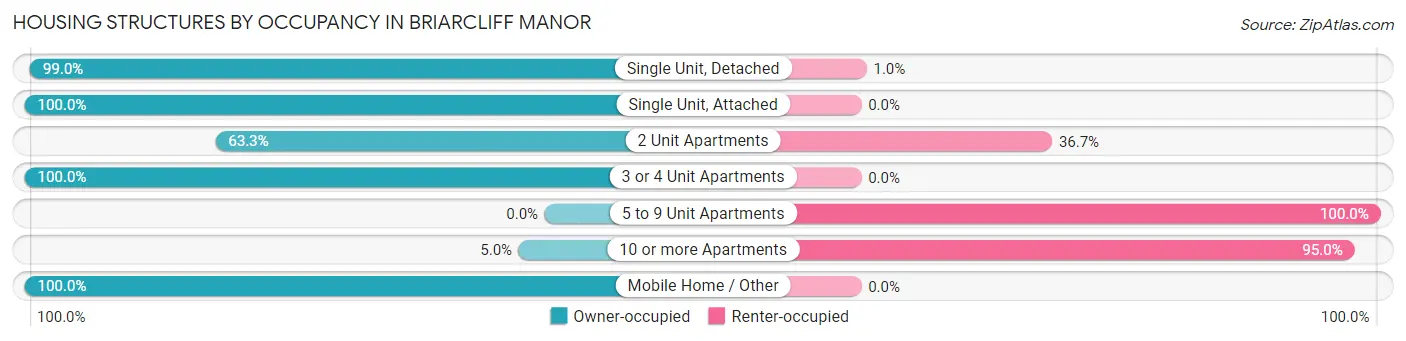
| Structure Type | Owner-occupied | Renter-occupied |
| Single Unit, Detached | 1,732 (99.0%) | 18 (1.0%) |
| Single Unit, Attached | 331 (100.0%) | 0 (0.0%) |
| 2 Unit Apartments | 31 (63.3%) | 18 (36.7%) |
| 3 or 4 Unit Apartments | 48 (100.0%) | 0 (0.0%) |
| 5 to 9 Unit Apartments | 0 (0.0%) | 111 (100.0%) |
| 10 or more Apartments | 20 (5.0%) | 379 (95.0%) |
| Mobile Home / Other | 21 (100.0%) | 0 (0.0%) |
| Total | 2,183 (80.6%) | 526 (19.4%) |
Housing Structures by Number of Rooms in Briarcliff Manor
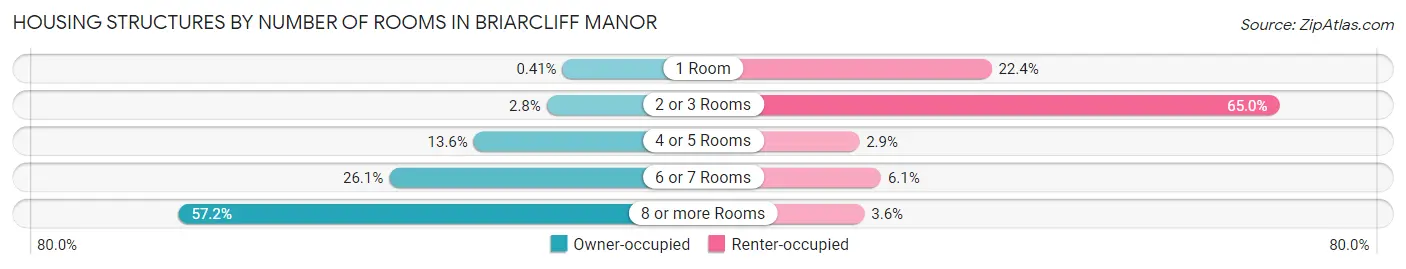
| Number of Rooms | Owner-occupied | Renter-occupied |
| 1 Room | 9 (0.4%) | 118 (22.4%) |
| 2 or 3 Rooms | 60 (2.8%) | 342 (65.0%) |
| 4 or 5 Rooms | 296 (13.6%) | 15 (2.9%) |
| 6 or 7 Rooms | 569 (26.1%) | 32 (6.1%) |
| 8 or more Rooms | 1,249 (57.2%) | 19 (3.6%) |
| Total | 2,183 (100.0%) | 526 (100.0%) |
Housing Structure by Heating Type in Briarcliff Manor
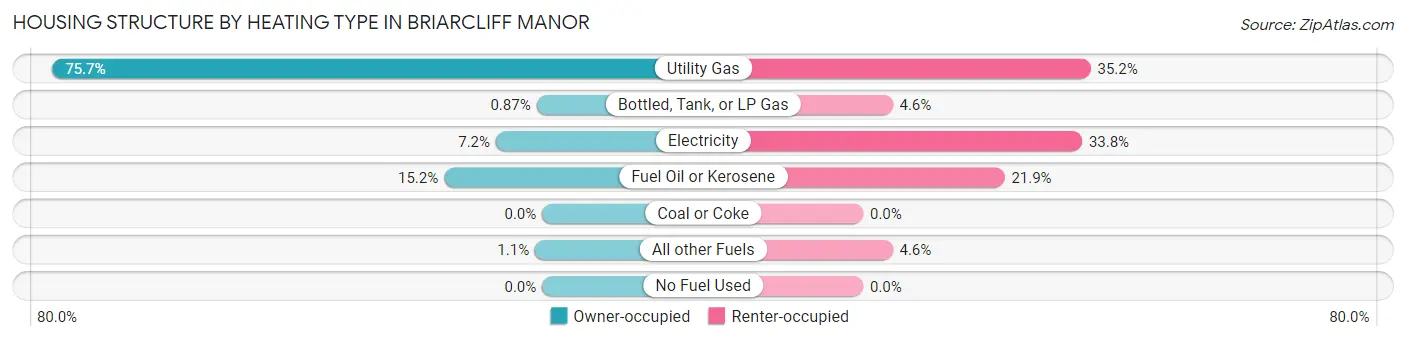
| Heating Type | Owner-occupied | Renter-occupied |
| Utility Gas | 1,653 (75.7%) | 185 (35.2%) |
| Bottled, Tank, or LP Gas | 19 (0.9%) | 24 (4.6%) |
| Electricity | 156 (7.1%) | 178 (33.8%) |
| Fuel Oil or Kerosene | 331 (15.2%) | 115 (21.9%) |
| Coal or Coke | 0 (0.0%) | 0 (0.0%) |
| All other Fuels | 24 (1.1%) | 24 (4.6%) |
| No Fuel Used | 0 (0.0%) | 0 (0.0%) |
| Total | 2,183 (100.0%) | 526 (100.0%) |
Household Vehicle Usage in Briarcliff Manor
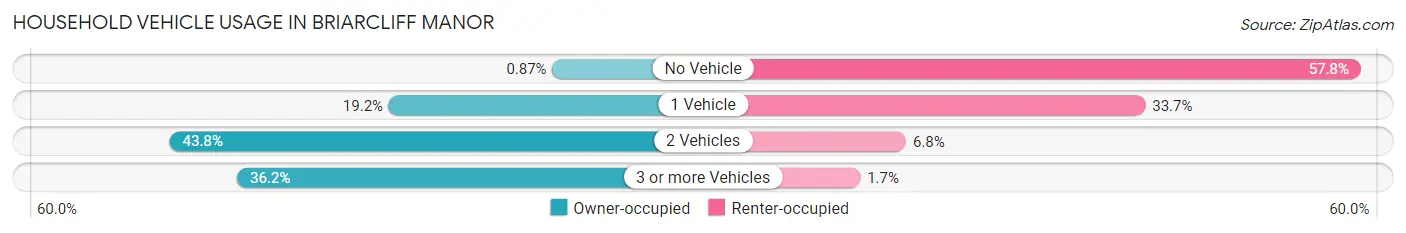
| Vehicles per Household | Owner-occupied | Renter-occupied |
| No Vehicle | 19 (0.9%) | 304 (57.8%) |
| 1 Vehicle | 419 (19.2%) | 177 (33.7%) |
| 2 Vehicles | 955 (43.8%) | 36 (6.8%) |
| 3 or more Vehicles | 790 (36.2%) | 9 (1.7%) |
| Total | 2,183 (100.0%) | 526 (100.0%) |
Real Estate & Mortgages in Briarcliff Manor
Real Estate and Mortgage Overview in Briarcliff Manor
| Characteristic | Without Mortgage | With Mortgage |
| Housing Units | 592 | 1,591 |
| Median Property Value | $825,900 | $827,100 |
| Median Household Income | $190,833 | $1,287 |
| Monthly Housing Costs | $1,501 | $1,394 |
| Real Estate Taxes | $10,001 | $20 |
Property Value by Mortgage Status in Briarcliff Manor
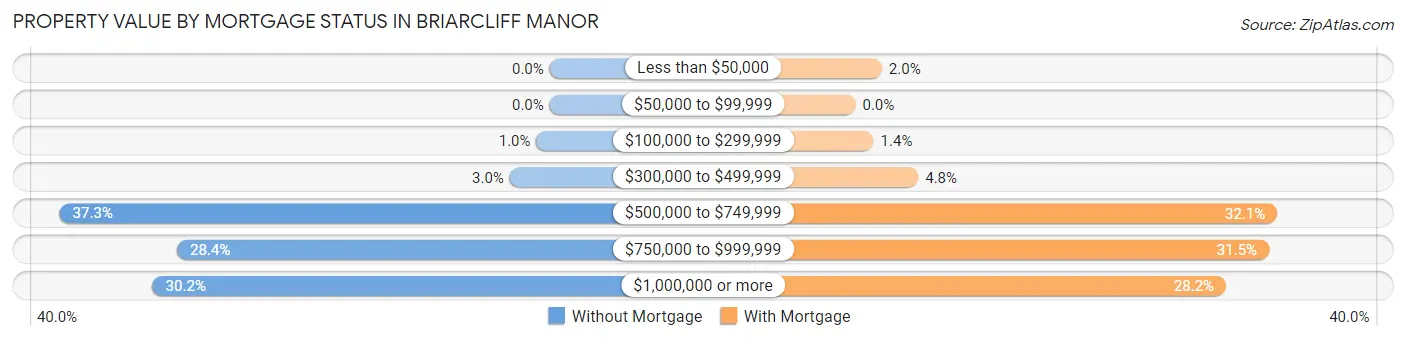
| Property Value | Without Mortgage | With Mortgage |
| Less than $50,000 | 0 (0.0%) | 32 (2.0%) |
| $50,000 to $99,999 | 0 (0.0%) | 0 (0.0%) |
| $100,000 to $299,999 | 6 (1.0%) | 22 (1.4%) |
| $300,000 to $499,999 | 18 (3.0%) | 76 (4.8%) |
| $500,000 to $749,999 | 221 (37.3%) | 511 (32.1%) |
| $750,000 to $999,999 | 168 (28.4%) | 501 (31.5%) |
| $1,000,000 or more | 179 (30.2%) | 449 (28.2%) |
| Total | 592 (100.0%) | 1,591 (100.0%) |
Household Income by Mortgage Status in Briarcliff Manor
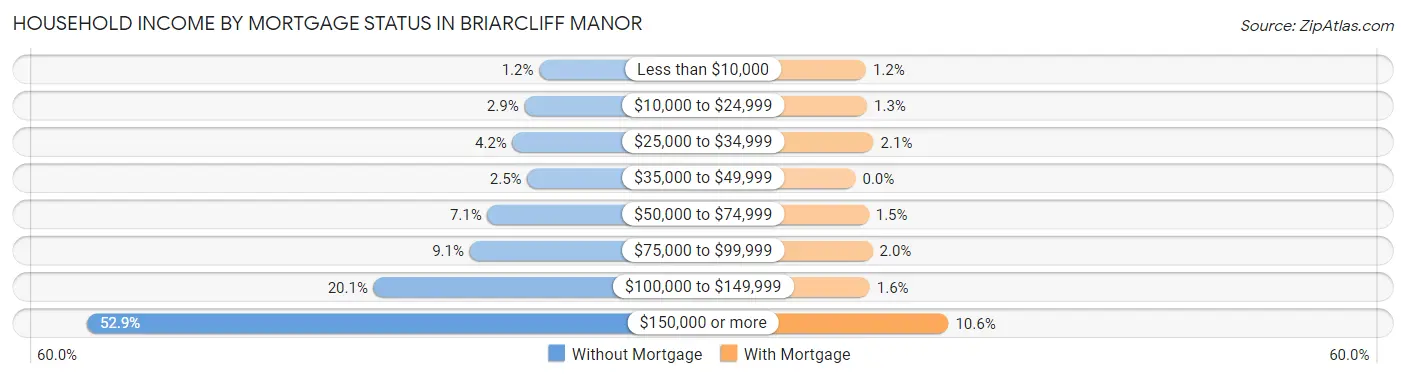
| Household Income | Without Mortgage | With Mortgage |
| Less than $10,000 | 7 (1.2%) | 19 (1.2%) |
| $10,000 to $24,999 | 17 (2.9%) | 21 (1.3%) |
| $25,000 to $34,999 | 25 (4.2%) | 33 (2.1%) |
| $35,000 to $49,999 | 15 (2.5%) | 0 (0.0%) |
| $50,000 to $74,999 | 42 (7.1%) | 24 (1.5%) |
| $75,000 to $99,999 | 54 (9.1%) | 31 (1.9%) |
| $100,000 to $149,999 | 119 (20.1%) | 26 (1.6%) |
| $150,000 or more | 313 (52.9%) | 169 (10.6%) |
| Total | 592 (100.0%) | 1,591 (100.0%) |
Property Value to Household Income Ratio in Briarcliff Manor
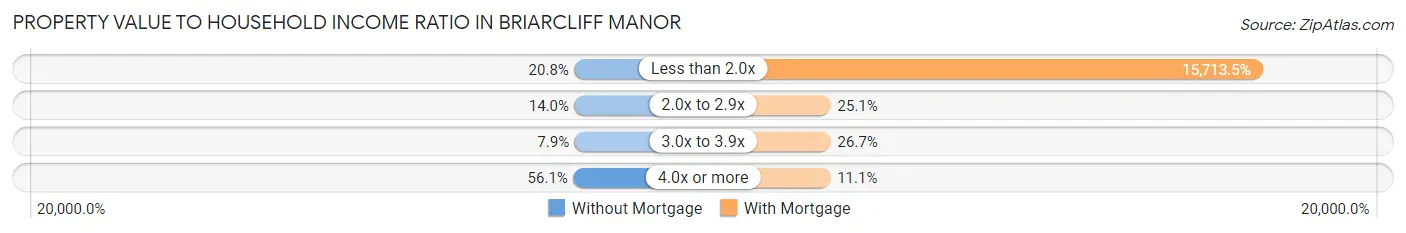
| Value-to-Income Ratio | Without Mortgage | With Mortgage |
| Less than 2.0x | 123 (20.8%) | 250,001 (15,713.5%) |
| 2.0x to 2.9x | 83 (14.0%) | 399 (25.1%) |
| 3.0x to 3.9x | 47 (7.9%) | 425 (26.7%) |
| 4.0x or more | 332 (56.1%) | 177 (11.1%) |
| Total | 592 (100.0%) | 1,591 (100.0%) |
Real Estate Taxes by Mortgage Status in Briarcliff Manor
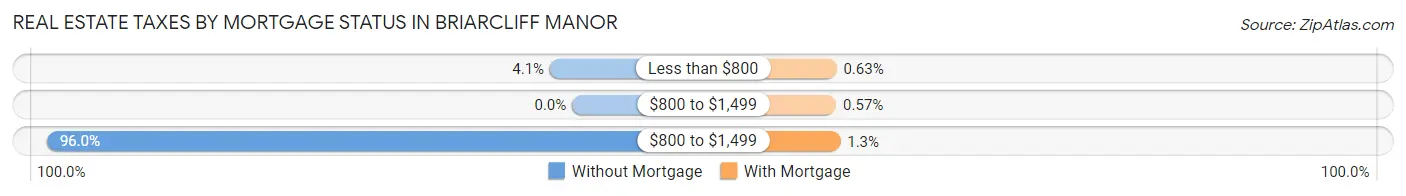
| Property Taxes | Without Mortgage | With Mortgage |
| Less than $800 | 24 (4.1%) | 10 (0.6%) |
| $800 to $1,499 | 0 (0.0%) | 9 (0.6%) |
| $800 to $1,499 | 568 (96.0%) | 21 (1.3%) |
| Total | 592 (100.0%) | 1,591 (100.0%) |
Health & Disability in Briarcliff Manor
Health Insurance Coverage by Age in Briarcliff Manor
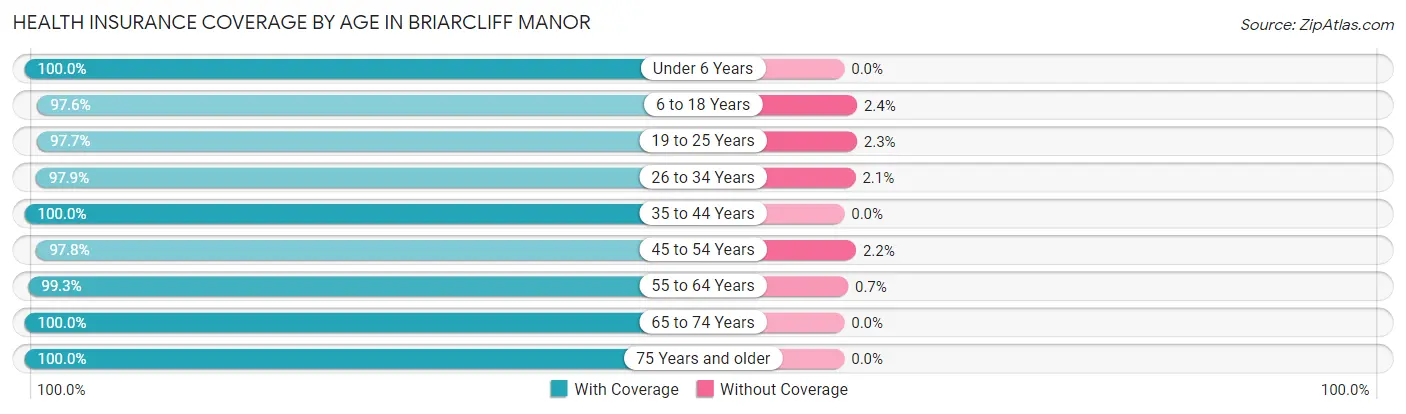
| Age Bracket | With Coverage | Without Coverage |
| Under 6 Years | 407 (100.0%) | 0 (0.0%) |
| 6 to 18 Years | 1,196 (97.6%) | 29 (2.4%) |
| 19 to 25 Years | 584 (97.7%) | 14 (2.3%) |
| 26 to 34 Years | 468 (97.9%) | 10 (2.1%) |
| 35 to 44 Years | 736 (100.0%) | 0 (0.0%) |
| 45 to 54 Years | 1,034 (97.8%) | 23 (2.2%) |
| 55 to 64 Years | 1,132 (99.3%) | 8 (0.7%) |
| 65 to 74 Years | 793 (100.0%) | 0 (0.0%) |
| 75 Years and older | 842 (100.0%) | 0 (0.0%) |
| Total | 7,192 (98.9%) | 84 (1.1%) |
Health Insurance Coverage by Citizenship Status in Briarcliff Manor
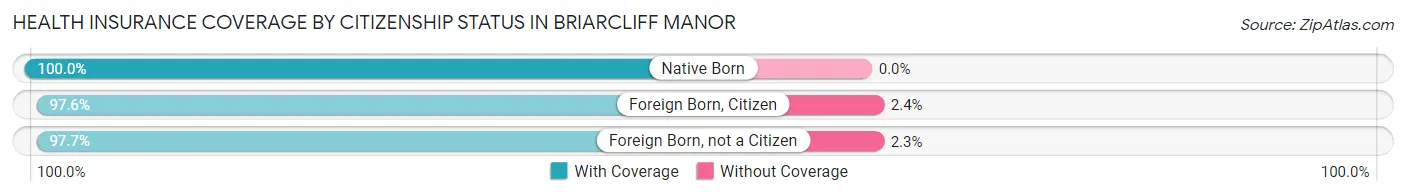
| Citizenship Status | With Coverage | Without Coverage |
| Native Born | 407 (100.0%) | 0 (0.0%) |
| Foreign Born, Citizen | 1,196 (97.6%) | 29 (2.4%) |
| Foreign Born, not a Citizen | 584 (97.7%) | 14 (2.3%) |
Health Insurance Coverage by Household Income in Briarcliff Manor
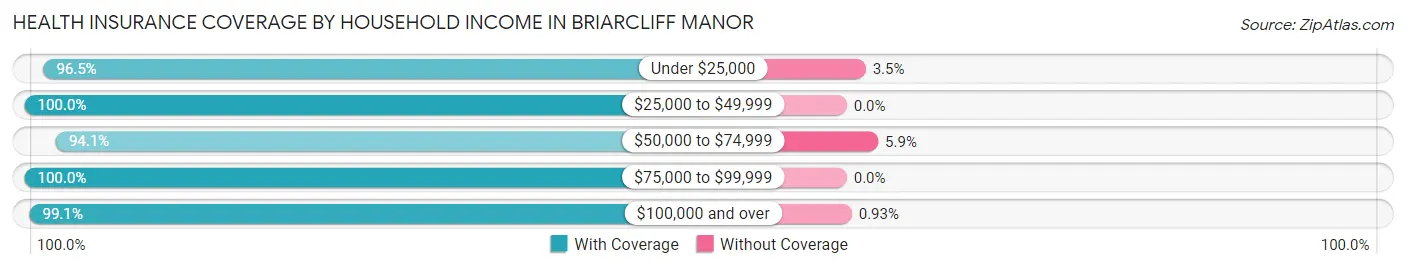
| Household Income | With Coverage | Without Coverage |
| Under $25,000 | 490 (96.5%) | 18 (3.5%) |
| $25,000 to $49,999 | 255 (100.0%) | 0 (0.0%) |
| $50,000 to $74,999 | 160 (94.1%) | 10 (5.9%) |
| $75,000 to $99,999 | 298 (100.0%) | 0 (0.0%) |
| $100,000 and over | 5,842 (99.1%) | 55 (0.9%) |
Public vs Private Health Insurance Coverage by Age in Briarcliff Manor
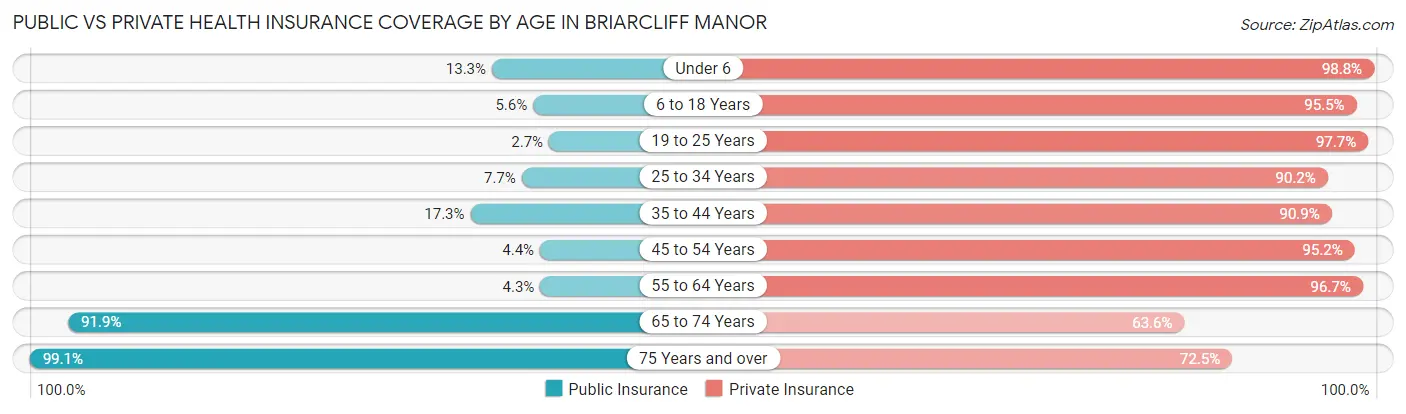
| Age Bracket | Public Insurance | Private Insurance |
| Under 6 | 54 (13.3%) | 402 (98.8%) |
| 6 to 18 Years | 69 (5.6%) | 1,170 (95.5%) |
| 19 to 25 Years | 16 (2.7%) | 584 (97.7%) |
| 25 to 34 Years | 37 (7.7%) | 431 (90.2%) |
| 35 to 44 Years | 127 (17.3%) | 669 (90.9%) |
| 45 to 54 Years | 46 (4.3%) | 1,006 (95.2%) |
| 55 to 64 Years | 49 (4.3%) | 1,102 (96.7%) |
| 65 to 74 Years | 729 (91.9%) | 504 (63.6%) |
| 75 Years and over | 834 (99.1%) | 610 (72.5%) |
| Total | 1,961 (27.0%) | 6,478 (89.0%) |
Disability Status by Sex by Age in Briarcliff Manor
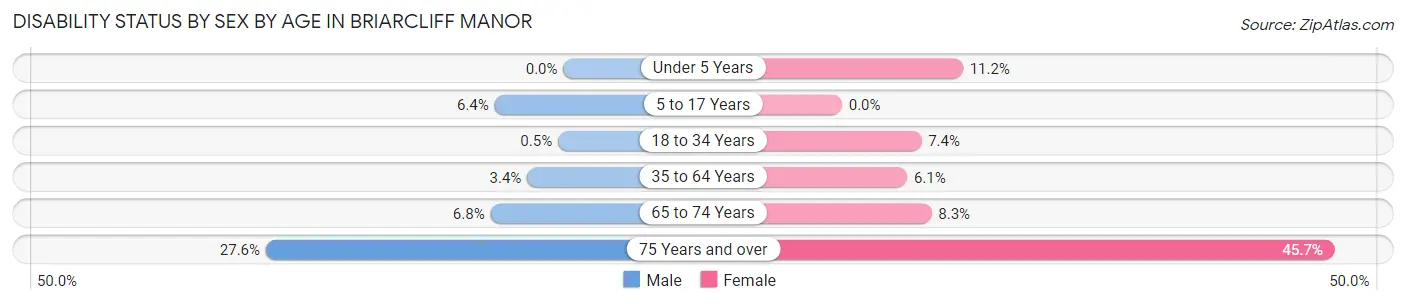
| Age Bracket | Male | Female |
| Under 5 Years | 0 (0.0%) | 11 (11.2%) |
| 5 to 17 Years | 51 (6.4%) | 0 (0.0%) |
| 18 to 34 Years | 3 (0.5%) | 40 (7.4%) |
| 35 to 64 Years | 48 (3.4%) | 91 (6.0%) |
| 65 to 74 Years | 30 (6.8%) | 29 (8.3%) |
| 75 Years and over | 90 (27.6%) | 236 (45.7%) |
Disability Class by Sex by Age in Briarcliff Manor
Disability Class: Hearing Difficulty
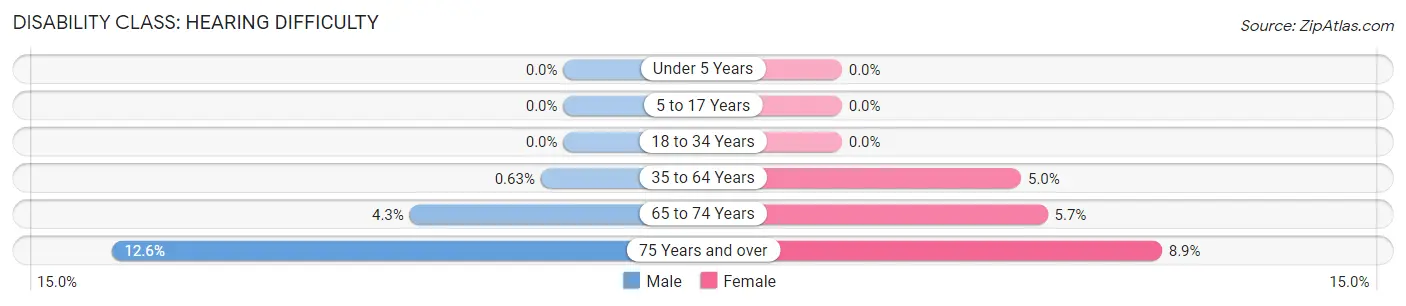
| Age Bracket | Male | Female |
| Under 5 Years | 0 (0.0%) | 0 (0.0%) |
| 5 to 17 Years | 0 (0.0%) | 0 (0.0%) |
| 18 to 34 Years | 0 (0.0%) | 0 (0.0%) |
| 35 to 64 Years | 9 (0.6%) | 75 (5.0%) |
| 65 to 74 Years | 19 (4.3%) | 20 (5.7%) |
| 75 Years and over | 41 (12.6%) | 46 (8.9%) |
Disability Class: Vision Difficulty
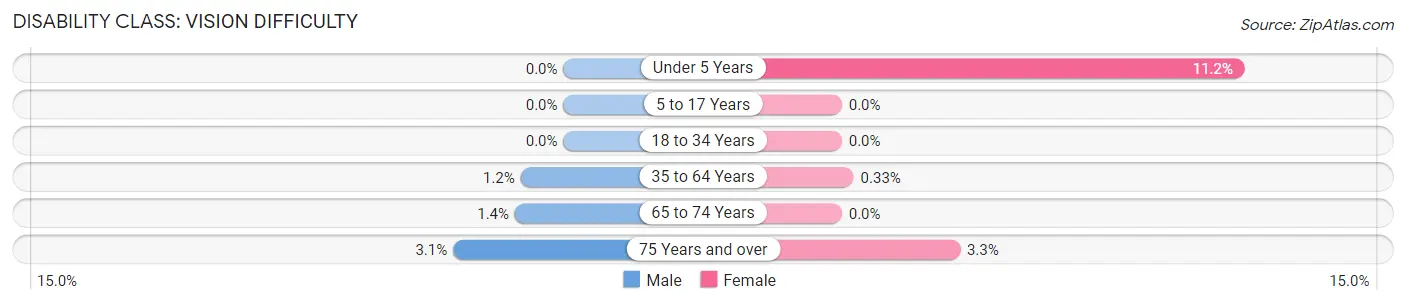
| Age Bracket | Male | Female |
| Under 5 Years | 0 (0.0%) | 11 (11.2%) |
| 5 to 17 Years | 0 (0.0%) | 0 (0.0%) |
| 18 to 34 Years | 0 (0.0%) | 0 (0.0%) |
| 35 to 64 Years | 17 (1.2%) | 5 (0.3%) |
| 65 to 74 Years | 6 (1.3%) | 0 (0.0%) |
| 75 Years and over | 10 (3.1%) | 17 (3.3%) |
Disability Class: Cognitive Difficulty
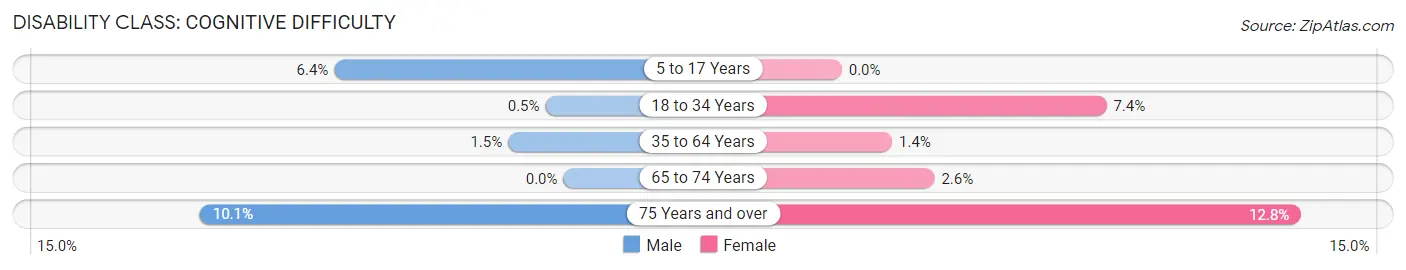
| Age Bracket | Male | Female |
| 5 to 17 Years | 51 (6.4%) | 0 (0.0%) |
| 18 to 34 Years | 3 (0.5%) | 40 (7.4%) |
| 35 to 64 Years | 22 (1.5%) | 21 (1.4%) |
| 65 to 74 Years | 0 (0.0%) | 9 (2.6%) |
| 75 Years and over | 33 (10.1%) | 66 (12.8%) |
Disability Class: Ambulatory Difficulty
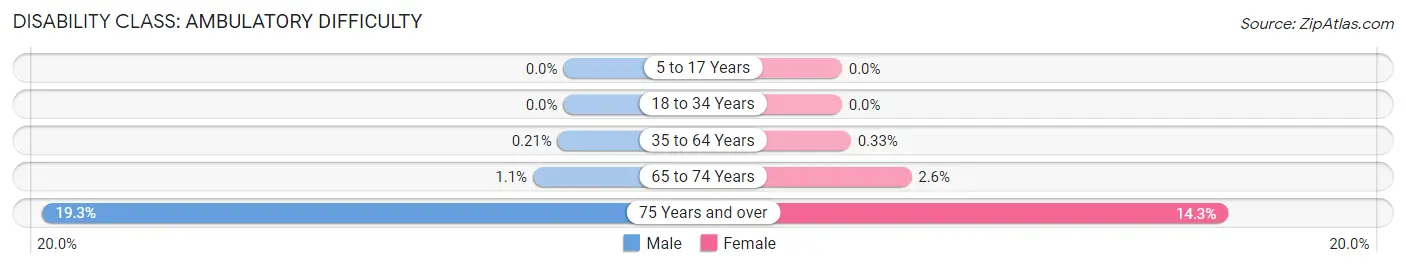
| Age Bracket | Male | Female |
| 5 to 17 Years | 0 (0.0%) | 0 (0.0%) |
| 18 to 34 Years | 0 (0.0%) | 0 (0.0%) |
| 35 to 64 Years | 3 (0.2%) | 5 (0.3%) |
| 65 to 74 Years | 5 (1.1%) | 9 (2.6%) |
| 75 Years and over | 63 (19.3%) | 74 (14.3%) |
Disability Class: Self-Care Difficulty
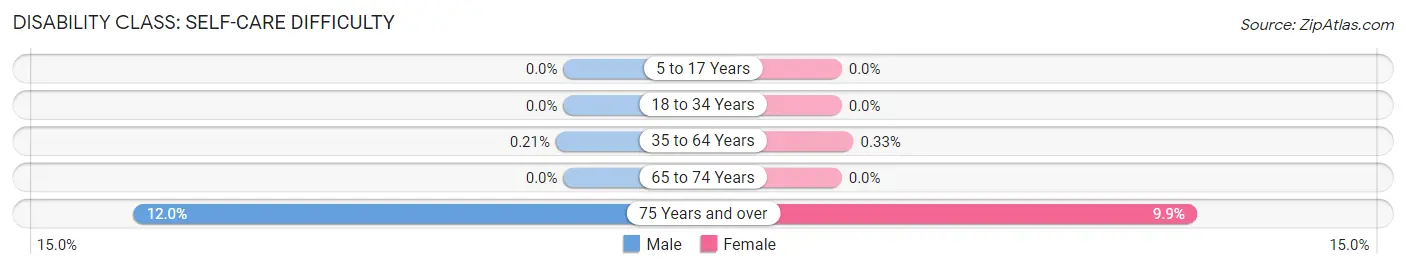
| Age Bracket | Male | Female |
| 5 to 17 Years | 0 (0.0%) | 0 (0.0%) |
| 18 to 34 Years | 0 (0.0%) | 0 (0.0%) |
| 35 to 64 Years | 3 (0.2%) | 5 (0.3%) |
| 65 to 74 Years | 0 (0.0%) | 0 (0.0%) |
| 75 Years and over | 39 (12.0%) | 51 (9.9%) |
Technology Access in Briarcliff Manor
Computing Device Access in Briarcliff Manor
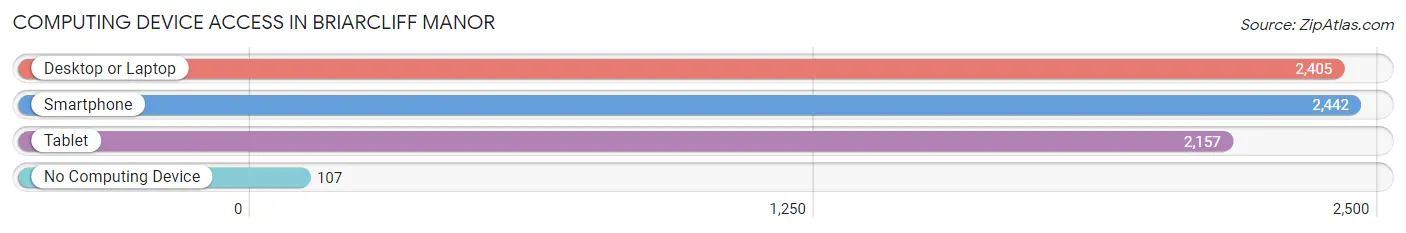
| Device Type | # Households | % Households |
| Desktop or Laptop | 2,405 | 88.8% |
| Smartphone | 2,442 | 90.1% |
| Tablet | 2,157 | 79.6% |
| No Computing Device | 107 | 4.0% |
| Total | 2,709 | 100.0% |
Internet Access in Briarcliff Manor
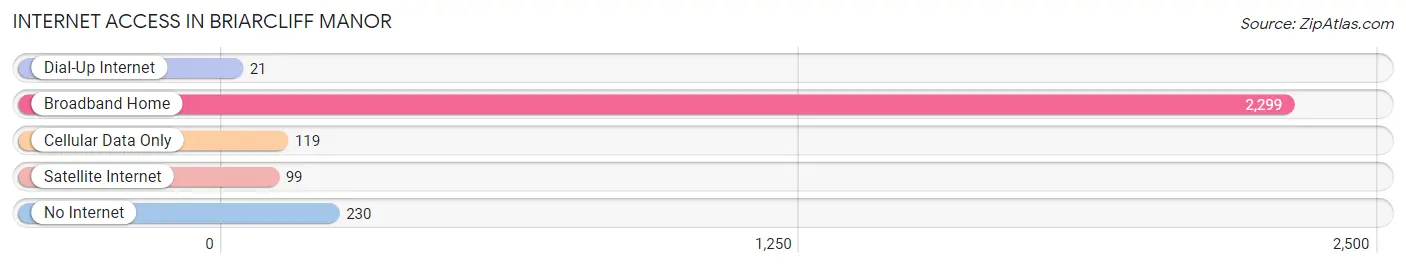
| Internet Type | # Households | % Households |
| Dial-Up Internet | 21 | 0.8% |
| Broadband Home | 2,299 | 84.9% |
| Cellular Data Only | 119 | 4.4% |
| Satellite Internet | 99 | 3.6% |
| No Internet | 230 | 8.5% |
| Total | 2,709 | 100.0% |
Briarcliff Manor Summary
Briarcliff Manor is a village located in Westchester County, New York, United States. It is situated on the Hudson River, about 30 miles north of New York City. The village is part of the town of Mount Pleasant. As of the 2010 census, the village had a population of 7,867.
History
The area that is now Briarcliff Manor was originally inhabited by the Siwanoy Indians, a branch of the Wappinger Confederacy. The first European settlers arrived in the area in the late 17th century. The area was originally part of the Philipsburg Manor, a large estate owned by the Philips family. In 1775, the Philips family sold the land to Walter William Law, who developed the area into a planned community. Law named the community after his family estate in England, Briarcliff Lodge.
In 1902, the village of Briarcliff Manor was incorporated. The village was designed to be a residential community, and it was zoned to prohibit commercial development. The village was also designed to be a commuter community, with easy access to New York City via the Hudson Line of the Metro-North Railroad.
Geography
Briarcliff Manor is located in Westchester County, New York, about 30 miles north of New York City. The village is situated on the east bank of the Hudson River, and is bordered by the towns of Ossining to the north, Mount Pleasant to the east, and New Castle to the south.
The village has a total area of 5.1 square miles, of which 4.9 square miles is land and 0.2 square miles is water. The village is located in the Hudson Valley region of New York, and is part of the Hudson Highlands.
Economy
The economy of Briarcliff Manor is largely based on the service industry. The village is home to several corporate headquarters, including PepsiCo, IBM, and Reader's Digest. The village is also home to several medical centers, including the Westchester Medical Center and the Phelps Memorial Hospital Center.
The village is also home to several educational institutions, including Pace University, the College of New Rochelle, and the Briarcliff Manor School District.
Demographics
As of the 2010 census, the village had a population of 7,867. The racial makeup of the village was 87.2% White, 4.3% African American, 0.2% Native American, 4.7% Asian, 0.1% Pacific Islander, 1.3% from other races, and 2.3% from two or more races. Hispanic or Latino of any race were 5.3% of the population.
The median household income in the village was $125,917, and the median family income was $150,917. The per capita income for the village was $60,917. About 2.3% of families and 3.7% of the population were below the poverty line, including 4.2% of those under age 18 and 2.3% of those age 65 or over.
Common Questions
What is the Total Population of Briarcliff Manor?
Total Population of Briarcliff Manor is 7,395.
What is the Total Male Population of Briarcliff Manor?
Total Male Population of Briarcliff Manor is 3,772.
What is the Total Female Population of Briarcliff Manor?
Total Female Population of Briarcliff Manor is 3,623.
What is the Ratio of Males per 100 Females in Briarcliff Manor?
There are 104.11 Males per 100 Females in Briarcliff Manor.
What is the Ratio of Females per 100 Males in Briarcliff Manor?
There are 96.05 Females per 100 Males in Briarcliff Manor.
What is the Median Population Age in Briarcliff Manor?
Median Population Age in Briarcliff Manor is 47.7 Years.
What is the Average Family Size in Briarcliff Manor
Average Family Size in Briarcliff Manor is 3.0 People.
What is the Average Household Size in Briarcliff Manor
Average Household Size in Briarcliff Manor is 2.6 People.
What is Per Capita Income in Briarcliff Manor?
Per Capita income in Briarcliff Manor is $111,008.
What is the Median Family Income in Briarcliff Manor?
Median Family Income in Briarcliff Manor is $250,001.
What is the Median Household income in Briarcliff Manor?
Median Household Income in Briarcliff Manor is $208,988.
What is Income or Wage Gap in Briarcliff Manor?
Income or Wage Gap in Briarcliff Manor is 40.3%.
Women in Briarcliff Manor earn 59.7 cents for every dollar earned by a man.
What is Family Income Deficit in Briarcliff Manor?
Family Income Deficit in Briarcliff Manor is $9,725.
Families that are below poverty line in Briarcliff Manor earn $9,725 less on average than the poverty threshold level.
What is Inequality or Gini Index in Briarcliff Manor?
Inequality or Gini Index in Briarcliff Manor is 0.51.
How Large is the Labor Force in Briarcliff Manor?
There are 3,815 People in the Labor Forcein in Briarcliff Manor.
What is the Percentage of People in the Labor Force in Briarcliff Manor?
62.3% of People are in the Labor Force in Briarcliff Manor.
What is the Unemployment Rate in Briarcliff Manor?
Unemployment Rate in Briarcliff Manor is 4.0%.