Watertown, NY
Watertown Map
Watertown Overview
24,859
TOTAL POPULATION
12,877
MALE POPULATION
11,982
FEMALE POPULATION
107.47
MALES / 100 FEMALES
93.05
FEMALES / 100 MALES
35.1
MEDIAN AGE
2.9
AVG FAMILY SIZE
2.1
AVG HOUSEHOLD SIZE
$32,679
PER CAPITA INCOME
$66,848
AVG FAMILY INCOME
$49,722
AVG HOUSEHOLD INCOME
21.5%
WAGE / INCOME GAP [ % ]
78.5¢/ $1
WAGE / INCOME GAP [ $ ]
$11,818
FAMILY INCOME DEFICIT
0.49
INEQUALITY / GINI INDEX
12,335
LABOR FORCE [ PEOPLE ]
61.9%
PERCENT IN LABOR FORCE
6.3%
UNEMPLOYMENT RATE
Watertown Area Codes
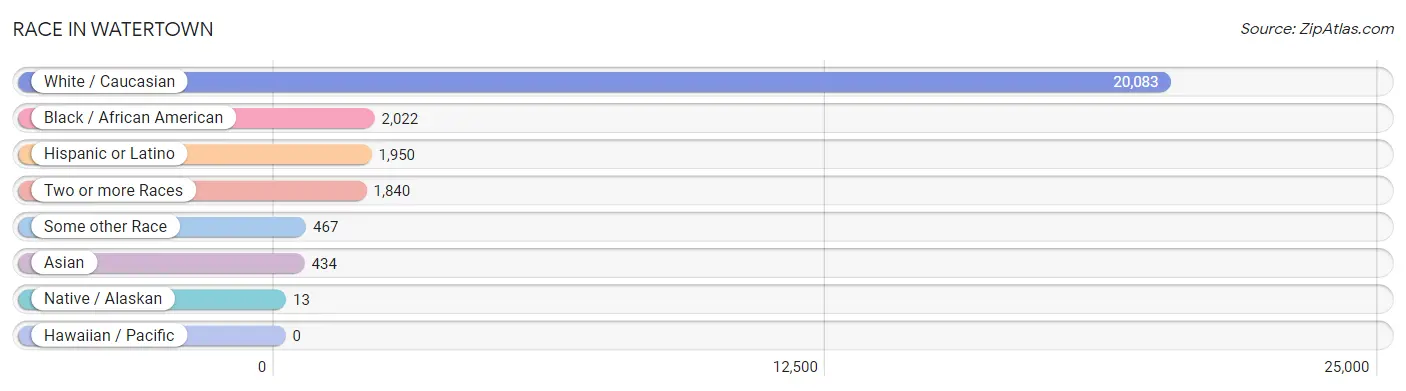
Race in Watertown
The most populous races in Watertown are White / Caucasian (20,083 | 80.8%), Black / African American (2,022 | 8.1%), and Hispanic or Latino (1,950 | 7.8%).
| Race | # Population | % Population |
| Asian | 434 | 1.8% |
| Black / African American | 2,022 | 8.1% |
| Hawaiian / Pacific | 0 | 0.0% |
| Hispanic or Latino | 1,950 | 7.8% |
| Native / Alaskan | 13 | 0.1% |
| White / Caucasian | 20,083 | 80.8% |
| Two or more Races | 1,840 | 7.4% |
| Some other Race | 467 | 1.9% |
| Total | 24,859 | 100.0% |
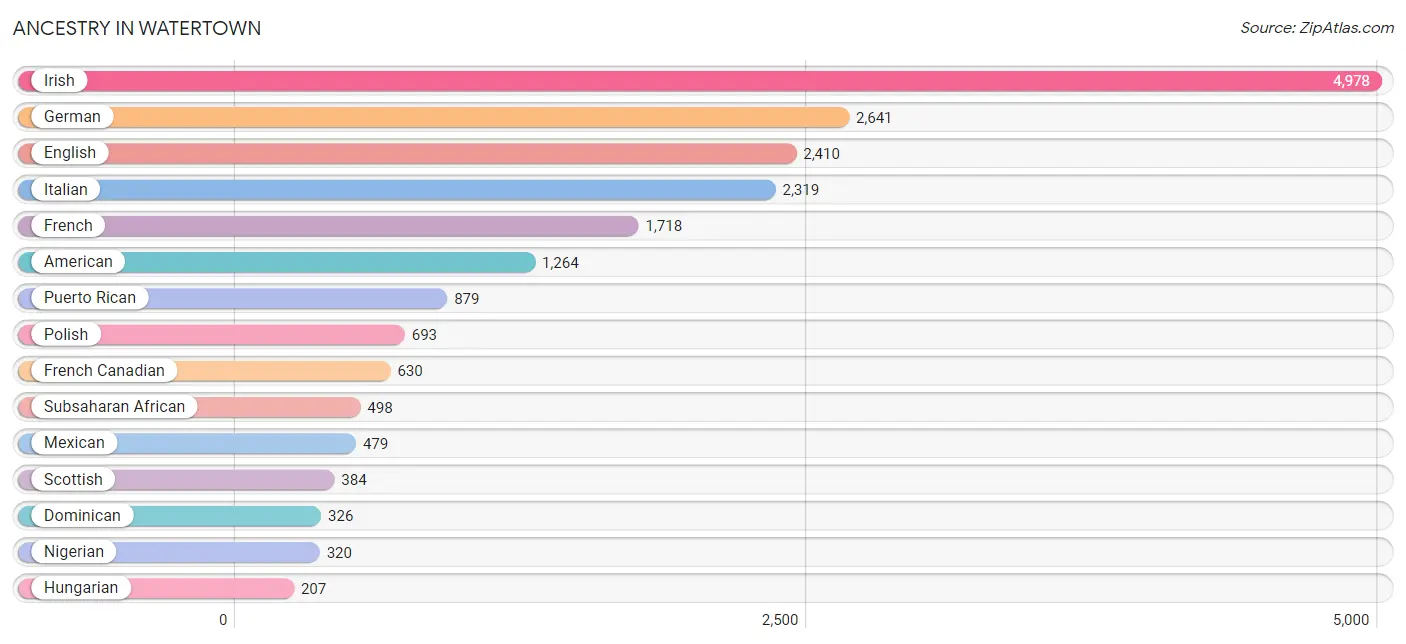
Ancestry in Watertown
The most populous ancestries reported in Watertown are Irish (4,978 | 20.0%), German (2,641 | 10.6%), English (2,410 | 9.7%), Italian (2,319 | 9.3%), and French (1,718 | 6.9%), together accounting for 56.6% of all Watertown residents.
| Ancestry | # Population | % Population |
| Afghan | 1 | 0.0% |
| African | 139 | 0.6% |
| American | 1,264 | 5.1% |
| Arab | 81 | 0.3% |
| Austrian | 51 | 0.2% |
| Belgian | 17 | 0.1% |
| Belizean | 137 | 0.5% |
| Bhutanese | 52 | 0.2% |
| British | 155 | 0.6% |
| Burmese | 43 | 0.2% |
| Canadian | 117 | 0.5% |
| Central American | 62 | 0.3% |
| Central American Indian | 9 | 0.0% |
| Cherokee | 3 | 0.0% |
| Cree | 6 | 0.0% |
| Cuban | 19 | 0.1% |
| Czech | 44 | 0.2% |
| Danish | 50 | 0.2% |
| Dominican | 326 | 1.3% |
| Dutch | 153 | 0.6% |
| Eastern European | 12 | 0.1% |
| Ecuadorian | 45 | 0.2% |
| Egyptian | 14 | 0.1% |
| English | 2,410 | 9.7% |
| Ethiopian | 39 | 0.2% |
| European | 159 | 0.6% |
| Finnish | 8 | 0.0% |
| French | 1,718 | 6.9% |
| French American Indian | 9 | 0.0% |
| French Canadian | 630 | 2.5% |
| German | 2,641 | 10.6% |
| Greek | 87 | 0.4% |
| Haitian | 18 | 0.1% |
| Hungarian | 207 | 0.8% |
| Indian (Asian) | 183 | 0.7% |
| Irish | 4,978 | 20.0% |
| Iroquois | 9 | 0.0% |
| Italian | 2,319 | 9.3% |
| Jamaican | 105 | 0.4% |
| Korean | 144 | 0.6% |
| Laotian | 13 | 0.1% |
| Lebanese | 20 | 0.1% |
| Lithuanian | 35 | 0.1% |
| Mexican | 479 | 1.9% |
| Native Hawaiian | 6 | 0.0% |
| Nicaraguan | 9 | 0.0% |
| Nigerian | 320 | 1.3% |
| Northern European | 34 | 0.1% |
| Norwegian | 175 | 0.7% |
| Peruvian | 24 | 0.1% |
| Polish | 693 | 2.8% |
| Portuguese | 35 | 0.1% |
| Puerto Rican | 879 | 3.5% |
| Romanian | 94 | 0.4% |
| Russian | 72 | 0.3% |
| Scandinavian | 76 | 0.3% |
| Scotch-Irish | 91 | 0.4% |
| Scottish | 384 | 1.5% |
| Sioux | 10 | 0.0% |
| South American | 69 | 0.3% |
| Spaniard | 10 | 0.0% |
| Sri Lankan | 8 | 0.0% |
| Subsaharan African | 498 | 2.0% |
| Swedish | 128 | 0.5% |
| Syrian | 47 | 0.2% |
| Thai | 155 | 0.6% |
| Turkish | 29 | 0.1% |
| Ukrainian | 152 | 0.6% |
| Welsh | 111 | 0.4% |
| West Indian | 23 | 0.1% | View All 70 Rows |
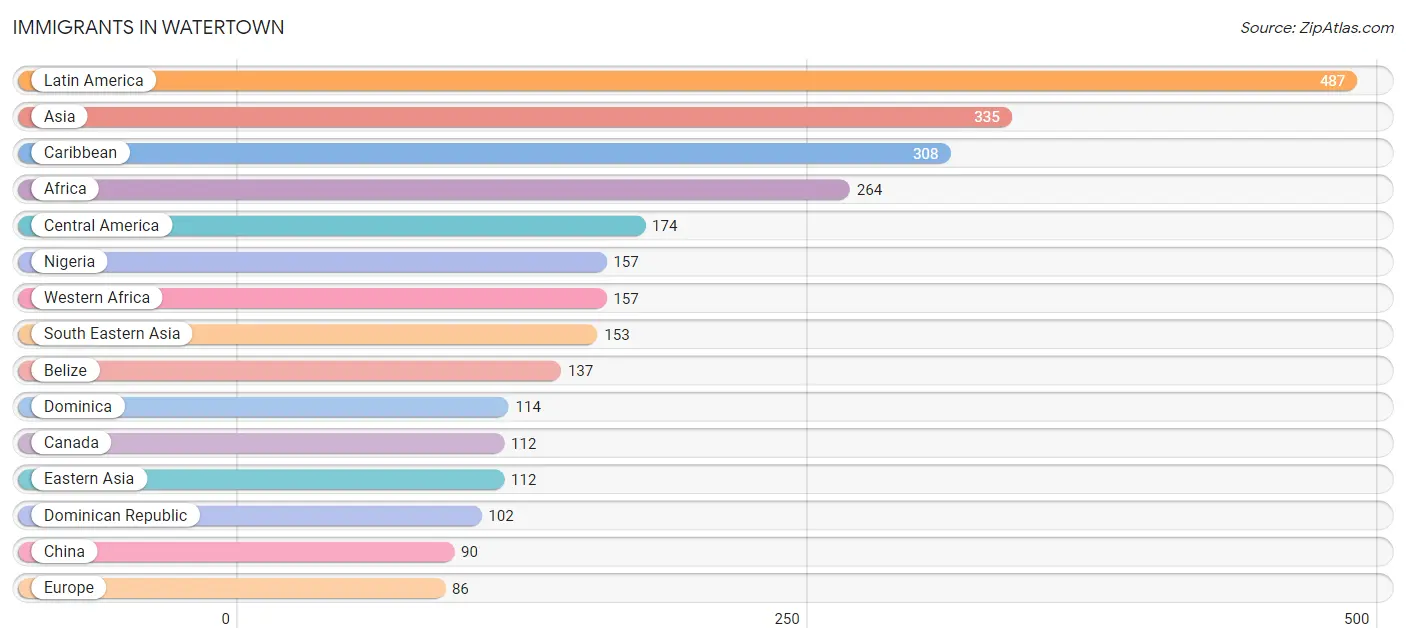
Immigrants in Watertown
The most numerous immigrant groups reported in Watertown came from Latin America (487 | 2.0%), Asia (335 | 1.3%), Caribbean (308 | 1.2%), Africa (264 | 1.1%), and Central America (174 | 0.7%), together accounting for 6.3% of all Watertown residents.
| Immigration Origin | # Population | % Population |
| Afghanistan | 1 | 0.0% |
| Africa | 264 | 1.1% |
| Asia | 335 | 1.3% |
| Belize | 137 | 0.5% |
| Canada | 112 | 0.4% |
| Caribbean | 308 | 1.2% |
| Central America | 174 | 0.7% |
| China | 90 | 0.4% |
| Dominica | 114 | 0.5% |
| Dominican Republic | 102 | 0.4% |
| Eastern Africa | 39 | 0.2% |
| Eastern Asia | 112 | 0.4% |
| Eastern Europe | 38 | 0.2% |
| Eritrea | 39 | 0.2% |
| Europe | 86 | 0.4% |
| Germany | 13 | 0.1% |
| Guyana | 5 | 0.0% |
| Haiti | 19 | 0.1% |
| India | 69 | 0.3% |
| Indonesia | 13 | 0.1% |
| Jamaica | 63 | 0.3% |
| Korea | 22 | 0.1% |
| Latin America | 487 | 2.0% |
| Mexico | 13 | 0.1% |
| Nicaragua | 9 | 0.0% |
| Nigeria | 157 | 0.6% |
| Northern Africa | 67 | 0.3% |
| Northern Europe | 35 | 0.1% |
| Panama | 15 | 0.1% |
| Philippines | 85 | 0.3% |
| Russia | 22 | 0.1% |
| South America | 5 | 0.0% |
| South Central Asia | 70 | 0.3% |
| South Eastern Asia | 153 | 0.6% |
| Sweden | 21 | 0.1% |
| Taiwan | 8 | 0.0% |
| Thailand | 41 | 0.2% |
| Trinidad and Tobago | 10 | 0.0% |
| Ukraine | 16 | 0.1% |
| Vietnam | 8 | 0.0% |
| Western Africa | 157 | 0.6% |
| Western Europe | 13 | 0.1% | View All 42 Rows |
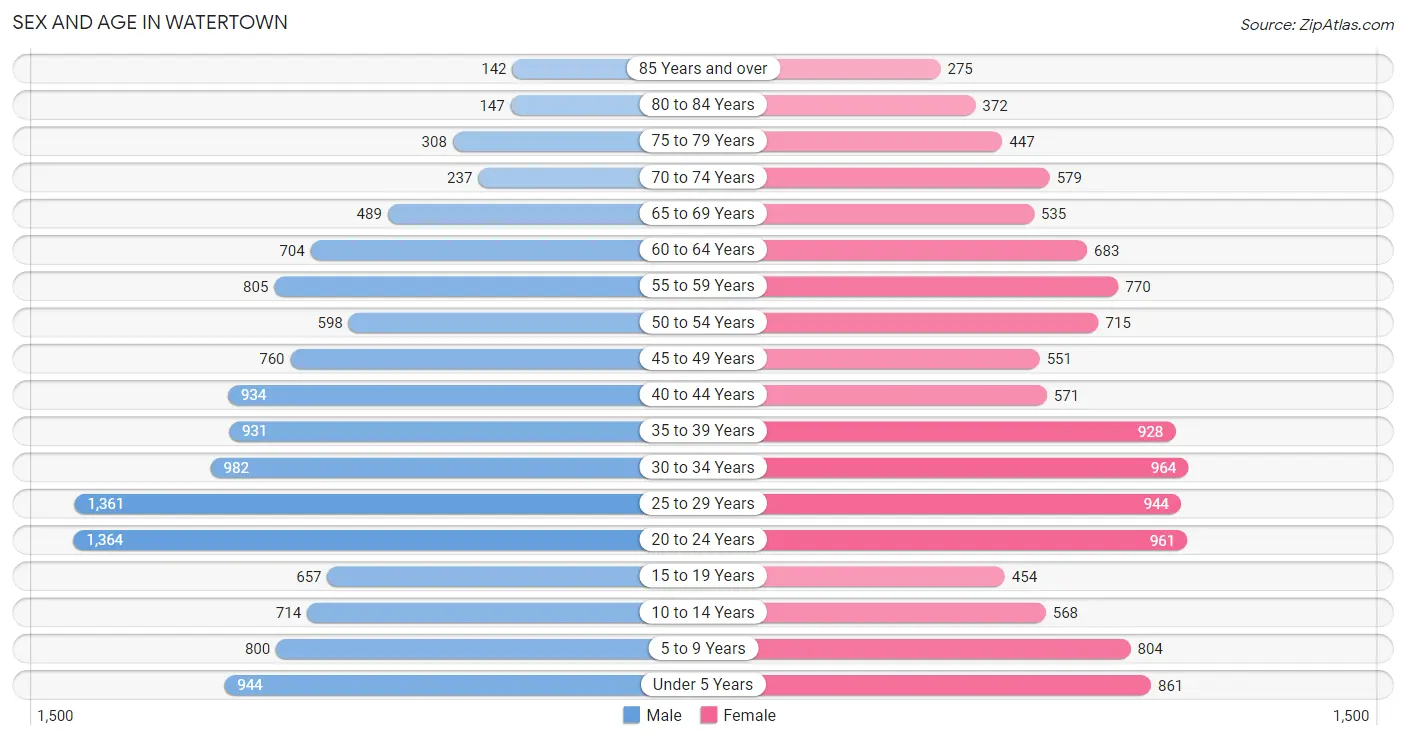
Sex and Age in Watertown
Sex and Age in Watertown
The most populous age groups in Watertown are 20 to 24 Years (1,364 | 10.6%) for men and 30 to 34 Years (964 | 8.1%) for women.
| Age Bracket | Male | Female |
| Under 5 Years | 944 (7.3%) | 861 (7.2%) |
| 5 to 9 Years | 800 (6.2%) | 804 (6.7%) |
| 10 to 14 Years | 714 (5.5%) | 568 (4.7%) |
| 15 to 19 Years | 657 (5.1%) | 454 (3.8%) |
| 20 to 24 Years | 1,364 (10.6%) | 961 (8.0%) |
| 25 to 29 Years | 1,361 (10.6%) | 944 (7.9%) |
| 30 to 34 Years | 982 (7.6%) | 964 (8.1%) |
| 35 to 39 Years | 931 (7.2%) | 928 (7.7%) |
| 40 to 44 Years | 934 (7.2%) | 571 (4.8%) |
| 45 to 49 Years | 760 (5.9%) | 551 (4.6%) |
| 50 to 54 Years | 598 (4.6%) | 715 (6.0%) |
| 55 to 59 Years | 805 (6.2%) | 770 (6.4%) |
| 60 to 64 Years | 704 (5.5%) | 683 (5.7%) |
| 65 to 69 Years | 489 (3.8%) | 535 (4.5%) |
| 70 to 74 Years | 237 (1.8%) | 579 (4.8%) |
| 75 to 79 Years | 308 (2.4%) | 447 (3.7%) |
| 80 to 84 Years | 147 (1.1%) | 372 (3.1%) |
| 85 Years and over | 142 (1.1%) | 275 (2.3%) |
| Total | 12,877 (100.0%) | 11,982 (100.0%) |
Families and Households in Watertown
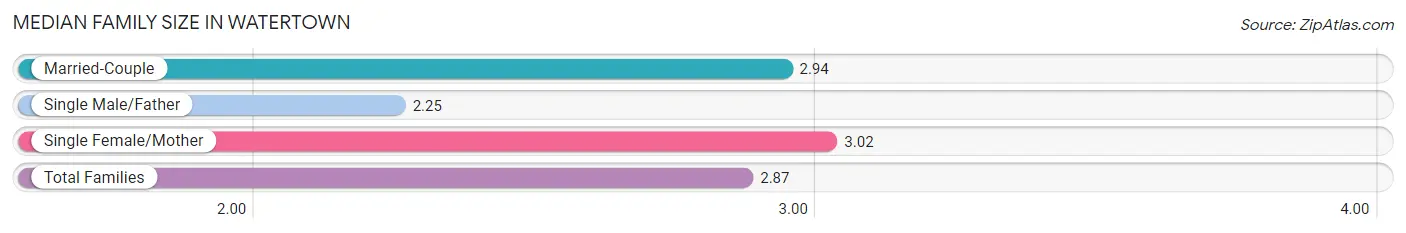
Median Family Size in Watertown
The median family size in Watertown is 2.87 persons per family, with single female/mother families (1,311 | 22.7%) accounting for the largest median family size of 3.02 persons per family. On the other hand, single male/father families (781 | 13.5%) represent the smallest median family size with 2.25 persons per family.
| Family Type | # Families | Family Size |
| Married-Couple | 3,684 (63.8%) | 2.94 |
| Single Male/Father | 781 (13.5%) | 2.25 |
| Single Female/Mother | 1,311 (22.7%) | 3.02 |
| Total Families | 5,776 (100.0%) | 2.87 |
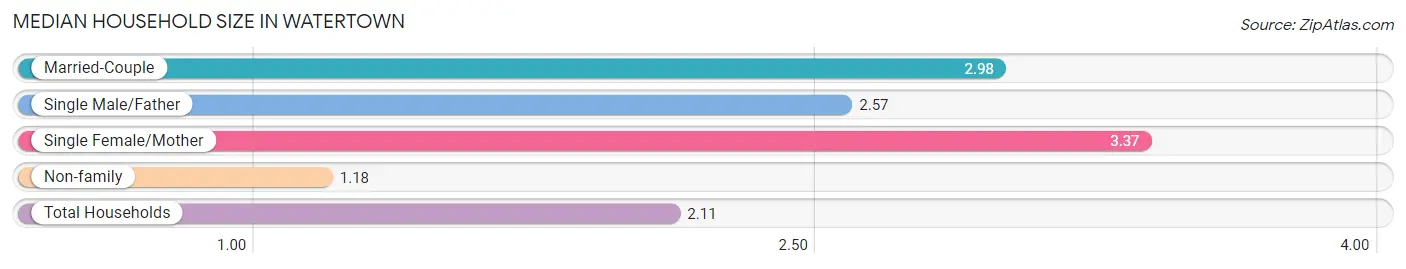
Median Household Size in Watertown
The median household size in Watertown is 2.11 persons per household, with single female/mother households (1,311 | 11.4%) accounting for the largest median household size of 3.37 persons per household. non-family households (5,679 | 49.6%) represent the smallest median household size with 1.18 persons per household.
| Household Type | # Households | Household Size |
| Married-Couple | 3,684 (32.2%) | 2.98 |
| Single Male/Father | 781 (6.8%) | 2.57 |
| Single Female/Mother | 1,311 (11.4%) | 3.37 |
| Non-family | 5,679 (49.6%) | 1.18 |
| Total Households | 11,455 (100.0%) | 2.11 |
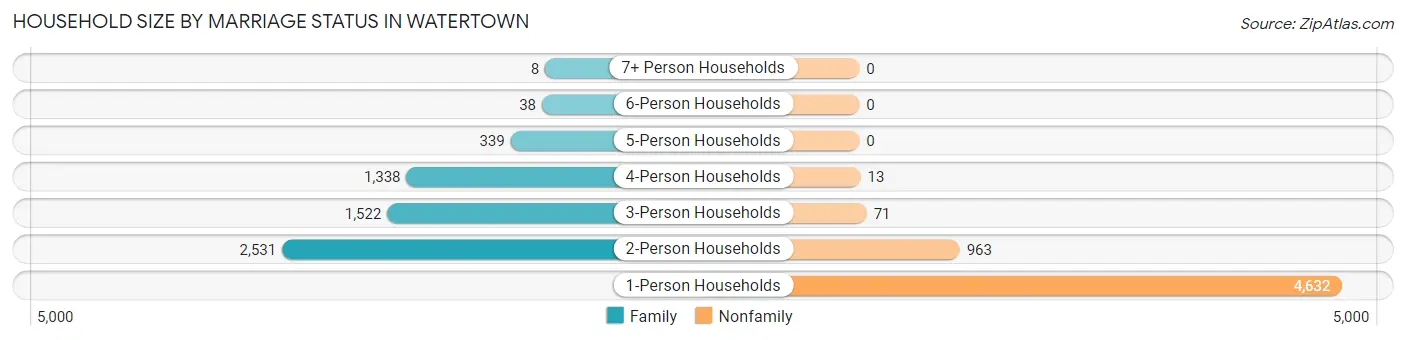
Household Size by Marriage Status in Watertown
Out of a total of 11,455 households in Watertown, 5,776 (50.4%) are family households, while 5,679 (49.6%) are nonfamily households. The most numerous type of family households are 2-person households, comprising 2,531, and the most common type of nonfamily households are 1-person households, comprising 4,632.
| Household Size | Family Households | Nonfamily Households |
| 1-Person Households | - | 4,632 (40.4%) |
| 2-Person Households | 2,531 (22.1%) | 963 (8.4%) |
| 3-Person Households | 1,522 (13.3%) | 71 (0.6%) |
| 4-Person Households | 1,338 (11.7%) | 13 (0.1%) |
| 5-Person Households | 339 (3.0%) | 0 (0.0%) |
| 6-Person Households | 38 (0.3%) | 0 (0.0%) |
| 7+ Person Households | 8 (0.1%) | 0 (0.0%) |
| Total | 5,776 (50.4%) | 5,679 (49.6%) |
Female Fertility in Watertown
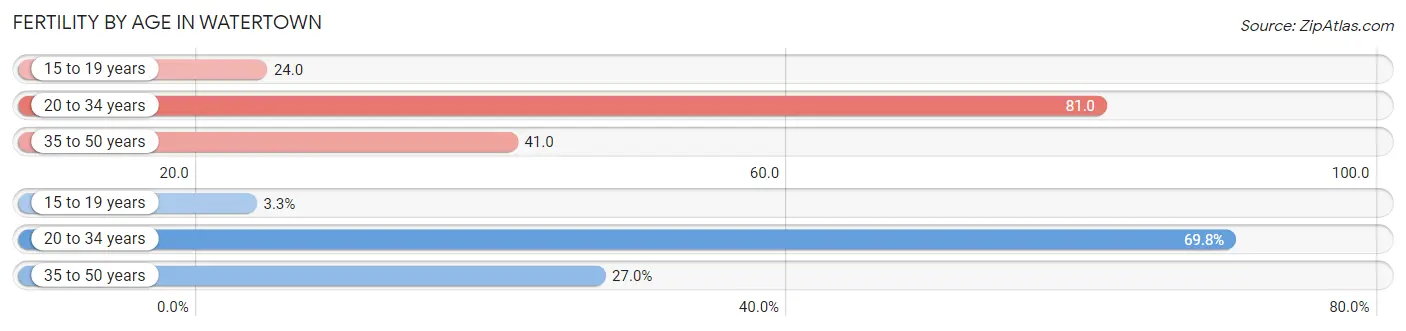
Fertility by Age in Watertown
Average fertility rate in Watertown is 61.0 births per 1,000 women. Women in the age bracket of 20 to 34 years have the highest fertility rate with 81.0 births per 1,000 women. Women in the age bracket of 20 to 34 years acount for 69.8% of all women with births.
| Age Bracket | Women with Births | Births / 1,000 Women |
| 15 to 19 years | 11 (3.3%) | 24.0 |
| 20 to 34 years | 233 (69.8%) | 81.0 |
| 35 to 50 years | 90 (27.0%) | 41.0 |
| Total | 334 (100.0%) | 61.0 |
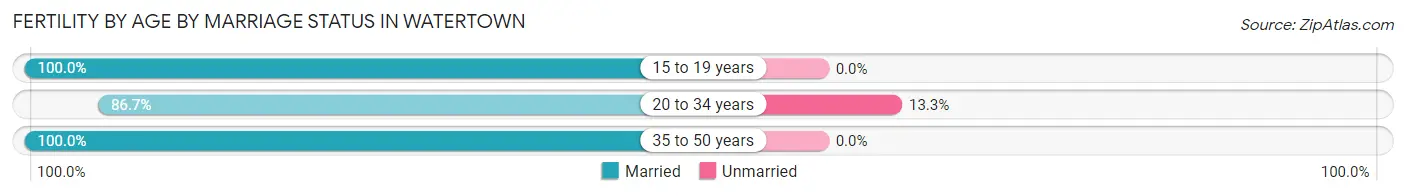
Fertility by Age by Marriage Status in Watertown
90.7% of women with births (334) in Watertown are married. The highest percentage of unmarried women with births falls into 20 to 34 years age bracket with 13.3% of them unmarried at the time of birth, while the lowest percentage of unmarried women with births belong to 15 to 19 years age bracket with 0.0% of them unmarried.
| Age Bracket | Married | Unmarried |
| 15 to 19 years | 11 (100.0%) | 0 (0.0%) |
| 20 to 34 years | 202 (86.7%) | 31 (13.3%) |
| 35 to 50 years | 90 (100.0%) | 0 (0.0%) |
| Total | 303 (90.7%) | 31 (9.3%) |
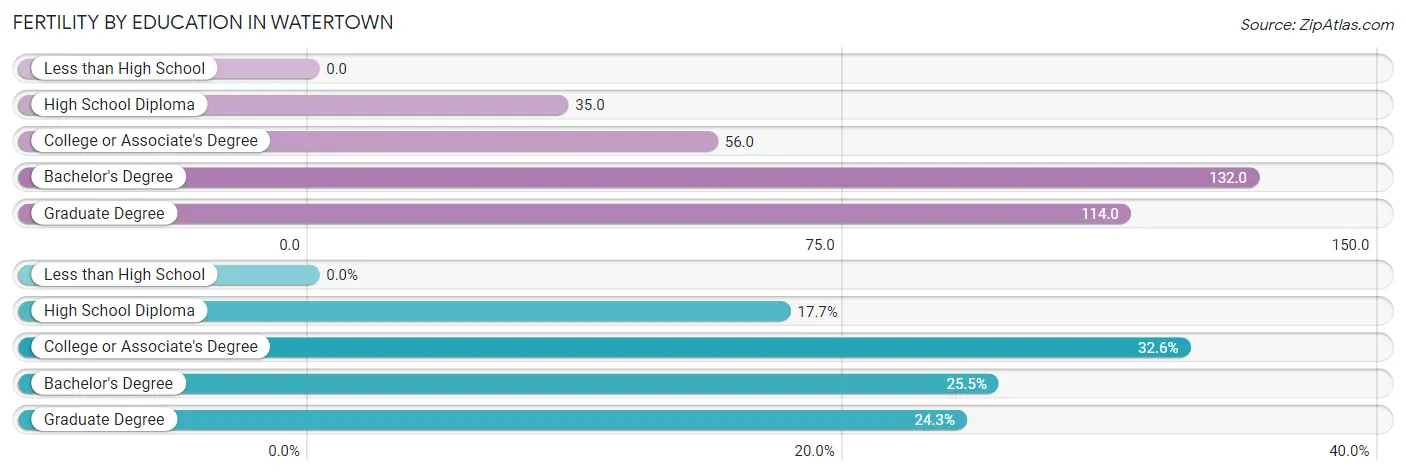
Fertility by Education in Watertown
| Educational Attainment | Women with Births | Births / 1,000 Women |
| Less than High School | 0 (0.0%) | 0.0 |
| High School Diploma | 59 (17.7%) | 35.0 |
| College or Associate's Degree | 109 (32.6%) | 56.0 |
| Bachelor's Degree | 85 (25.5%) | 132.0 |
| Graduate Degree | 81 (24.2%) | 114.0 |
| Total | 334 (100.0%) | 61.0 |
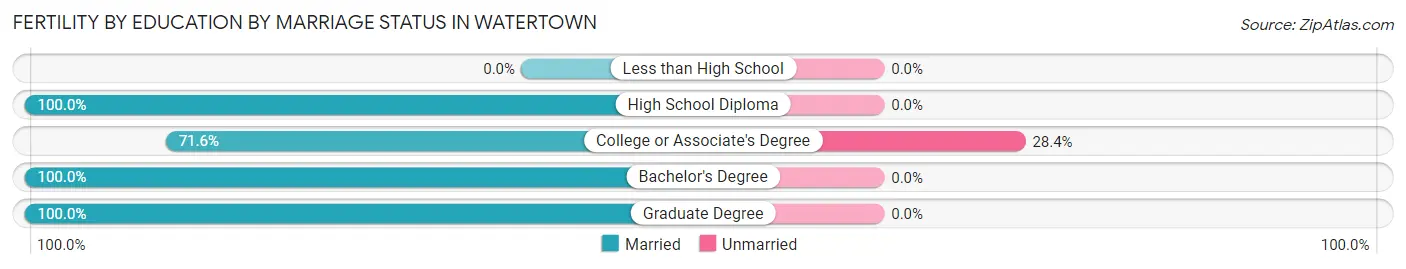
Fertility by Education by Marriage Status in Watertown
9.3% of women with births in Watertown are unmarried. Women with the educational attainment of high school diploma are most likely to be married with 100.0% of them married at childbirth, while women with the educational attainment of college or associate's degree are least likely to be married with 28.4% of them unmarried at childbirth.
| Educational Attainment | Married | Unmarried |
| Less than High School | 0 (0.0%) | 0 (0.0%) |
| High School Diploma | 59 (100.0%) | 0 (0.0%) |
| College or Associate's Degree | 78 (71.6%) | 31 (28.4%) |
| Bachelor's Degree | 85 (100.0%) | 0 (0.0%) |
| Graduate Degree | 81 (100.0%) | 0 (0.0%) |
| Total | 303 (90.7%) | 31 (9.3%) |
Income in Watertown
Income Overview in Watertown
Per Capita Income in Watertown is $32,679, while median incomes of families and households are $66,848 and $49,722 respectively.
| Characteristic | Number | Measure |
| Per Capita Income | 24,859 | $32,679 |
| Median Family Income | 5,776 | $66,848 |
| Mean Family Income | 5,776 | $89,281 |
| Median Household Income | 11,455 | $49,722 |
| Mean Household Income | 11,455 | $70,455 |
| Income Deficit | 5,776 | $11,818 |
| Wage / Income Gap (%) | 24,859 | 21.52% |
| Wage / Income Gap ($) | 24,859 | 78.48¢ per $1 |
| Gini / Inequality Index | 24,859 | 0.49 |
Earnings by Sex in Watertown
Average Earnings in Watertown are $34,358, $38,928 for men and $30,550 for women, a difference of 21.5%.
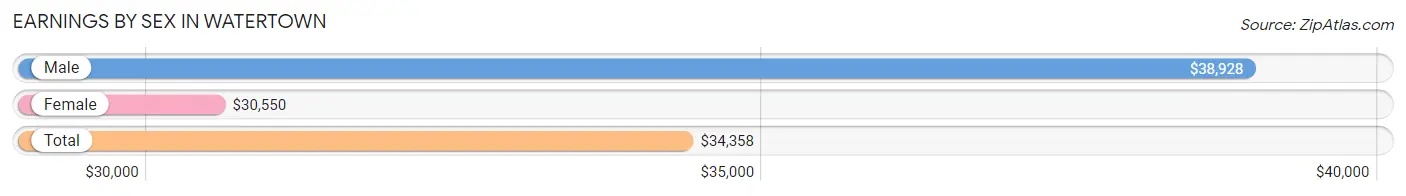
| Sex | Number | Average Earnings |
| Male | 7,141 (55.8%) | $38,928 |
| Female | 5,647 (44.2%) | $30,550 |
| Total | 12,788 (100.0%) | $34,358 |
Earnings by Sex by Income Bracket in Watertown
The most common earnings brackets in Watertown are $75,000 to $99,999 for men (624 | 8.7%) and $30,000 to $34,999 for women (600 | 10.6%).
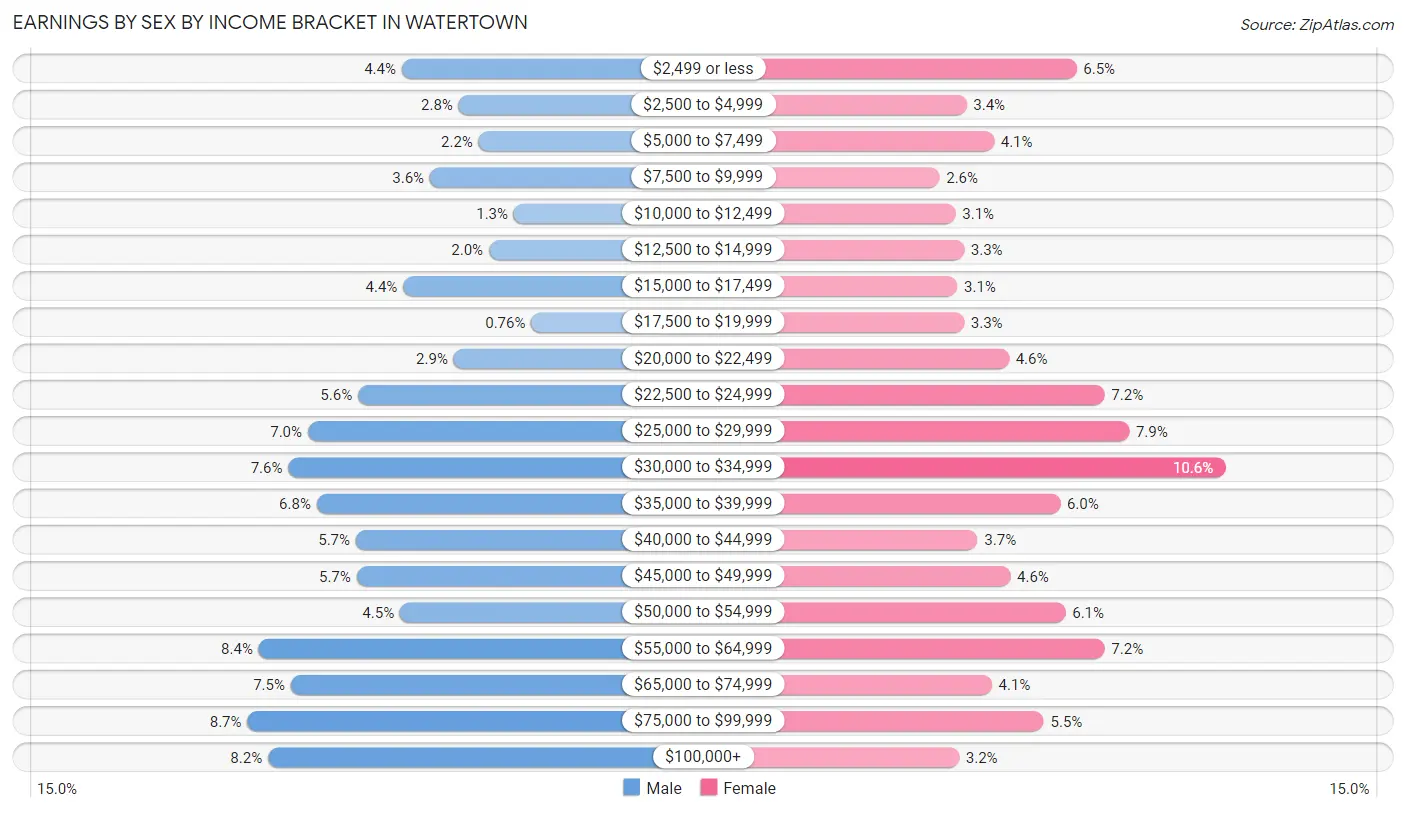
| Income | Male | Female |
| $2,499 or less | 314 (4.4%) | 364 (6.5%) |
| $2,500 to $4,999 | 200 (2.8%) | 190 (3.4%) |
| $5,000 to $7,499 | 160 (2.2%) | 233 (4.1%) |
| $7,500 to $9,999 | 258 (3.6%) | 147 (2.6%) |
| $10,000 to $12,499 | 89 (1.3%) | 172 (3.0%) |
| $12,500 to $14,999 | 139 (1.9%) | 186 (3.3%) |
| $15,000 to $17,499 | 311 (4.4%) | 175 (3.1%) |
| $17,500 to $19,999 | 54 (0.8%) | 186 (3.3%) |
| $20,000 to $22,499 | 210 (2.9%) | 257 (4.5%) |
| $22,500 to $24,999 | 402 (5.6%) | 409 (7.2%) |
| $25,000 to $29,999 | 503 (7.0%) | 448 (7.9%) |
| $30,000 to $34,999 | 542 (7.6%) | 600 (10.6%) |
| $35,000 to $39,999 | 485 (6.8%) | 338 (6.0%) |
| $40,000 to $44,999 | 406 (5.7%) | 207 (3.7%) |
| $45,000 to $49,999 | 405 (5.7%) | 259 (4.6%) |
| $50,000 to $54,999 | 318 (4.4%) | 347 (6.1%) |
| $55,000 to $64,999 | 601 (8.4%) | 409 (7.2%) |
| $65,000 to $74,999 | 537 (7.5%) | 230 (4.1%) |
| $75,000 to $99,999 | 624 (8.7%) | 312 (5.5%) |
| $100,000+ | 583 (8.2%) | 178 (3.2%) |
| Total | 7,141 (100.0%) | 5,647 (100.0%) |
Earnings by Sex by Educational Attainment in Watertown
Average earnings in Watertown are $45,987 for men and $33,949 for women, a difference of 26.2%. Men with an educational attainment of graduate degree enjoy the highest average annual earnings of $84,600, while those with less than high school education earn the least with $9,003. Women with an educational attainment of graduate degree earn the most with the average annual earnings of $61,169, while those with high school diploma education have the smallest earnings of $23,662.
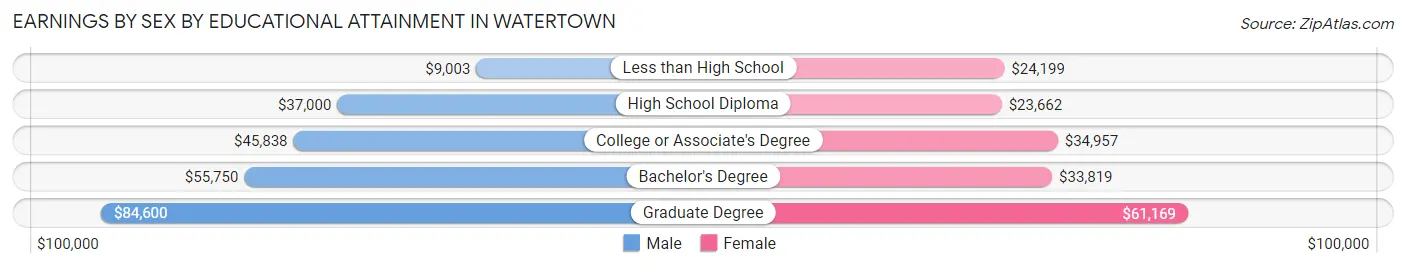
| Educational Attainment | Male Income | Female Income |
| Less than High School | $9,003 | $24,199 |
| High School Diploma | $37,000 | $23,662 |
| College or Associate's Degree | $45,838 | $34,957 |
| Bachelor's Degree | $55,750 | $33,819 |
| Graduate Degree | $84,600 | $61,169 |
| Total | $45,987 | $33,949 |
Family Income in Watertown
Family Income Brackets in Watertown
According to the Watertown family income data, there are 1,028 families falling into the $50,000 to $74,999 income range, which is the most common income bracket and makes up 17.8% of all families. Conversely, the $10,000 to $14,999 income bracket is the least frequent group with only 121 families (2.1%) belonging to this category.
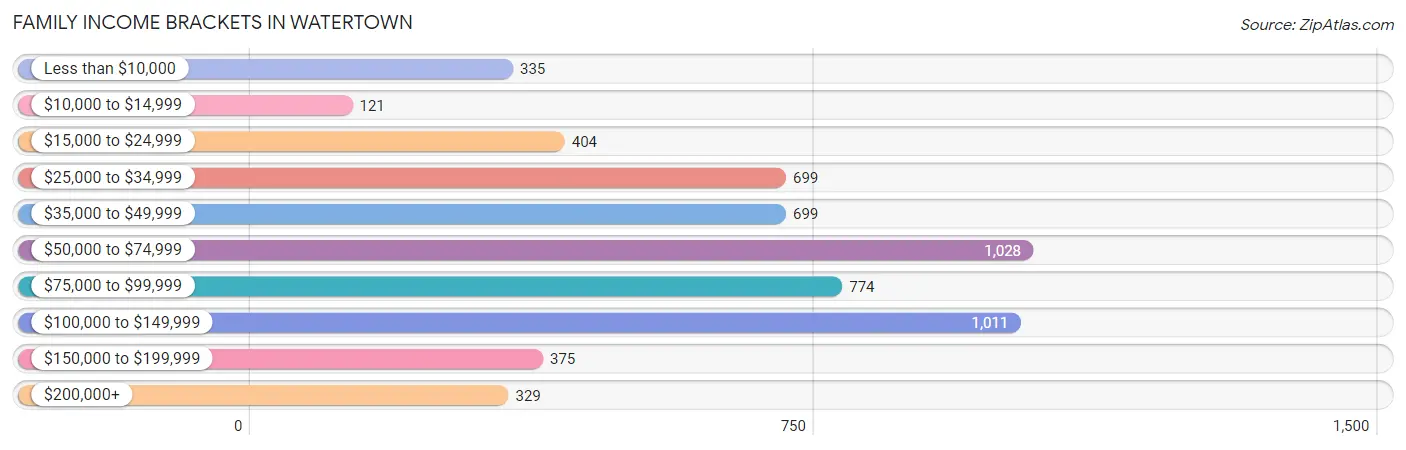
| Income Bracket | # Families | % Families |
| Less than $10,000 | 335 | 5.8% |
| $10,000 to $14,999 | 121 | 2.1% |
| $15,000 to $24,999 | 404 | 7.0% |
| $25,000 to $34,999 | 699 | 12.1% |
| $35,000 to $49,999 | 699 | 12.1% |
| $50,000 to $74,999 | 1,028 | 17.8% |
| $75,000 to $99,999 | 774 | 13.4% |
| $100,000 to $149,999 | 1,011 | 17.5% |
| $150,000 to $199,999 | 375 | 6.5% |
| $200,000+ | 329 | 5.7% |
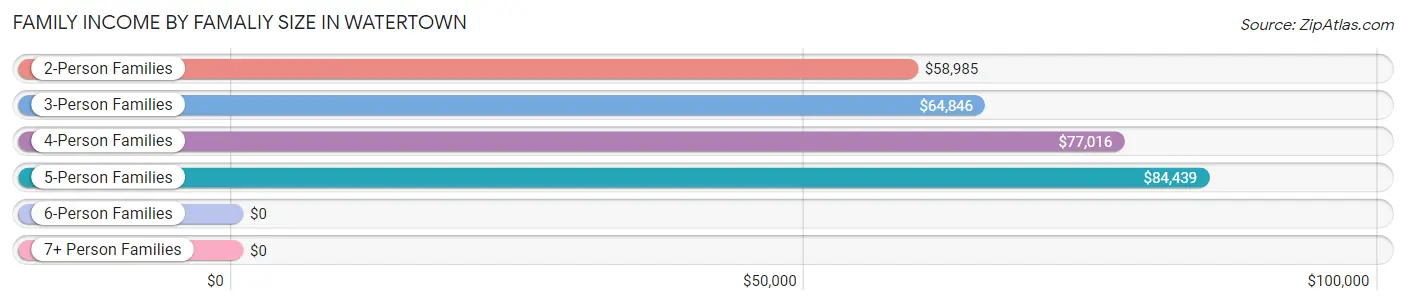
Family Income by Famaliy Size in Watertown
5-person families (206 | 3.6%) account for the highest median family income in Watertown with $84,439 per family, while 2-person families (2,885 | 49.9%) have the highest median income of $29,492 per family member.
| Income Bracket | # Families | Median Income |
| 2-Person Families | 2,885 (49.9%) | $58,985 |
| 3-Person Families | 1,484 (25.7%) | $64,846 |
| 4-Person Families | 1,172 (20.3%) | $77,016 |
| 5-Person Families | 206 (3.6%) | $84,439 |
| 6-Person Families | 29 (0.5%) | $0 |
| 7+ Person Families | 0 (0.0%) | $0 |
| Total | 5,776 (100.0%) | $66,848 |
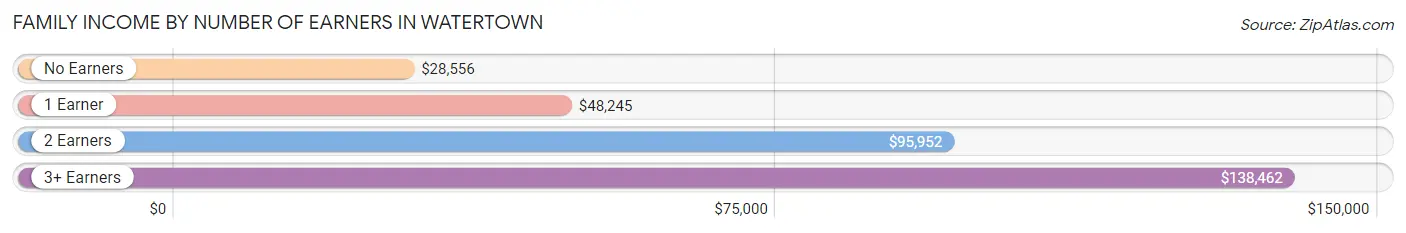
Family Income by Number of Earners in Watertown
The median family income in Watertown is $66,848, with families comprising 3+ earners (362) having the highest median family income of $138,462, while families with no earners (880) have the lowest median family income of $28,556, accounting for 6.3% and 15.2% of families, respectively.
| Number of Earners | # Families | Median Income |
| No Earners | 880 (15.2%) | $28,556 |
| 1 Earner | 2,346 (40.6%) | $48,245 |
| 2 Earners | 2,188 (37.9%) | $95,952 |
| 3+ Earners | 362 (6.3%) | $138,462 |
| Total | 5,776 (100.0%) | $66,848 |
Household Income in Watertown
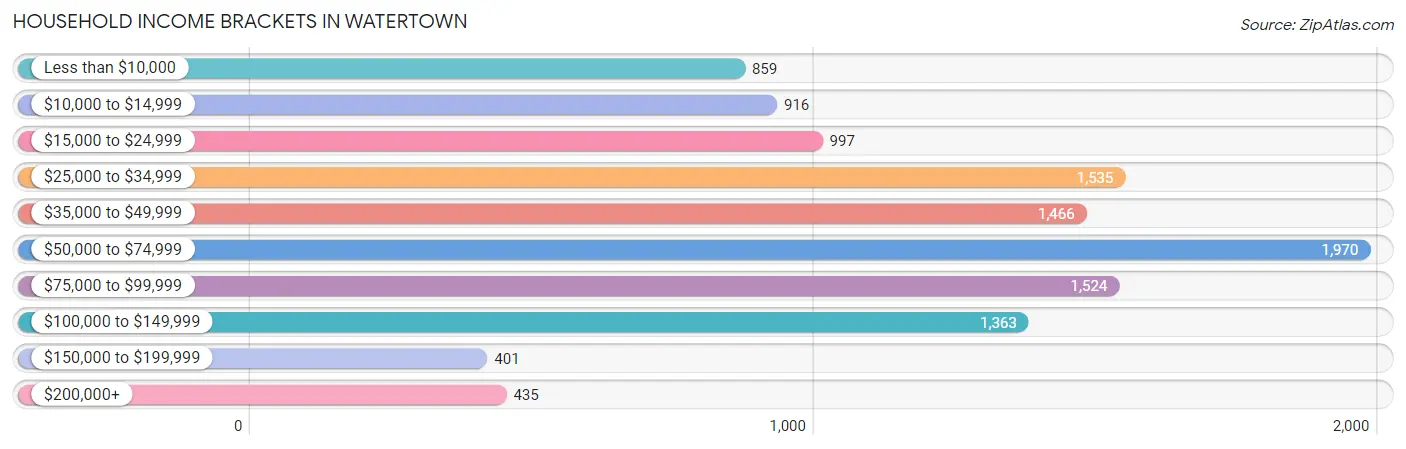
Household Income Brackets in Watertown
With 1,970 households falling in the category, the $50,000 to $74,999 income range is the most frequent in Watertown, accounting for 17.2% of all households. In contrast, only 401 households (3.5%) fall into the $150,000 to $199,999 income bracket, making it the least populous group.
| Income Bracket | # Households | % Households |
| Less than $10,000 | 859 | 7.5% |
| $10,000 to $14,999 | 916 | 8.0% |
| $15,000 to $24,999 | 997 | 8.7% |
| $25,000 to $34,999 | 1,535 | 13.4% |
| $35,000 to $49,999 | 1,466 | 12.8% |
| $50,000 to $74,999 | 1,970 | 17.2% |
| $75,000 to $99,999 | 1,524 | 13.3% |
| $100,000 to $149,999 | 1,363 | 11.9% |
| $150,000 to $199,999 | 401 | 3.5% |
| $200,000+ | 435 | 3.8% |
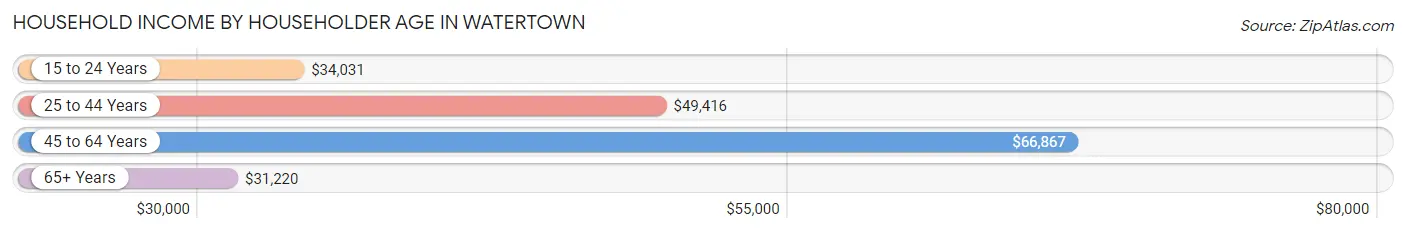
Household Income by Householder Age in Watertown
The median household income in Watertown is $49,722, with the highest median household income of $66,867 found in the 45 to 64 years age bracket for the primary householder. A total of 3,499 households (30.5%) fall into this category. Meanwhile, the 65+ years age bracket for the primary householder has the lowest median household income of $31,220, with 2,435 households (21.3%) in this group.
| Income Bracket | # Households | Median Income |
| 15 to 24 Years | 1,071 (9.3%) | $34,031 |
| 25 to 44 Years | 4,450 (38.9%) | $49,416 |
| 45 to 64 Years | 3,499 (30.5%) | $66,867 |
| 65+ Years | 2,435 (21.3%) | $31,220 |
| Total | 11,455 (100.0%) | $49,722 |
Poverty in Watertown
Income Below Poverty by Sex and Age in Watertown
With 17.7% poverty level for males and 21.4% for females among the residents of Watertown, 15 year old males and 5 year old females are the most vulnerable to poverty, with 54 males (37.0%) and 53 females (62.4%) in their respective age groups living below the poverty level.
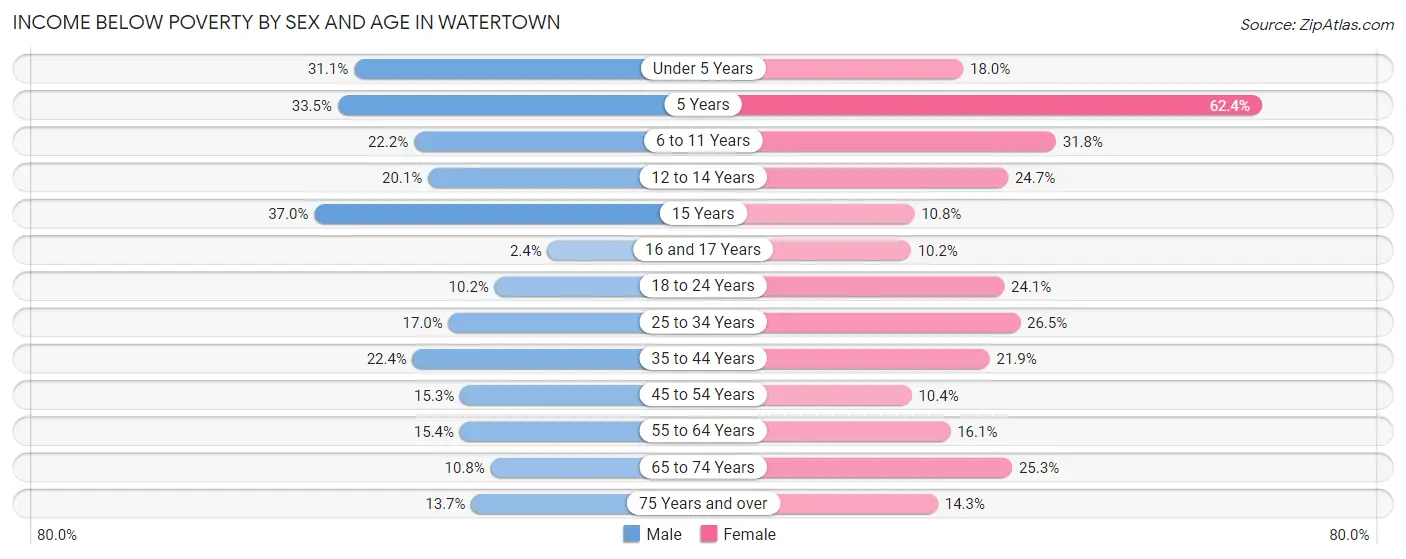
| Age Bracket | Male | Female |
| Under 5 Years | 268 (31.1%) | 141 (18.0%) |
| 5 Years | 72 (33.5%) | 53 (62.4%) |
| 6 to 11 Years | 179 (22.2%) | 348 (31.8%) |
| 12 to 14 Years | 92 (20.1%) | 38 (24.7%) |
| 15 Years | 54 (37.0%) | 10 (10.7%) |
| 16 and 17 Years | 6 (2.4%) | 9 (10.2%) |
| 18 to 24 Years | 160 (10.2%) | 294 (24.1%) |
| 25 to 34 Years | 393 (17.0%) | 505 (26.5%) |
| 35 to 44 Years | 407 (22.4%) | 328 (21.9%) |
| 45 to 54 Years | 205 (15.3%) | 131 (10.3%) |
| 55 to 64 Years | 232 (15.4%) | 234 (16.1%) |
| 65 to 74 Years | 77 (10.8%) | 277 (25.3%) |
| 75 Years and over | 75 (13.7%) | 136 (14.3%) |
| Total | 2,220 (17.7%) | 2,504 (21.4%) |
Income Above Poverty by Sex and Age in Watertown
According to the poverty statistics in Watertown, males aged 16 and 17 years and females aged 16 and 17 years are the age groups that are most secure financially, with 97.7% of males and 89.8% of females in these age groups living above the poverty line.
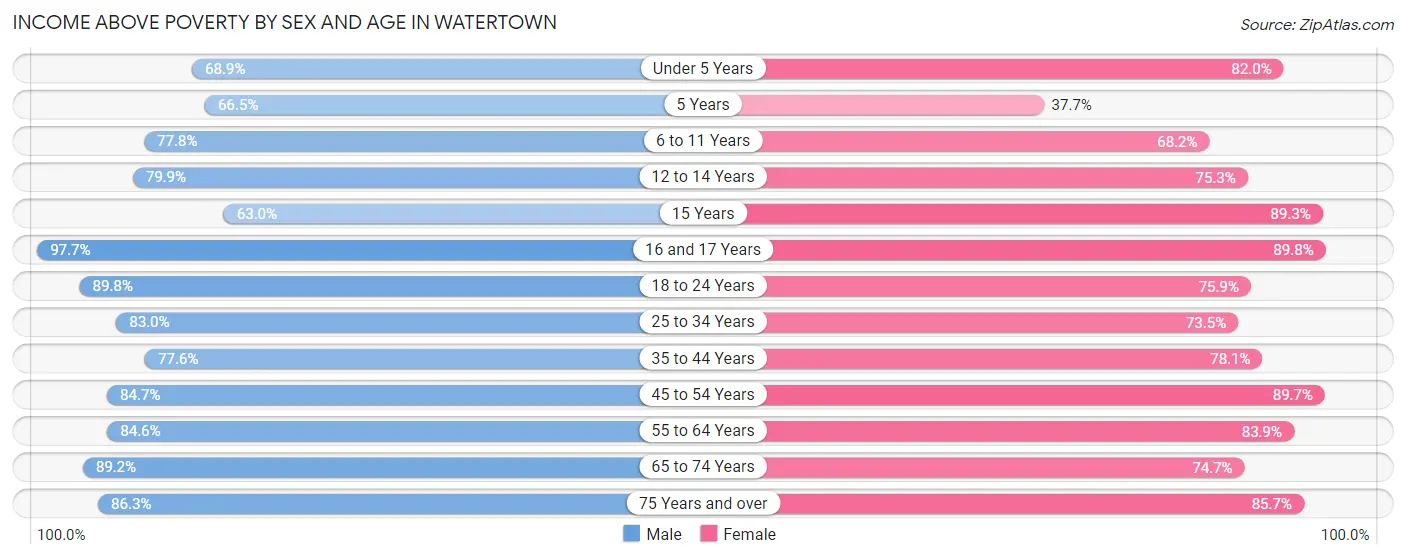
| Age Bracket | Male | Female |
| Under 5 Years | 594 (68.9%) | 642 (82.0%) |
| 5 Years | 143 (66.5%) | 32 (37.7%) |
| 6 to 11 Years | 628 (77.8%) | 747 (68.2%) |
| 12 to 14 Years | 366 (79.9%) | 116 (75.3%) |
| 15 Years | 92 (63.0%) | 83 (89.2%) |
| 16 and 17 Years | 249 (97.7%) | 79 (89.8%) |
| 18 to 24 Years | 1,408 (89.8%) | 926 (75.9%) |
| 25 to 34 Years | 1,914 (83.0%) | 1,403 (73.5%) |
| 35 to 44 Years | 1,412 (77.6%) | 1,167 (78.1%) |
| 45 to 54 Years | 1,132 (84.7%) | 1,135 (89.6%) |
| 55 to 64 Years | 1,277 (84.6%) | 1,219 (83.9%) |
| 65 to 74 Years | 636 (89.2%) | 819 (74.7%) |
| 75 Years and over | 474 (86.3%) | 818 (85.7%) |
| Total | 10,325 (82.3%) | 9,186 (78.6%) |
Income Below Poverty Among Married-Couple Families in Watertown
The poverty statistics for married-couple families in Watertown show that 5.2% or 193 of the total 3,684 families live below the poverty line. Families with 3 or 4 children have the highest poverty rate of 9.3%, comprising of 11 families. On the other hand, families with no children have the lowest poverty rate of 3.6%, which includes 71 families.
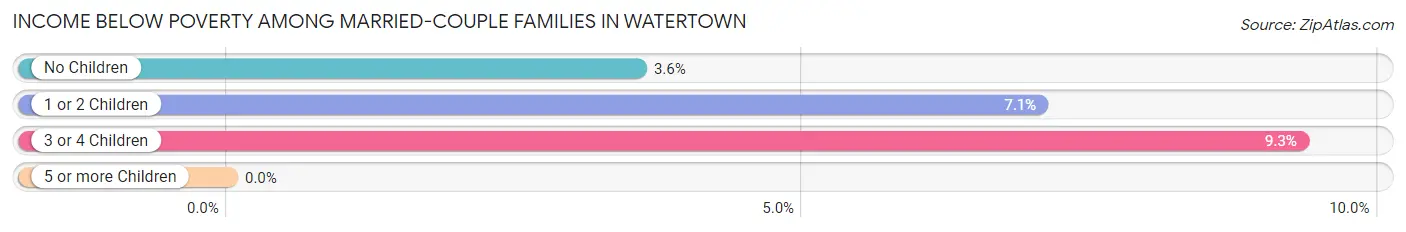
| Children | Above Poverty | Below Poverty |
| No Children | 1,921 (96.4%) | 71 (3.6%) |
| 1 or 2 Children | 1,463 (92.9%) | 111 (7.0%) |
| 3 or 4 Children | 107 (90.7%) | 11 (9.3%) |
| 5 or more Children | 0 (0.0%) | 0 (0.0%) |
| Total | 3,491 (94.8%) | 193 (5.2%) |
Income Below Poverty Among Single-Parent Households in Watertown
According to the poverty data in Watertown, 24.7% or 193 single-father households and 27.5% or 361 single-mother households are living below the poverty line. Among single-father households, those with 1 or 2 children have the highest poverty rate, with 193 households (48.2%) experiencing poverty. Likewise, among single-mother households, those with 3 or 4 children have the highest poverty rate, with 107 households (66.5%) falling below the poverty line.
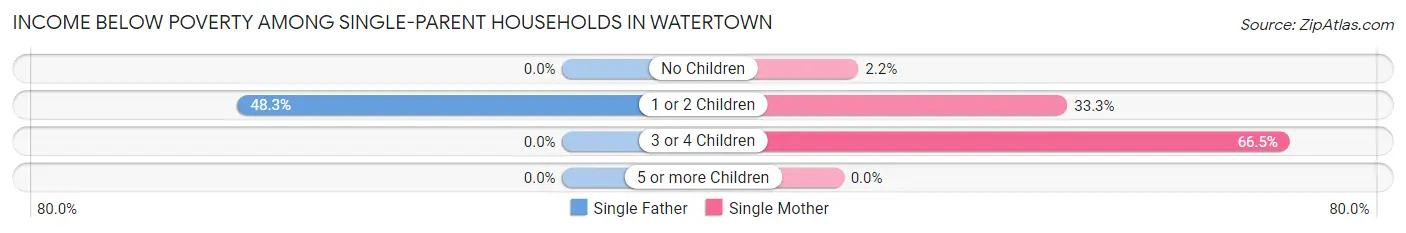
| Children | Single Father | Single Mother |
| No Children | 0 (0.0%) | 9 (2.2%) |
| 1 or 2 Children | 193 (48.2%) | 245 (33.3%) |
| 3 or 4 Children | 0 (0.0%) | 107 (66.5%) |
| 5 or more Children | 0 (0.0%) | 0 (0.0%) |
| Total | 193 (24.7%) | 361 (27.5%) |
Income Below Poverty Among Married-Couple vs Single-Parent Households in Watertown
The poverty data for Watertown shows that 193 of the married-couple family households (5.2%) and 554 of the single-parent households (26.5%) are living below the poverty level. Within the married-couple family households, those with 3 or 4 children have the highest poverty rate, with 11 households (9.3%) falling below the poverty line. Among the single-parent households, those with 3 or 4 children have the highest poverty rate, with 107 household (61.1%) living below poverty.
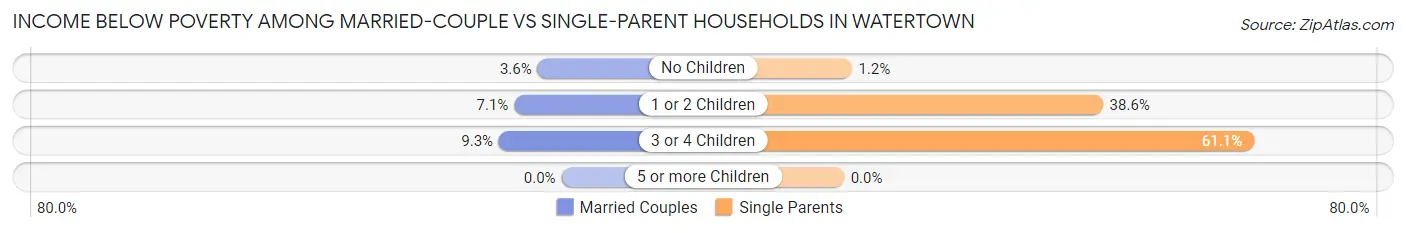
| Children | Married-Couple Families | Single-Parent Households |
| No Children | 71 (3.6%) | 9 (1.2%) |
| 1 or 2 Children | 111 (7.0%) | 438 (38.6%) |
| 3 or 4 Children | 11 (9.3%) | 107 (61.1%) |
| 5 or more Children | 0 (0.0%) | 0 (0.0%) |
| Total | 193 (5.2%) | 554 (26.5%) |
Employment Characteristics in Watertown
Employment by Class of Employer in Watertown
Among the 11,374 employed individuals in Watertown, private company employees (6,466 | 56.9%), federal government employees (1,548 | 13.6%), and not-for-profit organizations (1,267 | 11.1%) make up the most common classes of employment.
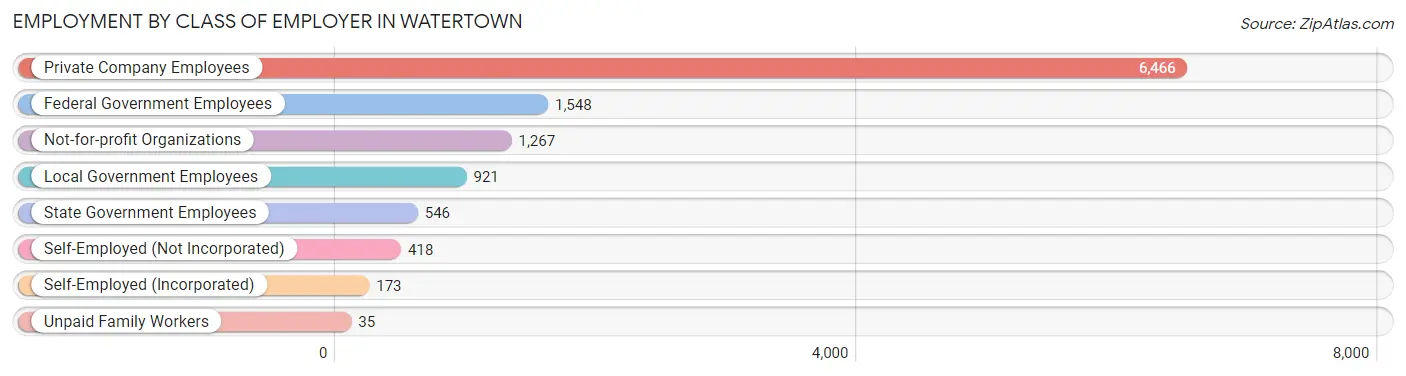
| Employer Class | # Employees | % Employees |
| Private Company Employees | 6,466 | 56.9% |
| Self-Employed (Incorporated) | 173 | 1.5% |
| Self-Employed (Not Incorporated) | 418 | 3.7% |
| Not-for-profit Organizations | 1,267 | 11.1% |
| Local Government Employees | 921 | 8.1% |
| State Government Employees | 546 | 4.8% |
| Federal Government Employees | 1,548 | 13.6% |
| Unpaid Family Workers | 35 | 0.3% |
| Total | 11,374 | 100.0% |
Employment Status by Age in Watertown
According to the labor force statistics for Watertown, out of the total population over 16 years of age (19,928), 61.9% or 12,335 individuals are in the labor force, with 6.3% or 777 of them unemployed. The age group with the highest labor force participation rate is 45 to 54 years, with 84.1% or 2,207 individuals in the labor force. Within the labor force, the 16 to 19 years age range has the highest percentage of unemployed individuals, with 19.8% or 95 of them being unemployed.
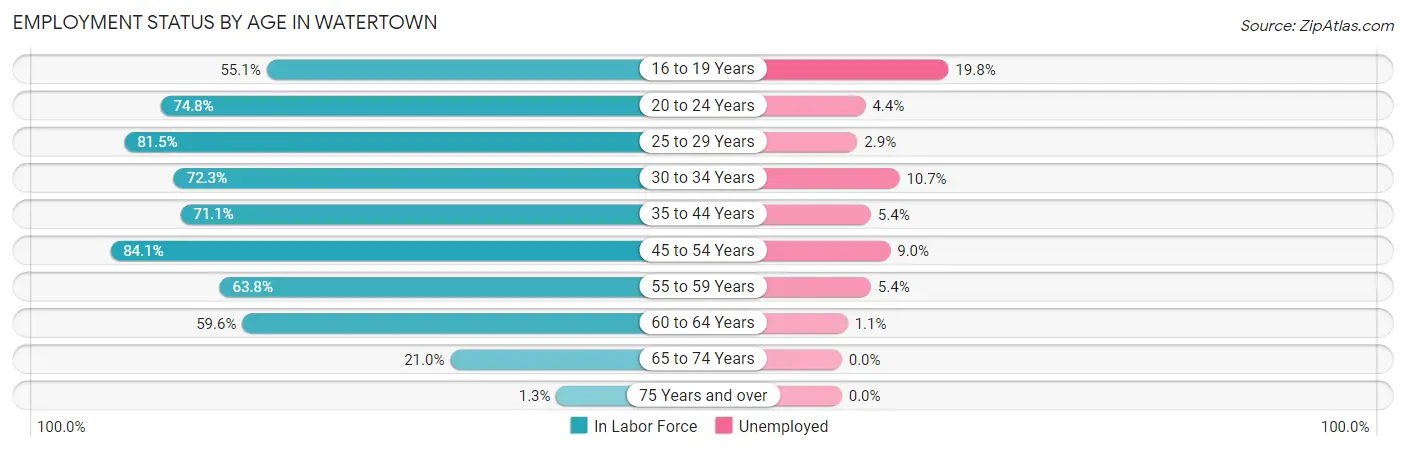
| Age Bracket | In Labor Force | Unemployed |
| 16 to 19 Years | 480 (55.1%) | 95 (19.8%) |
| 20 to 24 Years | 1,739 (74.8%) | 77 (4.4%) |
| 25 to 29 Years | 1,879 (81.5%) | 54 (2.9%) |
| 30 to 34 Years | 1,407 (72.3%) | 151 (10.7%) |
| 35 to 44 Years | 2,392 (71.1%) | 129 (5.4%) |
| 45 to 54 Years | 2,207 (84.1%) | 199 (9.0%) |
| 55 to 59 Years | 1,005 (63.8%) | 54 (5.4%) |
| 60 to 64 Years | 827 (59.6%) | 9 (1.1%) |
| 65 to 74 Years | 386 (21.0%) | 0 (0.0%) |
| 75 Years and over | 22 (1.3%) | 0 (0.0%) |
| Total | 12,335 (61.9%) | 777 (6.3%) |
Employment Status by Educational Attainment in Watertown
According to labor force statistics for Watertown, 73.6% of individuals (9,716) out of the total population between 25 and 64 years of age (13,201) are in the labor force, with 6.2% or 602 of them being unemployed. The group with the highest labor force participation rate are those with the educational attainment of bachelor's degree or higher, with 80.9% or 2,781 individuals in the labor force. Within the labor force, individuals with college / associate degree education have the highest percentage of unemployment, with 7.5% or 256 of them being unemployed.
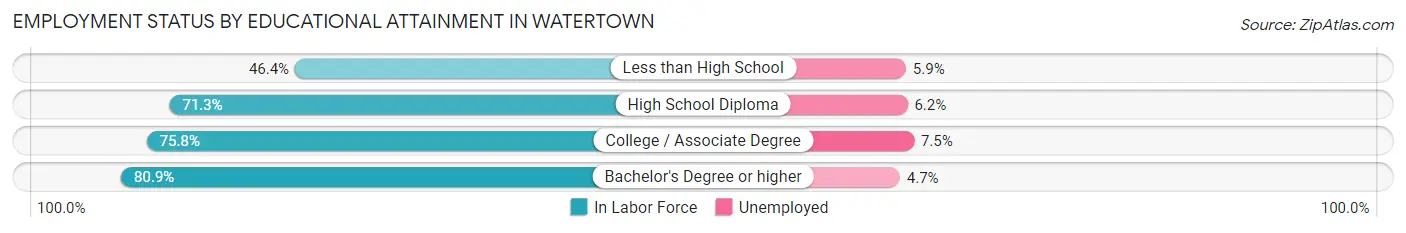
| Educational Attainment | In Labor Force | Unemployed |
| Less than High School | 437 (46.4%) | 56 (5.9%) |
| High School Diploma | 3,075 (71.3%) | 267 (6.2%) |
| College / Associate Degree | 3,419 (75.8%) | 338 (7.5%) |
| Bachelor's Degree or higher | 2,781 (80.9%) | 162 (4.7%) |
| Total | 9,716 (73.6%) | 818 (6.2%) |
Employment Occupations by Sex in Watertown
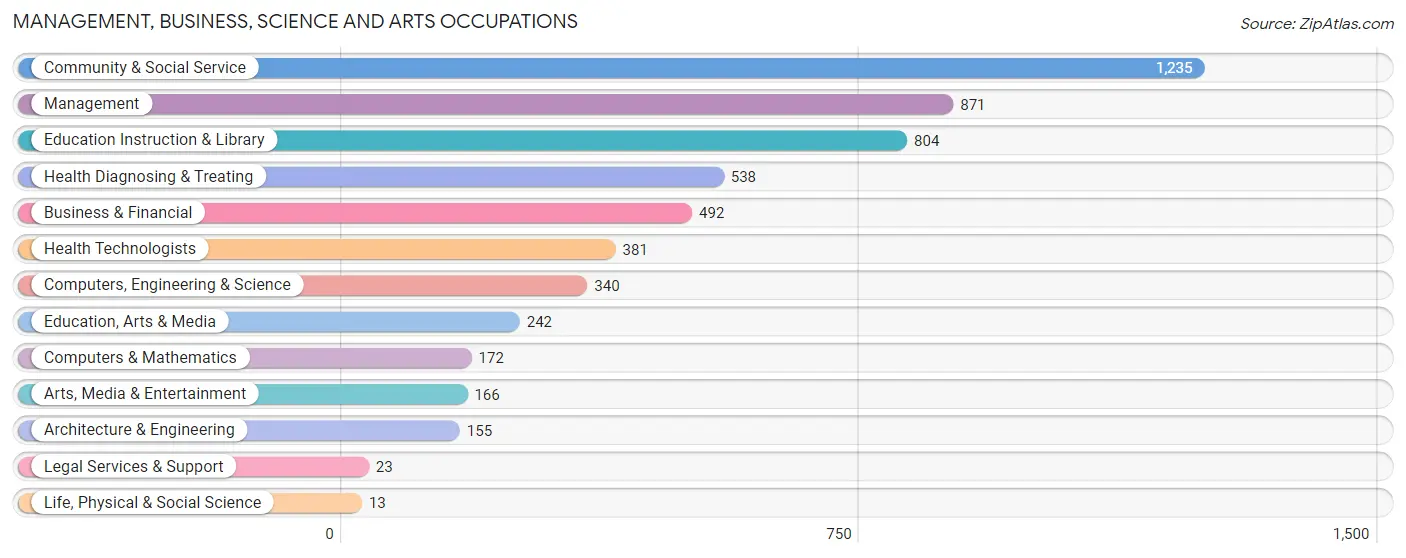
Management, Business, Science and Arts Occupations
The most common Management, Business, Science and Arts occupations in Watertown are Community & Social Service (1,235 | 11.6%), Management (871 | 8.2%), Education Instruction & Library (804 | 7.6%), Health Diagnosing & Treating (538 | 5.1%), and Business & Financial (492 | 4.6%).
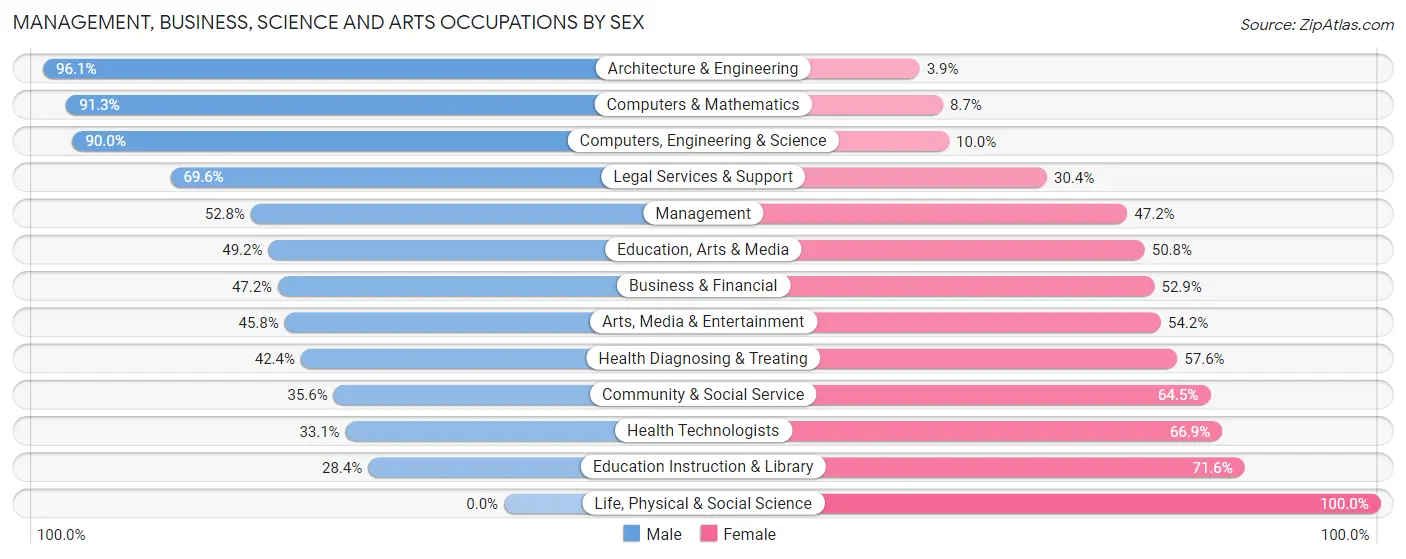
Management, Business, Science and Arts Occupations by Sex
Within the Management, Business, Science and Arts occupations in Watertown, the most male-oriented occupations are Architecture & Engineering (96.1%), Computers & Mathematics (91.3%), and Computers, Engineering & Science (90.0%), while the most female-oriented occupations are Life, Physical & Social Science (100.0%), Education Instruction & Library (71.6%), and Health Technologists (66.9%).
| Occupation | Male | Female |
| Management | 460 (52.8%) | 411 (47.2%) |
| Business & Financial | 232 (47.1%) | 260 (52.8%) |
| Computers, Engineering & Science | 306 (90.0%) | 34 (10.0%) |
| Computers & Mathematics | 157 (91.3%) | 15 (8.7%) |
| Architecture & Engineering | 149 (96.1%) | 6 (3.9%) |
| Life, Physical & Social Science | 0 (0.0%) | 13 (100.0%) |
| Community & Social Service | 439 (35.5%) | 796 (64.4%) |
| Education, Arts & Media | 119 (49.2%) | 123 (50.8%) |
| Legal Services & Support | 16 (69.6%) | 7 (30.4%) |
| Education Instruction & Library | 228 (28.4%) | 576 (71.6%) |
| Arts, Media & Entertainment | 76 (45.8%) | 90 (54.2%) |
| Health Diagnosing & Treating | 228 (42.4%) | 310 (57.6%) |
| Health Technologists | 126 (33.1%) | 255 (66.9%) |
| Total (Category) | 1,665 (47.9%) | 1,811 (52.1%) |
| Total (Overall) | 5,547 (52.3%) | 5,063 (47.7%) |
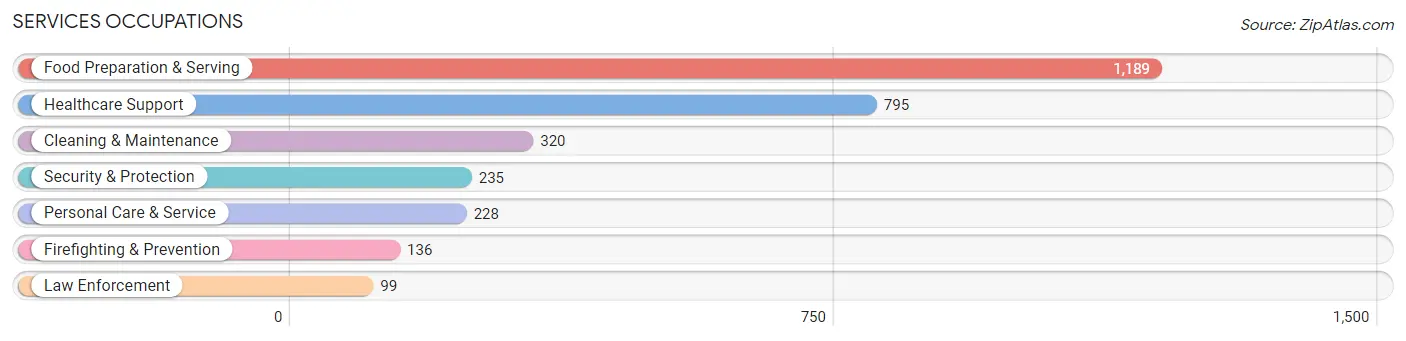
Services Occupations
The most common Services occupations in Watertown are Food Preparation & Serving (1,189 | 11.2%), Healthcare Support (795 | 7.5%), Cleaning & Maintenance (320 | 3.0%), Security & Protection (235 | 2.2%), and Personal Care & Service (228 | 2.1%).
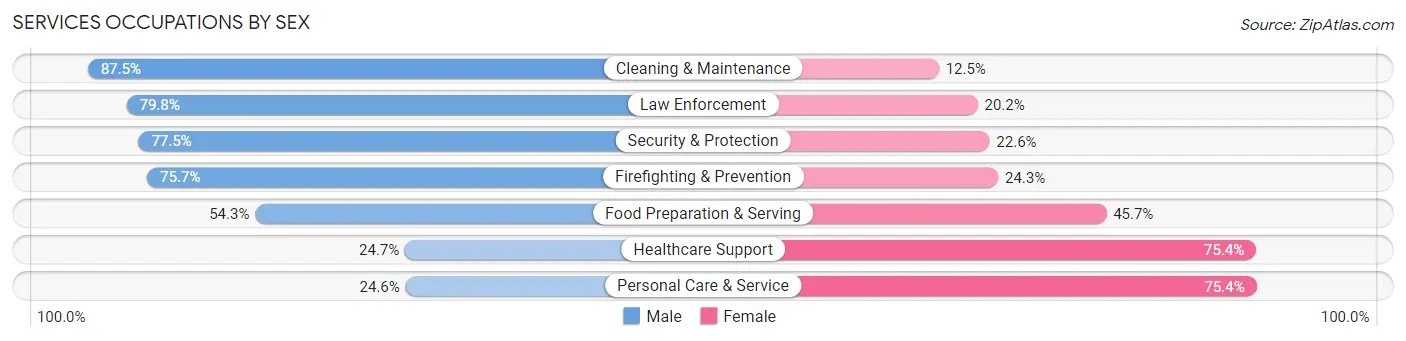
Services Occupations by Sex
Within the Services occupations in Watertown, the most male-oriented occupations are Cleaning & Maintenance (87.5%), Law Enforcement (79.8%), and Security & Protection (77.4%), while the most female-oriented occupations are Personal Care & Service (75.4%), Healthcare Support (75.3%), and Food Preparation & Serving (45.7%).
| Occupation | Male | Female |
| Healthcare Support | 196 (24.6%) | 599 (75.3%) |
| Security & Protection | 182 (77.4%) | 53 (22.6%) |
| Firefighting & Prevention | 103 (75.7%) | 33 (24.3%) |
| Law Enforcement | 79 (79.8%) | 20 (20.2%) |
| Food Preparation & Serving | 646 (54.3%) | 543 (45.7%) |
| Cleaning & Maintenance | 280 (87.5%) | 40 (12.5%) |
| Personal Care & Service | 56 (24.6%) | 172 (75.4%) |
| Total (Category) | 1,360 (49.1%) | 1,407 (50.8%) |
| Total (Overall) | 5,547 (52.3%) | 5,063 (47.7%) |
Sales and Office Occupations
The most common Sales and Office occupations in Watertown are Sales & Related (1,420 | 13.4%), and Office & Administration (1,194 | 11.3%).

Sales and Office Occupations by Sex
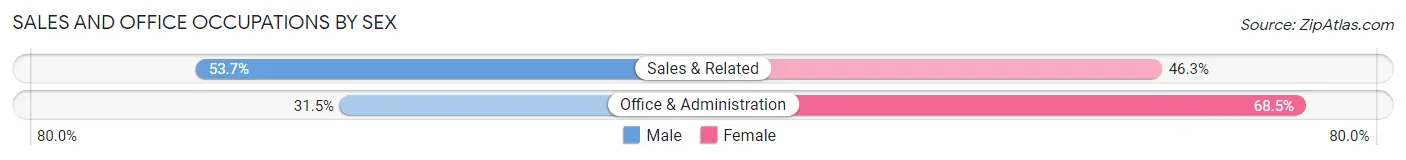
| Occupation | Male | Female |
| Sales & Related | 762 (53.7%) | 658 (46.3%) |
| Office & Administration | 376 (31.5%) | 818 (68.5%) |
| Total (Category) | 1,138 (43.5%) | 1,476 (56.5%) |
| Total (Overall) | 5,547 (52.3%) | 5,063 (47.7%) |
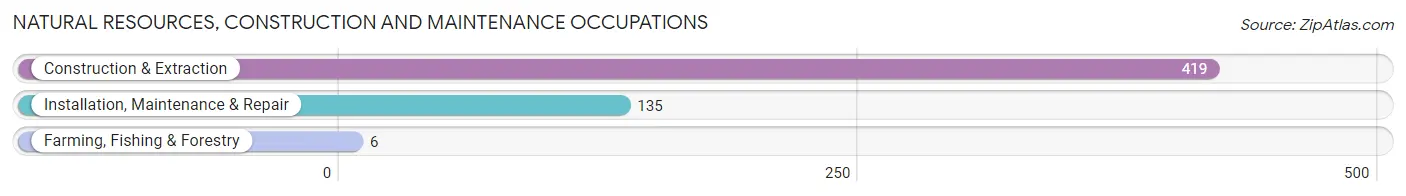
Natural Resources, Construction and Maintenance Occupations
The most common Natural Resources, Construction and Maintenance occupations in Watertown are Construction & Extraction (419 | 4.0%), Installation, Maintenance & Repair (135 | 1.3%), and Farming, Fishing & Forestry (6 | 0.1%).
Natural Resources, Construction and Maintenance Occupations by Sex
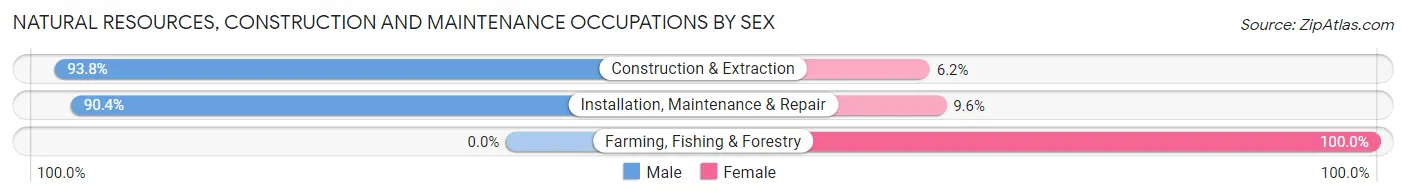
| Occupation | Male | Female |
| Farming, Fishing & Forestry | 0 (0.0%) | 6 (100.0%) |
| Construction & Extraction | 393 (93.8%) | 26 (6.2%) |
| Installation, Maintenance & Repair | 122 (90.4%) | 13 (9.6%) |
| Total (Category) | 515 (92.0%) | 45 (8.0%) |
| Total (Overall) | 5,547 (52.3%) | 5,063 (47.7%) |
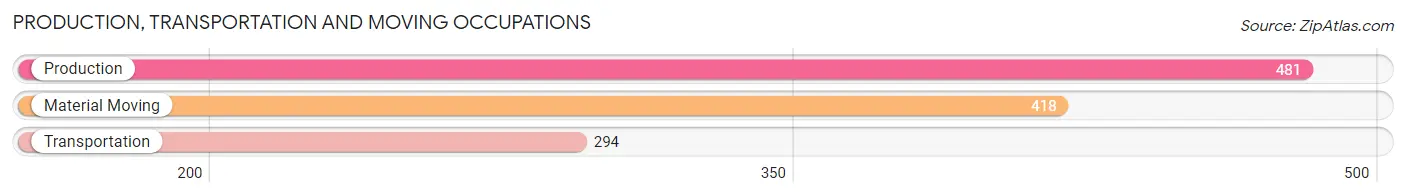
Production, Transportation and Moving Occupations
The most common Production, Transportation and Moving occupations in Watertown are Production (481 | 4.5%), Material Moving (418 | 3.9%), and Transportation (294 | 2.8%).
Production, Transportation and Moving Occupations by Sex
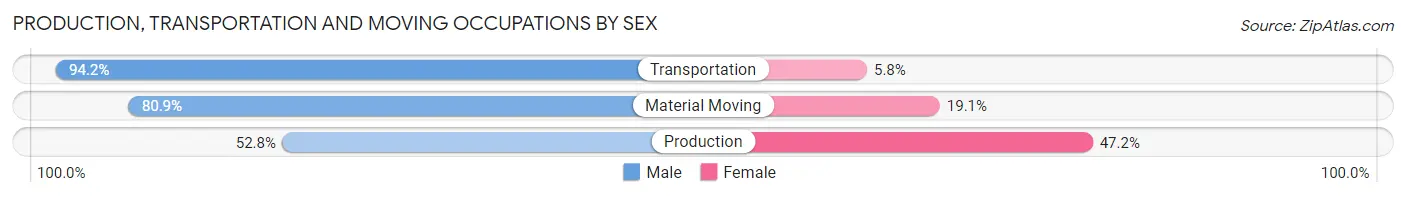
| Occupation | Male | Female |
| Production | 254 (52.8%) | 227 (47.2%) |
| Transportation | 277 (94.2%) | 17 (5.8%) |
| Material Moving | 338 (80.9%) | 80 (19.1%) |
| Total (Category) | 869 (72.8%) | 324 (27.2%) |
| Total (Overall) | 5,547 (52.3%) | 5,063 (47.7%) |
Employment Industries by Sex in Watertown
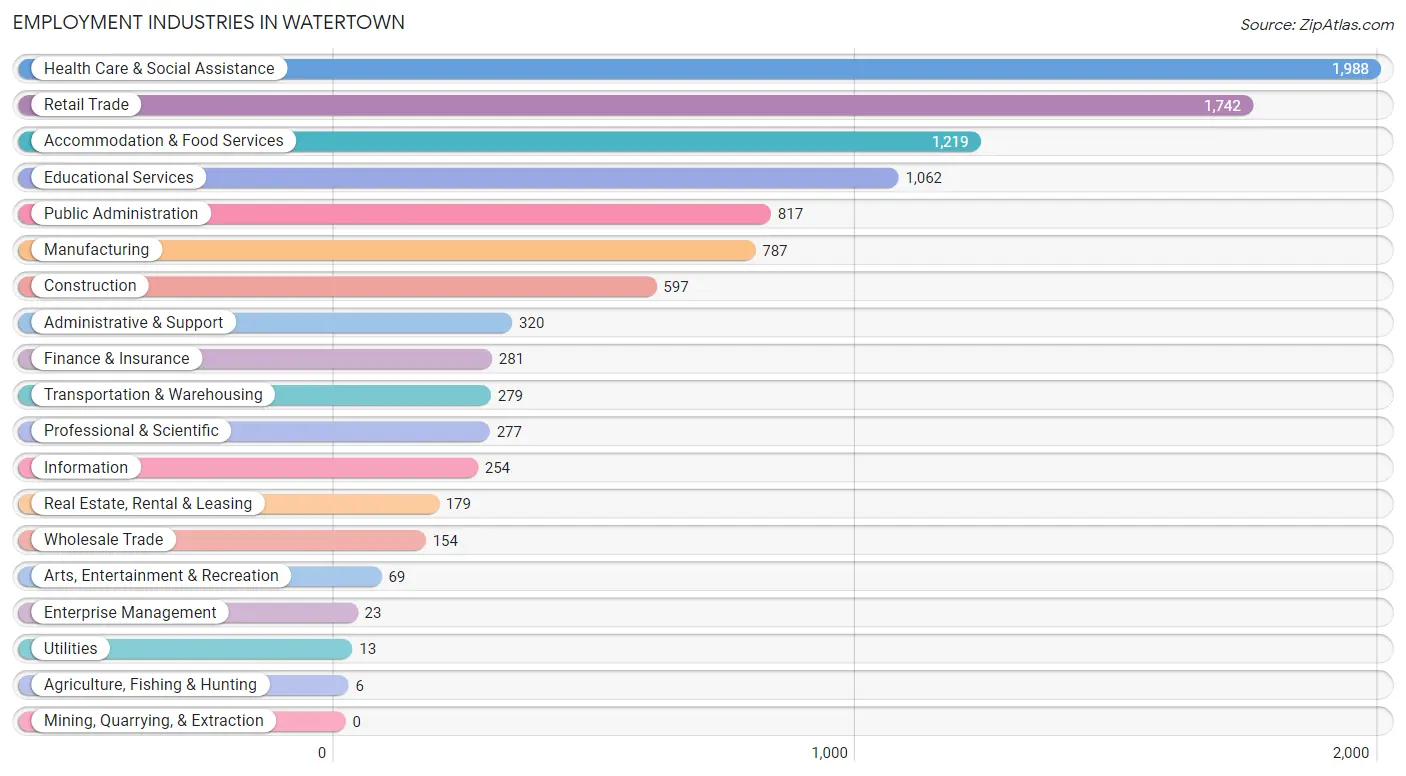
Employment Industries in Watertown
The major employment industries in Watertown include Health Care & Social Assistance (1,988 | 18.7%), Retail Trade (1,742 | 16.4%), Accommodation & Food Services (1,219 | 11.5%), Educational Services (1,062 | 10.0%), and Public Administration (817 | 7.7%).
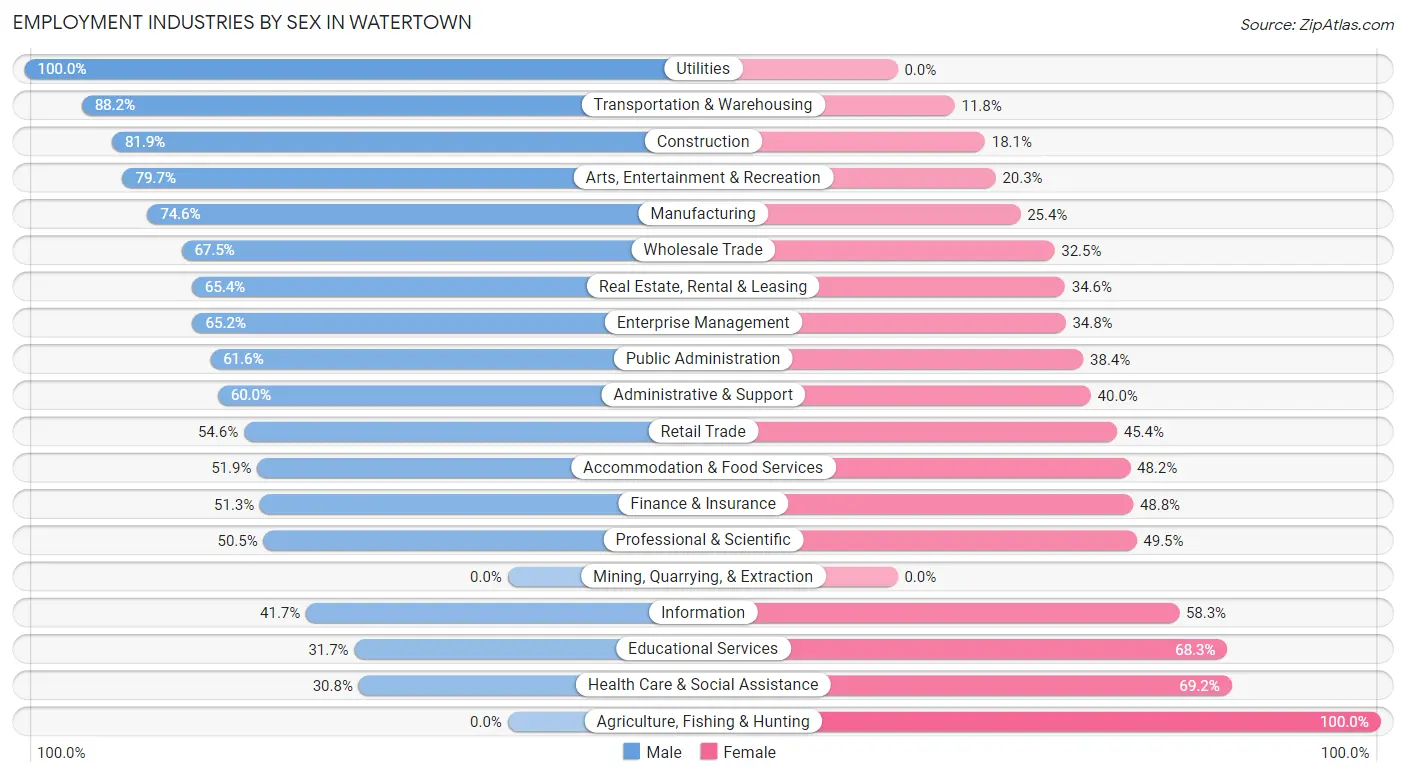
Employment Industries by Sex in Watertown
The Watertown industries that see more men than women are Utilities (100.0%), Transportation & Warehousing (88.2%), and Construction (81.9%), whereas the industries that tend to have a higher number of women are Agriculture, Fishing & Hunting (100.0%), Health Care & Social Assistance (69.2%), and Educational Services (68.3%).
| Industry | Male | Female |
| Agriculture, Fishing & Hunting | 0 (0.0%) | 6 (100.0%) |
| Mining, Quarrying, & Extraction | 0 (0.0%) | 0 (0.0%) |
| Construction | 489 (81.9%) | 108 (18.1%) |
| Manufacturing | 587 (74.6%) | 200 (25.4%) |
| Wholesale Trade | 104 (67.5%) | 50 (32.5%) |
| Retail Trade | 951 (54.6%) | 791 (45.4%) |
| Transportation & Warehousing | 246 (88.2%) | 33 (11.8%) |
| Utilities | 13 (100.0%) | 0 (0.0%) |
| Information | 106 (41.7%) | 148 (58.3%) |
| Finance & Insurance | 144 (51.2%) | 137 (48.7%) |
| Real Estate, Rental & Leasing | 117 (65.4%) | 62 (34.6%) |
| Professional & Scientific | 140 (50.5%) | 137 (49.5%) |
| Enterprise Management | 15 (65.2%) | 8 (34.8%) |
| Administrative & Support | 192 (60.0%) | 128 (40.0%) |
| Educational Services | 337 (31.7%) | 725 (68.3%) |
| Health Care & Social Assistance | 613 (30.8%) | 1,375 (69.2%) |
| Arts, Entertainment & Recreation | 55 (79.7%) | 14 (20.3%) |
| Accommodation & Food Services | 632 (51.8%) | 587 (48.1%) |
| Public Administration | 503 (61.6%) | 314 (38.4%) |
| Total | 5,547 (52.3%) | 5,063 (47.7%) |
Education in Watertown
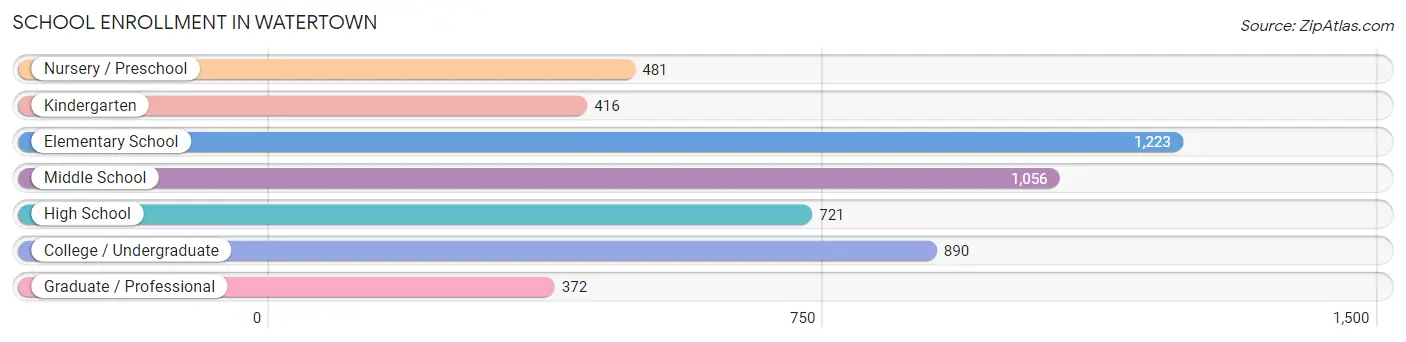
School Enrollment in Watertown
The most common levels of schooling among the 5,159 students in Watertown are elementary school (1,223 | 23.7%), middle school (1,056 | 20.5%), and college / undergraduate (890 | 17.2%).
| School Level | # Students | % Students |
| Nursery / Preschool | 481 | 9.3% |
| Kindergarten | 416 | 8.1% |
| Elementary School | 1,223 | 23.7% |
| Middle School | 1,056 | 20.5% |
| High School | 721 | 14.0% |
| College / Undergraduate | 890 | 17.2% |
| Graduate / Professional | 372 | 7.2% |
| Total | 5,159 | 100.0% |
School Enrollment by Age by Funding Source in Watertown
Out of a total of 5,159 students who are enrolled in schools in Watertown, 598 (11.6%) attend a private institution, while the remaining 4,561 (88.4%) are enrolled in public schools. The age group of 35 years and over has the highest likelihood of being enrolled in private schools, with 114 (27.8% in the age bracket) enrolled. Conversely, the age group of 18 to 19 year olds has the lowest likelihood of being enrolled in a private school, with 119 (99.2% in the age bracket) attending a public institution.
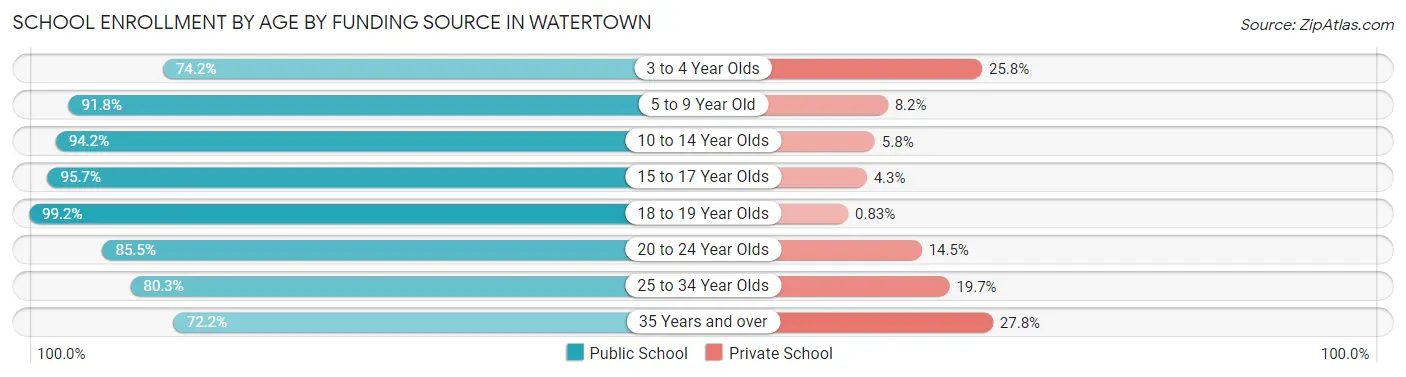
| Age Bracket | Public School | Private School |
| 3 to 4 Year Olds | 357 (74.2%) | 124 (25.8%) |
| 5 to 9 Year Old | 1,377 (91.8%) | 123 (8.2%) |
| 10 to 14 Year Olds | 1,148 (94.2%) | 71 (5.8%) |
| 15 to 17 Year Olds | 558 (95.7%) | 25 (4.3%) |
| 18 to 19 Year Olds | 119 (99.2%) | 1 (0.8%) |
| 20 to 24 Year Olds | 441 (85.5%) | 75 (14.5%) |
| 25 to 34 Year Olds | 265 (80.3%) | 65 (19.7%) |
| 35 Years and over | 296 (72.2%) | 114 (27.8%) |
| Total | 4,561 (88.4%) | 598 (11.6%) |
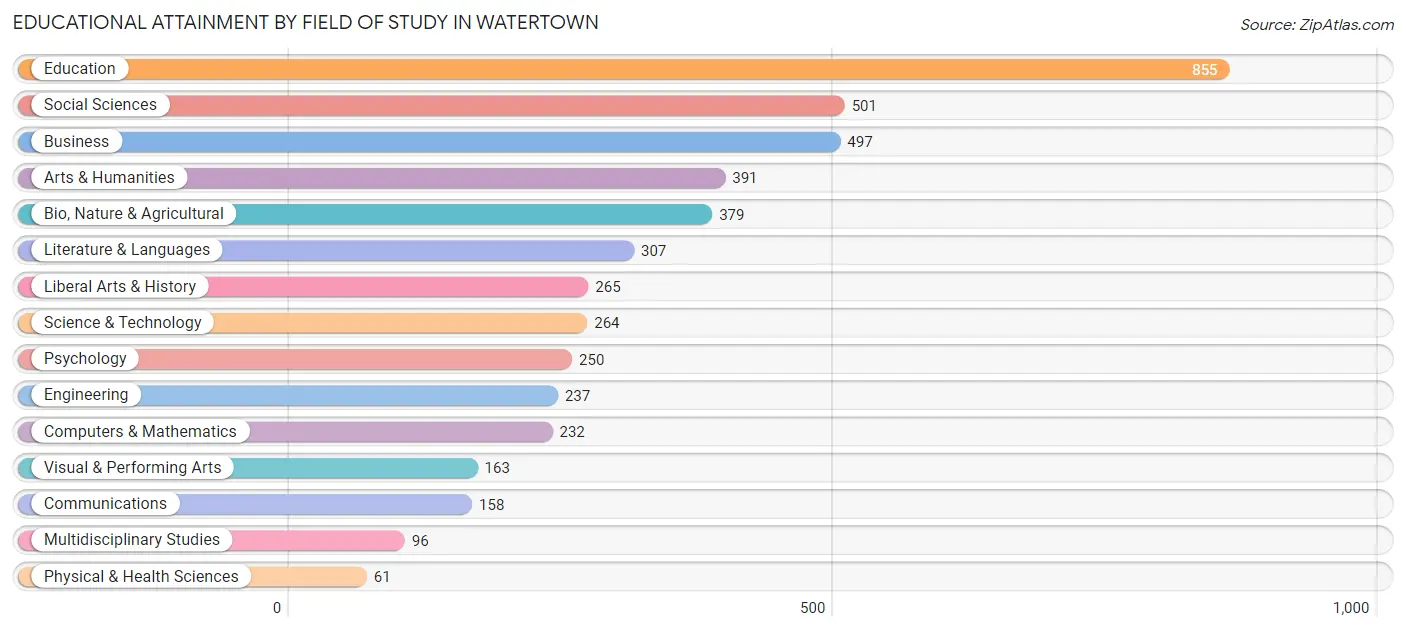
Educational Attainment by Field of Study in Watertown
Education (855 | 18.4%), social sciences (501 | 10.8%), business (497 | 10.7%), arts & humanities (391 | 8.4%), and bio, nature & agricultural (379 | 8.1%) are the most common fields of study among 4,656 individuals in Watertown who have obtained a bachelor's degree or higher.
| Field of Study | # Graduates | % Graduates |
| Computers & Mathematics | 232 | 5.0% |
| Bio, Nature & Agricultural | 379 | 8.1% |
| Physical & Health Sciences | 61 | 1.3% |
| Psychology | 250 | 5.4% |
| Social Sciences | 501 | 10.8% |
| Engineering | 237 | 5.1% |
| Multidisciplinary Studies | 96 | 2.1% |
| Science & Technology | 264 | 5.7% |
| Business | 497 | 10.7% |
| Education | 855 | 18.4% |
| Literature & Languages | 307 | 6.6% |
| Liberal Arts & History | 265 | 5.7% |
| Visual & Performing Arts | 163 | 3.5% |
| Communications | 158 | 3.4% |
| Arts & Humanities | 391 | 8.4% |
| Total | 4,656 | 100.0% |
Transportation & Commute in Watertown
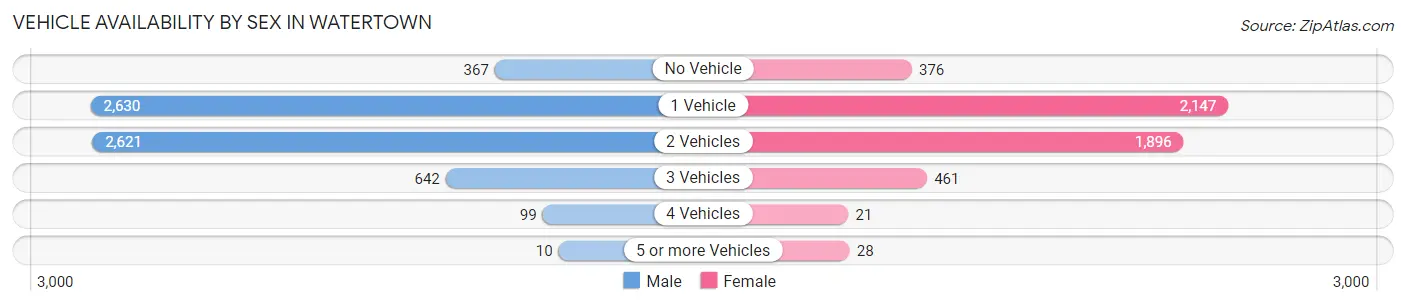
Vehicle Availability by Sex in Watertown
The most prevalent vehicle ownership categories in Watertown are males with 1 vehicle (2,630, accounting for 41.3%) and females with 1 vehicle (2,147, making up 53.4%).
| Vehicles Available | Male | Female |
| No Vehicle | 367 (5.8%) | 376 (7.6%) |
| 1 Vehicle | 2,630 (41.3%) | 2,147 (43.6%) |
| 2 Vehicles | 2,621 (41.1%) | 1,896 (38.5%) |
| 3 Vehicles | 642 (10.1%) | 461 (9.3%) |
| 4 Vehicles | 99 (1.5%) | 21 (0.4%) |
| 5 or more Vehicles | 10 (0.2%) | 28 (0.6%) |
| Total | 6,369 (100.0%) | 4,929 (100.0%) |
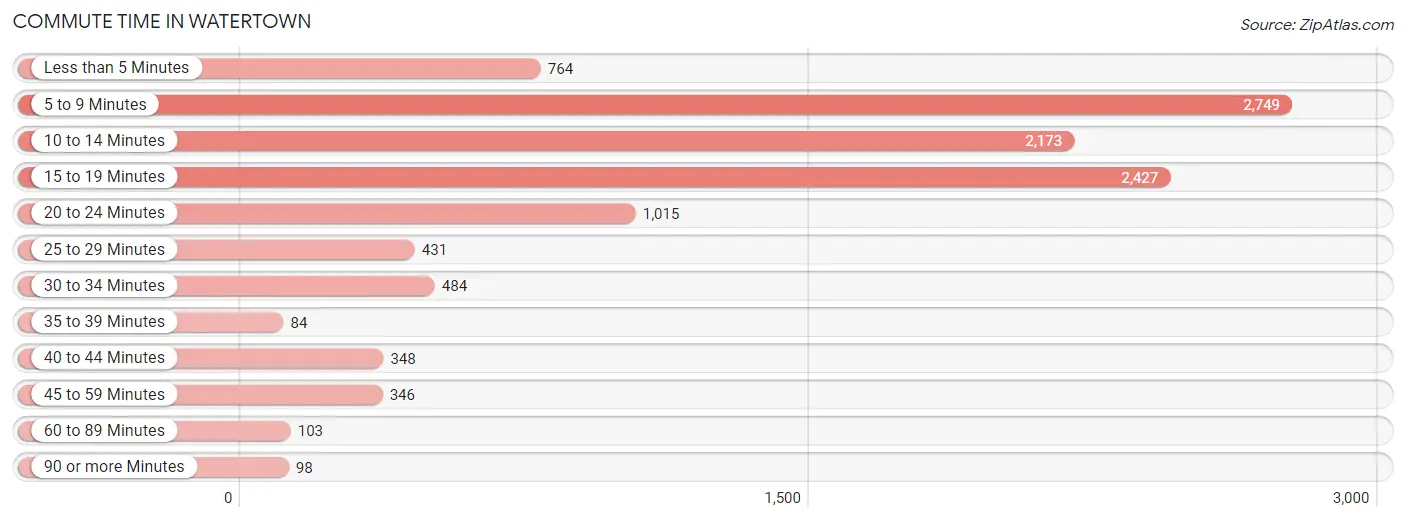
Commute Time in Watertown
The most frequently occuring commute durations in Watertown are 5 to 9 minutes (2,749 commuters, 24.9%), 15 to 19 minutes (2,427 commuters, 22.0%), and 10 to 14 minutes (2,173 commuters, 19.7%).
| Commute Time | # Commuters | % Commuters |
| Less than 5 Minutes | 764 | 6.9% |
| 5 to 9 Minutes | 2,749 | 24.9% |
| 10 to 14 Minutes | 2,173 | 19.7% |
| 15 to 19 Minutes | 2,427 | 22.0% |
| 20 to 24 Minutes | 1,015 | 9.2% |
| 25 to 29 Minutes | 431 | 3.9% |
| 30 to 34 Minutes | 484 | 4.4% |
| 35 to 39 Minutes | 84 | 0.8% |
| 40 to 44 Minutes | 348 | 3.2% |
| 45 to 59 Minutes | 346 | 3.1% |
| 60 to 89 Minutes | 103 | 0.9% |
| 90 or more Minutes | 98 | 0.9% |
Commute Time by Sex in Watertown
The most common commute times in Watertown are 5 to 9 minutes (1,452 commuters, 23.2%) for males and 5 to 9 minutes (1,297 commuters, 27.3%) for females.
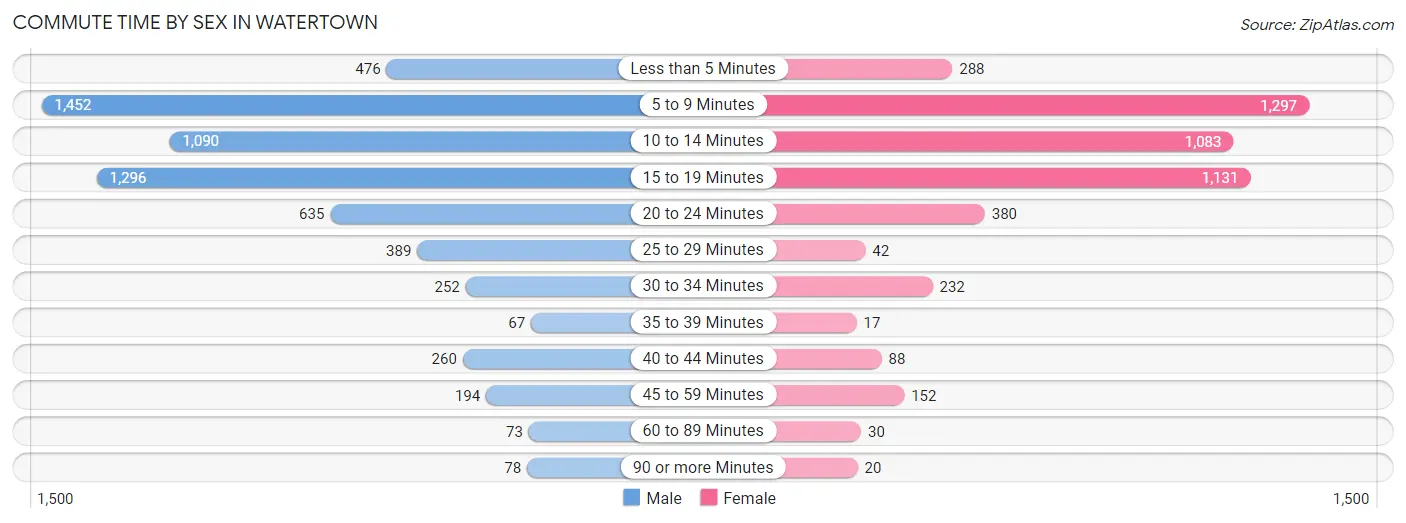
| Commute Time | Male | Female |
| Less than 5 Minutes | 476 (7.6%) | 288 (6.0%) |
| 5 to 9 Minutes | 1,452 (23.2%) | 1,297 (27.3%) |
| 10 to 14 Minutes | 1,090 (17.4%) | 1,083 (22.8%) |
| 15 to 19 Minutes | 1,296 (20.7%) | 1,131 (23.8%) |
| 20 to 24 Minutes | 635 (10.1%) | 380 (8.0%) |
| 25 to 29 Minutes | 389 (6.2%) | 42 (0.9%) |
| 30 to 34 Minutes | 252 (4.0%) | 232 (4.9%) |
| 35 to 39 Minutes | 67 (1.1%) | 17 (0.4%) |
| 40 to 44 Minutes | 260 (4.2%) | 88 (1.8%) |
| 45 to 59 Minutes | 194 (3.1%) | 152 (3.2%) |
| 60 to 89 Minutes | 73 (1.2%) | 30 (0.6%) |
| 90 or more Minutes | 78 (1.3%) | 20 (0.4%) |
Time of Departure to Work by Sex in Watertown
The most frequent times of departure to work in Watertown are 7:00 AM to 7:29 AM (1,014, 16.2%) for males and 7:30 AM to 7:59 AM (723, 15.2%) for females.
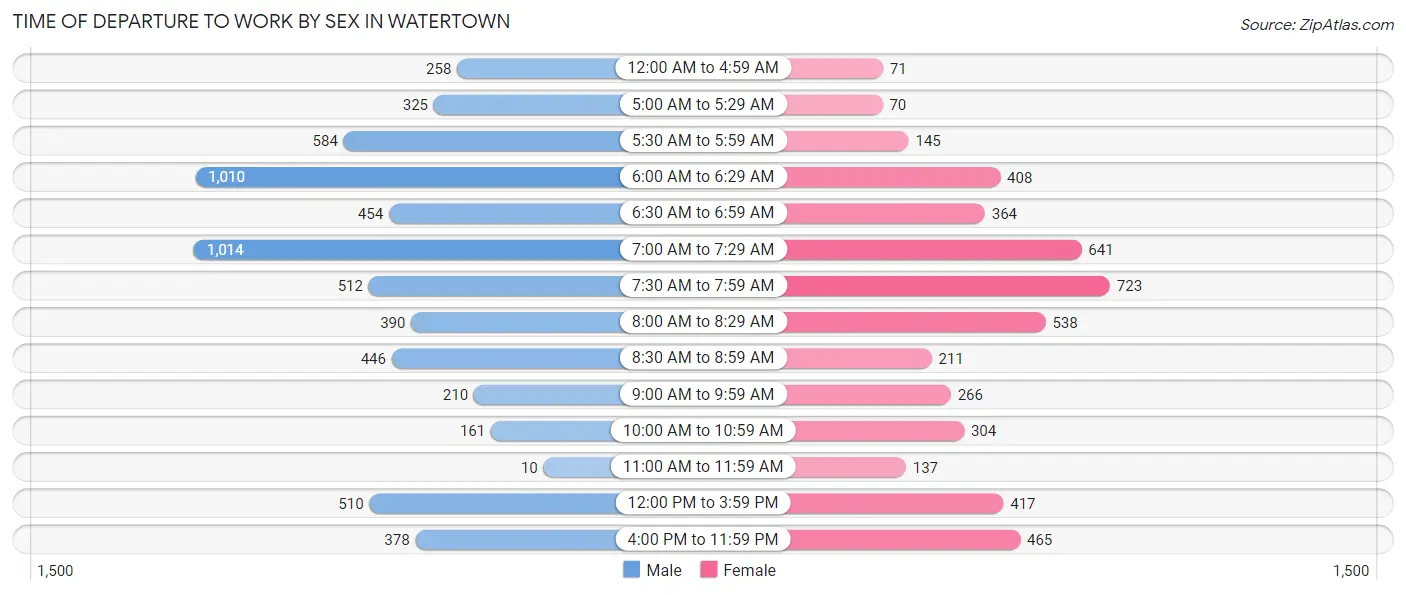
| Time of Departure | Male | Female |
| 12:00 AM to 4:59 AM | 258 (4.1%) | 71 (1.5%) |
| 5:00 AM to 5:29 AM | 325 (5.2%) | 70 (1.5%) |
| 5:30 AM to 5:59 AM | 584 (9.3%) | 145 (3.0%) |
| 6:00 AM to 6:29 AM | 1,010 (16.1%) | 408 (8.6%) |
| 6:30 AM to 6:59 AM | 454 (7.2%) | 364 (7.6%) |
| 7:00 AM to 7:29 AM | 1,014 (16.2%) | 641 (13.5%) |
| 7:30 AM to 7:59 AM | 512 (8.2%) | 723 (15.2%) |
| 8:00 AM to 8:29 AM | 390 (6.2%) | 538 (11.3%) |
| 8:30 AM to 8:59 AM | 446 (7.1%) | 211 (4.4%) |
| 9:00 AM to 9:59 AM | 210 (3.4%) | 266 (5.6%) |
| 10:00 AM to 10:59 AM | 161 (2.6%) | 304 (6.4%) |
| 11:00 AM to 11:59 AM | 10 (0.2%) | 137 (2.9%) |
| 12:00 PM to 3:59 PM | 510 (8.1%) | 417 (8.8%) |
| 4:00 PM to 11:59 PM | 378 (6.0%) | 465 (9.8%) |
| Total | 6,262 (100.0%) | 4,760 (100.0%) |
Housing Occupancy in Watertown
Occupancy by Ownership in Watertown
Of the total 11,455 dwellings in Watertown, owner-occupied units account for 4,843 (42.3%), while renter-occupied units make up 6,612 (57.7%).
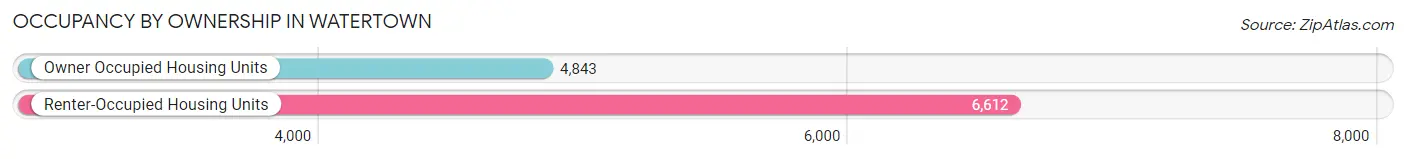
| Occupancy | # Housing Units | % Housing Units |
| Owner Occupied Housing Units | 4,843 | 42.3% |
| Renter-Occupied Housing Units | 6,612 | 57.7% |
| Total Occupied Housing Units | 11,455 | 100.0% |
Occupancy by Household Size in Watertown
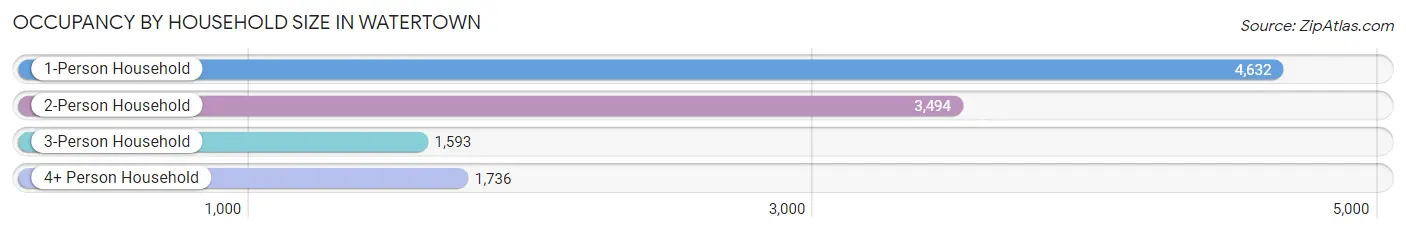
| Household Size | # Housing Units | % Housing Units |
| 1-Person Household | 4,632 | 40.4% |
| 2-Person Household | 3,494 | 30.5% |
| 3-Person Household | 1,593 | 13.9% |
| 4+ Person Household | 1,736 | 15.1% |
| Total Housing Units | 11,455 | 100.0% |
Occupancy by Ownership by Household Size in Watertown
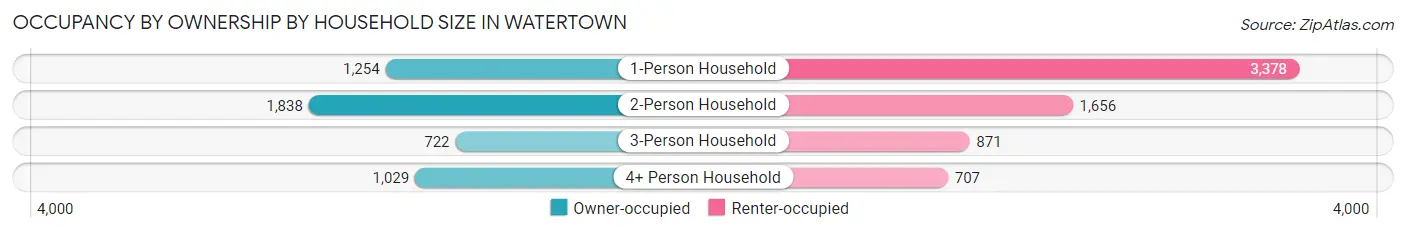
| Household Size | Owner-occupied | Renter-occupied |
| 1-Person Household | 1,254 (27.1%) | 3,378 (72.9%) |
| 2-Person Household | 1,838 (52.6%) | 1,656 (47.4%) |
| 3-Person Household | 722 (45.3%) | 871 (54.7%) |
| 4+ Person Household | 1,029 (59.3%) | 707 (40.7%) |
| Total Housing Units | 4,843 (42.3%) | 6,612 (57.7%) |
Occupancy by Educational Attainment in Watertown
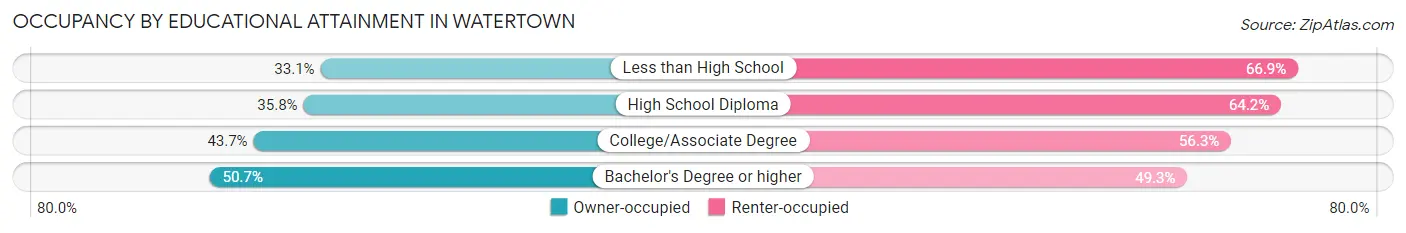
| Household Size | Owner-occupied | Renter-occupied |
| Less than High School | 308 (33.1%) | 623 (66.9%) |
| High School Diploma | 1,247 (35.8%) | 2,238 (64.2%) |
| College/Associate Degree | 1,743 (43.7%) | 2,246 (56.3%) |
| Bachelor's Degree or higher | 1,545 (50.7%) | 1,505 (49.3%) |
Occupancy by Age of Householder in Watertown
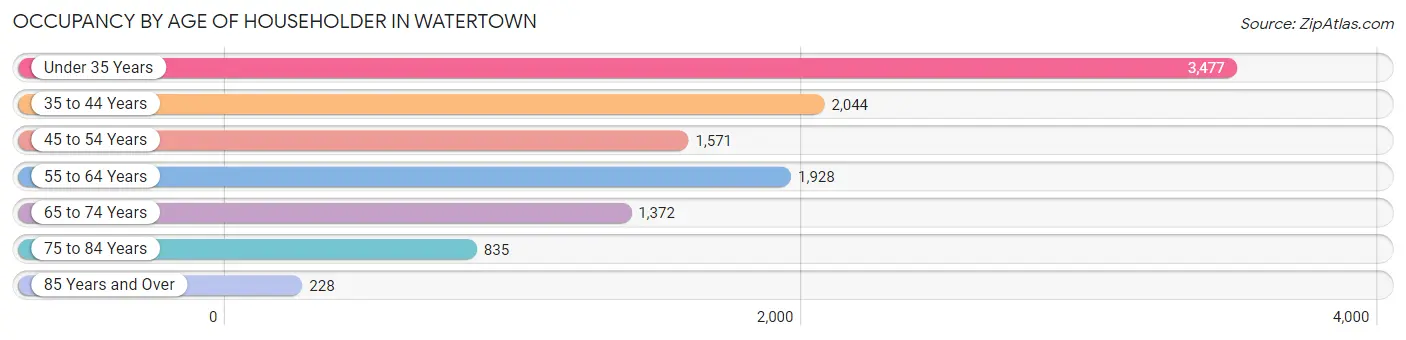
| Age Bracket | # Households | % Households |
| Under 35 Years | 3,477 | 30.3% |
| 35 to 44 Years | 2,044 | 17.8% |
| 45 to 54 Years | 1,571 | 13.7% |
| 55 to 64 Years | 1,928 | 16.8% |
| 65 to 74 Years | 1,372 | 12.0% |
| 75 to 84 Years | 835 | 7.3% |
| 85 Years and Over | 228 | 2.0% |
| Total | 11,455 | 100.0% |
Housing Finances in Watertown
Median Income by Occupancy in Watertown
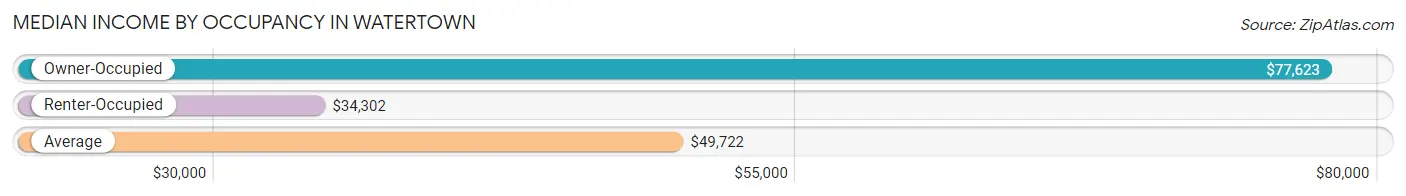
| Occupancy Type | # Households | Median Income |
| Owner-Occupied | 4,843 (42.3%) | $77,623 |
| Renter-Occupied | 6,612 (57.7%) | $34,302 |
| Average | 11,455 (100.0%) | $49,722 |
Occupancy by Householder Income Bracket in Watertown
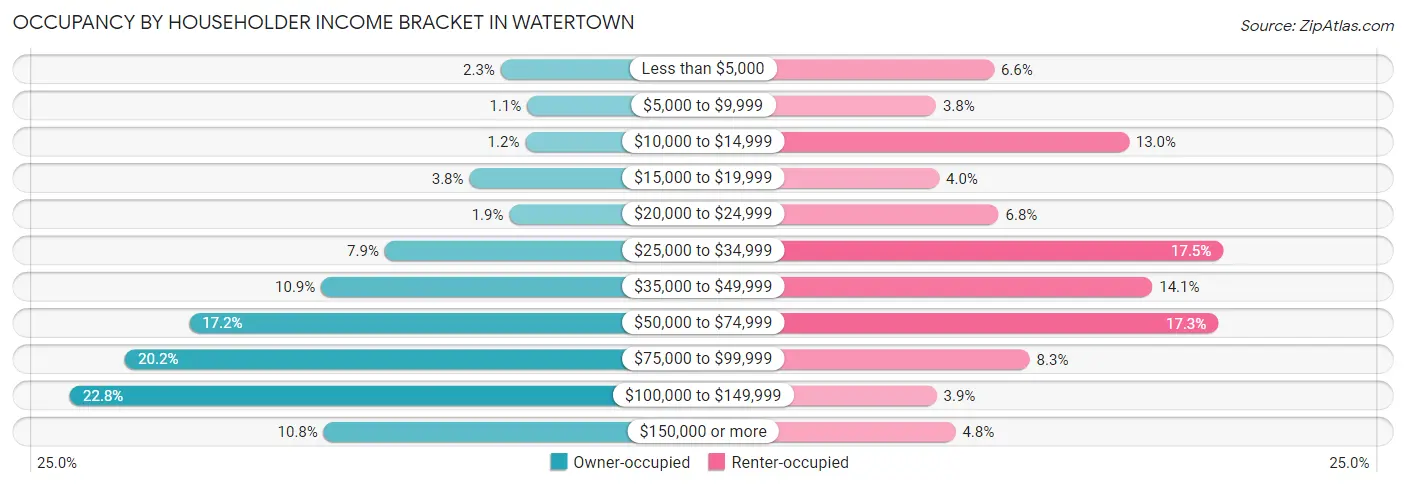
| Income Bracket | Owner-occupied | Renter-occupied |
| Less than $5,000 | 113 (2.3%) | 436 (6.6%) |
| $5,000 to $9,999 | 52 (1.1%) | 253 (3.8%) |
| $10,000 to $14,999 | 56 (1.2%) | 860 (13.0%) |
| $15,000 to $19,999 | 185 (3.8%) | 263 (4.0%) |
| $20,000 to $24,999 | 93 (1.9%) | 450 (6.8%) |
| $25,000 to $34,999 | 380 (7.9%) | 1,157 (17.5%) |
| $35,000 to $49,999 | 527 (10.9%) | 934 (14.1%) |
| $50,000 to $74,999 | 831 (17.2%) | 1,141 (17.3%) |
| $75,000 to $99,999 | 979 (20.2%) | 548 (8.3%) |
| $100,000 to $149,999 | 1,106 (22.8%) | 255 (3.9%) |
| $150,000 or more | 521 (10.8%) | 315 (4.8%) |
| Total | 4,843 (100.0%) | 6,612 (100.0%) |
Monthly Housing Cost Tiers in Watertown
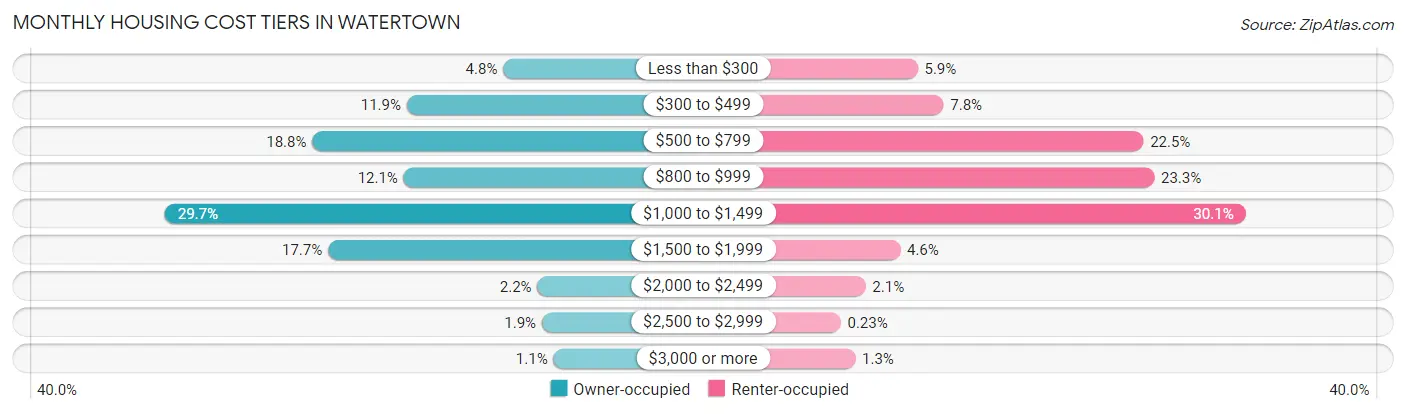
| Monthly Cost | Owner-occupied | Renter-occupied |
| Less than $300 | 230 (4.8%) | 390 (5.9%) |
| $300 to $499 | 574 (11.8%) | 516 (7.8%) |
| $500 to $799 | 911 (18.8%) | 1,489 (22.5%) |
| $800 to $999 | 585 (12.1%) | 1,542 (23.3%) |
| $1,000 to $1,499 | 1,437 (29.7%) | 1,987 (30.0%) |
| $1,500 to $1,999 | 855 (17.6%) | 305 (4.6%) |
| $2,000 to $2,499 | 108 (2.2%) | 136 (2.1%) |
| $2,500 to $2,999 | 92 (1.9%) | 15 (0.2%) |
| $3,000 or more | 51 (1.1%) | 86 (1.3%) |
| Total | 4,843 (100.0%) | 6,612 (100.0%) |
Physical Housing Characteristics in Watertown
Housing Structures in Watertown
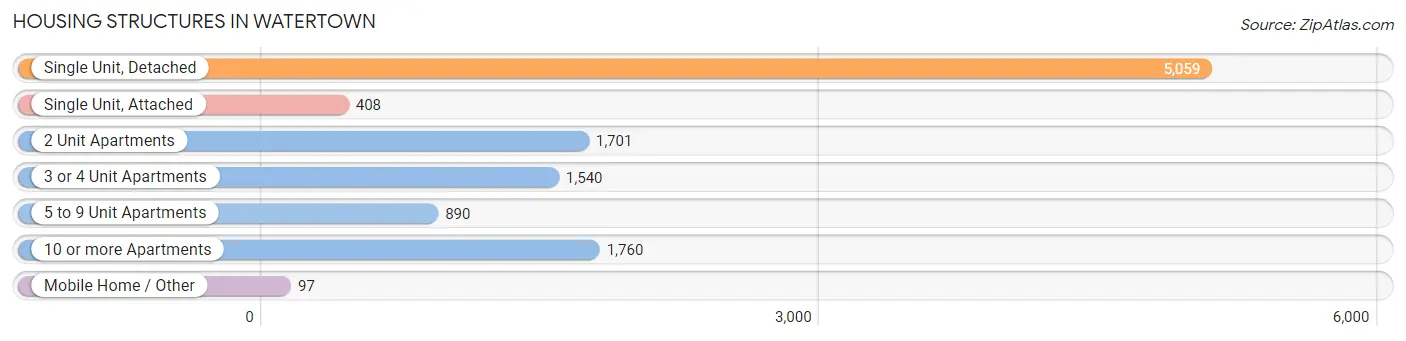
| Structure Type | # Housing Units | % Housing Units |
| Single Unit, Detached | 5,059 | 44.2% |
| Single Unit, Attached | 408 | 3.6% |
| 2 Unit Apartments | 1,701 | 14.8% |
| 3 or 4 Unit Apartments | 1,540 | 13.4% |
| 5 to 9 Unit Apartments | 890 | 7.8% |
| 10 or more Apartments | 1,760 | 15.4% |
| Mobile Home / Other | 97 | 0.9% |
| Total | 11,455 | 100.0% |
Housing Structures by Occupancy in Watertown
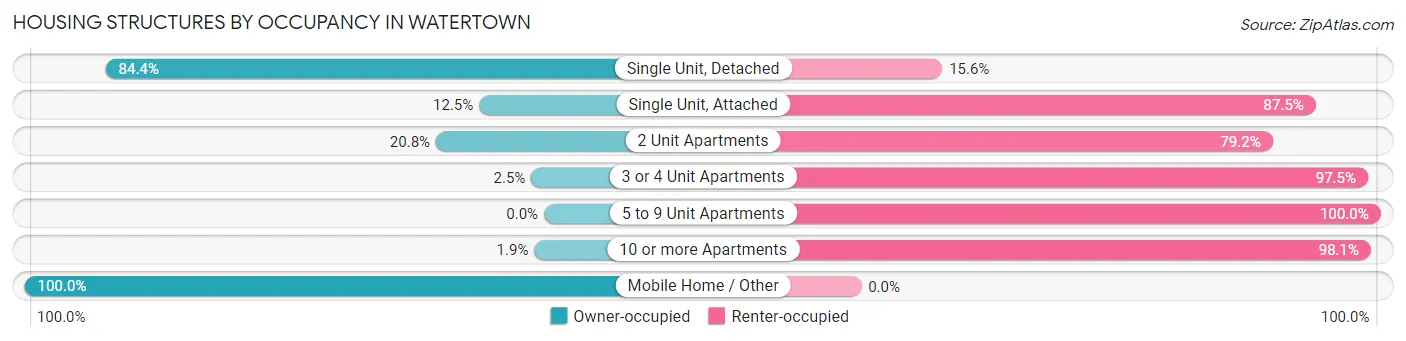
| Structure Type | Owner-occupied | Renter-occupied |
| Single Unit, Detached | 4,270 (84.4%) | 789 (15.6%) |
| Single Unit, Attached | 51 (12.5%) | 357 (87.5%) |
| 2 Unit Apartments | 354 (20.8%) | 1,347 (79.2%) |
| 3 or 4 Unit Apartments | 38 (2.5%) | 1,502 (97.5%) |
| 5 to 9 Unit Apartments | 0 (0.0%) | 890 (100.0%) |
| 10 or more Apartments | 33 (1.9%) | 1,727 (98.1%) |
| Mobile Home / Other | 97 (100.0%) | 0 (0.0%) |
| Total | 4,843 (42.3%) | 6,612 (57.7%) |
Housing Structures by Number of Rooms in Watertown
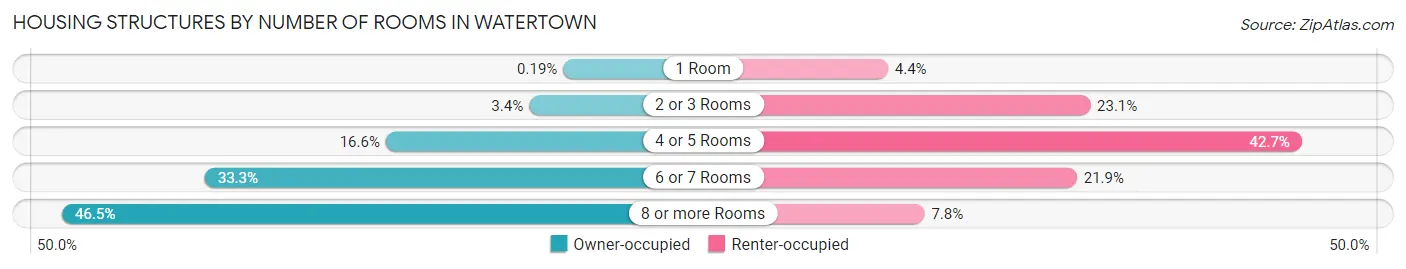
| Number of Rooms | Owner-occupied | Renter-occupied |
| 1 Room | 9 (0.2%) | 293 (4.4%) |
| 2 or 3 Rooms | 162 (3.4%) | 1,530 (23.1%) |
| 4 or 5 Rooms | 804 (16.6%) | 2,823 (42.7%) |
| 6 or 7 Rooms | 1,614 (33.3%) | 1,449 (21.9%) |
| 8 or more Rooms | 2,254 (46.5%) | 517 (7.8%) |
| Total | 4,843 (100.0%) | 6,612 (100.0%) |
Housing Structure by Heating Type in Watertown
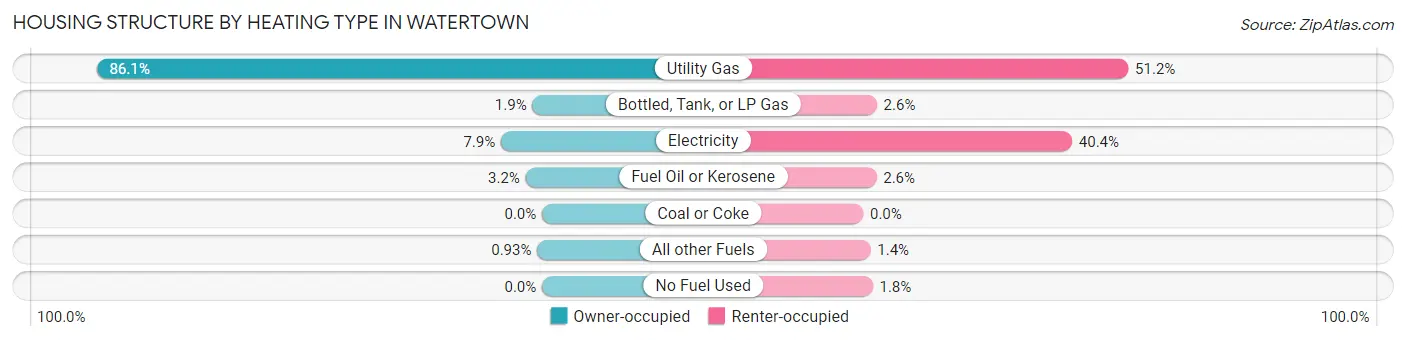
| Heating Type | Owner-occupied | Renter-occupied |
| Utility Gas | 4,170 (86.1%) | 3,387 (51.2%) |
| Bottled, Tank, or LP Gas | 90 (1.9%) | 174 (2.6%) |
| Electricity | 384 (7.9%) | 2,668 (40.4%) |
| Fuel Oil or Kerosene | 154 (3.2%) | 169 (2.6%) |
| Coal or Coke | 0 (0.0%) | 0 (0.0%) |
| All other Fuels | 45 (0.9%) | 93 (1.4%) |
| No Fuel Used | 0 (0.0%) | 121 (1.8%) |
| Total | 4,843 (100.0%) | 6,612 (100.0%) |
Household Vehicle Usage in Watertown
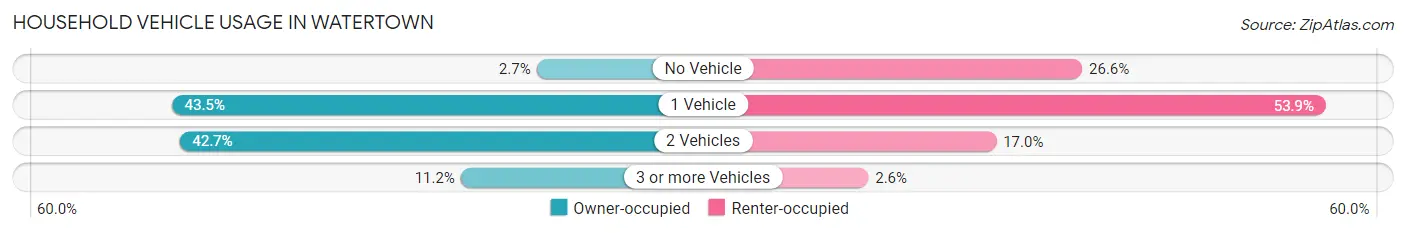
| Vehicles per Household | Owner-occupied | Renter-occupied |
| No Vehicle | 129 (2.7%) | 1,757 (26.6%) |
| 1 Vehicle | 2,108 (43.5%) | 3,561 (53.9%) |
| 2 Vehicles | 2,066 (42.7%) | 1,121 (17.0%) |
| 3 or more Vehicles | 540 (11.2%) | 173 (2.6%) |
| Total | 4,843 (100.0%) | 6,612 (100.0%) |
Real Estate & Mortgages in Watertown
Real Estate and Mortgage Overview in Watertown
| Characteristic | Without Mortgage | With Mortgage |
| Housing Units | 1,832 | 3,011 |
| Median Property Value | $127,000 | $161,500 |
| Median Household Income | $62,424 | $350 |
| Monthly Housing Costs | $536 | $51 |
| Real Estate Taxes | $2,059 | $102 |
Property Value by Mortgage Status in Watertown
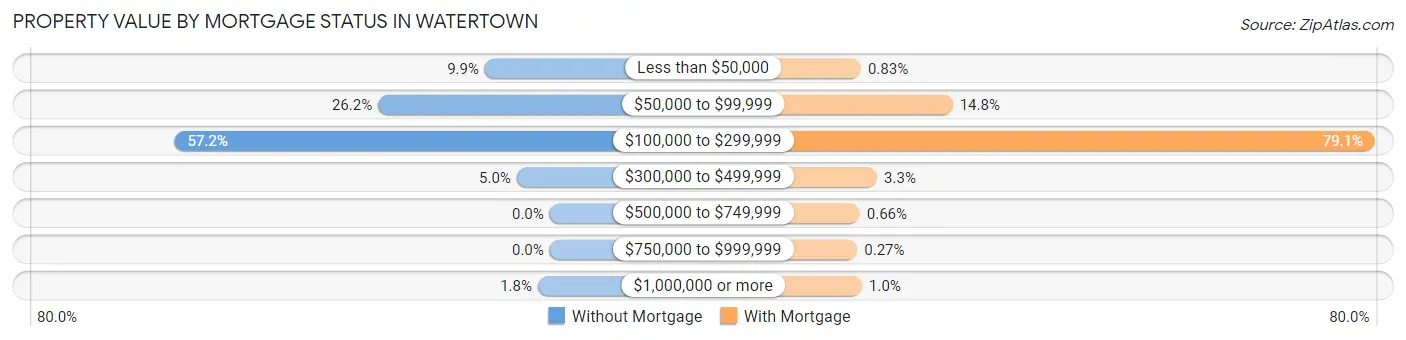
| Property Value | Without Mortgage | With Mortgage |
| Less than $50,000 | 181 (9.9%) | 25 (0.8%) |
| $50,000 to $99,999 | 479 (26.2%) | 446 (14.8%) |
| $100,000 to $299,999 | 1,047 (57.2%) | 2,383 (79.1%) |
| $300,000 to $499,999 | 92 (5.0%) | 99 (3.3%) |
| $500,000 to $749,999 | 0 (0.0%) | 20 (0.7%) |
| $750,000 to $999,999 | 0 (0.0%) | 8 (0.3%) |
| $1,000,000 or more | 33 (1.8%) | 30 (1.0%) |
| Total | 1,832 (100.0%) | 3,011 (100.0%) |
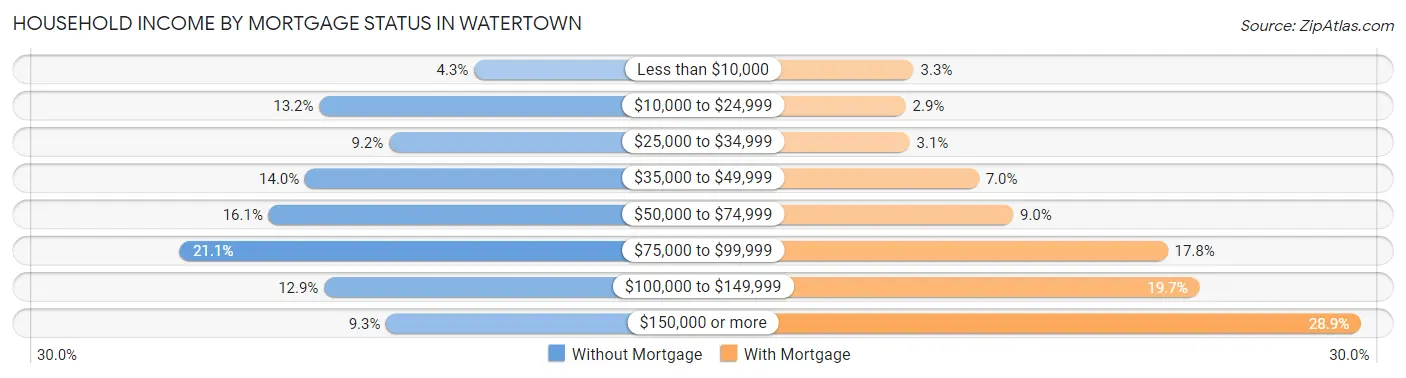
Household Income by Mortgage Status in Watertown
| Household Income | Without Mortgage | With Mortgage |
| Less than $10,000 | 79 (4.3%) | 100 (3.3%) |
| $10,000 to $24,999 | 241 (13.2%) | 86 (2.9%) |
| $25,000 to $34,999 | 168 (9.2%) | 93 (3.1%) |
| $35,000 to $49,999 | 256 (14.0%) | 212 (7.0%) |
| $50,000 to $74,999 | 294 (16.1%) | 271 (9.0%) |
| $75,000 to $99,999 | 387 (21.1%) | 537 (17.8%) |
| $100,000 to $149,999 | 236 (12.9%) | 592 (19.7%) |
| $150,000 or more | 171 (9.3%) | 870 (28.9%) |
| Total | 1,832 (100.0%) | 3,011 (100.0%) |
Property Value to Household Income Ratio in Watertown
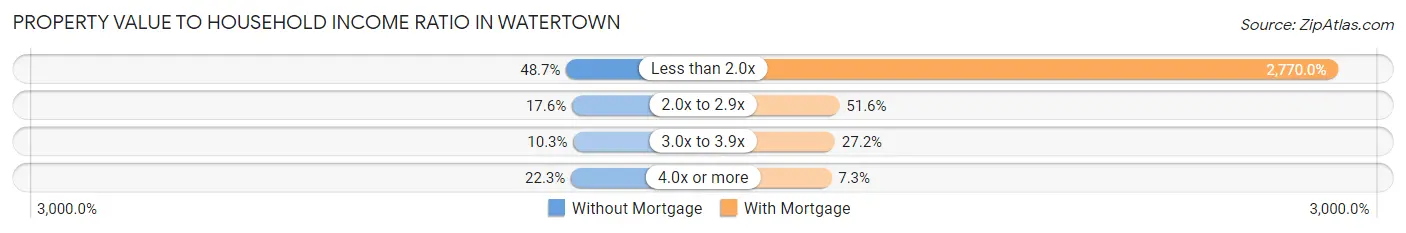
| Value-to-Income Ratio | Without Mortgage | With Mortgage |
| Less than 2.0x | 892 (48.7%) | 83,404 (2,770.0%) |
| 2.0x to 2.9x | 323 (17.6%) | 1,554 (51.6%) |
| 3.0x to 3.9x | 189 (10.3%) | 818 (27.2%) |
| 4.0x or more | 409 (22.3%) | 219 (7.3%) |
| Total | 1,832 (100.0%) | 3,011 (100.0%) |
Real Estate Taxes by Mortgage Status in Watertown
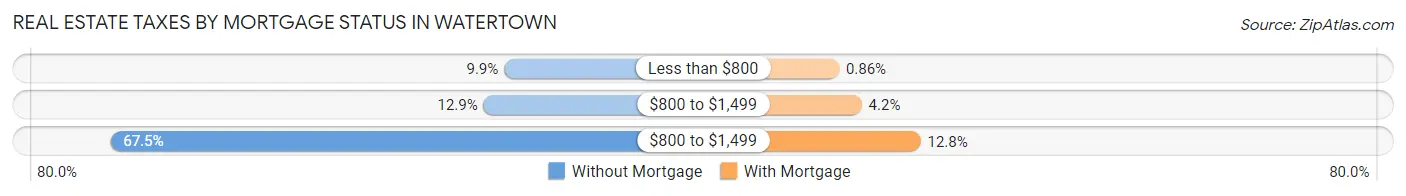
| Property Taxes | Without Mortgage | With Mortgage |
| Less than $800 | 182 (9.9%) | 26 (0.9%) |
| $800 to $1,499 | 237 (12.9%) | 126 (4.2%) |
| $800 to $1,499 | 1,236 (67.5%) | 385 (12.8%) |
| Total | 1,832 (100.0%) | 3,011 (100.0%) |
Health & Disability in Watertown
Health Insurance Coverage by Age in Watertown
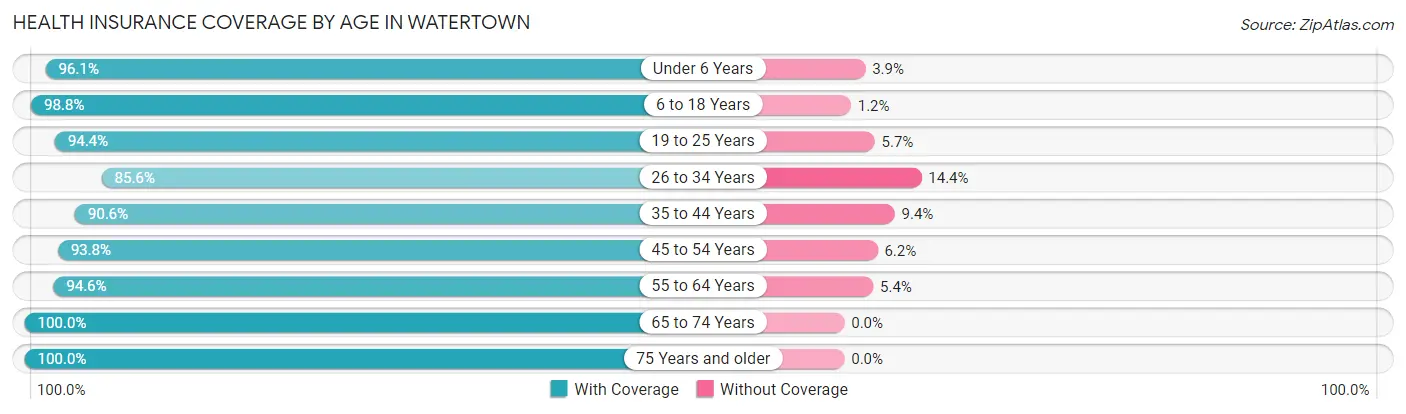
| Age Bracket | With Coverage | Without Coverage |
| Under 6 Years | 2,023 (96.1%) | 82 (3.9%) |
| 6 to 18 Years | 3,439 (98.8%) | 42 (1.2%) |
| 19 to 25 Years | 2,370 (94.4%) | 142 (5.7%) |
| 26 to 34 Years | 2,897 (85.6%) | 486 (14.4%) |
| 35 to 44 Years | 2,850 (90.6%) | 295 (9.4%) |
| 45 to 54 Years | 2,415 (93.8%) | 159 (6.2%) |
| 55 to 64 Years | 2,803 (94.6%) | 159 (5.4%) |
| 65 to 74 Years | 1,809 (100.0%) | 0 (0.0%) |
| 75 Years and older | 1,503 (100.0%) | 0 (0.0%) |
| Total | 22,109 (94.2%) | 1,365 (5.8%) |
Health Insurance Coverage by Citizenship Status in Watertown
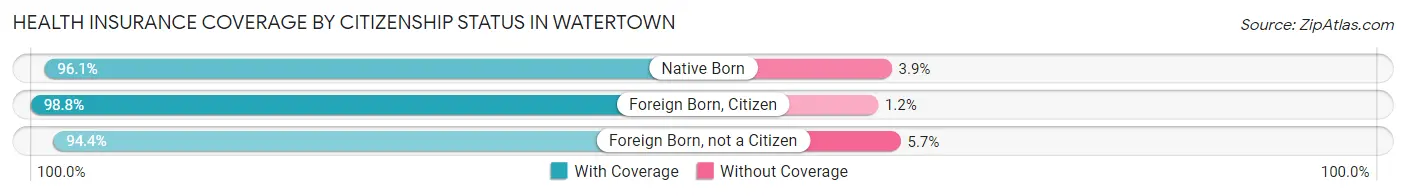
| Citizenship Status | With Coverage | Without Coverage |
| Native Born | 2,023 (96.1%) | 82 (3.9%) |
| Foreign Born, Citizen | 3,439 (98.8%) | 42 (1.2%) |
| Foreign Born, not a Citizen | 2,370 (94.4%) | 142 (5.7%) |
Health Insurance Coverage by Household Income in Watertown
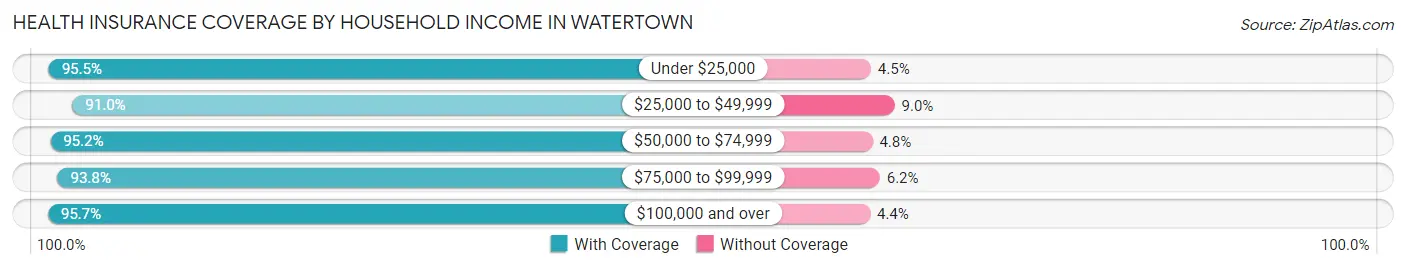
| Household Income | With Coverage | Without Coverage |
| Under $25,000 | 4,334 (95.5%) | 205 (4.5%) |
| $25,000 to $49,999 | 4,875 (91.0%) | 480 (9.0%) |
| $50,000 to $74,999 | 3,506 (95.2%) | 177 (4.8%) |
| $75,000 to $99,999 | 3,357 (93.8%) | 221 (6.2%) |
| $100,000 and over | 5,691 (95.7%) | 259 (4.3%) |
Public vs Private Health Insurance Coverage by Age in Watertown
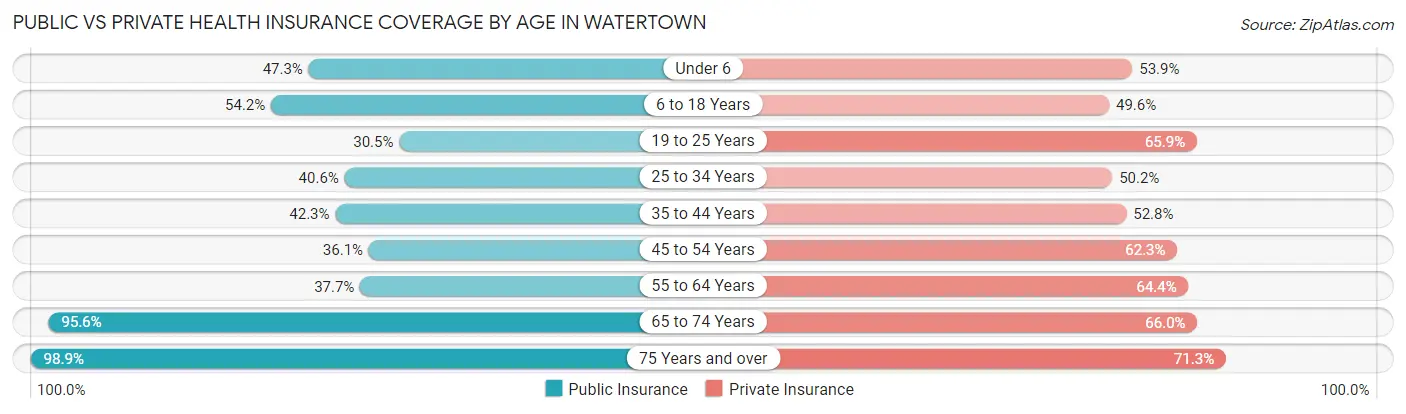
| Age Bracket | Public Insurance | Private Insurance |
| Under 6 | 995 (47.3%) | 1,135 (53.9%) |
| 6 to 18 Years | 1,888 (54.2%) | 1,727 (49.6%) |
| 19 to 25 Years | 765 (30.4%) | 1,656 (65.9%) |
| 25 to 34 Years | 1,373 (40.6%) | 1,698 (50.2%) |
| 35 to 44 Years | 1,331 (42.3%) | 1,661 (52.8%) |
| 45 to 54 Years | 929 (36.1%) | 1,603 (62.3%) |
| 55 to 64 Years | 1,117 (37.7%) | 1,906 (64.3%) |
| 65 to 74 Years | 1,729 (95.6%) | 1,194 (66.0%) |
| 75 Years and over | 1,486 (98.9%) | 1,072 (71.3%) |
| Total | 11,613 (49.5%) | 13,652 (58.2%) |
Disability Status by Sex by Age in Watertown
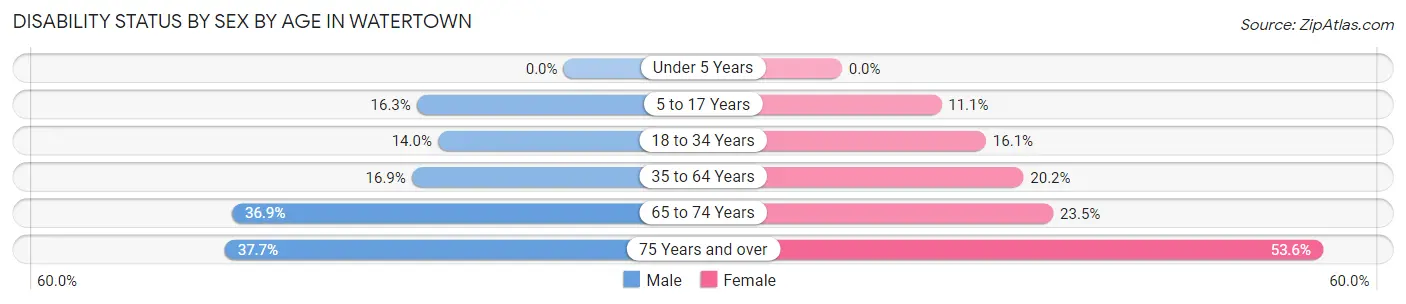
| Age Bracket | Male | Female |
| Under 5 Years | 0 (0.0%) | 0 (0.0%) |
| 5 to 17 Years | 312 (16.3%) | 172 (11.1%) |
| 18 to 34 Years | 439 (14.0%) | 494 (16.1%) |
| 35 to 64 Years | 755 (16.9%) | 852 (20.2%) |
| 65 to 74 Years | 263 (36.9%) | 258 (23.5%) |
| 75 Years and over | 207 (37.7%) | 511 (53.6%) |
Disability Class by Sex by Age in Watertown
Disability Class: Hearing Difficulty
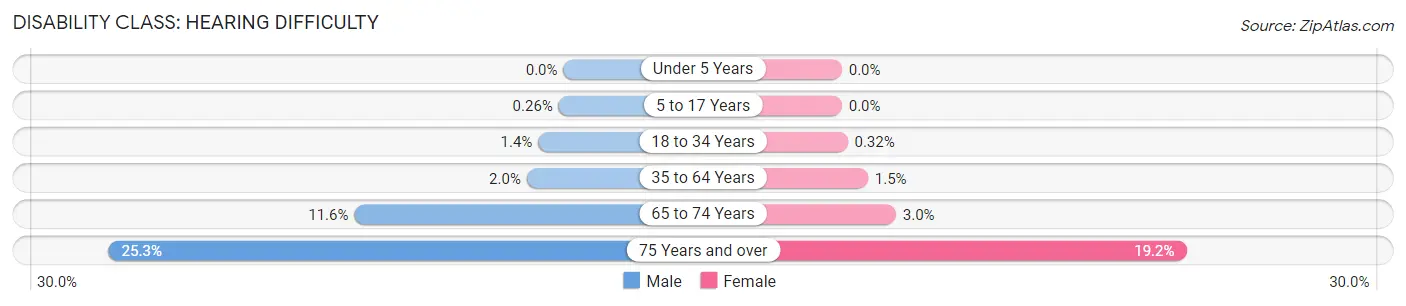
| Age Bracket | Male | Female |
| Under 5 Years | 0 (0.0%) | 0 (0.0%) |
| 5 to 17 Years | 5 (0.3%) | 0 (0.0%) |
| 18 to 34 Years | 44 (1.4%) | 10 (0.3%) |
| 35 to 64 Years | 91 (2.0%) | 61 (1.5%) |
| 65 to 74 Years | 83 (11.6%) | 33 (3.0%) |
| 75 Years and over | 139 (25.3%) | 183 (19.2%) |
Disability Class: Vision Difficulty
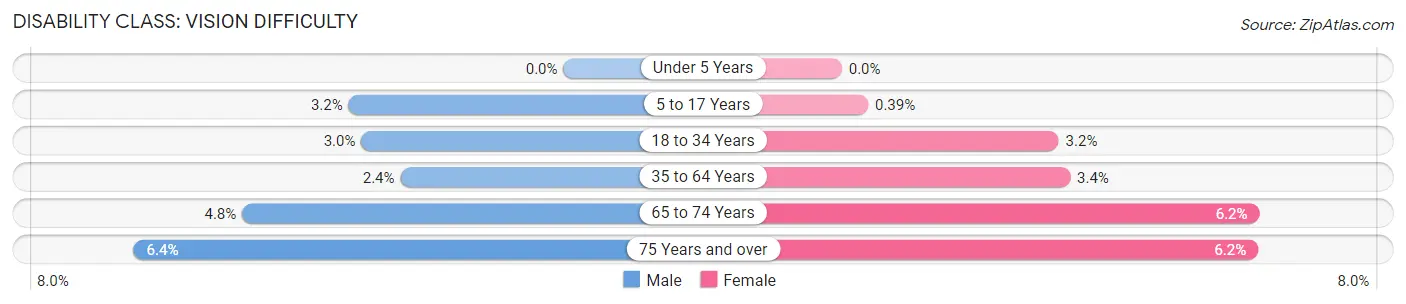
| Age Bracket | Male | Female |
| Under 5 Years | 0 (0.0%) | 0 (0.0%) |
| 5 to 17 Years | 61 (3.2%) | 6 (0.4%) |
| 18 to 34 Years | 94 (3.0%) | 99 (3.2%) |
| 35 to 64 Years | 108 (2.4%) | 143 (3.4%) |
| 65 to 74 Years | 34 (4.8%) | 68 (6.2%) |
| 75 Years and over | 35 (6.4%) | 59 (6.2%) |
Disability Class: Cognitive Difficulty
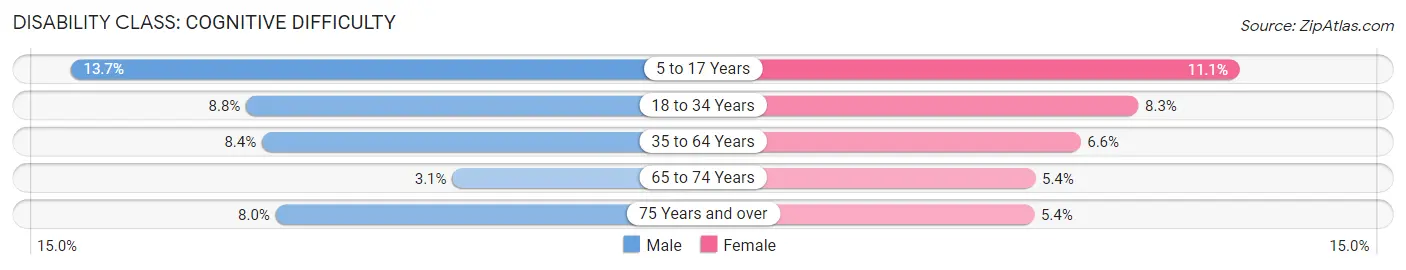
| Age Bracket | Male | Female |
| 5 to 17 Years | 262 (13.7%) | 172 (11.1%) |
| 18 to 34 Years | 277 (8.8%) | 254 (8.3%) |
| 35 to 64 Years | 375 (8.4%) | 280 (6.6%) |
| 65 to 74 Years | 22 (3.1%) | 59 (5.4%) |
| 75 Years and over | 44 (8.0%) | 51 (5.3%) |
Disability Class: Ambulatory Difficulty
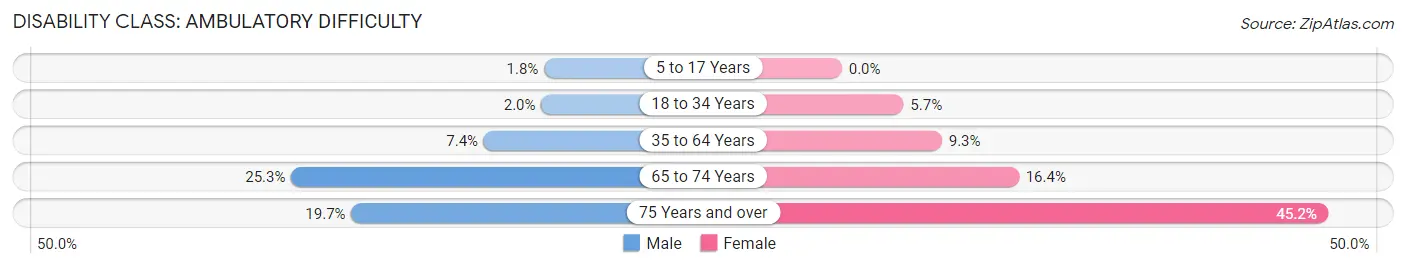
| Age Bracket | Male | Female |
| 5 to 17 Years | 34 (1.8%) | 0 (0.0%) |
| 18 to 34 Years | 64 (2.0%) | 176 (5.7%) |
| 35 to 64 Years | 329 (7.4%) | 391 (9.3%) |
| 65 to 74 Years | 180 (25.3%) | 180 (16.4%) |
| 75 Years and over | 108 (19.7%) | 431 (45.2%) |
Disability Class: Self-Care Difficulty
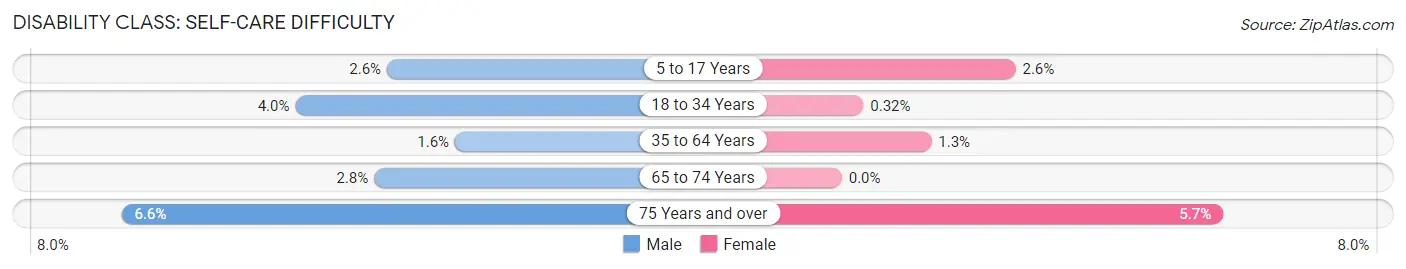
| Age Bracket | Male | Female |
| 5 to 17 Years | 50 (2.6%) | 40 (2.6%) |
| 18 to 34 Years | 125 (4.0%) | 10 (0.3%) |
| 35 to 64 Years | 72 (1.6%) | 56 (1.3%) |
| 65 to 74 Years | 20 (2.8%) | 0 (0.0%) |
| 75 Years and over | 36 (6.6%) | 54 (5.7%) |
Technology Access in Watertown
Computing Device Access in Watertown
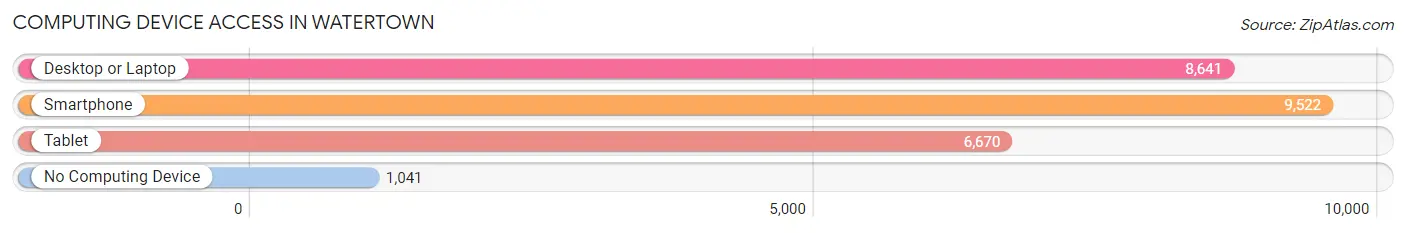
| Device Type | # Households | % Households |
| Desktop or Laptop | 8,641 | 75.4% |
| Smartphone | 9,522 | 83.1% |
| Tablet | 6,670 | 58.2% |
| No Computing Device | 1,041 | 9.1% |
| Total | 11,455 | 100.0% |
Internet Access in Watertown
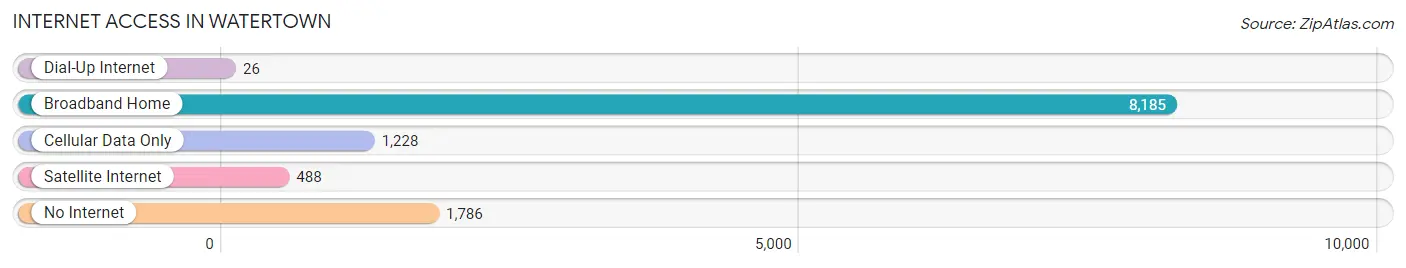
| Internet Type | # Households | % Households |
| Dial-Up Internet | 26 | 0.2% |
| Broadband Home | 8,185 | 71.5% |
| Cellular Data Only | 1,228 | 10.7% |
| Satellite Internet | 488 | 4.3% |
| No Internet | 1,786 | 15.6% |
| Total | 11,455 | 100.0% |
Watertown Summary
History
The city of Watertown, New York is located in Jefferson County in the northern part of the state. It is situated on the Black River, which is a tributary of Lake Ontario. The city was founded in 1800 by pioneers from New England and was originally known as Le Ray. It was later renamed Watertown in 1816 in honor of the many waterfalls in the area.
The city was an important center of industry in the 19th century, with several mills and factories located along the Black River. It was also a major transportation hub, with the Black River Canal connecting it to the Erie Canal and the Oswego Canal connecting it to Lake Ontario.
Watertown was an important center of the abolitionist movement in the mid-19th century. It was home to several prominent abolitionists, including Gerrit Smith, who was a major financial supporter of the Underground Railroad.
Watertown was also the site of several important Civil War battles, including the Battle of Watertown in 1863. The city was also the site of the first military draft in the United States in 1863.
Geography
Watertown is located in the northern part of New York State, in Jefferson County. It is situated on the Black River, which is a tributary of Lake Ontario. The city is located at the intersection of Interstate 81 and US Route 11.
The city has a total area of 16.2 square miles, of which 15.9 square miles is land and 0.3 square miles is water. The city is located in the foothills of the Adirondack Mountains and is surrounded by several lakes, including Black River Lake, Lake Ontario, and Lake Ozonia.
The climate in Watertown is classified as humid continental, with cold winters and warm summers. The average annual temperature is around 45°F, with an average high of around 70°F in the summer and an average low of around 20°F in the winter.
Economy
Watertown’s economy is largely based on manufacturing and services. The city is home to several large manufacturing companies, including Kraft Foods, Nestle, and General Motors. The city is also home to several large healthcare providers, including Samaritan Medical Center and Watertown Regional Medical Center.
The city is also home to several educational institutions, including Jefferson Community College and SUNY Canton. The city is also home to several large retail stores, including Walmart, Target, and Best Buy.
Demographics
As of the 2010 census, the population of Watertown was 27,023. The racial makeup of the city was 90.2% White, 4.3% African American, 0.7% Native American, 1.3% Asian, 0.1% Pacific Islander, 1.3% from other races, and 2.3% from two or more races. Hispanic or Latino of any race were 4.2% of the population.
The median household income in Watertown was $41,945, and the median family income was $50,945. The per capita income was $20,945. About 14.2% of the population was below the poverty line.
Watertown is served by the Watertown City School District, which includes seven elementary schools, two middle schools, and one high school. The city is also home to several private schools, including Immaculate Heart Central School and Seton Catholic Central High School.
Common Questions
What is the Total Population of Watertown?
Total Population of Watertown is 24,859.
What is the Total Male Population of Watertown?
Total Male Population of Watertown is 12,877.
What is the Total Female Population of Watertown?
Total Female Population of Watertown is 11,982.
What is the Ratio of Males per 100 Females in Watertown?
There are 107.47 Males per 100 Females in Watertown.
What is the Ratio of Females per 100 Males in Watertown?
There are 93.05 Females per 100 Males in Watertown.
What is the Median Population Age in Watertown?
Median Population Age in Watertown is 35.1 Years.
What is the Average Family Size in Watertown
Average Family Size in Watertown is 2.9 People.
What is the Average Household Size in Watertown
Average Household Size in Watertown is 2.1 People.
What is Per Capita Income in Watertown?
Per Capita income in Watertown is $32,679.
What is the Median Family Income in Watertown?
Median Family Income in Watertown is $66,848.
What is the Median Household income in Watertown?
Median Household Income in Watertown is $49,722.
What is Income or Wage Gap in Watertown?
Income or Wage Gap in Watertown is 21.5%.
Women in Watertown earn 78.5 cents for every dollar earned by a man.
What is Family Income Deficit in Watertown?
Family Income Deficit in Watertown is $11,818.
Families that are below poverty line in Watertown earn $11,818 less on average than the poverty threshold level.
What is Inequality or Gini Index in Watertown?
Inequality or Gini Index in Watertown is 0.49.
How Large is the Labor Force in Watertown?
There are 12,335 People in the Labor Forcein in Watertown.
What is the Percentage of People in the Labor Force in Watertown?
61.9% of People are in the Labor Force in Watertown.
What is the Unemployment Rate in Watertown?
Unemployment Rate in Watertown is 6.3%.