Massapequa Park, NY
Massapequa Park Map
Massapequa Park Overview
17,045
TOTAL POPULATION
8,506
MALE POPULATION
8,539
FEMALE POPULATION
99.61
MALES / 100 FEMALES
100.39
FEMALES / 100 MALES
43.7
MEDIAN AGE
3.2
AVG FAMILY SIZE
2.9
AVG HOUSEHOLD SIZE
$61,507
PER CAPITA INCOME
$173,773
AVG FAMILY INCOME
$161,193
AVG HOUSEHOLD INCOME
36.0%
WAGE / INCOME GAP [ % ]
64.0¢/ $1
WAGE / INCOME GAP [ $ ]
0.38
INEQUALITY / GINI INDEX
9,048
LABOR FORCE [ PEOPLE ]
64.4%
PERCENT IN LABOR FORCE
4.9%
UNEMPLOYMENT RATE
Massapequa Park Zip Codes
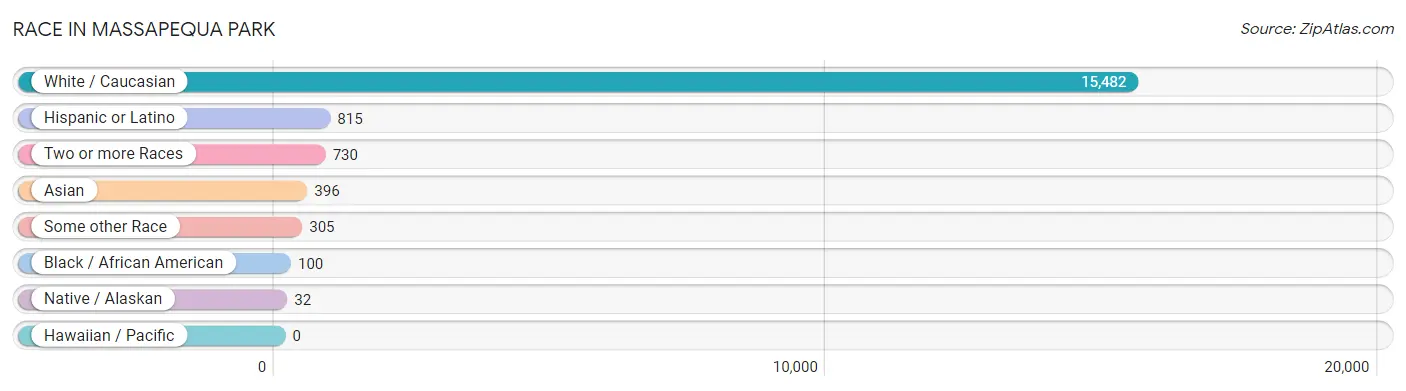
Race in Massapequa Park
The most populous races in Massapequa Park are White / Caucasian (15,482 | 90.8%), Hispanic or Latino (815 | 4.8%), and Two or more Races (730 | 4.3%).
| Race | # Population | % Population |
| Asian | 396 | 2.3% |
| Black / African American | 100 | 0.6% |
| Hawaiian / Pacific | 0 | 0.0% |
| Hispanic or Latino | 815 | 4.8% |
| Native / Alaskan | 32 | 0.2% |
| White / Caucasian | 15,482 | 90.8% |
| Two or more Races | 730 | 4.3% |
| Some other Race | 305 | 1.8% |
| Total | 17,045 | 100.0% |
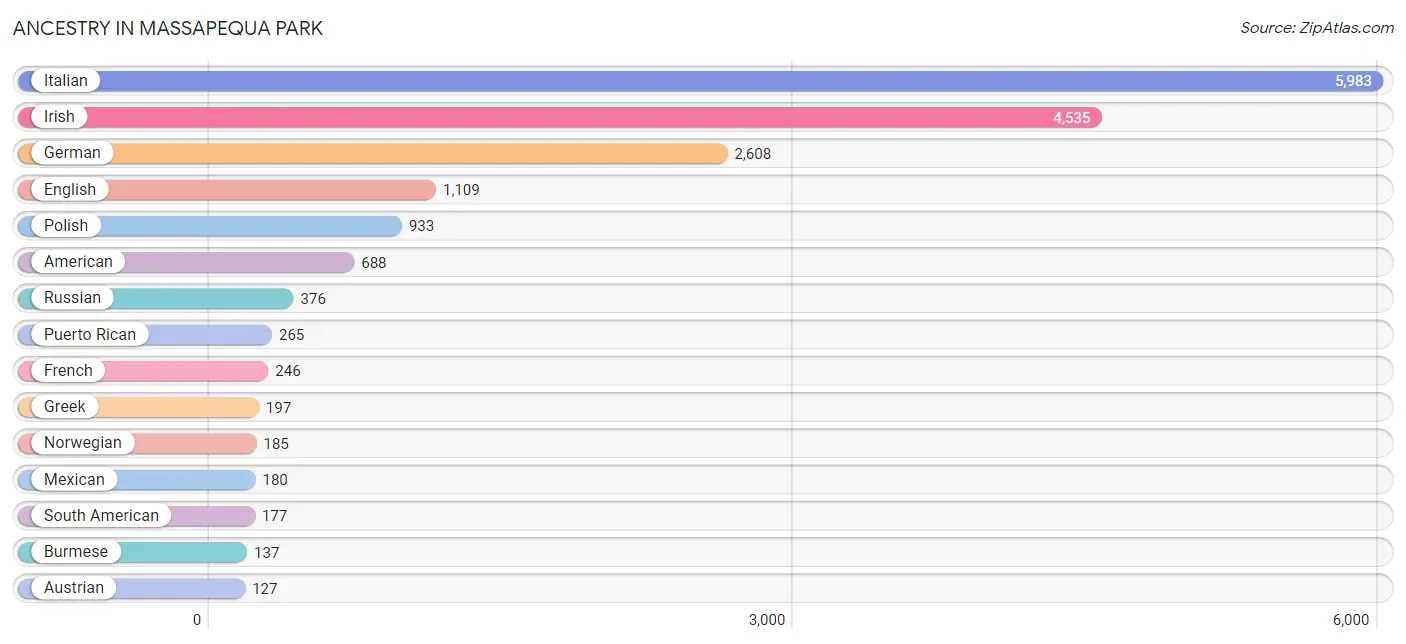
Ancestry in Massapequa Park
The most populous ancestries reported in Massapequa Park are Italian (5,983 | 35.1%), Irish (4,535 | 26.6%), German (2,608 | 15.3%), English (1,109 | 6.5%), and Polish (933 | 5.5%), together accounting for 89.0% of all Massapequa Park residents.
| Ancestry | # Population | % Population |
| Afghan | 118 | 0.7% |
| African | 17 | 0.1% |
| American | 688 | 4.0% |
| Arab | 55 | 0.3% |
| Argentinean | 11 | 0.1% |
| Armenian | 8 | 0.1% |
| Australian | 29 | 0.2% |
| Austrian | 127 | 0.7% |
| Belgian | 39 | 0.2% |
| Bhutanese | 10 | 0.1% |
| British | 7 | 0.0% |
| Bulgarian | 8 | 0.1% |
| Burmese | 137 | 0.8% |
| Canadian | 36 | 0.2% |
| Central American | 43 | 0.3% |
| Cherokee | 17 | 0.1% |
| Colombian | 123 | 0.7% |
| Costa Rican | 5 | 0.0% |
| Croatian | 28 | 0.2% |
| Cuban | 17 | 0.1% |
| Czech | 22 | 0.1% |
| Czechoslovakian | 10 | 0.1% |
| Danish | 8 | 0.1% |
| Dominican | 24 | 0.1% |
| Dutch | 22 | 0.1% |
| Eastern European | 124 | 0.7% |
| Ecuadorian | 16 | 0.1% |
| Egyptian | 46 | 0.3% |
| English | 1,109 | 6.5% |
| European | 15 | 0.1% |
| French | 246 | 1.4% |
| French Canadian | 11 | 0.1% |
| German | 2,608 | 15.3% |
| Greek | 197 | 1.2% |
| Guatemalan | 38 | 0.2% |
| Guyanese | 7 | 0.0% |
| Hungarian | 90 | 0.5% |
| Indian (Asian) | 126 | 0.7% |
| Irish | 4,535 | 26.6% |
| Italian | 5,983 | 35.1% |
| Jamaican | 12 | 0.1% |
| Korean | 93 | 0.5% |
| Lebanese | 9 | 0.1% |
| Lithuanian | 78 | 0.5% |
| Maltese | 12 | 0.1% |
| Mexican | 180 | 1.1% |
| New Zealander | 9 | 0.1% |
| Northern European | 24 | 0.1% |
| Norwegian | 185 | 1.1% |
| Peruvian | 27 | 0.2% |
| Polish | 933 | 5.5% |
| Portuguese | 51 | 0.3% |
| Puerto Rican | 265 | 1.5% |
| Romanian | 12 | 0.1% |
| Russian | 376 | 2.2% |
| Scandinavian | 43 | 0.3% |
| Scotch-Irish | 32 | 0.2% |
| Scottish | 35 | 0.2% |
| Slovak | 43 | 0.3% |
| South American | 177 | 1.0% |
| Spaniard | 58 | 0.3% |
| Spanish | 42 | 0.3% |
| Subsaharan African | 17 | 0.1% |
| Swedish | 85 | 0.5% |
| Swiss | 25 | 0.2% |
| Thai | 71 | 0.4% |
| Turkish | 28 | 0.2% |
| Ukrainian | 26 | 0.2% | View All 68 Rows |
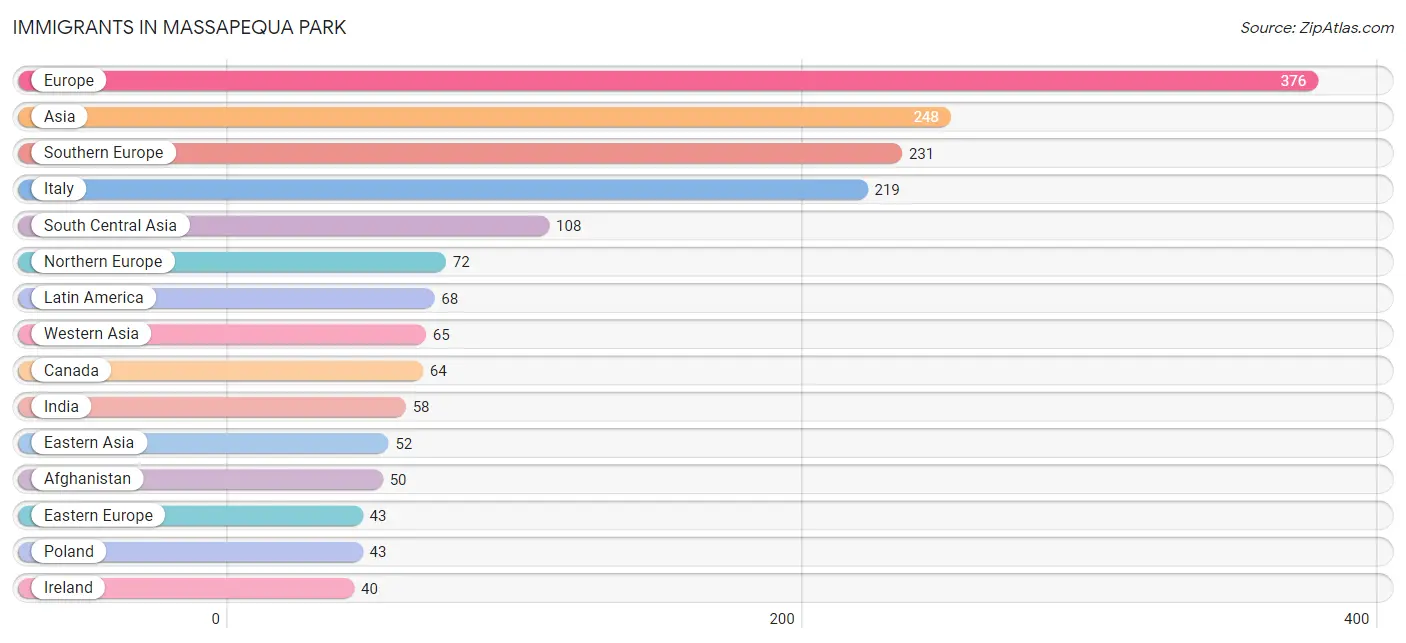
Immigrants in Massapequa Park
The most numerous immigrant groups reported in Massapequa Park came from Europe (376 | 2.2%), Asia (248 | 1.5%), Southern Europe (231 | 1.4%), Italy (219 | 1.3%), and South Central Asia (108 | 0.6%), together accounting for 6.9% of all Massapequa Park residents.
| Immigration Origin | # Population | % Population |
| Afghanistan | 50 | 0.3% |
| Africa | 13 | 0.1% |
| Argentina | 11 | 0.1% |
| Asia | 248 | 1.5% |
| Australia | 14 | 0.1% |
| Belgium | 30 | 0.2% |
| Canada | 64 | 0.4% |
| Central America | 39 | 0.2% |
| China | 31 | 0.2% |
| Eastern Asia | 52 | 0.3% |
| Eastern Europe | 43 | 0.3% |
| England | 20 | 0.1% |
| Europe | 376 | 2.2% |
| Guatemala | 21 | 0.1% |
| Hong Kong | 15 | 0.1% |
| India | 58 | 0.3% |
| Ireland | 40 | 0.2% |
| Israel | 29 | 0.2% |
| Italy | 219 | 1.3% |
| Japan | 10 | 0.1% |
| Korea | 11 | 0.1% |
| Latin America | 68 | 0.4% |
| Mexico | 18 | 0.1% |
| Nigeria | 13 | 0.1% |
| Northern Europe | 72 | 0.4% |
| Oceania | 14 | 0.1% |
| Peru | 18 | 0.1% |
| Philippines | 23 | 0.1% |
| Poland | 43 | 0.3% |
| South America | 29 | 0.2% |
| South Central Asia | 108 | 0.6% |
| South Eastern Asia | 23 | 0.1% |
| Southern Europe | 231 | 1.4% |
| Western Africa | 13 | 0.1% |
| Western Asia | 65 | 0.4% |
| Western Europe | 30 | 0.2% | View All 36 Rows |
Sex and Age in Massapequa Park
Sex and Age in Massapequa Park
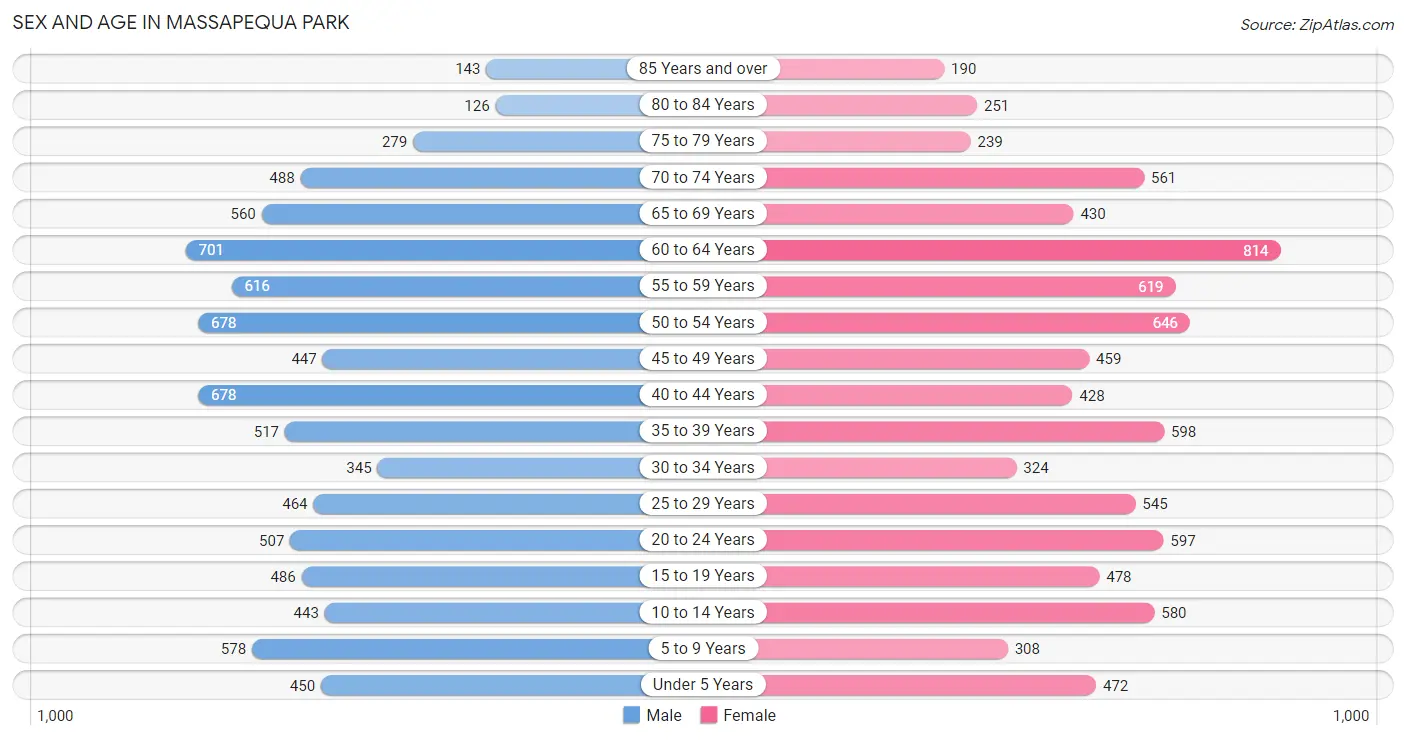
The most populous age groups in Massapequa Park are 60 to 64 Years (701 | 8.2%) for men and 60 to 64 Years (814 | 9.5%) for women.
| Age Bracket | Male | Female |
| Under 5 Years | 450 (5.3%) | 472 (5.5%) |
| 5 to 9 Years | 578 (6.8%) | 308 (3.6%) |
| 10 to 14 Years | 443 (5.2%) | 580 (6.8%) |
| 15 to 19 Years | 486 (5.7%) | 478 (5.6%) |
| 20 to 24 Years | 507 (6.0%) | 597 (7.0%) |
| 25 to 29 Years | 464 (5.4%) | 545 (6.4%) |
| 30 to 34 Years | 345 (4.1%) | 324 (3.8%) |
| 35 to 39 Years | 517 (6.1%) | 598 (7.0%) |
| 40 to 44 Years | 678 (8.0%) | 428 (5.0%) |
| 45 to 49 Years | 447 (5.3%) | 459 (5.4%) |
| 50 to 54 Years | 678 (8.0%) | 646 (7.6%) |
| 55 to 59 Years | 616 (7.2%) | 619 (7.2%) |
| 60 to 64 Years | 701 (8.2%) | 814 (9.5%) |
| 65 to 69 Years | 560 (6.6%) | 430 (5.0%) |
| 70 to 74 Years | 488 (5.7%) | 561 (6.6%) |
| 75 to 79 Years | 279 (3.3%) | 239 (2.8%) |
| 80 to 84 Years | 126 (1.5%) | 251 (2.9%) |
| 85 Years and over | 143 (1.7%) | 190 (2.2%) |
| Total | 8,506 (100.0%) | 8,539 (100.0%) |
Families and Households in Massapequa Park
Median Family Size in Massapequa Park
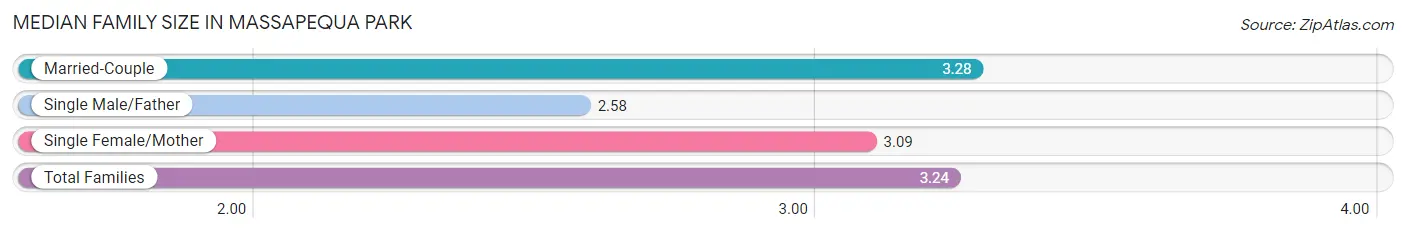
The median family size in Massapequa Park is 3.24 persons per family, with married-couple families (4,205 | 87.0%) accounting for the largest median family size of 3.28 persons per family. On the other hand, single male/father families (205 | 4.2%) represent the smallest median family size with 2.58 persons per family.
| Family Type | # Families | Family Size |
| Married-Couple | 4,205 (87.0%) | 3.28 |
| Single Male/Father | 205 (4.2%) | 2.58 |
| Single Female/Mother | 424 (8.8%) | 3.09 |
| Total Families | 4,834 (100.0%) | 3.24 |
Median Household Size in Massapequa Park
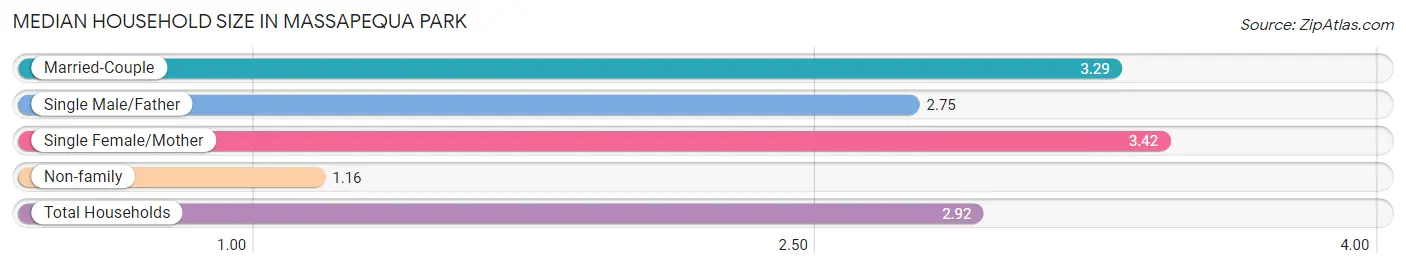
The median household size in Massapequa Park is 2.92 persons per household, with single female/mother households (424 | 7.3%) accounting for the largest median household size of 3.42 persons per household. non-family households (1,003 | 17.2%) represent the smallest median household size with 1.16 persons per household.
| Household Type | # Households | Household Size |
| Married-Couple | 4,205 (72.0%) | 3.29 |
| Single Male/Father | 205 (3.5%) | 2.75 |
| Single Female/Mother | 424 (7.3%) | 3.42 |
| Non-family | 1,003 (17.2%) | 1.16 |
| Total Households | 5,837 (100.0%) | 2.92 |
Household Size by Marriage Status in Massapequa Park
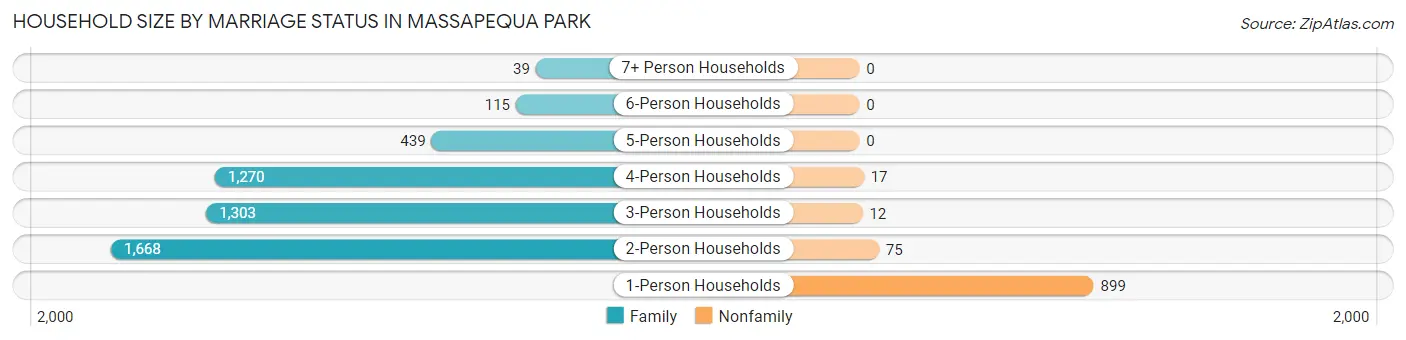
Out of a total of 5,837 households in Massapequa Park, 4,834 (82.8%) are family households, while 1,003 (17.2%) are nonfamily households. The most numerous type of family households are 2-person households, comprising 1,668, and the most common type of nonfamily households are 1-person households, comprising 899.
| Household Size | Family Households | Nonfamily Households |
| 1-Person Households | - | 899 (15.4%) |
| 2-Person Households | 1,668 (28.6%) | 75 (1.3%) |
| 3-Person Households | 1,303 (22.3%) | 12 (0.2%) |
| 4-Person Households | 1,270 (21.8%) | 17 (0.3%) |
| 5-Person Households | 439 (7.5%) | 0 (0.0%) |
| 6-Person Households | 115 (2.0%) | 0 (0.0%) |
| 7+ Person Households | 39 (0.7%) | 0 (0.0%) |
| Total | 4,834 (82.8%) | 1,003 (17.2%) |
Female Fertility in Massapequa Park
Fertility by Age in Massapequa Park
Average fertility rate in Massapequa Park is 90.0 births per 1,000 women. Women in the age bracket of 35 to 50 years have the highest fertility rate with 111.0 births per 1,000 women. Women in the age bracket of 35 to 50 years acount for 56.2% of all women with births.
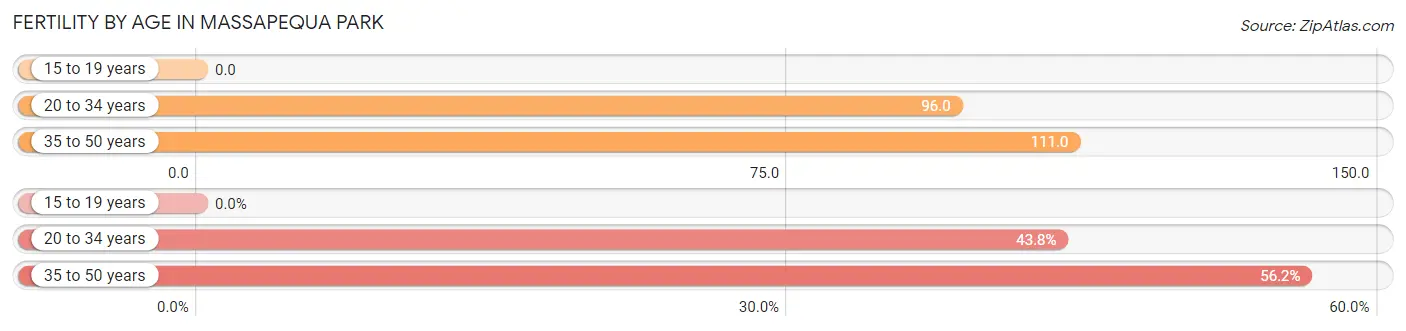
| Age Bracket | Women with Births | Births / 1,000 Women |
| 15 to 19 years | 0 (0.0%) | 0.0 |
| 20 to 34 years | 141 (43.8%) | 96.0 |
| 35 to 50 years | 181 (56.2%) | 111.0 |
| Total | 322 (100.0%) | 90.0 |
Fertility by Age by Marriage Status in Massapequa Park
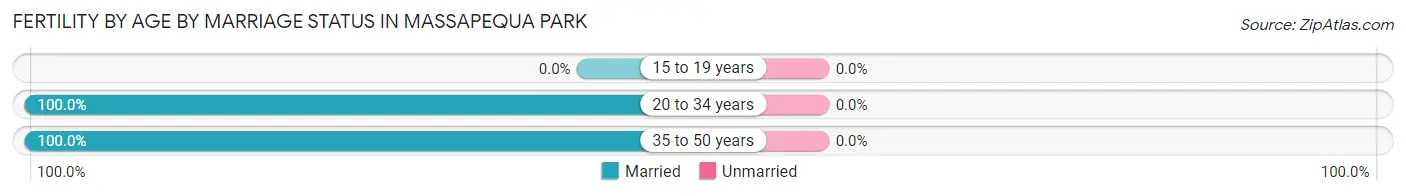
| Age Bracket | Married | Unmarried |
| 15 to 19 years | 0 (0.0%) | 0 (0.0%) |
| 20 to 34 years | 141 (100.0%) | 0 (0.0%) |
| 35 to 50 years | 181 (100.0%) | 0 (0.0%) |
| Total | 322 (100.0%) | 0 (0.0%) |
Fertility by Education in Massapequa Park
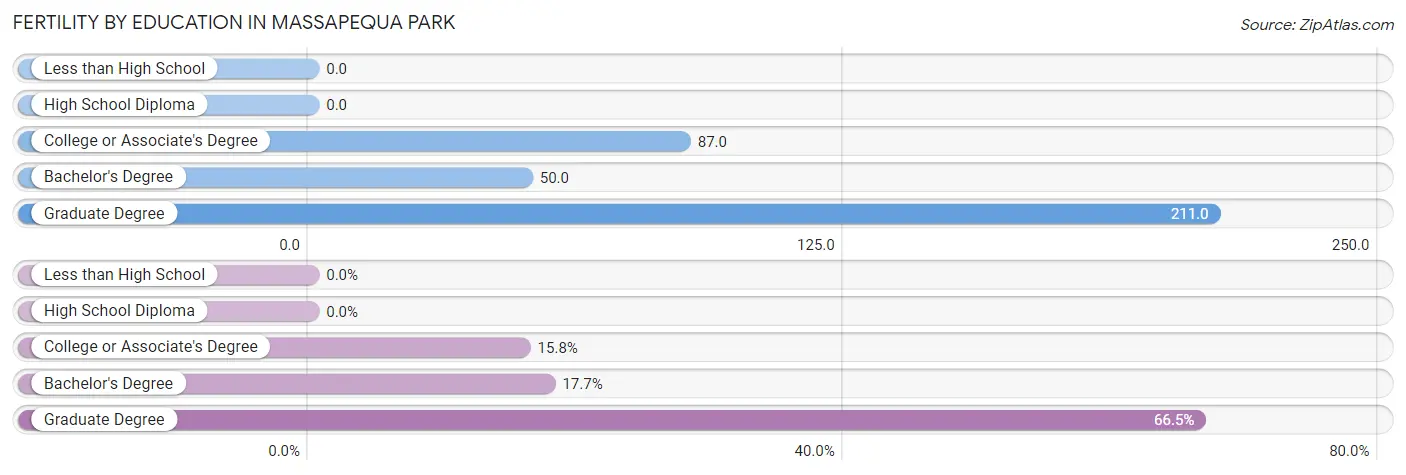
| Educational Attainment | Women with Births | Births / 1,000 Women |
| Less than High School | 0 (0.0%) | 0.0 |
| High School Diploma | 0 (0.0%) | 0.0 |
| College or Associate's Degree | 51 (15.8%) | 87.0 |
| Bachelor's Degree | 57 (17.7%) | 50.0 |
| Graduate Degree | 214 (66.5%) | 211.0 |
| Total | 322 (100.0%) | 90.0 |
Fertility by Education by Marriage Status in Massapequa Park
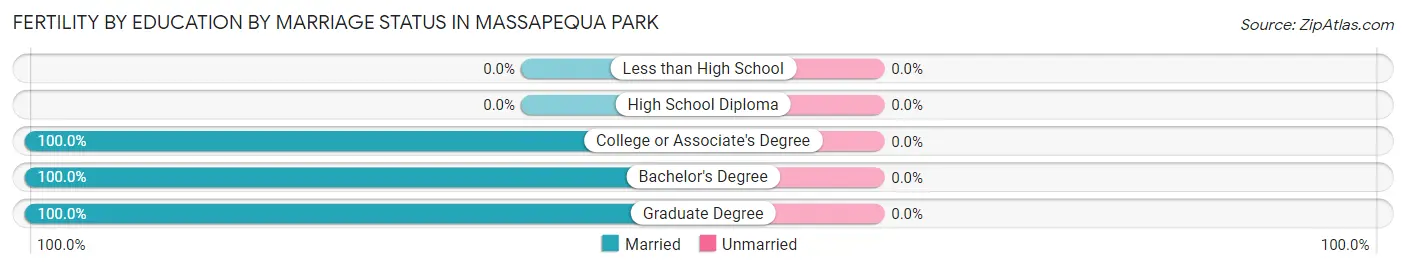
| Educational Attainment | Married | Unmarried |
| Less than High School | 0 (0.0%) | 0 (0.0%) |
| High School Diploma | 0 (0.0%) | 0 (0.0%) |
| College or Associate's Degree | 51 (100.0%) | 0 (0.0%) |
| Bachelor's Degree | 57 (100.0%) | 0 (0.0%) |
| Graduate Degree | 214 (100.0%) | 0 (0.0%) |
| Total | 322 (100.0%) | 0 (0.0%) |
Income in Massapequa Park
Income Overview in Massapequa Park
Per Capita Income in Massapequa Park is $61,507, while median incomes of families and households are $173,773 and $161,193 respectively.
| Characteristic | Number | Measure |
| Per Capita Income | 17,045 | $61,507 |
| Median Family Income | 4,834 | $173,773 |
| Mean Family Income | 4,834 | $195,118 |
| Median Household Income | 5,837 | $161,193 |
| Mean Household Income | 5,837 | $177,886 |
| Income Deficit | 4,834 | $0 |
| Wage / Income Gap (%) | 17,045 | 36.02% |
| Wage / Income Gap ($) | 17,045 | 63.98¢ per $1 |
| Gini / Inequality Index | 17,045 | 0.38 |
Earnings by Sex in Massapequa Park
Average Earnings in Massapequa Park are $70,414, $86,577 for men and $55,392 for women, a difference of 36.0%.
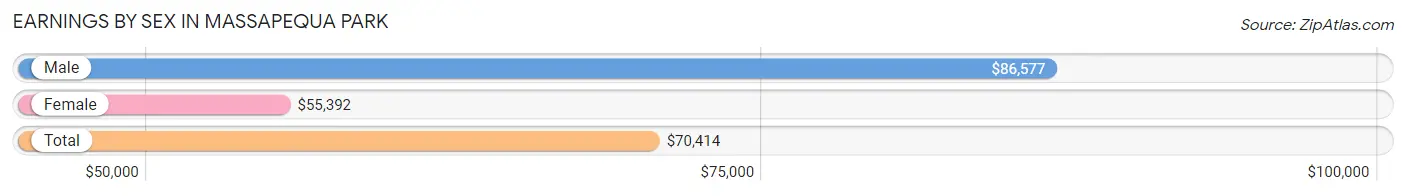
| Sex | Number | Average Earnings |
| Male | 4,847 (51.5%) | $86,577 |
| Female | 4,567 (48.5%) | $55,392 |
| Total | 9,414 (100.0%) | $70,414 |
Earnings by Sex by Income Bracket in Massapequa Park
The most common earnings brackets in Massapequa Park are $100,000+ for men (2,158 | 44.5%) and $100,000+ for women (1,194 | 26.1%).
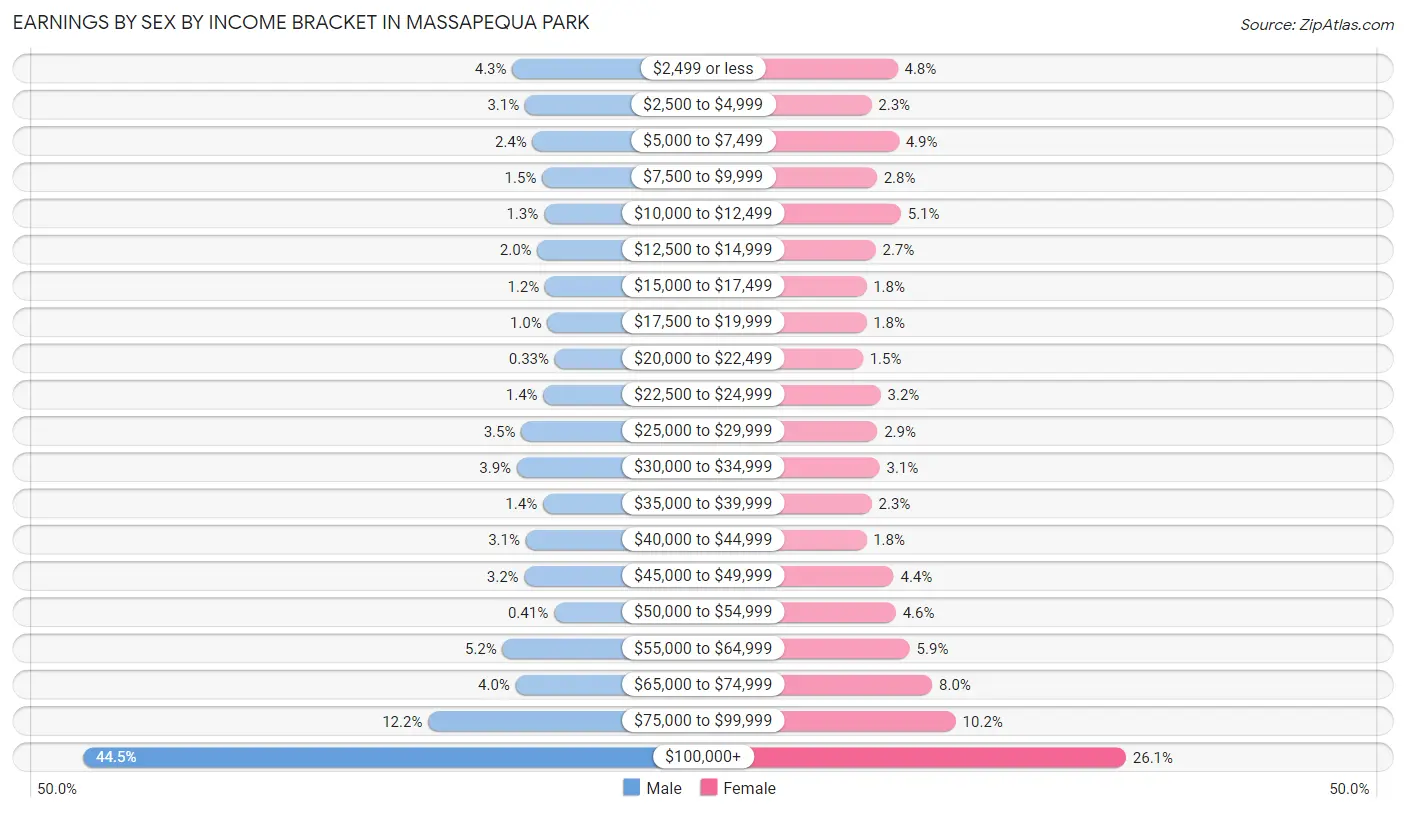
| Income | Male | Female |
| $2,499 or less | 209 (4.3%) | 217 (4.8%) |
| $2,500 to $4,999 | 151 (3.1%) | 105 (2.3%) |
| $5,000 to $7,499 | 117 (2.4%) | 222 (4.9%) |
| $7,500 to $9,999 | 73 (1.5%) | 128 (2.8%) |
| $10,000 to $12,499 | 65 (1.3%) | 231 (5.1%) |
| $12,500 to $14,999 | 95 (2.0%) | 123 (2.7%) |
| $15,000 to $17,499 | 60 (1.2%) | 83 (1.8%) |
| $17,500 to $19,999 | 49 (1.0%) | 83 (1.8%) |
| $20,000 to $22,499 | 16 (0.3%) | 68 (1.5%) |
| $22,500 to $24,999 | 68 (1.4%) | 145 (3.2%) |
| $25,000 to $29,999 | 168 (3.5%) | 130 (2.9%) |
| $30,000 to $34,999 | 188 (3.9%) | 140 (3.1%) |
| $35,000 to $39,999 | 70 (1.4%) | 106 (2.3%) |
| $40,000 to $44,999 | 148 (3.0%) | 83 (1.8%) |
| $45,000 to $49,999 | 154 (3.2%) | 200 (4.4%) |
| $50,000 to $54,999 | 20 (0.4%) | 209 (4.6%) |
| $55,000 to $64,999 | 253 (5.2%) | 269 (5.9%) |
| $65,000 to $74,999 | 194 (4.0%) | 365 (8.0%) |
| $75,000 to $99,999 | 591 (12.2%) | 466 (10.2%) |
| $100,000+ | 2,158 (44.5%) | 1,194 (26.1%) |
| Total | 4,847 (100.0%) | 4,567 (100.0%) |
Earnings by Sex by Educational Attainment in Massapequa Park
Average earnings in Massapequa Park are $101,567 for men and $66,893 for women, a difference of 34.1%. Men with an educational attainment of graduate degree enjoy the highest average annual earnings of $133,182, while those with less than high school education earn the least with $47,841. Women with an educational attainment of graduate degree earn the most with the average annual earnings of $100,636, while those with high school diploma education have the smallest earnings of $39,785.
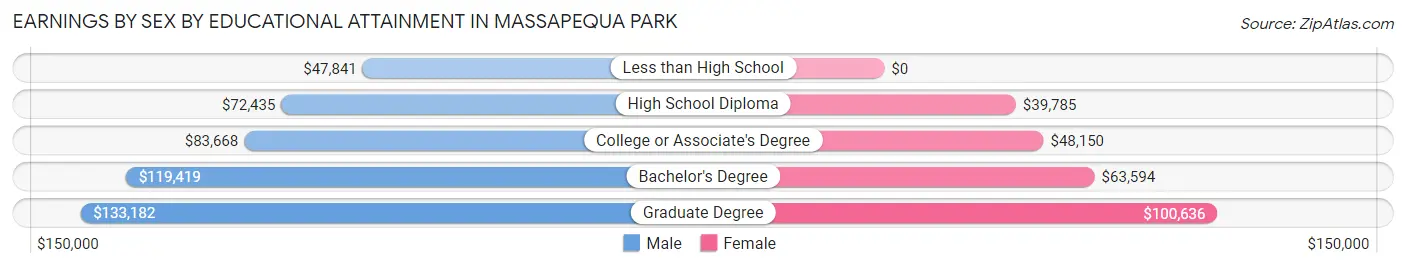
| Educational Attainment | Male Income | Female Income |
| Less than High School | $47,841 | $0 |
| High School Diploma | $72,435 | $39,785 |
| College or Associate's Degree | $83,668 | $48,150 |
| Bachelor's Degree | $119,419 | $63,594 |
| Graduate Degree | $133,182 | $100,636 |
| Total | $101,567 | $66,893 |
Family Income in Massapequa Park
Family Income Brackets in Massapequa Park
According to the Massapequa Park family income data, there are 1,963 families falling into the $200,000+ income range, which is the most common income bracket and makes up 40.6% of all families. Conversely, the $10,000 to $14,999 income bracket is the least frequent group with only 15 families (0.3%) belonging to this category.
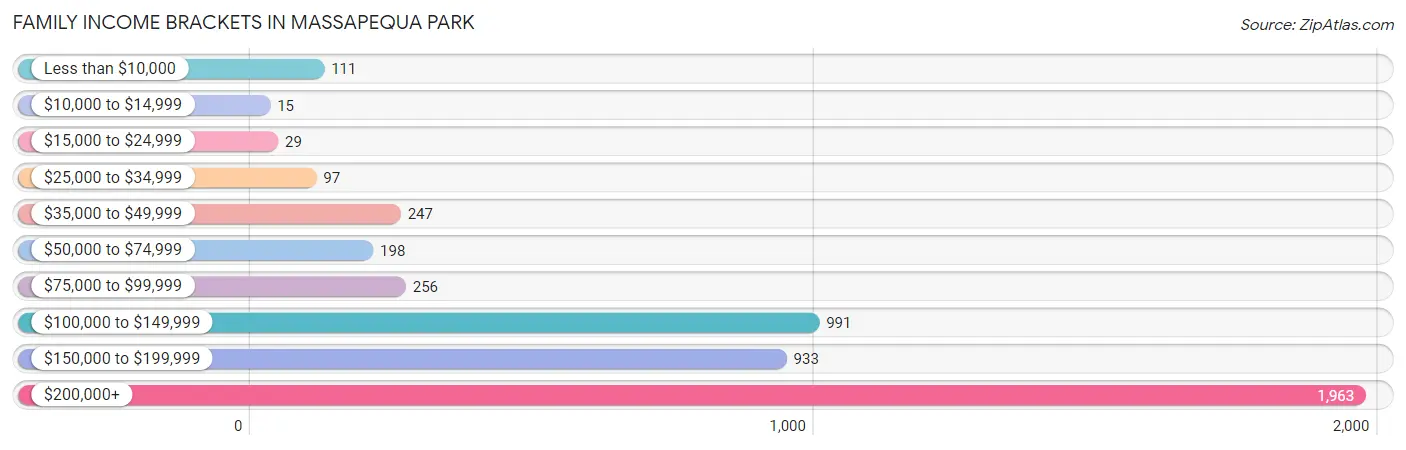
| Income Bracket | # Families | % Families |
| Less than $10,000 | 111 | 2.3% |
| $10,000 to $14,999 | 15 | 0.3% |
| $15,000 to $24,999 | 29 | 0.6% |
| $25,000 to $34,999 | 97 | 2.0% |
| $35,000 to $49,999 | 247 | 5.1% |
| $50,000 to $74,999 | 198 | 4.1% |
| $75,000 to $99,999 | 256 | 5.3% |
| $100,000 to $149,999 | 991 | 20.5% |
| $150,000 to $199,999 | 933 | 19.3% |
| $200,000+ | 1,963 | 40.6% |
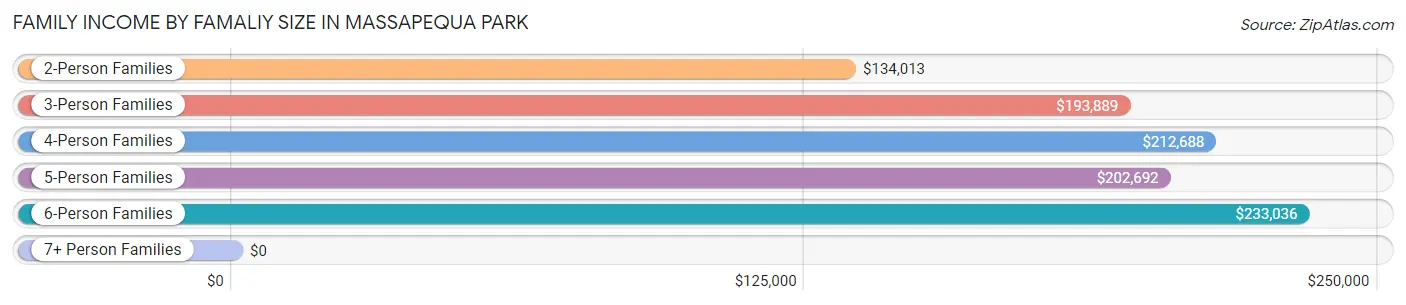
Family Income by Famaliy Size in Massapequa Park
6-person families (98 | 2.0%) account for the highest median family income in Massapequa Park with $233,036 per family, while 2-person families (1,769 | 36.6%) have the highest median income of $67,006 per family member.
| Income Bracket | # Families | Median Income |
| 2-Person Families | 1,769 (36.6%) | $134,013 |
| 3-Person Families | 1,236 (25.6%) | $193,889 |
| 4-Person Families | 1,271 (26.3%) | $212,688 |
| 5-Person Families | 424 (8.8%) | $202,692 |
| 6-Person Families | 98 (2.0%) | $233,036 |
| 7+ Person Families | 36 (0.7%) | $0 |
| Total | 4,834 (100.0%) | $173,773 |
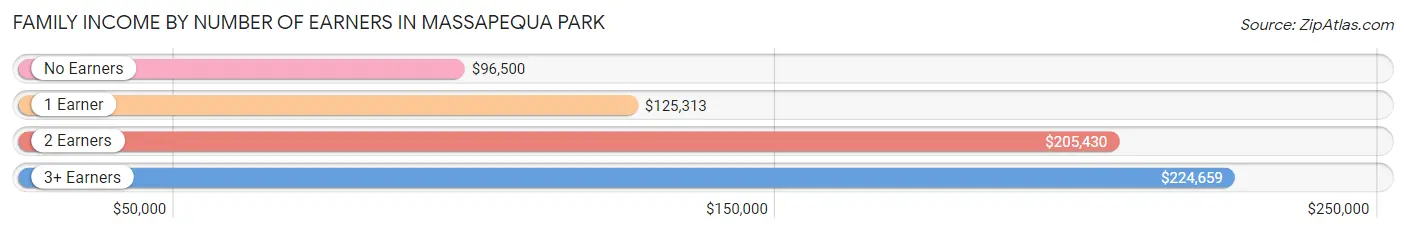
Family Income by Number of Earners in Massapequa Park
The median family income in Massapequa Park is $173,773, with families comprising 3+ earners (875) having the highest median family income of $224,659, while families with no earners (690) have the lowest median family income of $96,500, accounting for 18.1% and 14.3% of families, respectively.
| Number of Earners | # Families | Median Income |
| No Earners | 690 (14.3%) | $96,500 |
| 1 Earner | 972 (20.1%) | $125,313 |
| 2 Earners | 2,297 (47.5%) | $205,430 |
| 3+ Earners | 875 (18.1%) | $224,659 |
| Total | 4,834 (100.0%) | $173,773 |
Household Income in Massapequa Park
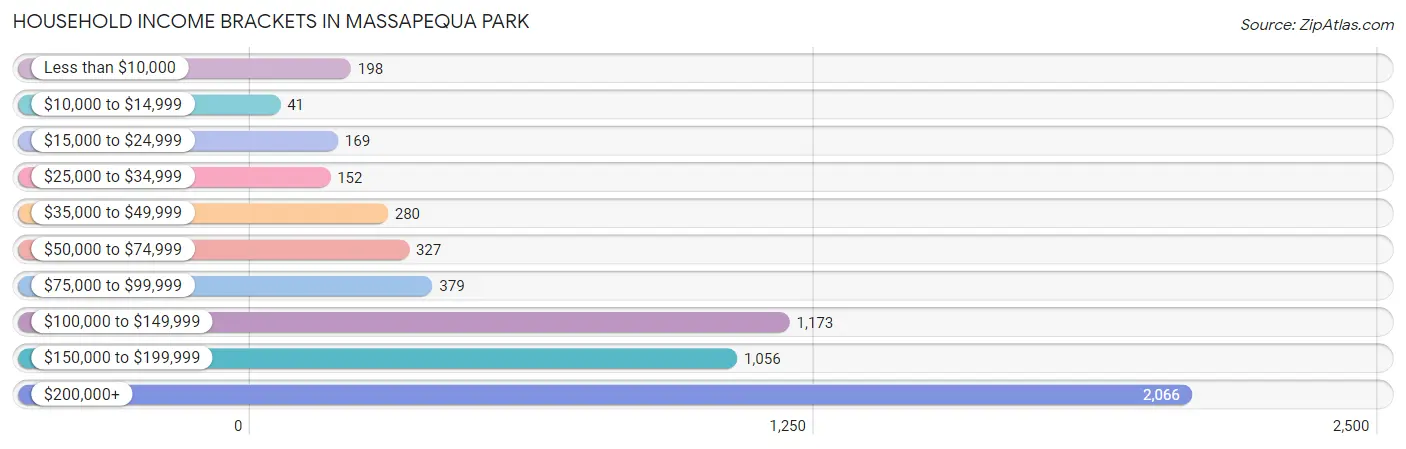
Household Income Brackets in Massapequa Park
With 2,066 households falling in the category, the $200,000+ income range is the most frequent in Massapequa Park, accounting for 35.4% of all households. In contrast, only 41 households (0.7%) fall into the $10,000 to $14,999 income bracket, making it the least populous group.
| Income Bracket | # Households | % Households |
| Less than $10,000 | 198 | 3.4% |
| $10,000 to $14,999 | 41 | 0.7% |
| $15,000 to $24,999 | 169 | 2.9% |
| $25,000 to $34,999 | 152 | 2.6% |
| $35,000 to $49,999 | 280 | 4.8% |
| $50,000 to $74,999 | 327 | 5.6% |
| $75,000 to $99,999 | 379 | 6.5% |
| $100,000 to $149,999 | 1,173 | 20.1% |
| $150,000 to $199,999 | 1,056 | 18.1% |
| $200,000+ | 2,066 | 35.4% |
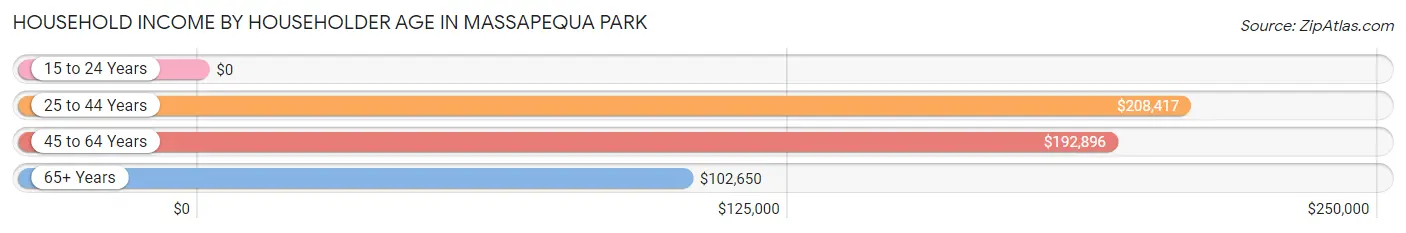
Household Income by Householder Age in Massapequa Park
The median household income in Massapequa Park is $161,193, with the highest median household income of $208,417 found in the 25 to 44 years age bracket for the primary householder. A total of 1,402 households (24.0%) fall into this category.
| Income Bracket | # Households | Median Income |
| 15 to 24 Years | 0 (0.0%) | $0 |
| 25 to 44 Years | 1,402 (24.0%) | $208,417 |
| 45 to 64 Years | 2,449 (42.0%) | $192,896 |
| 65+ Years | 1,986 (34.0%) | $102,650 |
| Total | 5,837 (100.0%) | $161,193 |
Poverty in Massapequa Park
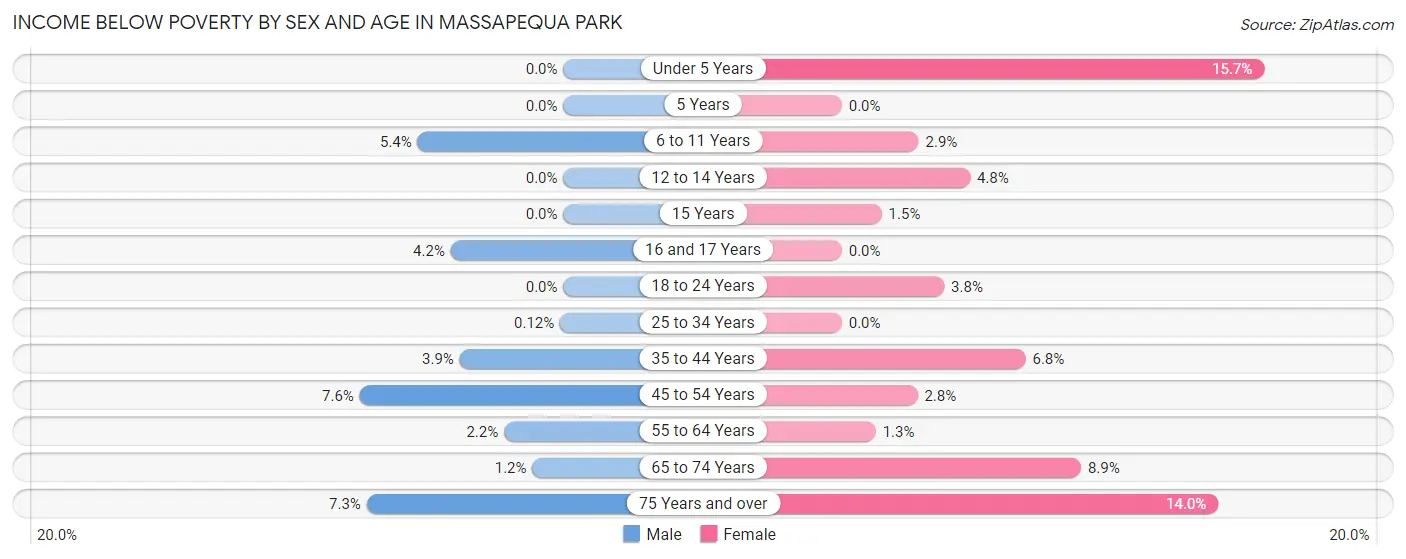
Income Below Poverty by Sex and Age in Massapequa Park
With 3.0% poverty level for males and 5.1% for females among the residents of Massapequa Park, 45 to 54 year old males and under 5 year old females are the most vulnerable to poverty, with 85 males (7.6%) and 74 females (15.7%) in their respective age groups living below the poverty level.
| Age Bracket | Male | Female |
| Under 5 Years | 0 (0.0%) | 74 (15.7%) |
| 5 Years | 0 (0.0%) | 0 (0.0%) |
| 6 to 11 Years | 32 (5.4%) | 14 (2.9%) |
| 12 to 14 Years | 0 (0.0%) | 14 (4.8%) |
| 15 Years | 0 (0.0%) | 2 (1.5%) |
| 16 and 17 Years | 10 (4.2%) | 0 (0.0%) |
| 18 to 24 Years | 0 (0.0%) | 27 (3.8%) |
| 25 to 34 Years | 1 (0.1%) | 0 (0.0%) |
| 35 to 44 Years | 46 (3.8%) | 70 (6.8%) |
| 45 to 54 Years | 85 (7.6%) | 31 (2.8%) |
| 55 to 64 Years | 29 (2.2%) | 18 (1.3%) |
| 65 to 74 Years | 12 (1.1%) | 88 (8.9%) |
| 75 Years and over | 40 (7.3%) | 95 (14.0%) |
| Total | 255 (3.0%) | 433 (5.1%) |
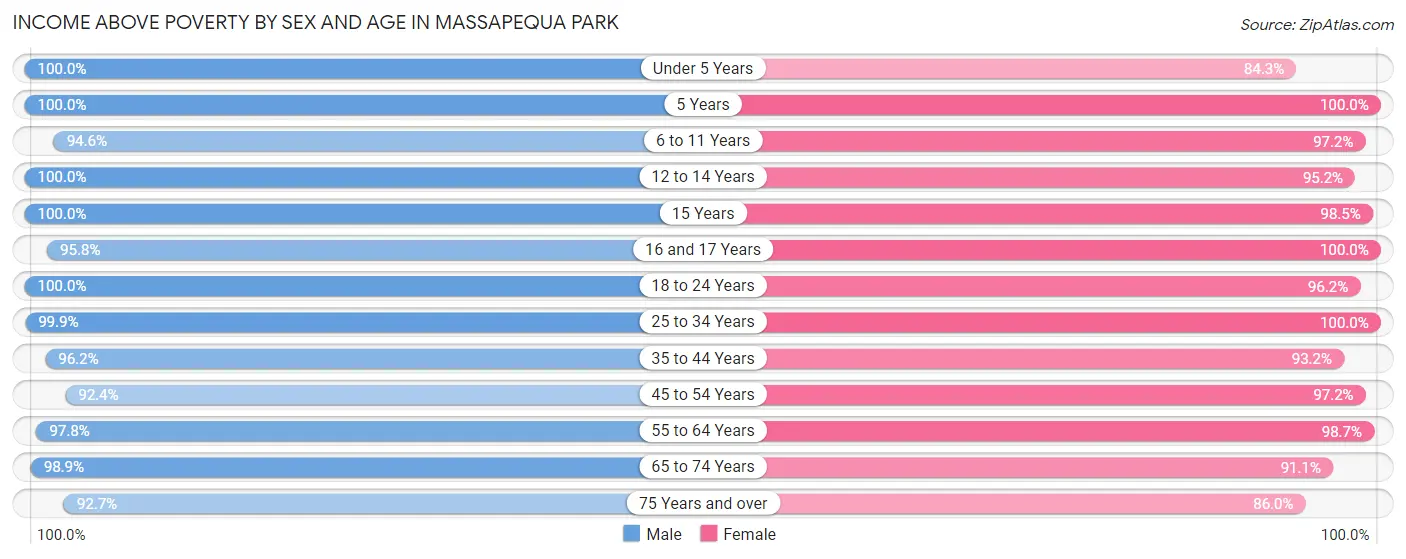
Income Above Poverty by Sex and Age in Massapequa Park
According to the poverty statistics in Massapequa Park, males aged under 5 years and females aged 5 years are the age groups that are most secure financially, with 100.0% of males and 100.0% of females in these age groups living above the poverty line.
| Age Bracket | Male | Female |
| Under 5 Years | 450 (100.0%) | 398 (84.3%) |
| 5 Years | 154 (100.0%) | 91 (100.0%) |
| 6 to 11 Years | 559 (94.6%) | 477 (97.2%) |
| 12 to 14 Years | 276 (100.0%) | 280 (95.2%) |
| 15 Years | 30 (100.0%) | 133 (98.5%) |
| 16 and 17 Years | 229 (95.8%) | 229 (100.0%) |
| 18 to 24 Years | 724 (100.0%) | 684 (96.2%) |
| 25 to 34 Years | 808 (99.9%) | 869 (100.0%) |
| 35 to 44 Years | 1,149 (96.2%) | 956 (93.2%) |
| 45 to 54 Years | 1,040 (92.4%) | 1,074 (97.2%) |
| 55 to 64 Years | 1,288 (97.8%) | 1,415 (98.7%) |
| 65 to 74 Years | 1,036 (98.9%) | 903 (91.1%) |
| 75 Years and over | 508 (92.7%) | 585 (86.0%) |
| Total | 8,251 (97.0%) | 8,094 (94.9%) |
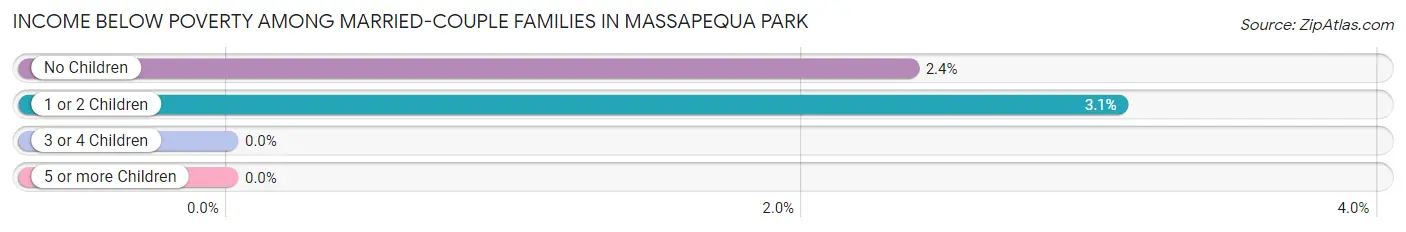
Income Below Poverty Among Married-Couple Families in Massapequa Park
The poverty statistics for married-couple families in Massapequa Park show that 2.5% or 107 of the total 4,205 families live below the poverty line. Families with 1 or 2 children have the highest poverty rate of 3.1%, comprising of 52 families. On the other hand, families with 3 or 4 children have the lowest poverty rate of 0.0%, which includes 0 families.
| Children | Above Poverty | Below Poverty |
| No Children | 2,266 (97.6%) | 55 (2.4%) |
| 1 or 2 Children | 1,626 (96.9%) | 52 (3.1%) |
| 3 or 4 Children | 206 (100.0%) | 0 (0.0%) |
| 5 or more Children | 0 (0.0%) | 0 (0.0%) |
| Total | 4,098 (97.5%) | 107 (2.5%) |
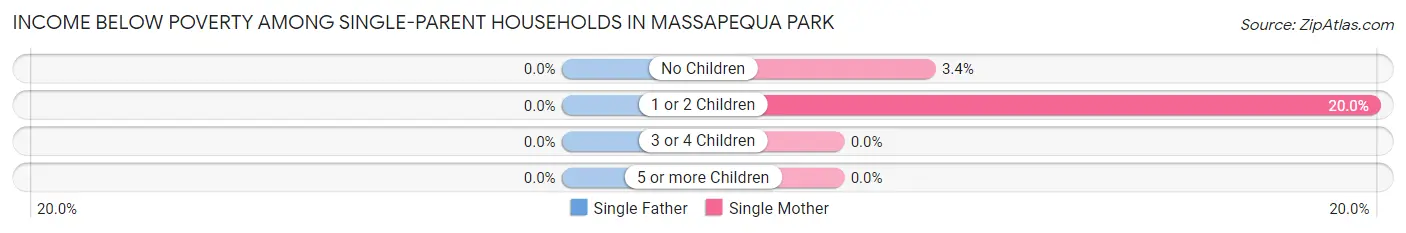
Income Below Poverty Among Single-Parent Households in Massapequa Park
| Children | Single Father | Single Mother |
| No Children | 0 (0.0%) | 12 (3.4%) |
| 1 or 2 Children | 0 (0.0%) | 13 (20.0%) |
| 3 or 4 Children | 0 (0.0%) | 0 (0.0%) |
| 5 or more Children | 0 (0.0%) | 0 (0.0%) |
| Total | 0 (0.0%) | 25 (5.9%) |
Income Below Poverty Among Married-Couple vs Single-Parent Households in Massapequa Park
The poverty data for Massapequa Park shows that 107 of the married-couple family households (2.5%) and 25 of the single-parent households (4.0%) are living below the poverty level. Within the married-couple family households, those with 1 or 2 children have the highest poverty rate, with 52 households (3.1%) falling below the poverty line. Among the single-parent households, those with 1 or 2 children have the highest poverty rate, with 13 household (11.8%) living below poverty.
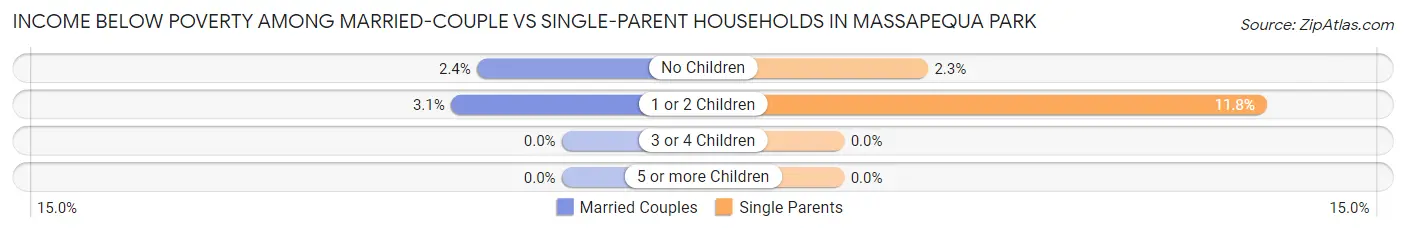
| Children | Married-Couple Families | Single-Parent Households |
| No Children | 55 (2.4%) | 12 (2.3%) |
| 1 or 2 Children | 52 (3.1%) | 13 (11.8%) |
| 3 or 4 Children | 0 (0.0%) | 0 (0.0%) |
| 5 or more Children | 0 (0.0%) | 0 (0.0%) |
| Total | 107 (2.5%) | 25 (4.0%) |
Employment Characteristics in Massapequa Park
Employment by Class of Employer in Massapequa Park
Among the 8,495 employed individuals in Massapequa Park, private company employees (5,093 | 60.0%), local government employees (1,769 | 20.8%), and not-for-profit organizations (438 | 5.2%) make up the most common classes of employment.
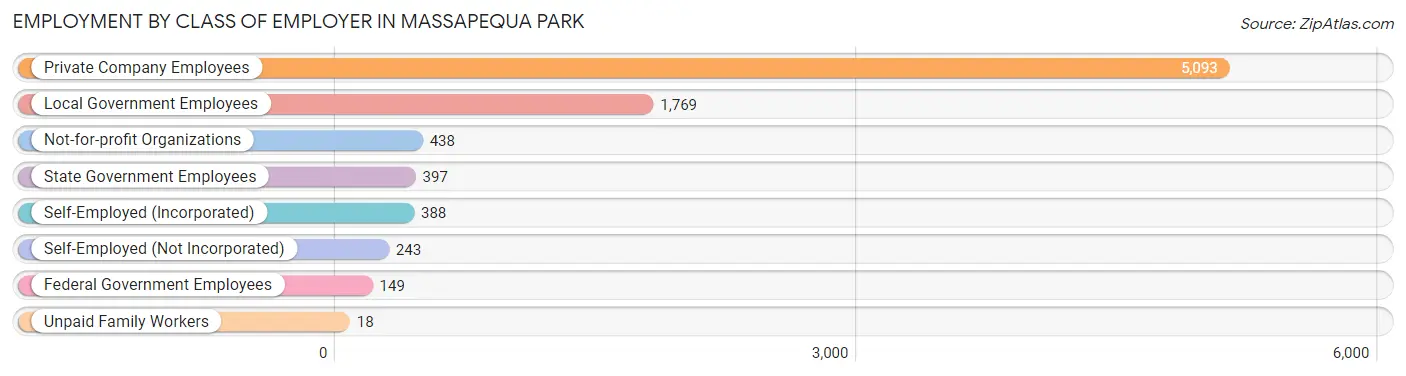
| Employer Class | # Employees | % Employees |
| Private Company Employees | 5,093 | 60.0% |
| Self-Employed (Incorporated) | 388 | 4.6% |
| Self-Employed (Not Incorporated) | 243 | 2.9% |
| Not-for-profit Organizations | 438 | 5.2% |
| Local Government Employees | 1,769 | 20.8% |
| State Government Employees | 397 | 4.7% |
| Federal Government Employees | 149 | 1.8% |
| Unpaid Family Workers | 18 | 0.2% |
| Total | 8,495 | 100.0% |
Employment Status by Age in Massapequa Park
According to the labor force statistics for Massapequa Park, out of the total population over 16 years of age (14,049), 64.4% or 9,048 individuals are in the labor force, with 4.9% or 443 of them unemployed. The age group with the highest labor force participation rate is 30 to 34 years, with 93.3% or 624 individuals in the labor force. Within the labor force, the 65 to 74 years age range has the highest percentage of unemployed individuals, with 12.3% or 53 of them being unemployed.
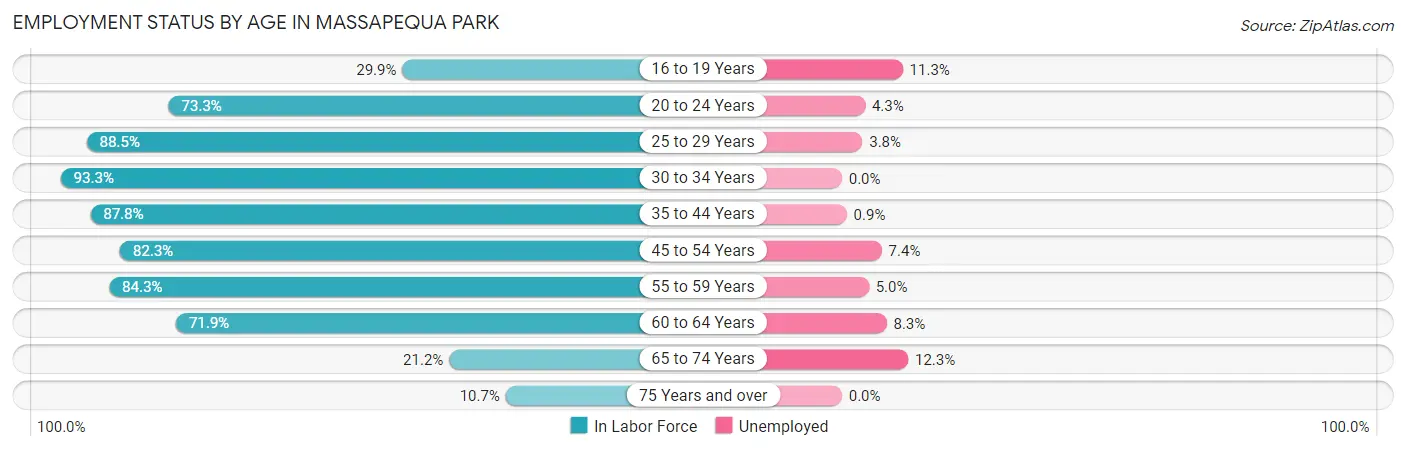
| Age Bracket | In Labor Force | Unemployed |
| 16 to 19 Years | 239 (29.9%) | 27 (11.3%) |
| 20 to 24 Years | 809 (73.3%) | 35 (4.3%) |
| 25 to 29 Years | 893 (88.5%) | 34 (3.8%) |
| 30 to 34 Years | 624 (93.3%) | 0 (0.0%) |
| 35 to 44 Years | 1,950 (87.8%) | 18 (0.9%) |
| 45 to 54 Years | 1,835 (82.3%) | 136 (7.4%) |
| 55 to 59 Years | 1,041 (84.3%) | 52 (5.0%) |
| 60 to 64 Years | 1,089 (71.9%) | 90 (8.3%) |
| 65 to 74 Years | 432 (21.2%) | 53 (12.3%) |
| 75 Years and over | 131 (10.7%) | 0 (0.0%) |
| Total | 9,048 (64.4%) | 443 (4.9%) |
Employment Status by Educational Attainment in Massapequa Park
According to labor force statistics for Massapequa Park, 83.7% of individuals (7,432) out of the total population between 25 and 64 years of age (8,879) are in the labor force, with 4.4% or 327 of them being unemployed. The group with the highest labor force participation rate are those with the educational attainment of bachelor's degree or higher, with 89.4% or 4,461 individuals in the labor force. Within the labor force, individuals with less than high school education have the highest percentage of unemployment, with 13.6% or 11 of them being unemployed.
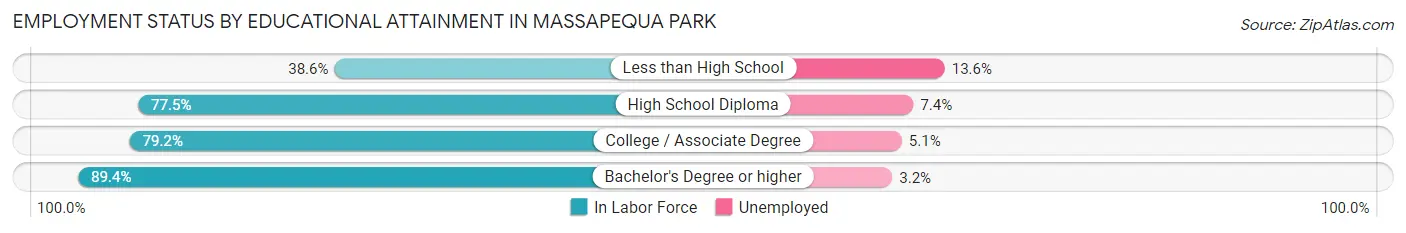
| Educational Attainment | In Labor Force | Unemployed |
| Less than High School | 81 (38.6%) | 29 (13.6%) |
| High School Diploma | 1,169 (77.5%) | 112 (7.4%) |
| College / Associate Degree | 1,719 (79.2%) | 111 (5.1%) |
| Bachelor's Degree or higher | 4,461 (89.4%) | 160 (3.2%) |
| Total | 7,432 (83.7%) | 391 (4.4%) |
Employment Occupations by Sex in Massapequa Park
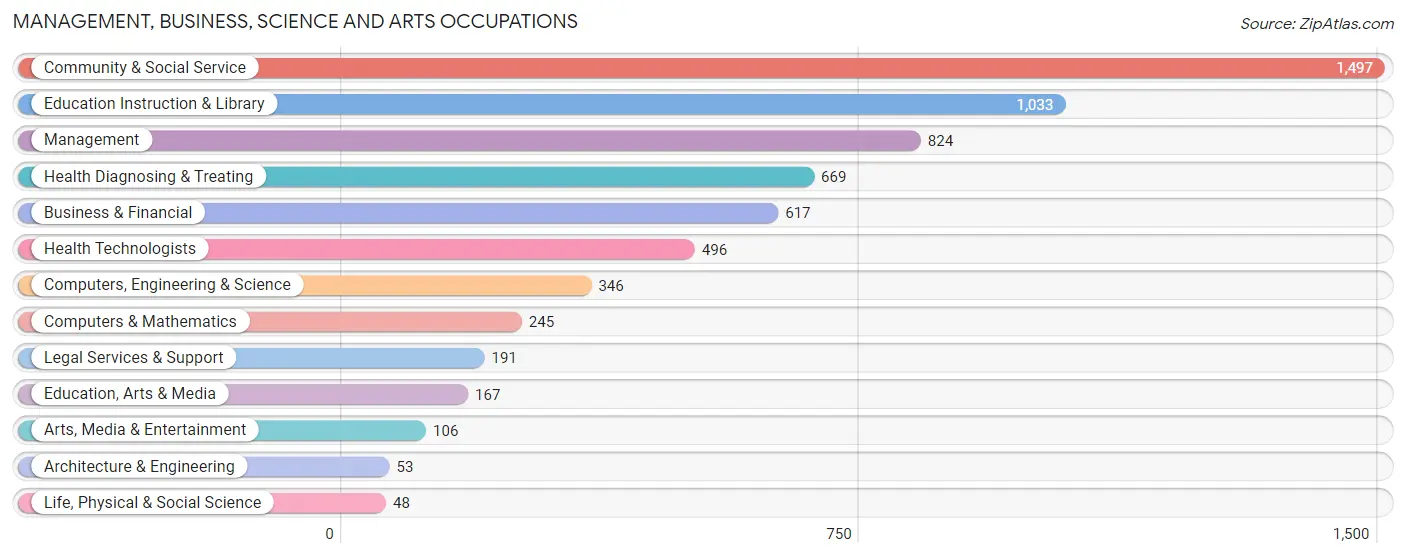
Management, Business, Science and Arts Occupations
The most common Management, Business, Science and Arts occupations in Massapequa Park are Community & Social Service (1,497 | 17.4%), Education Instruction & Library (1,033 | 12.0%), Management (824 | 9.6%), Health Diagnosing & Treating (669 | 7.8%), and Business & Financial (617 | 7.2%).
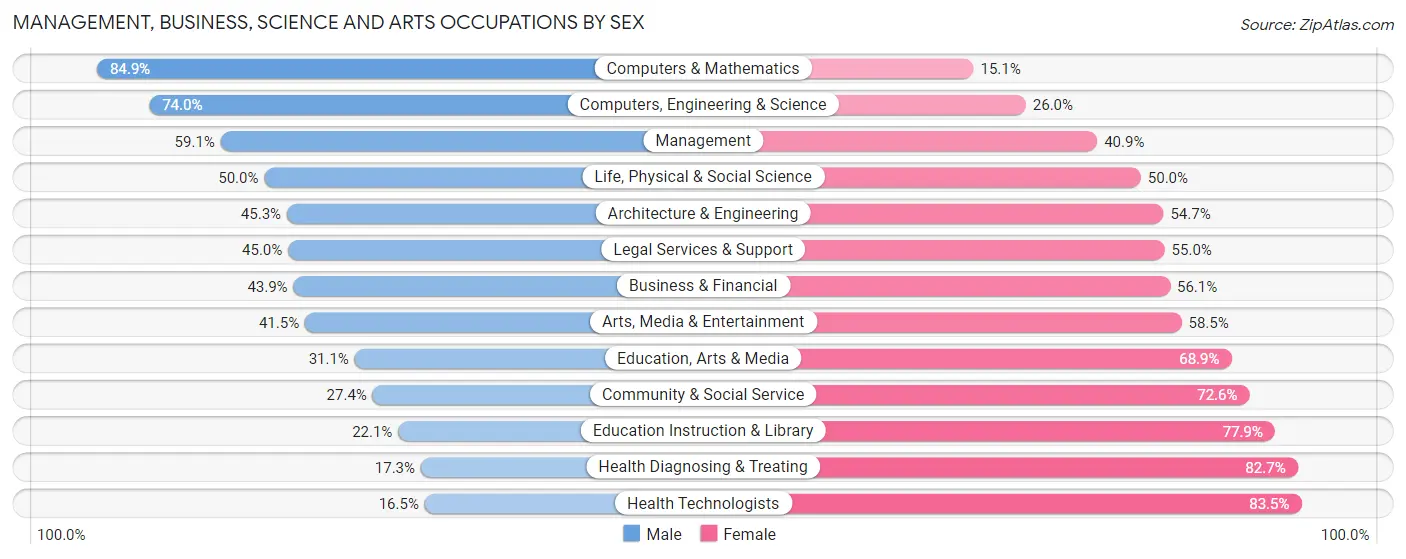
Management, Business, Science and Arts Occupations by Sex
Within the Management, Business, Science and Arts occupations in Massapequa Park, the most male-oriented occupations are Computers & Mathematics (84.9%), Computers, Engineering & Science (74.0%), and Management (59.1%), while the most female-oriented occupations are Health Technologists (83.5%), Health Diagnosing & Treating (82.7%), and Education Instruction & Library (77.9%).
| Occupation | Male | Female |
| Management | 487 (59.1%) | 337 (40.9%) |
| Business & Financial | 271 (43.9%) | 346 (56.1%) |
| Computers, Engineering & Science | 256 (74.0%) | 90 (26.0%) |
| Computers & Mathematics | 208 (84.9%) | 37 (15.1%) |
| Architecture & Engineering | 24 (45.3%) | 29 (54.7%) |
| Life, Physical & Social Science | 24 (50.0%) | 24 (50.0%) |
| Community & Social Service | 410 (27.4%) | 1,087 (72.6%) |
| Education, Arts & Media | 52 (31.1%) | 115 (68.9%) |
| Legal Services & Support | 86 (45.0%) | 105 (55.0%) |
| Education Instruction & Library | 228 (22.1%) | 805 (77.9%) |
| Arts, Media & Entertainment | 44 (41.5%) | 62 (58.5%) |
| Health Diagnosing & Treating | 116 (17.3%) | 553 (82.7%) |
| Health Technologists | 82 (16.5%) | 414 (83.5%) |
| Total (Category) | 1,540 (39.0%) | 2,413 (61.0%) |
| Total (Overall) | 4,386 (51.0%) | 4,213 (49.0%) |
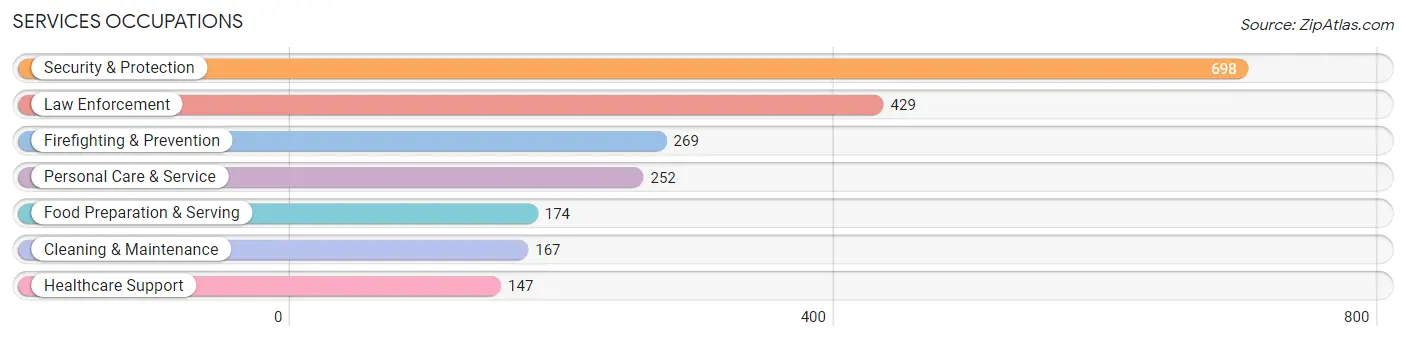
Services Occupations
The most common Services occupations in Massapequa Park are Security & Protection (698 | 8.1%), Law Enforcement (429 | 5.0%), Firefighting & Prevention (269 | 3.1%), Personal Care & Service (252 | 2.9%), and Food Preparation & Serving (174 | 2.0%).
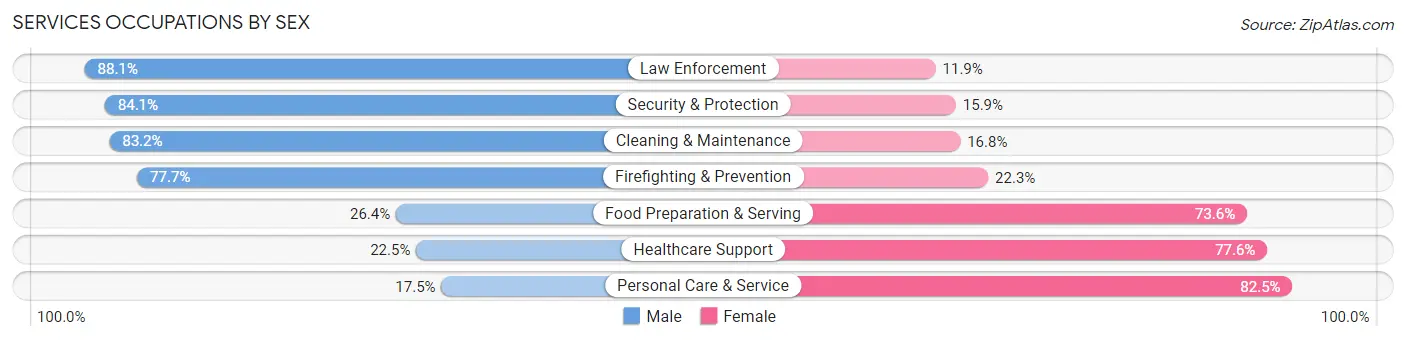
Services Occupations by Sex
Within the Services occupations in Massapequa Park, the most male-oriented occupations are Law Enforcement (88.1%), Security & Protection (84.1%), and Cleaning & Maintenance (83.2%), while the most female-oriented occupations are Personal Care & Service (82.5%), Healthcare Support (77.5%), and Food Preparation & Serving (73.6%).
| Occupation | Male | Female |
| Healthcare Support | 33 (22.5%) | 114 (77.5%) |
| Security & Protection | 587 (84.1%) | 111 (15.9%) |
| Firefighting & Prevention | 209 (77.7%) | 60 (22.3%) |
| Law Enforcement | 378 (88.1%) | 51 (11.9%) |
| Food Preparation & Serving | 46 (26.4%) | 128 (73.6%) |
| Cleaning & Maintenance | 139 (83.2%) | 28 (16.8%) |
| Personal Care & Service | 44 (17.5%) | 208 (82.5%) |
| Total (Category) | 849 (59.0%) | 589 (41.0%) |
| Total (Overall) | 4,386 (51.0%) | 4,213 (49.0%) |
Sales and Office Occupations
The most common Sales and Office occupations in Massapequa Park are Office & Administration (1,259 | 14.6%), and Sales & Related (844 | 9.8%).
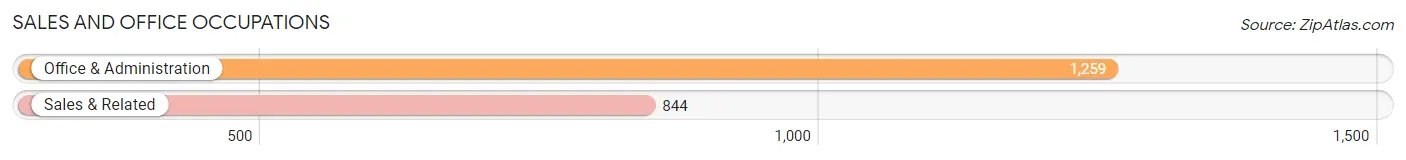
Sales and Office Occupations by Sex
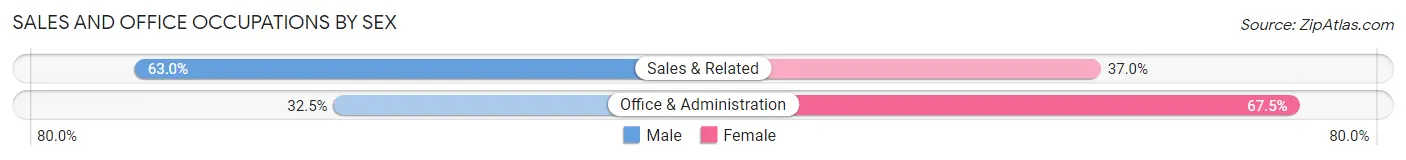
| Occupation | Male | Female |
| Sales & Related | 532 (63.0%) | 312 (37.0%) |
| Office & Administration | 409 (32.5%) | 850 (67.5%) |
| Total (Category) | 941 (44.8%) | 1,162 (55.2%) |
| Total (Overall) | 4,386 (51.0%) | 4,213 (49.0%) |
Natural Resources, Construction and Maintenance Occupations
The most common Natural Resources, Construction and Maintenance occupations in Massapequa Park are Construction & Extraction (307 | 3.6%), and Installation, Maintenance & Repair (217 | 2.5%).
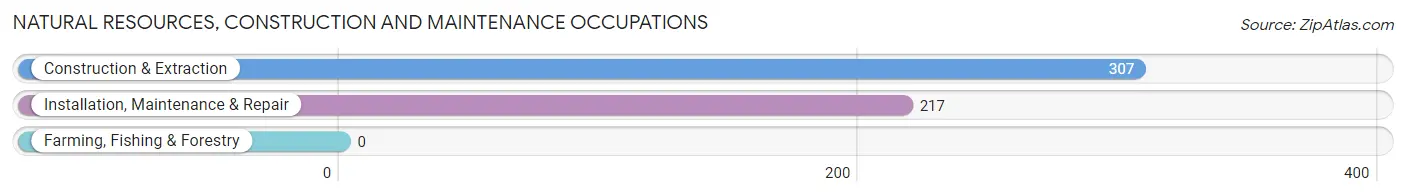
Natural Resources, Construction and Maintenance Occupations by Sex
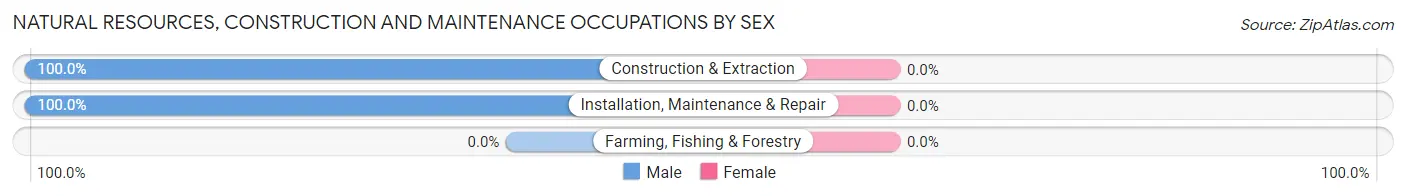
| Occupation | Male | Female |
| Farming, Fishing & Forestry | 0 (0.0%) | 0 (0.0%) |
| Construction & Extraction | 307 (100.0%) | 0 (0.0%) |
| Installation, Maintenance & Repair | 217 (100.0%) | 0 (0.0%) |
| Total (Category) | 524 (100.0%) | 0 (0.0%) |
| Total (Overall) | 4,386 (51.0%) | 4,213 (49.0%) |
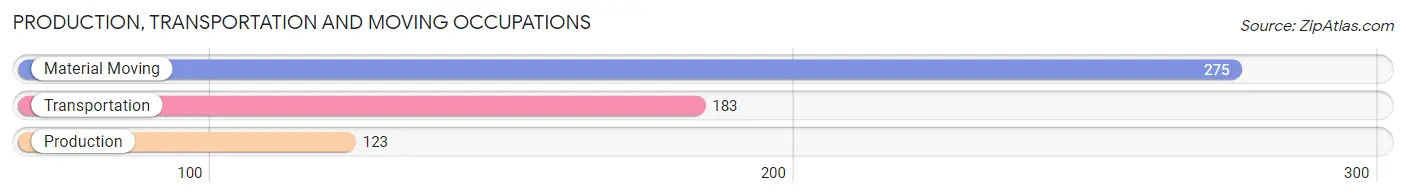
Production, Transportation and Moving Occupations
The most common Production, Transportation and Moving occupations in Massapequa Park are Material Moving (275 | 3.2%), Transportation (183 | 2.1%), and Production (123 | 1.4%).
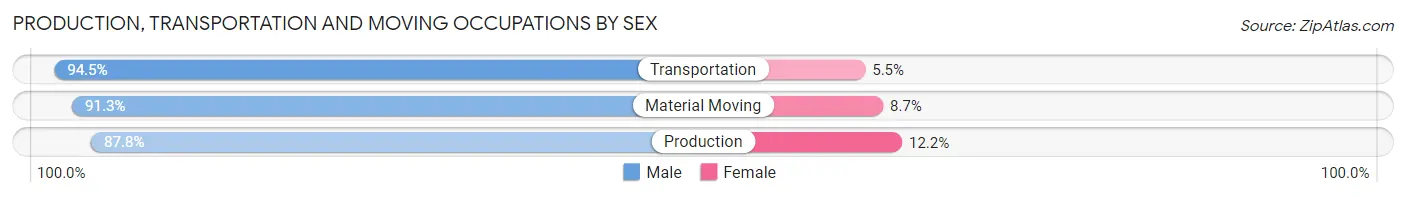
Production, Transportation and Moving Occupations by Sex
| Occupation | Male | Female |
| Production | 108 (87.8%) | 15 (12.2%) |
| Transportation | 173 (94.5%) | 10 (5.5%) |
| Material Moving | 251 (91.3%) | 24 (8.7%) |
| Total (Category) | 532 (91.6%) | 49 (8.4%) |
| Total (Overall) | 4,386 (51.0%) | 4,213 (49.0%) |
Employment Industries by Sex in Massapequa Park
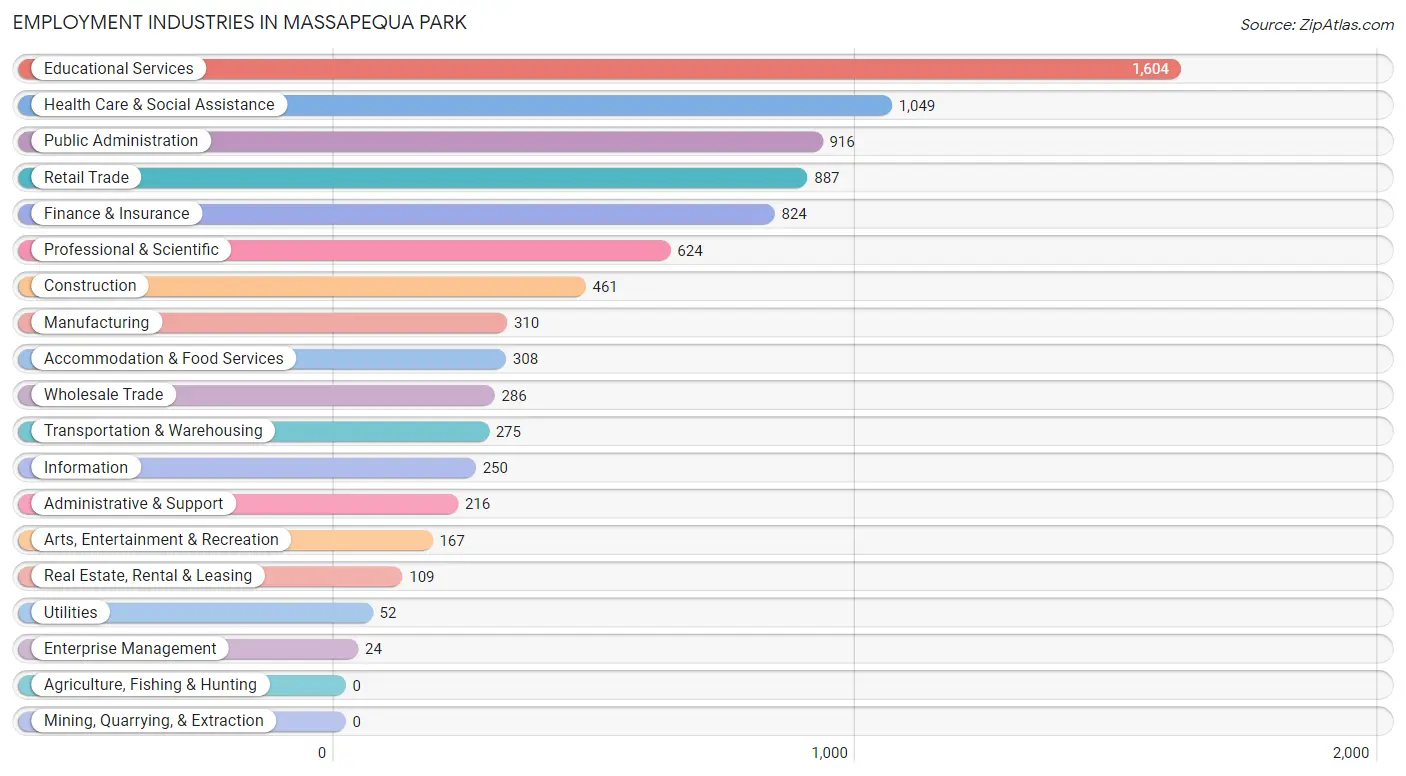
Employment Industries in Massapequa Park
The major employment industries in Massapequa Park include Educational Services (1,604 | 18.6%), Health Care & Social Assistance (1,049 | 12.2%), Public Administration (916 | 10.6%), Retail Trade (887 | 10.3%), and Finance & Insurance (824 | 9.6%).
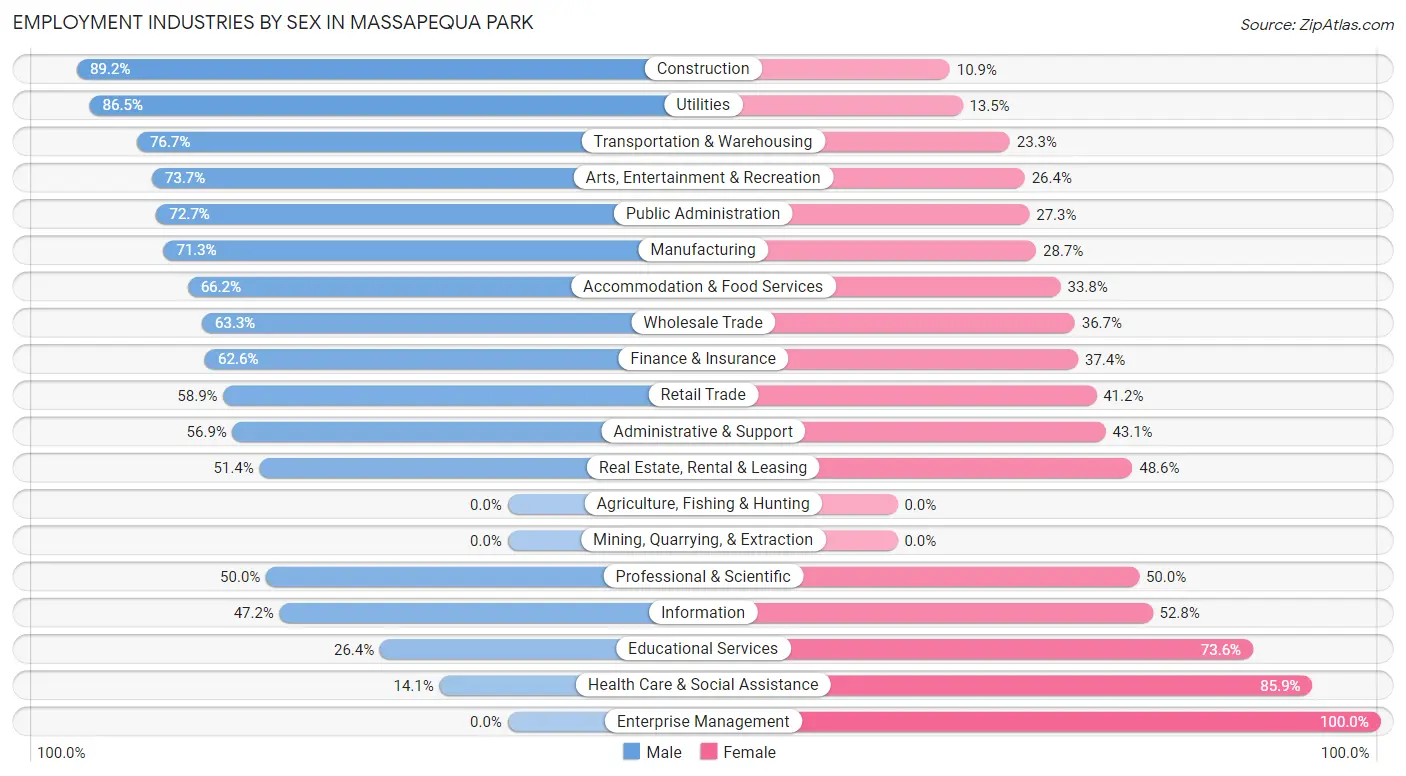
Employment Industries by Sex in Massapequa Park
The Massapequa Park industries that see more men than women are Construction (89.1%), Utilities (86.5%), and Transportation & Warehousing (76.7%), whereas the industries that tend to have a higher number of women are Enterprise Management (100.0%), Health Care & Social Assistance (85.9%), and Educational Services (73.6%).
| Industry | Male | Female |
| Agriculture, Fishing & Hunting | 0 (0.0%) | 0 (0.0%) |
| Mining, Quarrying, & Extraction | 0 (0.0%) | 0 (0.0%) |
| Construction | 411 (89.1%) | 50 (10.8%) |
| Manufacturing | 221 (71.3%) | 89 (28.7%) |
| Wholesale Trade | 181 (63.3%) | 105 (36.7%) |
| Retail Trade | 522 (58.9%) | 365 (41.1%) |
| Transportation & Warehousing | 211 (76.7%) | 64 (23.3%) |
| Utilities | 45 (86.5%) | 7 (13.5%) |
| Information | 118 (47.2%) | 132 (52.8%) |
| Finance & Insurance | 516 (62.6%) | 308 (37.4%) |
| Real Estate, Rental & Leasing | 56 (51.4%) | 53 (48.6%) |
| Professional & Scientific | 312 (50.0%) | 312 (50.0%) |
| Enterprise Management | 0 (0.0%) | 24 (100.0%) |
| Administrative & Support | 123 (56.9%) | 93 (43.1%) |
| Educational Services | 424 (26.4%) | 1,180 (73.6%) |
| Health Care & Social Assistance | 148 (14.1%) | 901 (85.9%) |
| Arts, Entertainment & Recreation | 123 (73.7%) | 44 (26.4%) |
| Accommodation & Food Services | 204 (66.2%) | 104 (33.8%) |
| Public Administration | 666 (72.7%) | 250 (27.3%) |
| Total | 4,386 (51.0%) | 4,213 (49.0%) |
Education in Massapequa Park
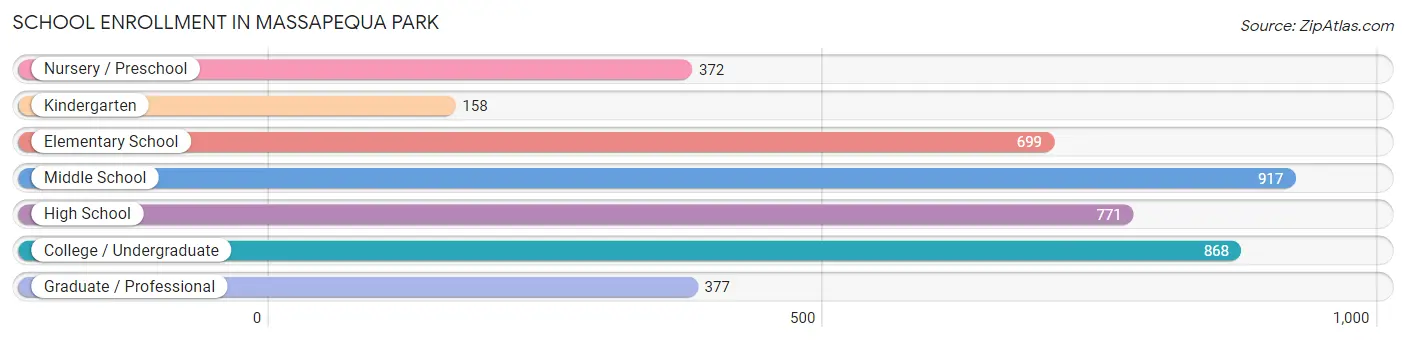
School Enrollment in Massapequa Park
The most common levels of schooling among the 4,162 students in Massapequa Park are middle school (917 | 22.0%), college / undergraduate (868 | 20.9%), and high school (771 | 18.5%).
| School Level | # Students | % Students |
| Nursery / Preschool | 372 | 8.9% |
| Kindergarten | 158 | 3.8% |
| Elementary School | 699 | 16.8% |
| Middle School | 917 | 22.0% |
| High School | 771 | 18.5% |
| College / Undergraduate | 868 | 20.9% |
| Graduate / Professional | 377 | 9.1% |
| Total | 4,162 | 100.0% |
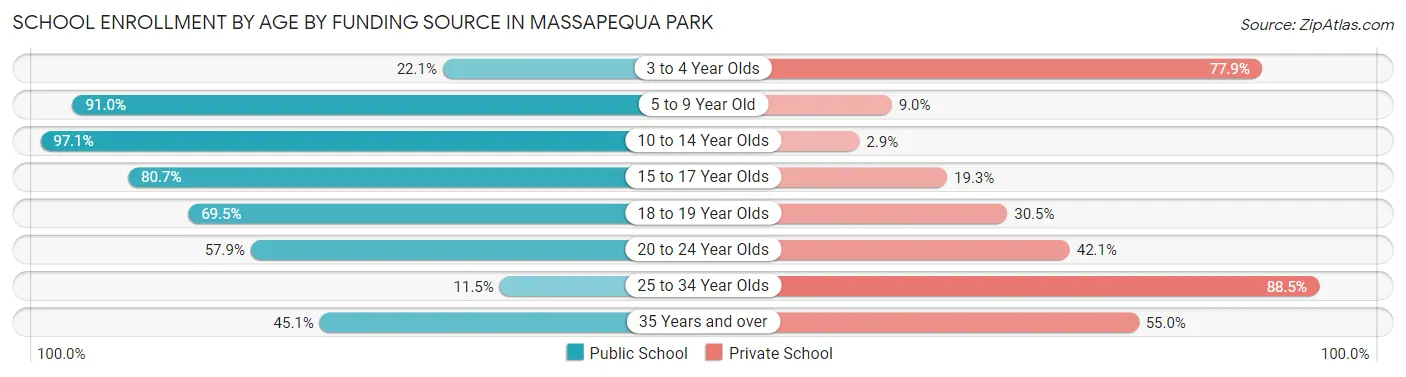
School Enrollment by Age by Funding Source in Massapequa Park
Out of a total of 4,162 students who are enrolled in schools in Massapequa Park, 1,132 (27.2%) attend a private institution, while the remaining 3,030 (72.8%) are enrolled in public schools. The age group of 25 to 34 year olds has the highest likelihood of being enrolled in private schools, with 192 (88.5% in the age bracket) enrolled. Conversely, the age group of 10 to 14 year olds has the lowest likelihood of being enrolled in a private school, with 993 (97.1% in the age bracket) attending a public institution.
| Age Bracket | Public School | Private School |
| 3 to 4 Year Olds | 71 (22.1%) | 250 (77.9%) |
| 5 to 9 Year Old | 772 (91.0%) | 76 (9.0%) |
| 10 to 14 Year Olds | 993 (97.1%) | 30 (2.9%) |
| 15 to 17 Year Olds | 511 (80.7%) | 122 (19.3%) |
| 18 to 19 Year Olds | 219 (69.5%) | 96 (30.5%) |
| 20 to 24 Year Olds | 349 (57.9%) | 254 (42.1%) |
| 25 to 34 Year Olds | 25 (11.5%) | 192 (88.5%) |
| 35 Years and over | 91 (45.1%) | 111 (54.9%) |
| Total | 3,030 (72.8%) | 1,132 (27.2%) |
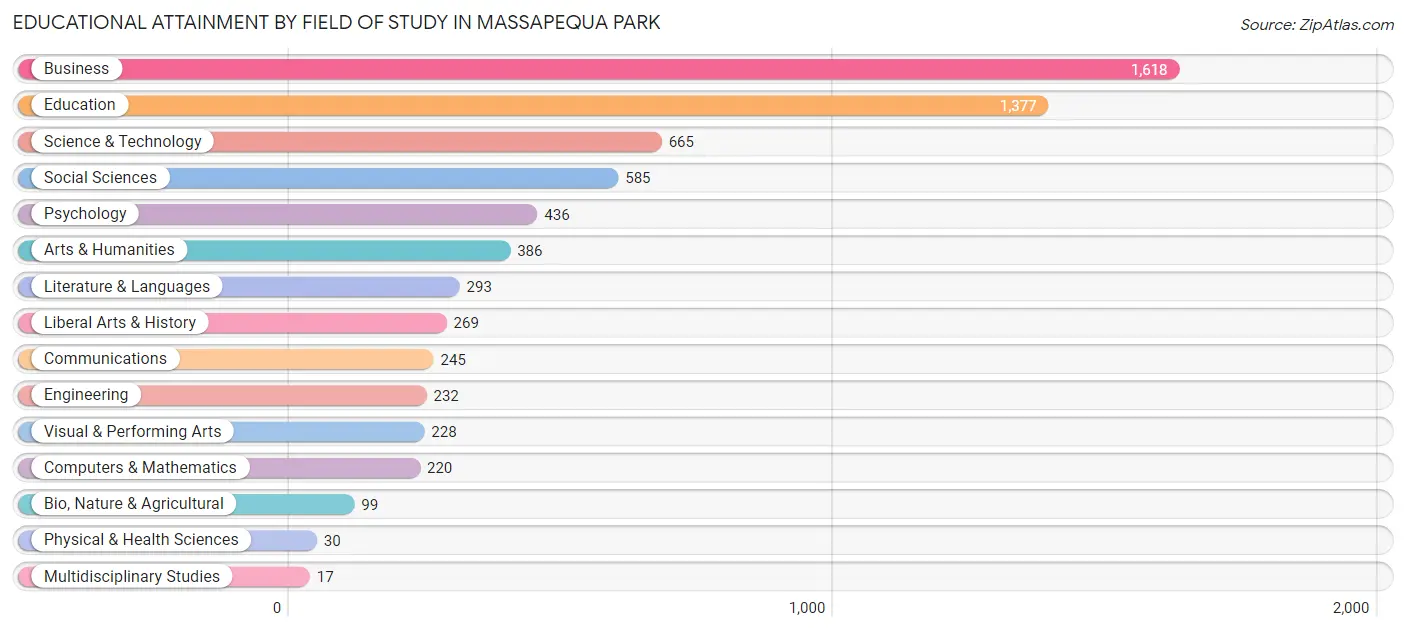
Educational Attainment by Field of Study in Massapequa Park
Business (1,618 | 24.1%), education (1,377 | 20.5%), science & technology (665 | 9.9%), social sciences (585 | 8.7%), and psychology (436 | 6.5%) are the most common fields of study among 6,700 individuals in Massapequa Park who have obtained a bachelor's degree or higher.
| Field of Study | # Graduates | % Graduates |
| Computers & Mathematics | 220 | 3.3% |
| Bio, Nature & Agricultural | 99 | 1.5% |
| Physical & Health Sciences | 30 | 0.4% |
| Psychology | 436 | 6.5% |
| Social Sciences | 585 | 8.7% |
| Engineering | 232 | 3.5% |
| Multidisciplinary Studies | 17 | 0.3% |
| Science & Technology | 665 | 9.9% |
| Business | 1,618 | 24.1% |
| Education | 1,377 | 20.5% |
| Literature & Languages | 293 | 4.4% |
| Liberal Arts & History | 269 | 4.0% |
| Visual & Performing Arts | 228 | 3.4% |
| Communications | 245 | 3.7% |
| Arts & Humanities | 386 | 5.8% |
| Total | 6,700 | 100.0% |
Transportation & Commute in Massapequa Park
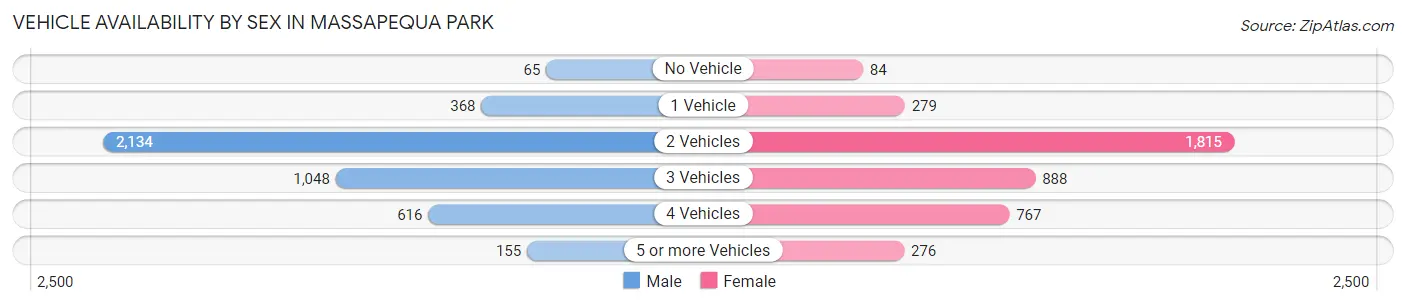
Vehicle Availability by Sex in Massapequa Park
The most prevalent vehicle ownership categories in Massapequa Park are males with 2 vehicles (2,134, accounting for 48.6%) and females with 2 vehicles (1,815, making up 51.9%).
| Vehicles Available | Male | Female |
| No Vehicle | 65 (1.5%) | 84 (2.0%) |
| 1 Vehicle | 368 (8.4%) | 279 (6.8%) |
| 2 Vehicles | 2,134 (48.6%) | 1,815 (44.2%) |
| 3 Vehicles | 1,048 (23.9%) | 888 (21.6%) |
| 4 Vehicles | 616 (14.0%) | 767 (18.7%) |
| 5 or more Vehicles | 155 (3.5%) | 276 (6.7%) |
| Total | 4,386 (100.0%) | 4,109 (100.0%) |
Commute Time in Massapequa Park
The most frequently occuring commute durations in Massapequa Park are 30 to 34 minutes (1,086 commuters, 14.5%), 20 to 24 minutes (991 commuters, 13.2%), and 15 to 19 minutes (843 commuters, 11.2%).
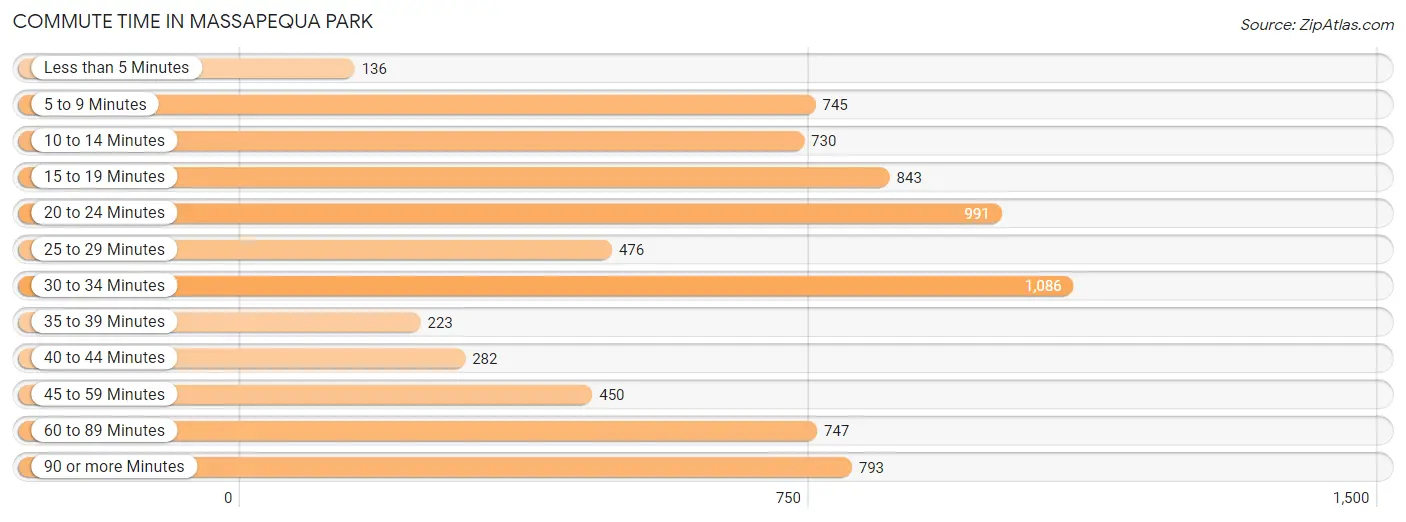
| Commute Time | # Commuters | % Commuters |
| Less than 5 Minutes | 136 | 1.8% |
| 5 to 9 Minutes | 745 | 9.9% |
| 10 to 14 Minutes | 730 | 9.7% |
| 15 to 19 Minutes | 843 | 11.2% |
| 20 to 24 Minutes | 991 | 13.2% |
| 25 to 29 Minutes | 476 | 6.3% |
| 30 to 34 Minutes | 1,086 | 14.5% |
| 35 to 39 Minutes | 223 | 3.0% |
| 40 to 44 Minutes | 282 | 3.8% |
| 45 to 59 Minutes | 450 | 6.0% |
| 60 to 89 Minutes | 747 | 10.0% |
| 90 or more Minutes | 793 | 10.6% |
Commute Time by Sex in Massapequa Park
The most common commute times in Massapequa Park are 30 to 34 minutes (654 commuters, 16.9%) for males and 15 to 19 minutes (494 commuters, 13.6%) for females.
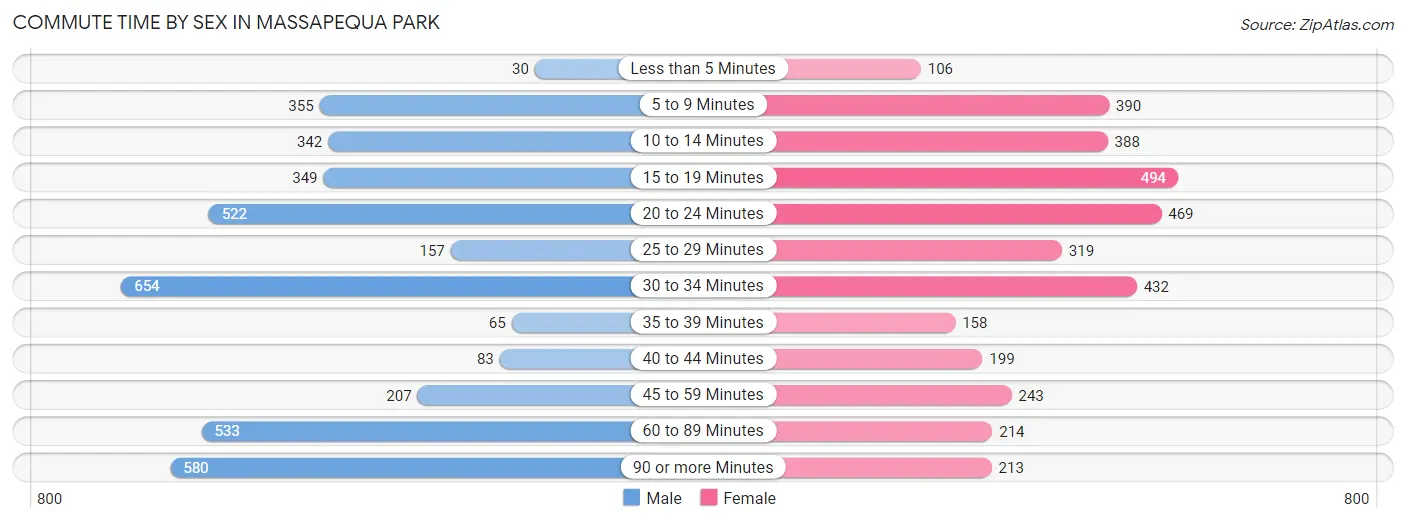
| Commute Time | Male | Female |
| Less than 5 Minutes | 30 (0.8%) | 106 (2.9%) |
| 5 to 9 Minutes | 355 (9.2%) | 390 (10.8%) |
| 10 to 14 Minutes | 342 (8.8%) | 388 (10.7%) |
| 15 to 19 Minutes | 349 (9.0%) | 494 (13.6%) |
| 20 to 24 Minutes | 522 (13.5%) | 469 (12.9%) |
| 25 to 29 Minutes | 157 (4.1%) | 319 (8.8%) |
| 30 to 34 Minutes | 654 (16.9%) | 432 (11.9%) |
| 35 to 39 Minutes | 65 (1.7%) | 158 (4.4%) |
| 40 to 44 Minutes | 83 (2.1%) | 199 (5.5%) |
| 45 to 59 Minutes | 207 (5.3%) | 243 (6.7%) |
| 60 to 89 Minutes | 533 (13.8%) | 214 (5.9%) |
| 90 or more Minutes | 580 (15.0%) | 213 (5.9%) |
Time of Departure to Work by Sex in Massapequa Park
The most frequent times of departure to work in Massapequa Park are 8:00 AM to 8:29 AM (730, 18.8%) for males and 8:00 AM to 8:29 AM (682, 18.8%) for females.
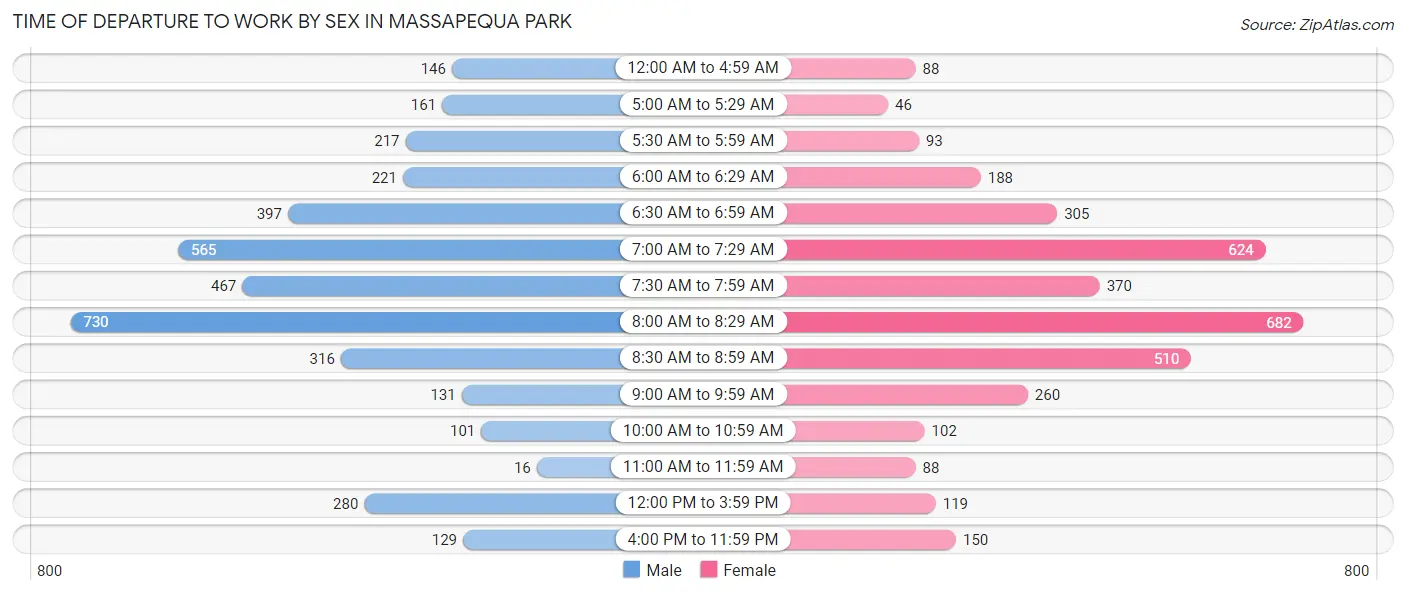
| Time of Departure | Male | Female |
| 12:00 AM to 4:59 AM | 146 (3.8%) | 88 (2.4%) |
| 5:00 AM to 5:29 AM | 161 (4.2%) | 46 (1.3%) |
| 5:30 AM to 5:59 AM | 217 (5.6%) | 93 (2.6%) |
| 6:00 AM to 6:29 AM | 221 (5.7%) | 188 (5.2%) |
| 6:30 AM to 6:59 AM | 397 (10.2%) | 305 (8.4%) |
| 7:00 AM to 7:29 AM | 565 (14.6%) | 624 (17.2%) |
| 7:30 AM to 7:59 AM | 467 (12.0%) | 370 (10.2%) |
| 8:00 AM to 8:29 AM | 730 (18.8%) | 682 (18.8%) |
| 8:30 AM to 8:59 AM | 316 (8.2%) | 510 (14.1%) |
| 9:00 AM to 9:59 AM | 131 (3.4%) | 260 (7.2%) |
| 10:00 AM to 10:59 AM | 101 (2.6%) | 102 (2.8%) |
| 11:00 AM to 11:59 AM | 16 (0.4%) | 88 (2.4%) |
| 12:00 PM to 3:59 PM | 280 (7.2%) | 119 (3.3%) |
| 4:00 PM to 11:59 PM | 129 (3.3%) | 150 (4.1%) |
| Total | 3,877 (100.0%) | 3,625 (100.0%) |
Housing Occupancy in Massapequa Park
Occupancy by Ownership in Massapequa Park
Of the total 5,837 dwellings in Massapequa Park, owner-occupied units account for 5,728 (98.1%), while renter-occupied units make up 109 (1.9%).
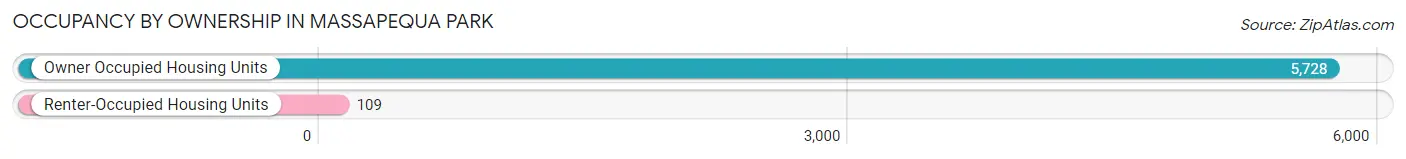
| Occupancy | # Housing Units | % Housing Units |
| Owner Occupied Housing Units | 5,728 | 98.1% |
| Renter-Occupied Housing Units | 109 | 1.9% |
| Total Occupied Housing Units | 5,837 | 100.0% |
Occupancy by Household Size in Massapequa Park
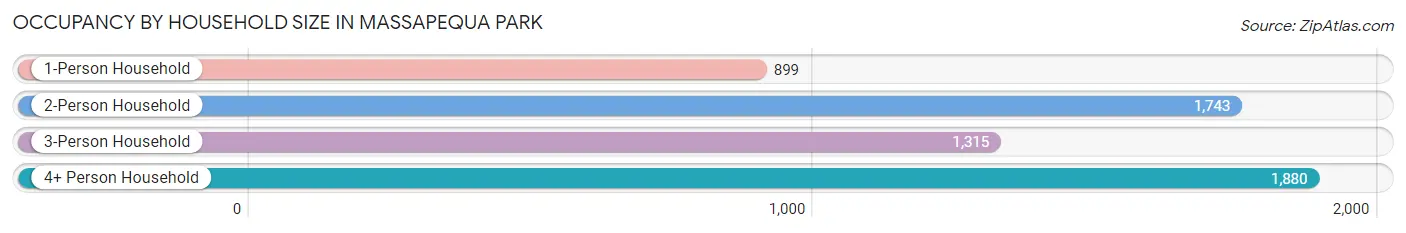
| Household Size | # Housing Units | % Housing Units |
| 1-Person Household | 899 | 15.4% |
| 2-Person Household | 1,743 | 29.9% |
| 3-Person Household | 1,315 | 22.5% |
| 4+ Person Household | 1,880 | 32.2% |
| Total Housing Units | 5,837 | 100.0% |
Occupancy by Ownership by Household Size in Massapequa Park
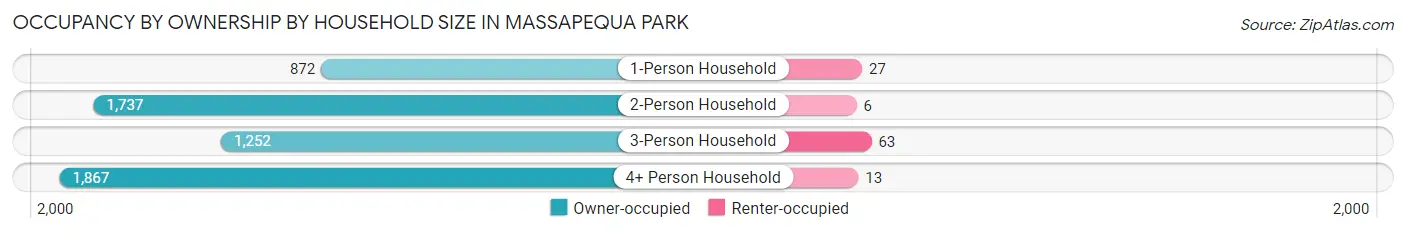
| Household Size | Owner-occupied | Renter-occupied |
| 1-Person Household | 872 (97.0%) | 27 (3.0%) |
| 2-Person Household | 1,737 (99.7%) | 6 (0.3%) |
| 3-Person Household | 1,252 (95.2%) | 63 (4.8%) |
| 4+ Person Household | 1,867 (99.3%) | 13 (0.7%) |
| Total Housing Units | 5,728 (98.1%) | 109 (1.9%) |
Occupancy by Educational Attainment in Massapequa Park

| Household Size | Owner-occupied | Renter-occupied |
| Less than High School | 104 (91.2%) | 10 (8.8%) |
| High School Diploma | 1,132 (98.0%) | 23 (2.0%) |
| College/Associate Degree | 1,424 (97.6%) | 35 (2.4%) |
| Bachelor's Degree or higher | 3,068 (98.7%) | 41 (1.3%) |
Occupancy by Age of Householder in Massapequa Park
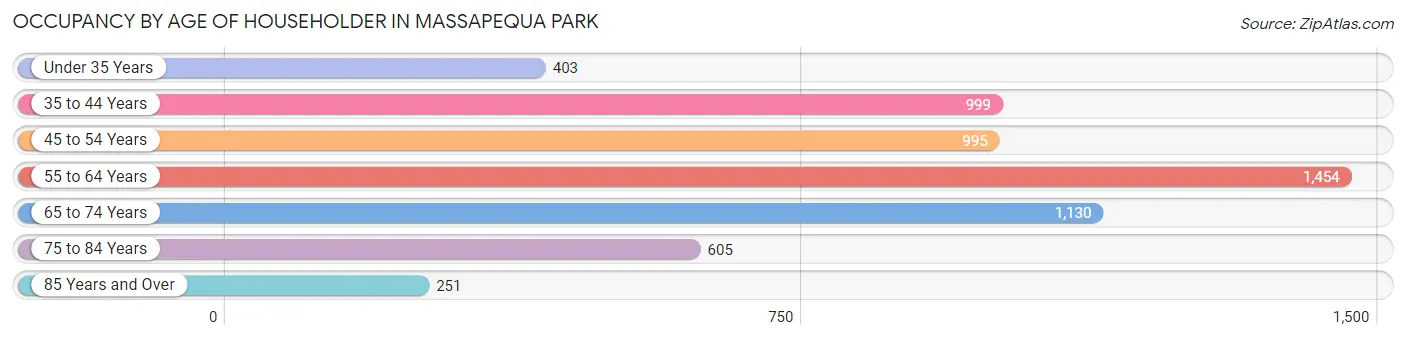
| Age Bracket | # Households | % Households |
| Under 35 Years | 403 | 6.9% |
| 35 to 44 Years | 999 | 17.1% |
| 45 to 54 Years | 995 | 17.1% |
| 55 to 64 Years | 1,454 | 24.9% |
| 65 to 74 Years | 1,130 | 19.4% |
| 75 to 84 Years | 605 | 10.4% |
| 85 Years and Over | 251 | 4.3% |
| Total | 5,837 | 100.0% |
Housing Finances in Massapequa Park
Median Income by Occupancy in Massapequa Park
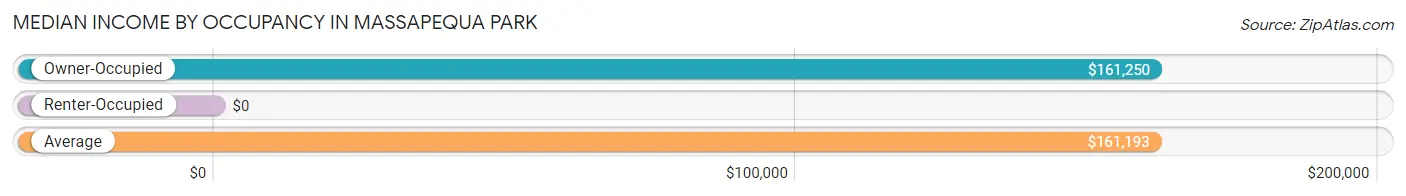
| Occupancy Type | # Households | Median Income |
| Owner-Occupied | 5,728 (98.1%) | $161,250 |
| Renter-Occupied | 109 (1.9%) | $0 |
| Average | 5,837 (100.0%) | $161,193 |
Occupancy by Householder Income Bracket in Massapequa Park
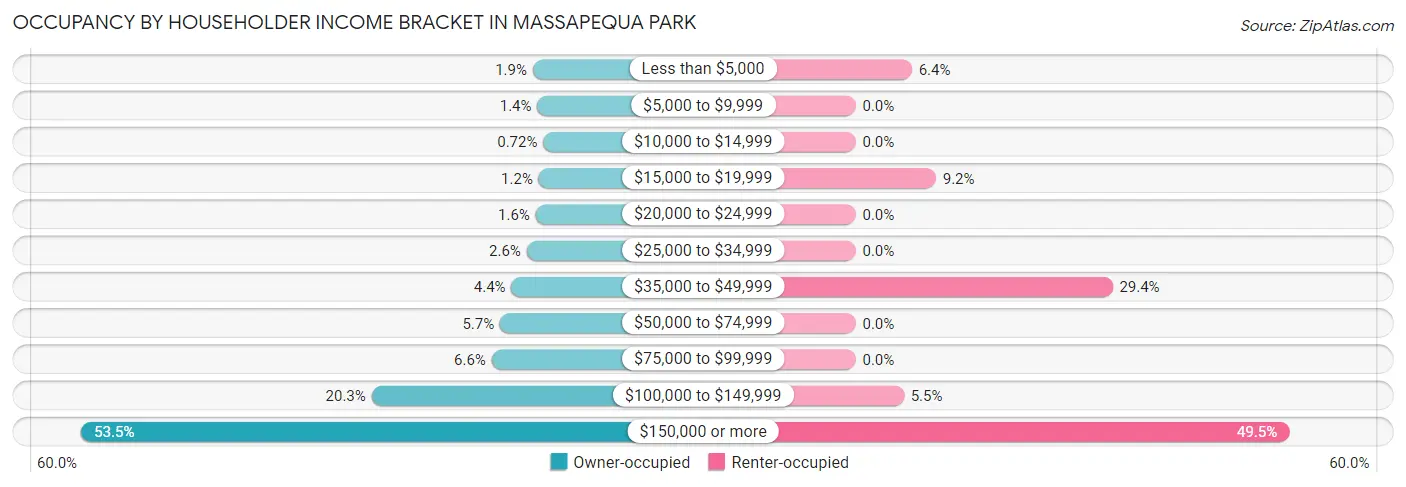
| Income Bracket | Owner-occupied | Renter-occupied |
| Less than $5,000 | 110 (1.9%) | 7 (6.4%) |
| $5,000 to $9,999 | 80 (1.4%) | 0 (0.0%) |
| $10,000 to $14,999 | 41 (0.7%) | 0 (0.0%) |
| $15,000 to $19,999 | 71 (1.2%) | 10 (9.2%) |
| $20,000 to $24,999 | 91 (1.6%) | 0 (0.0%) |
| $25,000 to $34,999 | 150 (2.6%) | 0 (0.0%) |
| $35,000 to $49,999 | 250 (4.4%) | 32 (29.4%) |
| $50,000 to $74,999 | 324 (5.7%) | 0 (0.0%) |
| $75,000 to $99,999 | 379 (6.6%) | 0 (0.0%) |
| $100,000 to $149,999 | 1,165 (20.3%) | 6 (5.5%) |
| $150,000 or more | 3,067 (53.5%) | 54 (49.5%) |
| Total | 5,728 (100.0%) | 109 (100.0%) |
Monthly Housing Cost Tiers in Massapequa Park
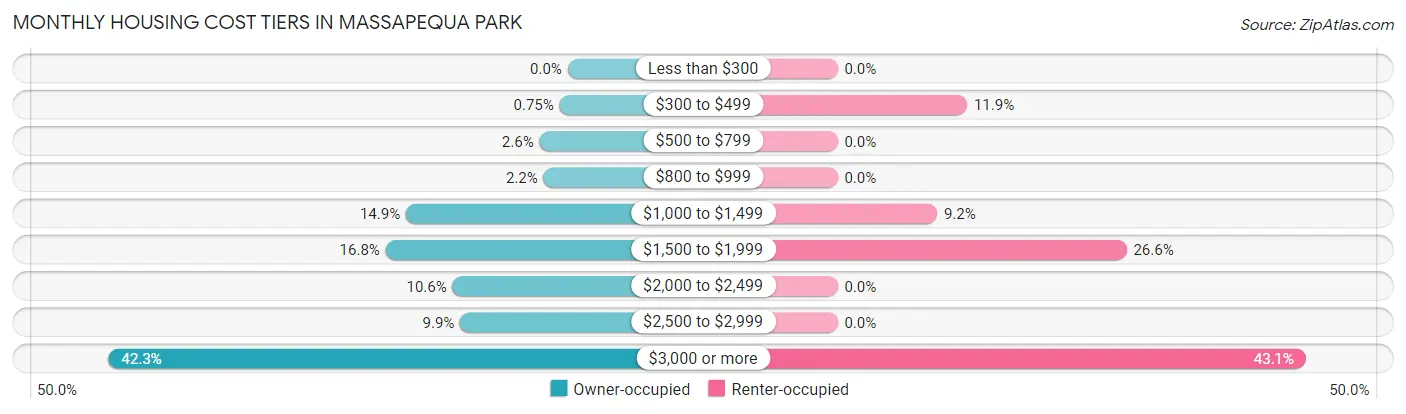
| Monthly Cost | Owner-occupied | Renter-occupied |
| Less than $300 | 0 (0.0%) | 0 (0.0%) |
| $300 to $499 | 43 (0.7%) | 13 (11.9%) |
| $500 to $799 | 149 (2.6%) | 0 (0.0%) |
| $800 to $999 | 127 (2.2%) | 0 (0.0%) |
| $1,000 to $1,499 | 853 (14.9%) | 10 (9.2%) |
| $1,500 to $1,999 | 960 (16.8%) | 29 (26.6%) |
| $2,000 to $2,499 | 607 (10.6%) | 0 (0.0%) |
| $2,500 to $2,999 | 567 (9.9%) | 0 (0.0%) |
| $3,000 or more | 2,422 (42.3%) | 47 (43.1%) |
| Total | 5,728 (100.0%) | 109 (100.0%) |
Physical Housing Characteristics in Massapequa Park
Housing Structures in Massapequa Park
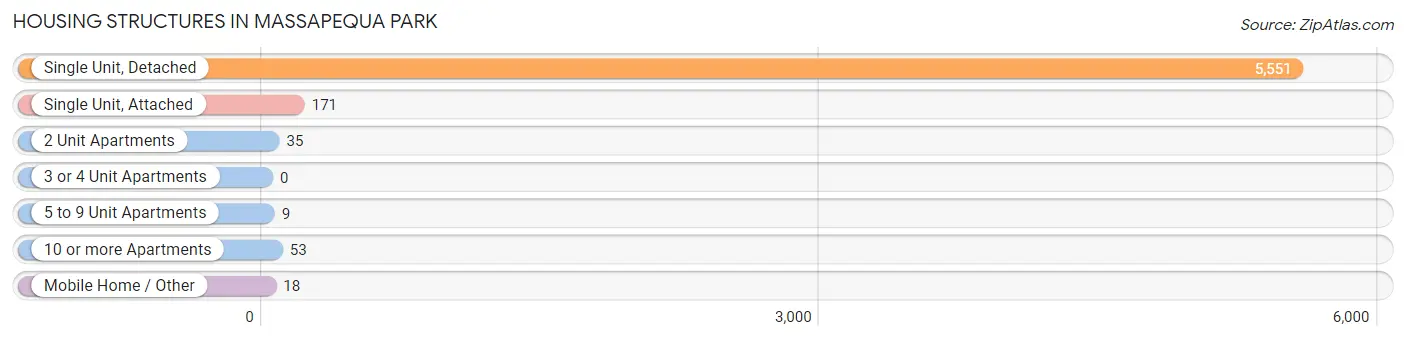
| Structure Type | # Housing Units | % Housing Units |
| Single Unit, Detached | 5,551 | 95.1% |
| Single Unit, Attached | 171 | 2.9% |
| 2 Unit Apartments | 35 | 0.6% |
| 3 or 4 Unit Apartments | 0 | 0.0% |
| 5 to 9 Unit Apartments | 9 | 0.2% |
| 10 or more Apartments | 53 | 0.9% |
| Mobile Home / Other | 18 | 0.3% |
| Total | 5,837 | 100.0% |
Housing Structures by Occupancy in Massapequa Park
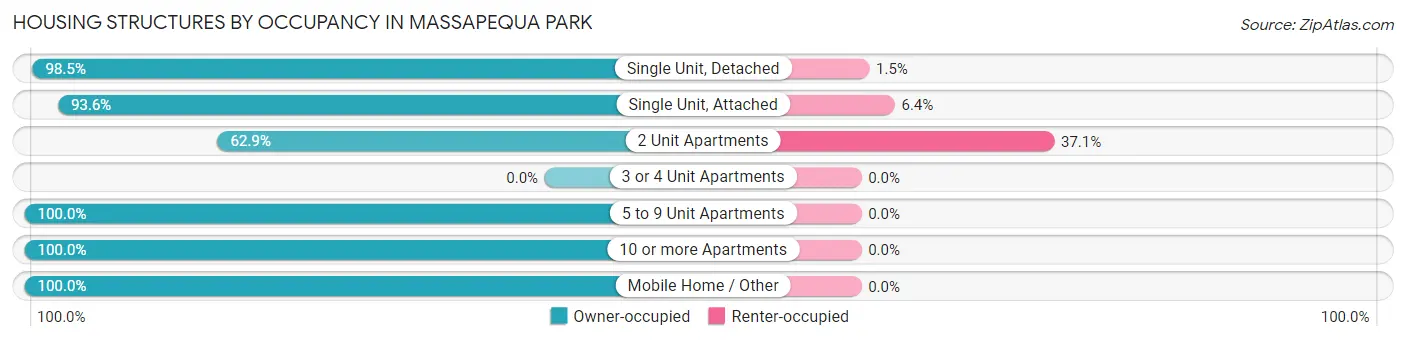
| Structure Type | Owner-occupied | Renter-occupied |
| Single Unit, Detached | 5,466 (98.5%) | 85 (1.5%) |
| Single Unit, Attached | 160 (93.6%) | 11 (6.4%) |
| 2 Unit Apartments | 22 (62.9%) | 13 (37.1%) |
| 3 or 4 Unit Apartments | 0 (0.0%) | 0 (0.0%) |
| 5 to 9 Unit Apartments | 9 (100.0%) | 0 (0.0%) |
| 10 or more Apartments | 53 (100.0%) | 0 (0.0%) |
| Mobile Home / Other | 18 (100.0%) | 0 (0.0%) |
| Total | 5,728 (98.1%) | 109 (1.9%) |
Housing Structures by Number of Rooms in Massapequa Park
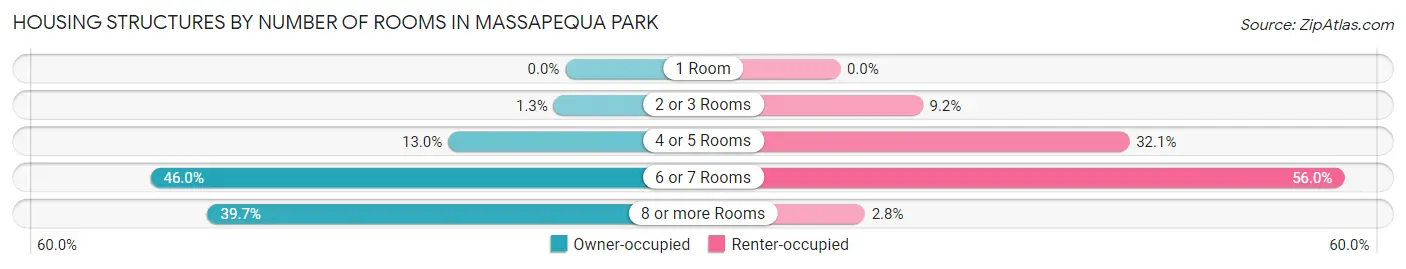
| Number of Rooms | Owner-occupied | Renter-occupied |
| 1 Room | 0 (0.0%) | 0 (0.0%) |
| 2 or 3 Rooms | 74 (1.3%) | 10 (9.2%) |
| 4 or 5 Rooms | 745 (13.0%) | 35 (32.1%) |
| 6 or 7 Rooms | 2,636 (46.0%) | 61 (56.0%) |
| 8 or more Rooms | 2,273 (39.7%) | 3 (2.8%) |
| Total | 5,728 (100.0%) | 109 (100.0%) |
Housing Structure by Heating Type in Massapequa Park
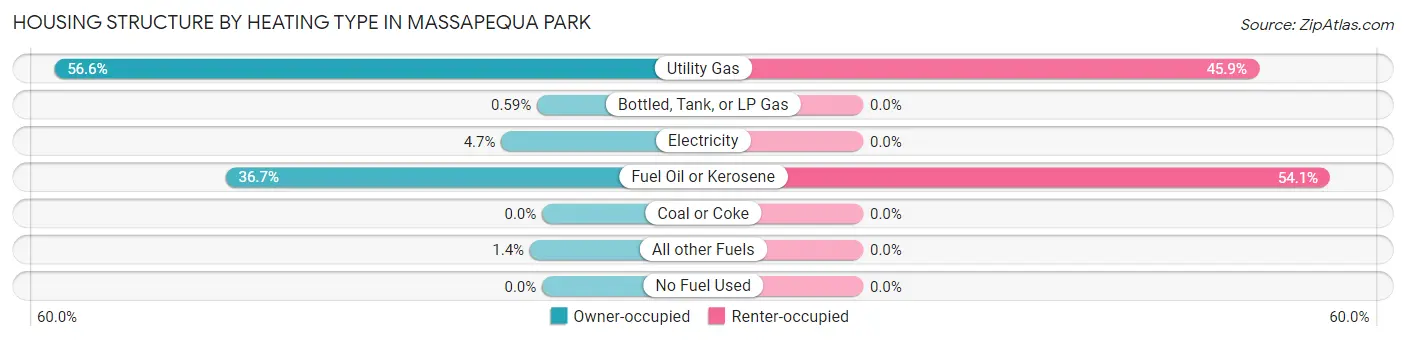
| Heating Type | Owner-occupied | Renter-occupied |
| Utility Gas | 3,240 (56.6%) | 50 (45.9%) |
| Bottled, Tank, or LP Gas | 34 (0.6%) | 0 (0.0%) |
| Electricity | 271 (4.7%) | 0 (0.0%) |
| Fuel Oil or Kerosene | 2,102 (36.7%) | 59 (54.1%) |
| Coal or Coke | 0 (0.0%) | 0 (0.0%) |
| All other Fuels | 81 (1.4%) | 0 (0.0%) |
| No Fuel Used | 0 (0.0%) | 0 (0.0%) |
| Total | 5,728 (100.0%) | 109 (100.0%) |
Household Vehicle Usage in Massapequa Park
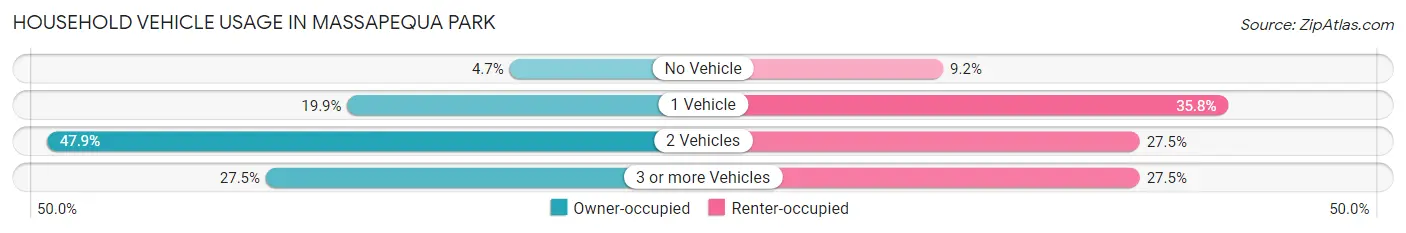
| Vehicles per Household | Owner-occupied | Renter-occupied |
| No Vehicle | 271 (4.7%) | 10 (9.2%) |
| 1 Vehicle | 1,138 (19.9%) | 39 (35.8%) |
| 2 Vehicles | 2,745 (47.9%) | 30 (27.5%) |
| 3 or more Vehicles | 1,574 (27.5%) | 30 (27.5%) |
| Total | 5,728 (100.0%) | 109 (100.0%) |
Real Estate & Mortgages in Massapequa Park
Real Estate and Mortgage Overview in Massapequa Park
| Characteristic | Without Mortgage | With Mortgage |
| Housing Units | 2,379 | 3,349 |
| Median Property Value | $592,100 | $629,800 |
| Median Household Income | $115,188 | $2,173 |
| Monthly Housing Costs | $1,501 | $2,367 |
| Real Estate Taxes | $10,001 | $60 |
Property Value by Mortgage Status in Massapequa Park
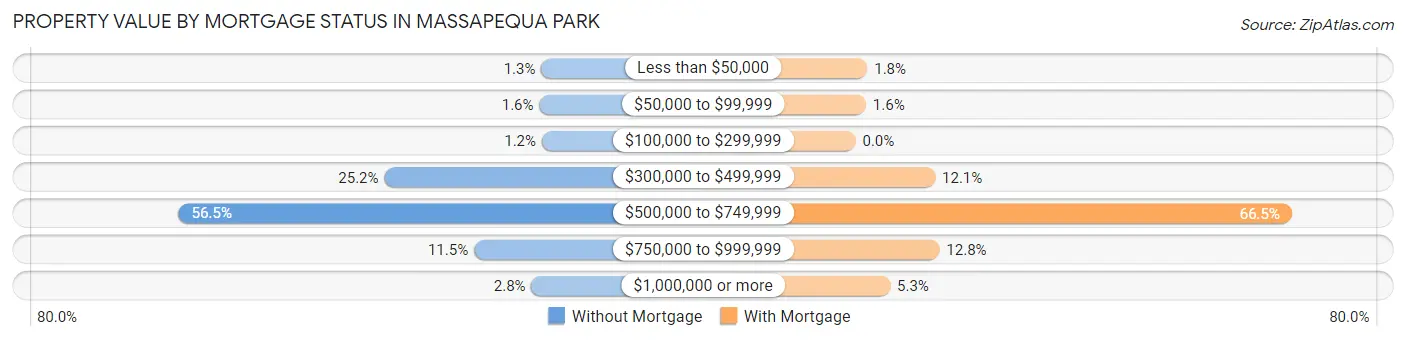
| Property Value | Without Mortgage | With Mortgage |
| Less than $50,000 | 30 (1.3%) | 60 (1.8%) |
| $50,000 to $99,999 | 37 (1.6%) | 53 (1.6%) |
| $100,000 to $299,999 | 28 (1.2%) | 0 (0.0%) |
| $300,000 to $499,999 | 599 (25.2%) | 406 (12.1%) |
| $500,000 to $749,999 | 1,345 (56.5%) | 2,226 (66.5%) |
| $750,000 to $999,999 | 274 (11.5%) | 428 (12.8%) |
| $1,000,000 or more | 66 (2.8%) | 176 (5.3%) |
| Total | 2,379 (100.0%) | 3,349 (100.0%) |
Household Income by Mortgage Status in Massapequa Park
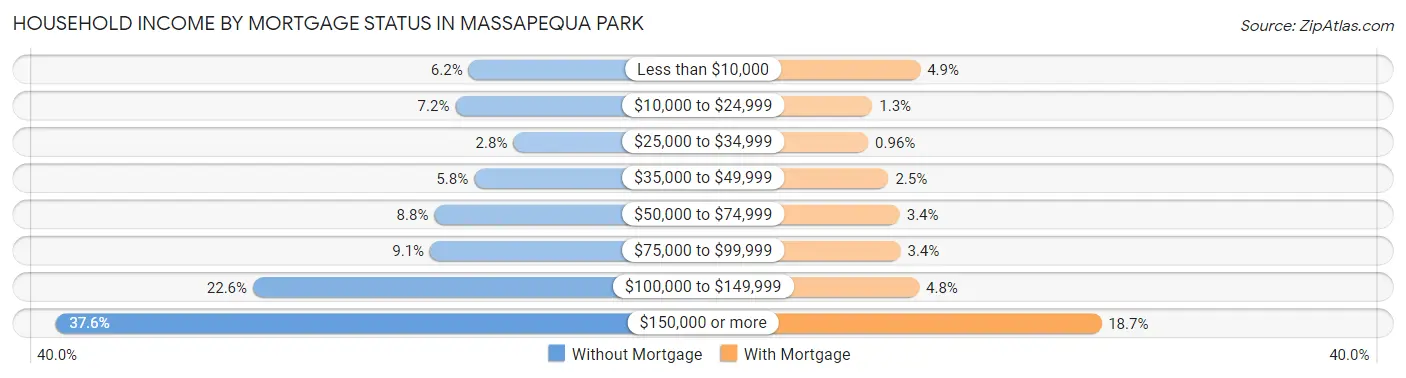
| Household Income | Without Mortgage | With Mortgage |
| Less than $10,000 | 147 (6.2%) | 165 (4.9%) |
| $10,000 to $24,999 | 171 (7.2%) | 43 (1.3%) |
| $25,000 to $34,999 | 66 (2.8%) | 32 (1.0%) |
| $35,000 to $49,999 | 137 (5.8%) | 84 (2.5%) |
| $50,000 to $74,999 | 209 (8.8%) | 113 (3.4%) |
| $75,000 to $99,999 | 217 (9.1%) | 115 (3.4%) |
| $100,000 to $149,999 | 538 (22.6%) | 162 (4.8%) |
| $150,000 or more | 894 (37.6%) | 627 (18.7%) |
| Total | 2,379 (100.0%) | 3,349 (100.0%) |
Property Value to Household Income Ratio in Massapequa Park
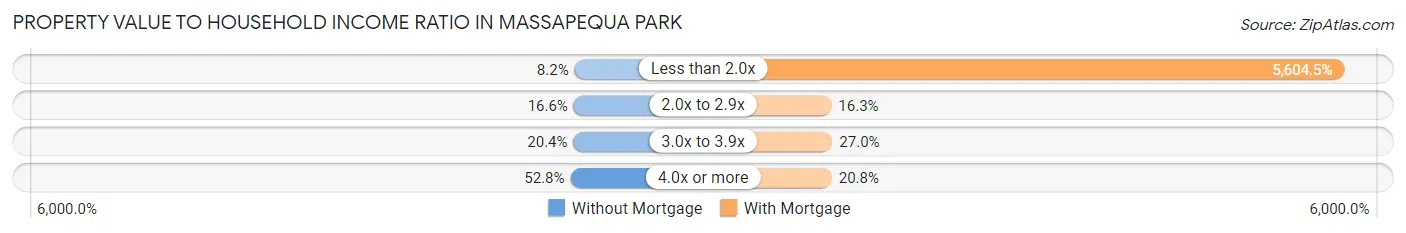
| Value-to-Income Ratio | Without Mortgage | With Mortgage |
| Less than 2.0x | 196 (8.2%) | 187,694 (5,604.5%) |
| 2.0x to 2.9x | 394 (16.6%) | 545 (16.3%) |
| 3.0x to 3.9x | 485 (20.4%) | 905 (27.0%) |
| 4.0x or more | 1,257 (52.8%) | 698 (20.8%) |
| Total | 2,379 (100.0%) | 3,349 (100.0%) |
Real Estate Taxes by Mortgage Status in Massapequa Park
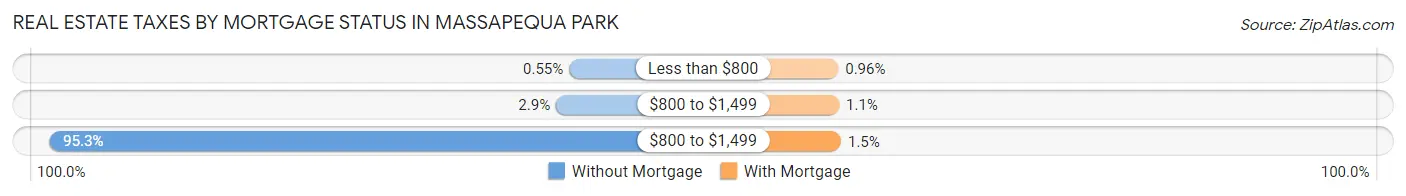
| Property Taxes | Without Mortgage | With Mortgage |
| Less than $800 | 13 (0.5%) | 32 (1.0%) |
| $800 to $1,499 | 70 (2.9%) | 37 (1.1%) |
| $800 to $1,499 | 2,268 (95.3%) | 49 (1.5%) |
| Total | 2,379 (100.0%) | 3,349 (100.0%) |
Health & Disability in Massapequa Park
Health Insurance Coverage by Age in Massapequa Park
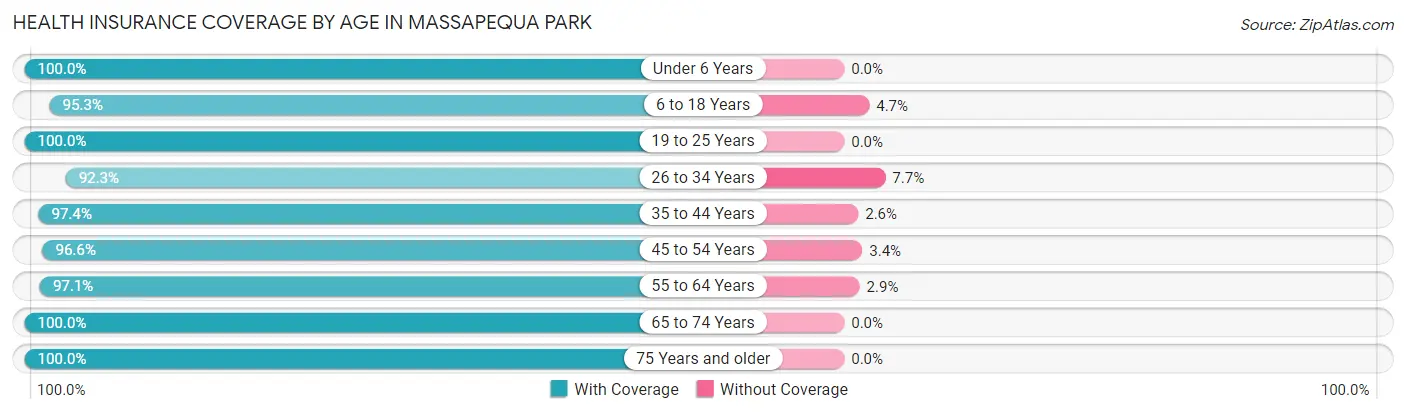
| Age Bracket | With Coverage | Without Coverage |
| Under 6 Years | 1,167 (100.0%) | 0 (0.0%) |
| 6 to 18 Years | 2,333 (95.3%) | 114 (4.7%) |
| 19 to 25 Years | 1,438 (100.0%) | 0 (0.0%) |
| 26 to 34 Years | 1,408 (92.3%) | 117 (7.7%) |
| 35 to 44 Years | 2,163 (97.4%) | 58 (2.6%) |
| 45 to 54 Years | 2,155 (96.6%) | 75 (3.4%) |
| 55 to 64 Years | 2,671 (97.1%) | 79 (2.9%) |
| 65 to 74 Years | 2,039 (100.0%) | 0 (0.0%) |
| 75 Years and older | 1,228 (100.0%) | 0 (0.0%) |
| Total | 16,602 (97.4%) | 443 (2.6%) |
Health Insurance Coverage by Citizenship Status in Massapequa Park
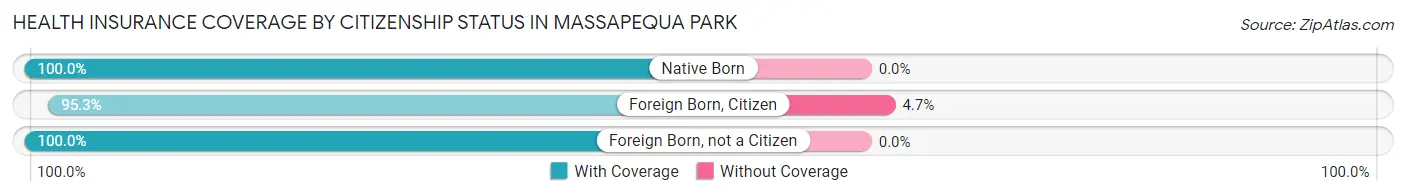
| Citizenship Status | With Coverage | Without Coverage |
| Native Born | 1,167 (100.0%) | 0 (0.0%) |
| Foreign Born, Citizen | 2,333 (95.3%) | 114 (4.7%) |
| Foreign Born, not a Citizen | 1,438 (100.0%) | 0 (0.0%) |
Health Insurance Coverage by Household Income in Massapequa Park
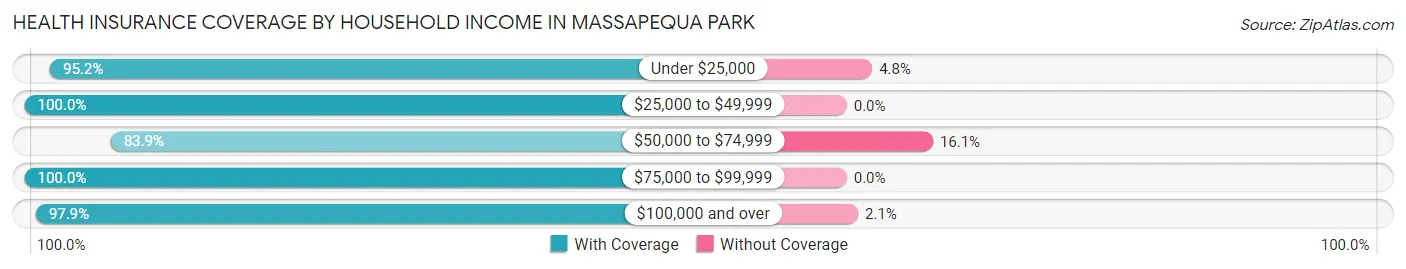
| Household Income | With Coverage | Without Coverage |
| Under $25,000 | 639 (95.2%) | 32 (4.8%) |
| $25,000 to $49,999 | 1,047 (100.0%) | 0 (0.0%) |
| $50,000 to $74,999 | 634 (83.9%) | 122 (16.1%) |
| $75,000 to $99,999 | 903 (100.0%) | 0 (0.0%) |
| $100,000 and over | 13,358 (97.9%) | 289 (2.1%) |
Public vs Private Health Insurance Coverage by Age in Massapequa Park
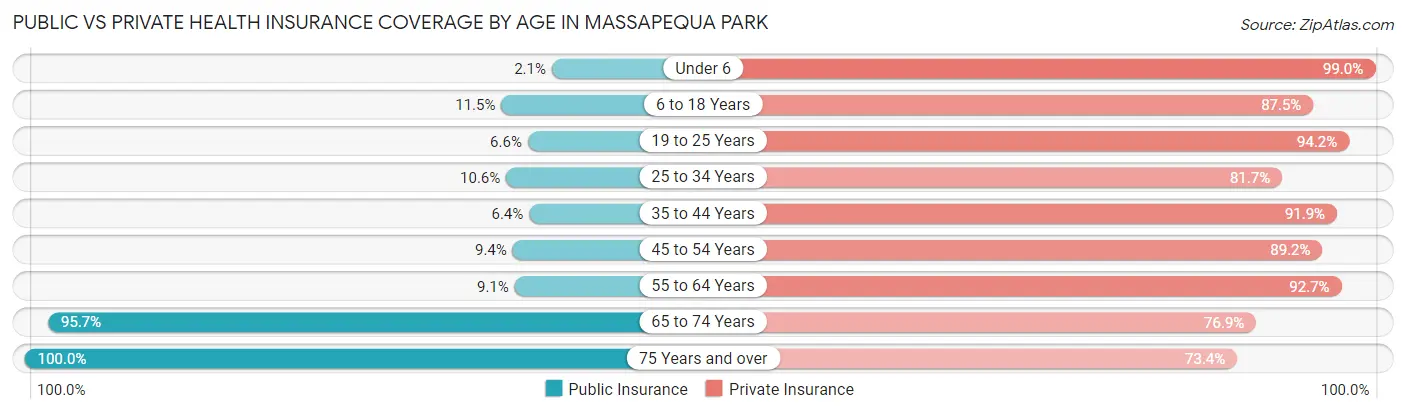
| Age Bracket | Public Insurance | Private Insurance |
| Under 6 | 25 (2.1%) | 1,155 (99.0%) |
| 6 to 18 Years | 282 (11.5%) | 2,141 (87.5%) |
| 19 to 25 Years | 95 (6.6%) | 1,354 (94.2%) |
| 25 to 34 Years | 162 (10.6%) | 1,246 (81.7%) |
| 35 to 44 Years | 141 (6.4%) | 2,041 (91.9%) |
| 45 to 54 Years | 210 (9.4%) | 1,989 (89.2%) |
| 55 to 64 Years | 249 (9.0%) | 2,550 (92.7%) |
| 65 to 74 Years | 1,951 (95.7%) | 1,568 (76.9%) |
| 75 Years and over | 1,228 (100.0%) | 901 (73.4%) |
| Total | 4,343 (25.5%) | 14,945 (87.7%) |
Disability Status by Sex by Age in Massapequa Park
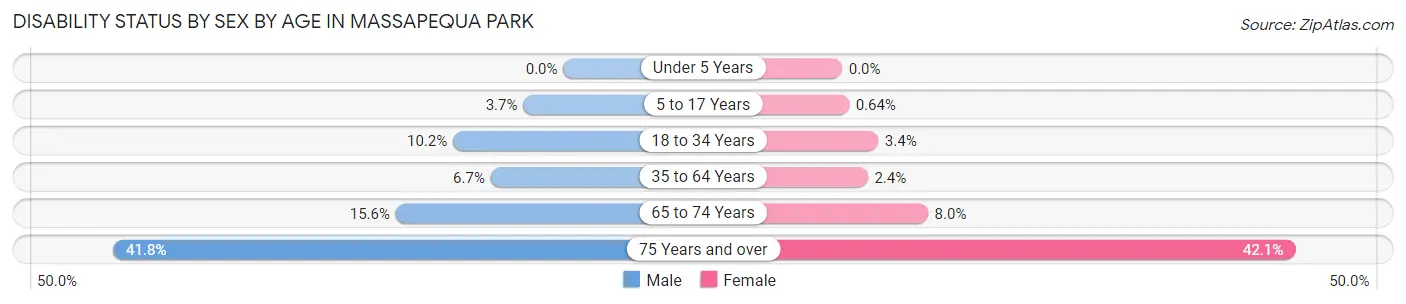
| Age Bracket | Male | Female |
| Under 5 Years | 0 (0.0%) | 0 (0.0%) |
| 5 to 17 Years | 48 (3.7%) | 8 (0.6%) |
| 18 to 34 Years | 157 (10.2%) | 53 (3.4%) |
| 35 to 64 Years | 245 (6.7%) | 85 (2.4%) |
| 65 to 74 Years | 163 (15.5%) | 79 (8.0%) |
| 75 Years and over | 229 (41.8%) | 286 (42.1%) |
Disability Class by Sex by Age in Massapequa Park
Disability Class: Hearing Difficulty
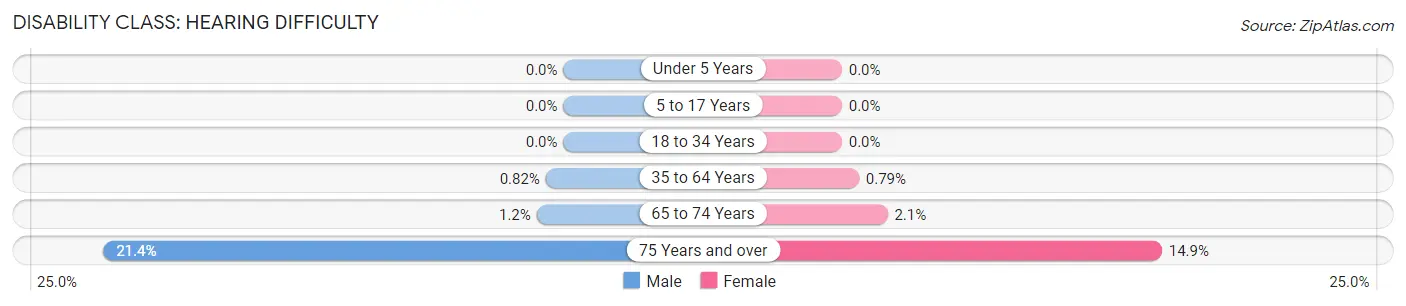
| Age Bracket | Male | Female |
| Under 5 Years | 0 (0.0%) | 0 (0.0%) |
| 5 to 17 Years | 0 (0.0%) | 0 (0.0%) |
| 18 to 34 Years | 0 (0.0%) | 0 (0.0%) |
| 35 to 64 Years | 30 (0.8%) | 28 (0.8%) |
| 65 to 74 Years | 13 (1.2%) | 21 (2.1%) |
| 75 Years and over | 117 (21.3%) | 101 (14.8%) |
Disability Class: Vision Difficulty
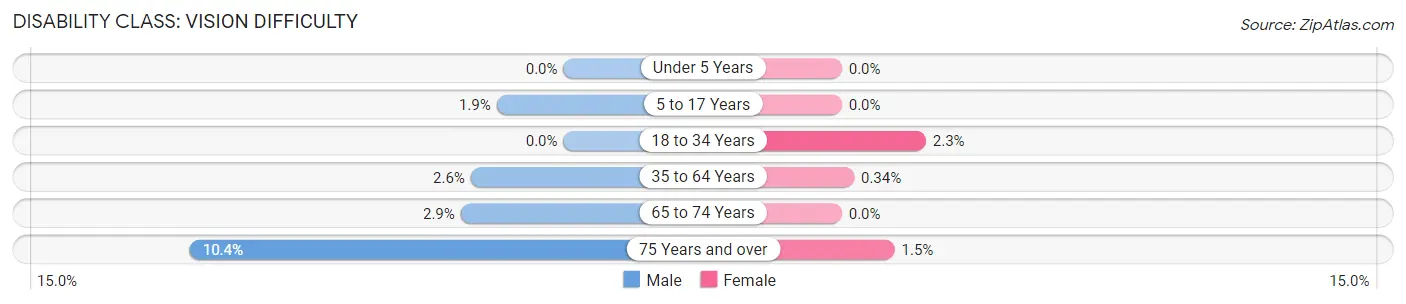
| Age Bracket | Male | Female |
| Under 5 Years | 0 (0.0%) | 0 (0.0%) |
| 5 to 17 Years | 24 (1.9%) | 0 (0.0%) |
| 18 to 34 Years | 0 (0.0%) | 37 (2.3%) |
| 35 to 64 Years | 94 (2.6%) | 12 (0.3%) |
| 65 to 74 Years | 30 (2.9%) | 0 (0.0%) |
| 75 Years and over | 57 (10.4%) | 10 (1.5%) |
Disability Class: Cognitive Difficulty
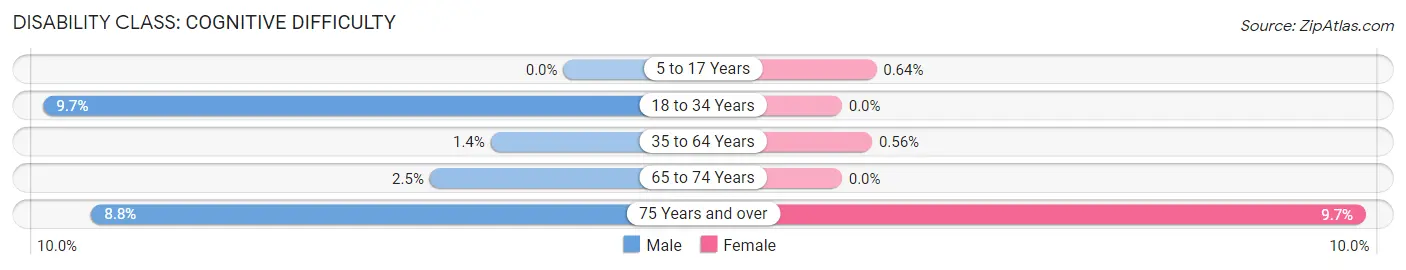
| Age Bracket | Male | Female |
| 5 to 17 Years | 0 (0.0%) | 8 (0.6%) |
| 18 to 34 Years | 148 (9.7%) | 0 (0.0%) |
| 35 to 64 Years | 49 (1.3%) | 20 (0.6%) |
| 65 to 74 Years | 26 (2.5%) | 0 (0.0%) |
| 75 Years and over | 48 (8.8%) | 66 (9.7%) |
Disability Class: Ambulatory Difficulty
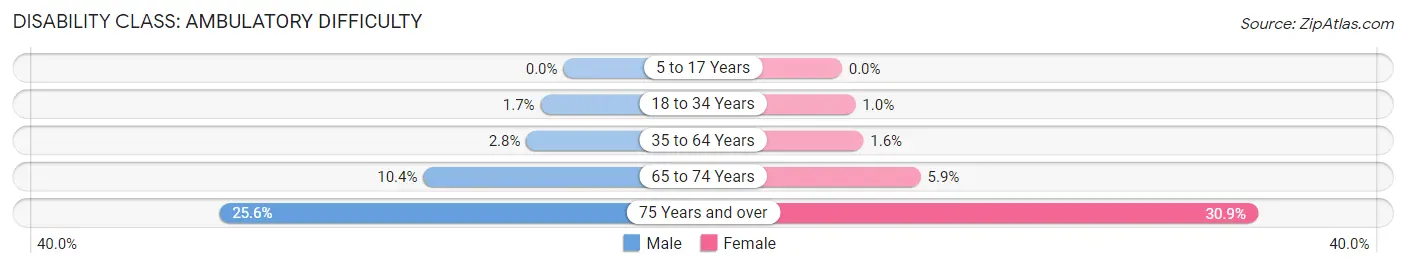
| Age Bracket | Male | Female |
| 5 to 17 Years | 0 (0.0%) | 0 (0.0%) |
| 18 to 34 Years | 26 (1.7%) | 16 (1.0%) |
| 35 to 64 Years | 100 (2.8%) | 57 (1.6%) |
| 65 to 74 Years | 109 (10.4%) | 58 (5.9%) |
| 75 Years and over | 140 (25.6%) | 210 (30.9%) |
Disability Class: Self-Care Difficulty
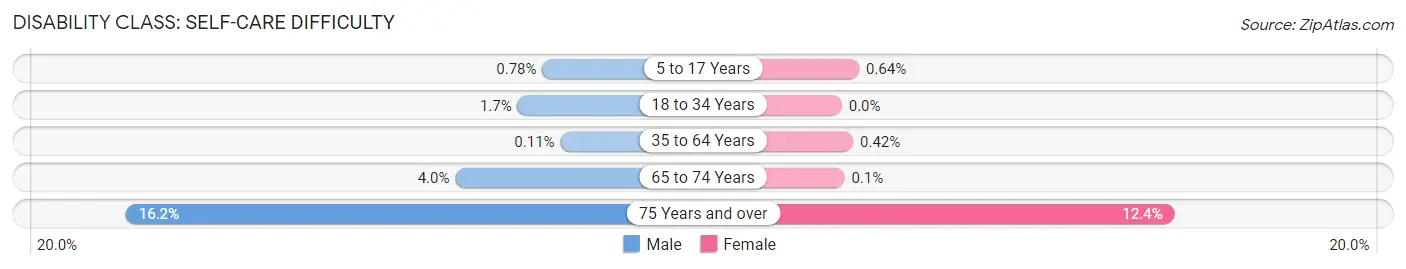
| Age Bracket | Male | Female |
| 5 to 17 Years | 10 (0.8%) | 8 (0.6%) |
| 18 to 34 Years | 26 (1.7%) | 0 (0.0%) |
| 35 to 64 Years | 4 (0.1%) | 15 (0.4%) |
| 65 to 74 Years | 42 (4.0%) | 1 (0.1%) |
| 75 Years and over | 89 (16.2%) | 84 (12.3%) |
Technology Access in Massapequa Park
Computing Device Access in Massapequa Park
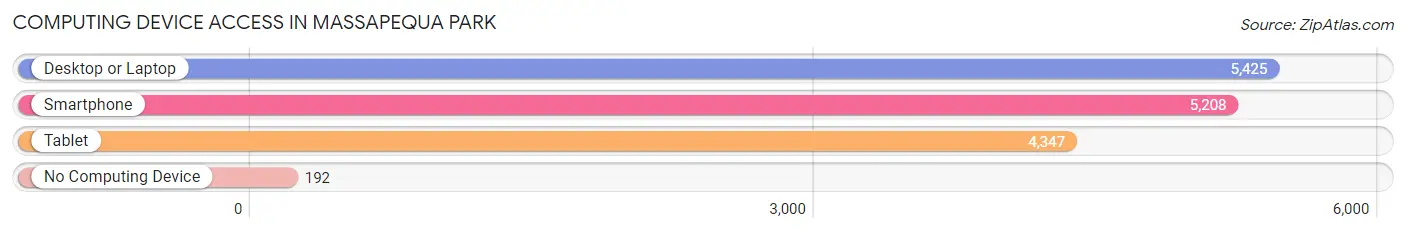
| Device Type | # Households | % Households |
| Desktop or Laptop | 5,425 | 92.9% |
| Smartphone | 5,208 | 89.2% |
| Tablet | 4,347 | 74.5% |
| No Computing Device | 192 | 3.3% |
| Total | 5,837 | 100.0% |
Internet Access in Massapequa Park
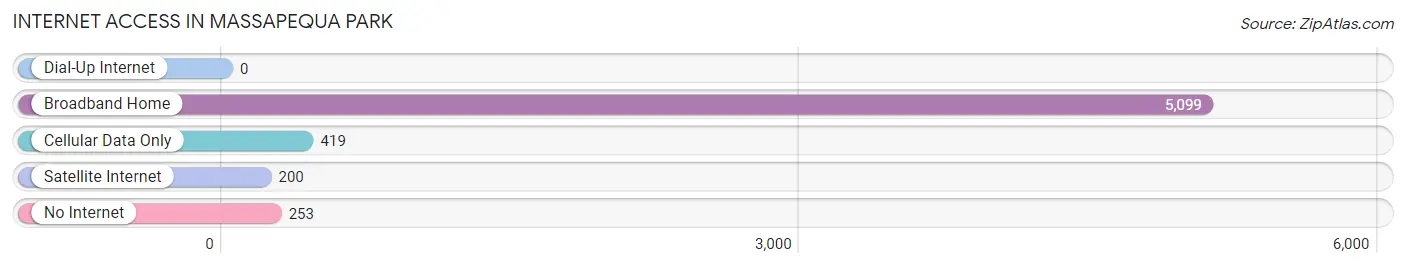
| Internet Type | # Households | % Households |
| Dial-Up Internet | 0 | 0.0% |
| Broadband Home | 5,099 | 87.4% |
| Cellular Data Only | 419 | 7.2% |
| Satellite Internet | 200 | 3.4% |
| No Internet | 253 | 4.3% |
| Total | 5,837 | 100.0% |
Massapequa Park Summary
Introduction
Massapequa Park is a village located in Nassau County, New York, United States. It is located within the Town of Oyster Bay and is part of the Greater New York City metropolitan area. The village is located on the south shore of Long Island and is bordered by the villages of Massapequa and Amityville. The population of Massapequa Park was 17,008 as of the 2010 census.
History
The area that is now Massapequa Park was originally inhabited by the Massapequa Indians, a sub-tribe of the Algonquin Indians. The Massapequa Indians were a peaceful tribe that lived in the area for centuries before the arrival of European settlers. The first European settlers arrived in the area in the late 1600s and early 1700s. The area was originally part of the Town of Oyster Bay, which was established in 1653.
In 1875, the area was incorporated as the Village of Massapequa Park. The village was named after the Massapequa Indians who had inhabited the area for centuries. The village was originally a farming community, but it began to grow in the early 1900s as more people moved to the area.
Geography
Massapequa Park is located in Nassau County, New York, United States. It is located within the Town of Oyster Bay and is part of the Greater New York City metropolitan area. The village is located on the south shore of Long Island and is bordered by the villages of Massapequa and Amityville. The village is located approximately 25 miles east of Manhattan.
The village has a total area of 2.2 square miles, all of which is land. The village is located on the south shore of Long Island and is bordered by the villages of Massapequa and Amityville. The village is located approximately 25 miles east of Manhattan.
Economy
Massapequa Park is a primarily residential community, but it does have a few businesses. The village is home to a variety of retail stores, restaurants, and other businesses. The village is also home to a few industrial businesses, such as a printing company and a metal fabrication company.
The village is also home to a few medical facilities, including a hospital and a nursing home. The village is also home to a few educational institutions, including a public school district and a private school.
Demographics
As of the 2010 census, the population of Massapequa Park was 17,008. The population density was 7,717.3 people per square mile. The racial makeup of the village was 87.3% White, 4.2% African American, 0.2% Native American, 4.2% Asian, 0.1% Pacific Islander, 1.7% from other races, and 2.5% from two or more races. Hispanic or Latino of any race were 6.3% of the population.
The median income for a household in the village was $90,945, and the median income for a family was $103,945. The per capita income for the village was $37,945. About 2.7% of families and 3.7% of the population were below the poverty line, including 4.3% of those under age 18 and 4.2% of those age 65 or over.
Conclusion
Massapequa Park is a village located in Nassau County, New York, United States. It is located within the Town of Oyster Bay and is part of the Greater New York City metropolitan area. The village is located on the south shore of Long Island and is bordered by the villages of Massapequa and Amityville. The population of Massapequa Park was 17,008 as of the 2010 census. The village is primarily a residential community, but it does have a few businesses. The village is also home to a few medical facilities, including a hospital and a nursing home. The median income for a household in the village was $90,945, and the median income for a family was $103,945. The per capita income for the village was $37,945.
Common Questions
What is the Total Population of Massapequa Park?
Total Population of Massapequa Park is 17,045.
What is the Total Male Population of Massapequa Park?
Total Male Population of Massapequa Park is 8,506.
What is the Total Female Population of Massapequa Park?
Total Female Population of Massapequa Park is 8,539.
What is the Ratio of Males per 100 Females in Massapequa Park?
There are 99.61 Males per 100 Females in Massapequa Park.
What is the Ratio of Females per 100 Males in Massapequa Park?
There are 100.39 Females per 100 Males in Massapequa Park.
What is the Median Population Age in Massapequa Park?
Median Population Age in Massapequa Park is 43.7 Years.
What is the Average Family Size in Massapequa Park
Average Family Size in Massapequa Park is 3.2 People.
What is the Average Household Size in Massapequa Park
Average Household Size in Massapequa Park is 2.9 People.
What is Per Capita Income in Massapequa Park?
Per Capita income in Massapequa Park is $61,507.
What is the Median Family Income in Massapequa Park?
Median Family Income in Massapequa Park is $173,773.
What is the Median Household income in Massapequa Park?
Median Household Income in Massapequa Park is $161,193.
What is Income or Wage Gap in Massapequa Park?
Income or Wage Gap in Massapequa Park is 36.0%.
Women in Massapequa Park earn 64.0 cents for every dollar earned by a man.
What is Inequality or Gini Index in Massapequa Park?
Inequality or Gini Index in Massapequa Park is 0.38.
How Large is the Labor Force in Massapequa Park?
There are 9,048 People in the Labor Forcein in Massapequa Park.
What is the Percentage of People in the Labor Force in Massapequa Park?
64.4% of People are in the Labor Force in Massapequa Park.
What is the Unemployment Rate in Massapequa Park?
Unemployment Rate in Massapequa Park is 4.9%.