Rouses Point, NY
Rouses Point Map
Rouses Point Overview
2,530
TOTAL POPULATION
1,310
MALE POPULATION
1,220
FEMALE POPULATION
107.38
MALES / 100 FEMALES
93.13
FEMALES / 100 MALES
45.0
MEDIAN AGE
3.1
AVG FAMILY SIZE
2.1
AVG HOUSEHOLD SIZE
$29,724
PER CAPITA INCOME
$74,318
AVG FAMILY INCOME
$45,542
AVG HOUSEHOLD INCOME
19.5%
WAGE / INCOME GAP [ % ]
80.5¢/ $1
WAGE / INCOME GAP [ $ ]
$15,098
FAMILY INCOME DEFICIT
0.49
INEQUALITY / GINI INDEX
1,134
LABOR FORCE [ PEOPLE ]
56.4%
PERCENT IN LABOR FORCE
5.6%
UNEMPLOYMENT RATE
Rouses Point Zip Codes
Rouses Point Area Codes
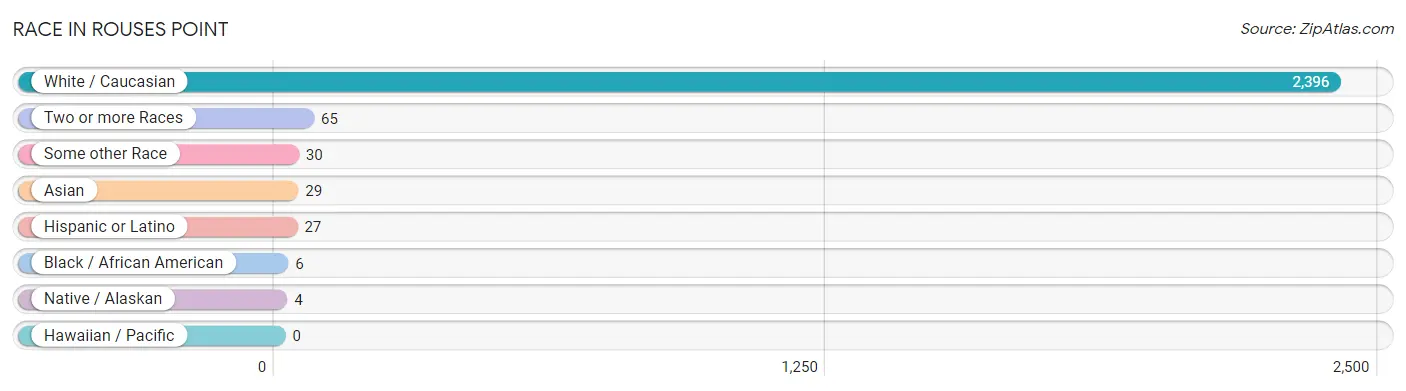
Race in Rouses Point
The most populous races in Rouses Point are White / Caucasian (2,396 | 94.7%), Two or more Races (65 | 2.6%), and Some other Race (30 | 1.2%).
| Race | # Population | % Population |
| Asian | 29 | 1.1% |
| Black / African American | 6 | 0.2% |
| Hawaiian / Pacific | 0 | 0.0% |
| Hispanic or Latino | 27 | 1.1% |
| Native / Alaskan | 4 | 0.2% |
| White / Caucasian | 2,396 | 94.7% |
| Two or more Races | 65 | 2.6% |
| Some other Race | 30 | 1.2% |
| Total | 2,530 | 100.0% |
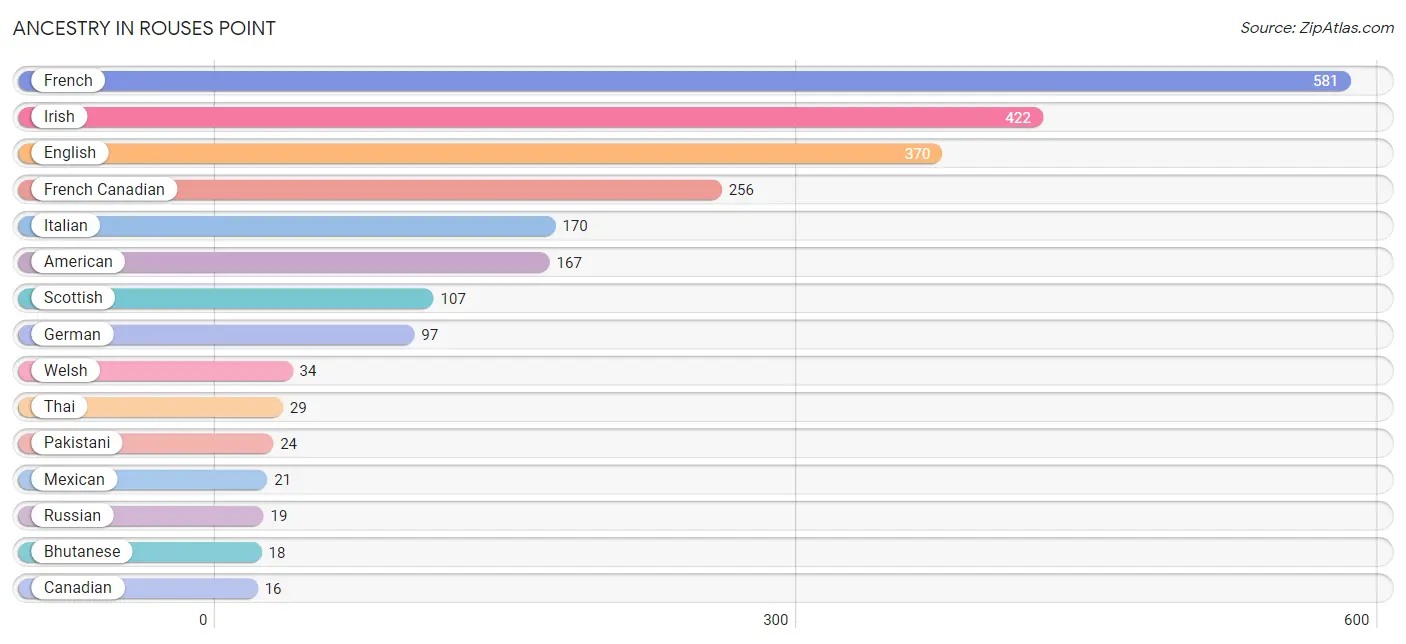
Ancestry in Rouses Point
The most populous ancestries reported in Rouses Point are French (581 | 23.0%), Irish (422 | 16.7%), English (370 | 14.6%), French Canadian (256 | 10.1%), and Italian (170 | 6.7%), together accounting for 71.1% of all Rouses Point residents.
| Ancestry | # Population | % Population |
| American | 167 | 6.6% |
| Bhutanese | 18 | 0.7% |
| Blackfeet | 5 | 0.2% |
| British | 3 | 0.1% |
| Canadian | 16 | 0.6% |
| Central American | 2 | 0.1% |
| Dominican | 1 | 0.0% |
| Dutch | 10 | 0.4% |
| English | 370 | 14.6% |
| European | 6 | 0.2% |
| French | 581 | 23.0% |
| French Canadian | 256 | 10.1% |
| German | 97 | 3.8% |
| Guyanese | 8 | 0.3% |
| Honduran | 2 | 0.1% |
| Inupiat | 4 | 0.2% |
| Irish | 422 | 16.7% |
| Iroquois | 4 | 0.2% |
| Italian | 170 | 6.7% |
| Korean | 4 | 0.2% |
| Lithuanian | 7 | 0.3% |
| Mexican | 21 | 0.8% |
| Pakistani | 24 | 0.9% |
| Polish | 13 | 0.5% |
| Russian | 19 | 0.7% |
| Scotch-Irish | 12 | 0.5% |
| Scottish | 107 | 4.2% |
| Spaniard | 3 | 0.1% |
| Swedish | 6 | 0.2% |
| Thai | 29 | 1.1% |
| Ukrainian | 7 | 0.3% |
| Welsh | 34 | 1.3% | View All 32 Rows |
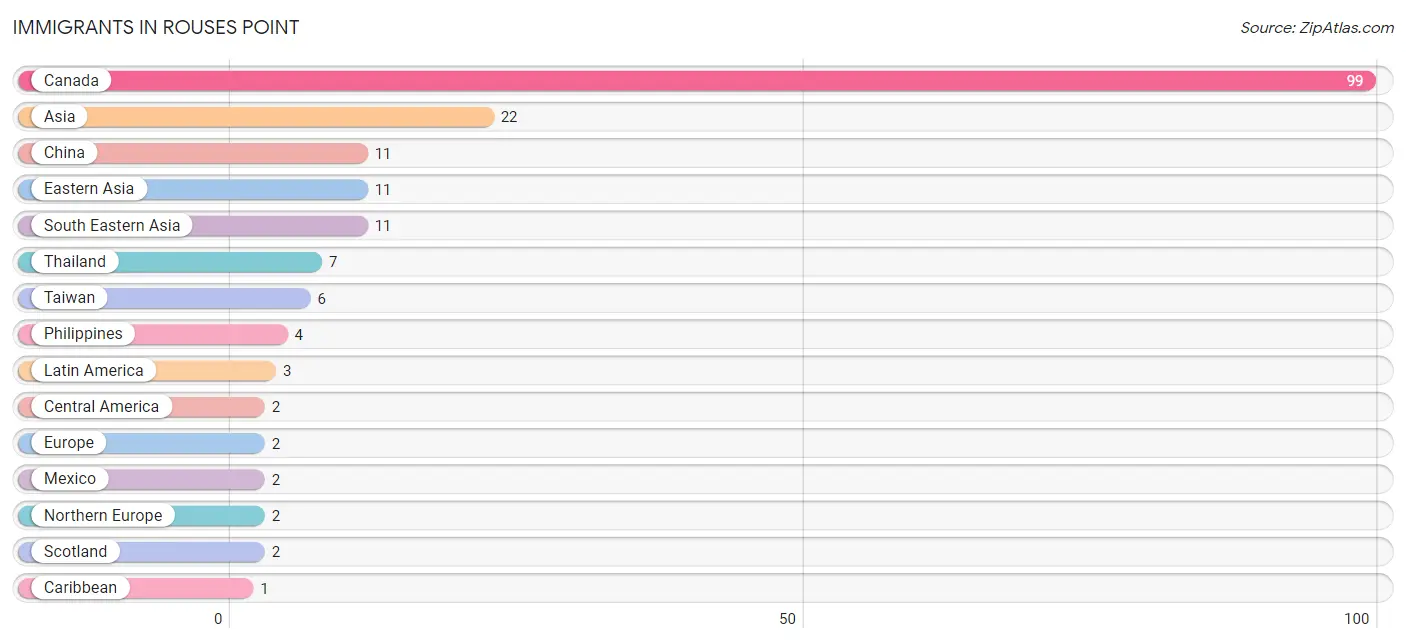
Immigrants in Rouses Point
The most numerous immigrant groups reported in Rouses Point came from Canada (99 | 3.9%), Asia (22 | 0.9%), China (11 | 0.4%), Eastern Asia (11 | 0.4%), and South Eastern Asia (11 | 0.4%), together accounting for 6.1% of all Rouses Point residents.
| Immigration Origin | # Population | % Population |
| Asia | 22 | 0.9% |
| Canada | 99 | 3.9% |
| Caribbean | 1 | 0.0% |
| Central America | 2 | 0.1% |
| China | 11 | 0.4% |
| Dominican Republic | 1 | 0.0% |
| Eastern Asia | 11 | 0.4% |
| Europe | 2 | 0.1% |
| Latin America | 3 | 0.1% |
| Mexico | 2 | 0.1% |
| Northern Europe | 2 | 0.1% |
| Philippines | 4 | 0.2% |
| Scotland | 2 | 0.1% |
| South Eastern Asia | 11 | 0.4% |
| Taiwan | 6 | 0.2% |
| Thailand | 7 | 0.3% | View All 16 Rows |
Sex and Age in Rouses Point
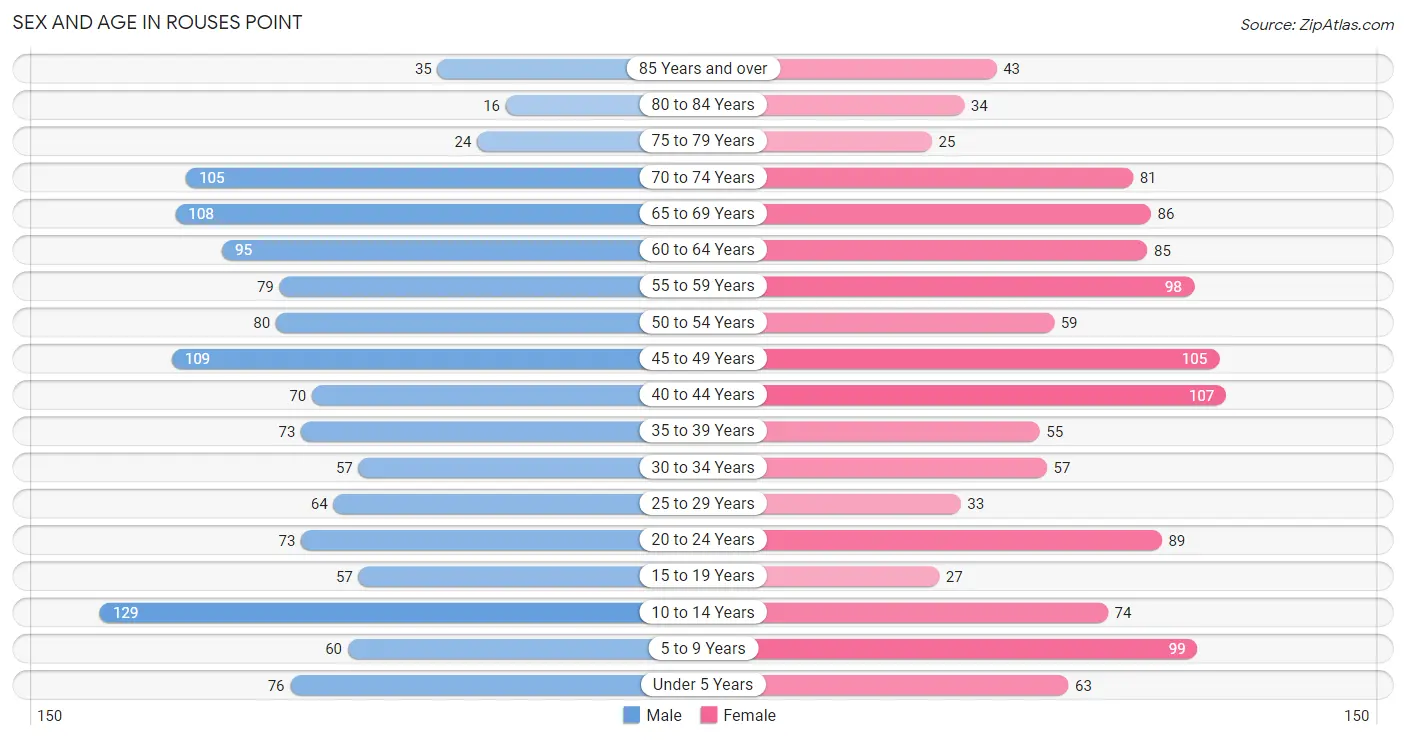
Sex and Age in Rouses Point
The most populous age groups in Rouses Point are 10 to 14 Years (129 | 9.9%) for men and 40 to 44 Years (107 | 8.8%) for women.
| Age Bracket | Male | Female |
| Under 5 Years | 76 (5.8%) | 63 (5.2%) |
| 5 to 9 Years | 60 (4.6%) | 99 (8.1%) |
| 10 to 14 Years | 129 (9.9%) | 74 (6.1%) |
| 15 to 19 Years | 57 (4.3%) | 27 (2.2%) |
| 20 to 24 Years | 73 (5.6%) | 89 (7.3%) |
| 25 to 29 Years | 64 (4.9%) | 33 (2.7%) |
| 30 to 34 Years | 57 (4.3%) | 57 (4.7%) |
| 35 to 39 Years | 73 (5.6%) | 55 (4.5%) |
| 40 to 44 Years | 70 (5.3%) | 107 (8.8%) |
| 45 to 49 Years | 109 (8.3%) | 105 (8.6%) |
| 50 to 54 Years | 80 (6.1%) | 59 (4.8%) |
| 55 to 59 Years | 79 (6.0%) | 98 (8.0%) |
| 60 to 64 Years | 95 (7.2%) | 85 (7.0%) |
| 65 to 69 Years | 108 (8.2%) | 86 (7.0%) |
| 70 to 74 Years | 105 (8.0%) | 81 (6.6%) |
| 75 to 79 Years | 24 (1.8%) | 25 (2.1%) |
| 80 to 84 Years | 16 (1.2%) | 34 (2.8%) |
| 85 Years and over | 35 (2.7%) | 43 (3.5%) |
| Total | 1,310 (100.0%) | 1,220 (100.0%) |
Families and Households in Rouses Point
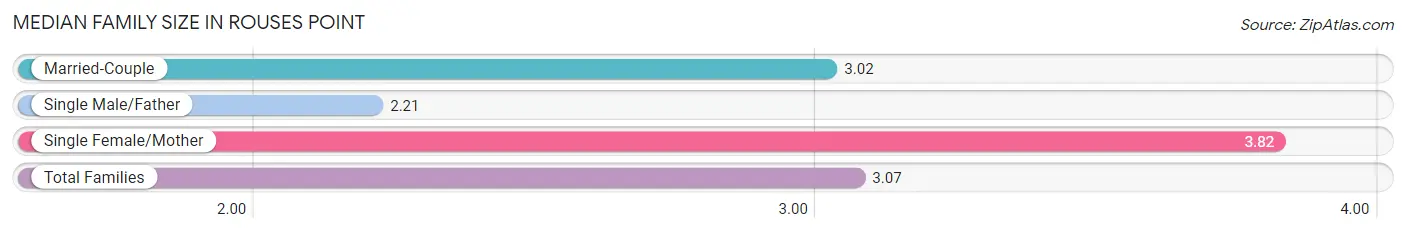
Median Family Size in Rouses Point
The median family size in Rouses Point is 3.07 persons per family, with single female/mother families (74 | 12.2%) accounting for the largest median family size of 3.82 persons per family. On the other hand, single male/father families (38 | 6.3%) represent the smallest median family size with 2.21 persons per family.
| Family Type | # Families | Family Size |
| Married-Couple | 494 (81.5%) | 3.02 |
| Single Male/Father | 38 (6.3%) | 2.21 |
| Single Female/Mother | 74 (12.2%) | 3.82 |
| Total Families | 606 (100.0%) | 3.07 |
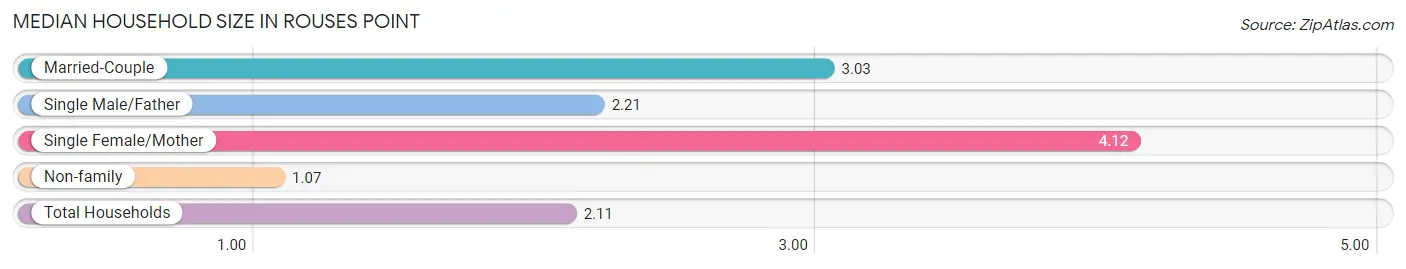
Median Household Size in Rouses Point
The median household size in Rouses Point is 2.11 persons per household, with single female/mother households (74 | 6.2%) accounting for the largest median household size of 4.12 persons per household. non-family households (585 | 49.1%) represent the smallest median household size with 1.07 persons per household.
| Household Type | # Households | Household Size |
| Married-Couple | 494 (41.5%) | 3.03 |
| Single Male/Father | 38 (3.2%) | 2.21 |
| Single Female/Mother | 74 (6.2%) | 4.12 |
| Non-family | 585 (49.1%) | 1.07 |
| Total Households | 1,191 (100.0%) | 2.11 |
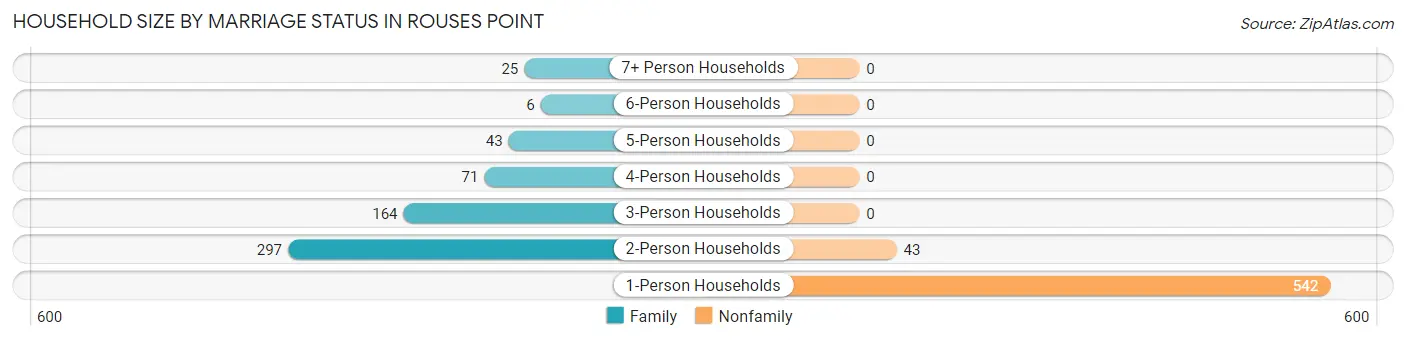
Household Size by Marriage Status in Rouses Point
Out of a total of 1,191 households in Rouses Point, 606 (50.9%) are family households, while 585 (49.1%) are nonfamily households. The most numerous type of family households are 2-person households, comprising 297, and the most common type of nonfamily households are 1-person households, comprising 542.
| Household Size | Family Households | Nonfamily Households |
| 1-Person Households | - | 542 (45.5%) |
| 2-Person Households | 297 (24.9%) | 43 (3.6%) |
| 3-Person Households | 164 (13.8%) | 0 (0.0%) |
| 4-Person Households | 71 (6.0%) | 0 (0.0%) |
| 5-Person Households | 43 (3.6%) | 0 (0.0%) |
| 6-Person Households | 6 (0.5%) | 0 (0.0%) |
| 7+ Person Households | 25 (2.1%) | 0 (0.0%) |
| Total | 606 (50.9%) | 585 (49.1%) |
Female Fertility in Rouses Point
Fertility by Age in Rouses Point
Average fertility rate in Rouses Point is 44.0 births per 1,000 women. Women in the age bracket of 20 to 34 years have the highest fertility rate with 61.0 births per 1,000 women. Women in the age bracket of 20 to 34 years acount for 52.4% of all women with births.
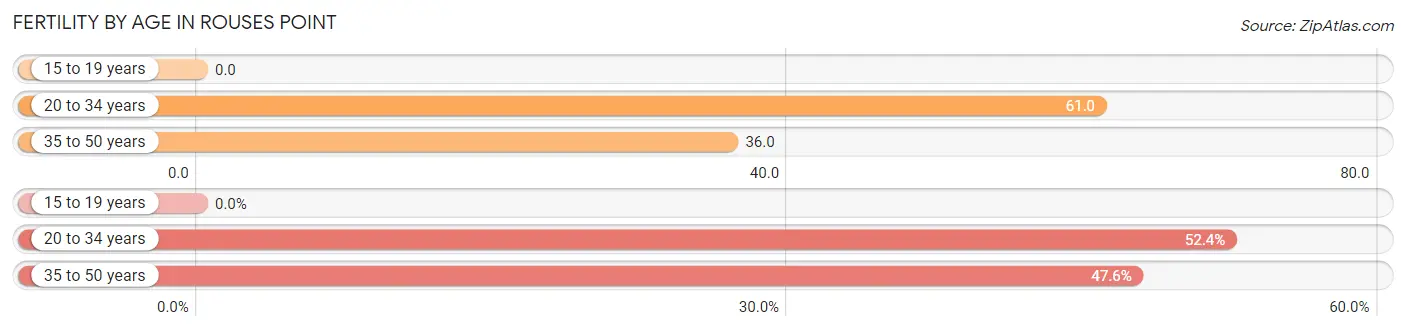
| Age Bracket | Women with Births | Births / 1,000 Women |
| 15 to 19 years | 0 (0.0%) | 0.0 |
| 20 to 34 years | 11 (52.4%) | 61.0 |
| 35 to 50 years | 10 (47.6%) | 36.0 |
| Total | 21 (100.0%) | 44.0 |
Fertility by Age by Marriage Status in Rouses Point
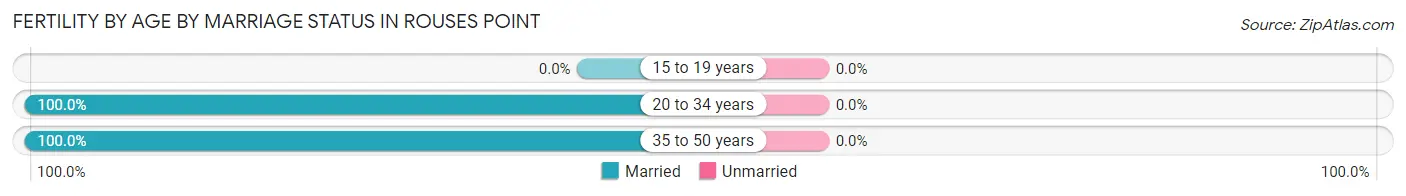
| Age Bracket | Married | Unmarried |
| 15 to 19 years | 0 (0.0%) | 0 (0.0%) |
| 20 to 34 years | 11 (100.0%) | 0 (0.0%) |
| 35 to 50 years | 10 (100.0%) | 0 (0.0%) |
| Total | 21 (100.0%) | 0 (0.0%) |
Fertility by Education in Rouses Point
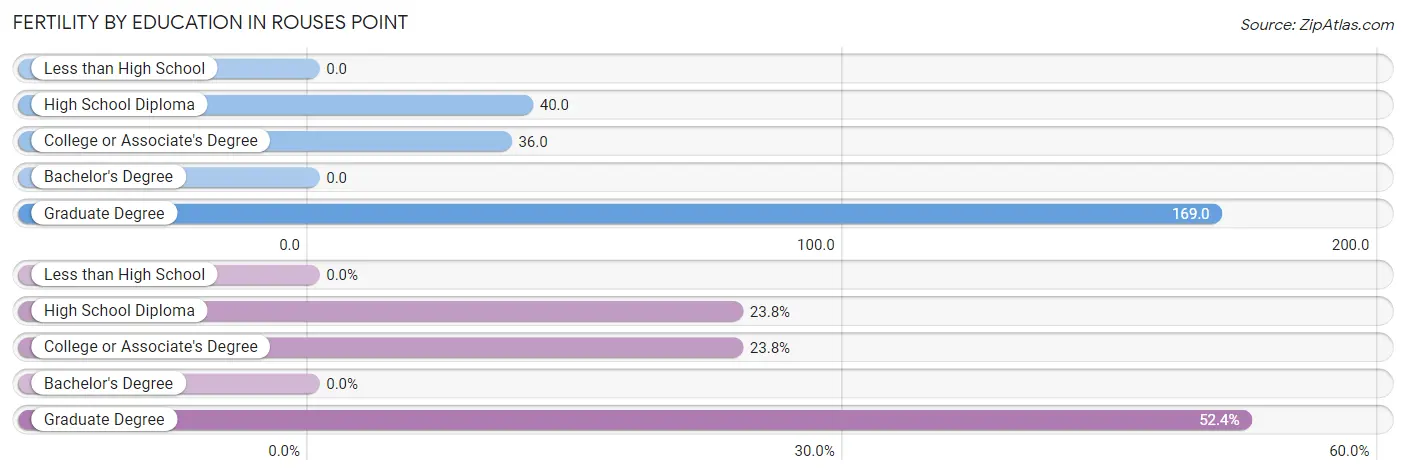
| Educational Attainment | Women with Births | Births / 1,000 Women |
| Less than High School | 0 (0.0%) | 0.0 |
| High School Diploma | 5 (23.8%) | 40.0 |
| College or Associate's Degree | 5 (23.8%) | 36.0 |
| Bachelor's Degree | 0 (0.0%) | 0.0 |
| Graduate Degree | 11 (52.4%) | 169.0 |
| Total | 21 (100.0%) | 44.0 |
Fertility by Education by Marriage Status in Rouses Point
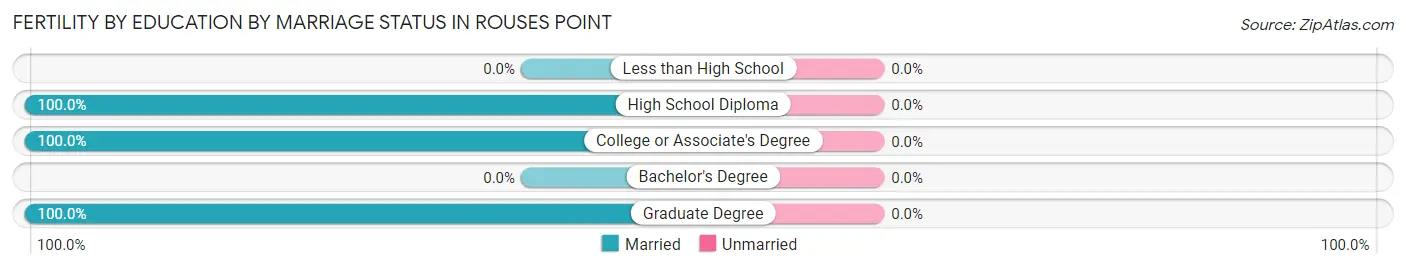
| Educational Attainment | Married | Unmarried |
| Less than High School | 0 (0.0%) | 0 (0.0%) |
| High School Diploma | 5 (100.0%) | 0 (0.0%) |
| College or Associate's Degree | 5 (100.0%) | 0 (0.0%) |
| Bachelor's Degree | 0 (0.0%) | 0 (0.0%) |
| Graduate Degree | 11 (100.0%) | 0 (0.0%) |
| Total | 21 (100.0%) | 0 (0.0%) |
Income in Rouses Point
Income Overview in Rouses Point
Per Capita Income in Rouses Point is $29,724, while median incomes of families and households are $74,318 and $45,542 respectively.
| Characteristic | Number | Measure |
| Per Capita Income | 2,530 | $29,724 |
| Median Family Income | 606 | $74,318 |
| Mean Family Income | 606 | $84,219 |
| Median Household Income | 1,191 | $45,542 |
| Mean Household Income | 1,191 | $62,486 |
| Income Deficit | 606 | $15,098 |
| Wage / Income Gap (%) | 2,530 | 19.47% |
| Wage / Income Gap ($) | 2,530 | 80.53¢ per $1 |
| Gini / Inequality Index | 2,530 | 0.49 |
Earnings by Sex in Rouses Point
Average Earnings in Rouses Point are $40,436, $42,115 for men and $33,917 for women, a difference of 19.5%.
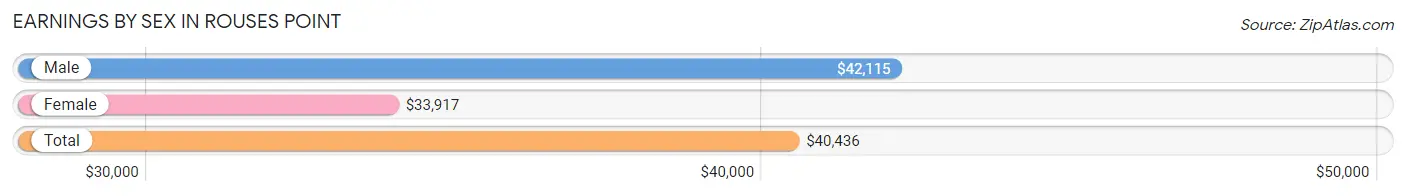
| Sex | Number | Average Earnings |
| Male | 638 (55.0%) | $42,115 |
| Female | 521 (45.0%) | $33,917 |
| Total | 1,159 (100.0%) | $40,436 |
Earnings by Sex by Income Bracket in Rouses Point
The most common earnings brackets in Rouses Point are $2,500 to $4,999 for men (109 | 17.1%) and $17,500 to $19,999 for women (78 | 15.0%).
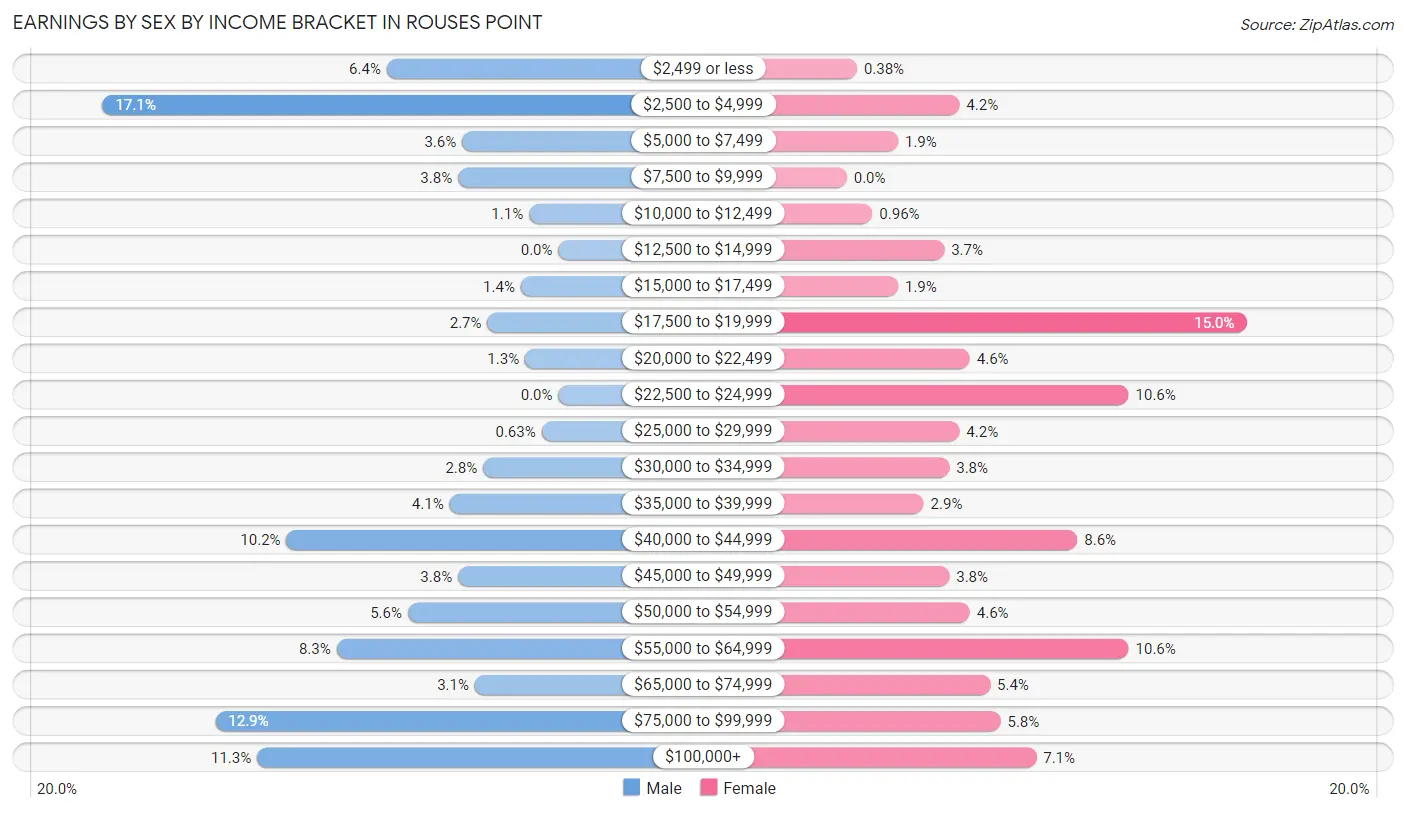
| Income | Male | Female |
| $2,499 or less | 41 (6.4%) | 2 (0.4%) |
| $2,500 to $4,999 | 109 (17.1%) | 22 (4.2%) |
| $5,000 to $7,499 | 23 (3.6%) | 10 (1.9%) |
| $7,500 to $9,999 | 24 (3.8%) | 0 (0.0%) |
| $10,000 to $12,499 | 7 (1.1%) | 5 (1.0%) |
| $12,500 to $14,999 | 0 (0.0%) | 19 (3.6%) |
| $15,000 to $17,499 | 9 (1.4%) | 10 (1.9%) |
| $17,500 to $19,999 | 17 (2.7%) | 78 (15.0%) |
| $20,000 to $22,499 | 8 (1.3%) | 24 (4.6%) |
| $22,500 to $24,999 | 0 (0.0%) | 55 (10.6%) |
| $25,000 to $29,999 | 4 (0.6%) | 22 (4.2%) |
| $30,000 to $34,999 | 18 (2.8%) | 20 (3.8%) |
| $35,000 to $39,999 | 26 (4.1%) | 15 (2.9%) |
| $40,000 to $44,999 | 65 (10.2%) | 45 (8.6%) |
| $45,000 to $49,999 | 24 (3.8%) | 20 (3.8%) |
| $50,000 to $54,999 | 36 (5.6%) | 24 (4.6%) |
| $55,000 to $64,999 | 53 (8.3%) | 55 (10.6%) |
| $65,000 to $74,999 | 20 (3.1%) | 28 (5.4%) |
| $75,000 to $99,999 | 82 (12.9%) | 30 (5.8%) |
| $100,000+ | 72 (11.3%) | 37 (7.1%) |
| Total | 638 (100.0%) | 521 (100.0%) |
Earnings by Sex by Educational Attainment in Rouses Point
Average earnings in Rouses Point are $49,688 for men and $41,667 for women, a difference of 16.1%. Men with an educational attainment of college or associate's degree enjoy the highest average annual earnings of $77,000, while those with less than high school education earn the least with $8,456. Women with an educational attainment of bachelor's degree earn the most with the average annual earnings of $66,458, while those with high school diploma education have the smallest earnings of $19,877.
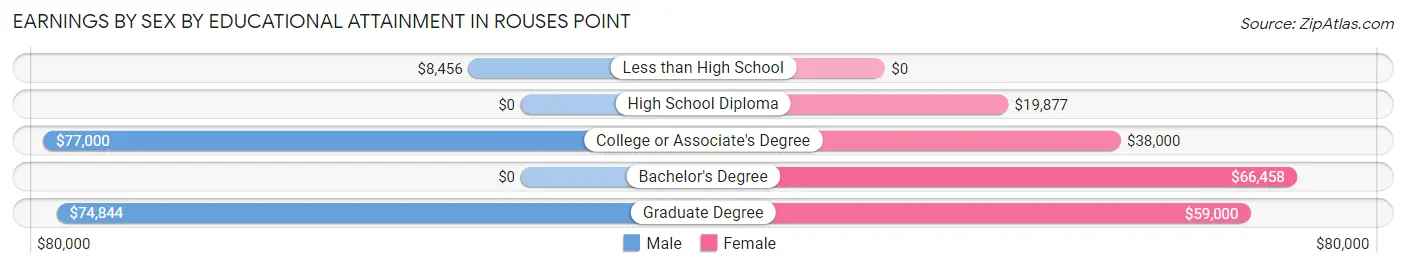
| Educational Attainment | Male Income | Female Income |
| Less than High School | $8,456 | $0 |
| High School Diploma | - | - |
| College or Associate's Degree | $77,000 | $38,000 |
| Bachelor's Degree | - | - |
| Graduate Degree | $74,844 | $59,000 |
| Total | $49,688 | $41,667 |
Family Income in Rouses Point
Family Income Brackets in Rouses Point
According to the Rouses Point family income data, there are 148 families falling into the $100,000 to $149,999 income range, which is the most common income bracket and makes up 24.4% of all families. Conversely, the $10,000 to $14,999 income bracket is the least frequent group with only 11 families (1.8%) belonging to this category.
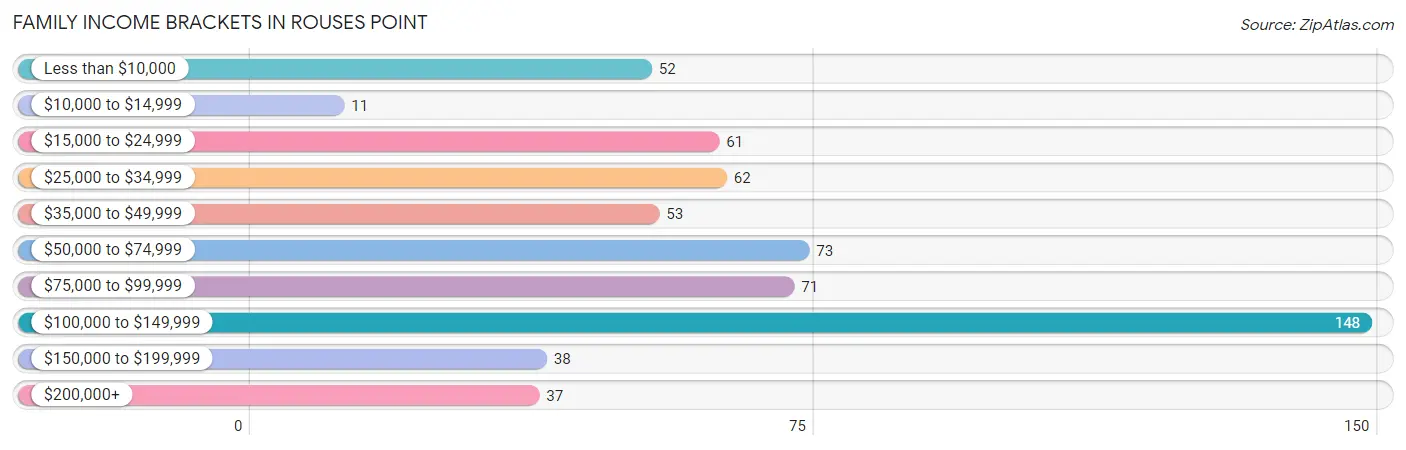
| Income Bracket | # Families | % Families |
| Less than $10,000 | 52 | 8.6% |
| $10,000 to $14,999 | 11 | 1.8% |
| $15,000 to $24,999 | 61 | 10.1% |
| $25,000 to $34,999 | 62 | 10.2% |
| $35,000 to $49,999 | 53 | 8.7% |
| $50,000 to $74,999 | 73 | 12.0% |
| $75,000 to $99,999 | 71 | 11.7% |
| $100,000 to $149,999 | 148 | 24.4% |
| $150,000 to $199,999 | 38 | 6.3% |
| $200,000+ | 37 | 6.1% |
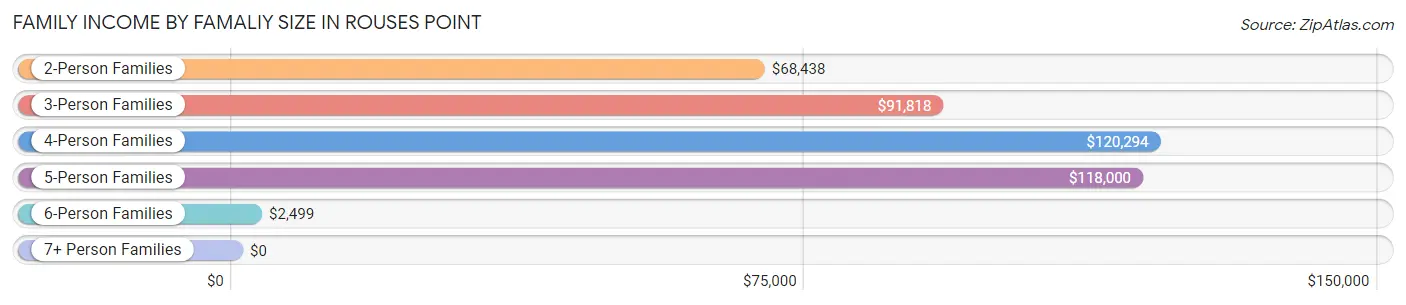
Family Income by Famaliy Size in Rouses Point
4-person families (72 | 11.9%) account for the highest median family income in Rouses Point with $120,294 per family, while 2-person families (299 | 49.3%) have the highest median income of $34,219 per family member.
| Income Bracket | # Families | Median Income |
| 2-Person Families | 299 (49.3%) | $68,438 |
| 3-Person Families | 162 (26.7%) | $91,818 |
| 4-Person Families | 72 (11.9%) | $120,294 |
| 5-Person Families | 42 (6.9%) | $118,000 |
| 6-Person Families | 23 (3.8%) | $2,499 |
| 7+ Person Families | 8 (1.3%) | $0 |
| Total | 606 (100.0%) | $74,318 |
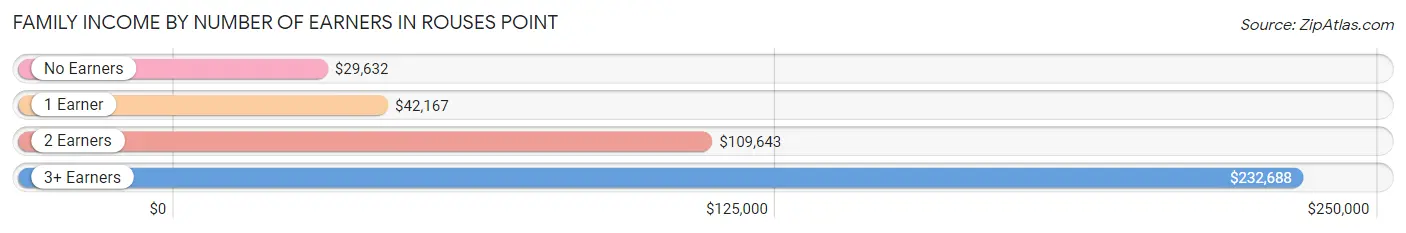
Family Income by Number of Earners in Rouses Point
The median family income in Rouses Point is $74,318, with families comprising 3+ earners (61) having the highest median family income of $232,688, while families with no earners (161) have the lowest median family income of $29,632, accounting for 10.1% and 26.6% of families, respectively.
| Number of Earners | # Families | Median Income |
| No Earners | 161 (26.6%) | $29,632 |
| 1 Earner | 212 (35.0%) | $42,167 |
| 2 Earners | 172 (28.4%) | $109,643 |
| 3+ Earners | 61 (10.1%) | $232,688 |
| Total | 606 (100.0%) | $74,318 |
Household Income in Rouses Point
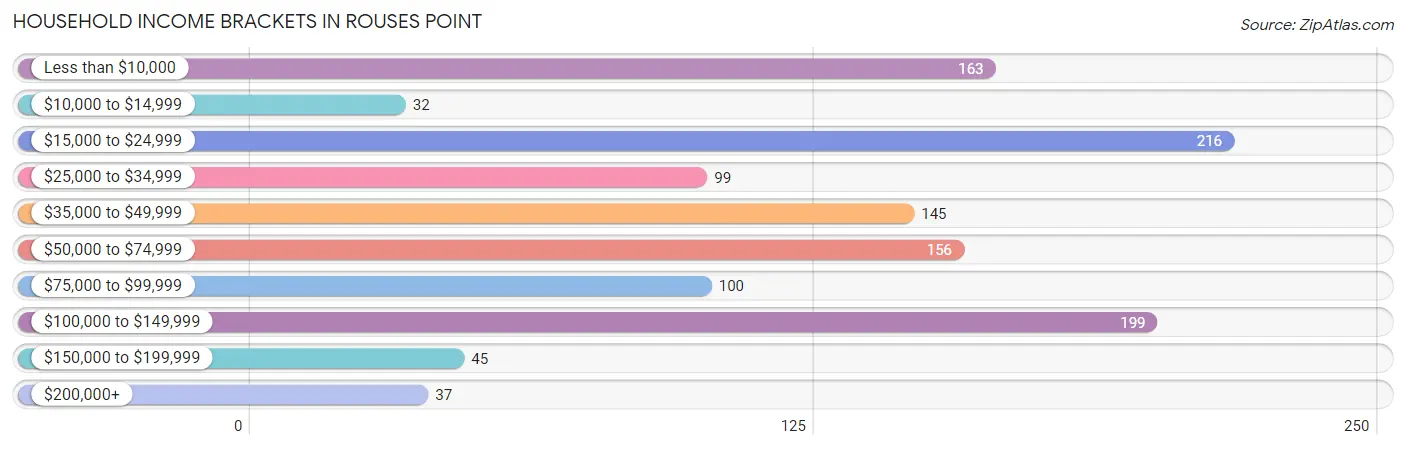
Household Income Brackets in Rouses Point
With 216 households falling in the category, the $15,000 to $24,999 income range is the most frequent in Rouses Point, accounting for 18.1% of all households. In contrast, only 32 households (2.7%) fall into the $10,000 to $14,999 income bracket, making it the least populous group.
| Income Bracket | # Households | % Households |
| Less than $10,000 | 163 | 13.7% |
| $10,000 to $14,999 | 32 | 2.7% |
| $15,000 to $24,999 | 216 | 18.1% |
| $25,000 to $34,999 | 99 | 8.3% |
| $35,000 to $49,999 | 145 | 12.2% |
| $50,000 to $74,999 | 156 | 13.1% |
| $75,000 to $99,999 | 100 | 8.4% |
| $100,000 to $149,999 | 199 | 16.7% |
| $150,000 to $199,999 | 45 | 3.8% |
| $200,000+ | 37 | 3.1% |
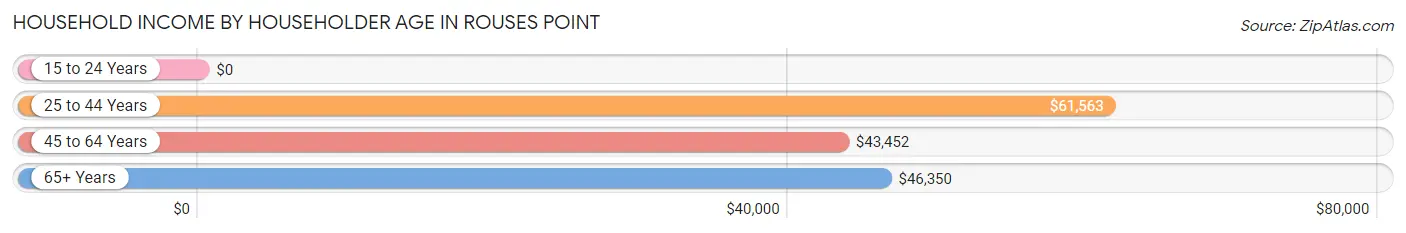
Household Income by Householder Age in Rouses Point
The median household income in Rouses Point is $45,542, with the highest median household income of $61,563 found in the 25 to 44 years age bracket for the primary householder. A total of 288 households (24.2%) fall into this category. Meanwhile, the 15 to 24 years age bracket for the primary householder has the lowest median household income of $0, with 82 households (6.9%) in this group.
| Income Bracket | # Households | Median Income |
| 15 to 24 Years | 82 (6.9%) | $0 |
| 25 to 44 Years | 288 (24.2%) | $61,563 |
| 45 to 64 Years | 418 (35.1%) | $43,452 |
| 65+ Years | 403 (33.8%) | $46,350 |
| Total | 1,191 (100.0%) | $45,542 |
Poverty in Rouses Point
Income Below Poverty by Sex and Age in Rouses Point
With 16.8% poverty level for males and 20.3% for females among the residents of Rouses Point, 12 to 14 year old males and 5 year old females are the most vulnerable to poverty, with 26 males (44.1%) and 22 females (100.0%) in their respective age groups living below the poverty level.
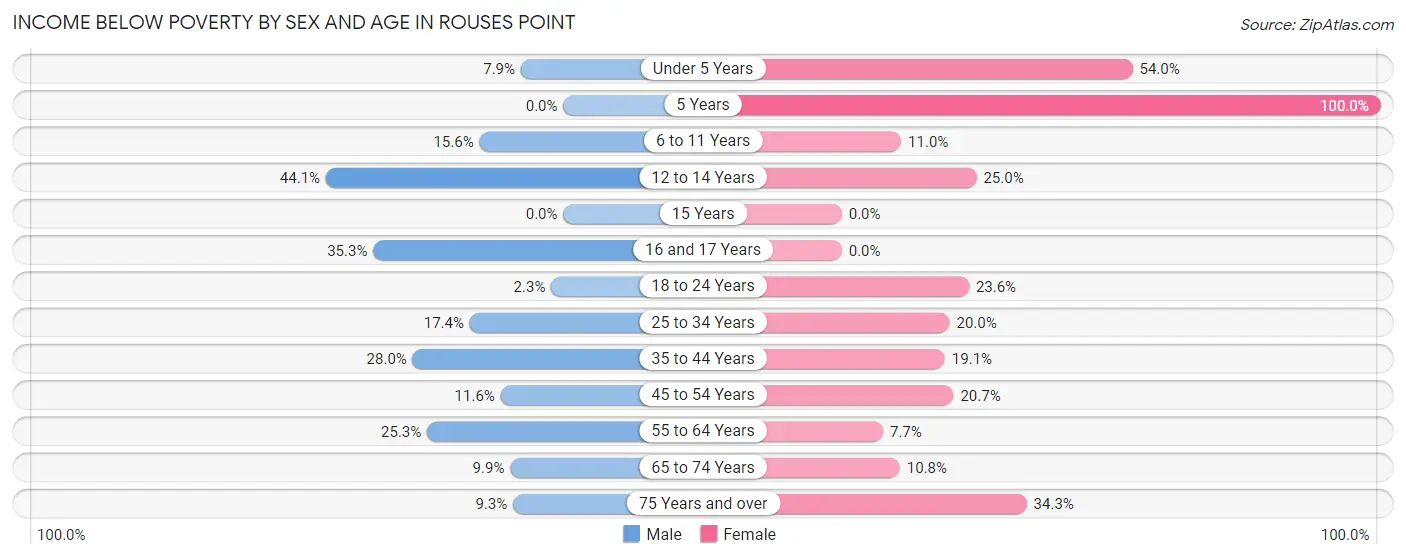
| Age Bracket | Male | Female |
| Under 5 Years | 6 (7.9%) | 34 (54.0%) |
| 5 Years | 0 (0.0%) | 22 (100.0%) |
| 6 to 11 Years | 19 (15.6%) | 14 (11.0%) |
| 12 to 14 Years | 26 (44.1%) | 6 (25.0%) |
| 15 Years | 0 (0.0%) | 0 (0.0%) |
| 16 and 17 Years | 12 (35.3%) | 0 (0.0%) |
| 18 to 24 Years | 2 (2.2%) | 21 (23.6%) |
| 25 to 34 Years | 21 (17.4%) | 18 (20.0%) |
| 35 to 44 Years | 40 (28.0%) | 31 (19.1%) |
| 45 to 54 Years | 22 (11.6%) | 34 (20.7%) |
| 55 to 64 Years | 44 (25.3%) | 14 (7.6%) |
| 65 to 74 Years | 21 (9.9%) | 18 (10.8%) |
| 75 Years and over | 7 (9.3%) | 35 (34.3%) |
| Total | 220 (16.8%) | 247 (20.3%) |
Income Above Poverty by Sex and Age in Rouses Point
According to the poverty statistics in Rouses Point, males aged 5 years and females aged 15 years are the age groups that are most secure financially, with 100.0% of males and 100.0% of females in these age groups living above the poverty line.
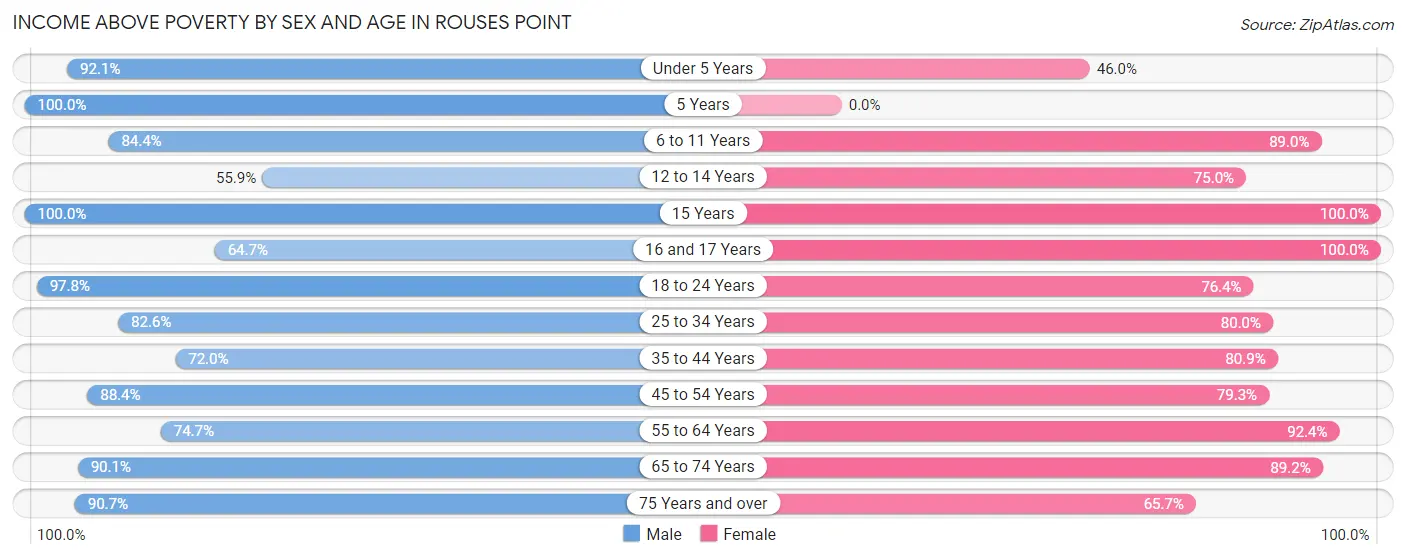
| Age Bracket | Male | Female |
| Under 5 Years | 70 (92.1%) | 29 (46.0%) |
| 5 Years | 8 (100.0%) | 0 (0.0%) |
| 6 to 11 Years | 103 (84.4%) | 113 (89.0%) |
| 12 to 14 Years | 33 (55.9%) | 18 (75.0%) |
| 15 Years | 7 (100.0%) | 11 (100.0%) |
| 16 and 17 Years | 22 (64.7%) | 16 (100.0%) |
| 18 to 24 Years | 87 (97.8%) | 68 (76.4%) |
| 25 to 34 Years | 100 (82.6%) | 72 (80.0%) |
| 35 to 44 Years | 103 (72.0%) | 131 (80.9%) |
| 45 to 54 Years | 167 (88.4%) | 130 (79.3%) |
| 55 to 64 Years | 130 (74.7%) | 169 (92.3%) |
| 65 to 74 Years | 192 (90.1%) | 149 (89.2%) |
| 75 Years and over | 68 (90.7%) | 67 (65.7%) |
| Total | 1,090 (83.2%) | 973 (79.7%) |
Income Below Poverty Among Married-Couple Families in Rouses Point
The poverty statistics for married-couple families in Rouses Point show that 11.7% or 58 of the total 494 families live below the poverty line. Families with no children have the highest poverty rate of 15.6%, comprising of 46 families. On the other hand, families with 5 or more children have the lowest poverty rate of 0.0%, which includes 0 families.
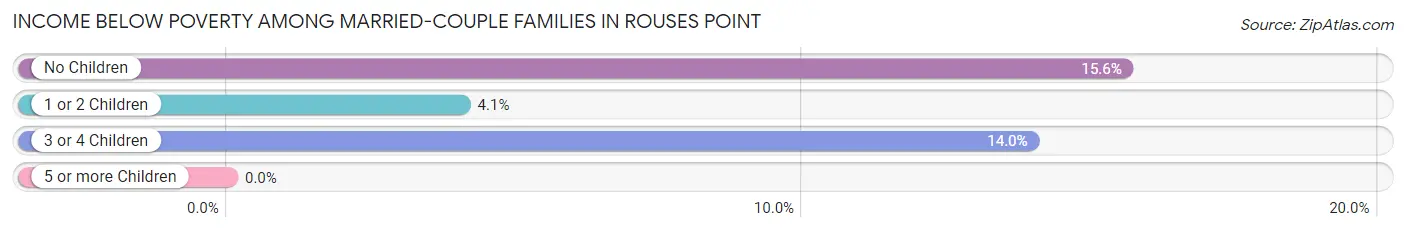
| Children | Above Poverty | Below Poverty |
| No Children | 249 (84.4%) | 46 (15.6%) |
| 1 or 2 Children | 142 (96.0%) | 6 (4.1%) |
| 3 or 4 Children | 37 (86.1%) | 6 (14.0%) |
| 5 or more Children | 8 (100.0%) | 0 (0.0%) |
| Total | 436 (88.3%) | 58 (11.7%) |
Income Below Poverty Among Single-Parent Households in Rouses Point
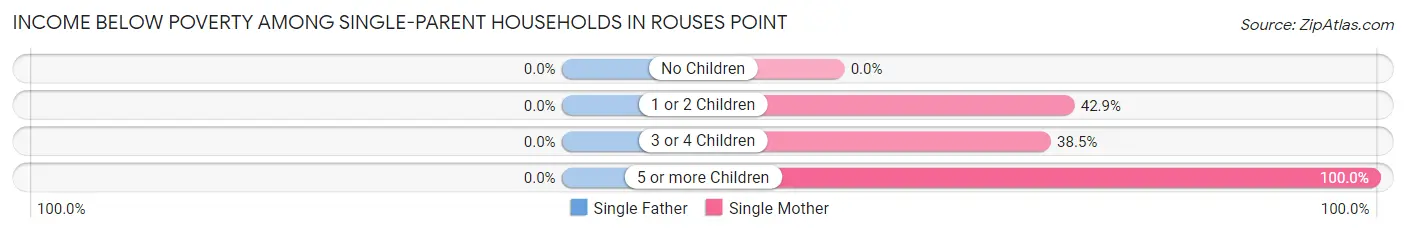
| Children | Single Father | Single Mother |
| No Children | 0 (0.0%) | 0 (0.0%) |
| 1 or 2 Children | 0 (0.0%) | 18 (42.9%) |
| 3 or 4 Children | 0 (0.0%) | 5 (38.5%) |
| 5 or more Children | 0 (0.0%) | 12 (100.0%) |
| Total | 0 (0.0%) | 35 (47.3%) |
Income Below Poverty Among Married-Couple vs Single-Parent Households in Rouses Point
The poverty data for Rouses Point shows that 58 of the married-couple family households (11.7%) and 35 of the single-parent households (31.2%) are living below the poverty level. Within the married-couple family households, those with no children have the highest poverty rate, with 46 households (15.6%) falling below the poverty line. Among the single-parent households, those with 5 or more children have the highest poverty rate, with 12 household (100.0%) living below poverty.
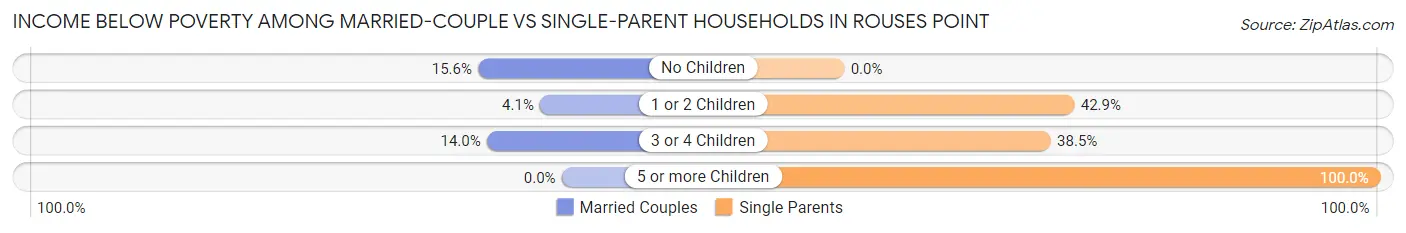
| Children | Married-Couple Families | Single-Parent Households |
| No Children | 46 (15.6%) | 0 (0.0%) |
| 1 or 2 Children | 6 (4.1%) | 18 (42.9%) |
| 3 or 4 Children | 6 (14.0%) | 5 (38.5%) |
| 5 or more Children | 0 (0.0%) | 12 (100.0%) |
| Total | 58 (11.7%) | 35 (31.2%) |
Employment Characteristics in Rouses Point
Employment by Class of Employer in Rouses Point
Among the 971 employed individuals in Rouses Point, private company employees (552 | 56.9%), federal government employees (127 | 13.1%), and local government employees (120 | 12.4%) make up the most common classes of employment.
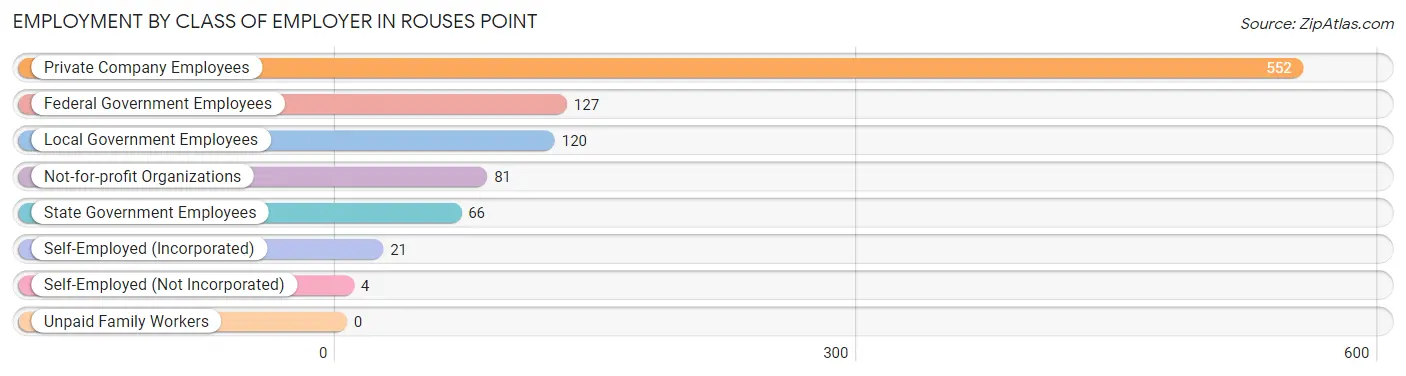
| Employer Class | # Employees | % Employees |
| Private Company Employees | 552 | 56.9% |
| Self-Employed (Incorporated) | 21 | 2.2% |
| Self-Employed (Not Incorporated) | 4 | 0.4% |
| Not-for-profit Organizations | 81 | 8.3% |
| Local Government Employees | 120 | 12.4% |
| State Government Employees | 66 | 6.8% |
| Federal Government Employees | 127 | 13.1% |
| Unpaid Family Workers | 0 | 0.0% |
| Total | 971 | 100.0% |
Employment Status by Age in Rouses Point
According to the labor force statistics for Rouses Point, out of the total population over 16 years of age (2,011), 56.4% or 1,134 individuals are in the labor force, with 5.6% or 64 of them unemployed. The age group with the highest labor force participation rate is 20 to 24 years, with 87.0% or 141 individuals in the labor force. Within the labor force, the 75 years and over age range has the highest percentage of unemployed individuals, with 63.6% or 7 of them being unemployed.
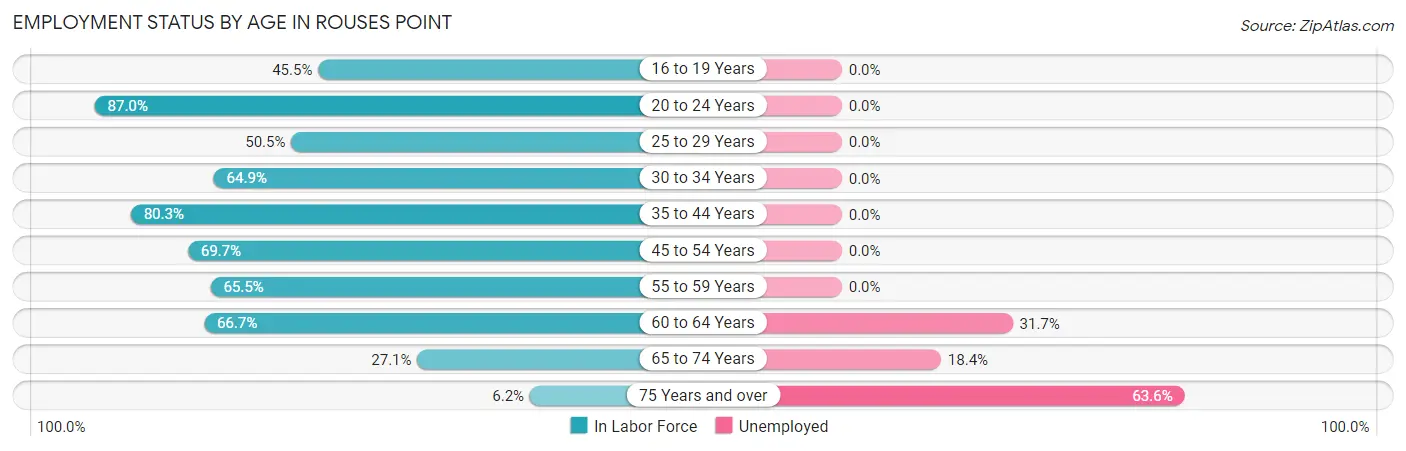
| Age Bracket | In Labor Force | Unemployed |
| 16 to 19 Years | 30 (45.5%) | 0 (0.0%) |
| 20 to 24 Years | 141 (87.0%) | 0 (0.0%) |
| 25 to 29 Years | 49 (50.5%) | 0 (0.0%) |
| 30 to 34 Years | 74 (64.9%) | 0 (0.0%) |
| 35 to 44 Years | 245 (80.3%) | 0 (0.0%) |
| 45 to 54 Years | 246 (69.7%) | 0 (0.0%) |
| 55 to 59 Years | 116 (65.5%) | 0 (0.0%) |
| 60 to 64 Years | 120 (66.7%) | 38 (31.7%) |
| 65 to 74 Years | 103 (27.1%) | 19 (18.4%) |
| 75 Years and over | 11 (6.2%) | 7 (63.6%) |
| Total | 1,134 (56.4%) | 64 (5.6%) |
Employment Status by Educational Attainment in Rouses Point
According to labor force statistics for Rouses Point, 69.3% of individuals (850) out of the total population between 25 and 64 years of age (1,226) are in the labor force, with 4.5% or 38 of them being unemployed. The group with the highest labor force participation rate are those with the educational attainment of college / associate degree, with 75.8% or 314 individuals in the labor force. Within the labor force, individuals with less than high school education have the highest percentage of unemployment, with 41.0% or 34 of them being unemployed.
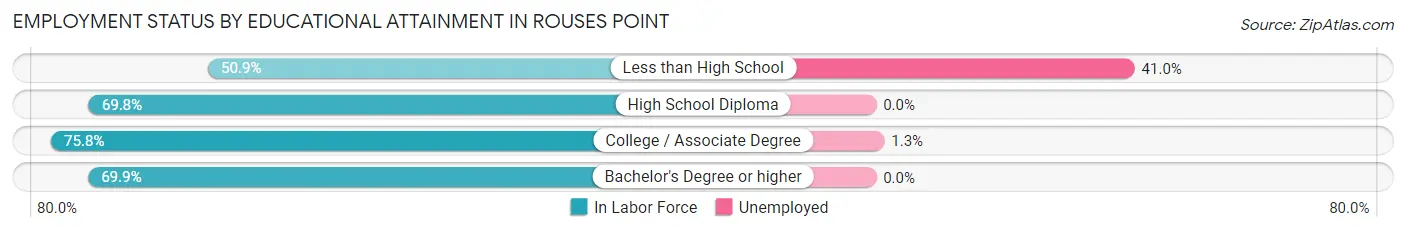
| Educational Attainment | In Labor Force | Unemployed |
| Less than High School | 83 (50.9%) | 67 (41.0%) |
| High School Diploma | 286 (69.8%) | 0 (0.0%) |
| College / Associate Degree | 314 (75.8%) | 5 (1.3%) |
| Bachelor's Degree or higher | 167 (69.9%) | 0 (0.0%) |
| Total | 850 (69.3%) | 55 (4.5%) |
Employment Occupations by Sex in Rouses Point
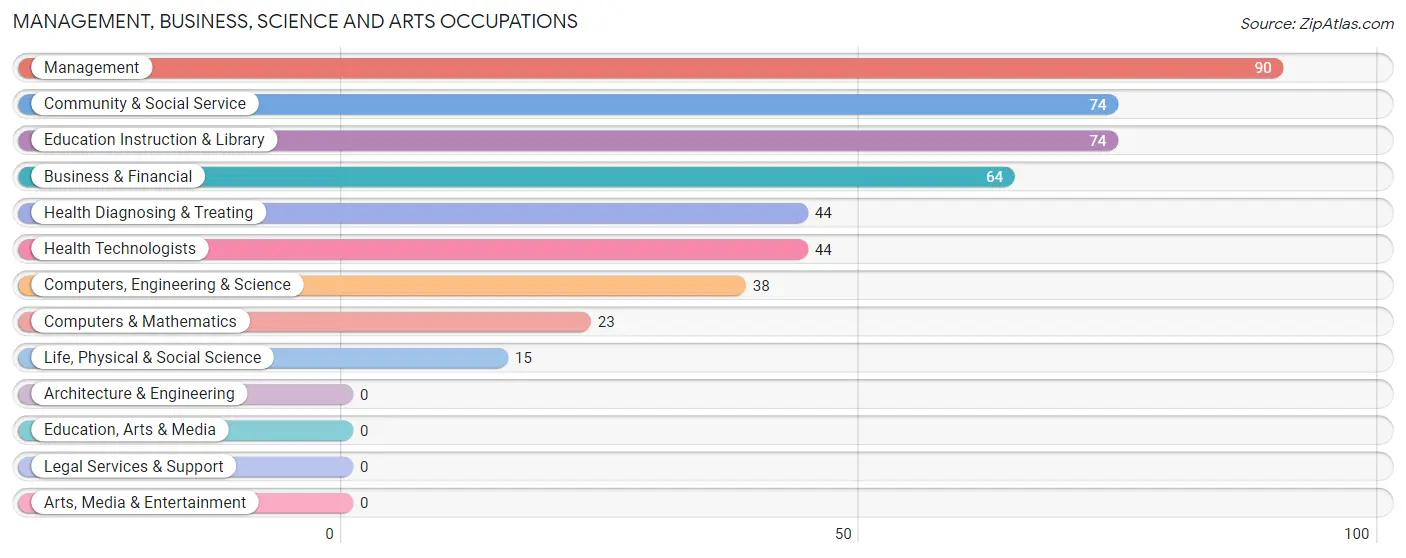
Management, Business, Science and Arts Occupations
The most common Management, Business, Science and Arts occupations in Rouses Point are Management (90 | 8.4%), Community & Social Service (74 | 6.9%), Education Instruction & Library (74 | 6.9%), Business & Financial (64 | 6.0%), and Health Diagnosing & Treating (44 | 4.1%).
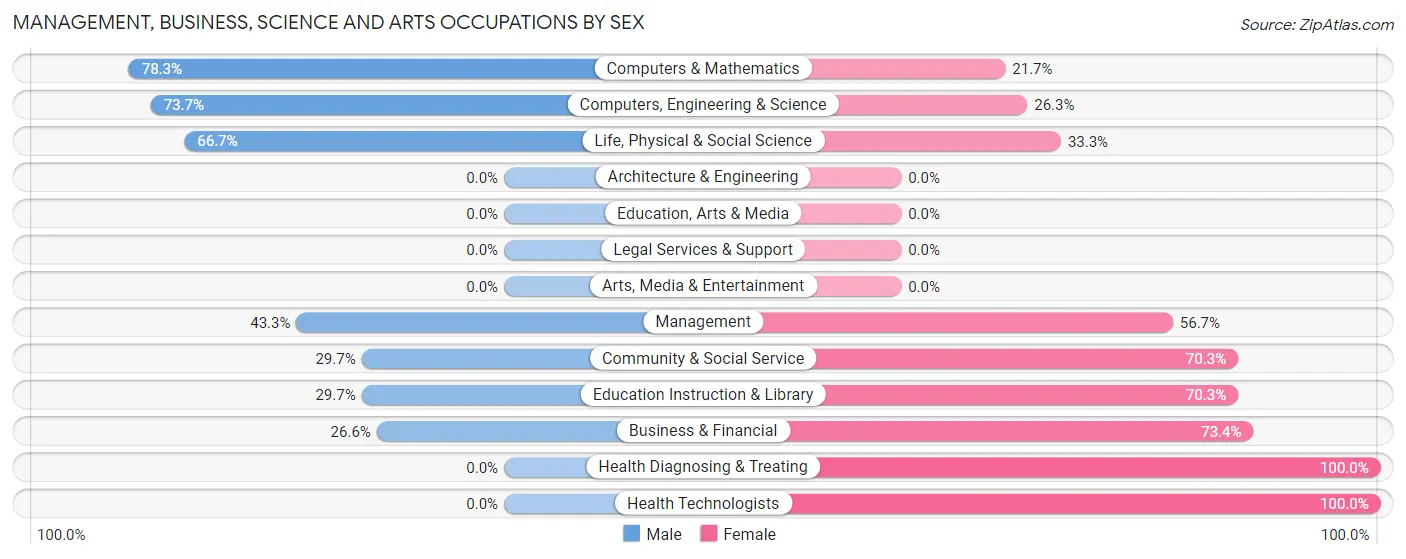
Management, Business, Science and Arts Occupations by Sex
Within the Management, Business, Science and Arts occupations in Rouses Point, the most male-oriented occupations are Computers & Mathematics (78.3%), Computers, Engineering & Science (73.7%), and Life, Physical & Social Science (66.7%), while the most female-oriented occupations are Health Diagnosing & Treating (100.0%), Health Technologists (100.0%), and Business & Financial (73.4%).
| Occupation | Male | Female |
| Management | 39 (43.3%) | 51 (56.7%) |
| Business & Financial | 17 (26.6%) | 47 (73.4%) |
| Computers, Engineering & Science | 28 (73.7%) | 10 (26.3%) |
| Computers & Mathematics | 18 (78.3%) | 5 (21.7%) |
| Architecture & Engineering | 0 (0.0%) | 0 (0.0%) |
| Life, Physical & Social Science | 10 (66.7%) | 5 (33.3%) |
| Community & Social Service | 22 (29.7%) | 52 (70.3%) |
| Education, Arts & Media | 0 (0.0%) | 0 (0.0%) |
| Legal Services & Support | 0 (0.0%) | 0 (0.0%) |
| Education Instruction & Library | 22 (29.7%) | 52 (70.3%) |
| Arts, Media & Entertainment | 0 (0.0%) | 0 (0.0%) |
| Health Diagnosing & Treating | 0 (0.0%) | 44 (100.0%) |
| Health Technologists | 0 (0.0%) | 44 (100.0%) |
| Total (Category) | 106 (34.2%) | 204 (65.8%) |
| Total (Overall) | 586 (54.7%) | 485 (45.3%) |
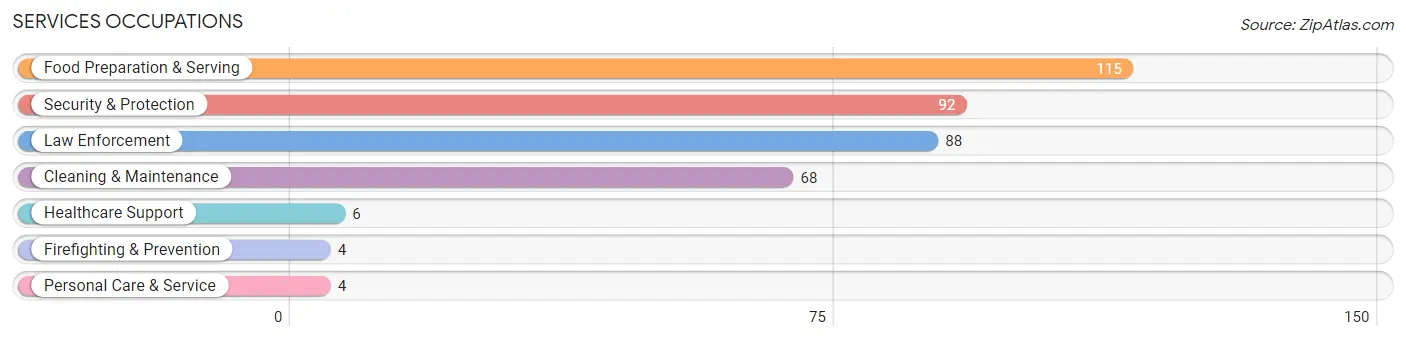
Services Occupations
The most common Services occupations in Rouses Point are Food Preparation & Serving (115 | 10.7%), Security & Protection (92 | 8.6%), Law Enforcement (88 | 8.2%), Cleaning & Maintenance (68 | 6.4%), and Healthcare Support (6 | 0.6%).
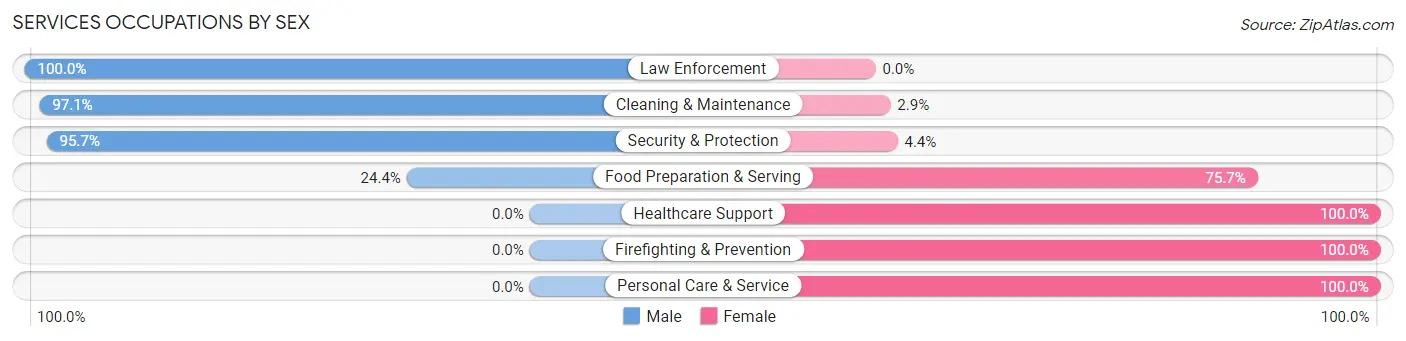
Services Occupations by Sex
Within the Services occupations in Rouses Point, the most male-oriented occupations are Law Enforcement (100.0%), Cleaning & Maintenance (97.1%), and Security & Protection (95.7%), while the most female-oriented occupations are Healthcare Support (100.0%), Firefighting & Prevention (100.0%), and Personal Care & Service (100.0%).
| Occupation | Male | Female |
| Healthcare Support | 0 (0.0%) | 6 (100.0%) |
| Security & Protection | 88 (95.7%) | 4 (4.3%) |
| Firefighting & Prevention | 0 (0.0%) | 4 (100.0%) |
| Law Enforcement | 88 (100.0%) | 0 (0.0%) |
| Food Preparation & Serving | 28 (24.3%) | 87 (75.6%) |
| Cleaning & Maintenance | 66 (97.1%) | 2 (2.9%) |
| Personal Care & Service | 0 (0.0%) | 4 (100.0%) |
| Total (Category) | 182 (63.9%) | 103 (36.1%) |
| Total (Overall) | 586 (54.7%) | 485 (45.3%) |
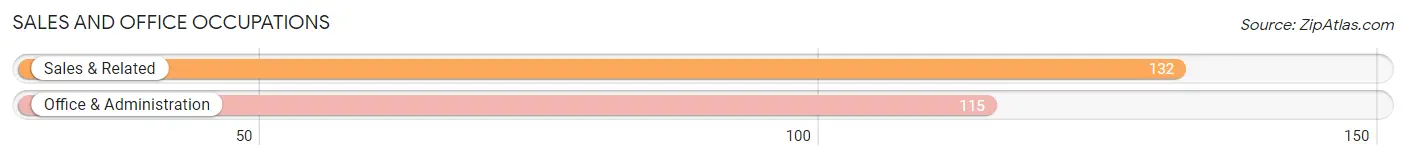
Sales and Office Occupations
The most common Sales and Office occupations in Rouses Point are Sales & Related (132 | 12.3%), and Office & Administration (115 | 10.7%).
Sales and Office Occupations by Sex
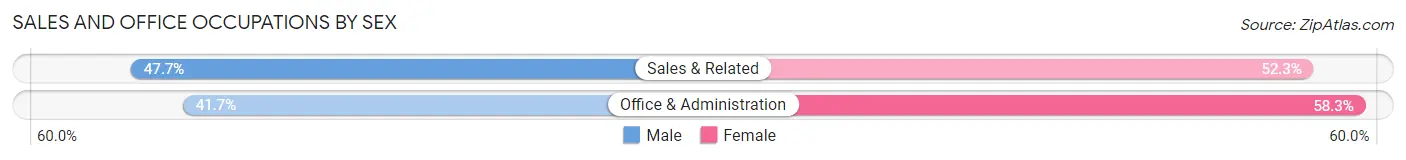
| Occupation | Male | Female |
| Sales & Related | 63 (47.7%) | 69 (52.3%) |
| Office & Administration | 48 (41.7%) | 67 (58.3%) |
| Total (Category) | 111 (44.9%) | 136 (55.1%) |
| Total (Overall) | 586 (54.7%) | 485 (45.3%) |
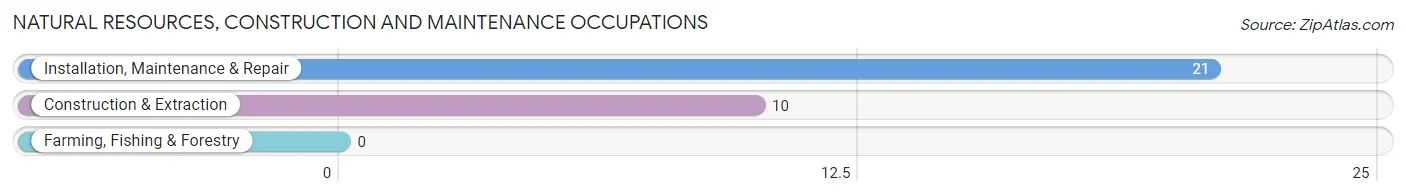
Natural Resources, Construction and Maintenance Occupations
The most common Natural Resources, Construction and Maintenance occupations in Rouses Point are Installation, Maintenance & Repair (21 | 2.0%), and Construction & Extraction (10 | 0.9%).
Natural Resources, Construction and Maintenance Occupations by Sex
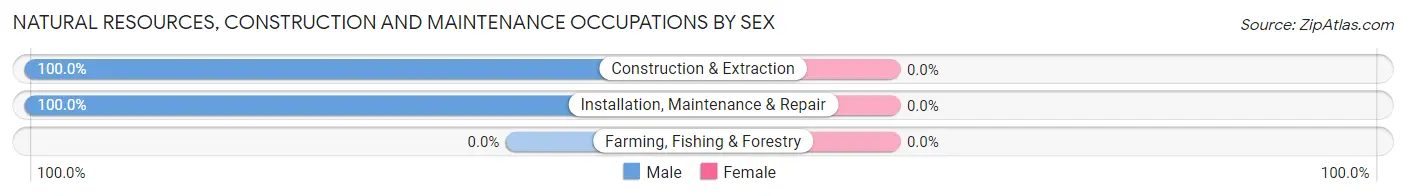
| Occupation | Male | Female |
| Farming, Fishing & Forestry | 0 (0.0%) | 0 (0.0%) |
| Construction & Extraction | 10 (100.0%) | 0 (0.0%) |
| Installation, Maintenance & Repair | 21 (100.0%) | 0 (0.0%) |
| Total (Category) | 31 (100.0%) | 0 (0.0%) |
| Total (Overall) | 586 (54.7%) | 485 (45.3%) |
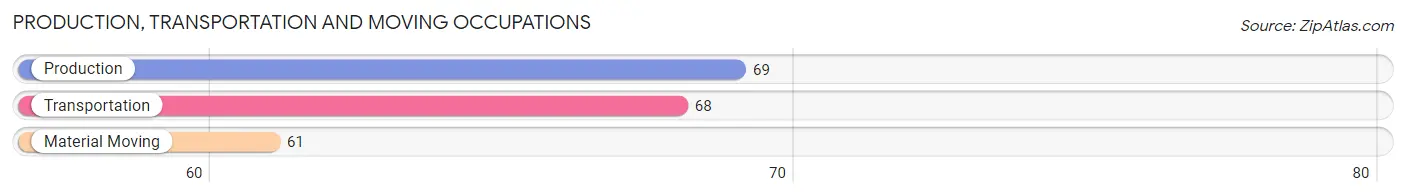
Production, Transportation and Moving Occupations
The most common Production, Transportation and Moving occupations in Rouses Point are Production (69 | 6.4%), Transportation (68 | 6.4%), and Material Moving (61 | 5.7%).
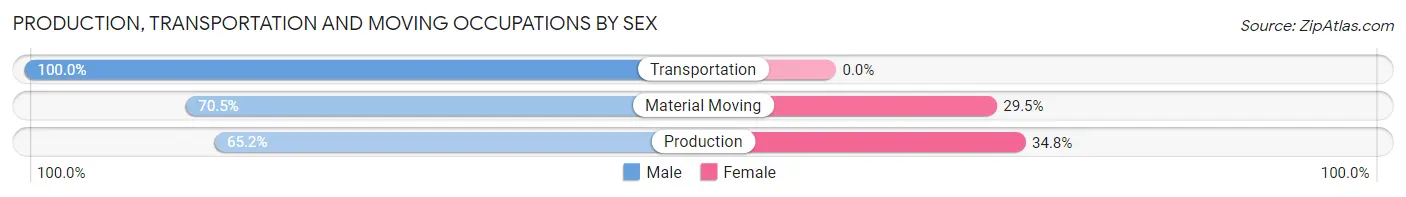
Production, Transportation and Moving Occupations by Sex
| Occupation | Male | Female |
| Production | 45 (65.2%) | 24 (34.8%) |
| Transportation | 68 (100.0%) | 0 (0.0%) |
| Material Moving | 43 (70.5%) | 18 (29.5%) |
| Total (Category) | 156 (78.8%) | 42 (21.2%) |
| Total (Overall) | 586 (54.7%) | 485 (45.3%) |
Employment Industries by Sex in Rouses Point
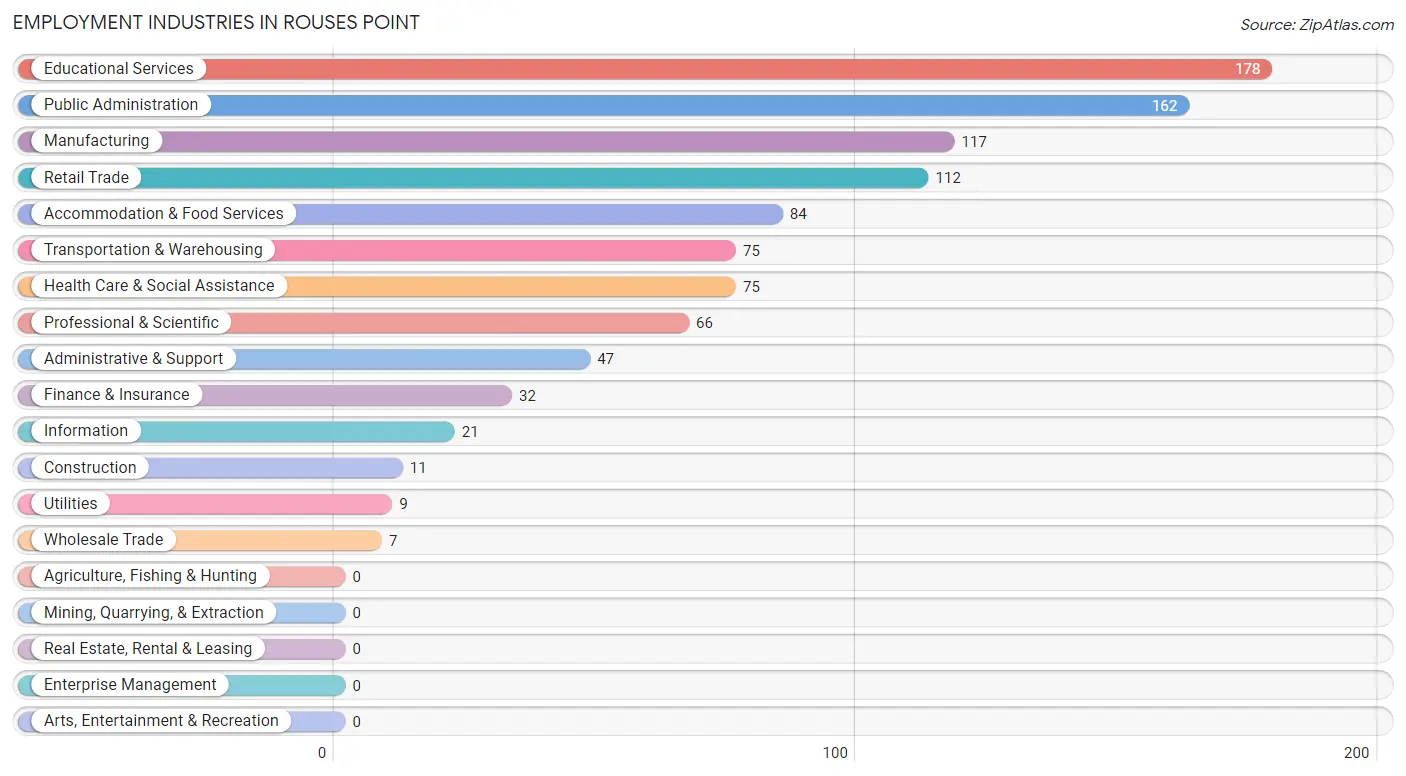
Employment Industries in Rouses Point
The major employment industries in Rouses Point include Educational Services (178 | 16.6%), Public Administration (162 | 15.1%), Manufacturing (117 | 10.9%), Retail Trade (112 | 10.5%), and Accommodation & Food Services (84 | 7.8%).
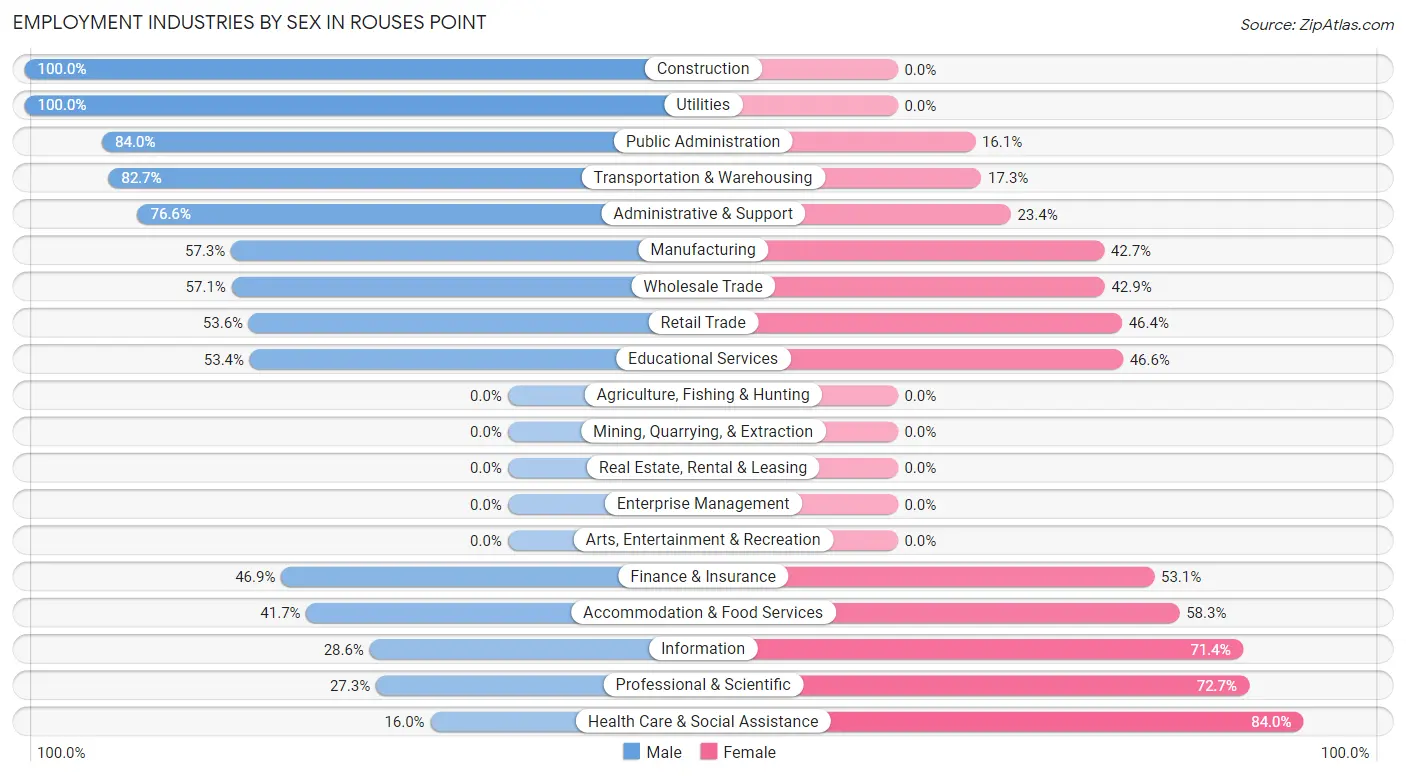
Employment Industries by Sex in Rouses Point
The Rouses Point industries that see more men than women are Construction (100.0%), Utilities (100.0%), and Public Administration (84.0%), whereas the industries that tend to have a higher number of women are Health Care & Social Assistance (84.0%), Professional & Scientific (72.7%), and Information (71.4%).
| Industry | Male | Female |
| Agriculture, Fishing & Hunting | 0 (0.0%) | 0 (0.0%) |
| Mining, Quarrying, & Extraction | 0 (0.0%) | 0 (0.0%) |
| Construction | 11 (100.0%) | 0 (0.0%) |
| Manufacturing | 67 (57.3%) | 50 (42.7%) |
| Wholesale Trade | 4 (57.1%) | 3 (42.9%) |
| Retail Trade | 60 (53.6%) | 52 (46.4%) |
| Transportation & Warehousing | 62 (82.7%) | 13 (17.3%) |
| Utilities | 9 (100.0%) | 0 (0.0%) |
| Information | 6 (28.6%) | 15 (71.4%) |
| Finance & Insurance | 15 (46.9%) | 17 (53.1%) |
| Real Estate, Rental & Leasing | 0 (0.0%) | 0 (0.0%) |
| Professional & Scientific | 18 (27.3%) | 48 (72.7%) |
| Enterprise Management | 0 (0.0%) | 0 (0.0%) |
| Administrative & Support | 36 (76.6%) | 11 (23.4%) |
| Educational Services | 95 (53.4%) | 83 (46.6%) |
| Health Care & Social Assistance | 12 (16.0%) | 63 (84.0%) |
| Arts, Entertainment & Recreation | 0 (0.0%) | 0 (0.0%) |
| Accommodation & Food Services | 35 (41.7%) | 49 (58.3%) |
| Public Administration | 136 (84.0%) | 26 (16.1%) |
| Total | 586 (54.7%) | 485 (45.3%) |
Education in Rouses Point
School Enrollment in Rouses Point
The most common levels of schooling among the 540 students in Rouses Point are middle school (182 | 33.7%), elementary school (131 | 24.3%), and high school (92 | 17.0%).
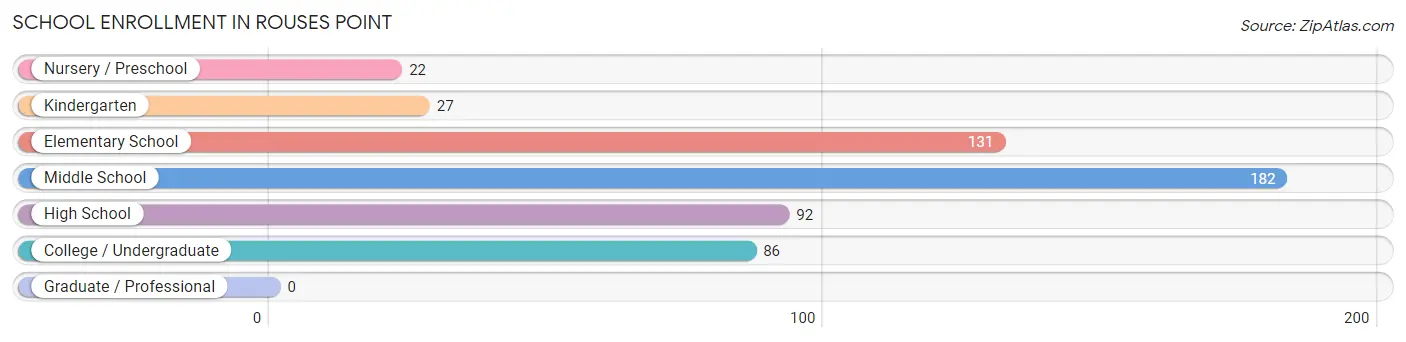
| School Level | # Students | % Students |
| Nursery / Preschool | 22 | 4.1% |
| Kindergarten | 27 | 5.0% |
| Elementary School | 131 | 24.3% |
| Middle School | 182 | 33.7% |
| High School | 92 | 17.0% |
| College / Undergraduate | 86 | 15.9% |
| Graduate / Professional | 0 | 0.0% |
| Total | 540 | 100.0% |
School Enrollment by Age by Funding Source in Rouses Point
Out of a total of 540 students who are enrolled in schools in Rouses Point, 77 (14.3%) attend a private institution, while the remaining 463 (85.7%) are enrolled in public schools. The age group of 3 to 4 year olds has the highest likelihood of being enrolled in private schools, with 7 (31.8% in the age bracket) enrolled. Conversely, the age group of 5 to 9 year old has the lowest likelihood of being enrolled in a private school, with 145 (100.0% in the age bracket) attending a public institution.
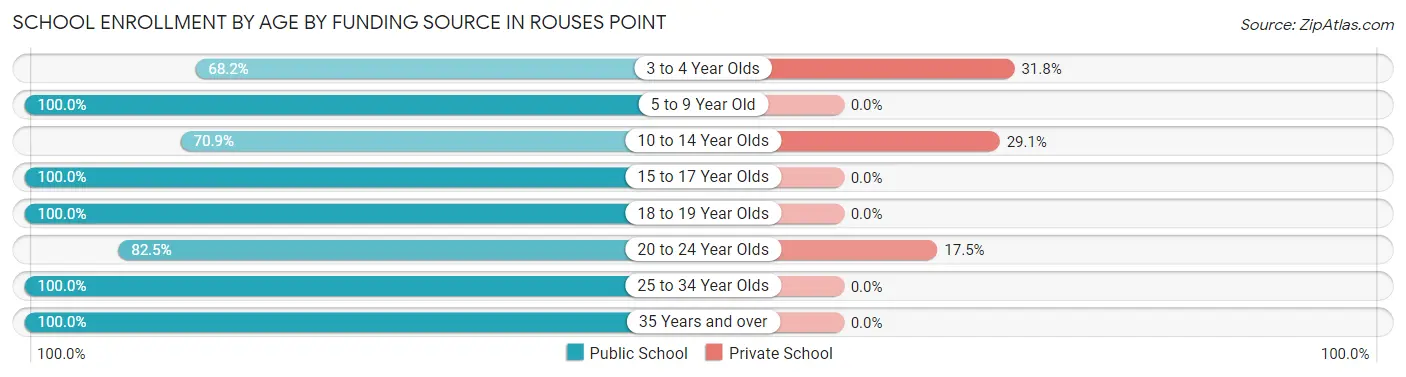
| Age Bracket | Public School | Private School |
| 3 to 4 Year Olds | 15 (68.2%) | 7 (31.8%) |
| 5 to 9 Year Old | 145 (100.0%) | 0 (0.0%) |
| 10 to 14 Year Olds | 144 (70.9%) | 59 (29.1%) |
| 15 to 17 Year Olds | 68 (100.0%) | 0 (0.0%) |
| 18 to 19 Year Olds | 16 (100.0%) | 0 (0.0%) |
| 20 to 24 Year Olds | 52 (82.5%) | 11 (17.5%) |
| 25 to 34 Year Olds | 10 (100.0%) | 0 (0.0%) |
| 35 Years and over | 13 (100.0%) | 0 (0.0%) |
| Total | 463 (85.7%) | 77 (14.3%) |
Educational Attainment by Field of Study in Rouses Point
Education (89 | 23.2%), science & technology (68 | 17.7%), business (38 | 9.9%), social sciences (32 | 8.3%), and psychology (30 | 7.8%) are the most common fields of study among 384 individuals in Rouses Point who have obtained a bachelor's degree or higher.
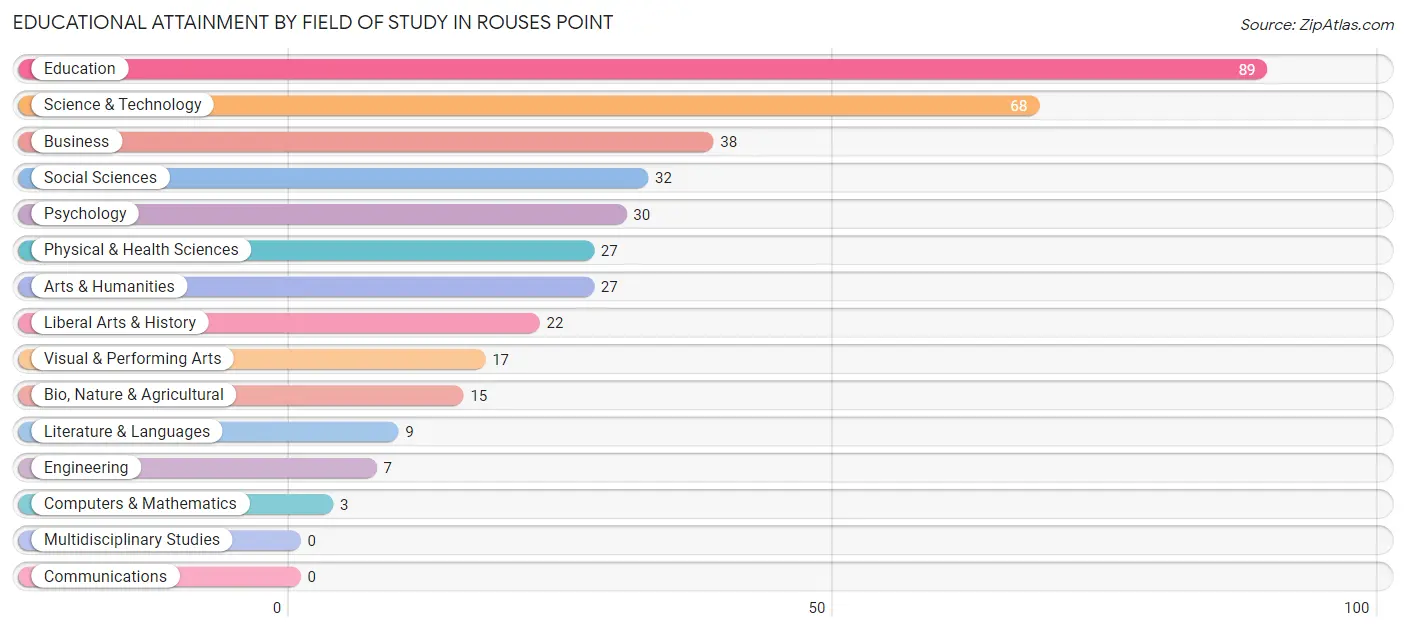
| Field of Study | # Graduates | % Graduates |
| Computers & Mathematics | 3 | 0.8% |
| Bio, Nature & Agricultural | 15 | 3.9% |
| Physical & Health Sciences | 27 | 7.0% |
| Psychology | 30 | 7.8% |
| Social Sciences | 32 | 8.3% |
| Engineering | 7 | 1.8% |
| Multidisciplinary Studies | 0 | 0.0% |
| Science & Technology | 68 | 17.7% |
| Business | 38 | 9.9% |
| Education | 89 | 23.2% |
| Literature & Languages | 9 | 2.3% |
| Liberal Arts & History | 22 | 5.7% |
| Visual & Performing Arts | 17 | 4.4% |
| Communications | 0 | 0.0% |
| Arts & Humanities | 27 | 7.0% |
| Total | 384 | 100.0% |
Transportation & Commute in Rouses Point
Vehicle Availability by Sex in Rouses Point
The most prevalent vehicle ownership categories in Rouses Point are males with 2 vehicles (194, accounting for 39.8%) and females with 2 vehicles (136, making up 40.2%).
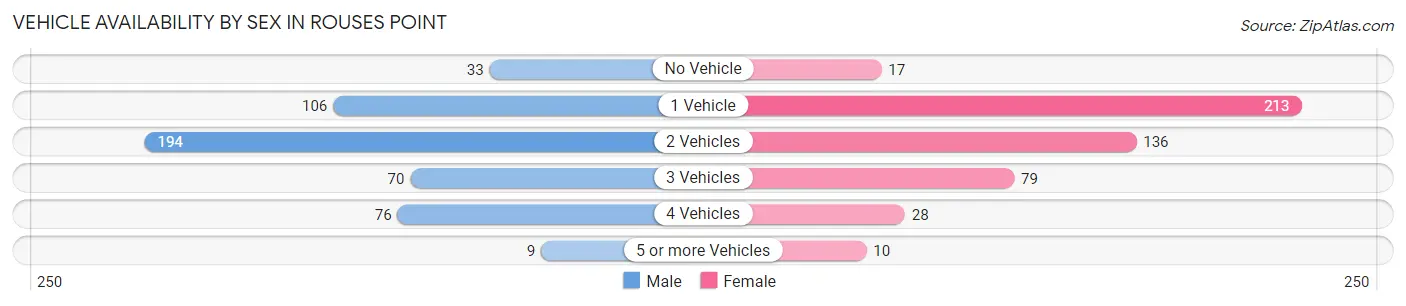
| Vehicles Available | Male | Female |
| No Vehicle | 33 (6.8%) | 17 (3.5%) |
| 1 Vehicle | 106 (21.7%) | 213 (44.1%) |
| 2 Vehicles | 194 (39.8%) | 136 (28.2%) |
| 3 Vehicles | 70 (14.3%) | 79 (16.4%) |
| 4 Vehicles | 76 (15.6%) | 28 (5.8%) |
| 5 or more Vehicles | 9 (1.8%) | 10 (2.1%) |
| Total | 488 (100.0%) | 483 (100.0%) |
Commute Time in Rouses Point
The most frequently occuring commute durations in Rouses Point are 30 to 34 minutes (207 commuters, 23.3%), 5 to 9 minutes (172 commuters, 19.4%), and 10 to 14 minutes (155 commuters, 17.4%).
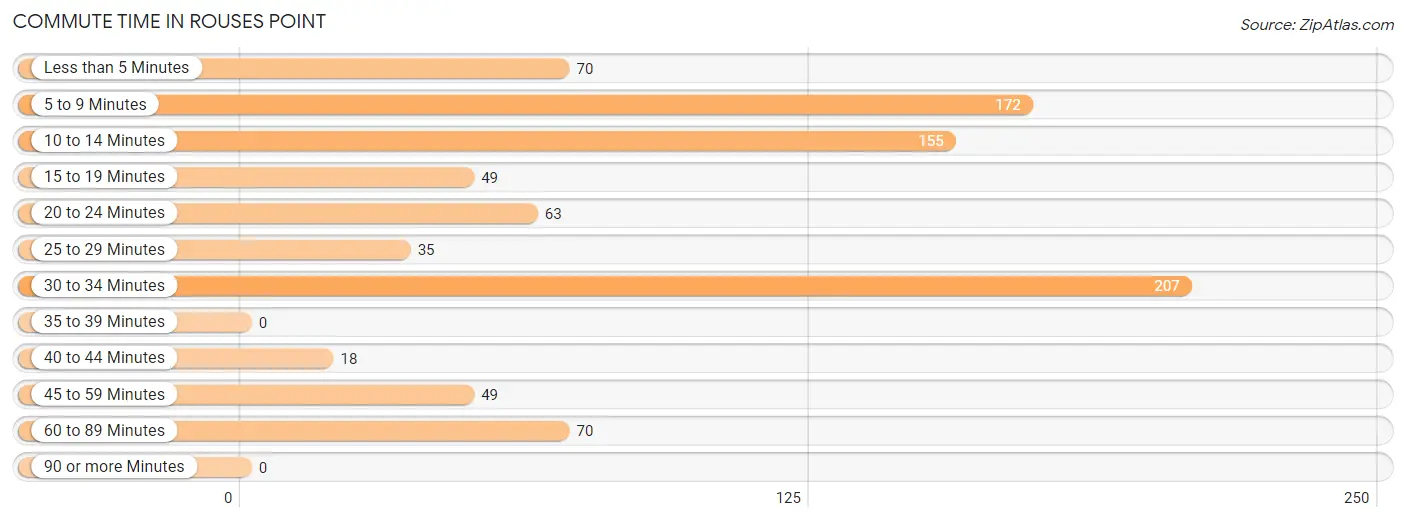
| Commute Time | # Commuters | % Commuters |
| Less than 5 Minutes | 70 | 7.9% |
| 5 to 9 Minutes | 172 | 19.4% |
| 10 to 14 Minutes | 155 | 17.4% |
| 15 to 19 Minutes | 49 | 5.5% |
| 20 to 24 Minutes | 63 | 7.1% |
| 25 to 29 Minutes | 35 | 3.9% |
| 30 to 34 Minutes | 207 | 23.3% |
| 35 to 39 Minutes | 0 | 0.0% |
| 40 to 44 Minutes | 18 | 2.0% |
| 45 to 59 Minutes | 49 | 5.5% |
| 60 to 89 Minutes | 70 | 7.9% |
| 90 or more Minutes | 0 | 0.0% |
Commute Time by Sex in Rouses Point
The most common commute times in Rouses Point are 10 to 14 minutes (118 commuters, 25.8%) for males and 30 to 34 minutes (137 commuters, 31.8%) for females.
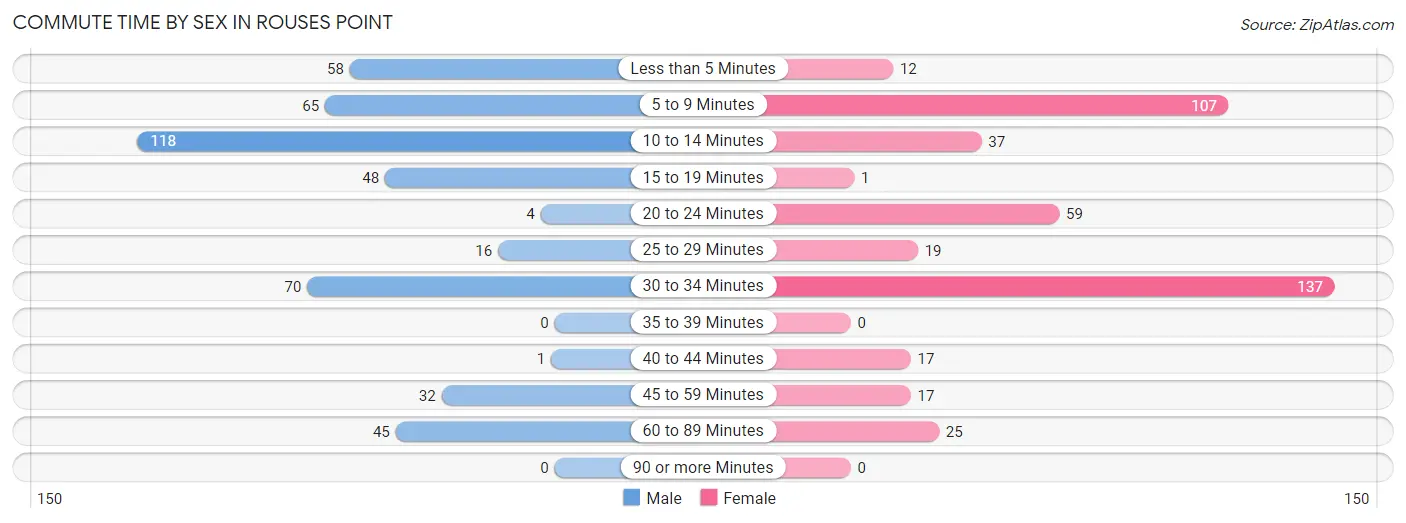
| Commute Time | Male | Female |
| Less than 5 Minutes | 58 (12.7%) | 12 (2.8%) |
| 5 to 9 Minutes | 65 (14.2%) | 107 (24.8%) |
| 10 to 14 Minutes | 118 (25.8%) | 37 (8.6%) |
| 15 to 19 Minutes | 48 (10.5%) | 1 (0.2%) |
| 20 to 24 Minutes | 4 (0.9%) | 59 (13.7%) |
| 25 to 29 Minutes | 16 (3.5%) | 19 (4.4%) |
| 30 to 34 Minutes | 70 (15.3%) | 137 (31.8%) |
| 35 to 39 Minutes | 0 (0.0%) | 0 (0.0%) |
| 40 to 44 Minutes | 1 (0.2%) | 17 (3.9%) |
| 45 to 59 Minutes | 32 (7.0%) | 17 (3.9%) |
| 60 to 89 Minutes | 45 (9.9%) | 25 (5.8%) |
| 90 or more Minutes | 0 (0.0%) | 0 (0.0%) |
Time of Departure to Work by Sex in Rouses Point
The most frequent times of departure to work in Rouses Point are 12:00 PM to 3:59 PM (92, 20.1%) for males and 7:30 AM to 7:59 AM (91, 21.1%) for females.
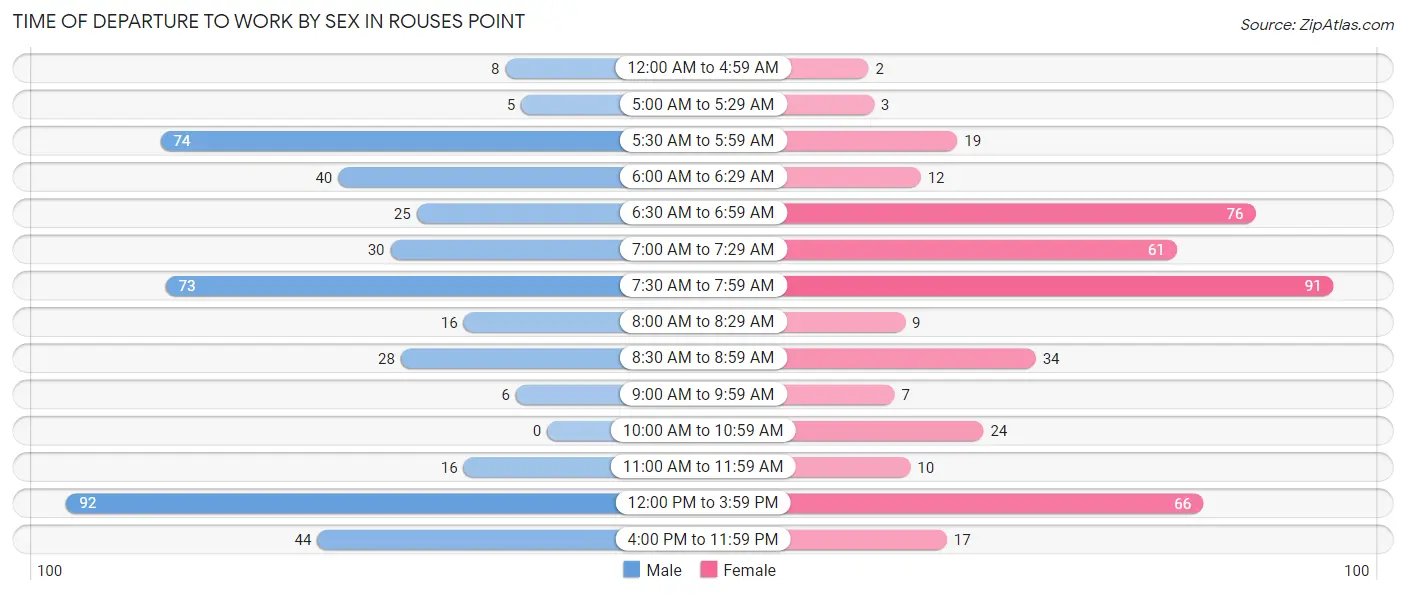
| Time of Departure | Male | Female |
| 12:00 AM to 4:59 AM | 8 (1.8%) | 2 (0.5%) |
| 5:00 AM to 5:29 AM | 5 (1.1%) | 3 (0.7%) |
| 5:30 AM to 5:59 AM | 74 (16.2%) | 19 (4.4%) |
| 6:00 AM to 6:29 AM | 40 (8.7%) | 12 (2.8%) |
| 6:30 AM to 6:59 AM | 25 (5.5%) | 76 (17.6%) |
| 7:00 AM to 7:29 AM | 30 (6.6%) | 61 (14.1%) |
| 7:30 AM to 7:59 AM | 73 (16.0%) | 91 (21.1%) |
| 8:00 AM to 8:29 AM | 16 (3.5%) | 9 (2.1%) |
| 8:30 AM to 8:59 AM | 28 (6.1%) | 34 (7.9%) |
| 9:00 AM to 9:59 AM | 6 (1.3%) | 7 (1.6%) |
| 10:00 AM to 10:59 AM | 0 (0.0%) | 24 (5.6%) |
| 11:00 AM to 11:59 AM | 16 (3.5%) | 10 (2.3%) |
| 12:00 PM to 3:59 PM | 92 (20.1%) | 66 (15.3%) |
| 4:00 PM to 11:59 PM | 44 (9.6%) | 17 (3.9%) |
| Total | 457 (100.0%) | 431 (100.0%) |
Housing Occupancy in Rouses Point
Occupancy by Ownership in Rouses Point
Of the total 1,191 dwellings in Rouses Point, owner-occupied units account for 640 (53.7%), while renter-occupied units make up 551 (46.3%).
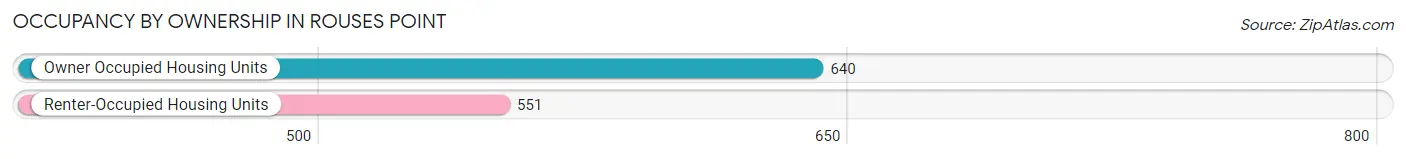
| Occupancy | # Housing Units | % Housing Units |
| Owner Occupied Housing Units | 640 | 53.7% |
| Renter-Occupied Housing Units | 551 | 46.3% |
| Total Occupied Housing Units | 1,191 | 100.0% |
Occupancy by Household Size in Rouses Point
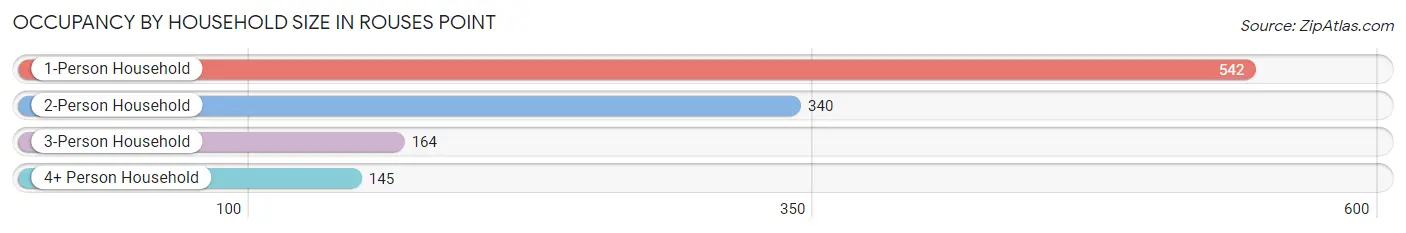
| Household Size | # Housing Units | % Housing Units |
| 1-Person Household | 542 | 45.5% |
| 2-Person Household | 340 | 28.5% |
| 3-Person Household | 164 | 13.8% |
| 4+ Person Household | 145 | 12.2% |
| Total Housing Units | 1,191 | 100.0% |
Occupancy by Ownership by Household Size in Rouses Point
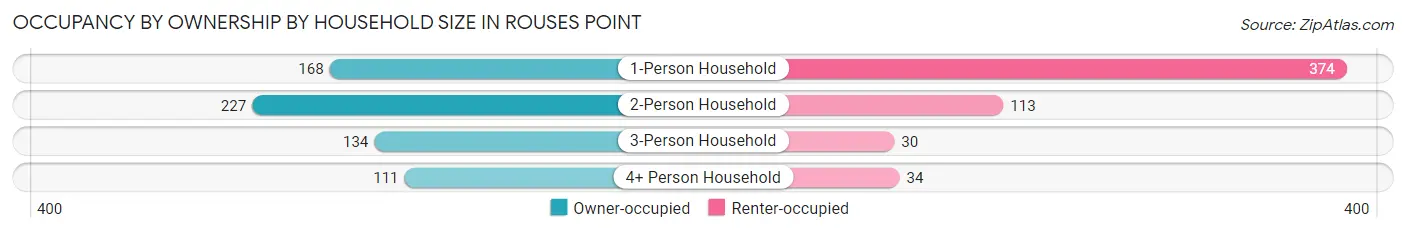
| Household Size | Owner-occupied | Renter-occupied |
| 1-Person Household | 168 (31.0%) | 374 (69.0%) |
| 2-Person Household | 227 (66.8%) | 113 (33.2%) |
| 3-Person Household | 134 (81.7%) | 30 (18.3%) |
| 4+ Person Household | 111 (76.5%) | 34 (23.4%) |
| Total Housing Units | 640 (53.7%) | 551 (46.3%) |
Occupancy by Educational Attainment in Rouses Point
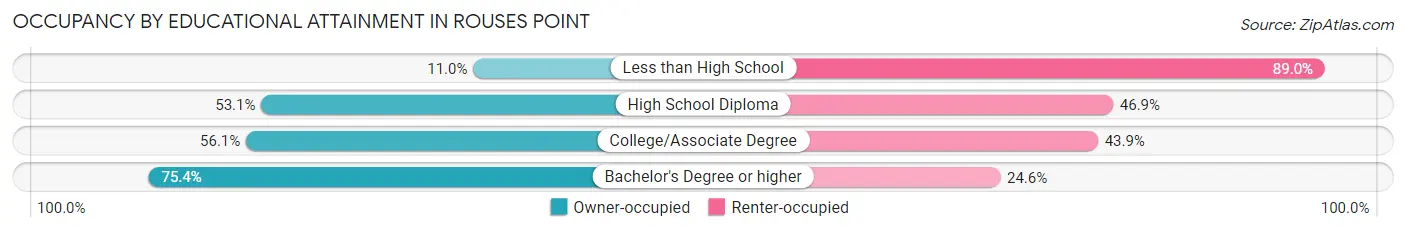
| Household Size | Owner-occupied | Renter-occupied |
| Less than High School | 17 (11.0%) | 137 (89.0%) |
| High School Diploma | 242 (53.1%) | 214 (46.9%) |
| College/Associate Degree | 166 (56.1%) | 130 (43.9%) |
| Bachelor's Degree or higher | 215 (75.4%) | 70 (24.6%) |
Occupancy by Age of Householder in Rouses Point
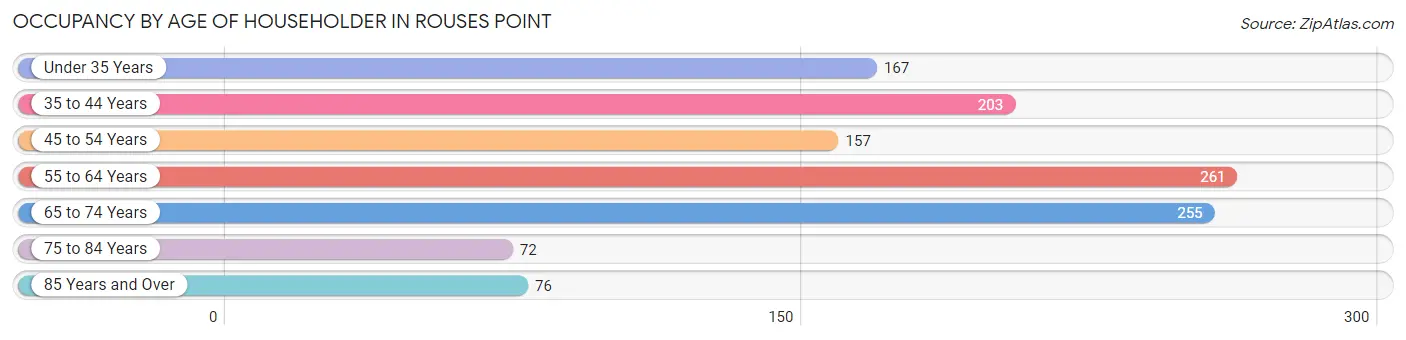
| Age Bracket | # Households | % Households |
| Under 35 Years | 167 | 14.0% |
| 35 to 44 Years | 203 | 17.0% |
| 45 to 54 Years | 157 | 13.2% |
| 55 to 64 Years | 261 | 21.9% |
| 65 to 74 Years | 255 | 21.4% |
| 75 to 84 Years | 72 | 6.0% |
| 85 Years and Over | 76 | 6.4% |
| Total | 1,191 | 100.0% |
Housing Finances in Rouses Point
Median Income by Occupancy in Rouses Point
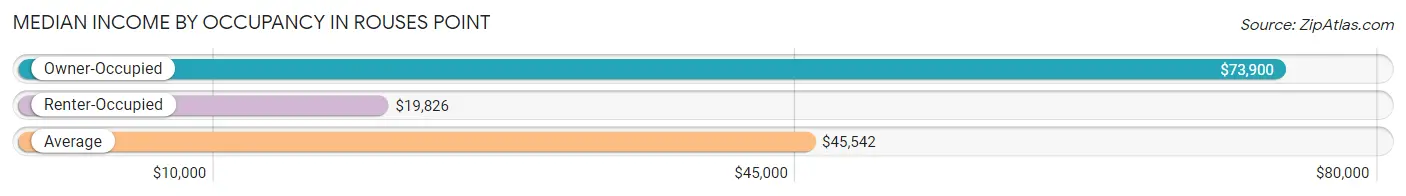
| Occupancy Type | # Households | Median Income |
| Owner-Occupied | 640 (53.7%) | $73,900 |
| Renter-Occupied | 551 (46.3%) | $19,826 |
| Average | 1,191 (100.0%) | $45,542 |
Occupancy by Householder Income Bracket in Rouses Point
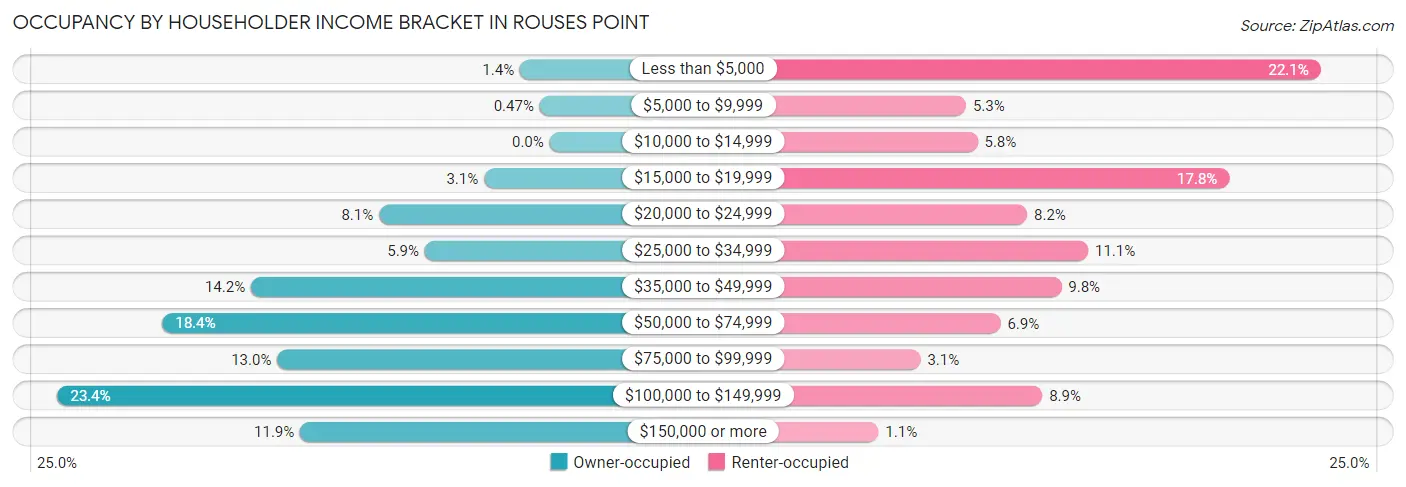
| Income Bracket | Owner-occupied | Renter-occupied |
| Less than $5,000 | 9 (1.4%) | 122 (22.1%) |
| $5,000 to $9,999 | 3 (0.5%) | 29 (5.3%) |
| $10,000 to $14,999 | 0 (0.0%) | 32 (5.8%) |
| $15,000 to $19,999 | 20 (3.1%) | 98 (17.8%) |
| $20,000 to $24,999 | 52 (8.1%) | 45 (8.2%) |
| $25,000 to $34,999 | 38 (5.9%) | 61 (11.1%) |
| $35,000 to $49,999 | 91 (14.2%) | 54 (9.8%) |
| $50,000 to $74,999 | 118 (18.4%) | 38 (6.9%) |
| $75,000 to $99,999 | 83 (13.0%) | 17 (3.1%) |
| $100,000 to $149,999 | 150 (23.4%) | 49 (8.9%) |
| $150,000 or more | 76 (11.9%) | 6 (1.1%) |
| Total | 640 (100.0%) | 551 (100.0%) |
Monthly Housing Cost Tiers in Rouses Point
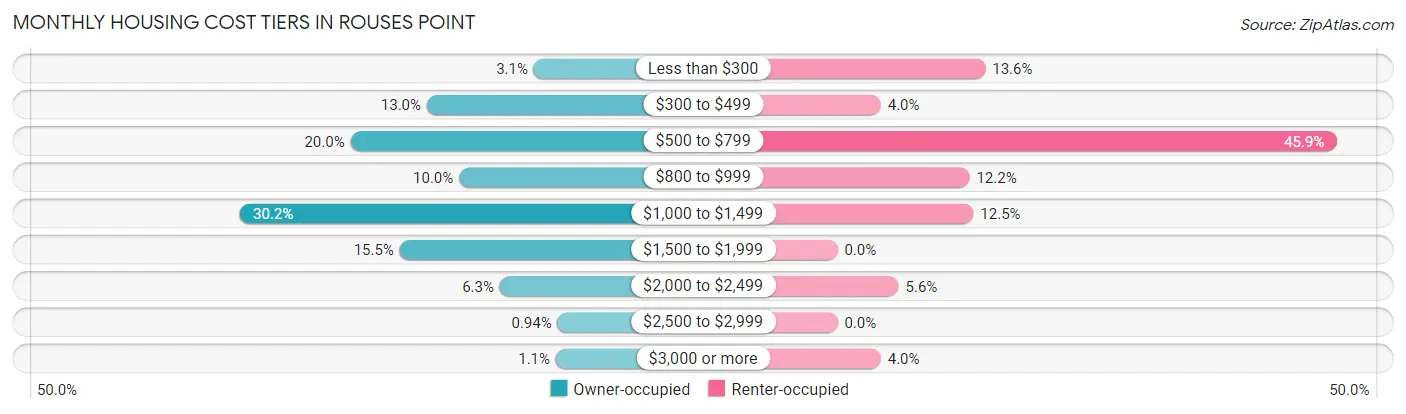
| Monthly Cost | Owner-occupied | Renter-occupied |
| Less than $300 | 20 (3.1%) | 75 (13.6%) |
| $300 to $499 | 83 (13.0%) | 22 (4.0%) |
| $500 to $799 | 128 (20.0%) | 253 (45.9%) |
| $800 to $999 | 64 (10.0%) | 67 (12.2%) |
| $1,000 to $1,499 | 193 (30.2%) | 69 (12.5%) |
| $1,500 to $1,999 | 99 (15.5%) | 0 (0.0%) |
| $2,000 to $2,499 | 40 (6.2%) | 31 (5.6%) |
| $2,500 to $2,999 | 6 (0.9%) | 0 (0.0%) |
| $3,000 or more | 7 (1.1%) | 22 (4.0%) |
| Total | 640 (100.0%) | 551 (100.0%) |
Physical Housing Characteristics in Rouses Point
Housing Structures in Rouses Point
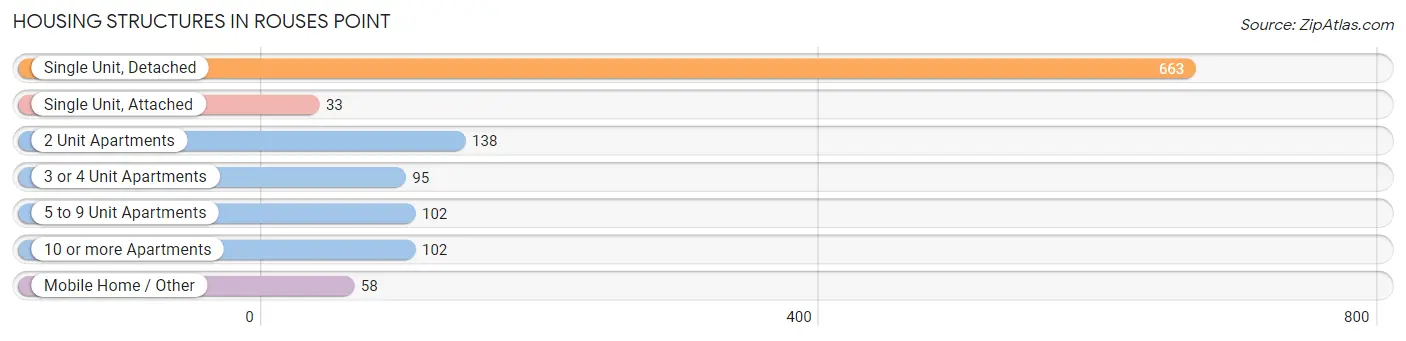
| Structure Type | # Housing Units | % Housing Units |
| Single Unit, Detached | 663 | 55.7% |
| Single Unit, Attached | 33 | 2.8% |
| 2 Unit Apartments | 138 | 11.6% |
| 3 or 4 Unit Apartments | 95 | 8.0% |
| 5 to 9 Unit Apartments | 102 | 8.6% |
| 10 or more Apartments | 102 | 8.6% |
| Mobile Home / Other | 58 | 4.9% |
| Total | 1,191 | 100.0% |
Housing Structures by Occupancy in Rouses Point
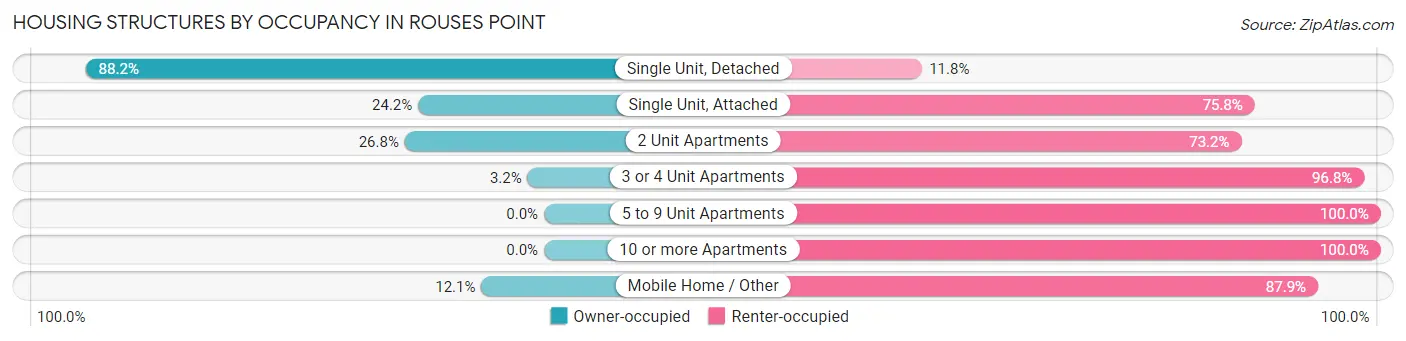
| Structure Type | Owner-occupied | Renter-occupied |
| Single Unit, Detached | 585 (88.2%) | 78 (11.8%) |
| Single Unit, Attached | 8 (24.2%) | 25 (75.8%) |
| 2 Unit Apartments | 37 (26.8%) | 101 (73.2%) |
| 3 or 4 Unit Apartments | 3 (3.2%) | 92 (96.8%) |
| 5 to 9 Unit Apartments | 0 (0.0%) | 102 (100.0%) |
| 10 or more Apartments | 0 (0.0%) | 102 (100.0%) |
| Mobile Home / Other | 7 (12.1%) | 51 (87.9%) |
| Total | 640 (53.7%) | 551 (46.3%) |
Housing Structures by Number of Rooms in Rouses Point
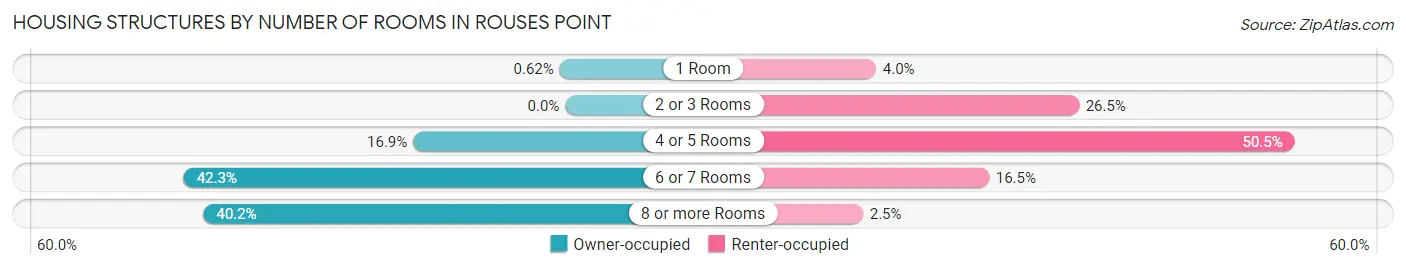
| Number of Rooms | Owner-occupied | Renter-occupied |
| 1 Room | 4 (0.6%) | 22 (4.0%) |
| 2 or 3 Rooms | 0 (0.0%) | 146 (26.5%) |
| 4 or 5 Rooms | 108 (16.9%) | 278 (50.4%) |
| 6 or 7 Rooms | 271 (42.3%) | 91 (16.5%) |
| 8 or more Rooms | 257 (40.2%) | 14 (2.5%) |
| Total | 640 (100.0%) | 551 (100.0%) |
Housing Structure by Heating Type in Rouses Point
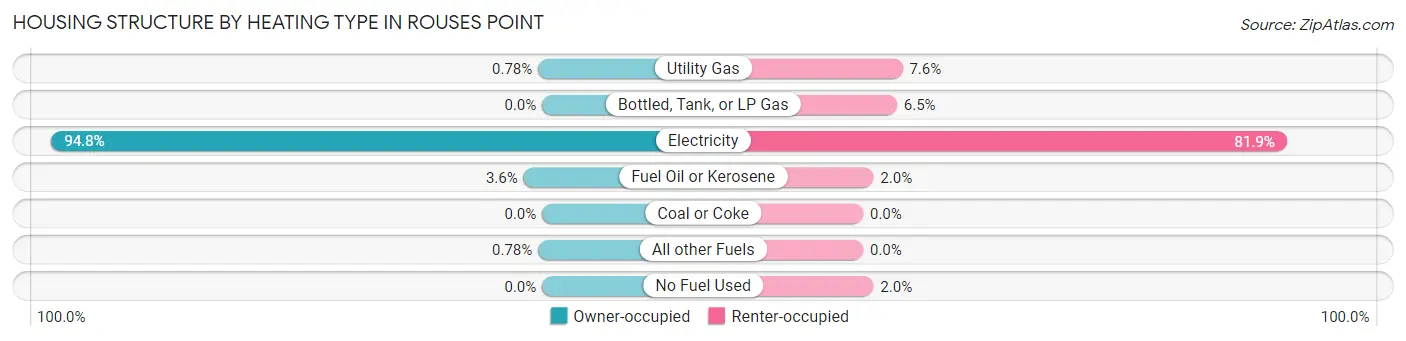
| Heating Type | Owner-occupied | Renter-occupied |
| Utility Gas | 5 (0.8%) | 42 (7.6%) |
| Bottled, Tank, or LP Gas | 0 (0.0%) | 36 (6.5%) |
| Electricity | 607 (94.8%) | 451 (81.9%) |
| Fuel Oil or Kerosene | 23 (3.6%) | 11 (2.0%) |
| Coal or Coke | 0 (0.0%) | 0 (0.0%) |
| All other Fuels | 5 (0.8%) | 0 (0.0%) |
| No Fuel Used | 0 (0.0%) | 11 (2.0%) |
| Total | 640 (100.0%) | 551 (100.0%) |
Household Vehicle Usage in Rouses Point
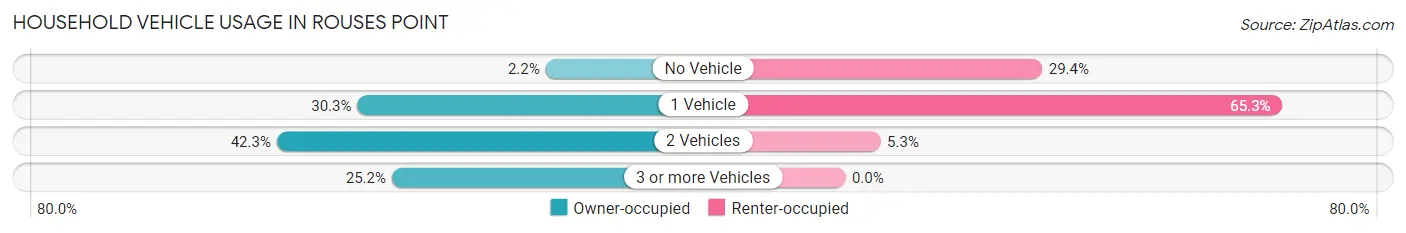
| Vehicles per Household | Owner-occupied | Renter-occupied |
| No Vehicle | 14 (2.2%) | 162 (29.4%) |
| 1 Vehicle | 194 (30.3%) | 360 (65.3%) |
| 2 Vehicles | 271 (42.3%) | 29 (5.3%) |
| 3 or more Vehicles | 161 (25.2%) | 0 (0.0%) |
| Total | 640 (100.0%) | 551 (100.0%) |
Real Estate & Mortgages in Rouses Point
Real Estate and Mortgage Overview in Rouses Point
| Characteristic | Without Mortgage | With Mortgage |
| Housing Units | 275 | 365 |
| Median Property Value | $138,900 | $199,500 |
| Median Household Income | $52,292 | $58 |
| Monthly Housing Costs | $559 | $7 |
| Real Estate Taxes | $3,336 | $11 |
Property Value by Mortgage Status in Rouses Point
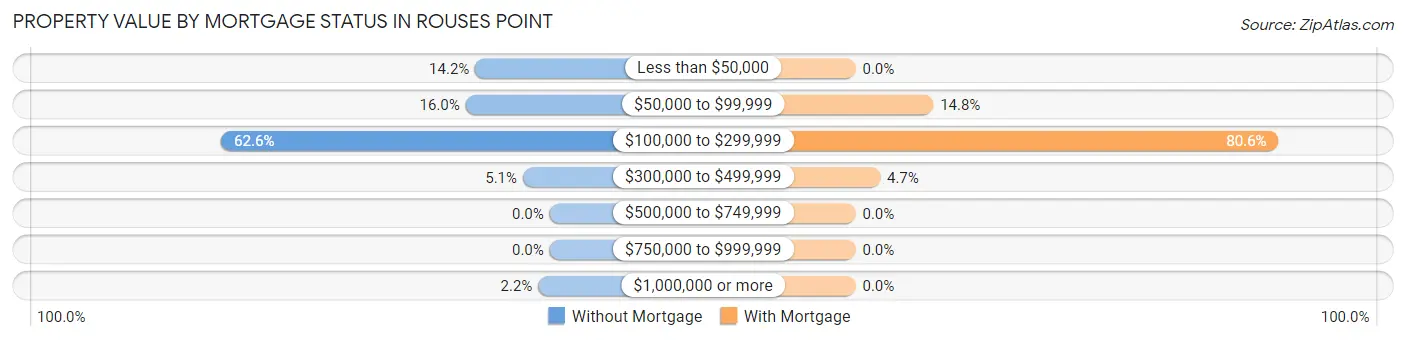
| Property Value | Without Mortgage | With Mortgage |
| Less than $50,000 | 39 (14.2%) | 0 (0.0%) |
| $50,000 to $99,999 | 44 (16.0%) | 54 (14.8%) |
| $100,000 to $299,999 | 172 (62.5%) | 294 (80.5%) |
| $300,000 to $499,999 | 14 (5.1%) | 17 (4.7%) |
| $500,000 to $749,999 | 0 (0.0%) | 0 (0.0%) |
| $750,000 to $999,999 | 0 (0.0%) | 0 (0.0%) |
| $1,000,000 or more | 6 (2.2%) | 0 (0.0%) |
| Total | 275 (100.0%) | 365 (100.0%) |
Household Income by Mortgage Status in Rouses Point
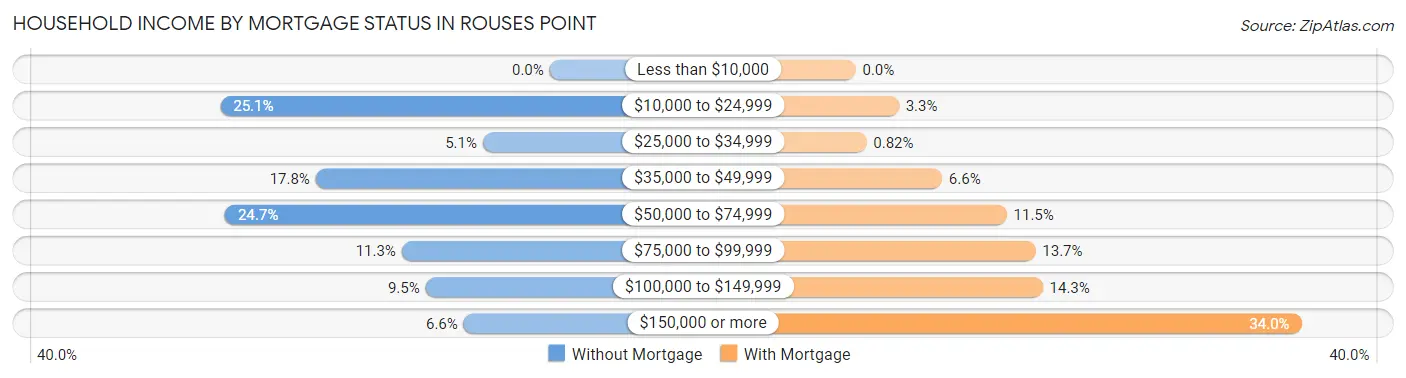
| Household Income | Without Mortgage | With Mortgage |
| Less than $10,000 | 0 (0.0%) | 0 (0.0%) |
| $10,000 to $24,999 | 69 (25.1%) | 12 (3.3%) |
| $25,000 to $34,999 | 14 (5.1%) | 3 (0.8%) |
| $35,000 to $49,999 | 49 (17.8%) | 24 (6.6%) |
| $50,000 to $74,999 | 68 (24.7%) | 42 (11.5%) |
| $75,000 to $99,999 | 31 (11.3%) | 50 (13.7%) |
| $100,000 to $149,999 | 26 (9.5%) | 52 (14.2%) |
| $150,000 or more | 18 (6.6%) | 124 (34.0%) |
| Total | 275 (100.0%) | 365 (100.0%) |
Property Value to Household Income Ratio in Rouses Point
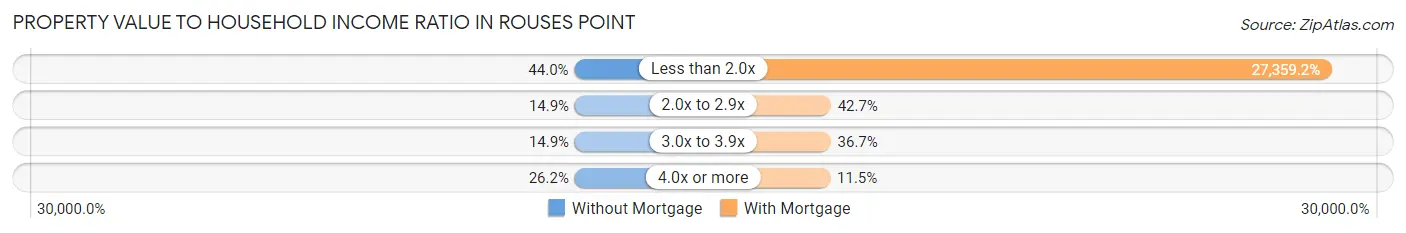
| Value-to-Income Ratio | Without Mortgage | With Mortgage |
| Less than 2.0x | 121 (44.0%) | 99,861 (27,359.2%) |
| 2.0x to 2.9x | 41 (14.9%) | 156 (42.7%) |
| 3.0x to 3.9x | 41 (14.9%) | 134 (36.7%) |
| 4.0x or more | 72 (26.2%) | 42 (11.5%) |
| Total | 275 (100.0%) | 365 (100.0%) |
Real Estate Taxes by Mortgage Status in Rouses Point
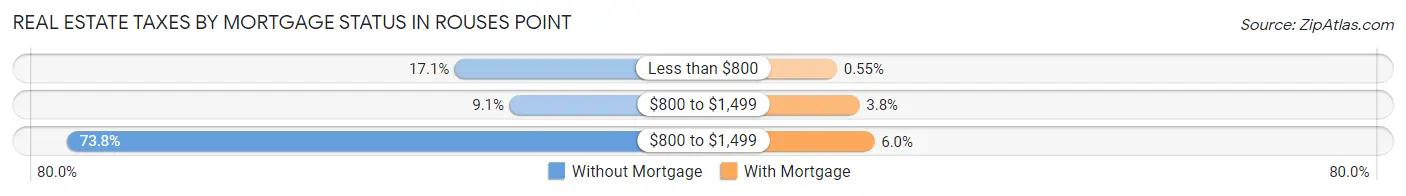
| Property Taxes | Without Mortgage | With Mortgage |
| Less than $800 | 47 (17.1%) | 2 (0.5%) |
| $800 to $1,499 | 25 (9.1%) | 14 (3.8%) |
| $800 to $1,499 | 203 (73.8%) | 22 (6.0%) |
| Total | 275 (100.0%) | 365 (100.0%) |
Health & Disability in Rouses Point
Health Insurance Coverage by Age in Rouses Point
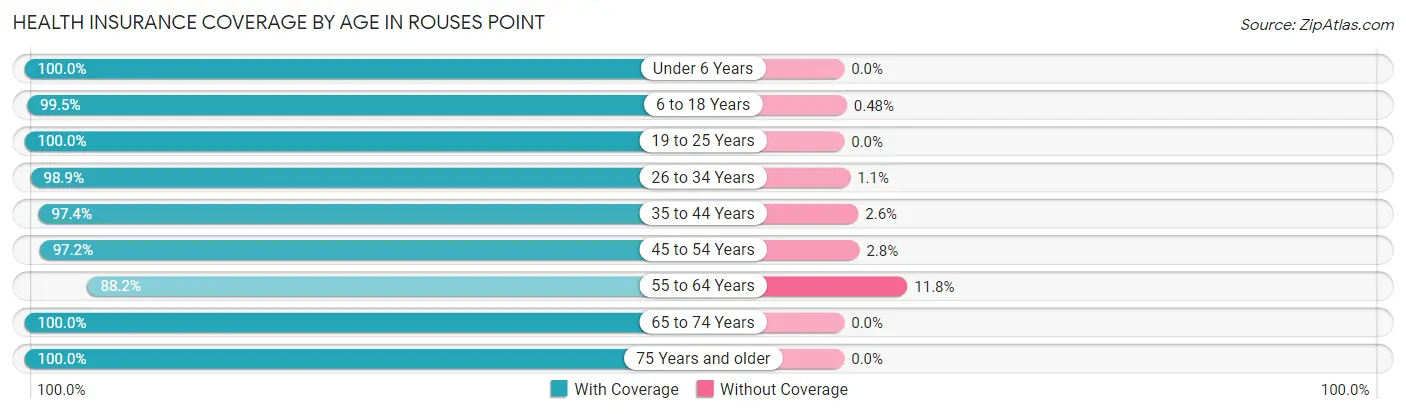
| Age Bracket | With Coverage | Without Coverage |
| Under 6 Years | 169 (100.0%) | 0 (0.0%) |
| 6 to 18 Years | 414 (99.5%) | 2 (0.5%) |
| 19 to 25 Years | 193 (100.0%) | 0 (0.0%) |
| 26 to 34 Years | 178 (98.9%) | 2 (1.1%) |
| 35 to 44 Years | 297 (97.4%) | 8 (2.6%) |
| 45 to 54 Years | 343 (97.2%) | 10 (2.8%) |
| 55 to 64 Years | 315 (88.2%) | 42 (11.8%) |
| 65 to 74 Years | 380 (100.0%) | 0 (0.0%) |
| 75 Years and older | 177 (100.0%) | 0 (0.0%) |
| Total | 2,466 (97.5%) | 64 (2.5%) |
Health Insurance Coverage by Citizenship Status in Rouses Point
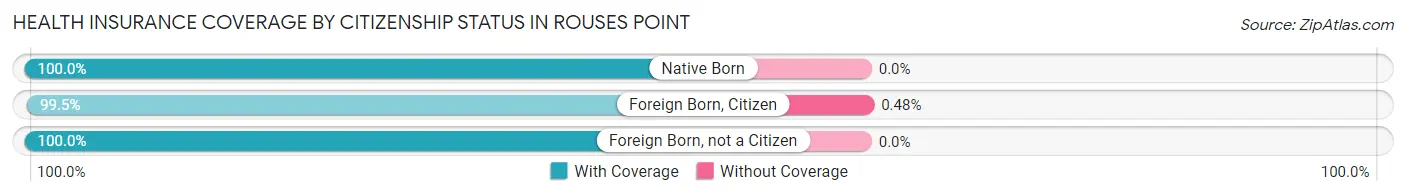
| Citizenship Status | With Coverage | Without Coverage |
| Native Born | 169 (100.0%) | 0 (0.0%) |
| Foreign Born, Citizen | 414 (99.5%) | 2 (0.5%) |
| Foreign Born, not a Citizen | 193 (100.0%) | 0 (0.0%) |
Health Insurance Coverage by Household Income in Rouses Point
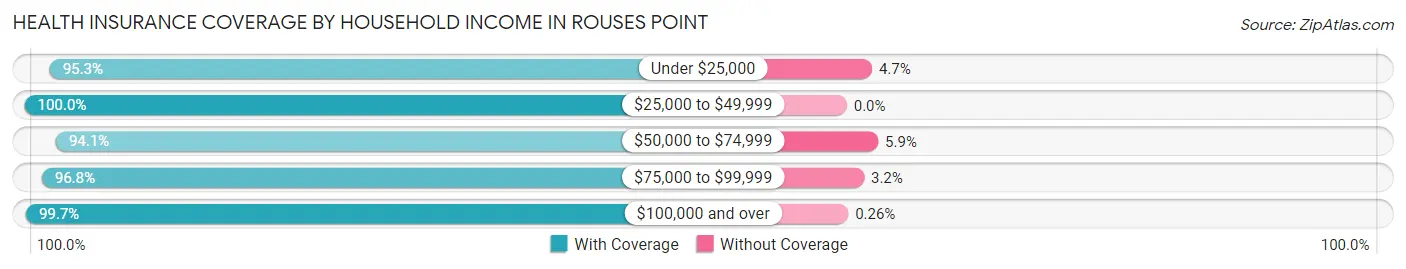
| Household Income | With Coverage | Without Coverage |
| Under $25,000 | 688 (95.3%) | 34 (4.7%) |
| $25,000 to $49,999 | 458 (100.0%) | 0 (0.0%) |
| $50,000 to $74,999 | 288 (94.1%) | 18 (5.9%) |
| $75,000 to $99,999 | 240 (96.8%) | 8 (3.2%) |
| $100,000 and over | 776 (99.7%) | 2 (0.3%) |
Public vs Private Health Insurance Coverage by Age in Rouses Point
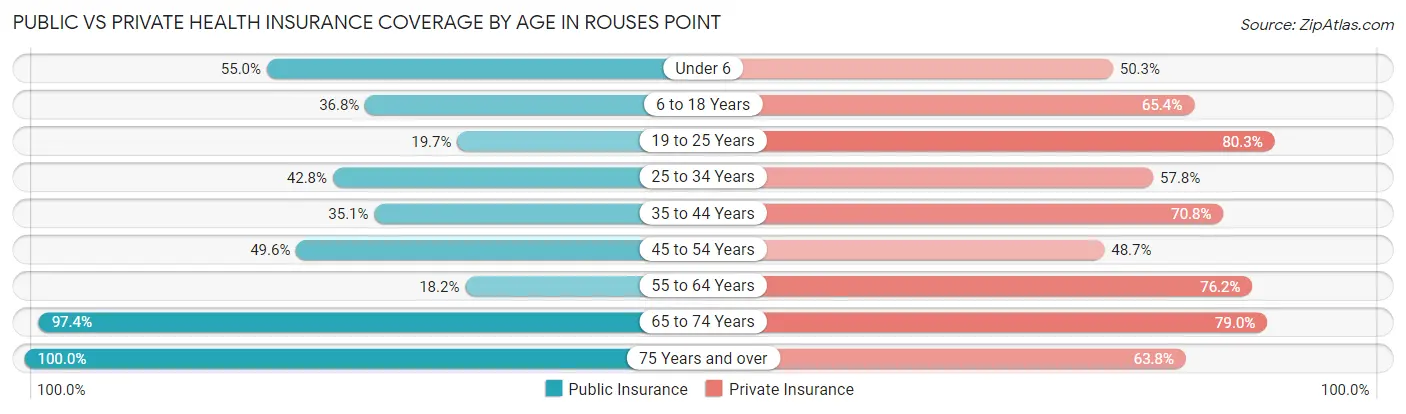
| Age Bracket | Public Insurance | Private Insurance |
| Under 6 | 93 (55.0%) | 85 (50.3%) |
| 6 to 18 Years | 153 (36.8%) | 272 (65.4%) |
| 19 to 25 Years | 38 (19.7%) | 155 (80.3%) |
| 25 to 34 Years | 77 (42.8%) | 104 (57.8%) |
| 35 to 44 Years | 107 (35.1%) | 216 (70.8%) |
| 45 to 54 Years | 175 (49.6%) | 172 (48.7%) |
| 55 to 64 Years | 65 (18.2%) | 272 (76.2%) |
| 65 to 74 Years | 370 (97.4%) | 300 (78.9%) |
| 75 Years and over | 177 (100.0%) | 113 (63.8%) |
| Total | 1,255 (49.6%) | 1,689 (66.8%) |
Disability Status by Sex by Age in Rouses Point
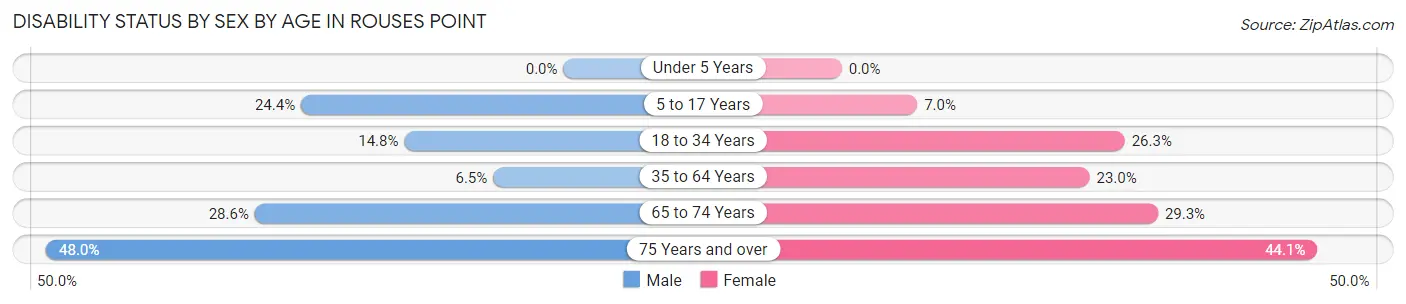
| Age Bracket | Male | Female |
| Under 5 Years | 0 (0.0%) | 0 (0.0%) |
| 5 to 17 Years | 56 (24.3%) | 14 (7.0%) |
| 18 to 34 Years | 31 (14.8%) | 47 (26.3%) |
| 35 to 64 Years | 33 (6.5%) | 117 (23.0%) |
| 65 to 74 Years | 61 (28.6%) | 49 (29.3%) |
| 75 Years and over | 36 (48.0%) | 45 (44.1%) |
Disability Class by Sex by Age in Rouses Point
Disability Class: Hearing Difficulty
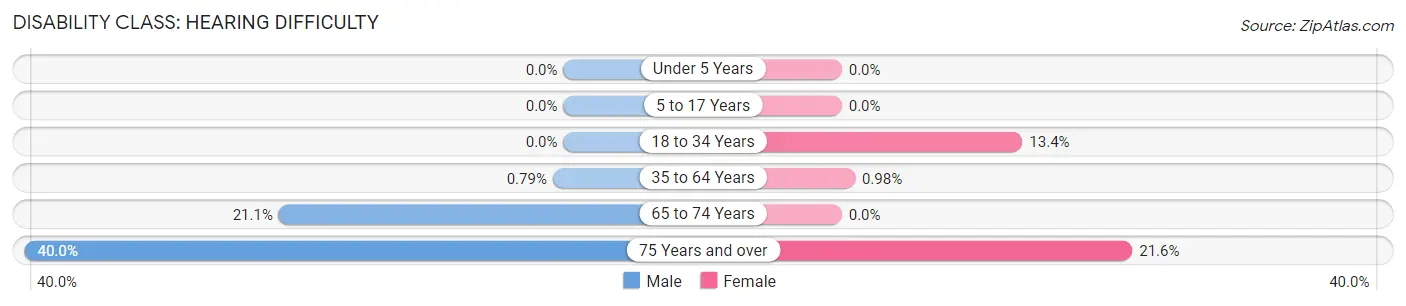
| Age Bracket | Male | Female |
| Under 5 Years | 0 (0.0%) | 0 (0.0%) |
| 5 to 17 Years | 0 (0.0%) | 0 (0.0%) |
| 18 to 34 Years | 0 (0.0%) | 24 (13.4%) |
| 35 to 64 Years | 4 (0.8%) | 5 (1.0%) |
| 65 to 74 Years | 45 (21.1%) | 0 (0.0%) |
| 75 Years and over | 30 (40.0%) | 22 (21.6%) |
Disability Class: Vision Difficulty
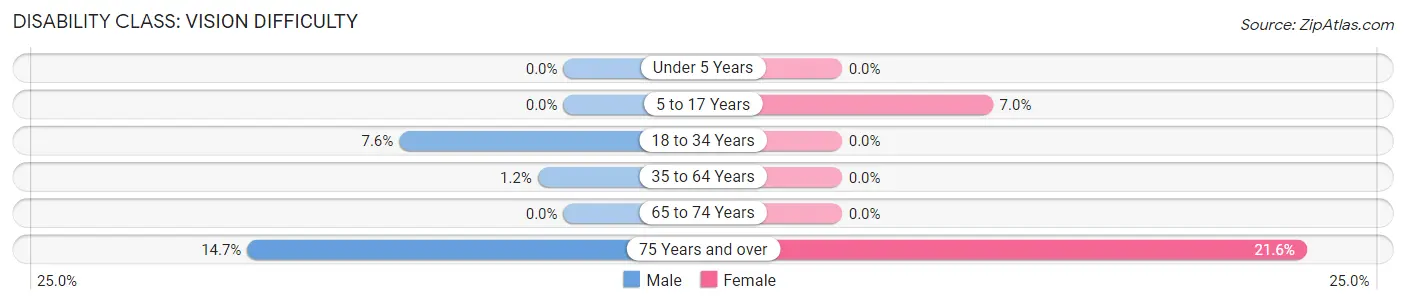
| Age Bracket | Male | Female |
| Under 5 Years | 0 (0.0%) | 0 (0.0%) |
| 5 to 17 Years | 0 (0.0%) | 14 (7.0%) |
| 18 to 34 Years | 16 (7.6%) | 0 (0.0%) |
| 35 to 64 Years | 6 (1.2%) | 0 (0.0%) |
| 65 to 74 Years | 0 (0.0%) | 0 (0.0%) |
| 75 Years and over | 11 (14.7%) | 22 (21.6%) |
Disability Class: Cognitive Difficulty
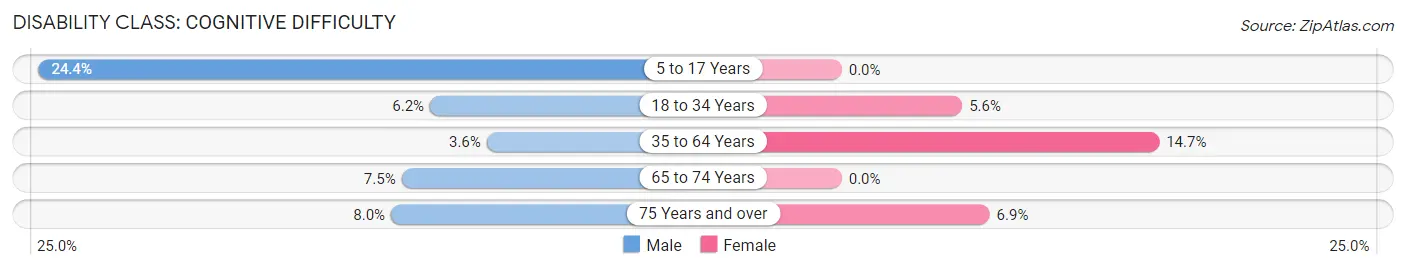
| Age Bracket | Male | Female |
| 5 to 17 Years | 56 (24.3%) | 0 (0.0%) |
| 18 to 34 Years | 13 (6.2%) | 10 (5.6%) |
| 35 to 64 Years | 18 (3.6%) | 75 (14.7%) |
| 65 to 74 Years | 16 (7.5%) | 0 (0.0%) |
| 75 Years and over | 6 (8.0%) | 7 (6.9%) |
Disability Class: Ambulatory Difficulty
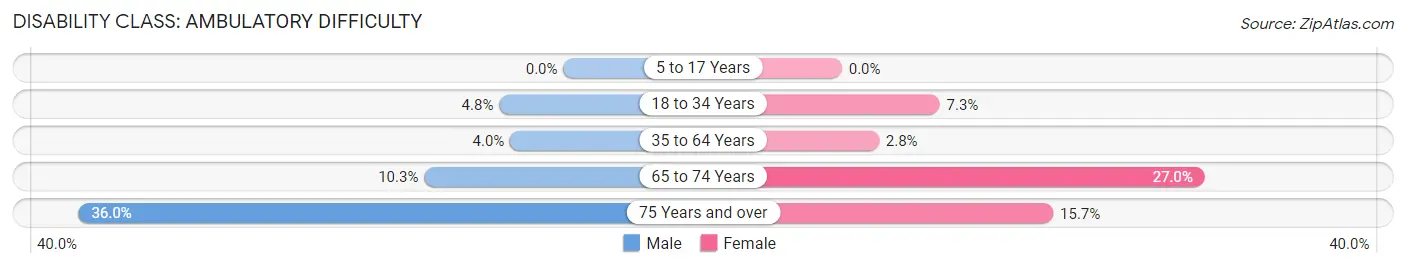
| Age Bracket | Male | Female |
| 5 to 17 Years | 0 (0.0%) | 0 (0.0%) |
| 18 to 34 Years | 10 (4.8%) | 13 (7.3%) |
| 35 to 64 Years | 20 (4.0%) | 14 (2.8%) |
| 65 to 74 Years | 22 (10.3%) | 45 (27.0%) |
| 75 Years and over | 27 (36.0%) | 16 (15.7%) |
Disability Class: Self-Care Difficulty
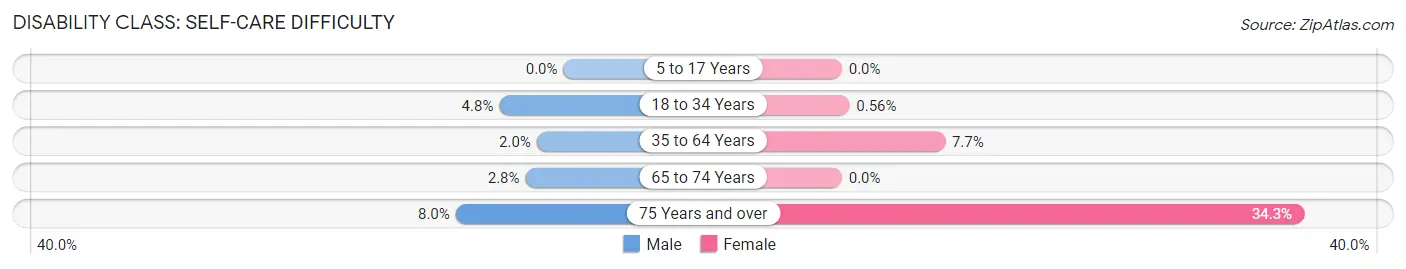
| Age Bracket | Male | Female |
| 5 to 17 Years | 0 (0.0%) | 0 (0.0%) |
| 18 to 34 Years | 10 (4.8%) | 1 (0.6%) |
| 35 to 64 Years | 10 (2.0%) | 39 (7.7%) |
| 65 to 74 Years | 6 (2.8%) | 0 (0.0%) |
| 75 Years and over | 6 (8.0%) | 35 (34.3%) |
Technology Access in Rouses Point
Computing Device Access in Rouses Point
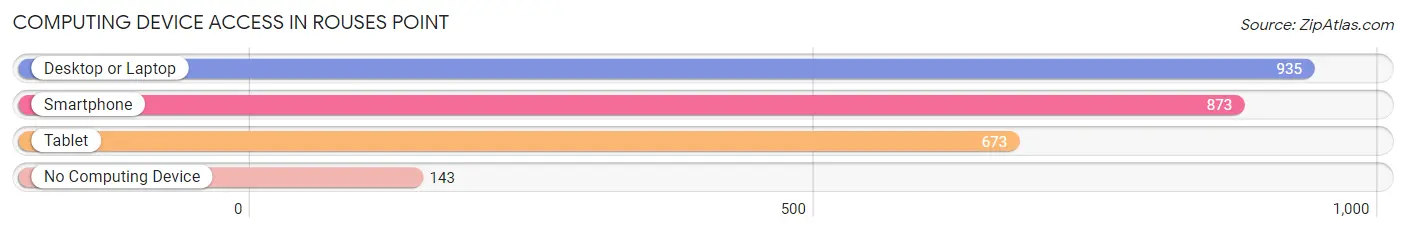
| Device Type | # Households | % Households |
| Desktop or Laptop | 935 | 78.5% |
| Smartphone | 873 | 73.3% |
| Tablet | 673 | 56.5% |
| No Computing Device | 143 | 12.0% |
| Total | 1,191 | 100.0% |
Internet Access in Rouses Point
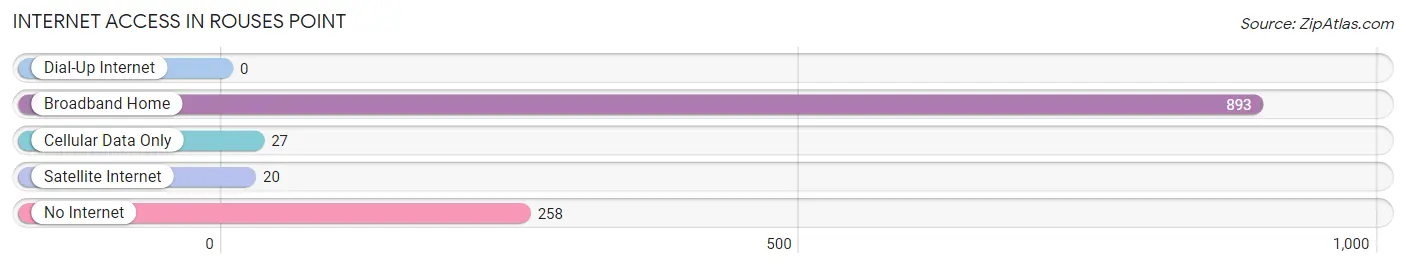
| Internet Type | # Households | % Households |
| Dial-Up Internet | 0 | 0.0% |
| Broadband Home | 893 | 75.0% |
| Cellular Data Only | 27 | 2.3% |
| Satellite Internet | 20 | 1.7% |
| No Internet | 258 | 21.7% |
| Total | 1,191 | 100.0% |
Rouses Point Summary
Rouses Point is a village located in the town of Champlain in Clinton County, New York, United States. The population was 1,209 at the 2010 census. It is located on the 45th parallel, halfway between the Equator and the North Pole.
History
Rouses Point was first settled in 1783 by French-Canadian fur traders. The village was named after Captain Rouse, a British officer who was stationed at the fort in the area. The village was incorporated in 1892.
In the early 19th century, the village was a major port of entry for immigrants from Canada. The village was also a major stop on the Underground Railroad, with many slaves escaping to freedom in Canada.
In the late 19th century, the village was a major hub for the lumber industry. The village was also home to a large paper mill, which was the largest employer in the area.
Geography
Rouses Point is located at 44°59′N 73°20′W (44.983, -73.333). According to the United States Census Bureau, the village has a total area of 0.9 square miles (2.3 km2), all of it land.
The village is located on the western shore of Lake Champlain, near the Canadian border. The village is connected to the Canadian city of Montreal by the Lake Champlain Bridge.
Economy
The economy of Rouses Point is largely based on tourism. The village is a popular destination for fishing, boating, and other outdoor activities. The village is also home to several small businesses, including restaurants, shops, and a marina.
The village is also home to a large paper mill, which is the largest employer in the area. The mill produces paper products for the local and regional markets.
Demographics
As of the census of 2010, there were 1,209 people, 517 households, and 315 families residing in the village. The population density was 1,346.7 people per square mile (520.2/km2). There were 567 housing units at an average density of 627.2 per square mile (242.2/km2). The racial makeup of the village was 97.2% White, 0.3% African American, 0.3% Native American, 0.3% Asian, 0.2% from other races, and 1.7% from two or more races. Hispanic or Latino of any race were 1.2% of the population.
There were 517 households, out of which 28.2% had children under the age of 18 living with them, 44.2% were married couples living together, 11.7% had a female householder with no husband present, and 38.7% were non-families. 33.2% of all households were made up of individuals, and 14.2% had someone living alone who was 65 years of age or older. The average household size was 2.33 and the average family size was 2.97.
In the village, the population was spread out, with 24.2% under the age of 18, 7.2% from 18 to 24, 25.7% from 25 to 44, 25.2% from 45 to 64, and 17.7% who were 65 years of age or older. The median age was 40 years. For every 100 females, there were 91.2 males. For every 100 females age 18 and over, there were 87.2 males.
The median income for a household in the village was $37,500, and the median income for a family was $45,000. Males had a median income of $35,000 versus $25,000 for females. The per capita income for the village was $19,845. About 8.2% of families and 10.2% of the population were below the poverty line, including 14.2% of those under age 18 and 5.2% of those age 65 or over.
Common Questions
What is the Total Population of Rouses Point?
Total Population of Rouses Point is 2,530.
What is the Total Male Population of Rouses Point?
Total Male Population of Rouses Point is 1,310.
What is the Total Female Population of Rouses Point?
Total Female Population of Rouses Point is 1,220.
What is the Ratio of Males per 100 Females in Rouses Point?
There are 107.38 Males per 100 Females in Rouses Point.
What is the Ratio of Females per 100 Males in Rouses Point?
There are 93.13 Females per 100 Males in Rouses Point.
What is the Median Population Age in Rouses Point?
Median Population Age in Rouses Point is 45.0 Years.
What is the Average Family Size in Rouses Point
Average Family Size in Rouses Point is 3.1 People.
What is the Average Household Size in Rouses Point
Average Household Size in Rouses Point is 2.1 People.
What is Per Capita Income in Rouses Point?
Per Capita income in Rouses Point is $29,724.
What is the Median Family Income in Rouses Point?
Median Family Income in Rouses Point is $74,318.
What is the Median Household income in Rouses Point?
Median Household Income in Rouses Point is $45,542.
What is Income or Wage Gap in Rouses Point?
Income or Wage Gap in Rouses Point is 19.5%.
Women in Rouses Point earn 80.5 cents for every dollar earned by a man.
What is Family Income Deficit in Rouses Point?
Family Income Deficit in Rouses Point is $15,098.
Families that are below poverty line in Rouses Point earn $15,098 less on average than the poverty threshold level.
What is Inequality or Gini Index in Rouses Point?
Inequality or Gini Index in Rouses Point is 0.49.
How Large is the Labor Force in Rouses Point?
There are 1,134 People in the Labor Forcein in Rouses Point.
What is the Percentage of People in the Labor Force in Rouses Point?
56.4% of People are in the Labor Force in Rouses Point.
What is the Unemployment Rate in Rouses Point?
Unemployment Rate in Rouses Point is 5.6%.