Mahopac, NY
Mahopac Map
Mahopac Overview
8,774
TOTAL POPULATION
4,252
MALE POPULATION
4,522
FEMALE POPULATION
94.03
MALES / 100 FEMALES
106.35
FEMALES / 100 MALES
43.6
MEDIAN AGE
3.1
AVG FAMILY SIZE
2.7
AVG HOUSEHOLD SIZE
$54,113
PER CAPITA INCOME
$131,729
AVG FAMILY INCOME
$119,563
AVG HOUSEHOLD INCOME
30.8%
WAGE / INCOME GAP [ % ]
69.2¢/ $1
WAGE / INCOME GAP [ $ ]
0.36
INEQUALITY / GINI INDEX
4,790
LABOR FORCE [ PEOPLE ]
65.9%
PERCENT IN LABOR FORCE
3.5%
UNEMPLOYMENT RATE
Mahopac Zip Codes
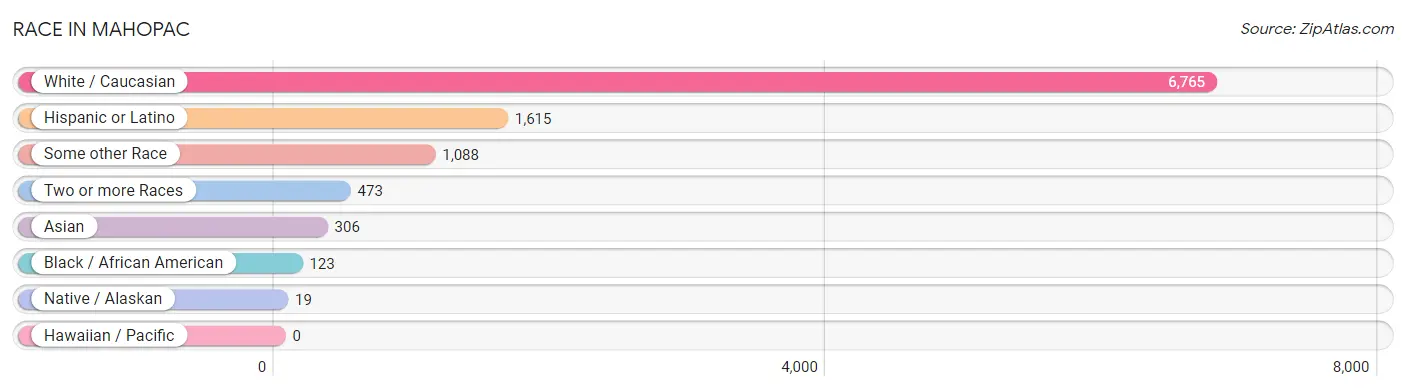
Race in Mahopac
The most populous races in Mahopac are White / Caucasian (6,765 | 77.1%), Hispanic or Latino (1,615 | 18.4%), and Some other Race (1,088 | 12.4%).
| Race | # Population | % Population |
| Asian | 306 | 3.5% |
| Black / African American | 123 | 1.4% |
| Hawaiian / Pacific | 0 | 0.0% |
| Hispanic or Latino | 1,615 | 18.4% |
| Native / Alaskan | 19 | 0.2% |
| White / Caucasian | 6,765 | 77.1% |
| Two or more Races | 473 | 5.4% |
| Some other Race | 1,088 | 12.4% |
| Total | 8,774 | 100.0% |
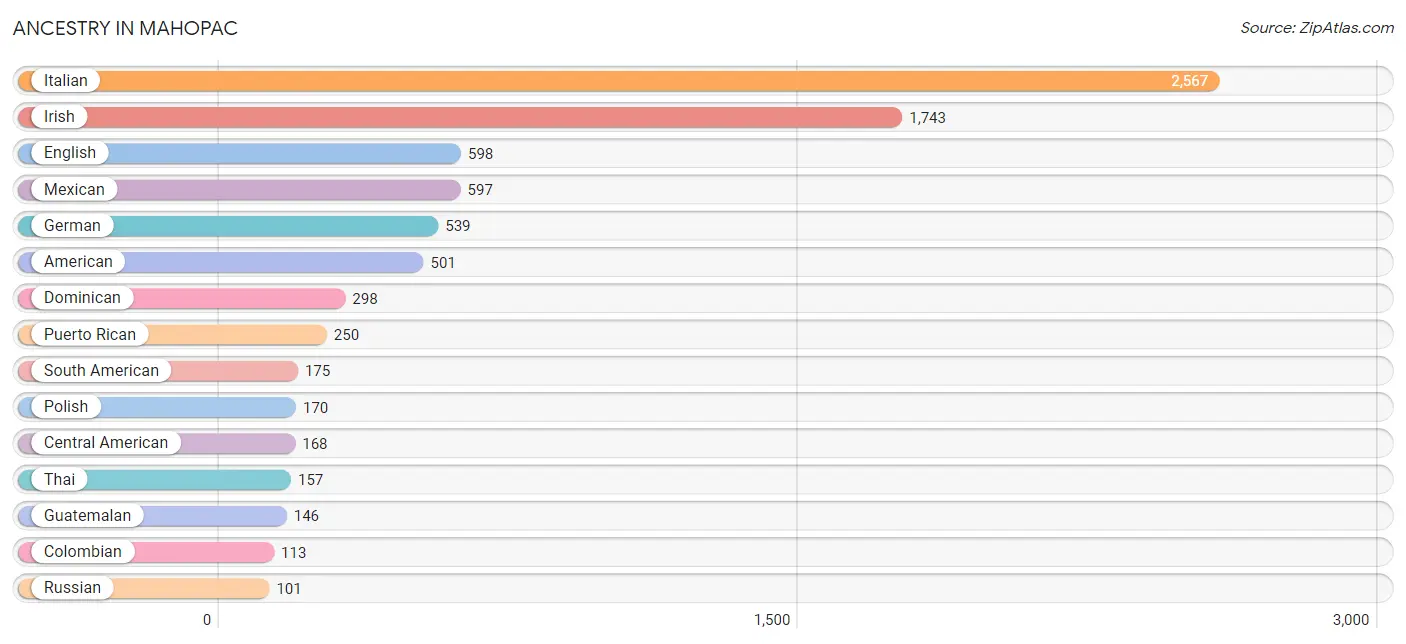
Ancestry in Mahopac
The most populous ancestries reported in Mahopac are Italian (2,567 | 29.3%), Irish (1,743 | 19.9%), English (598 | 6.8%), Mexican (597 | 6.8%), and German (539 | 6.1%), together accounting for 68.9% of all Mahopac residents.
| Ancestry | # Population | % Population |
| African | 26 | 0.3% |
| Albanian | 25 | 0.3% |
| American | 501 | 5.7% |
| Arab | 82 | 0.9% |
| Armenian | 16 | 0.2% |
| Austrian | 9 | 0.1% |
| Basque | 25 | 0.3% |
| Belgian | 6 | 0.1% |
| Bhutanese | 8 | 0.1% |
| British | 8 | 0.1% |
| Burmese | 76 | 0.9% |
| Canadian | 10 | 0.1% |
| Carpatho Rusyn | 10 | 0.1% |
| Central American | 168 | 1.9% |
| Central American Indian | 19 | 0.2% |
| Colombian | 113 | 1.3% |
| Cuban | 54 | 0.6% |
| Czech | 60 | 0.7% |
| Czechoslovakian | 11 | 0.1% |
| Danish | 66 | 0.7% |
| Dominican | 298 | 3.4% |
| Dutch | 30 | 0.3% |
| Eastern European | 48 | 0.5% |
| Ecuadorian | 62 | 0.7% |
| Egyptian | 82 | 0.9% |
| English | 598 | 6.8% |
| European | 19 | 0.2% |
| French | 87 | 1.0% |
| French American Indian | 40 | 0.5% |
| German | 539 | 6.1% |
| Greek | 96 | 1.1% |
| Guatemalan | 146 | 1.7% |
| Hungarian | 59 | 0.7% |
| Icelander | 10 | 0.1% |
| Indian (Asian) | 93 | 1.1% |
| Iranian | 6 | 0.1% |
| Irish | 1,743 | 19.9% |
| Italian | 2,567 | 29.3% |
| Jamaican | 33 | 0.4% |
| Latvian | 20 | 0.2% |
| Mexican | 597 | 6.8% |
| Polish | 170 | 1.9% |
| Puerto Rican | 250 | 2.9% |
| Romanian | 15 | 0.2% |
| Russian | 101 | 1.1% |
| Salvadoran | 22 | 0.3% |
| Scottish | 33 | 0.4% |
| Slovak | 69 | 0.8% |
| South American | 175 | 2.0% |
| Spaniard | 73 | 0.8% |
| Sri Lankan | 15 | 0.2% |
| Subsaharan African | 26 | 0.3% |
| Swedish | 32 | 0.4% |
| Thai | 157 | 1.8% |
| Ukrainian | 32 | 0.4% |
| Welsh | 24 | 0.3% |
| West Indian | 39 | 0.4% | View All 57 Rows |
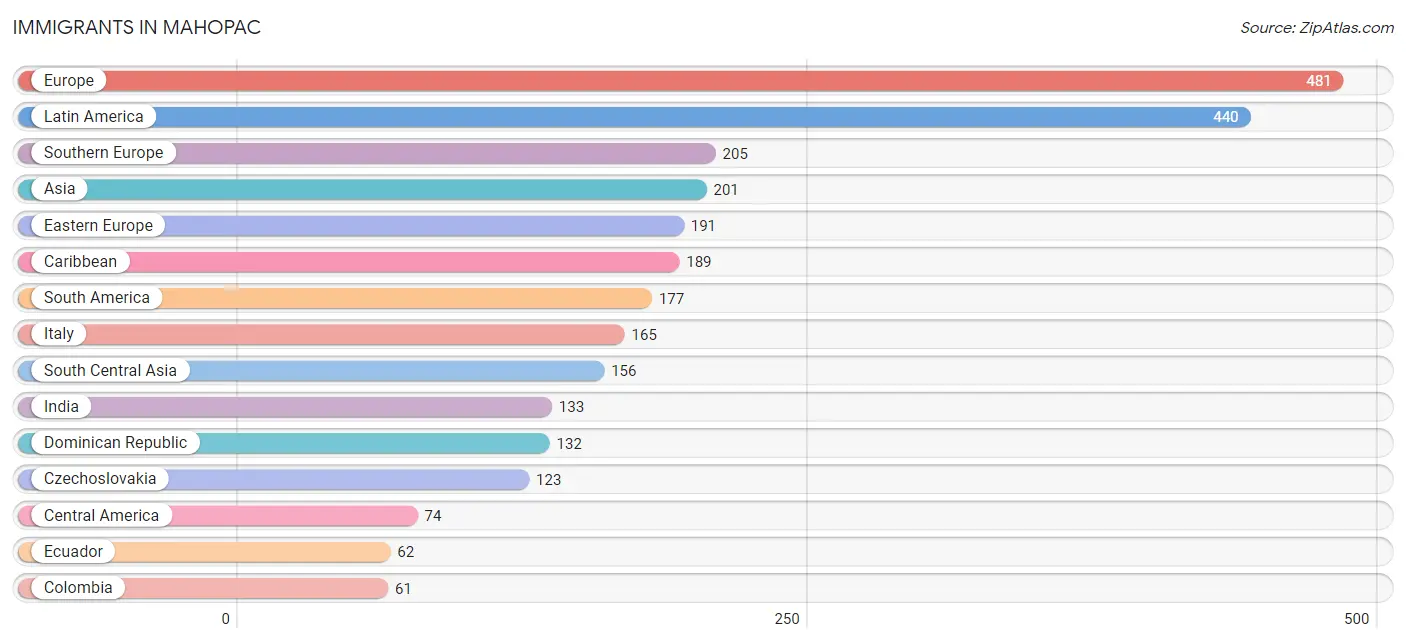
Immigrants in Mahopac
The most numerous immigrant groups reported in Mahopac came from Europe (481 | 5.5%), Latin America (440 | 5.0%), Southern Europe (205 | 2.3%), Asia (201 | 2.3%), and Eastern Europe (191 | 2.2%), together accounting for 17.3% of all Mahopac residents.
| Immigration Origin | # Population | % Population |
| Africa | 34 | 0.4% |
| Asia | 201 | 2.3% |
| Caribbean | 189 | 2.1% |
| Central America | 74 | 0.8% |
| Colombia | 61 | 0.7% |
| Czechoslovakia | 123 | 1.4% |
| Dominican Republic | 132 | 1.5% |
| Eastern Asia | 30 | 0.3% |
| Eastern Europe | 191 | 2.2% |
| Ecuador | 62 | 0.7% |
| Egypt | 34 | 0.4% |
| Europe | 481 | 5.5% |
| Germany | 30 | 0.3% |
| Guatemala | 45 | 0.5% |
| Guyana | 54 | 0.6% |
| India | 133 | 1.5% |
| Ireland | 8 | 0.1% |
| Italy | 165 | 1.9% |
| Jamaica | 18 | 0.2% |
| Japan | 8 | 0.1% |
| Korea | 22 | 0.3% |
| Latin America | 440 | 5.0% |
| Latvia | 20 | 0.2% |
| Mexico | 29 | 0.3% |
| Northern Africa | 34 | 0.4% |
| Northern Europe | 18 | 0.2% |
| Portugal | 16 | 0.2% |
| Romania | 8 | 0.1% |
| Russia | 26 | 0.3% |
| South America | 177 | 2.0% |
| South Central Asia | 156 | 1.8% |
| South Eastern Asia | 15 | 0.2% |
| Southern Europe | 205 | 2.3% |
| Spain | 24 | 0.3% |
| Uzbekistan | 23 | 0.3% |
| Vietnam | 15 | 0.2% |
| West Indies | 39 | 0.4% |
| Western Europe | 30 | 0.3% | View All 38 Rows |
Sex and Age in Mahopac
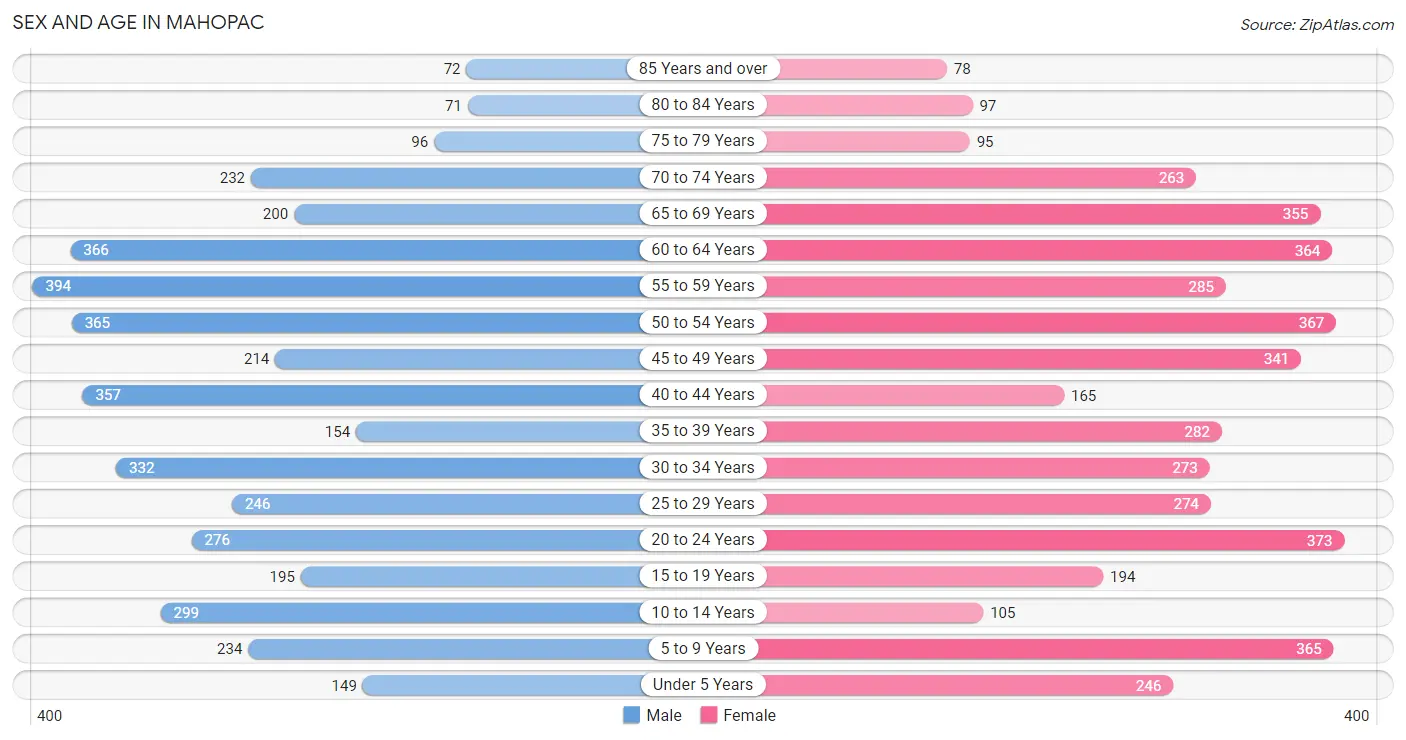
Sex and Age in Mahopac
The most populous age groups in Mahopac are 55 to 59 Years (394 | 9.3%) for men and 20 to 24 Years (373 | 8.3%) for women.
| Age Bracket | Male | Female |
| Under 5 Years | 149 (3.5%) | 246 (5.4%) |
| 5 to 9 Years | 234 (5.5%) | 365 (8.1%) |
| 10 to 14 Years | 299 (7.0%) | 105 (2.3%) |
| 15 to 19 Years | 195 (4.6%) | 194 (4.3%) |
| 20 to 24 Years | 276 (6.5%) | 373 (8.3%) |
| 25 to 29 Years | 246 (5.8%) | 274 (6.1%) |
| 30 to 34 Years | 332 (7.8%) | 273 (6.0%) |
| 35 to 39 Years | 154 (3.6%) | 282 (6.2%) |
| 40 to 44 Years | 357 (8.4%) | 165 (3.6%) |
| 45 to 49 Years | 214 (5.0%) | 341 (7.5%) |
| 50 to 54 Years | 365 (8.6%) | 367 (8.1%) |
| 55 to 59 Years | 394 (9.3%) | 285 (6.3%) |
| 60 to 64 Years | 366 (8.6%) | 364 (8.1%) |
| 65 to 69 Years | 200 (4.7%) | 355 (7.9%) |
| 70 to 74 Years | 232 (5.5%) | 263 (5.8%) |
| 75 to 79 Years | 96 (2.3%) | 95 (2.1%) |
| 80 to 84 Years | 71 (1.7%) | 97 (2.1%) |
| 85 Years and over | 72 (1.7%) | 78 (1.7%) |
| Total | 4,252 (100.0%) | 4,522 (100.0%) |
Families and Households in Mahopac
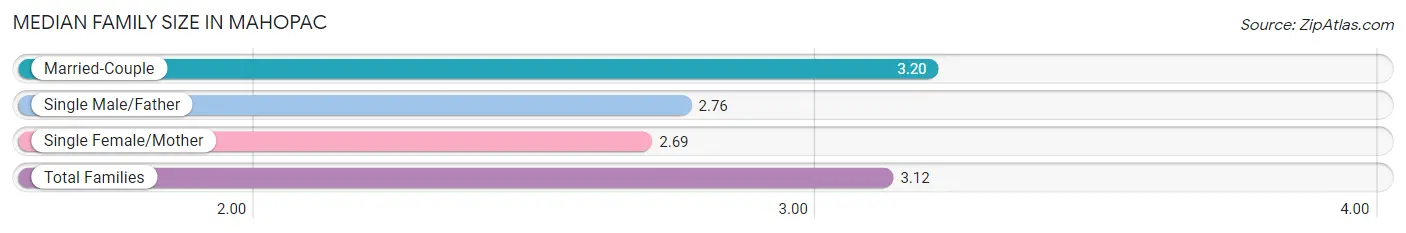
Median Family Size in Mahopac
The median family size in Mahopac is 3.12 persons per family, with married-couple families (2,089 | 83.4%) accounting for the largest median family size of 3.2 persons per family. On the other hand, single female/mother families (288 | 11.5%) represent the smallest median family size with 2.69 persons per family.
| Family Type | # Families | Family Size |
| Married-Couple | 2,089 (83.4%) | 3.20 |
| Single Male/Father | 127 (5.1%) | 2.76 |
| Single Female/Mother | 288 (11.5%) | 2.69 |
| Total Families | 2,504 (100.0%) | 3.12 |
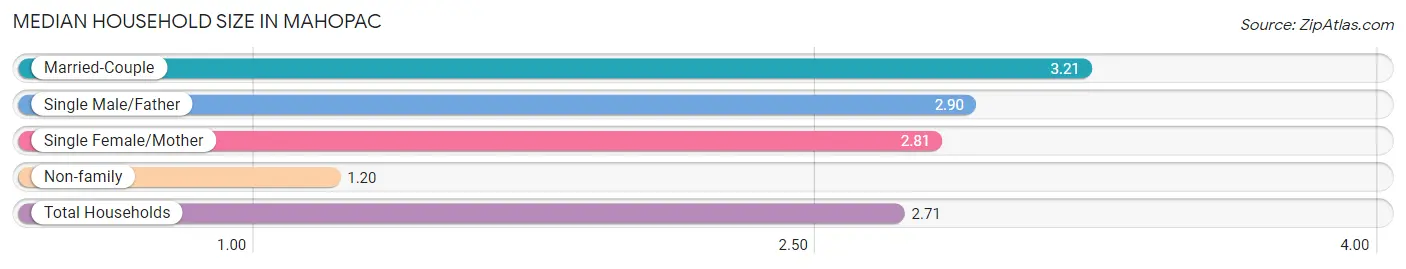
Median Household Size in Mahopac
The median household size in Mahopac is 2.71 persons per household, with married-couple households (2,089 | 64.6%) accounting for the largest median household size of 3.21 persons per household. non-family households (728 | 22.5%) represent the smallest median household size with 1.20 persons per household.
| Household Type | # Households | Household Size |
| Married-Couple | 2,089 (64.6%) | 3.21 |
| Single Male/Father | 127 (3.9%) | 2.90 |
| Single Female/Mother | 288 (8.9%) | 2.81 |
| Non-family | 728 (22.5%) | 1.20 |
| Total Households | 3,232 (100.0%) | 2.71 |
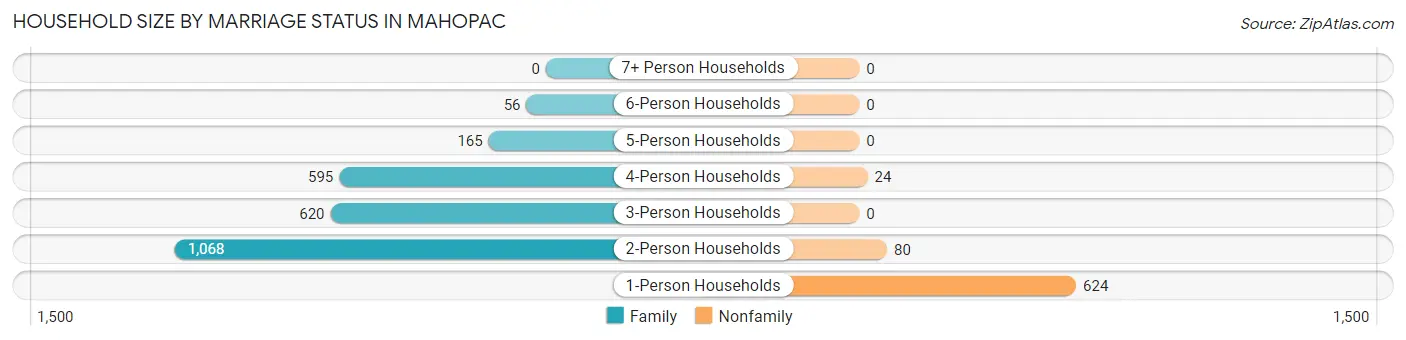
Household Size by Marriage Status in Mahopac
Out of a total of 3,232 households in Mahopac, 2,504 (77.5%) are family households, while 728 (22.5%) are nonfamily households. The most numerous type of family households are 2-person households, comprising 1,068, and the most common type of nonfamily households are 1-person households, comprising 624.
| Household Size | Family Households | Nonfamily Households |
| 1-Person Households | - | 624 (19.3%) |
| 2-Person Households | 1,068 (33.0%) | 80 (2.5%) |
| 3-Person Households | 620 (19.2%) | 0 (0.0%) |
| 4-Person Households | 595 (18.4%) | 24 (0.7%) |
| 5-Person Households | 165 (5.1%) | 0 (0.0%) |
| 6-Person Households | 56 (1.7%) | 0 (0.0%) |
| 7+ Person Households | 0 (0.0%) | 0 (0.0%) |
| Total | 2,504 (77.5%) | 728 (22.5%) |
Female Fertility in Mahopac
Fertility by Age in Mahopac
Average fertility rate in Mahopac is 32.0 births per 1,000 women. Women in the age bracket of 20 to 34 years have the highest fertility rate with 67.0 births per 1,000 women. Women in the age bracket of 20 to 34 years acount for 100.0% of all women with births.
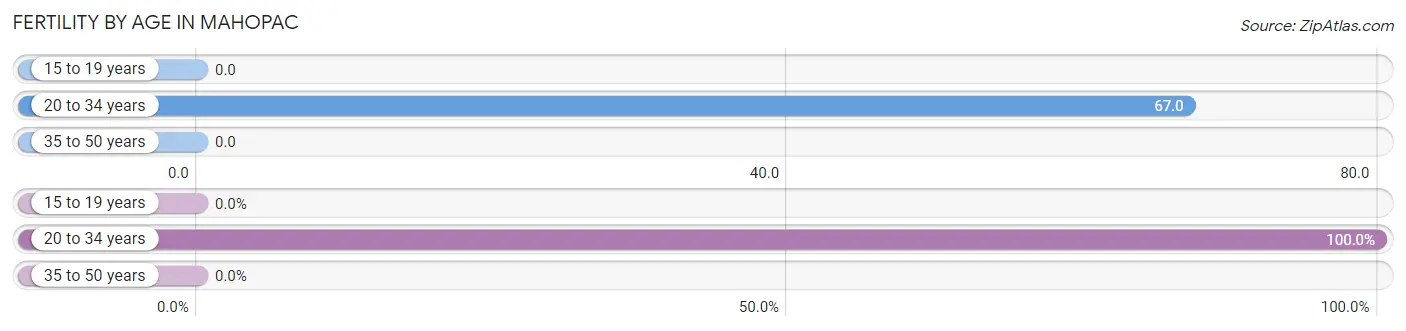
| Age Bracket | Women with Births | Births / 1,000 Women |
| 15 to 19 years | 0 (0.0%) | 0.0 |
| 20 to 34 years | 62 (100.0%) | 67.0 |
| 35 to 50 years | 0 (0.0%) | 0.0 |
| Total | 62 (100.0%) | 32.0 |
Fertility by Age by Marriage Status in Mahopac
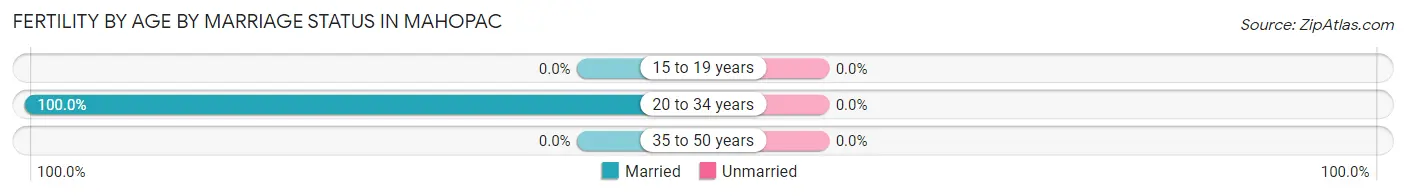
| Age Bracket | Married | Unmarried |
| 15 to 19 years | 0 (0.0%) | 0 (0.0%) |
| 20 to 34 years | 62 (100.0%) | 0 (0.0%) |
| 35 to 50 years | 0 (0.0%) | 0 (0.0%) |
| Total | 62 (100.0%) | 0 (0.0%) |
Fertility by Education in Mahopac
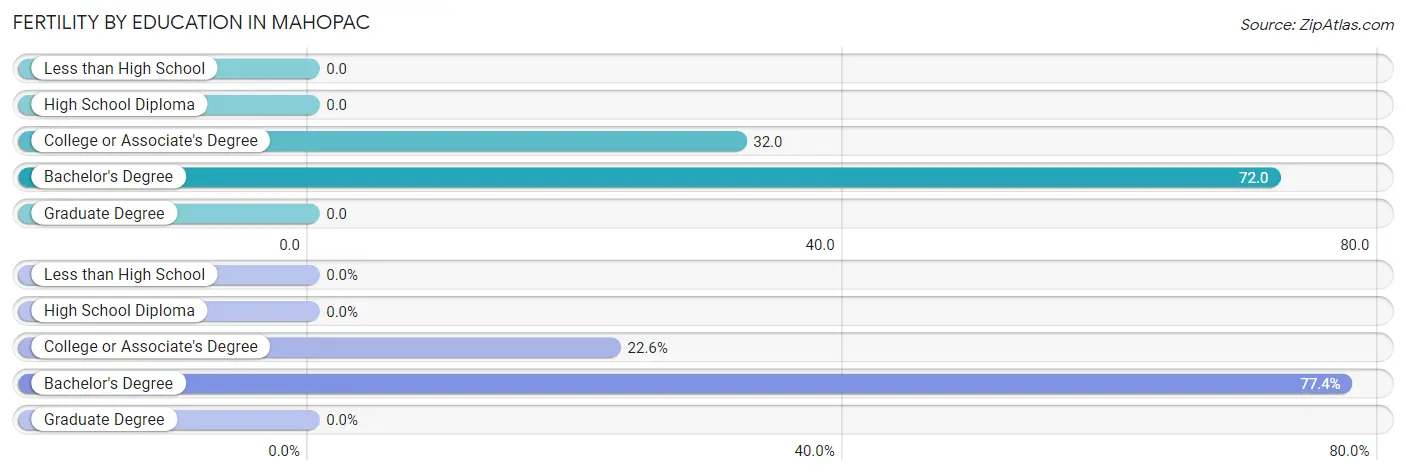
| Educational Attainment | Women with Births | Births / 1,000 Women |
| Less than High School | 0 (0.0%) | 0.0 |
| High School Diploma | 0 (0.0%) | 0.0 |
| College or Associate's Degree | 14 (22.6%) | 32.0 |
| Bachelor's Degree | 48 (77.4%) | 72.0 |
| Graduate Degree | 0 (0.0%) | 0.0 |
| Total | 62 (100.0%) | 32.0 |
Fertility by Education by Marriage Status in Mahopac
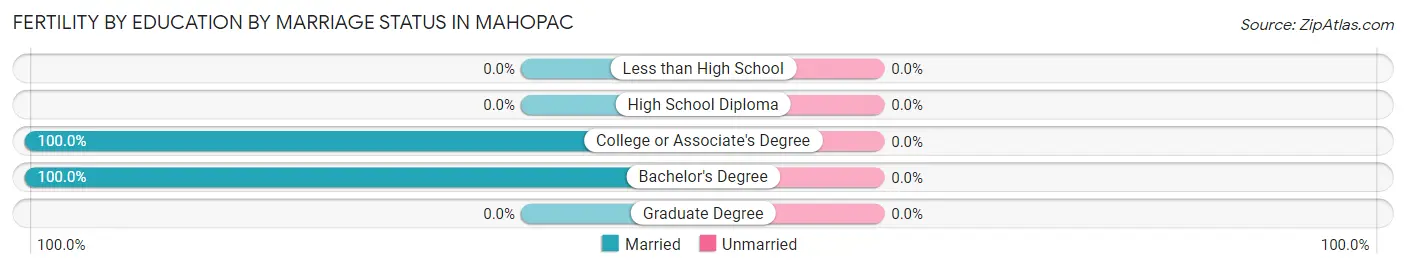
| Educational Attainment | Married | Unmarried |
| Less than High School | 0 (0.0%) | 0 (0.0%) |
| High School Diploma | 0 (0.0%) | 0 (0.0%) |
| College or Associate's Degree | 14 (100.0%) | 0 (0.0%) |
| Bachelor's Degree | 48 (100.0%) | 0 (0.0%) |
| Graduate Degree | 0 (0.0%) | 0 (0.0%) |
| Total | 62 (100.0%) | 0 (0.0%) |
Income in Mahopac
Income Overview in Mahopac
Per Capita Income in Mahopac is $54,113, while median incomes of families and households are $131,729 and $119,563 respectively.
| Characteristic | Number | Measure |
| Per Capita Income | 8,774 | $54,113 |
| Median Family Income | 2,504 | $131,729 |
| Mean Family Income | 2,504 | $156,153 |
| Median Household Income | 3,232 | $119,563 |
| Mean Household Income | 3,232 | $139,734 |
| Income Deficit | 2,504 | $0 |
| Wage / Income Gap (%) | 8,774 | 30.75% |
| Wage / Income Gap ($) | 8,774 | 69.25¢ per $1 |
| Gini / Inequality Index | 8,774 | 0.36 |
Earnings by Sex in Mahopac
Average Earnings in Mahopac are $60,135, $73,193 for men and $50,684 for women, a difference of 30.7%.
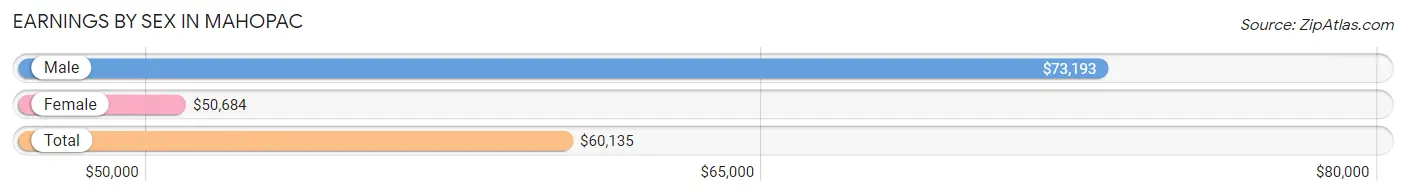
| Sex | Number | Average Earnings |
| Male | 2,689 (51.3%) | $73,193 |
| Female | 2,552 (48.7%) | $50,684 |
| Total | 5,241 (100.0%) | $60,135 |
Earnings by Sex by Income Bracket in Mahopac
The most common earnings brackets in Mahopac are $100,000+ for men (900 | 33.5%) and $100,000+ for women (547 | 21.4%).
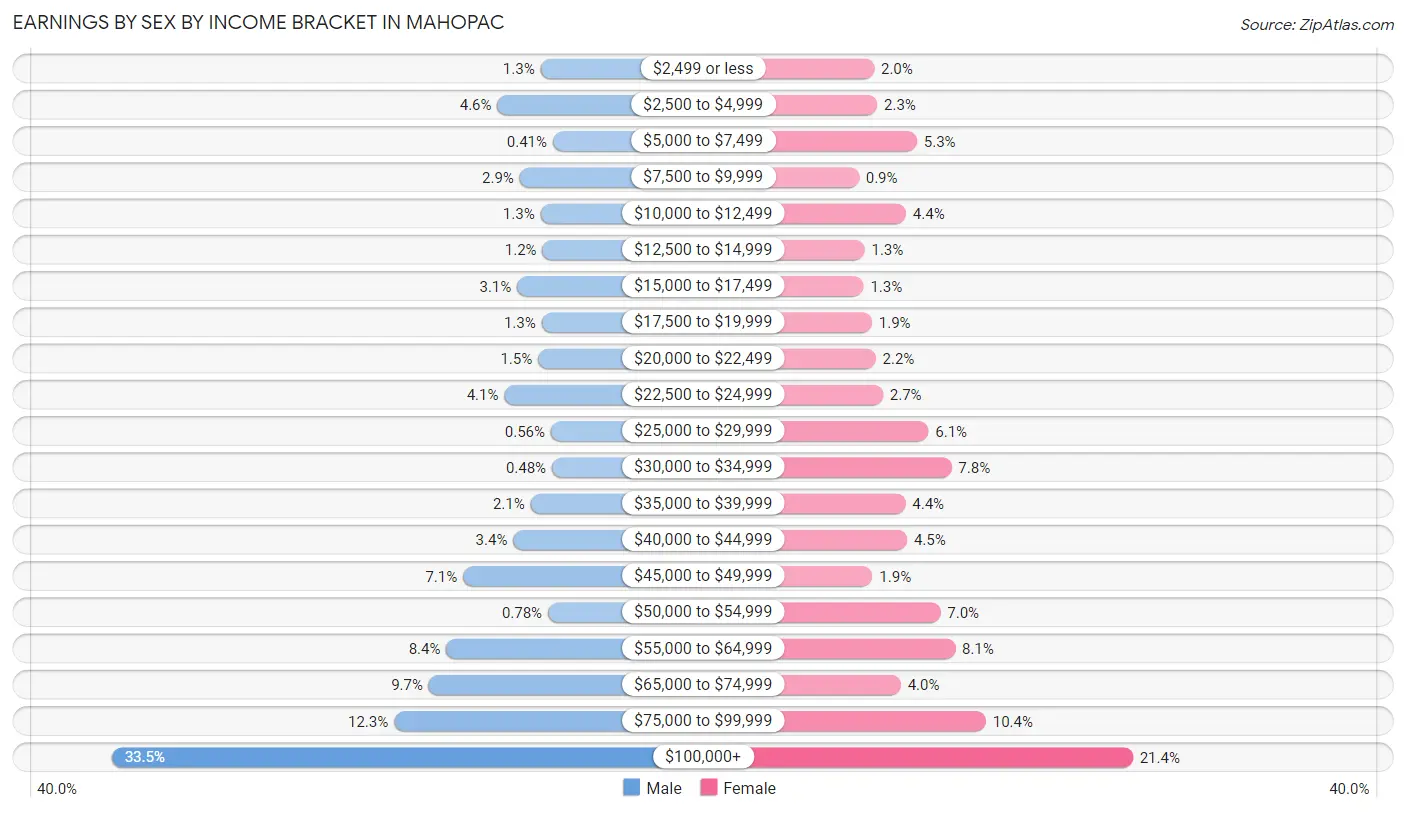
| Income | Male | Female |
| $2,499 or less | 36 (1.3%) | 52 (2.0%) |
| $2,500 to $4,999 | 123 (4.6%) | 58 (2.3%) |
| $5,000 to $7,499 | 11 (0.4%) | 134 (5.2%) |
| $7,500 to $9,999 | 78 (2.9%) | 23 (0.9%) |
| $10,000 to $12,499 | 36 (1.3%) | 113 (4.4%) |
| $12,500 to $14,999 | 32 (1.2%) | 34 (1.3%) |
| $15,000 to $17,499 | 83 (3.1%) | 32 (1.3%) |
| $17,500 to $19,999 | 34 (1.3%) | 48 (1.9%) |
| $20,000 to $22,499 | 41 (1.5%) | 55 (2.2%) |
| $22,500 to $24,999 | 109 (4.1%) | 69 (2.7%) |
| $25,000 to $29,999 | 15 (0.6%) | 156 (6.1%) |
| $30,000 to $34,999 | 13 (0.5%) | 200 (7.8%) |
| $35,000 to $39,999 | 56 (2.1%) | 112 (4.4%) |
| $40,000 to $44,999 | 91 (3.4%) | 115 (4.5%) |
| $45,000 to $49,999 | 192 (7.1%) | 49 (1.9%) |
| $50,000 to $54,999 | 21 (0.8%) | 179 (7.0%) |
| $55,000 to $64,999 | 226 (8.4%) | 207 (8.1%) |
| $65,000 to $74,999 | 261 (9.7%) | 103 (4.0%) |
| $75,000 to $99,999 | 331 (12.3%) | 266 (10.4%) |
| $100,000+ | 900 (33.5%) | 547 (21.4%) |
| Total | 2,689 (100.0%) | 2,552 (100.0%) |
Earnings by Sex by Educational Attainment in Mahopac
Average earnings in Mahopac are $78,419 for men and $55,408 for women, a difference of 29.3%. Men with an educational attainment of bachelor's degree enjoy the highest average annual earnings of $98,700, while those with less than high school education earn the least with $24,360. Women with an educational attainment of graduate degree earn the most with the average annual earnings of $95,625, while those with less than high school education have the smallest earnings of $14,375.
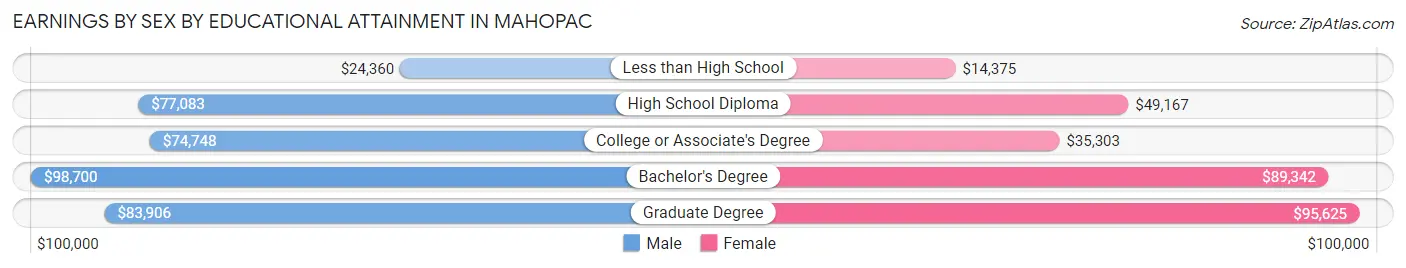
| Educational Attainment | Male Income | Female Income |
| Less than High School | $24,360 | $14,375 |
| High School Diploma | $77,083 | $49,167 |
| College or Associate's Degree | $74,748 | $35,303 |
| Bachelor's Degree | $98,700 | $89,342 |
| Graduate Degree | $83,906 | $95,625 |
| Total | $78,419 | $55,408 |
Family Income in Mahopac
Family Income Brackets in Mahopac
According to the Mahopac family income data, there are 741 families falling into the $100,000 to $149,999 income range, which is the most common income bracket and makes up 29.6% of all families.
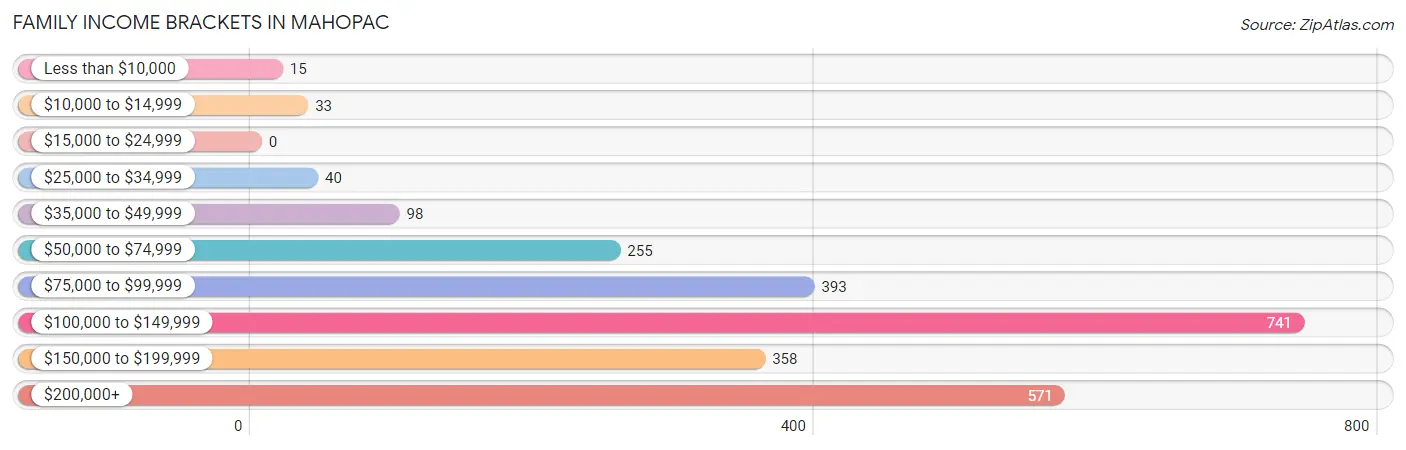
| Income Bracket | # Families | % Families |
| Less than $10,000 | 15 | 0.6% |
| $10,000 to $14,999 | 33 | 1.3% |
| $15,000 to $24,999 | 0 | 0.0% |
| $25,000 to $34,999 | 40 | 1.6% |
| $35,000 to $49,999 | 98 | 3.9% |
| $50,000 to $74,999 | 255 | 10.2% |
| $75,000 to $99,999 | 393 | 15.7% |
| $100,000 to $149,999 | 741 | 29.6% |
| $150,000 to $199,999 | 358 | 14.3% |
| $200,000+ | 571 | 22.8% |
Family Income by Famaliy Size in Mahopac
5-person families (115 | 4.6%) account for the highest median family income in Mahopac with $162,159 per family, while 2-person families (1,090 | 43.5%) have the highest median income of $52,959 per family member.
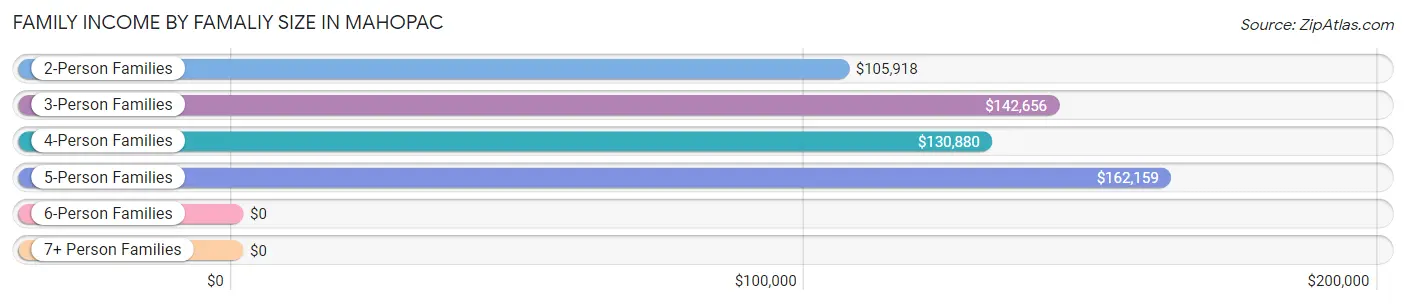
| Income Bracket | # Families | Median Income |
| 2-Person Families | 1,090 (43.5%) | $105,918 |
| 3-Person Families | 603 (24.1%) | $142,656 |
| 4-Person Families | 640 (25.6%) | $130,880 |
| 5-Person Families | 115 (4.6%) | $162,159 |
| 6-Person Families | 56 (2.2%) | $0 |
| 7+ Person Families | 0 (0.0%) | $0 |
| Total | 2,504 (100.0%) | $131,729 |
Family Income by Number of Earners in Mahopac
The median family income in Mahopac is $131,729, with families comprising 3+ earners (361) having the highest median family income of $189,345, while families with no earners (359) have the lowest median family income of $71,438, accounting for 14.4% and 14.3% of families, respectively.
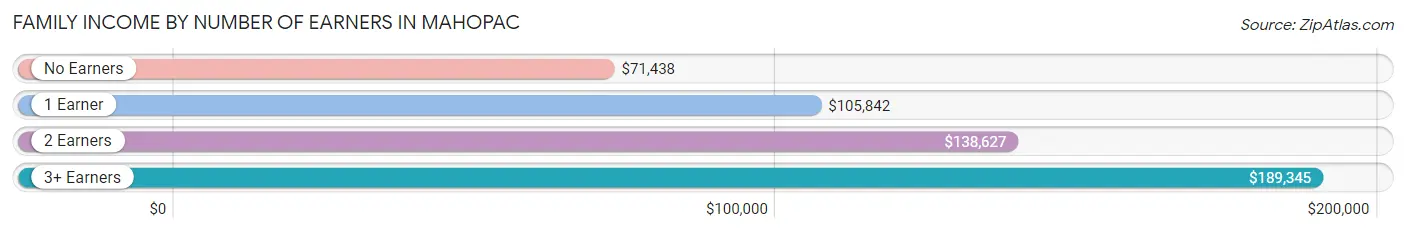
| Number of Earners | # Families | Median Income |
| No Earners | 359 (14.3%) | $71,438 |
| 1 Earner | 423 (16.9%) | $105,842 |
| 2 Earners | 1,361 (54.3%) | $138,627 |
| 3+ Earners | 361 (14.4%) | $189,345 |
| Total | 2,504 (100.0%) | $131,729 |
Household Income in Mahopac
Household Income Brackets in Mahopac
With 921 households falling in the category, the $100,000 to $149,999 income range is the most frequent in Mahopac, accounting for 28.5% of all households. In contrast, only 45 households (1.4%) fall into the $15,000 to $24,999 income bracket, making it the least populous group.
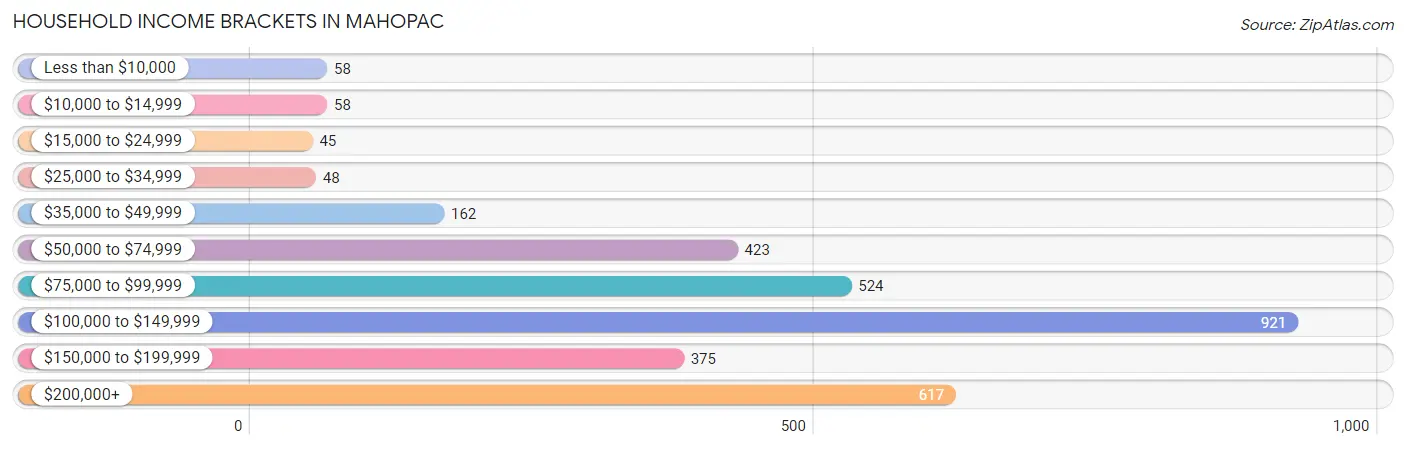
| Income Bracket | # Households | % Households |
| Less than $10,000 | 58 | 1.8% |
| $10,000 to $14,999 | 58 | 1.8% |
| $15,000 to $24,999 | 45 | 1.4% |
| $25,000 to $34,999 | 48 | 1.5% |
| $35,000 to $49,999 | 162 | 5.0% |
| $50,000 to $74,999 | 423 | 13.1% |
| $75,000 to $99,999 | 524 | 16.2% |
| $100,000 to $149,999 | 921 | 28.5% |
| $150,000 to $199,999 | 375 | 11.6% |
| $200,000+ | 617 | 19.1% |
Household Income by Householder Age in Mahopac
The median household income in Mahopac is $119,563, with the highest median household income of $142,550 found in the 25 to 44 years age bracket for the primary householder. A total of 915 households (28.3%) fall into this category. Meanwhile, the 15 to 24 years age bracket for the primary householder has the lowest median household income of $0, with 12 households (0.4%) in this group.
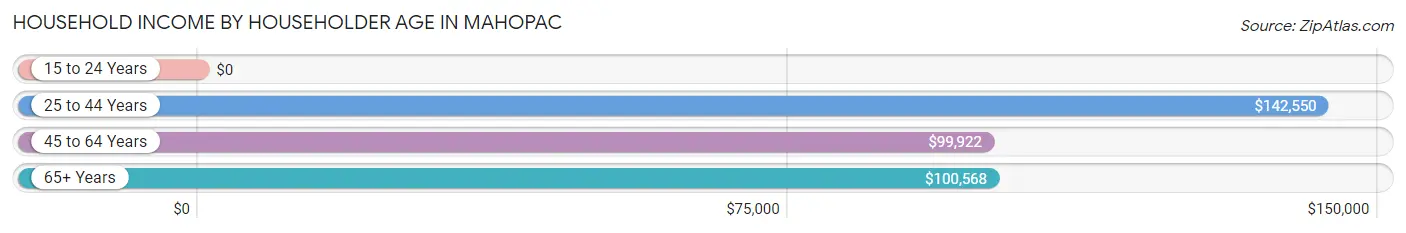
| Income Bracket | # Households | Median Income |
| 15 to 24 Years | 12 (0.4%) | $0 |
| 25 to 44 Years | 915 (28.3%) | $142,550 |
| 45 to 64 Years | 1,434 (44.4%) | $99,922 |
| 65+ Years | 871 (27.0%) | $100,568 |
| Total | 3,232 (100.0%) | $119,563 |
Poverty in Mahopac
Income Below Poverty by Sex and Age in Mahopac
With 1.2% poverty level for males and 3.5% for females among the residents of Mahopac, 15 year old males and 75 year old and over females are the most vulnerable to poverty, with 13 males (23.6%) and 68 females (25.2%) in their respective age groups living below the poverty level.
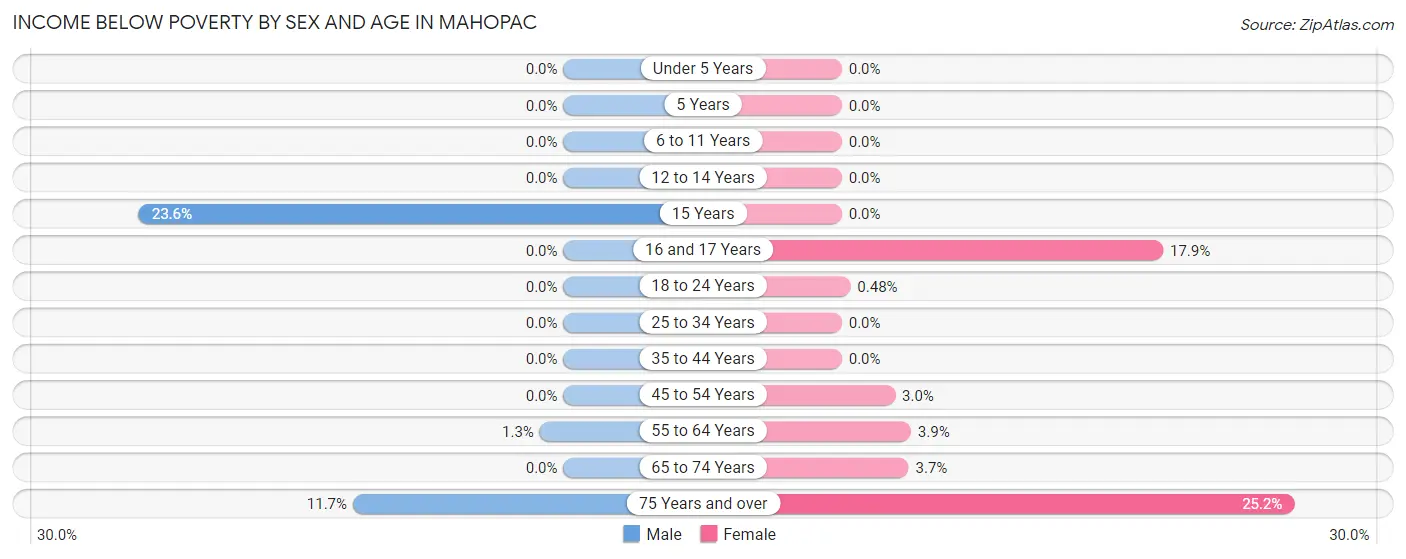
| Age Bracket | Male | Female |
| Under 5 Years | 0 (0.0%) | 0 (0.0%) |
| 5 Years | 0 (0.0%) | 0 (0.0%) |
| 6 to 11 Years | 0 (0.0%) | 0 (0.0%) |
| 12 to 14 Years | 0 (0.0%) | 0 (0.0%) |
| 15 Years | 13 (23.6%) | 0 (0.0%) |
| 16 and 17 Years | 0 (0.0%) | 17 (17.9%) |
| 18 to 24 Years | 0 (0.0%) | 2 (0.5%) |
| 25 to 34 Years | 0 (0.0%) | 0 (0.0%) |
| 35 to 44 Years | 0 (0.0%) | 0 (0.0%) |
| 45 to 54 Years | 0 (0.0%) | 21 (3.0%) |
| 55 to 64 Years | 10 (1.3%) | 25 (3.8%) |
| 65 to 74 Years | 0 (0.0%) | 23 (3.7%) |
| 75 Years and over | 28 (11.7%) | 68 (25.2%) |
| Total | 51 (1.2%) | 156 (3.5%) |
Income Above Poverty by Sex and Age in Mahopac
According to the poverty statistics in Mahopac, males aged under 5 years and females aged under 5 years are the age groups that are most secure financially, with 100.0% of males and 100.0% of females in these age groups living above the poverty line.
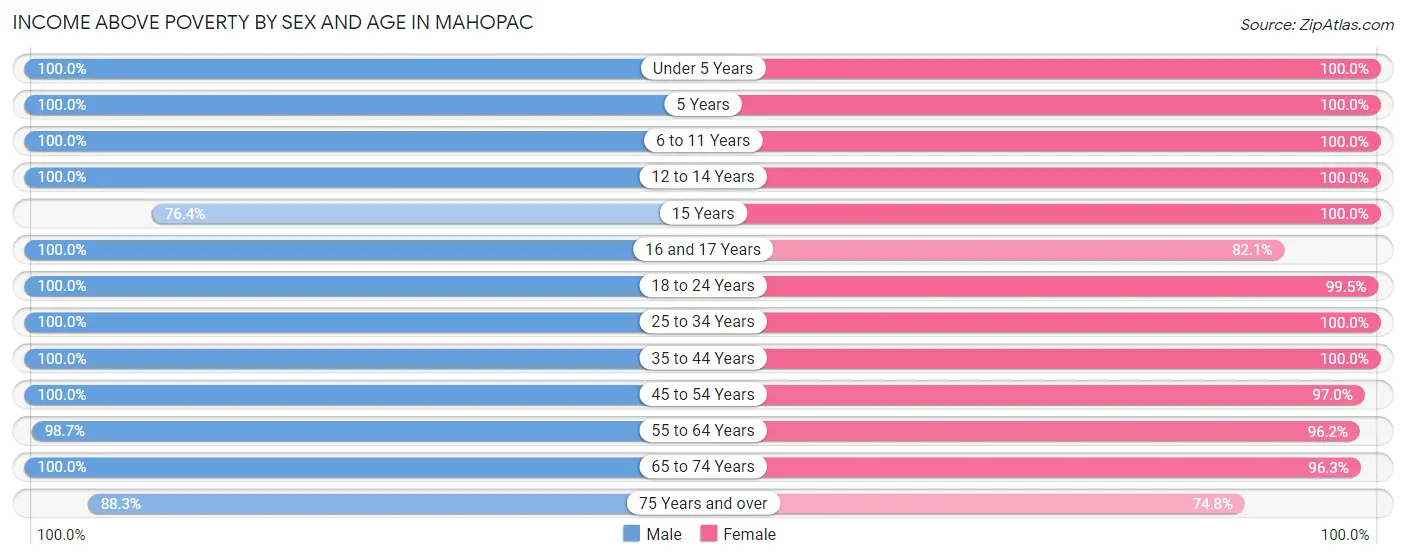
| Age Bracket | Male | Female |
| Under 5 Years | 149 (100.0%) | 246 (100.0%) |
| 5 Years | 11 (100.0%) | 62 (100.0%) |
| 6 to 11 Years | 295 (100.0%) | 295 (100.0%) |
| 12 to 14 Years | 227 (100.0%) | 68 (100.0%) |
| 15 Years | 42 (76.4%) | 53 (100.0%) |
| 16 and 17 Years | 84 (100.0%) | 78 (82.1%) |
| 18 to 24 Years | 332 (100.0%) | 417 (99.5%) |
| 25 to 34 Years | 578 (100.0%) | 547 (100.0%) |
| 35 to 44 Years | 511 (100.0%) | 447 (100.0%) |
| 45 to 54 Years | 579 (100.0%) | 687 (97.0%) |
| 55 to 64 Years | 750 (98.7%) | 624 (96.2%) |
| 65 to 74 Years | 432 (100.0%) | 595 (96.3%) |
| 75 Years and over | 211 (88.3%) | 202 (74.8%) |
| Total | 4,201 (98.8%) | 4,321 (96.5%) |
Income Below Poverty Among Married-Couple Families in Mahopac
The poverty statistics for married-couple families in Mahopac show that 1.7% or 35 of the total 2,089 families live below the poverty line. Families with no children have the highest poverty rate of 2.8%, comprising of 35 families. On the other hand, families with 1 or 2 children have the lowest poverty rate of 0.0%, which includes 0 families.
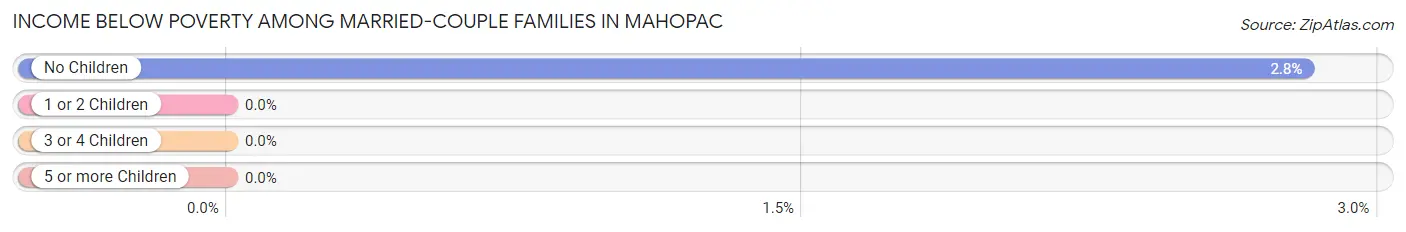
| Children | Above Poverty | Below Poverty |
| No Children | 1,211 (97.2%) | 35 (2.8%) |
| 1 or 2 Children | 808 (100.0%) | 0 (0.0%) |
| 3 or 4 Children | 35 (100.0%) | 0 (0.0%) |
| 5 or more Children | 0 (0.0%) | 0 (0.0%) |
| Total | 2,054 (98.3%) | 35 (1.7%) |
Income Below Poverty Among Single-Parent Households in Mahopac
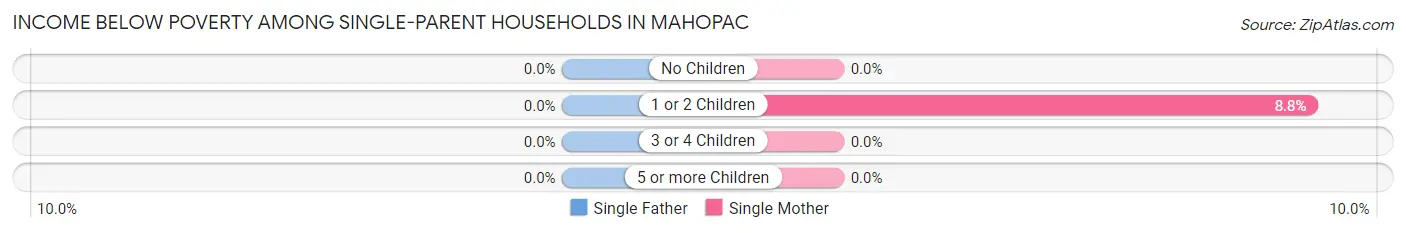
| Children | Single Father | Single Mother |
| No Children | 0 (0.0%) | 0 (0.0%) |
| 1 or 2 Children | 0 (0.0%) | 13 (8.8%) |
| 3 or 4 Children | 0 (0.0%) | 0 (0.0%) |
| 5 or more Children | 0 (0.0%) | 0 (0.0%) |
| Total | 0 (0.0%) | 13 (4.5%) |
Income Below Poverty Among Married-Couple vs Single-Parent Households in Mahopac
The poverty data for Mahopac shows that 35 of the married-couple family households (1.7%) and 13 of the single-parent households (3.1%) are living below the poverty level. Within the married-couple family households, those with no children have the highest poverty rate, with 35 households (2.8%) falling below the poverty line. Among the single-parent households, those with 1 or 2 children have the highest poverty rate, with 13 household (7.6%) living below poverty.
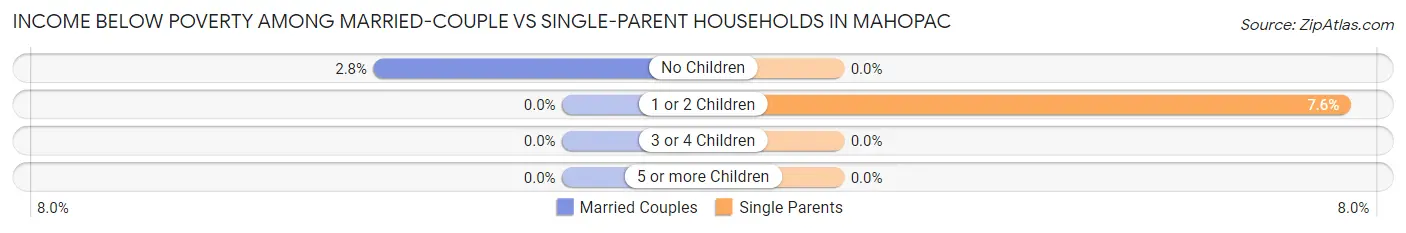
| Children | Married-Couple Families | Single-Parent Households |
| No Children | 35 (2.8%) | 0 (0.0%) |
| 1 or 2 Children | 0 (0.0%) | 13 (7.6%) |
| 3 or 4 Children | 0 (0.0%) | 0 (0.0%) |
| 5 or more Children | 0 (0.0%) | 0 (0.0%) |
| Total | 35 (1.7%) | 13 (3.1%) |
Employment Characteristics in Mahopac
Employment by Class of Employer in Mahopac
Among the 4,541 employed individuals in Mahopac, private company employees (2,445 | 53.8%), local government employees (674 | 14.8%), and not-for-profit organizations (369 | 8.1%) make up the most common classes of employment.
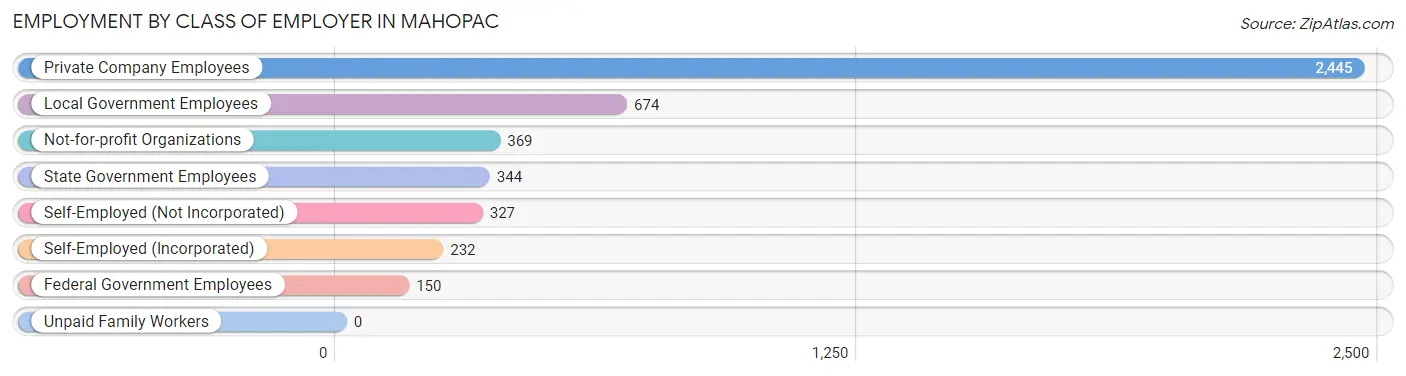
| Employer Class | # Employees | % Employees |
| Private Company Employees | 2,445 | 53.8% |
| Self-Employed (Incorporated) | 232 | 5.1% |
| Self-Employed (Not Incorporated) | 327 | 7.2% |
| Not-for-profit Organizations | 369 | 8.1% |
| Local Government Employees | 674 | 14.8% |
| State Government Employees | 344 | 7.6% |
| Federal Government Employees | 150 | 3.3% |
| Unpaid Family Workers | 0 | 0.0% |
| Total | 4,541 | 100.0% |
Employment Status by Age in Mahopac
According to the labor force statistics for Mahopac, out of the total population over 16 years of age (7,268), 65.9% or 4,790 individuals are in the labor force, with 3.5% or 168 of them unemployed. The age group with the highest labor force participation rate is 25 to 29 years, with 95.0% or 494 individuals in the labor force. Within the labor force, the 30 to 34 years age range has the highest percentage of unemployed individuals, with 17.2% or 90 of them being unemployed.
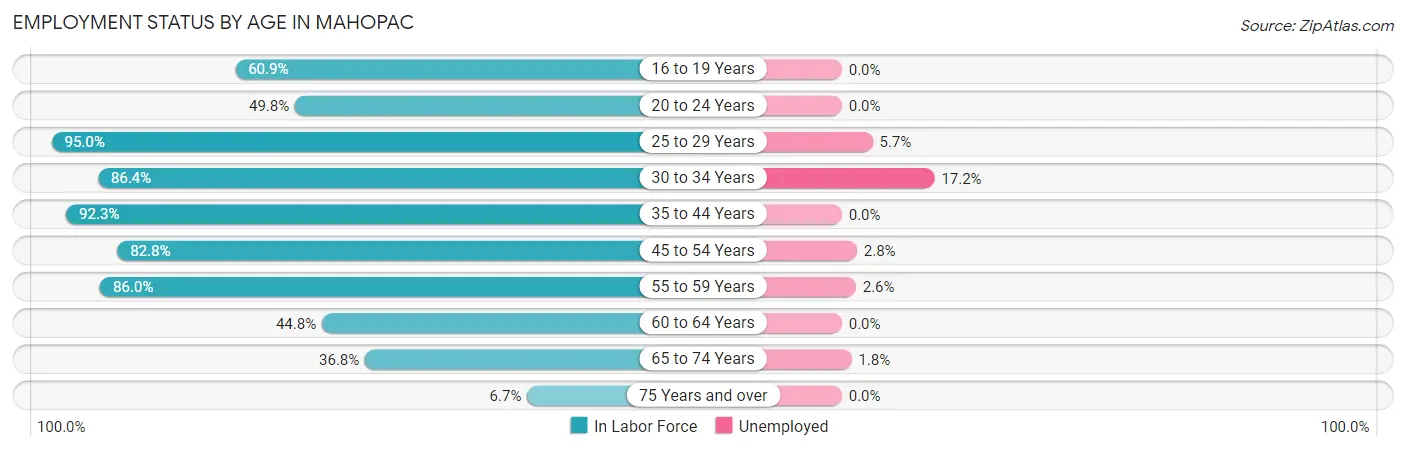
| Age Bracket | In Labor Force | Unemployed |
| 16 to 19 Years | 171 (60.9%) | 0 (0.0%) |
| 20 to 24 Years | 323 (49.8%) | 0 (0.0%) |
| 25 to 29 Years | 494 (95.0%) | 28 (5.7%) |
| 30 to 34 Years | 523 (86.4%) | 90 (17.2%) |
| 35 to 44 Years | 884 (92.3%) | 0 (0.0%) |
| 45 to 54 Years | 1,066 (82.8%) | 30 (2.8%) |
| 55 to 59 Years | 584 (86.0%) | 15 (2.6%) |
| 60 to 64 Years | 327 (44.8%) | 0 (0.0%) |
| 65 to 74 Years | 386 (36.8%) | 7 (1.8%) |
| 75 Years and over | 34 (6.7%) | 0 (0.0%) |
| Total | 4,790 (65.9%) | 168 (3.5%) |
Employment Status by Educational Attainment in Mahopac
According to labor force statistics for Mahopac, 81.1% of individuals (3,876) out of the total population between 25 and 64 years of age (4,779) are in the labor force, with 4.2% or 163 of them being unemployed. The group with the highest labor force participation rate are those with the educational attainment of high school diploma, with 90.5% or 986 individuals in the labor force. Within the labor force, individuals with high school diploma education have the highest percentage of unemployment, with 10.4% or 103 of them being unemployed.
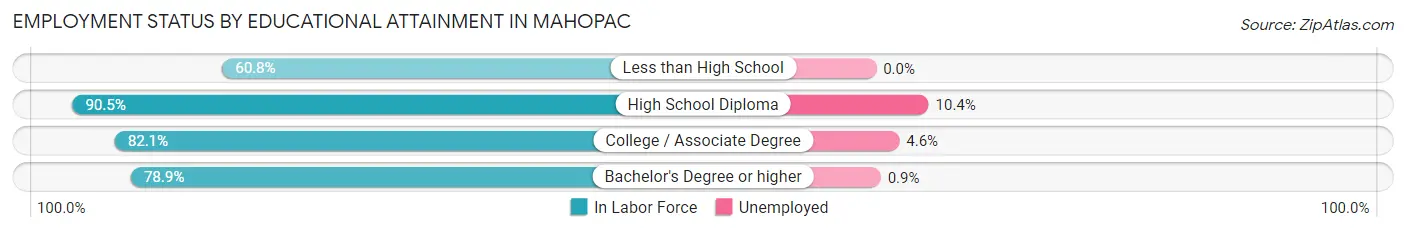
| Educational Attainment | In Labor Force | Unemployed |
| Less than High School | 200 (60.8%) | 0 (0.0%) |
| High School Diploma | 986 (90.5%) | 113 (10.4%) |
| College / Associate Degree | 988 (82.1%) | 55 (4.6%) |
| Bachelor's Degree or higher | 1,701 (78.9%) | 19 (0.9%) |
| Total | 3,876 (81.1%) | 201 (4.2%) |
Employment Occupations by Sex in Mahopac
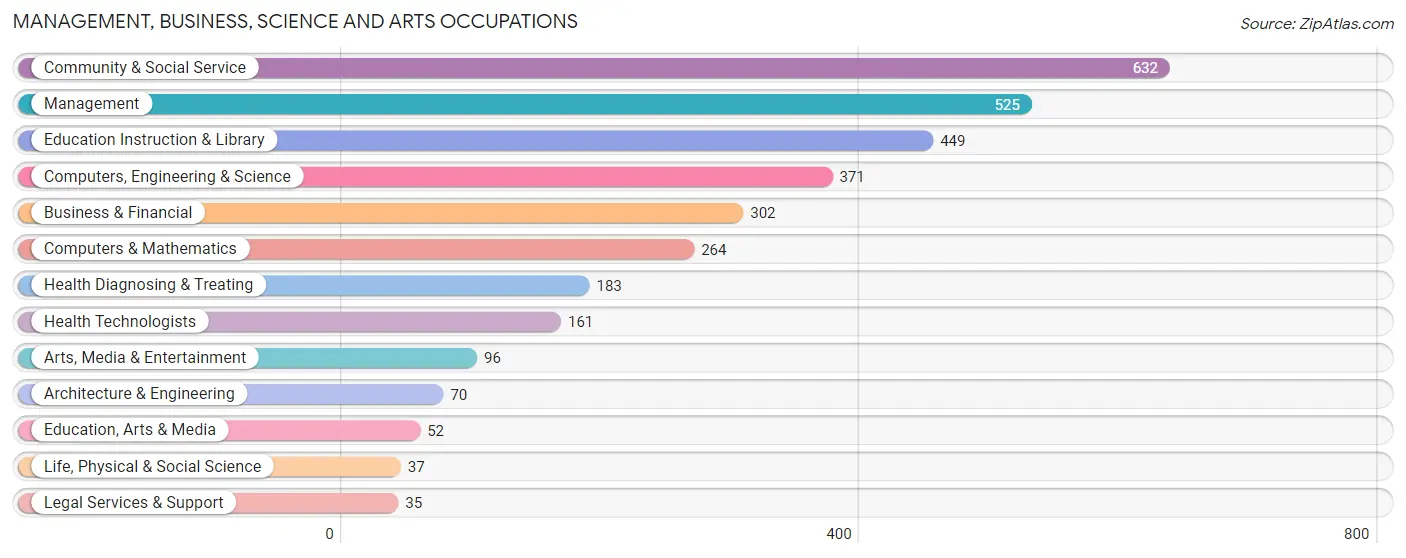
Management, Business, Science and Arts Occupations
The most common Management, Business, Science and Arts occupations in Mahopac are Community & Social Service (632 | 13.7%), Management (525 | 11.4%), Education Instruction & Library (449 | 9.7%), Computers, Engineering & Science (371 | 8.0%), and Business & Financial (302 | 6.5%).
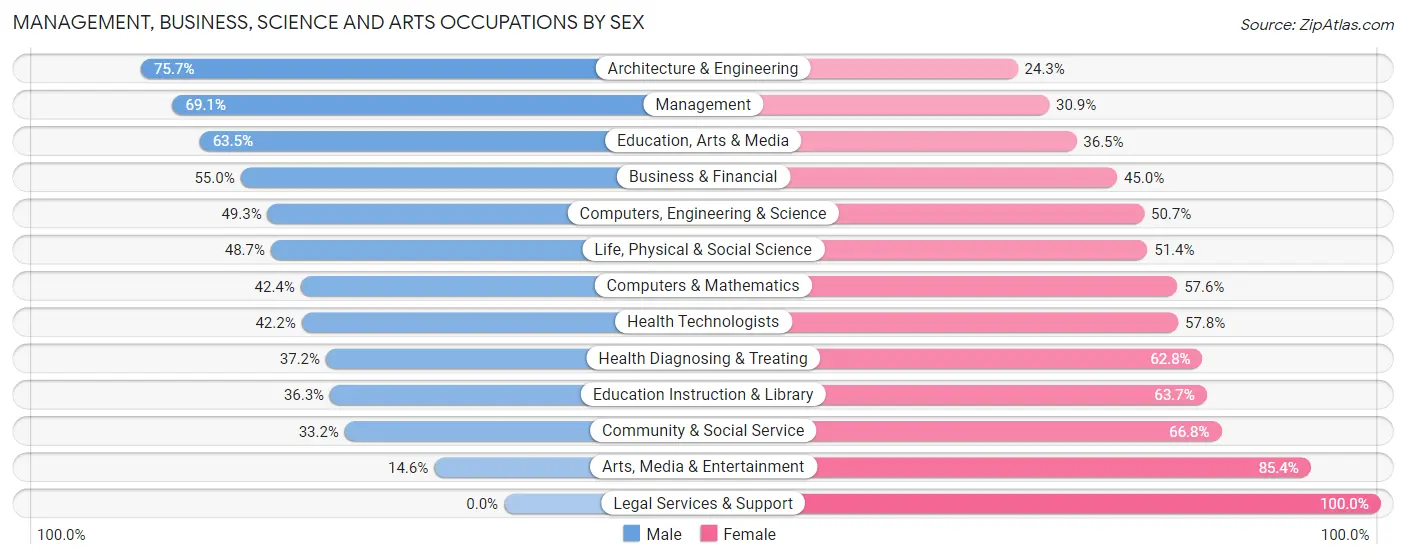
Management, Business, Science and Arts Occupations by Sex
Within the Management, Business, Science and Arts occupations in Mahopac, the most male-oriented occupations are Architecture & Engineering (75.7%), Management (69.1%), and Education, Arts & Media (63.5%), while the most female-oriented occupations are Legal Services & Support (100.0%), Arts, Media & Entertainment (85.4%), and Community & Social Service (66.8%).
| Occupation | Male | Female |
| Management | 363 (69.1%) | 162 (30.9%) |
| Business & Financial | 166 (55.0%) | 136 (45.0%) |
| Computers, Engineering & Science | 183 (49.3%) | 188 (50.7%) |
| Computers & Mathematics | 112 (42.4%) | 152 (57.6%) |
| Architecture & Engineering | 53 (75.7%) | 17 (24.3%) |
| Life, Physical & Social Science | 18 (48.6%) | 19 (51.3%) |
| Community & Social Service | 210 (33.2%) | 422 (66.8%) |
| Education, Arts & Media | 33 (63.5%) | 19 (36.5%) |
| Legal Services & Support | 0 (0.0%) | 35 (100.0%) |
| Education Instruction & Library | 163 (36.3%) | 286 (63.7%) |
| Arts, Media & Entertainment | 14 (14.6%) | 82 (85.4%) |
| Health Diagnosing & Treating | 68 (37.2%) | 115 (62.8%) |
| Health Technologists | 68 (42.2%) | 93 (57.8%) |
| Total (Category) | 990 (49.2%) | 1,023 (50.8%) |
| Total (Overall) | 2,451 (53.0%) | 2,170 (47.0%) |
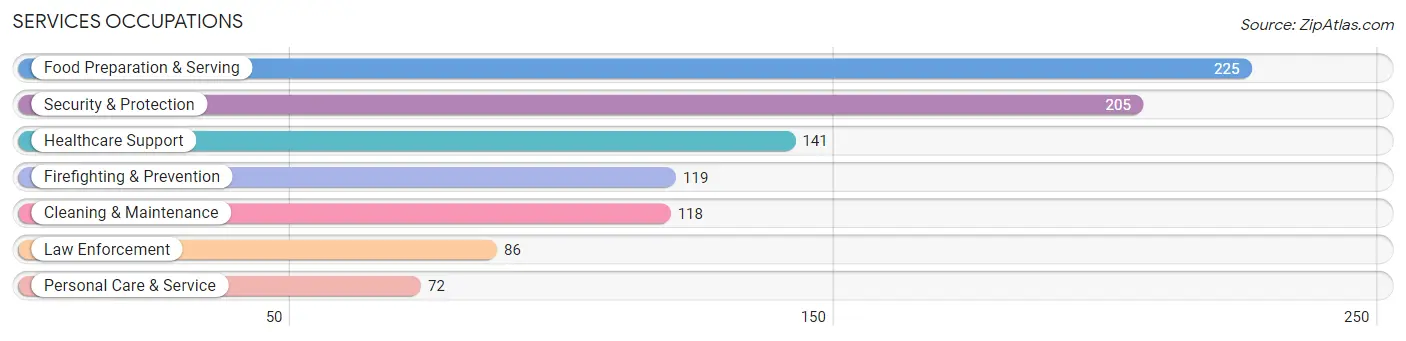
Services Occupations
The most common Services occupations in Mahopac are Food Preparation & Serving (225 | 4.9%), Security & Protection (205 | 4.4%), Healthcare Support (141 | 3.0%), Firefighting & Prevention (119 | 2.6%), and Cleaning & Maintenance (118 | 2.5%).
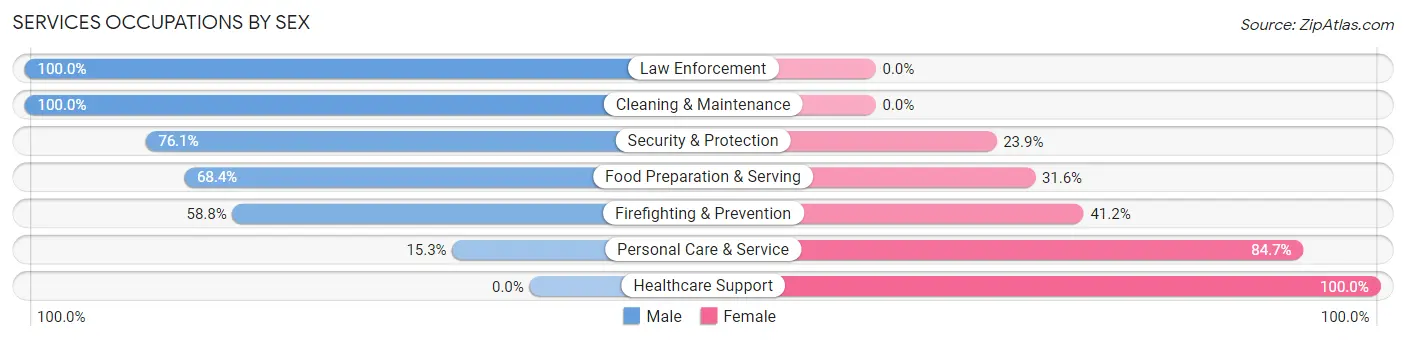
Services Occupations by Sex
Within the Services occupations in Mahopac, the most male-oriented occupations are Law Enforcement (100.0%), Cleaning & Maintenance (100.0%), and Security & Protection (76.1%), while the most female-oriented occupations are Healthcare Support (100.0%), Personal Care & Service (84.7%), and Firefighting & Prevention (41.2%).
| Occupation | Male | Female |
| Healthcare Support | 0 (0.0%) | 141 (100.0%) |
| Security & Protection | 156 (76.1%) | 49 (23.9%) |
| Firefighting & Prevention | 70 (58.8%) | 49 (41.2%) |
| Law Enforcement | 86 (100.0%) | 0 (0.0%) |
| Food Preparation & Serving | 154 (68.4%) | 71 (31.6%) |
| Cleaning & Maintenance | 118 (100.0%) | 0 (0.0%) |
| Personal Care & Service | 11 (15.3%) | 61 (84.7%) |
| Total (Category) | 439 (57.7%) | 322 (42.3%) |
| Total (Overall) | 2,451 (53.0%) | 2,170 (47.0%) |
Sales and Office Occupations
The most common Sales and Office occupations in Mahopac are Sales & Related (626 | 13.6%), and Office & Administration (566 | 12.2%).
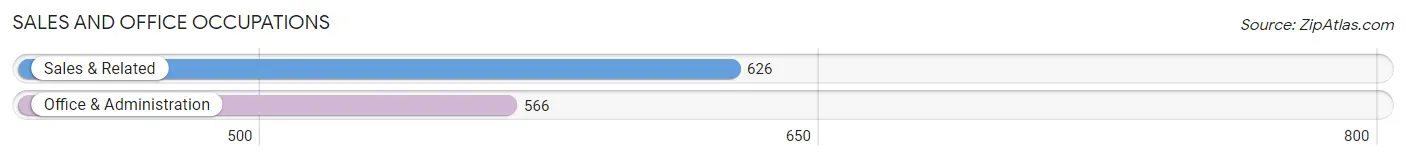
Sales and Office Occupations by Sex
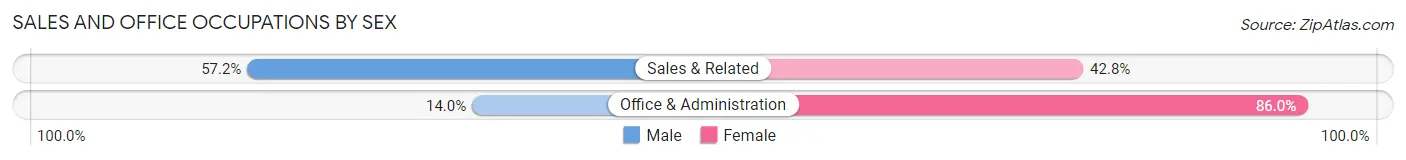
| Occupation | Male | Female |
| Sales & Related | 358 (57.2%) | 268 (42.8%) |
| Office & Administration | 79 (14.0%) | 487 (86.0%) |
| Total (Category) | 437 (36.7%) | 755 (63.3%) |
| Total (Overall) | 2,451 (53.0%) | 2,170 (47.0%) |
Natural Resources, Construction and Maintenance Occupations
The most common Natural Resources, Construction and Maintenance occupations in Mahopac are Construction & Extraction (321 | 7.0%), Installation, Maintenance & Repair (83 | 1.8%), and Farming, Fishing & Forestry (12 | 0.3%).
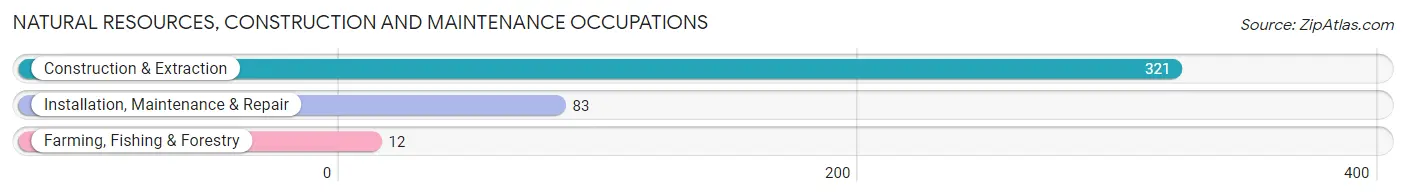
Natural Resources, Construction and Maintenance Occupations by Sex
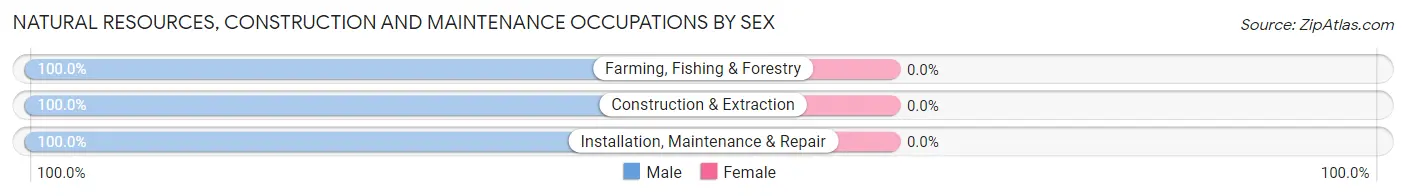
| Occupation | Male | Female |
| Farming, Fishing & Forestry | 12 (100.0%) | 0 (0.0%) |
| Construction & Extraction | 321 (100.0%) | 0 (0.0%) |
| Installation, Maintenance & Repair | 83 (100.0%) | 0 (0.0%) |
| Total (Category) | 416 (100.0%) | 0 (0.0%) |
| Total (Overall) | 2,451 (53.0%) | 2,170 (47.0%) |
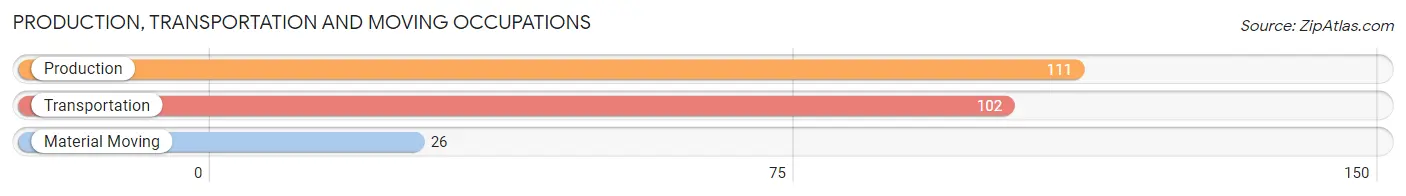
Production, Transportation and Moving Occupations
The most common Production, Transportation and Moving occupations in Mahopac are Production (111 | 2.4%), Transportation (102 | 2.2%), and Material Moving (26 | 0.6%).
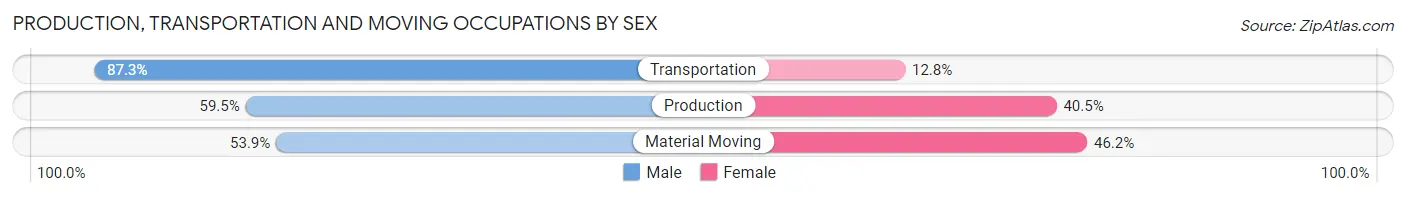
Production, Transportation and Moving Occupations by Sex
| Occupation | Male | Female |
| Production | 66 (59.5%) | 45 (40.5%) |
| Transportation | 89 (87.3%) | 13 (12.8%) |
| Material Moving | 14 (53.8%) | 12 (46.2%) |
| Total (Category) | 169 (70.7%) | 70 (29.3%) |
| Total (Overall) | 2,451 (53.0%) | 2,170 (47.0%) |
Employment Industries by Sex in Mahopac
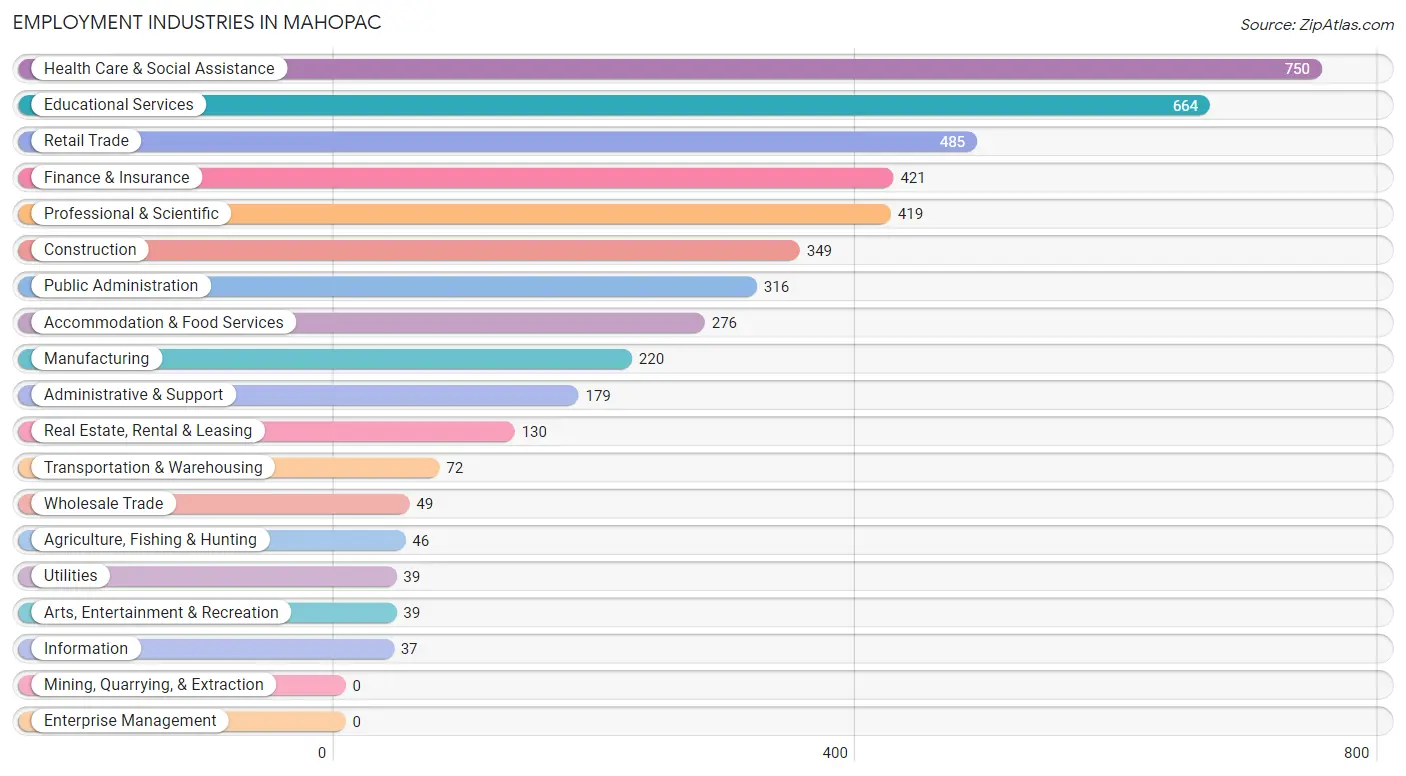
Employment Industries in Mahopac
The major employment industries in Mahopac include Health Care & Social Assistance (750 | 16.2%), Educational Services (664 | 14.4%), Retail Trade (485 | 10.5%), Finance & Insurance (421 | 9.1%), and Professional & Scientific (419 | 9.1%).
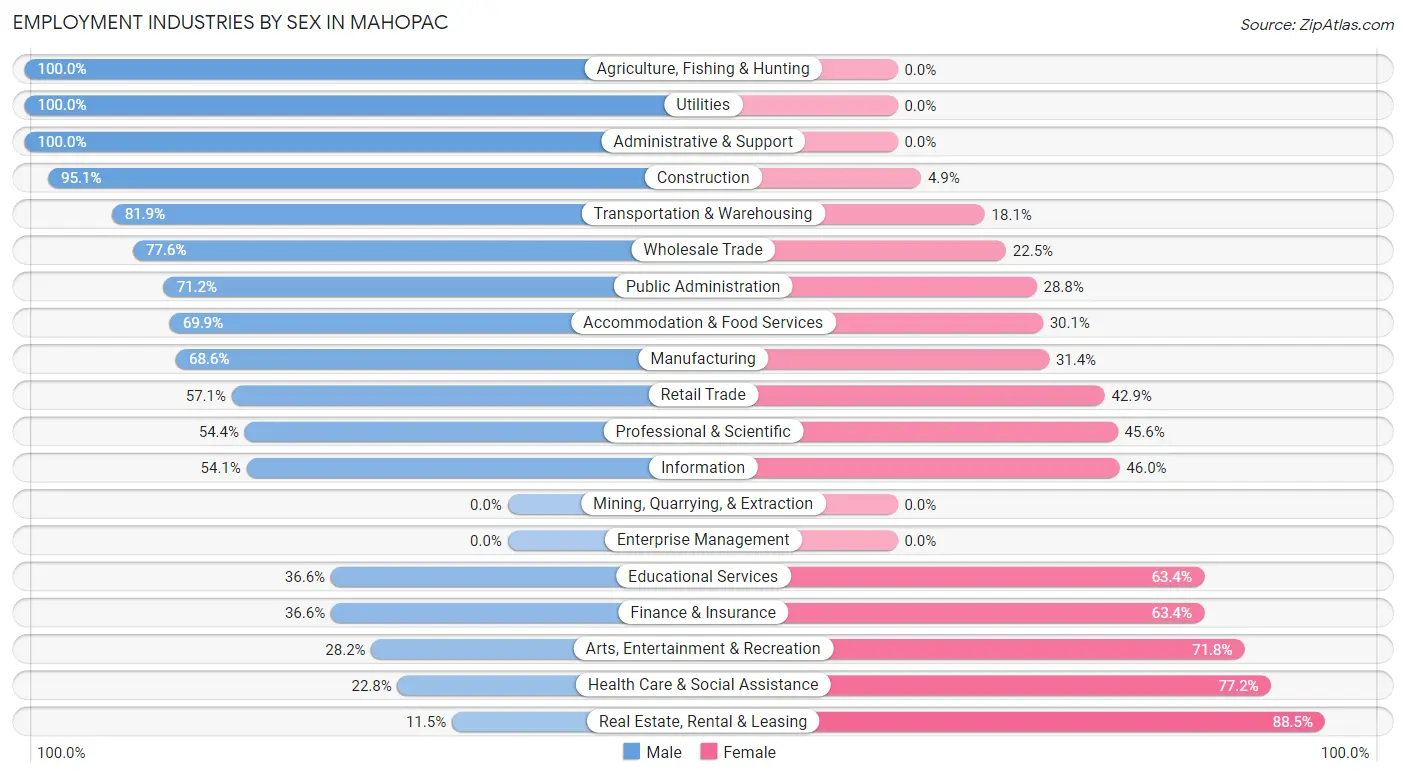
Employment Industries by Sex in Mahopac
The Mahopac industries that see more men than women are Agriculture, Fishing & Hunting (100.0%), Utilities (100.0%), and Administrative & Support (100.0%), whereas the industries that tend to have a higher number of women are Real Estate, Rental & Leasing (88.5%), Health Care & Social Assistance (77.2%), and Arts, Entertainment & Recreation (71.8%).
| Industry | Male | Female |
| Agriculture, Fishing & Hunting | 46 (100.0%) | 0 (0.0%) |
| Mining, Quarrying, & Extraction | 0 (0.0%) | 0 (0.0%) |
| Construction | 332 (95.1%) | 17 (4.9%) |
| Manufacturing | 151 (68.6%) | 69 (31.4%) |
| Wholesale Trade | 38 (77.5%) | 11 (22.5%) |
| Retail Trade | 277 (57.1%) | 208 (42.9%) |
| Transportation & Warehousing | 59 (81.9%) | 13 (18.1%) |
| Utilities | 39 (100.0%) | 0 (0.0%) |
| Information | 20 (54.0%) | 17 (46.0%) |
| Finance & Insurance | 154 (36.6%) | 267 (63.4%) |
| Real Estate, Rental & Leasing | 15 (11.5%) | 115 (88.5%) |
| Professional & Scientific | 228 (54.4%) | 191 (45.6%) |
| Enterprise Management | 0 (0.0%) | 0 (0.0%) |
| Administrative & Support | 179 (100.0%) | 0 (0.0%) |
| Educational Services | 243 (36.6%) | 421 (63.4%) |
| Health Care & Social Assistance | 171 (22.8%) | 579 (77.2%) |
| Arts, Entertainment & Recreation | 11 (28.2%) | 28 (71.8%) |
| Accommodation & Food Services | 193 (69.9%) | 83 (30.1%) |
| Public Administration | 225 (71.2%) | 91 (28.8%) |
| Total | 2,451 (53.0%) | 2,170 (47.0%) |
Education in Mahopac
School Enrollment in Mahopac
The most common levels of schooling among the 2,006 students in Mahopac are elementary school (569 | 28.4%), college / undergraduate (532 | 26.5%), and high school (328 | 16.4%).
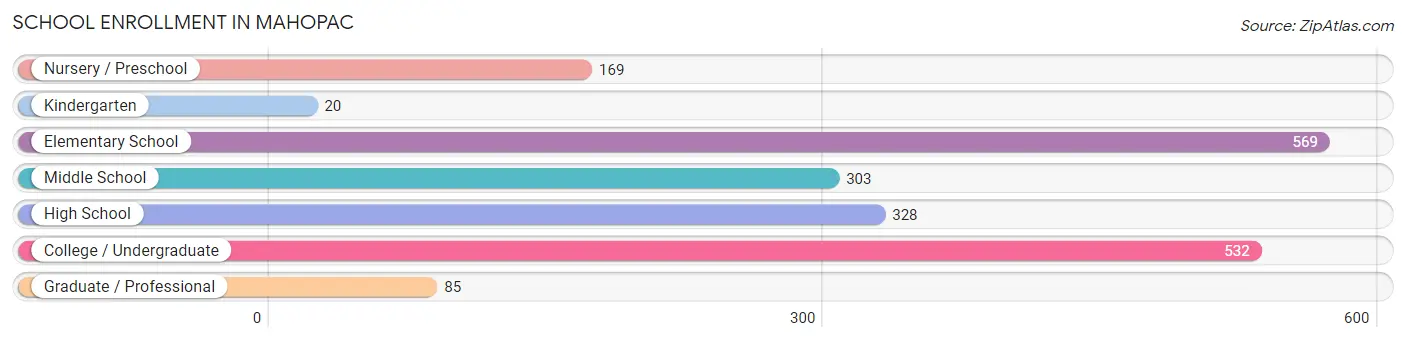
| School Level | # Students | % Students |
| Nursery / Preschool | 169 | 8.4% |
| Kindergarten | 20 | 1.0% |
| Elementary School | 569 | 28.4% |
| Middle School | 303 | 15.1% |
| High School | 328 | 16.4% |
| College / Undergraduate | 532 | 26.5% |
| Graduate / Professional | 85 | 4.2% |
| Total | 2,006 | 100.0% |
School Enrollment by Age by Funding Source in Mahopac
Out of a total of 2,006 students who are enrolled in schools in Mahopac, 481 (24.0%) attend a private institution, while the remaining 1,525 (76.0%) are enrolled in public schools. The age group of 35 years and over has the highest likelihood of being enrolled in private schools, with 35 (58.3% in the age bracket) enrolled. Conversely, the age group of 10 to 14 year olds has the lowest likelihood of being enrolled in a private school, with 392 (97.0% in the age bracket) attending a public institution.
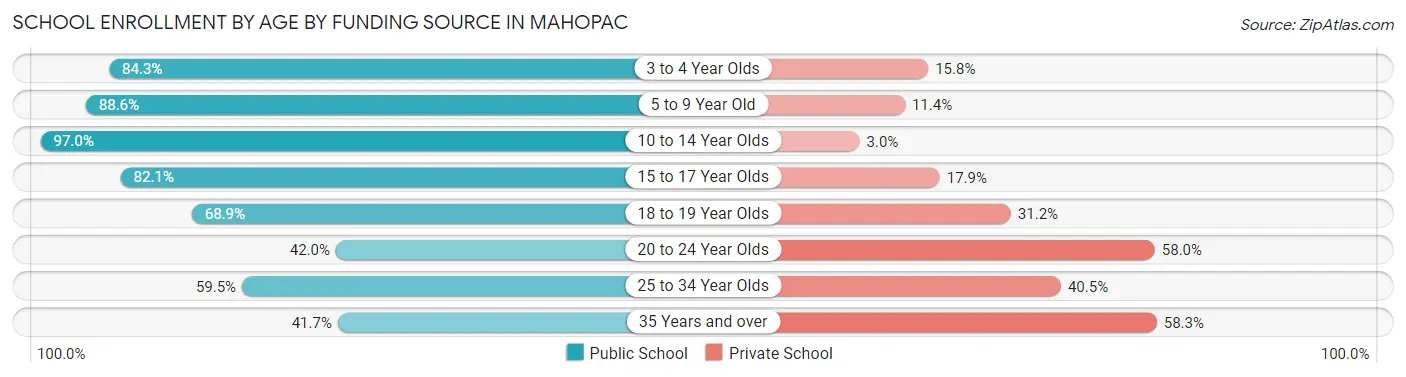
| Age Bracket | Public School | Private School |
| 3 to 4 Year Olds | 107 (84.3%) | 20 (15.8%) |
| 5 to 9 Year Old | 504 (88.6%) | 65 (11.4%) |
| 10 to 14 Year Olds | 392 (97.0%) | 12 (3.0%) |
| 15 to 17 Year Olds | 211 (82.1%) | 46 (17.9%) |
| 18 to 19 Year Olds | 42 (68.9%) | 19 (31.1%) |
| 20 to 24 Year Olds | 169 (42.0%) | 233 (58.0%) |
| 25 to 34 Year Olds | 75 (59.5%) | 51 (40.5%) |
| 35 Years and over | 25 (41.7%) | 35 (58.3%) |
| Total | 1,525 (76.0%) | 481 (24.0%) |
Educational Attainment by Field of Study in Mahopac
Business (1,018 | 37.6%), education (352 | 13.0%), arts & humanities (206 | 7.6%), social sciences (205 | 7.6%), and visual & performing arts (164 | 6.0%) are the most common fields of study among 2,711 individuals in Mahopac who have obtained a bachelor's degree or higher.
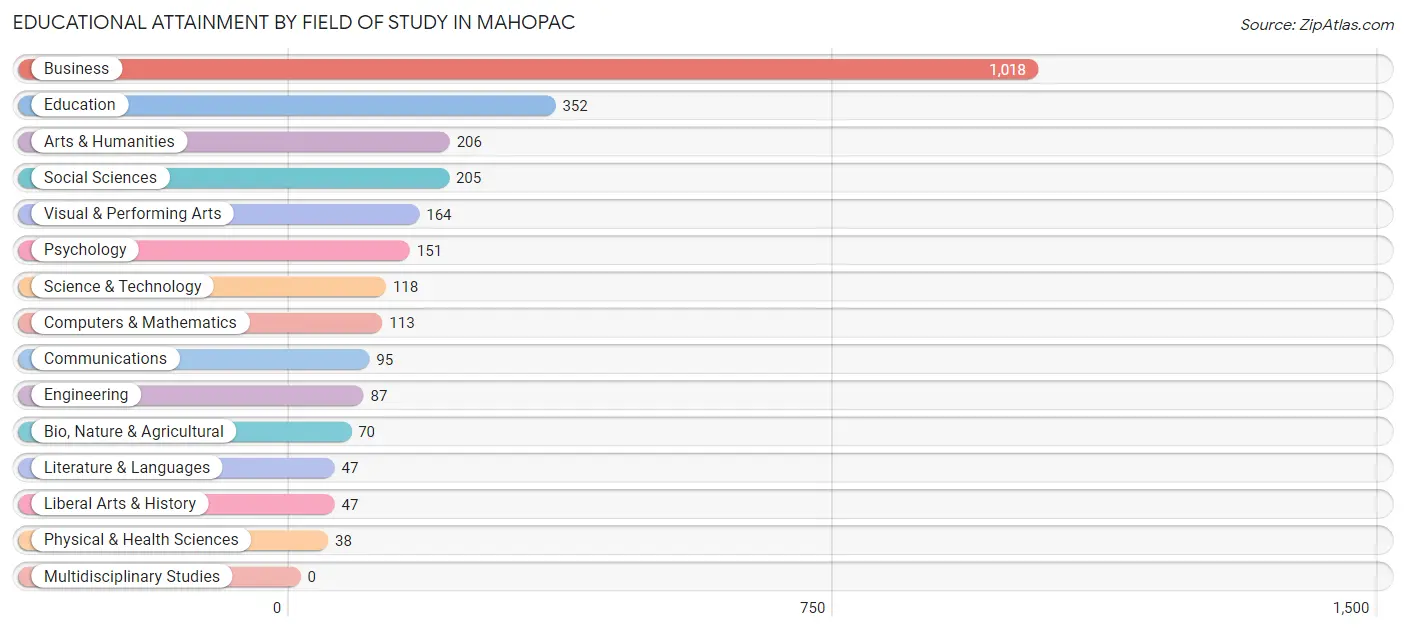
| Field of Study | # Graduates | % Graduates |
| Computers & Mathematics | 113 | 4.2% |
| Bio, Nature & Agricultural | 70 | 2.6% |
| Physical & Health Sciences | 38 | 1.4% |
| Psychology | 151 | 5.6% |
| Social Sciences | 205 | 7.6% |
| Engineering | 87 | 3.2% |
| Multidisciplinary Studies | 0 | 0.0% |
| Science & Technology | 118 | 4.3% |
| Business | 1,018 | 37.6% |
| Education | 352 | 13.0% |
| Literature & Languages | 47 | 1.7% |
| Liberal Arts & History | 47 | 1.7% |
| Visual & Performing Arts | 164 | 6.0% |
| Communications | 95 | 3.5% |
| Arts & Humanities | 206 | 7.6% |
| Total | 2,711 | 100.0% |
Transportation & Commute in Mahopac
Vehicle Availability by Sex in Mahopac
The most prevalent vehicle ownership categories in Mahopac are males with 2 vehicles (1,363, accounting for 56.4%) and females with 2 vehicles (977, making up 64.1%).
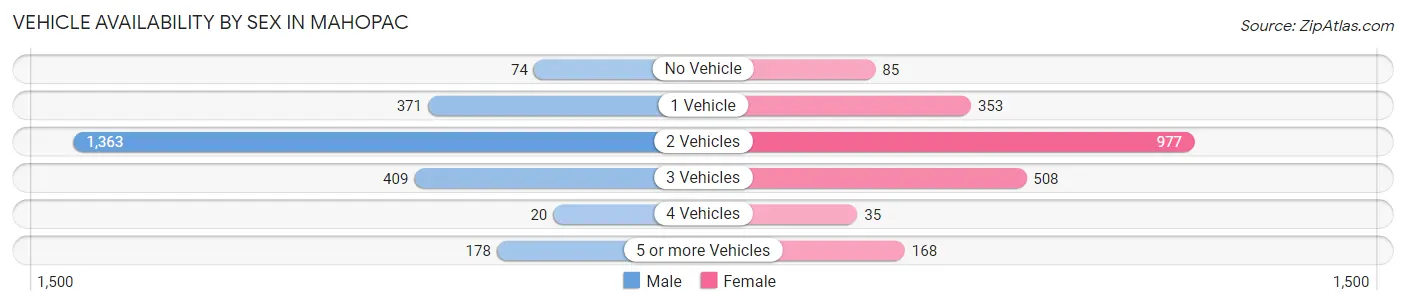
| Vehicles Available | Male | Female |
| No Vehicle | 74 (3.1%) | 85 (4.0%) |
| 1 Vehicle | 371 (15.4%) | 353 (16.6%) |
| 2 Vehicles | 1,363 (56.4%) | 977 (46.0%) |
| 3 Vehicles | 409 (16.9%) | 508 (23.9%) |
| 4 Vehicles | 20 (0.8%) | 35 (1.7%) |
| 5 or more Vehicles | 178 (7.4%) | 168 (7.9%) |
| Total | 2,415 (100.0%) | 2,126 (100.0%) |
Commute Time in Mahopac
The most frequently occuring commute durations in Mahopac are 45 to 59 minutes (834 commuters, 21.2%), 60 to 89 minutes (626 commuters, 15.9%), and 20 to 24 minutes (350 commuters, 8.9%).
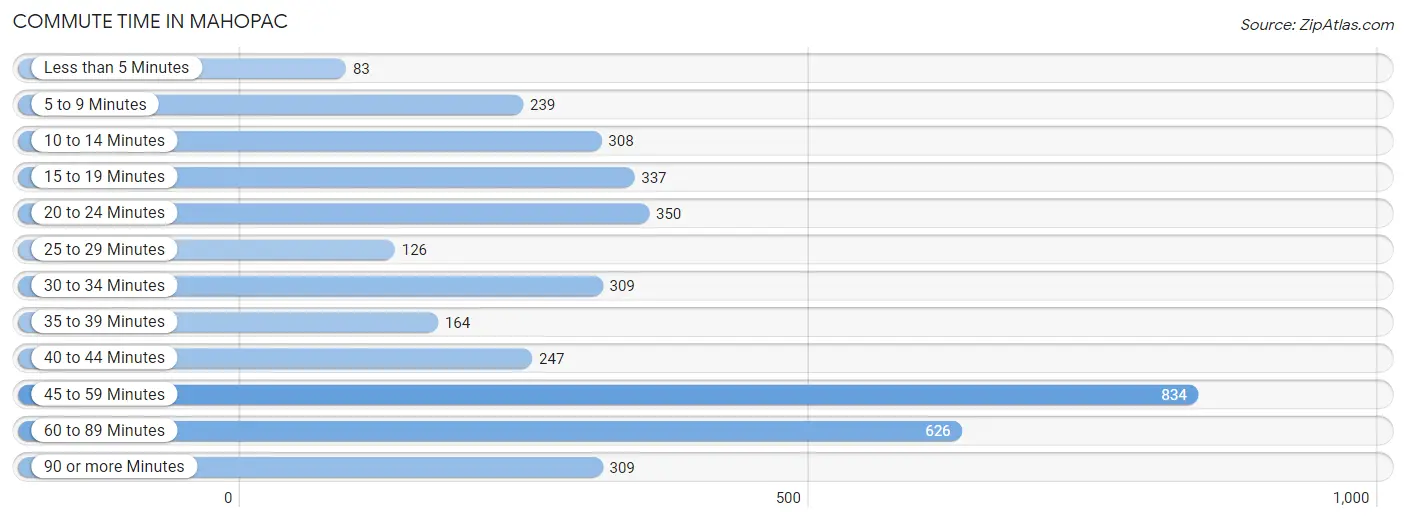
| Commute Time | # Commuters | % Commuters |
| Less than 5 Minutes | 83 | 2.1% |
| 5 to 9 Minutes | 239 | 6.1% |
| 10 to 14 Minutes | 308 | 7.8% |
| 15 to 19 Minutes | 337 | 8.6% |
| 20 to 24 Minutes | 350 | 8.9% |
| 25 to 29 Minutes | 126 | 3.2% |
| 30 to 34 Minutes | 309 | 7.9% |
| 35 to 39 Minutes | 164 | 4.2% |
| 40 to 44 Minutes | 247 | 6.3% |
| 45 to 59 Minutes | 834 | 21.2% |
| 60 to 89 Minutes | 626 | 15.9% |
| 90 or more Minutes | 309 | 7.9% |
Commute Time by Sex in Mahopac
The most common commute times in Mahopac are 45 to 59 minutes (547 commuters, 25.6%) for males and 60 to 89 minutes (353 commuters, 19.6%) for females.
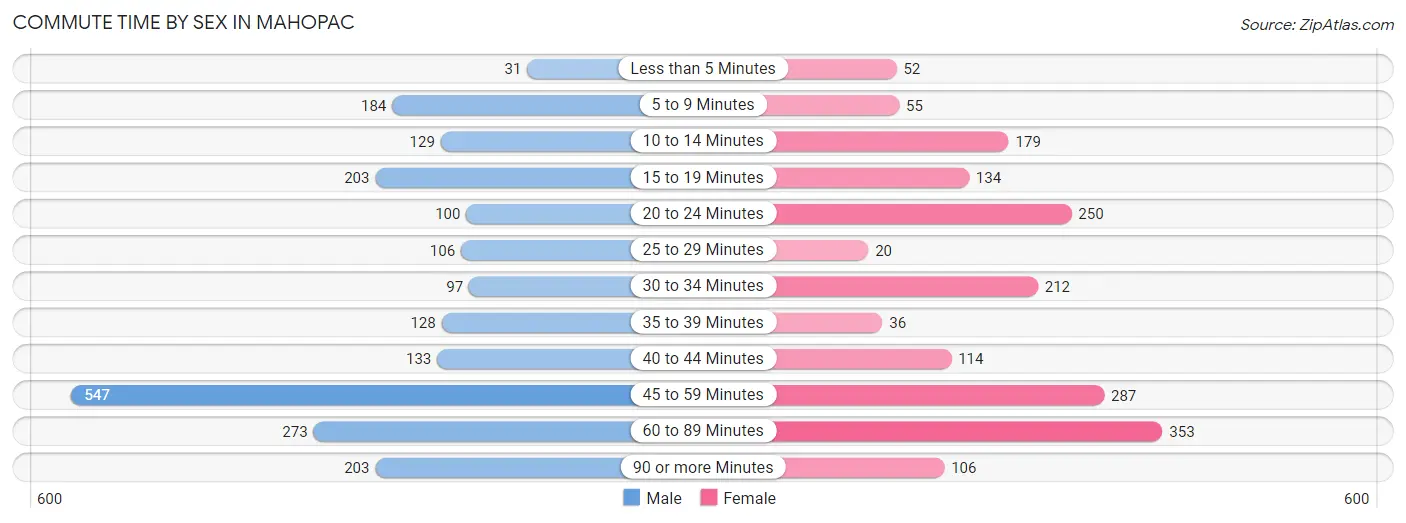
| Commute Time | Male | Female |
| Less than 5 Minutes | 31 (1.5%) | 52 (2.9%) |
| 5 to 9 Minutes | 184 (8.6%) | 55 (3.1%) |
| 10 to 14 Minutes | 129 (6.0%) | 179 (10.0%) |
| 15 to 19 Minutes | 203 (9.5%) | 134 (7.4%) |
| 20 to 24 Minutes | 100 (4.7%) | 250 (13.9%) |
| 25 to 29 Minutes | 106 (5.0%) | 20 (1.1%) |
| 30 to 34 Minutes | 97 (4.5%) | 212 (11.8%) |
| 35 to 39 Minutes | 128 (6.0%) | 36 (2.0%) |
| 40 to 44 Minutes | 133 (6.2%) | 114 (6.3%) |
| 45 to 59 Minutes | 547 (25.6%) | 287 (16.0%) |
| 60 to 89 Minutes | 273 (12.8%) | 353 (19.6%) |
| 90 or more Minutes | 203 (9.5%) | 106 (5.9%) |
Time of Departure to Work by Sex in Mahopac
The most frequent times of departure to work in Mahopac are 6:30 AM to 6:59 AM (423, 19.8%) for males and 7:00 AM to 7:29 AM (371, 20.6%) for females.
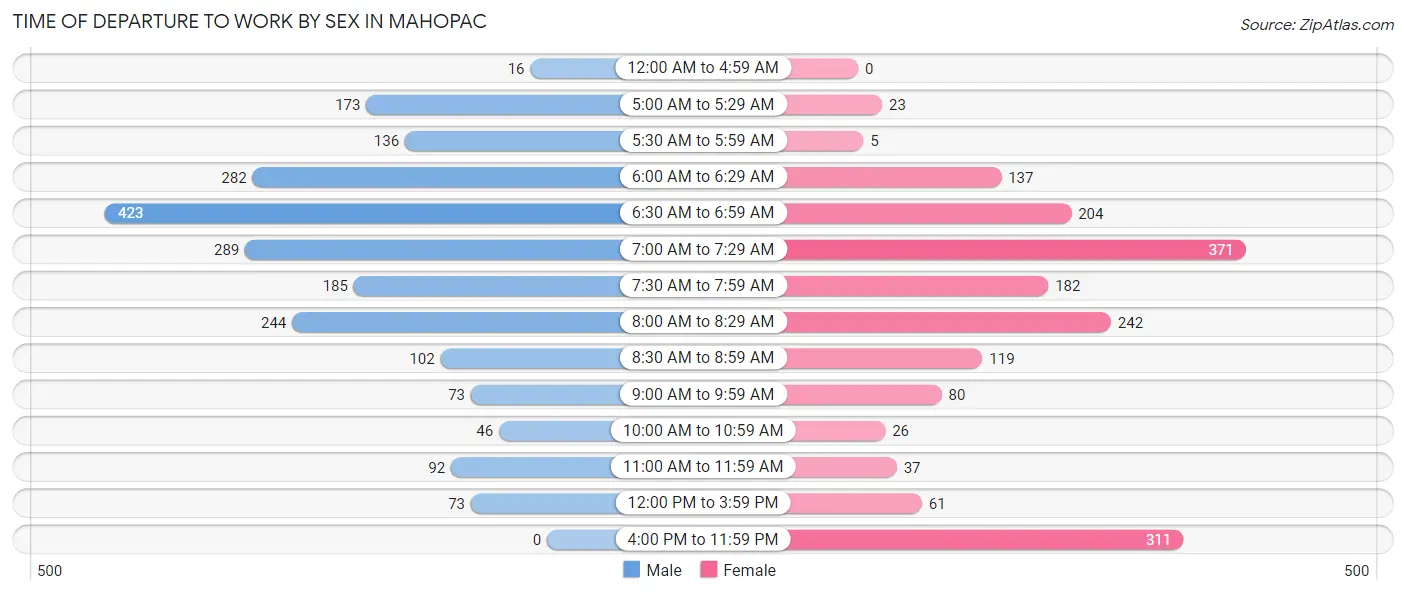
| Time of Departure | Male | Female |
| 12:00 AM to 4:59 AM | 16 (0.7%) | 0 (0.0%) |
| 5:00 AM to 5:29 AM | 173 (8.1%) | 23 (1.3%) |
| 5:30 AM to 5:59 AM | 136 (6.4%) | 5 (0.3%) |
| 6:00 AM to 6:29 AM | 282 (13.2%) | 137 (7.6%) |
| 6:30 AM to 6:59 AM | 423 (19.8%) | 204 (11.4%) |
| 7:00 AM to 7:29 AM | 289 (13.5%) | 371 (20.6%) |
| 7:30 AM to 7:59 AM | 185 (8.7%) | 182 (10.1%) |
| 8:00 AM to 8:29 AM | 244 (11.4%) | 242 (13.5%) |
| 8:30 AM to 8:59 AM | 102 (4.8%) | 119 (6.6%) |
| 9:00 AM to 9:59 AM | 73 (3.4%) | 80 (4.4%) |
| 10:00 AM to 10:59 AM | 46 (2.2%) | 26 (1.5%) |
| 11:00 AM to 11:59 AM | 92 (4.3%) | 37 (2.1%) |
| 12:00 PM to 3:59 PM | 73 (3.4%) | 61 (3.4%) |
| 4:00 PM to 11:59 PM | 0 (0.0%) | 311 (17.3%) |
| Total | 2,134 (100.0%) | 1,798 (100.0%) |
Housing Occupancy in Mahopac
Occupancy by Ownership in Mahopac
Of the total 3,232 dwellings in Mahopac, owner-occupied units account for 2,541 (78.6%), while renter-occupied units make up 691 (21.4%).
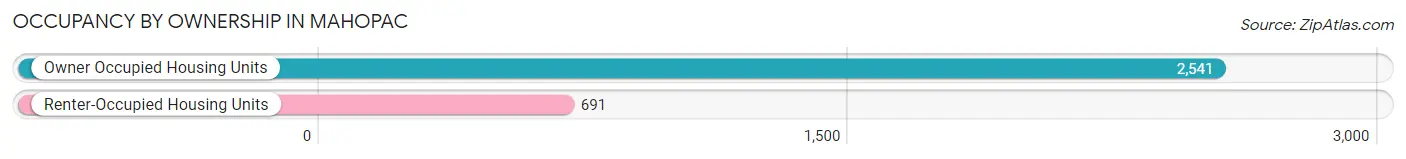
| Occupancy | # Housing Units | % Housing Units |
| Owner Occupied Housing Units | 2,541 | 78.6% |
| Renter-Occupied Housing Units | 691 | 21.4% |
| Total Occupied Housing Units | 3,232 | 100.0% |
Occupancy by Household Size in Mahopac
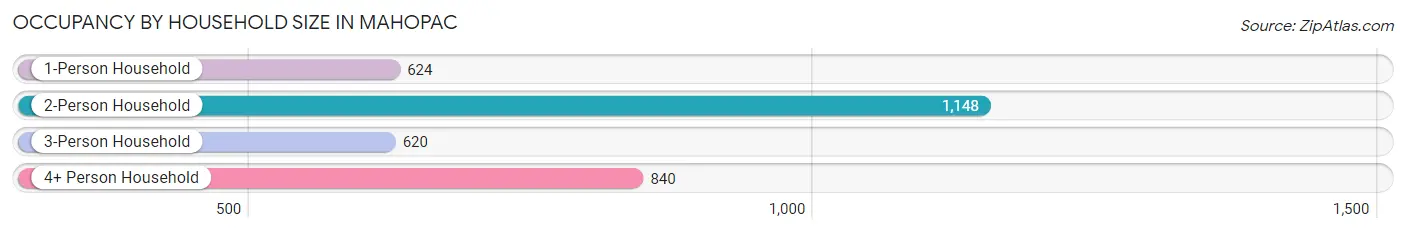
| Household Size | # Housing Units | % Housing Units |
| 1-Person Household | 624 | 19.3% |
| 2-Person Household | 1,148 | 35.5% |
| 3-Person Household | 620 | 19.2% |
| 4+ Person Household | 840 | 26.0% |
| Total Housing Units | 3,232 | 100.0% |
Occupancy by Ownership by Household Size in Mahopac
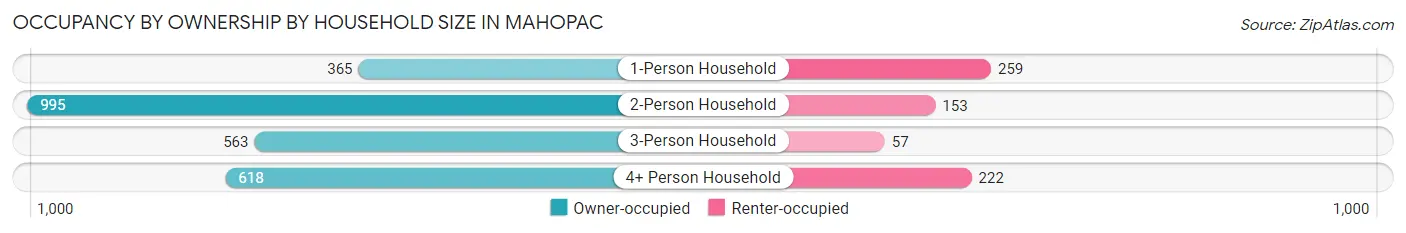
| Household Size | Owner-occupied | Renter-occupied |
| 1-Person Household | 365 (58.5%) | 259 (41.5%) |
| 2-Person Household | 995 (86.7%) | 153 (13.3%) |
| 3-Person Household | 563 (90.8%) | 57 (9.2%) |
| 4+ Person Household | 618 (73.6%) | 222 (26.4%) |
| Total Housing Units | 2,541 (78.6%) | 691 (21.4%) |
Occupancy by Educational Attainment in Mahopac
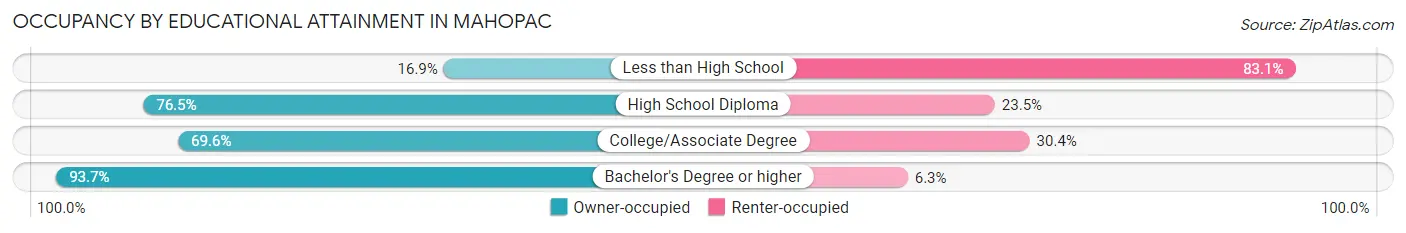
| Household Size | Owner-occupied | Renter-occupied |
| Less than High School | 33 (16.9%) | 162 (83.1%) |
| High School Diploma | 578 (76.5%) | 178 (23.5%) |
| College/Associate Degree | 599 (69.6%) | 262 (30.4%) |
| Bachelor's Degree or higher | 1,331 (93.7%) | 89 (6.3%) |
Occupancy by Age of Householder in Mahopac
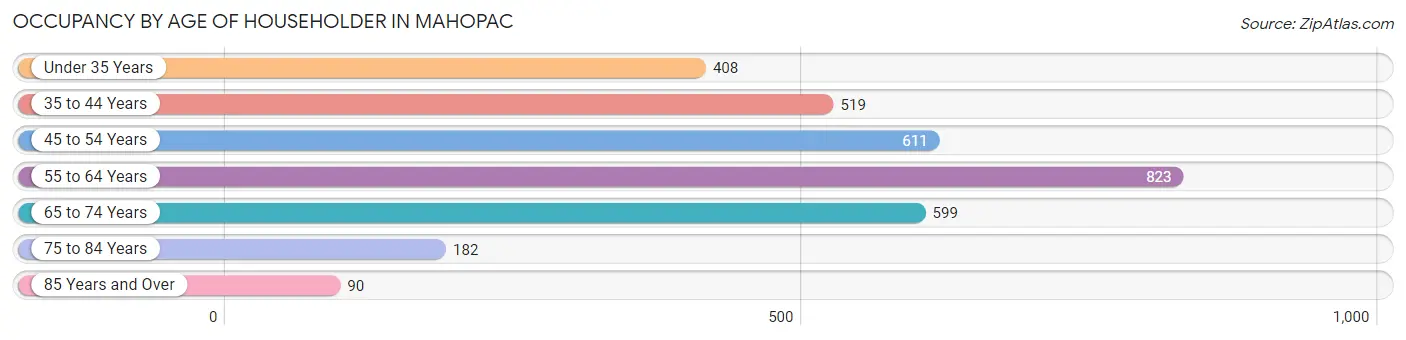
| Age Bracket | # Households | % Households |
| Under 35 Years | 408 | 12.6% |
| 35 to 44 Years | 519 | 16.1% |
| 45 to 54 Years | 611 | 18.9% |
| 55 to 64 Years | 823 | 25.5% |
| 65 to 74 Years | 599 | 18.5% |
| 75 to 84 Years | 182 | 5.6% |
| 85 Years and Over | 90 | 2.8% |
| Total | 3,232 | 100.0% |
Housing Finances in Mahopac
Median Income by Occupancy in Mahopac
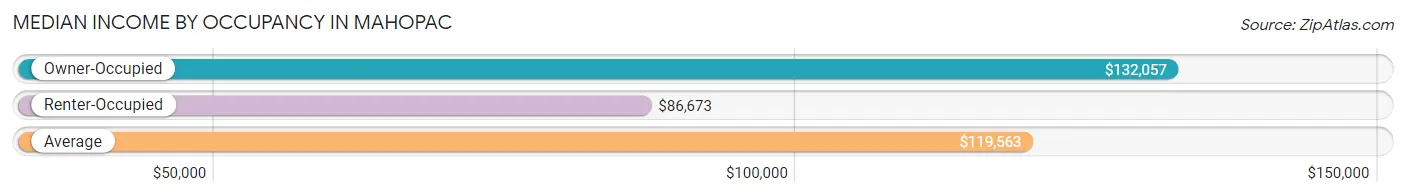
| Occupancy Type | # Households | Median Income |
| Owner-Occupied | 2,541 (78.6%) | $132,057 |
| Renter-Occupied | 691 (21.4%) | $86,673 |
| Average | 3,232 (100.0%) | $119,563 |
Occupancy by Householder Income Bracket in Mahopac
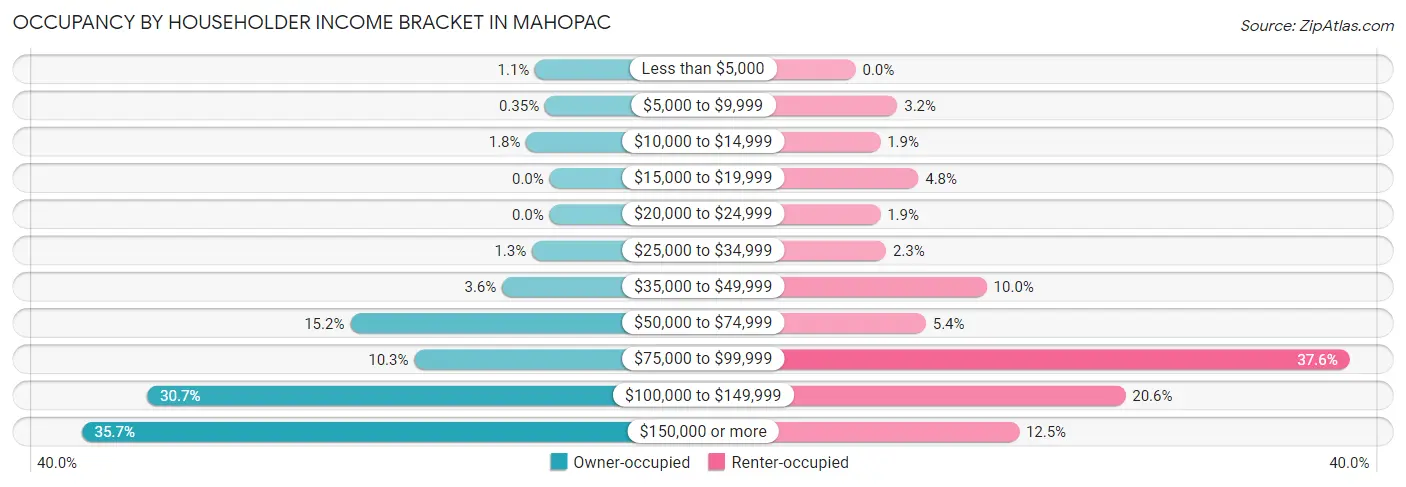
| Income Bracket | Owner-occupied | Renter-occupied |
| Less than $5,000 | 28 (1.1%) | 0 (0.0%) |
| $5,000 to $9,999 | 9 (0.4%) | 22 (3.2%) |
| $10,000 to $14,999 | 45 (1.8%) | 13 (1.9%) |
| $15,000 to $19,999 | 0 (0.0%) | 33 (4.8%) |
| $20,000 to $24,999 | 0 (0.0%) | 13 (1.9%) |
| $25,000 to $34,999 | 34 (1.3%) | 16 (2.3%) |
| $35,000 to $49,999 | 92 (3.6%) | 69 (10.0%) |
| $50,000 to $74,999 | 386 (15.2%) | 37 (5.3%) |
| $75,000 to $99,999 | 262 (10.3%) | 260 (37.6%) |
| $100,000 to $149,999 | 779 (30.7%) | 142 (20.5%) |
| $150,000 or more | 906 (35.7%) | 86 (12.4%) |
| Total | 2,541 (100.0%) | 691 (100.0%) |
Monthly Housing Cost Tiers in Mahopac
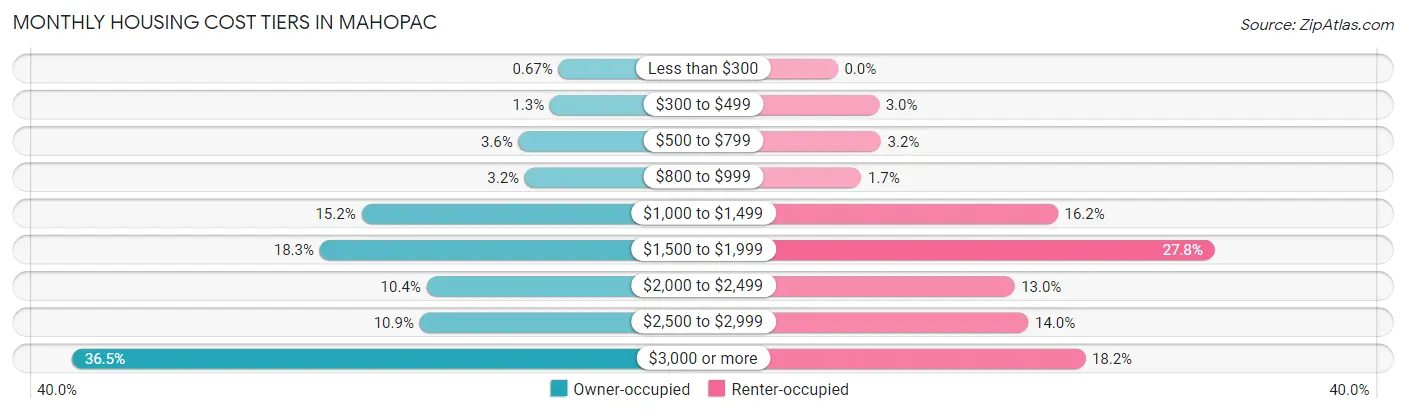
| Monthly Cost | Owner-occupied | Renter-occupied |
| Less than $300 | 17 (0.7%) | 0 (0.0%) |
| $300 to $499 | 33 (1.3%) | 21 (3.0%) |
| $500 to $799 | 92 (3.6%) | 22 (3.2%) |
| $800 to $999 | 80 (3.2%) | 12 (1.7%) |
| $1,000 to $1,499 | 386 (15.2%) | 112 (16.2%) |
| $1,500 to $1,999 | 464 (18.3%) | 192 (27.8%) |
| $2,000 to $2,499 | 264 (10.4%) | 90 (13.0%) |
| $2,500 to $2,999 | 277 (10.9%) | 97 (14.0%) |
| $3,000 or more | 928 (36.5%) | 126 (18.2%) |
| Total | 2,541 (100.0%) | 691 (100.0%) |
Physical Housing Characteristics in Mahopac
Housing Structures in Mahopac
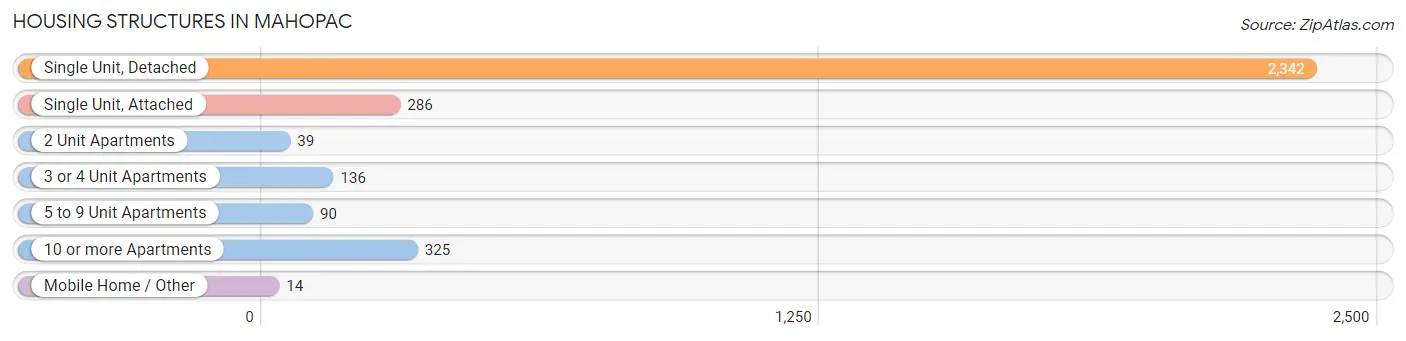
| Structure Type | # Housing Units | % Housing Units |
| Single Unit, Detached | 2,342 | 72.5% |
| Single Unit, Attached | 286 | 8.8% |
| 2 Unit Apartments | 39 | 1.2% |
| 3 or 4 Unit Apartments | 136 | 4.2% |
| 5 to 9 Unit Apartments | 90 | 2.8% |
| 10 or more Apartments | 325 | 10.1% |
| Mobile Home / Other | 14 | 0.4% |
| Total | 3,232 | 100.0% |
Housing Structures by Occupancy in Mahopac
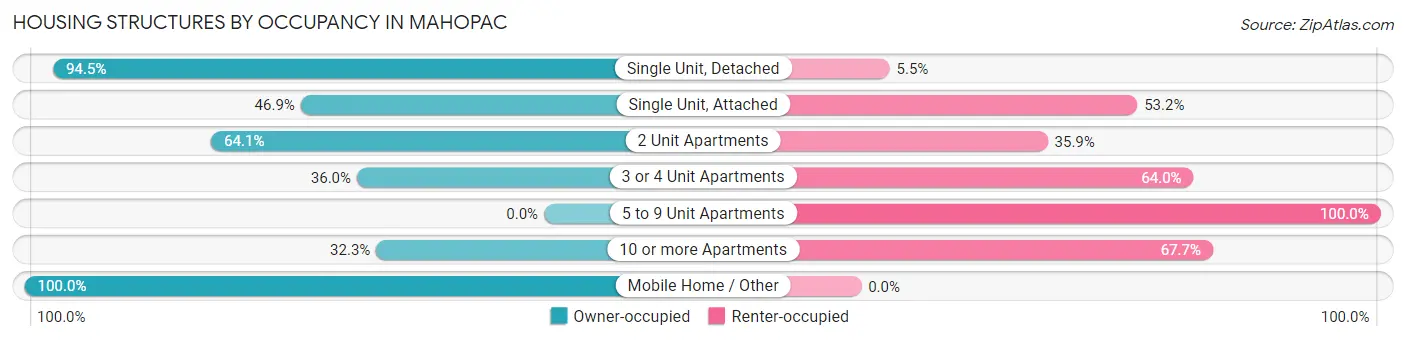
| Structure Type | Owner-occupied | Renter-occupied |
| Single Unit, Detached | 2,214 (94.5%) | 128 (5.5%) |
| Single Unit, Attached | 134 (46.9%) | 152 (53.1%) |
| 2 Unit Apartments | 25 (64.1%) | 14 (35.9%) |
| 3 or 4 Unit Apartments | 49 (36.0%) | 87 (64.0%) |
| 5 to 9 Unit Apartments | 0 (0.0%) | 90 (100.0%) |
| 10 or more Apartments | 105 (32.3%) | 220 (67.7%) |
| Mobile Home / Other | 14 (100.0%) | 0 (0.0%) |
| Total | 2,541 (78.6%) | 691 (21.4%) |
Housing Structures by Number of Rooms in Mahopac
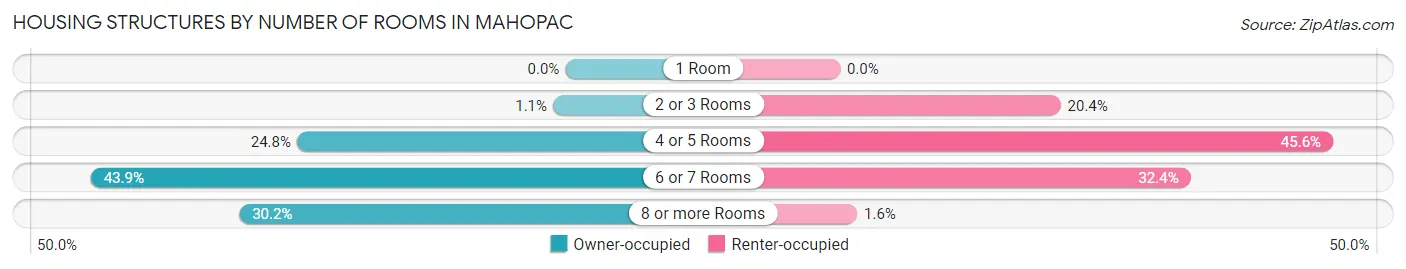
| Number of Rooms | Owner-occupied | Renter-occupied |
| 1 Room | 0 (0.0%) | 0 (0.0%) |
| 2 or 3 Rooms | 29 (1.1%) | 141 (20.4%) |
| 4 or 5 Rooms | 631 (24.8%) | 315 (45.6%) |
| 6 or 7 Rooms | 1,115 (43.9%) | 224 (32.4%) |
| 8 or more Rooms | 766 (30.1%) | 11 (1.6%) |
| Total | 2,541 (100.0%) | 691 (100.0%) |
Housing Structure by Heating Type in Mahopac
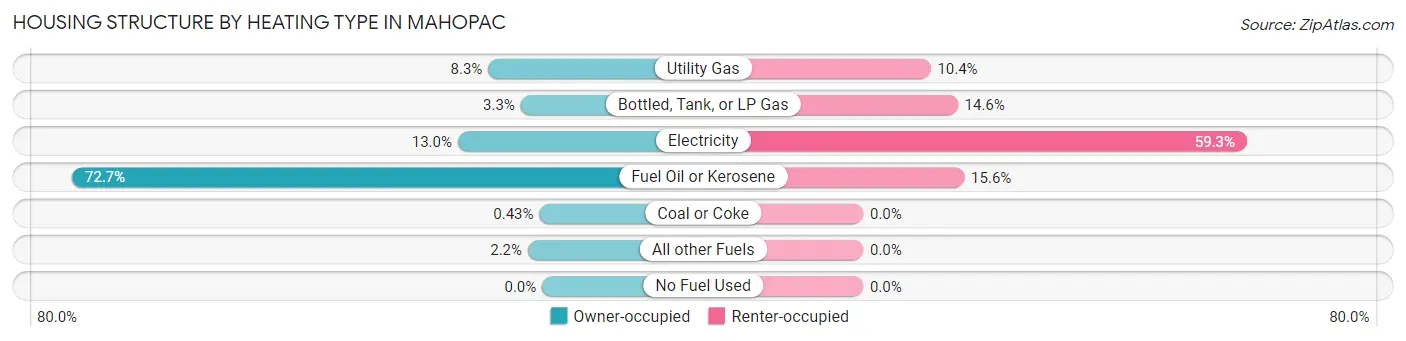
| Heating Type | Owner-occupied | Renter-occupied |
| Utility Gas | 212 (8.3%) | 72 (10.4%) |
| Bottled, Tank, or LP Gas | 84 (3.3%) | 101 (14.6%) |
| Electricity | 331 (13.0%) | 410 (59.3%) |
| Fuel Oil or Kerosene | 1,847 (72.7%) | 108 (15.6%) |
| Coal or Coke | 11 (0.4%) | 0 (0.0%) |
| All other Fuels | 56 (2.2%) | 0 (0.0%) |
| No Fuel Used | 0 (0.0%) | 0 (0.0%) |
| Total | 2,541 (100.0%) | 691 (100.0%) |
Household Vehicle Usage in Mahopac
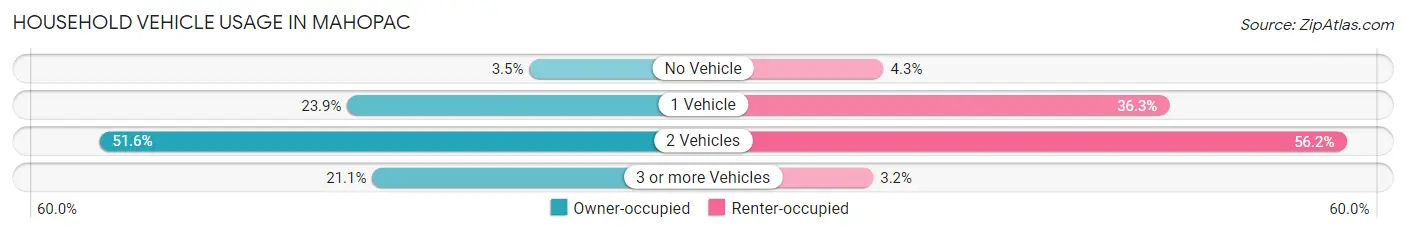
| Vehicles per Household | Owner-occupied | Renter-occupied |
| No Vehicle | 88 (3.5%) | 30 (4.3%) |
| 1 Vehicle | 606 (23.8%) | 251 (36.3%) |
| 2 Vehicles | 1,312 (51.6%) | 388 (56.1%) |
| 3 or more Vehicles | 535 (21.0%) | 22 (3.2%) |
| Total | 2,541 (100.0%) | 691 (100.0%) |
Real Estate & Mortgages in Mahopac
Real Estate and Mortgage Overview in Mahopac
| Characteristic | Without Mortgage | With Mortgage |
| Housing Units | 951 | 1,590 |
| Median Property Value | $421,900 | $447,200 |
| Median Household Income | $128,011 | $605 |
| Monthly Housing Costs | $1,410 | $905 |
| Real Estate Taxes | $10,001 | $0 |
Property Value by Mortgage Status in Mahopac
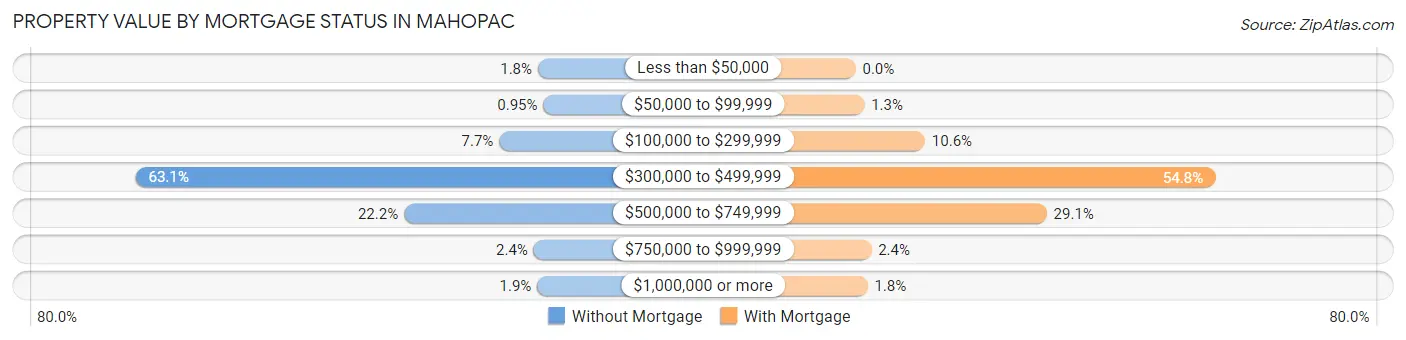
| Property Value | Without Mortgage | With Mortgage |
| Less than $50,000 | 17 (1.8%) | 0 (0.0%) |
| $50,000 to $99,999 | 9 (0.9%) | 21 (1.3%) |
| $100,000 to $299,999 | 73 (7.7%) | 168 (10.6%) |
| $300,000 to $499,999 | 600 (63.1%) | 871 (54.8%) |
| $500,000 to $749,999 | 211 (22.2%) | 463 (29.1%) |
| $750,000 to $999,999 | 23 (2.4%) | 38 (2.4%) |
| $1,000,000 or more | 18 (1.9%) | 29 (1.8%) |
| Total | 951 (100.0%) | 1,590 (100.0%) |
Household Income by Mortgage Status in Mahopac
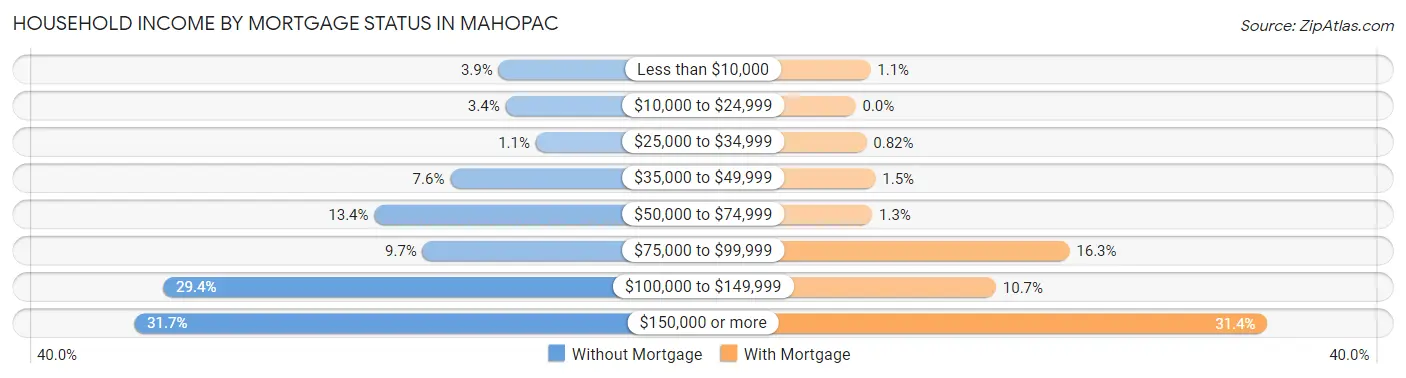
| Household Income | Without Mortgage | With Mortgage |
| Less than $10,000 | 37 (3.9%) | 18 (1.1%) |
| $10,000 to $24,999 | 32 (3.4%) | 0 (0.0%) |
| $25,000 to $34,999 | 10 (1.1%) | 13 (0.8%) |
| $35,000 to $49,999 | 72 (7.6%) | 24 (1.5%) |
| $50,000 to $74,999 | 127 (13.4%) | 20 (1.3%) |
| $75,000 to $99,999 | 92 (9.7%) | 259 (16.3%) |
| $100,000 to $149,999 | 280 (29.4%) | 170 (10.7%) |
| $150,000 or more | 301 (31.7%) | 499 (31.4%) |
| Total | 951 (100.0%) | 1,590 (100.0%) |
Property Value to Household Income Ratio in Mahopac
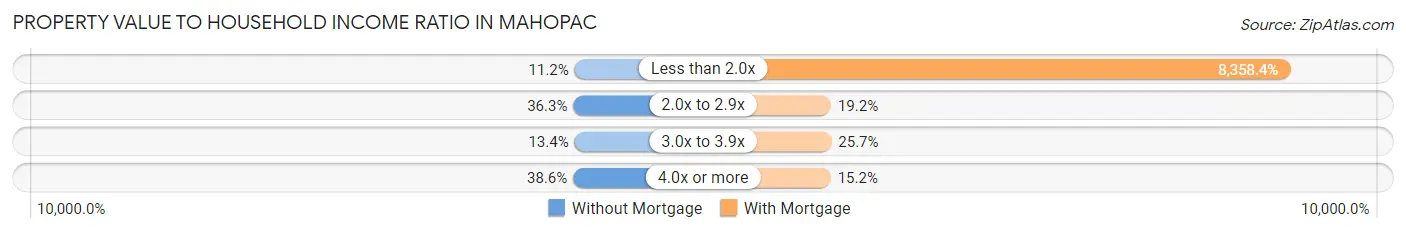
| Value-to-Income Ratio | Without Mortgage | With Mortgage |
| Less than 2.0x | 106 (11.2%) | 132,898 (8,358.4%) |
| 2.0x to 2.9x | 345 (36.3%) | 305 (19.2%) |
| 3.0x to 3.9x | 127 (13.4%) | 409 (25.7%) |
| 4.0x or more | 367 (38.6%) | 242 (15.2%) |
| Total | 951 (100.0%) | 1,590 (100.0%) |
Real Estate Taxes by Mortgage Status in Mahopac
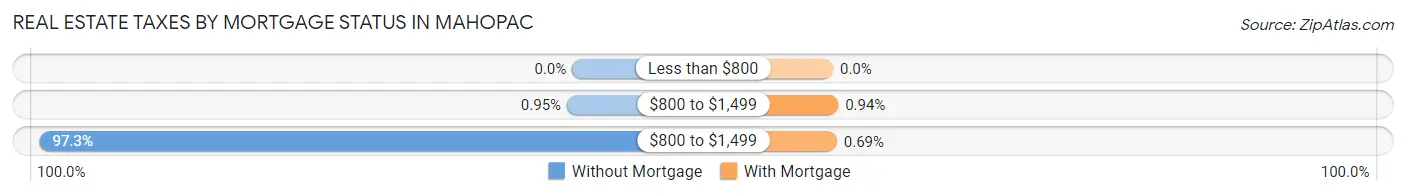
| Property Taxes | Without Mortgage | With Mortgage |
| Less than $800 | 0 (0.0%) | 0 (0.0%) |
| $800 to $1,499 | 9 (0.9%) | 15 (0.9%) |
| $800 to $1,499 | 925 (97.3%) | 11 (0.7%) |
| Total | 951 (100.0%) | 1,590 (100.0%) |
Health & Disability in Mahopac
Health Insurance Coverage by Age in Mahopac
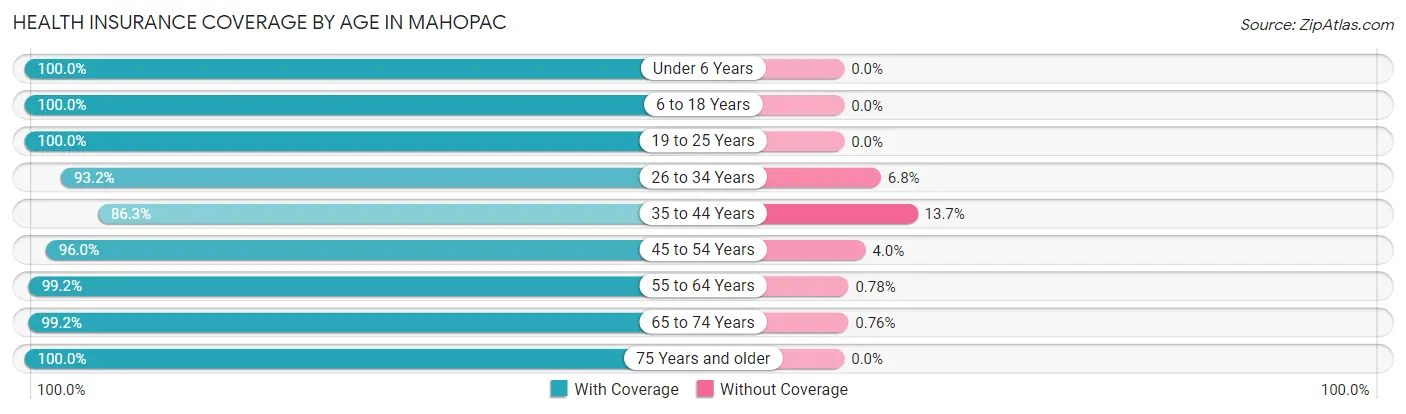
| Age Bracket | With Coverage | Without Coverage |
| Under 6 Years | 487 (100.0%) | 0 (0.0%) |
| 6 to 18 Years | 1,230 (100.0%) | 0 (0.0%) |
| 19 to 25 Years | 773 (100.0%) | 0 (0.0%) |
| 26 to 34 Years | 998 (93.2%) | 73 (6.8%) |
| 35 to 44 Years | 827 (86.3%) | 131 (13.7%) |
| 45 to 54 Years | 1,236 (96.0%) | 51 (4.0%) |
| 55 to 64 Years | 1,398 (99.2%) | 11 (0.8%) |
| 65 to 74 Years | 1,042 (99.2%) | 8 (0.8%) |
| 75 Years and older | 509 (100.0%) | 0 (0.0%) |
| Total | 8,500 (96.9%) | 274 (3.1%) |
Health Insurance Coverage by Citizenship Status in Mahopac
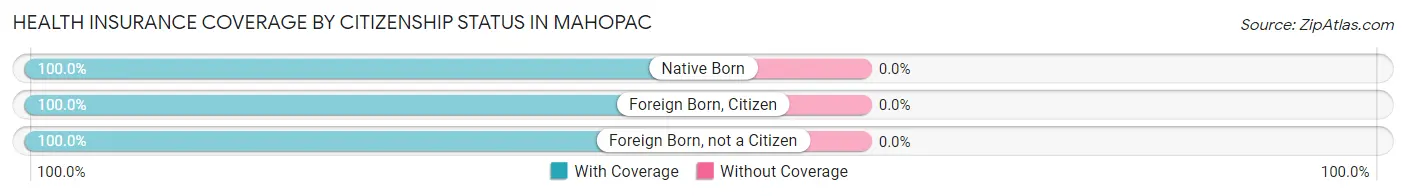
| Citizenship Status | With Coverage | Without Coverage |
| Native Born | 487 (100.0%) | 0 (0.0%) |
| Foreign Born, Citizen | 1,230 (100.0%) | 0 (0.0%) |
| Foreign Born, not a Citizen | 773 (100.0%) | 0 (0.0%) |
Health Insurance Coverage by Household Income in Mahopac
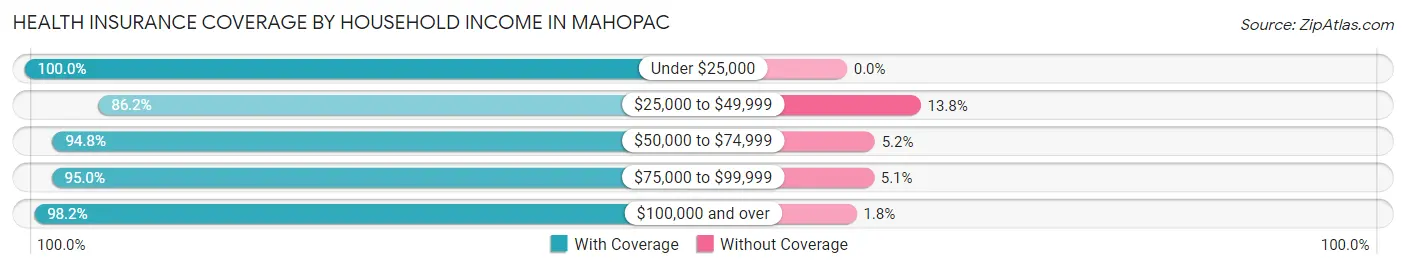
| Household Income | With Coverage | Without Coverage |
| Under $25,000 | 229 (100.0%) | 0 (0.0%) |
| $25,000 to $49,999 | 368 (86.2%) | 59 (13.8%) |
| $50,000 to $74,999 | 797 (94.8%) | 44 (5.2%) |
| $75,000 to $99,999 | 1,166 (95.0%) | 62 (5.1%) |
| $100,000 and over | 5,926 (98.2%) | 109 (1.8%) |
Public vs Private Health Insurance Coverage by Age in Mahopac
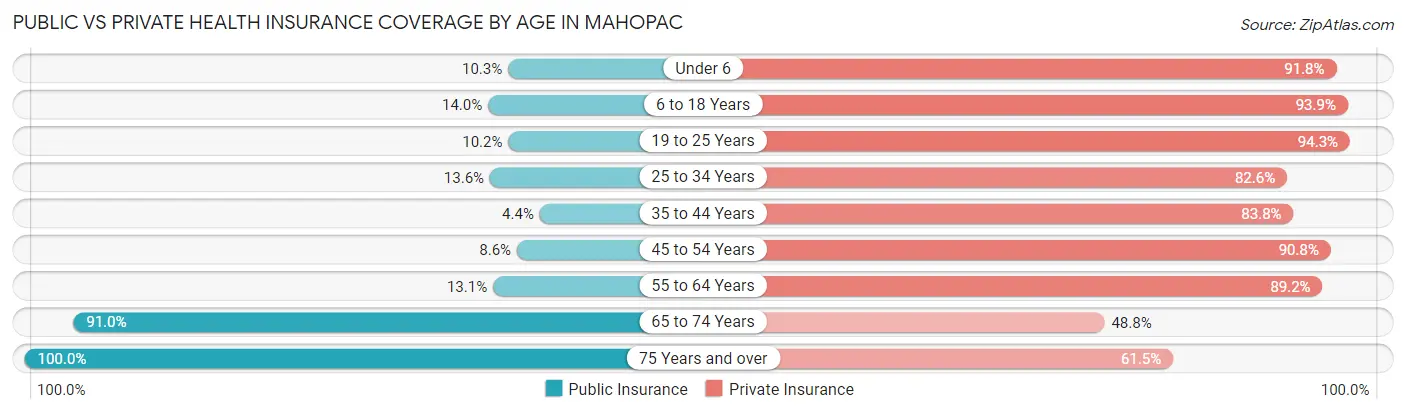
| Age Bracket | Public Insurance | Private Insurance |
| Under 6 | 50 (10.3%) | 447 (91.8%) |
| 6 to 18 Years | 172 (14.0%) | 1,155 (93.9%) |
| 19 to 25 Years | 79 (10.2%) | 729 (94.3%) |
| 25 to 34 Years | 146 (13.6%) | 885 (82.6%) |
| 35 to 44 Years | 42 (4.4%) | 803 (83.8%) |
| 45 to 54 Years | 111 (8.6%) | 1,168 (90.7%) |
| 55 to 64 Years | 184 (13.1%) | 1,257 (89.2%) |
| 65 to 74 Years | 955 (90.9%) | 512 (48.8%) |
| 75 Years and over | 509 (100.0%) | 313 (61.5%) |
| Total | 2,248 (25.6%) | 7,269 (82.9%) |
Disability Status by Sex by Age in Mahopac
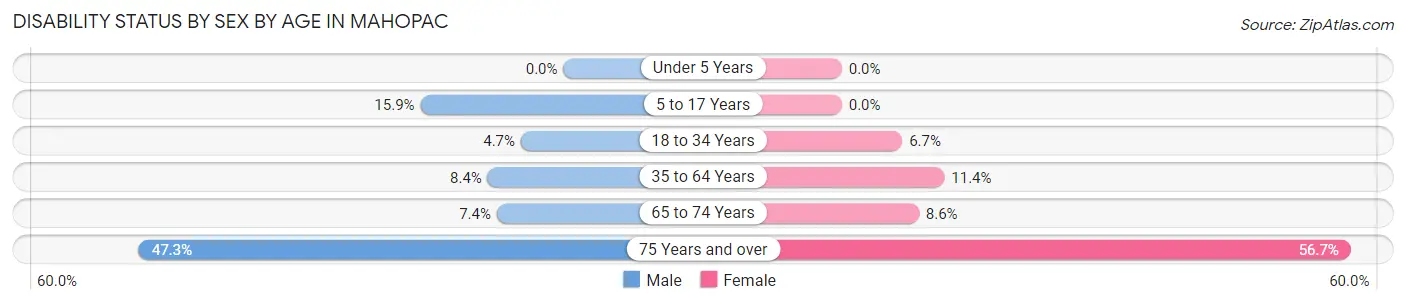
| Age Bracket | Male | Female |
| Under 5 Years | 0 (0.0%) | 0 (0.0%) |
| 5 to 17 Years | 107 (15.9%) | 0 (0.0%) |
| 18 to 34 Years | 43 (4.7%) | 65 (6.7%) |
| 35 to 64 Years | 156 (8.4%) | 206 (11.4%) |
| 65 to 74 Years | 32 (7.4%) | 53 (8.6%) |
| 75 Years and over | 113 (47.3%) | 153 (56.7%) |
Disability Class by Sex by Age in Mahopac
Disability Class: Hearing Difficulty
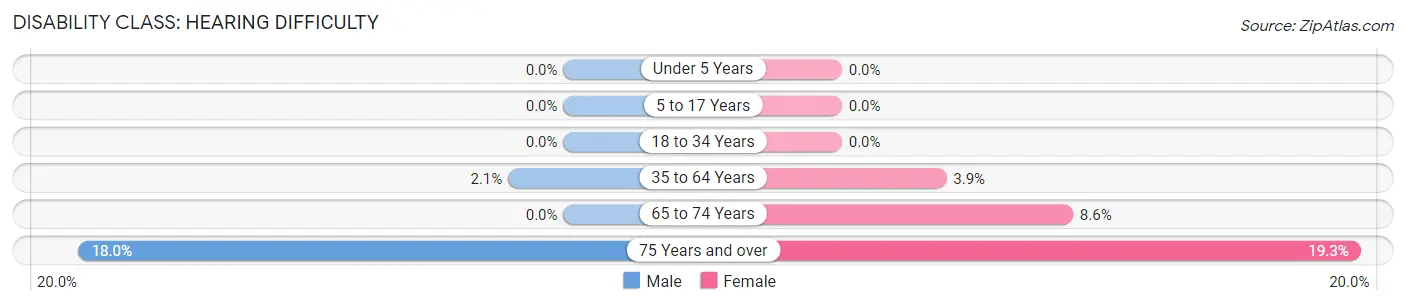
| Age Bracket | Male | Female |
| Under 5 Years | 0 (0.0%) | 0 (0.0%) |
| 5 to 17 Years | 0 (0.0%) | 0 (0.0%) |
| 18 to 34 Years | 0 (0.0%) | 0 (0.0%) |
| 35 to 64 Years | 38 (2.1%) | 70 (3.9%) |
| 65 to 74 Years | 0 (0.0%) | 53 (8.6%) |
| 75 Years and over | 43 (18.0%) | 52 (19.3%) |
Disability Class: Vision Difficulty
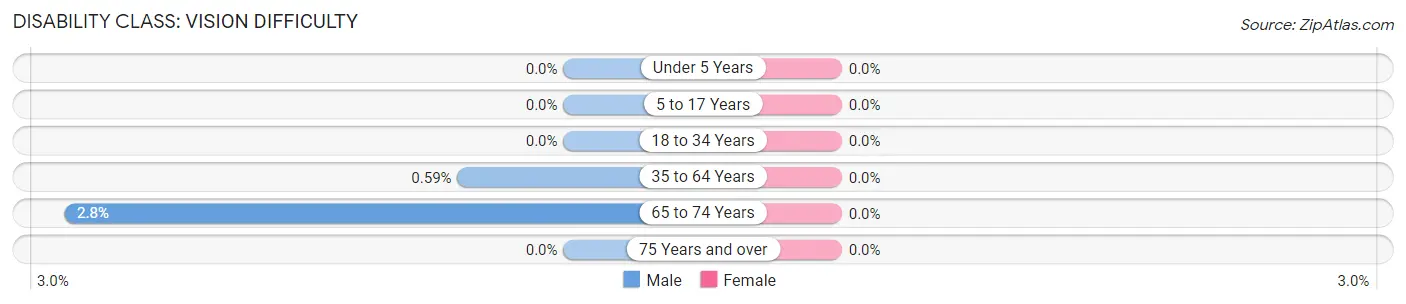
| Age Bracket | Male | Female |
| Under 5 Years | 0 (0.0%) | 0 (0.0%) |
| 5 to 17 Years | 0 (0.0%) | 0 (0.0%) |
| 18 to 34 Years | 0 (0.0%) | 0 (0.0%) |
| 35 to 64 Years | 11 (0.6%) | 0 (0.0%) |
| 65 to 74 Years | 12 (2.8%) | 0 (0.0%) |
| 75 Years and over | 0 (0.0%) | 0 (0.0%) |
Disability Class: Cognitive Difficulty
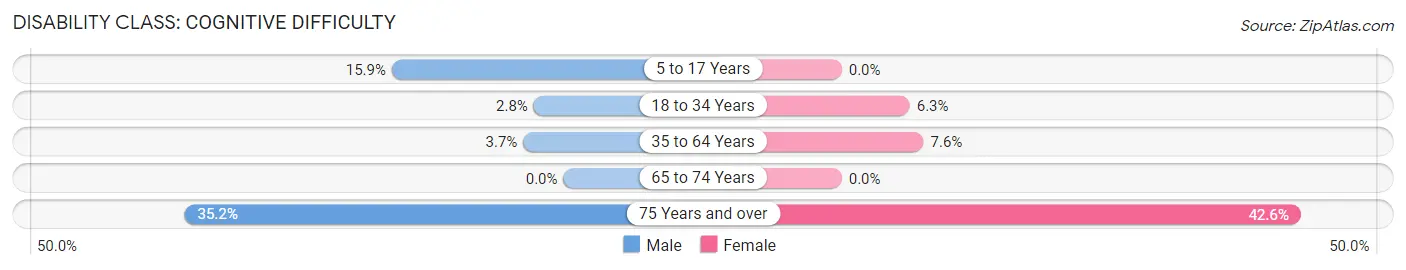
| Age Bracket | Male | Female |
| 5 to 17 Years | 107 (15.9%) | 0 (0.0%) |
| 18 to 34 Years | 25 (2.8%) | 61 (6.3%) |
| 35 to 64 Years | 69 (3.7%) | 137 (7.6%) |
| 65 to 74 Years | 0 (0.0%) | 0 (0.0%) |
| 75 Years and over | 84 (35.1%) | 115 (42.6%) |
Disability Class: Ambulatory Difficulty
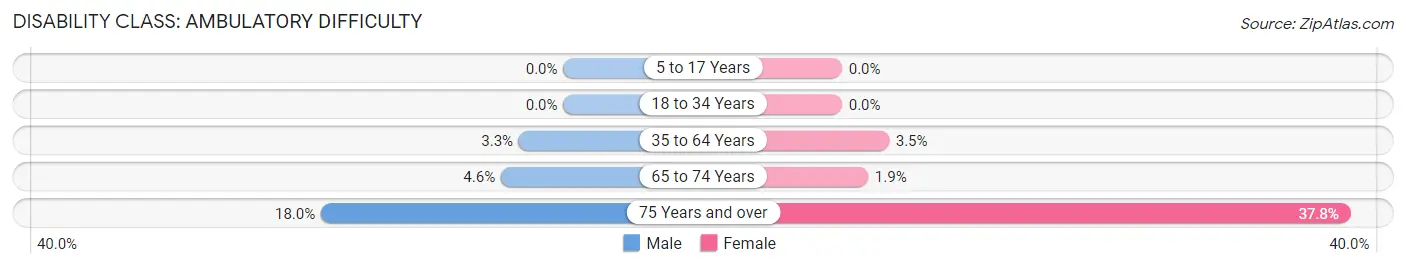
| Age Bracket | Male | Female |
| 5 to 17 Years | 0 (0.0%) | 0 (0.0%) |
| 18 to 34 Years | 0 (0.0%) | 0 (0.0%) |
| 35 to 64 Years | 61 (3.3%) | 63 (3.5%) |
| 65 to 74 Years | 20 (4.6%) | 12 (1.9%) |
| 75 Years and over | 43 (18.0%) | 102 (37.8%) |
Disability Class: Self-Care Difficulty
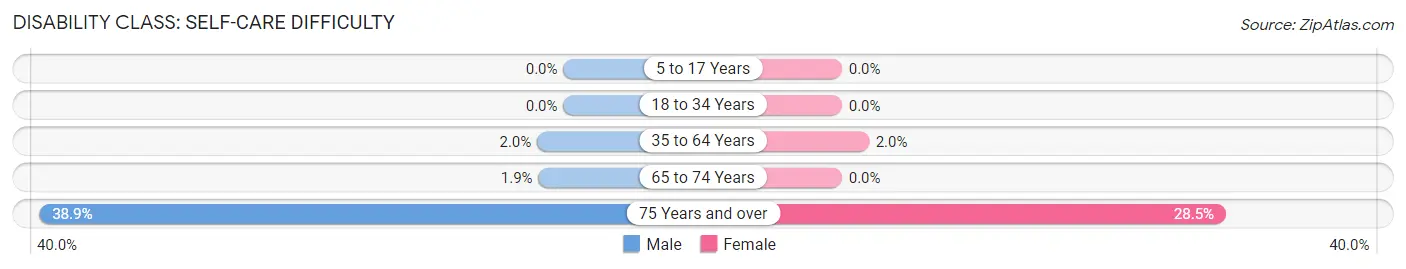
| Age Bracket | Male | Female |
| 5 to 17 Years | 0 (0.0%) | 0 (0.0%) |
| 18 to 34 Years | 0 (0.0%) | 0 (0.0%) |
| 35 to 64 Years | 36 (1.9%) | 36 (2.0%) |
| 65 to 74 Years | 8 (1.8%) | 0 (0.0%) |
| 75 Years and over | 93 (38.9%) | 77 (28.5%) |
Technology Access in Mahopac
Computing Device Access in Mahopac
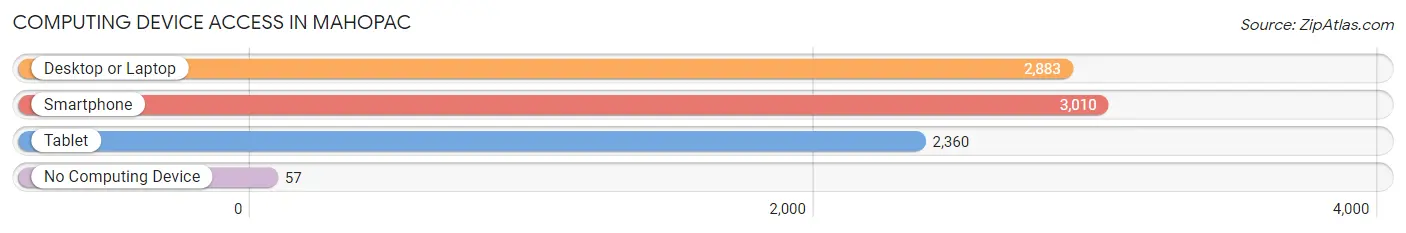
| Device Type | # Households | % Households |
| Desktop or Laptop | 2,883 | 89.2% |
| Smartphone | 3,010 | 93.1% |
| Tablet | 2,360 | 73.0% |
| No Computing Device | 57 | 1.8% |
| Total | 3,232 | 100.0% |
Internet Access in Mahopac
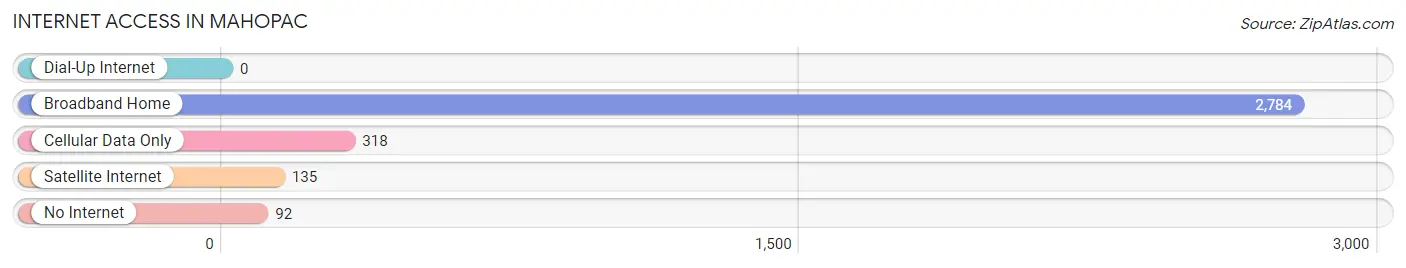
| Internet Type | # Households | % Households |
| Dial-Up Internet | 0 | 0.0% |
| Broadband Home | 2,784 | 86.1% |
| Cellular Data Only | 318 | 9.8% |
| Satellite Internet | 135 | 4.2% |
| No Internet | 92 | 2.9% |
| Total | 3,232 | 100.0% |
Mahopac Summary
Mahopac is a hamlet located in the town of Carmel in Putnam County, New York. It is situated in the southeastern corner of the county, approximately 50 miles north of New York City. The hamlet is bordered by the towns of Kent and Patterson to the east, and the towns of Carmel and Southeast to the west. Mahopac is home to a population of 8,369 people, according to the 2010 census.
History
The area that is now Mahopac was originally inhabited by the Wappinger Indians. The first European settlers arrived in the area in the late 17th century, and the hamlet was officially established in 1788. The name Mahopac is derived from the Wappinger word “mahopacke,” which means “a place of rest.”
The hamlet was originally a farming community, and the first grist mill was built in 1790. The first schoolhouse was built in 1802, and the first post office was established in 1820. The hamlet was officially incorporated in 1845.
In the late 19th century, Mahopac became a popular summer resort destination for wealthy New Yorkers. The hamlet was home to several large hotels, including the Mahopac Hotel, which was built in 1887. The hotel was destroyed by fire in 1895, but was rebuilt and reopened in 1897.
Geography
Mahopac is located in the southeastern corner of Putnam County, approximately 50 miles north of New York City. The hamlet is bordered by the towns of Kent and Patterson to the east, and the towns of Carmel and Southeast to the west.
The terrain of Mahopac is mostly hilly, with elevations ranging from 500 to 1,000 feet above sea level. The hamlet is located in the Hudson Valley region of New York, and is part of the Croton Watershed.
Economy
Mahopac’s economy is largely based on tourism and retail. The hamlet is home to several small businesses, including restaurants, shops, and galleries. The hamlet is also home to several large employers, including the Mahopac National Bank, the Mahopac Public Library, and the Mahopac Central School District.
Demographics
According to the 2010 census, Mahopac has a population of 8,369 people. The median household income is $77,917, and the median age is 43. The racial makeup of the hamlet is 87.3% White, 5.2% Hispanic or Latino, 3.2% Asian, and 2.3% African American.
The majority of Mahopac’s population is Catholic (44.3%), followed by Protestant (25.2%), and other religions (7.2%). The hamlet is also home to a large Jewish population (17.3%).
Conclusion
Mahopac is a hamlet located in the town of Carmel in Putnam County, New York. It is situated in the southeastern corner of the county, approximately 50 miles north of New York City. The hamlet was originally inhabited by the Wappinger Indians, and was officially established in 1788. Mahopac’s economy is largely based on tourism and retail, and the hamlet is home to a population of 8,369 people, according to the 2010 census. The majority of Mahopac’s population is Catholic, followed by Protestant and other religions.
Common Questions
What is the Total Population of Mahopac?
Total Population of Mahopac is 8,774.
What is the Total Male Population of Mahopac?
Total Male Population of Mahopac is 4,252.
What is the Total Female Population of Mahopac?
Total Female Population of Mahopac is 4,522.
What is the Ratio of Males per 100 Females in Mahopac?
There are 94.03 Males per 100 Females in Mahopac.
What is the Ratio of Females per 100 Males in Mahopac?
There are 106.35 Females per 100 Males in Mahopac.
What is the Median Population Age in Mahopac?
Median Population Age in Mahopac is 43.6 Years.
What is the Average Family Size in Mahopac
Average Family Size in Mahopac is 3.1 People.
What is the Average Household Size in Mahopac
Average Household Size in Mahopac is 2.7 People.
What is Per Capita Income in Mahopac?
Per Capita income in Mahopac is $54,113.
What is the Median Family Income in Mahopac?
Median Family Income in Mahopac is $131,729.
What is the Median Household income in Mahopac?
Median Household Income in Mahopac is $119,563.
What is Income or Wage Gap in Mahopac?
Income or Wage Gap in Mahopac is 30.8%.
Women in Mahopac earn 69.2 cents for every dollar earned by a man.
What is Inequality or Gini Index in Mahopac?
Inequality or Gini Index in Mahopac is 0.36.
How Large is the Labor Force in Mahopac?
There are 4,790 People in the Labor Forcein in Mahopac.
What is the Percentage of People in the Labor Force in Mahopac?
65.9% of People are in the Labor Force in Mahopac.
What is the Unemployment Rate in Mahopac?
Unemployment Rate in Mahopac is 3.5%.