Germantown, NY
Germantown Map
Germantown Overview
1,068
TOTAL POPULATION
520
MALE POPULATION
548
FEMALE POPULATION
94.89
MALES / 100 FEMALES
105.38
FEMALES / 100 MALES
56.3
MEDIAN AGE
2.3
AVG FAMILY SIZE
1.9
AVG HOUSEHOLD SIZE
$55,950
PER CAPITA INCOME
$91,755
AVG FAMILY INCOME
$89,120
AVG HOUSEHOLD INCOME
25.3%
WAGE / INCOME GAP [ % ]
74.7¢/ $1
WAGE / INCOME GAP [ $ ]
0.47
INEQUALITY / GINI INDEX
500
LABOR FORCE [ PEOPLE ]
54.4%
PERCENT IN LABOR FORCE
9.4%
UNEMPLOYMENT RATE
Germantown Zip Codes
Germantown Area Codes
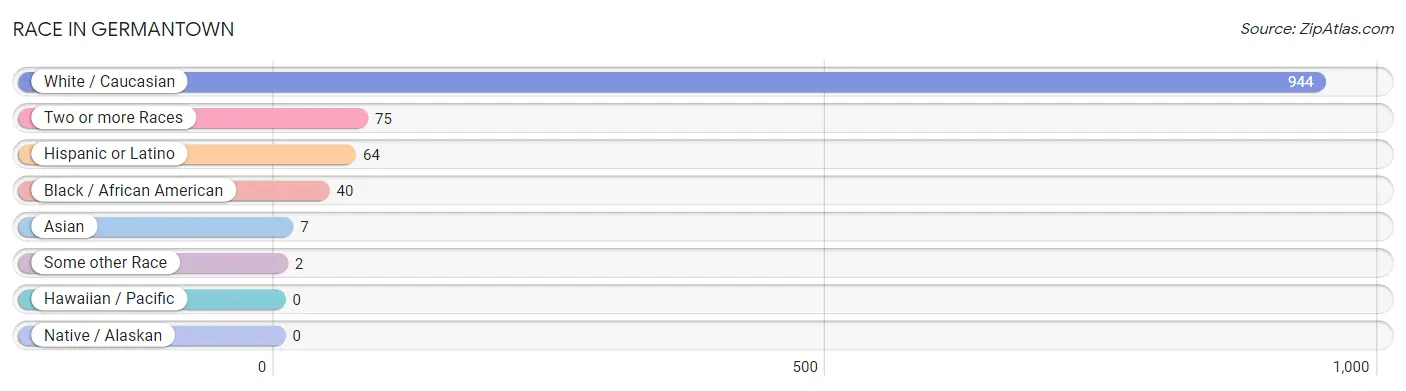
Race in Germantown
The most populous races in Germantown are White / Caucasian (944 | 88.4%), Two or more Races (75 | 7.0%), and Hispanic or Latino (64 | 6.0%).
| Race | # Population | % Population |
| Asian | 7 | 0.7% |
| Black / African American | 40 | 3.7% |
| Hawaiian / Pacific | 0 | 0.0% |
| Hispanic or Latino | 64 | 6.0% |
| Native / Alaskan | 0 | 0.0% |
| White / Caucasian | 944 | 88.4% |
| Two or more Races | 75 | 7.0% |
| Some other Race | 2 | 0.2% |
| Total | 1,068 | 100.0% |
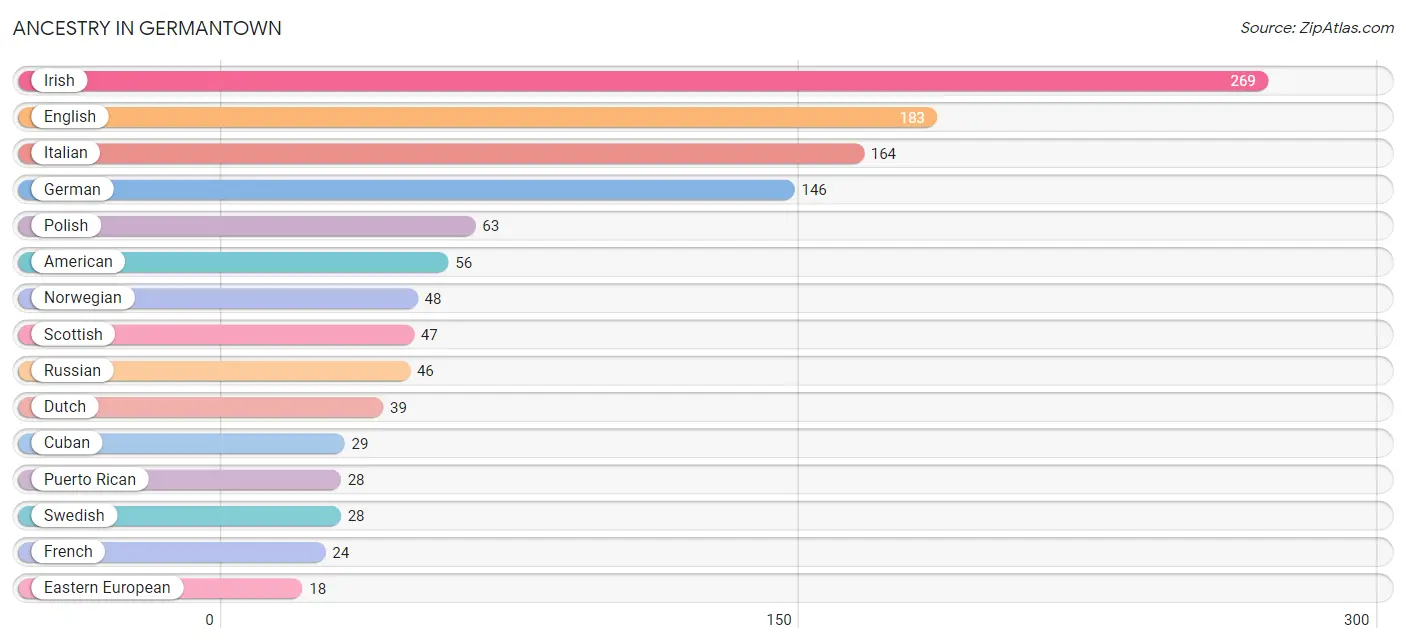
Ancestry in Germantown
The most populous ancestries reported in Germantown are Irish (269 | 25.2%), English (183 | 17.1%), Italian (164 | 15.4%), German (146 | 13.7%), and Polish (63 | 5.9%), together accounting for 77.2% of all Germantown residents.
| Ancestry | # Population | % Population |
| American | 56 | 5.2% |
| Arab | 11 | 1.0% |
| Austrian | 8 | 0.7% |
| Bhutanese | 16 | 1.5% |
| British | 5 | 0.5% |
| Burmese | 4 | 0.4% |
| Canadian | 2 | 0.2% |
| Cuban | 29 | 2.7% |
| Dutch | 39 | 3.6% |
| Eastern European | 18 | 1.7% |
| English | 183 | 17.1% |
| European | 16 | 1.5% |
| French | 24 | 2.2% |
| French Canadian | 7 | 0.7% |
| German | 146 | 13.7% |
| Greek | 10 | 0.9% |
| Hungarian | 7 | 0.7% |
| Irish | 269 | 25.2% |
| Italian | 164 | 15.4% |
| Korean | 5 | 0.5% |
| Norwegian | 48 | 4.5% |
| Palestinian | 11 | 1.0% |
| Polish | 63 | 5.9% |
| Puerto Rican | 28 | 2.6% |
| Russian | 46 | 4.3% |
| Scotch-Irish | 17 | 1.6% |
| Scottish | 47 | 4.4% |
| Slovak | 7 | 0.7% |
| South American | 7 | 0.7% |
| Swedish | 28 | 2.6% |
| Turkish | 7 | 0.7% |
| Ukrainian | 9 | 0.8% |
| Venezuelan | 7 | 0.7% |
| Welsh | 5 | 0.5% | View All 34 Rows |
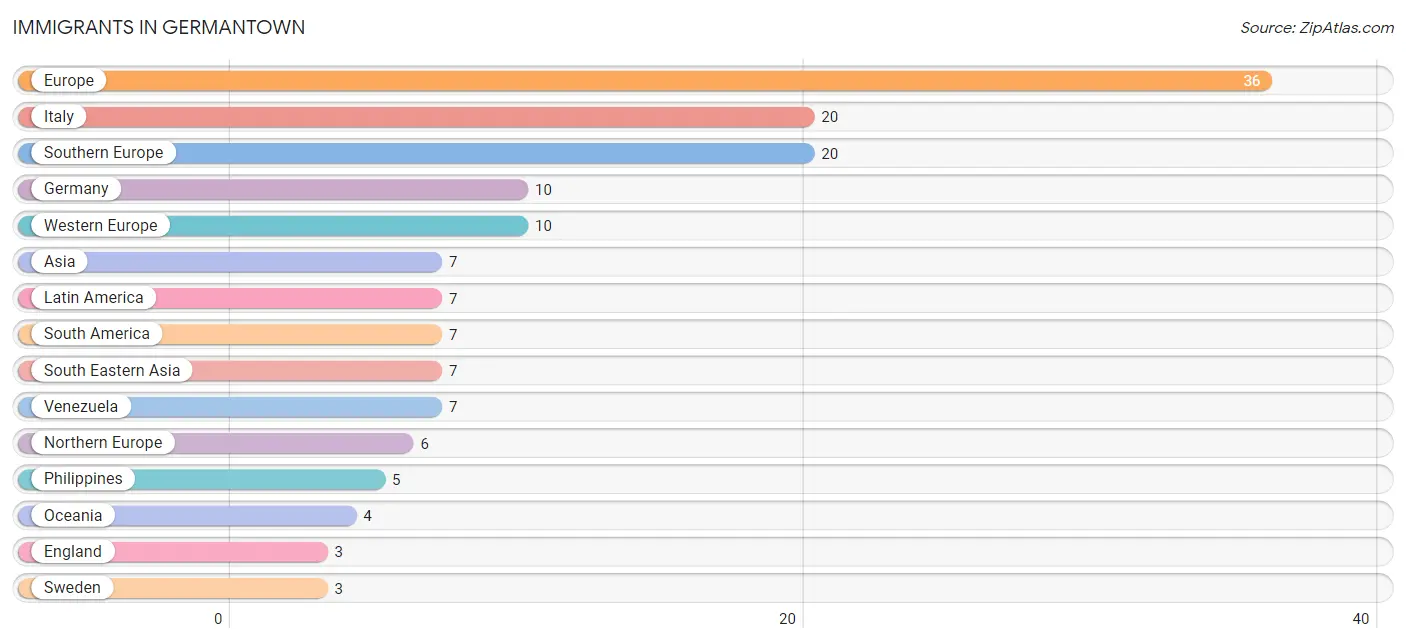
Immigrants in Germantown
The most numerous immigrant groups reported in Germantown came from Europe (36 | 3.4%), Italy (20 | 1.9%), Southern Europe (20 | 1.9%), Germany (10 | 0.9%), and Western Europe (10 | 0.9%), together accounting for 9.0% of all Germantown residents.
| Immigration Origin | # Population | % Population |
| Asia | 7 | 0.7% |
| England | 3 | 0.3% |
| Europe | 36 | 3.4% |
| Germany | 10 | 0.9% |
| Italy | 20 | 1.9% |
| Latin America | 7 | 0.7% |
| Northern Europe | 6 | 0.6% |
| Oceania | 4 | 0.4% |
| Philippines | 5 | 0.5% |
| South America | 7 | 0.7% |
| South Eastern Asia | 7 | 0.7% |
| Southern Europe | 20 | 1.9% |
| Sweden | 3 | 0.3% |
| Thailand | 2 | 0.2% |
| Venezuela | 7 | 0.7% |
| Western Europe | 10 | 0.9% | View All 16 Rows |
Sex and Age in Germantown
Sex and Age in Germantown
The most populous age groups in Germantown are 55 to 59 Years (99 | 19.0%) for men and 70 to 74 Years (65 | 11.9%) for women.
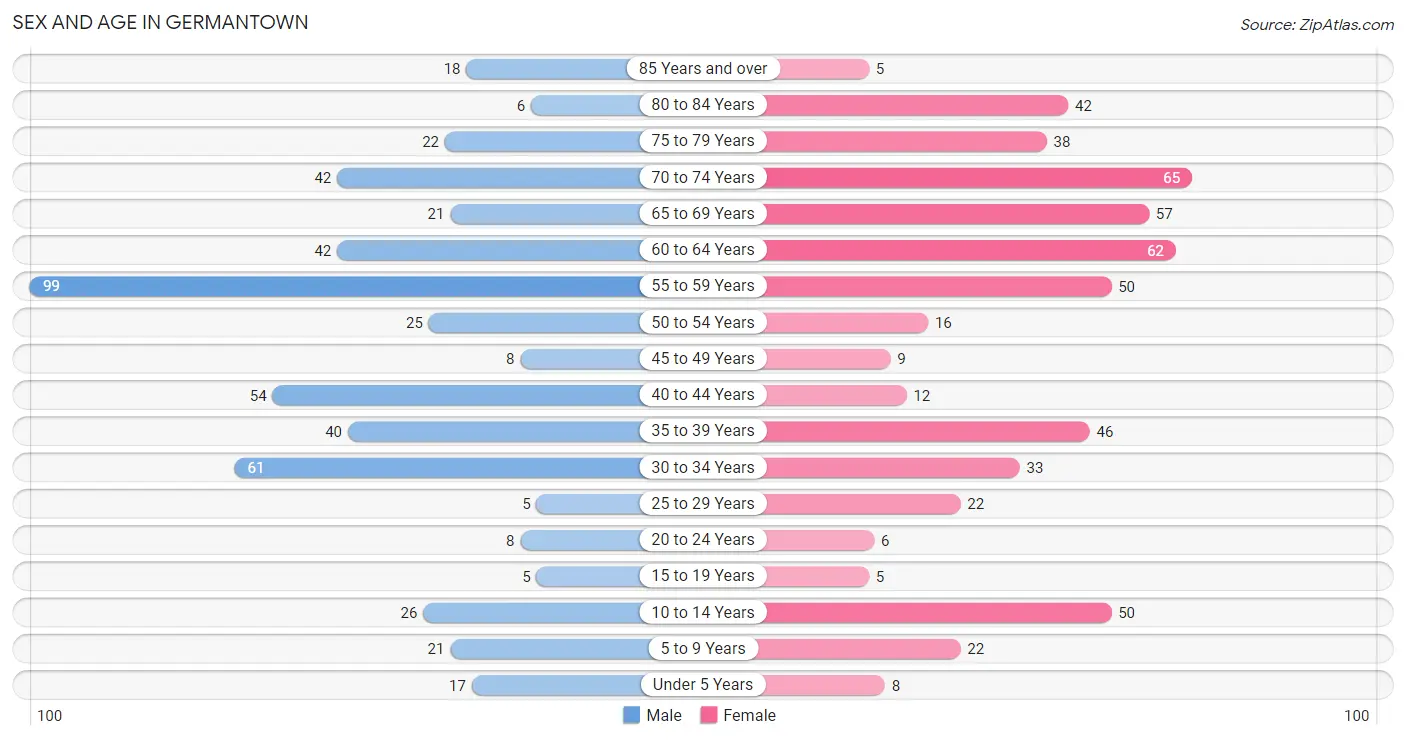
| Age Bracket | Male | Female |
| Under 5 Years | 17 (3.3%) | 8 (1.5%) |
| 5 to 9 Years | 21 (4.0%) | 22 (4.0%) |
| 10 to 14 Years | 26 (5.0%) | 50 (9.1%) |
| 15 to 19 Years | 5 (1.0%) | 5 (0.9%) |
| 20 to 24 Years | 8 (1.5%) | 6 (1.1%) |
| 25 to 29 Years | 5 (1.0%) | 22 (4.0%) |
| 30 to 34 Years | 61 (11.7%) | 33 (6.0%) |
| 35 to 39 Years | 40 (7.7%) | 46 (8.4%) |
| 40 to 44 Years | 54 (10.4%) | 12 (2.2%) |
| 45 to 49 Years | 8 (1.5%) | 9 (1.6%) |
| 50 to 54 Years | 25 (4.8%) | 16 (2.9%) |
| 55 to 59 Years | 99 (19.0%) | 50 (9.1%) |
| 60 to 64 Years | 42 (8.1%) | 62 (11.3%) |
| 65 to 69 Years | 21 (4.0%) | 57 (10.4%) |
| 70 to 74 Years | 42 (8.1%) | 65 (11.9%) |
| 75 to 79 Years | 22 (4.2%) | 38 (6.9%) |
| 80 to 84 Years | 6 (1.1%) | 42 (7.7%) |
| 85 Years and over | 18 (3.5%) | 5 (0.9%) |
| Total | 520 (100.0%) | 548 (100.0%) |
Families and Households in Germantown
Median Family Size in Germantown
The median family size in Germantown is 2.30 persons per family, with married-couple families (247 | 76.7%) accounting for the largest median family size of 2.33 persons per family. On the other hand, single male/father families (43 | 13.4%) represent the smallest median family size with 2.16 persons per family.
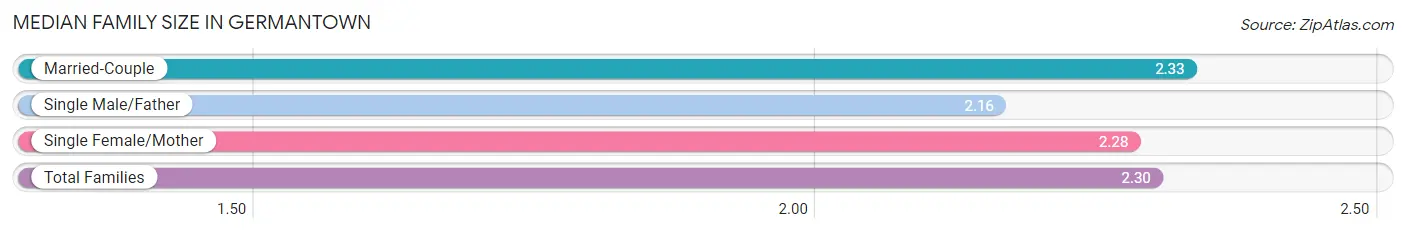
| Family Type | # Families | Family Size |
| Married-Couple | 247 (76.7%) | 2.33 |
| Single Male/Father | 43 (13.4%) | 2.16 |
| Single Female/Mother | 32 (9.9%) | 2.28 |
| Total Families | 322 (100.0%) | 2.30 |
Median Household Size in Germantown
The median household size in Germantown is 1.86 persons per household, with single female/mother households (32 | 5.7%) accounting for the largest median household size of 2.47 persons per household. non-family households (243 | 43.0%) represent the smallest median household size with 1.22 persons per household.
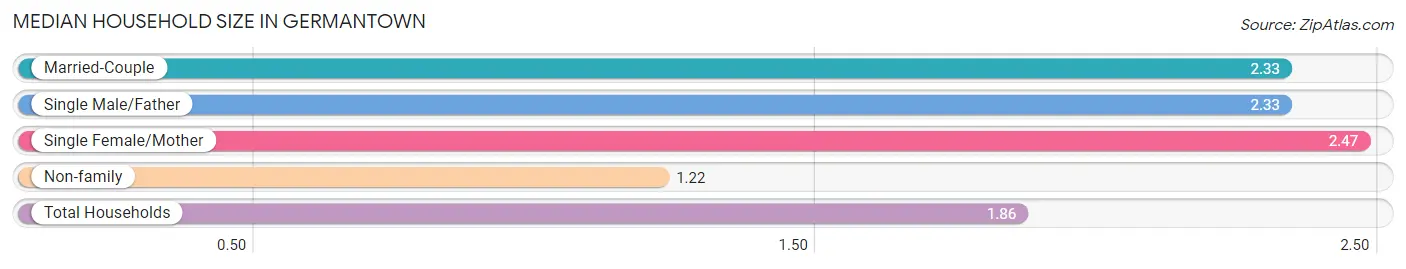
| Household Type | # Households | Household Size |
| Married-Couple | 247 (43.7%) | 2.33 |
| Single Male/Father | 43 (7.6%) | 2.33 |
| Single Female/Mother | 32 (5.7%) | 2.47 |
| Non-family | 243 (43.0%) | 1.22 |
| Total Households | 565 (100.0%) | 1.86 |
Household Size by Marriage Status in Germantown
Out of a total of 565 households in Germantown, 322 (57.0%) are family households, while 243 (43.0%) are nonfamily households. The most numerous type of family households are 2-person households, comprising 243, and the most common type of nonfamily households are 1-person households, comprising 188.
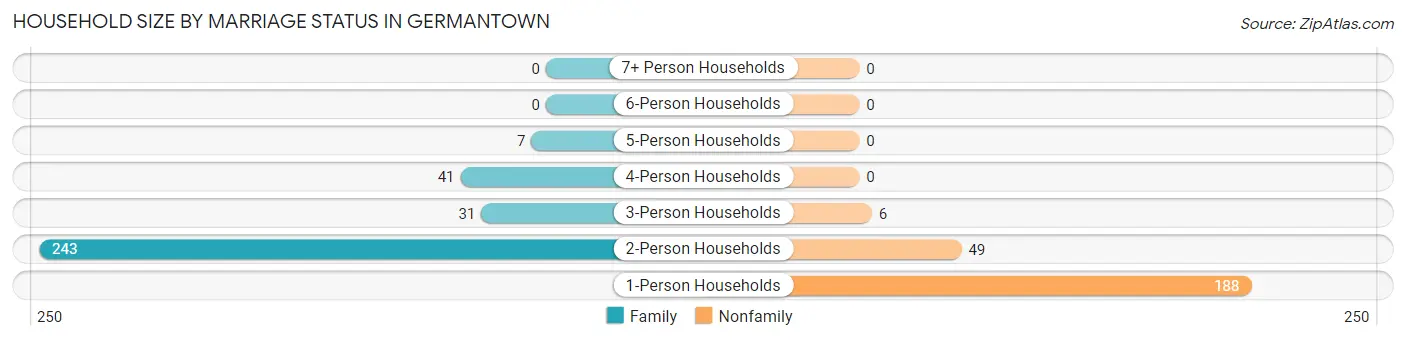
| Household Size | Family Households | Nonfamily Households |
| 1-Person Households | - | 188 (33.3%) |
| 2-Person Households | 243 (43.0%) | 49 (8.7%) |
| 3-Person Households | 31 (5.5%) | 6 (1.1%) |
| 4-Person Households | 41 (7.3%) | 0 (0.0%) |
| 5-Person Households | 7 (1.2%) | 0 (0.0%) |
| 6-Person Households | 0 (0.0%) | 0 (0.0%) |
| 7+ Person Households | 0 (0.0%) | 0 (0.0%) |
| Total | 322 (57.0%) | 243 (43.0%) |
Female Fertility in Germantown
Fertility by Age in Germantown
Average fertility rate in Germantown is 23.0 births per 1,000 women. Women in the age bracket of 20 to 34 years have the highest fertility rate with 49.0 births per 1,000 women. Women in the age bracket of 20 to 34 years acount for 100.0% of all women with births.
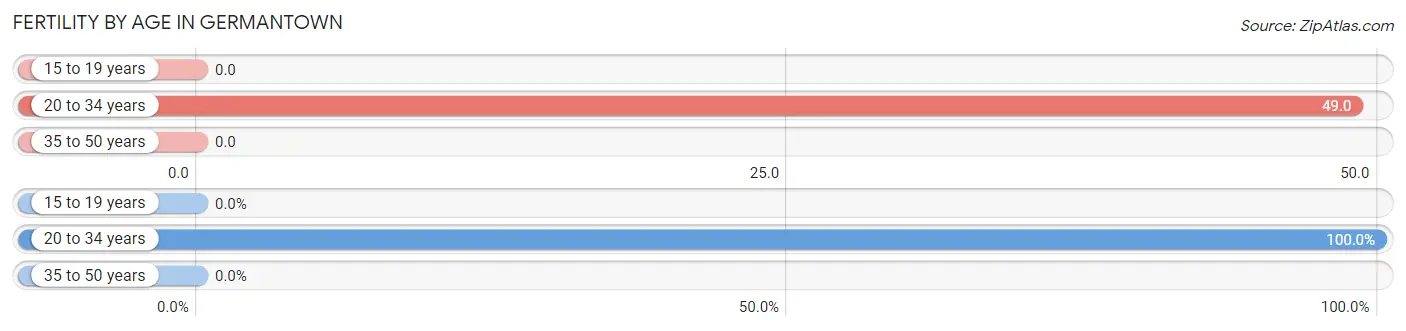
| Age Bracket | Women with Births | Births / 1,000 Women |
| 15 to 19 years | 0 (0.0%) | 0.0 |
| 20 to 34 years | 3 (100.0%) | 49.0 |
| 35 to 50 years | 0 (0.0%) | 0.0 |
| Total | 3 (100.0%) | 23.0 |
Fertility by Age by Marriage Status in Germantown
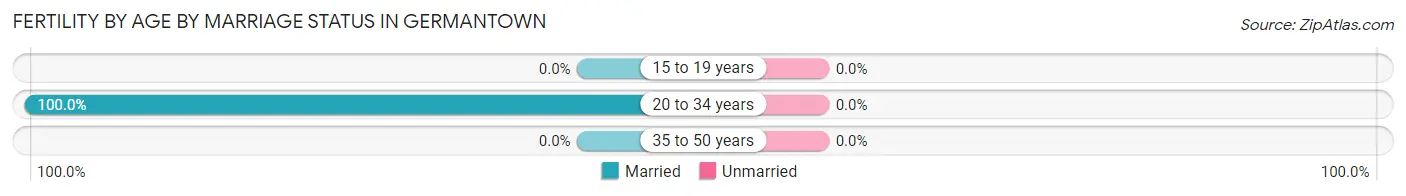
| Age Bracket | Married | Unmarried |
| 15 to 19 years | 0 (0.0%) | 0 (0.0%) |
| 20 to 34 years | 3 (100.0%) | 0 (0.0%) |
| 35 to 50 years | 0 (0.0%) | 0 (0.0%) |
| Total | 3 (100.0%) | 0 (0.0%) |
Fertility by Education in Germantown
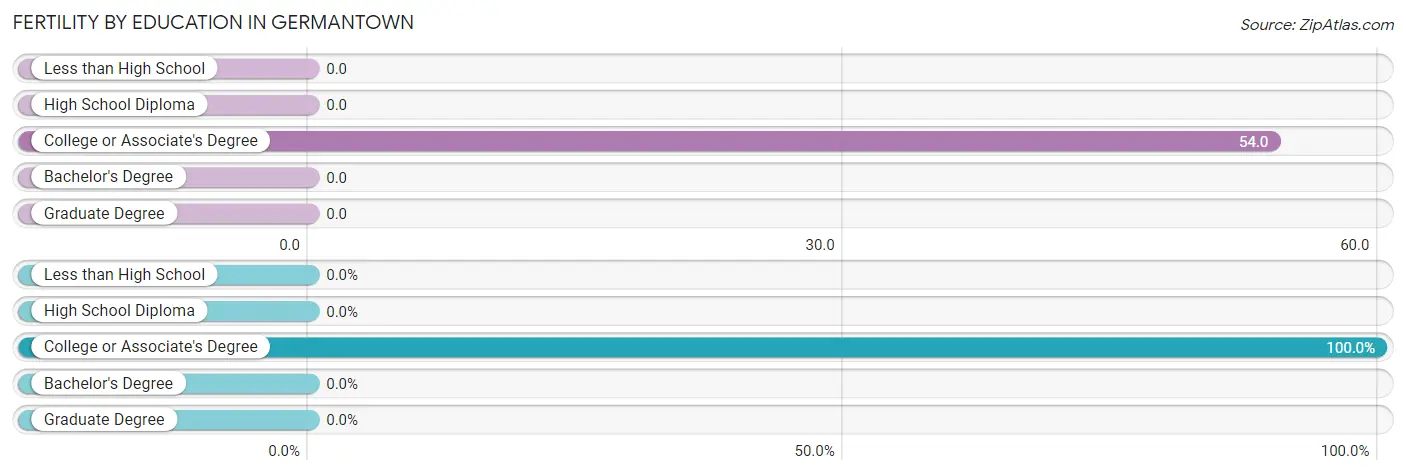
| Educational Attainment | Women with Births | Births / 1,000 Women |
| Less than High School | 0 (0.0%) | 0.0 |
| High School Diploma | 0 (0.0%) | 0.0 |
| College or Associate's Degree | 3 (100.0%) | 54.0 |
| Bachelor's Degree | 0 (0.0%) | 0.0 |
| Graduate Degree | 0 (0.0%) | 0.0 |
| Total | 3 (100.0%) | 23.0 |
Fertility by Education by Marriage Status in Germantown
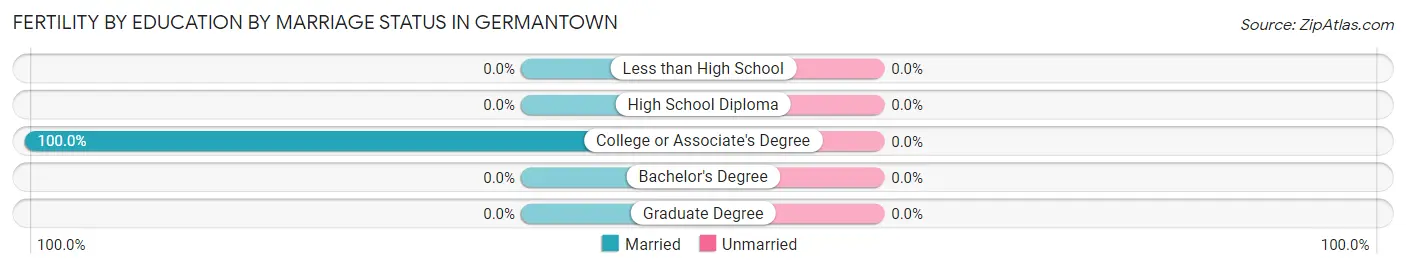
| Educational Attainment | Married | Unmarried |
| Less than High School | 0 (0.0%) | 0 (0.0%) |
| High School Diploma | 0 (0.0%) | 0 (0.0%) |
| College or Associate's Degree | 3 (100.0%) | 0 (0.0%) |
| Bachelor's Degree | 0 (0.0%) | 0 (0.0%) |
| Graduate Degree | 0 (0.0%) | 0 (0.0%) |
| Total | 3 (100.0%) | 0 (0.0%) |
Income in Germantown
Income Overview in Germantown
Per Capita Income in Germantown is $55,950, while median incomes of families and households are $91,755 and $89,120 respectively.
| Characteristic | Number | Measure |
| Per Capita Income | 1,068 | $55,950 |
| Median Family Income | 322 | $91,755 |
| Mean Family Income | 322 | $140,255 |
| Median Household Income | 565 | $89,120 |
| Mean Household Income | 565 | $109,767 |
| Income Deficit | 322 | $0 |
| Wage / Income Gap (%) | 1,068 | 25.31% |
| Wage / Income Gap ($) | 1,068 | 74.69¢ per $1 |
| Gini / Inequality Index | 1,068 | 0.47 |
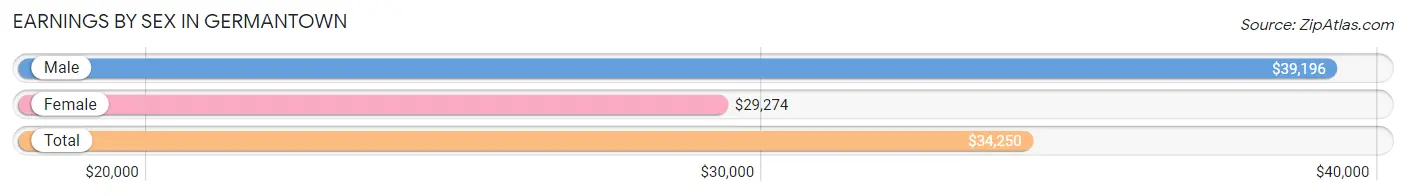
Earnings by Sex in Germantown
Average Earnings in Germantown are $34,250, $39,196 for men and $29,274 for women, a difference of 25.3%.
| Sex | Number | Average Earnings |
| Male | 337 (55.7%) | $39,196 |
| Female | 268 (44.3%) | $29,274 |
| Total | 605 (100.0%) | $34,250 |
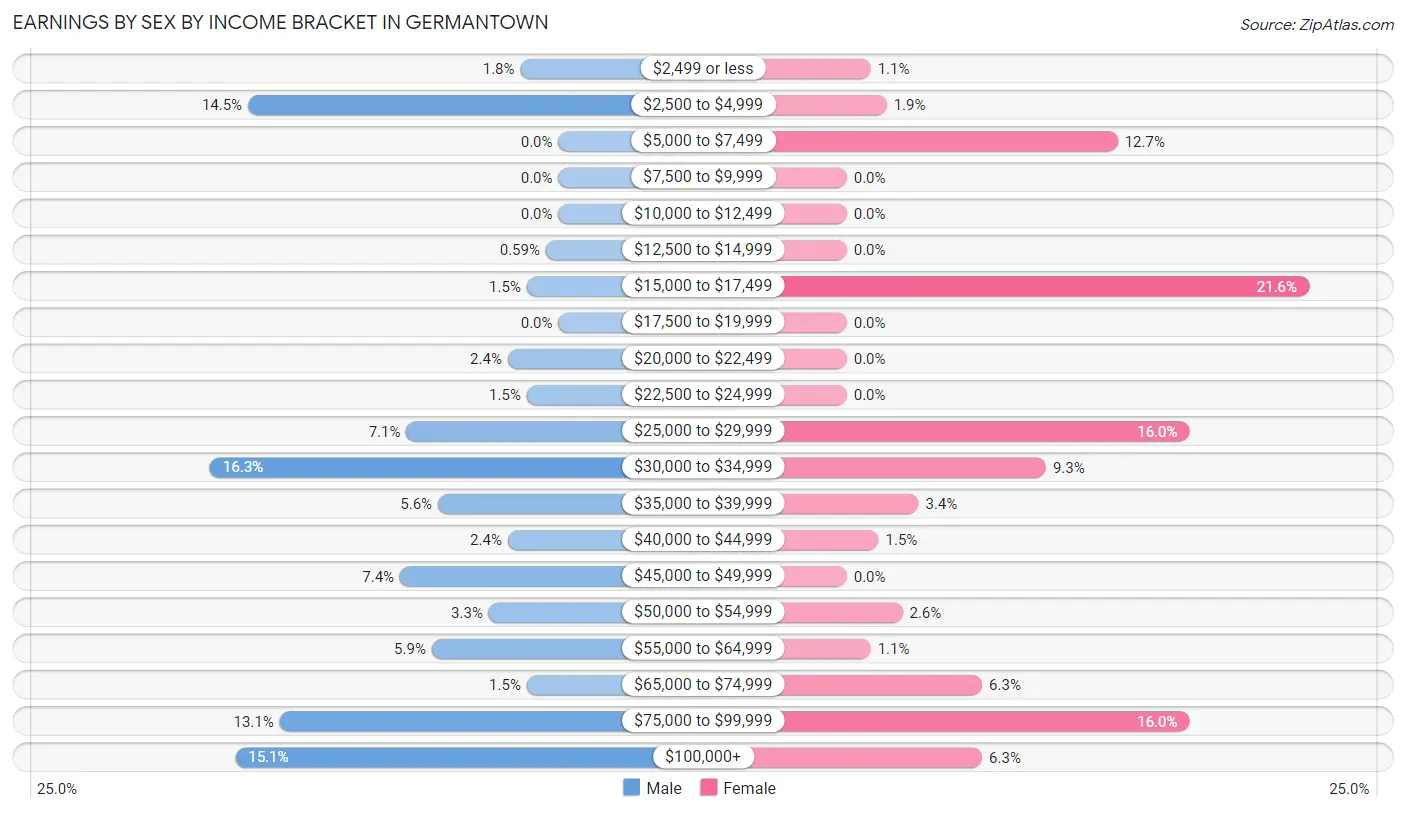
Earnings by Sex by Income Bracket in Germantown
The most common earnings brackets in Germantown are $30,000 to $34,999 for men (55 | 16.3%) and $15,000 to $17,499 for women (58 | 21.6%).
| Income | Male | Female |
| $2,499 or less | 6 (1.8%) | 3 (1.1%) |
| $2,500 to $4,999 | 49 (14.5%) | 5 (1.9%) |
| $5,000 to $7,499 | 0 (0.0%) | 34 (12.7%) |
| $7,500 to $9,999 | 0 (0.0%) | 0 (0.0%) |
| $10,000 to $12,499 | 0 (0.0%) | 0 (0.0%) |
| $12,500 to $14,999 | 2 (0.6%) | 0 (0.0%) |
| $15,000 to $17,499 | 5 (1.5%) | 58 (21.6%) |
| $17,500 to $19,999 | 0 (0.0%) | 0 (0.0%) |
| $20,000 to $22,499 | 8 (2.4%) | 0 (0.0%) |
| $22,500 to $24,999 | 5 (1.5%) | 0 (0.0%) |
| $25,000 to $29,999 | 24 (7.1%) | 43 (16.0%) |
| $30,000 to $34,999 | 55 (16.3%) | 25 (9.3%) |
| $35,000 to $39,999 | 19 (5.6%) | 9 (3.4%) |
| $40,000 to $44,999 | 8 (2.4%) | 4 (1.5%) |
| $45,000 to $49,999 | 25 (7.4%) | 0 (0.0%) |
| $50,000 to $54,999 | 11 (3.3%) | 7 (2.6%) |
| $55,000 to $64,999 | 20 (5.9%) | 3 (1.1%) |
| $65,000 to $74,999 | 5 (1.5%) | 17 (6.3%) |
| $75,000 to $99,999 | 44 (13.1%) | 43 (16.0%) |
| $100,000+ | 51 (15.1%) | 17 (6.3%) |
| Total | 337 (100.0%) | 268 (100.0%) |
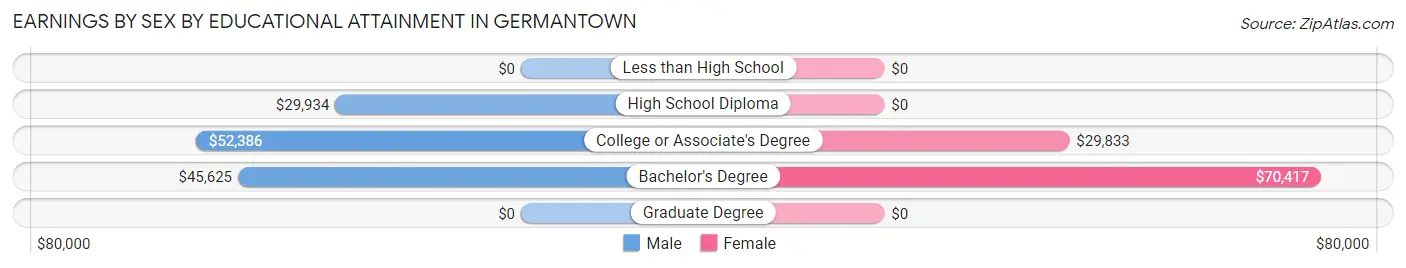
Earnings by Sex by Educational Attainment in Germantown
Average earnings in Germantown are $39,286 for men and $29,516 for women, a difference of 24.9%. Men with an educational attainment of college or associate's degree enjoy the highest average annual earnings of $52,386, while those with high school diploma education earn the least with $29,934. Women with an educational attainment of bachelor's degree earn the most with the average annual earnings of $70,417, while those with college or associate's degree education have the smallest earnings of $29,833.
| Educational Attainment | Male Income | Female Income |
| Less than High School | - | - |
| High School Diploma | $29,934 | $0 |
| College or Associate's Degree | $52,386 | $29,833 |
| Bachelor's Degree | $45,625 | $70,417 |
| Graduate Degree | - | - |
| Total | $39,286 | $29,516 |
Family Income in Germantown
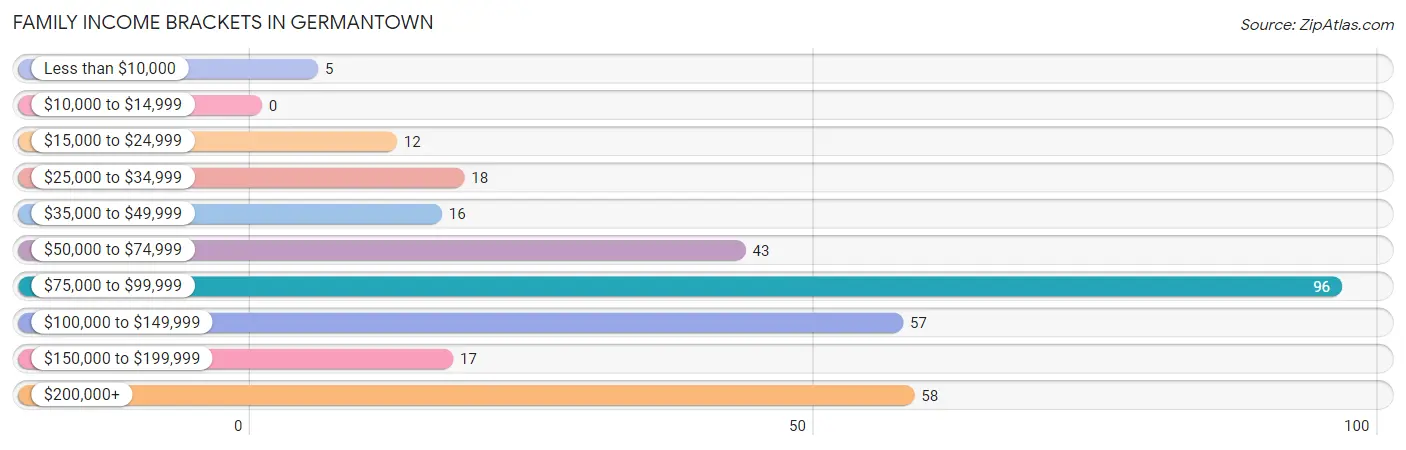
Family Income Brackets in Germantown
According to the Germantown family income data, there are 96 families falling into the $75,000 to $99,999 income range, which is the most common income bracket and makes up 29.8% of all families.
| Income Bracket | # Families | % Families |
| Less than $10,000 | 5 | 1.6% |
| $10,000 to $14,999 | 0 | 0.0% |
| $15,000 to $24,999 | 12 | 3.7% |
| $25,000 to $34,999 | 18 | 5.6% |
| $35,000 to $49,999 | 16 | 5.0% |
| $50,000 to $74,999 | 43 | 13.4% |
| $75,000 to $99,999 | 96 | 29.8% |
| $100,000 to $149,999 | 57 | 17.7% |
| $150,000 to $199,999 | 17 | 5.3% |
| $200,000+ | 58 | 18.0% |
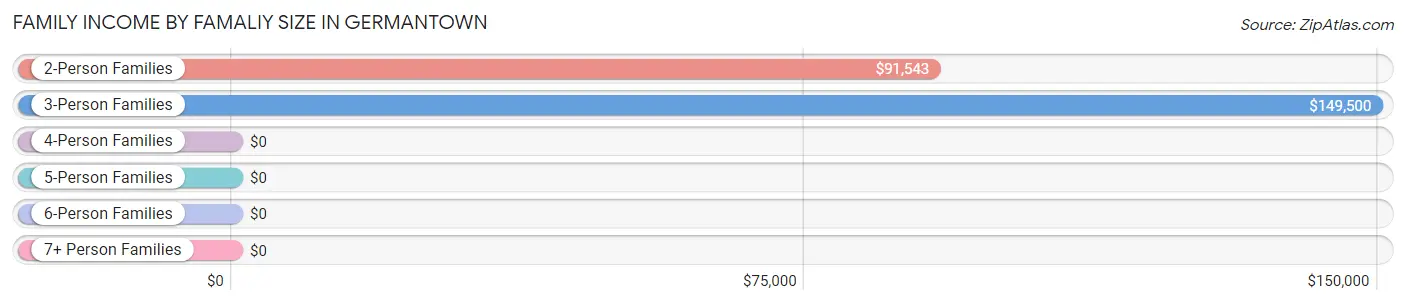
Family Income by Famaliy Size in Germantown
3-person families (26 | 8.1%) account for the highest median family income in Germantown with $149,500 per family, while 3-person families (26 | 8.1%) have the highest median income of $49,833 per family member.
| Income Bracket | # Families | Median Income |
| 2-Person Families | 254 (78.9%) | $91,543 |
| 3-Person Families | 26 (8.1%) | $149,500 |
| 4-Person Families | 35 (10.9%) | $0 |
| 5-Person Families | 7 (2.2%) | $0 |
| 6-Person Families | 0 (0.0%) | $0 |
| 7+ Person Families | 0 (0.0%) | $0 |
| Total | 322 (100.0%) | $91,755 |
Family Income by Number of Earners in Germantown
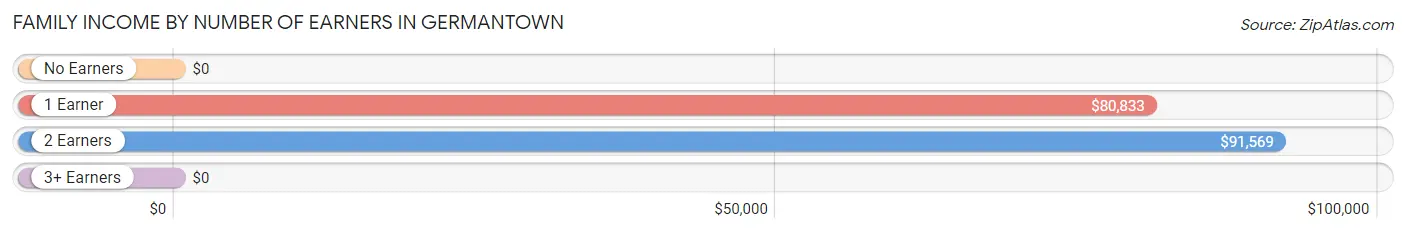
| Number of Earners | # Families | Median Income |
| No Earners | 63 (19.6%) | $0 |
| 1 Earner | 106 (32.9%) | $80,833 |
| 2 Earners | 149 (46.3%) | $91,569 |
| 3+ Earners | 4 (1.2%) | $0 |
| Total | 322 (100.0%) | $91,755 |
Household Income in Germantown
Household Income Brackets in Germantown
With 165 households falling in the category, the $75,000 to $99,999 income range is the most frequent in Germantown, accounting for 29.2% of all households. In contrast, only 18 households (3.2%) fall into the $25,000 to $34,999 income bracket, making it the least populous group.
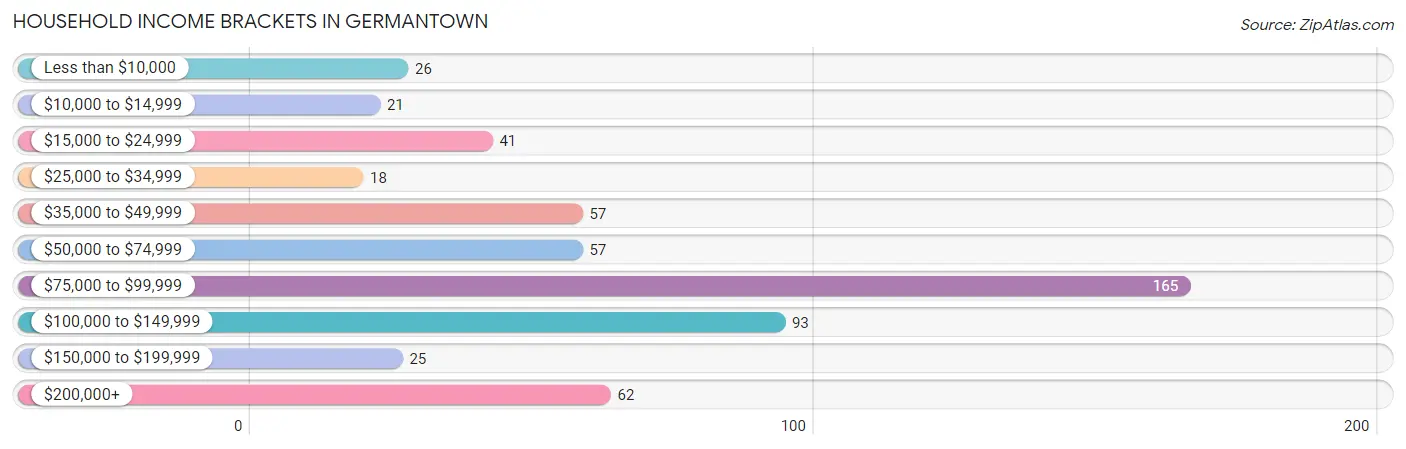
| Income Bracket | # Households | % Households |
| Less than $10,000 | 26 | 4.6% |
| $10,000 to $14,999 | 21 | 3.7% |
| $15,000 to $24,999 | 41 | 7.3% |
| $25,000 to $34,999 | 18 | 3.2% |
| $35,000 to $49,999 | 57 | 10.1% |
| $50,000 to $74,999 | 57 | 10.1% |
| $75,000 to $99,999 | 165 | 29.2% |
| $100,000 to $149,999 | 93 | 16.5% |
| $150,000 to $199,999 | 25 | 4.4% |
| $200,000+ | 62 | 11.0% |
Household Income by Householder Age in Germantown
The median household income in Germantown is $89,120, with the highest median household income of $102,727 found in the 25 to 44 years age bracket for the primary householder. A total of 130 households (23.0%) fall into this category.
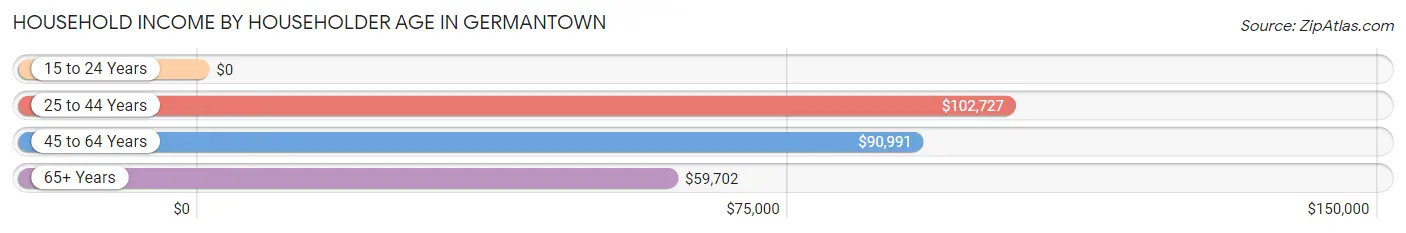
| Income Bracket | # Households | Median Income |
| 15 to 24 Years | 0 (0.0%) | $0 |
| 25 to 44 Years | 130 (23.0%) | $102,727 |
| 45 to 64 Years | 184 (32.6%) | $90,991 |
| 65+ Years | 251 (44.4%) | $59,702 |
| Total | 565 (100.0%) | $89,120 |
Poverty in Germantown
Income Below Poverty by Sex and Age in Germantown
With 5.2% poverty level for males and 10.4% for females among the residents of Germantown, 75 year old and over males and 18 to 24 year old females are the most vulnerable to poverty, with 14 males (30.4%) and 6 females (100.0%) in their respective age groups living below the poverty level.
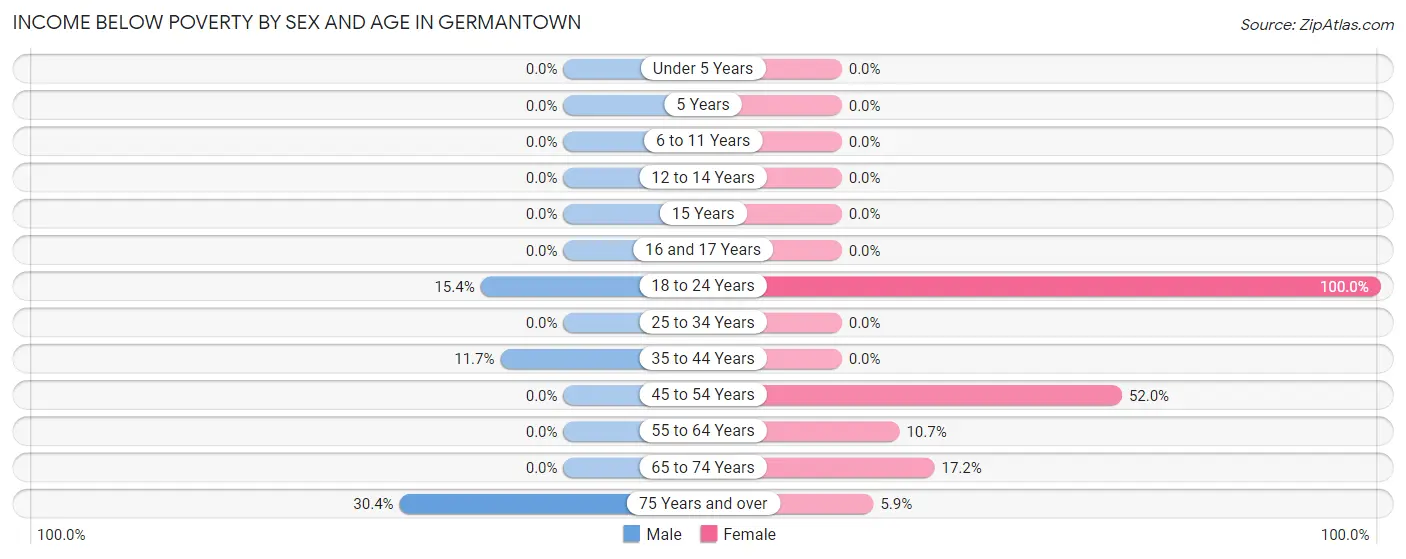
| Age Bracket | Male | Female |
| Under 5 Years | 0 (0.0%) | 0 (0.0%) |
| 5 Years | 0 (0.0%) | 0 (0.0%) |
| 6 to 11 Years | 0 (0.0%) | 0 (0.0%) |
| 12 to 14 Years | 0 (0.0%) | 0 (0.0%) |
| 15 Years | 0 (0.0%) | 0 (0.0%) |
| 16 and 17 Years | 0 (0.0%) | 0 (0.0%) |
| 18 to 24 Years | 2 (15.4%) | 6 (100.0%) |
| 25 to 34 Years | 0 (0.0%) | 0 (0.0%) |
| 35 to 44 Years | 11 (11.7%) | 0 (0.0%) |
| 45 to 54 Years | 0 (0.0%) | 13 (52.0%) |
| 55 to 64 Years | 0 (0.0%) | 12 (10.7%) |
| 65 to 74 Years | 0 (0.0%) | 21 (17.2%) |
| 75 Years and over | 14 (30.4%) | 5 (5.9%) |
| Total | 27 (5.2%) | 57 (10.4%) |
Income Above Poverty by Sex and Age in Germantown
According to the poverty statistics in Germantown, males aged under 5 years and females aged under 5 years are the age groups that are most secure financially, with 100.0% of males and 100.0% of females in these age groups living above the poverty line.
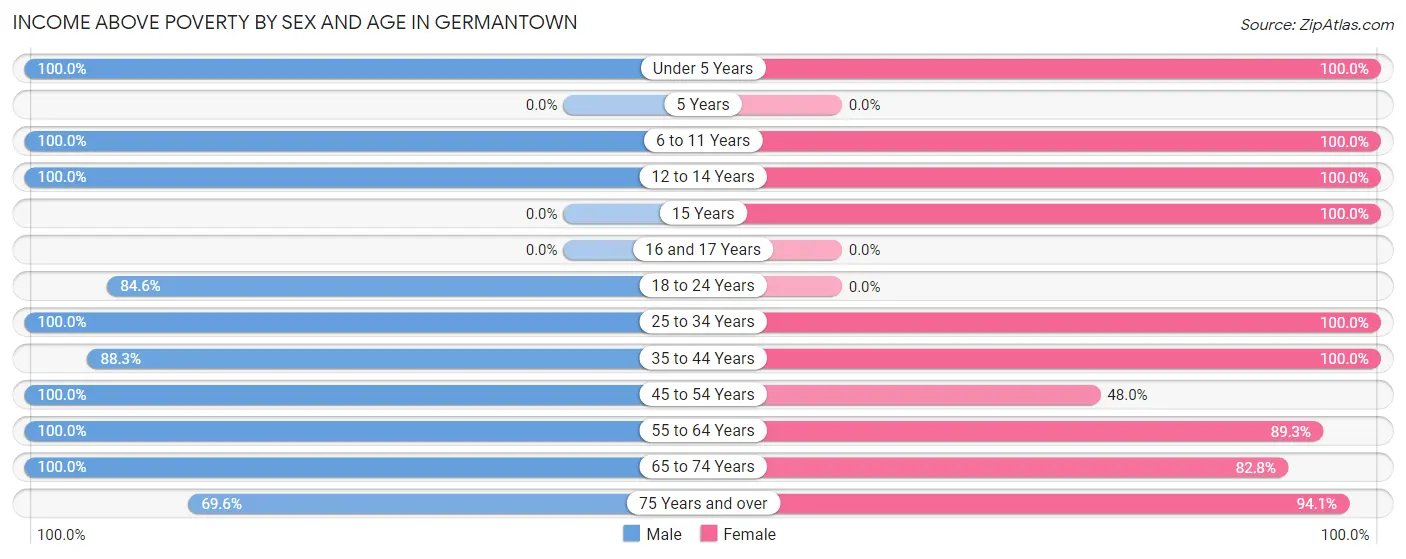
| Age Bracket | Male | Female |
| Under 5 Years | 17 (100.0%) | 8 (100.0%) |
| 5 Years | 0 (0.0%) | 0 (0.0%) |
| 6 to 11 Years | 33 (100.0%) | 48 (100.0%) |
| 12 to 14 Years | 14 (100.0%) | 24 (100.0%) |
| 15 Years | 0 (0.0%) | 5 (100.0%) |
| 16 and 17 Years | 0 (0.0%) | 0 (0.0%) |
| 18 to 24 Years | 11 (84.6%) | 0 (0.0%) |
| 25 to 34 Years | 66 (100.0%) | 55 (100.0%) |
| 35 to 44 Years | 83 (88.3%) | 58 (100.0%) |
| 45 to 54 Years | 33 (100.0%) | 12 (48.0%) |
| 55 to 64 Years | 141 (100.0%) | 100 (89.3%) |
| 65 to 74 Years | 63 (100.0%) | 101 (82.8%) |
| 75 Years and over | 32 (69.6%) | 80 (94.1%) |
| Total | 493 (94.8%) | 491 (89.6%) |
Income Below Poverty Among Married-Couple Families in Germantown
The poverty statistics for married-couple families in Germantown show that 6.9% or 17 of the total 247 families live below the poverty line. Families with no children have the highest poverty rate of 8.8%, comprising of 17 families. On the other hand, families with 1 or 2 children have the lowest poverty rate of 0.0%, which includes 0 families.
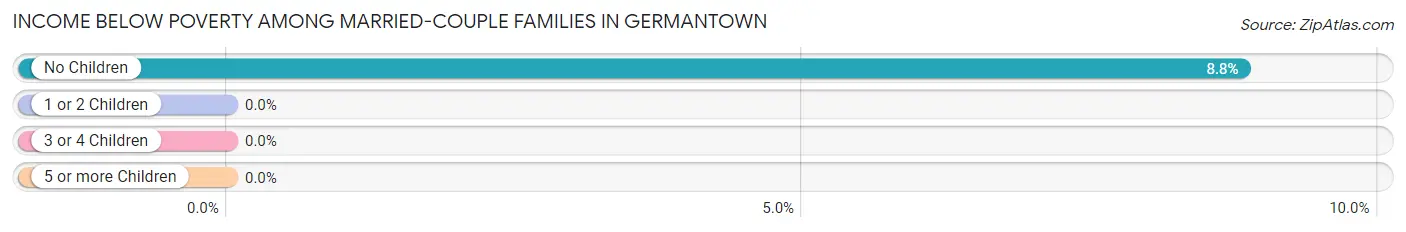
| Children | Above Poverty | Below Poverty |
| No Children | 176 (91.2%) | 17 (8.8%) |
| 1 or 2 Children | 47 (100.0%) | 0 (0.0%) |
| 3 or 4 Children | 7 (100.0%) | 0 (0.0%) |
| 5 or more Children | 0 (0.0%) | 0 (0.0%) |
| Total | 230 (93.1%) | 17 (6.9%) |
Income Below Poverty Among Single-Parent Households in Germantown
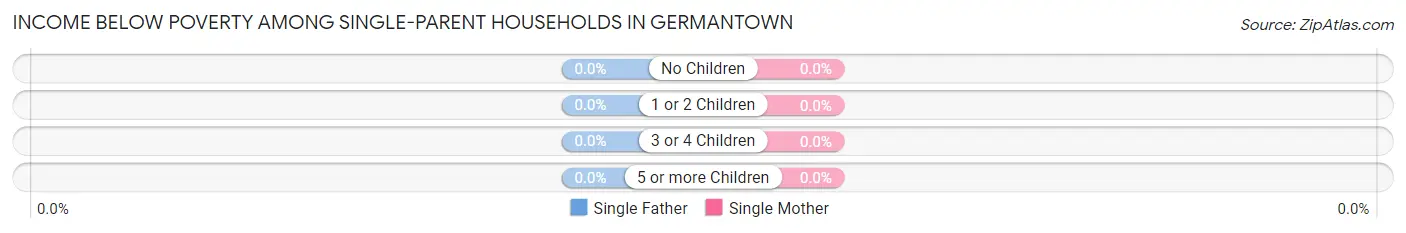
| Children | Single Father | Single Mother |
| No Children | 0 (0.0%) | 0 (0.0%) |
| 1 or 2 Children | 0 (0.0%) | 0 (0.0%) |
| 3 or 4 Children | 0 (0.0%) | 0 (0.0%) |
| 5 or more Children | 0 (0.0%) | 0 (0.0%) |
| Total | 0 (0.0%) | 0 (0.0%) |
Income Below Poverty Among Married-Couple vs Single-Parent Households in Germantown
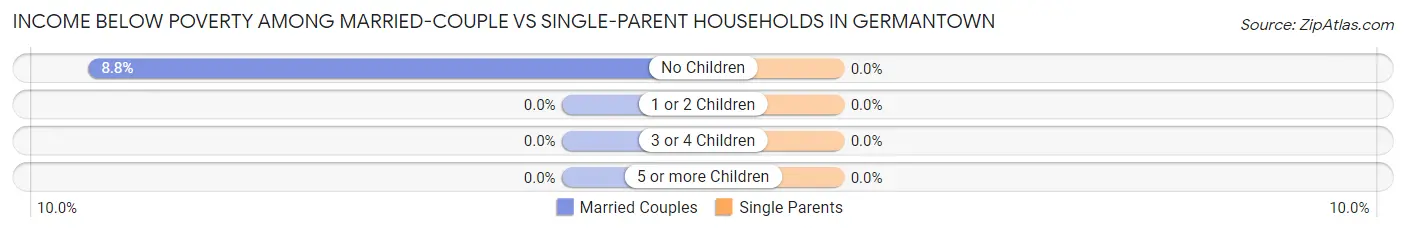
| Children | Married-Couple Families | Single-Parent Households |
| No Children | 17 (8.8%) | 0 (0.0%) |
| 1 or 2 Children | 0 (0.0%) | 0 (0.0%) |
| 3 or 4 Children | 0 (0.0%) | 0 (0.0%) |
| 5 or more Children | 0 (0.0%) | 0 (0.0%) |
| Total | 17 (6.9%) | 0 (0.0%) |
Employment Characteristics in Germantown
Employment by Class of Employer in Germantown
Among the 450 employed individuals in Germantown, private company employees (195 | 43.3%), not-for-profit organizations (118 | 26.2%), and self-employed (incorporated) (49 | 10.9%) make up the most common classes of employment.
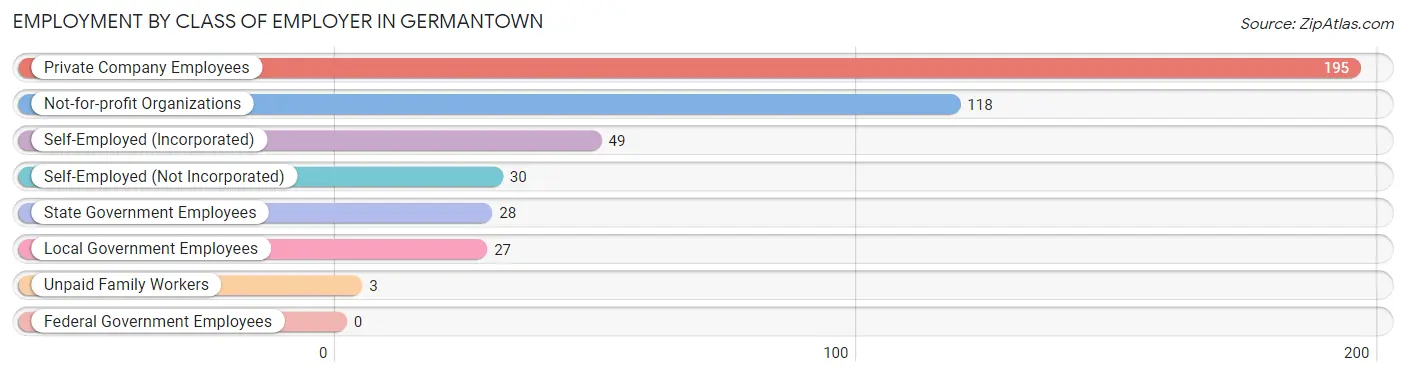
| Employer Class | # Employees | % Employees |
| Private Company Employees | 195 | 43.3% |
| Self-Employed (Incorporated) | 49 | 10.9% |
| Self-Employed (Not Incorporated) | 30 | 6.7% |
| Not-for-profit Organizations | 118 | 26.2% |
| Local Government Employees | 27 | 6.0% |
| State Government Employees | 28 | 6.2% |
| Federal Government Employees | 0 | 0.0% |
| Unpaid Family Workers | 3 | 0.7% |
| Total | 450 | 100.0% |
Employment Status by Age in Germantown
According to the labor force statistics for Germantown, out of the total population over 16 years of age (919), 54.4% or 500 individuals are in the labor force, with 9.4% or 47 of them unemployed. The age group with the highest labor force participation rate is 20 to 24 years, with 100.0% or 14 individuals in the labor force. Within the labor force, the 75 years and over age range has the highest percentage of unemployed individuals, with 100.0% or 11 of them being unemployed.
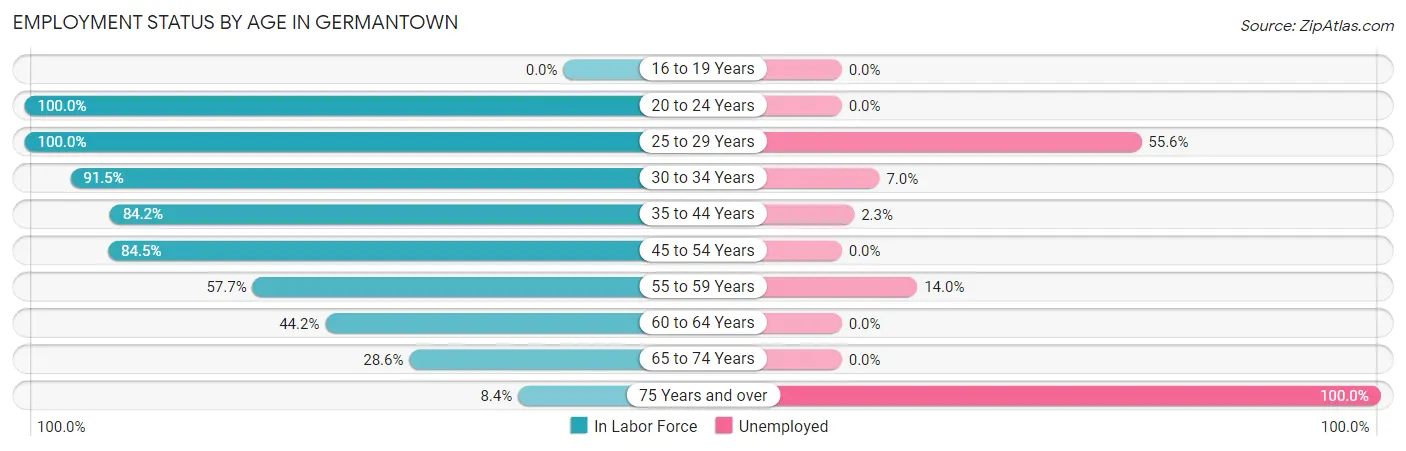
| Age Bracket | In Labor Force | Unemployed |
| 16 to 19 Years | 0 (0.0%) | 0 (0.0%) |
| 20 to 24 Years | 14 (100.0%) | 0 (0.0%) |
| 25 to 29 Years | 27 (100.0%) | 15 (55.6%) |
| 30 to 34 Years | 86 (91.5%) | 6 (7.0%) |
| 35 to 44 Years | 128 (84.2%) | 3 (2.3%) |
| 45 to 54 Years | 49 (84.5%) | 0 (0.0%) |
| 55 to 59 Years | 86 (57.7%) | 12 (14.0%) |
| 60 to 64 Years | 46 (44.2%) | 0 (0.0%) |
| 65 to 74 Years | 53 (28.6%) | 0 (0.0%) |
| 75 Years and over | 11 (8.4%) | 11 (100.0%) |
| Total | 500 (54.4%) | 47 (9.4%) |
Employment Status by Educational Attainment in Germantown
According to labor force statistics for Germantown, 72.3% of individuals (422) out of the total population between 25 and 64 years of age (584) are in the labor force, with 8.5% or 36 of them being unemployed. The group with the highest labor force participation rate are those with the educational attainment of college / associate degree, with 86.8% or 184 individuals in the labor force. Within the labor force, individuals with less than high school education have the highest percentage of unemployment, with 54.5% or 6 of them being unemployed.
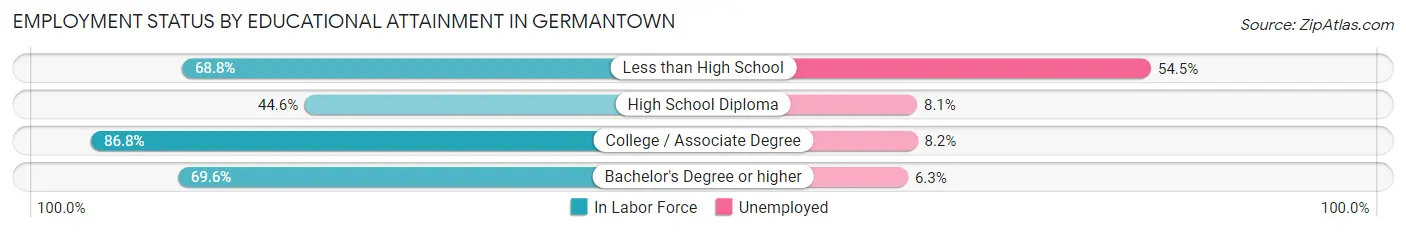
| Educational Attainment | In Labor Force | Unemployed |
| Less than High School | 11 (68.8%) | 9 (54.5%) |
| High School Diploma | 37 (44.6%) | 7 (8.1%) |
| College / Associate Degree | 184 (86.8%) | 17 (8.2%) |
| Bachelor's Degree or higher | 190 (69.6%) | 17 (6.3%) |
| Total | 422 (72.3%) | 50 (8.5%) |
Employment Occupations by Sex in Germantown
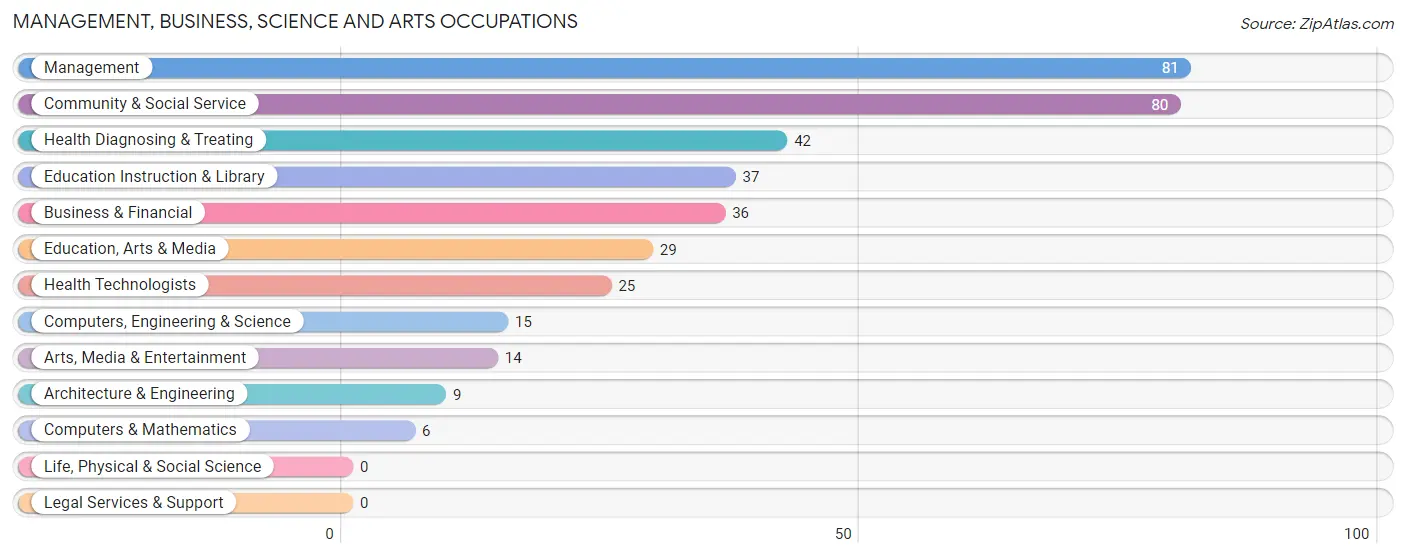
Management, Business, Science and Arts Occupations
The most common Management, Business, Science and Arts occupations in Germantown are Management (81 | 17.9%), Community & Social Service (80 | 17.7%), Health Diagnosing & Treating (42 | 9.3%), Education Instruction & Library (37 | 8.2%), and Business & Financial (36 | 8.0%).
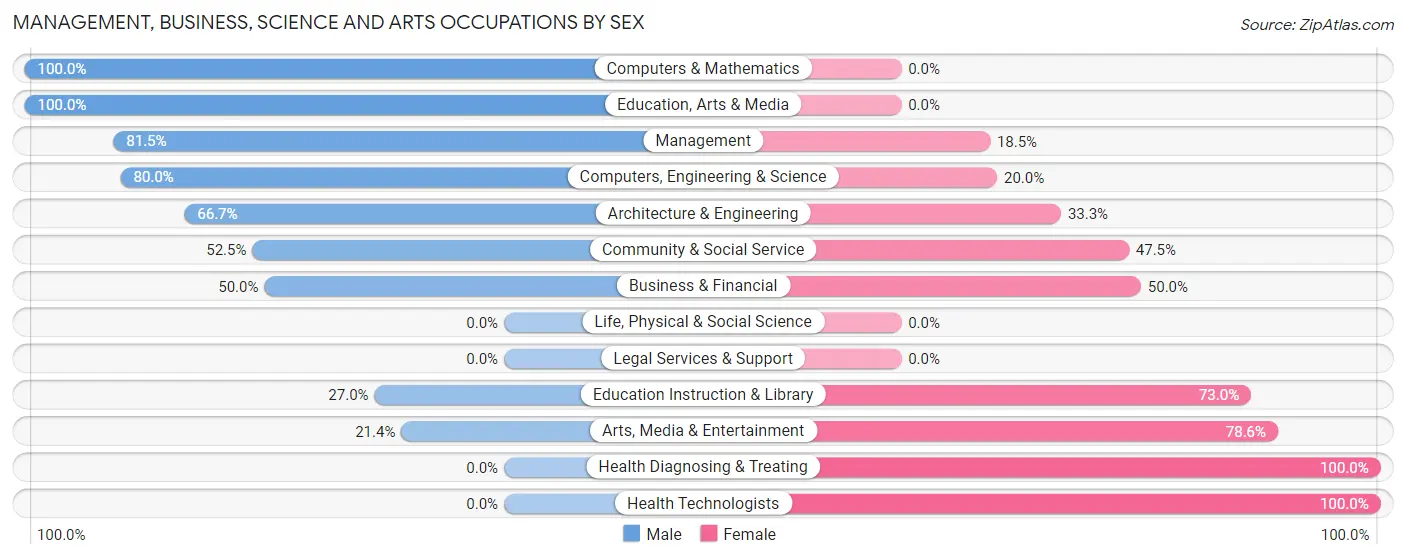
Management, Business, Science and Arts Occupations by Sex
Within the Management, Business, Science and Arts occupations in Germantown, the most male-oriented occupations are Computers & Mathematics (100.0%), Education, Arts & Media (100.0%), and Management (81.5%), while the most female-oriented occupations are Health Diagnosing & Treating (100.0%), Health Technologists (100.0%), and Arts, Media & Entertainment (78.6%).
| Occupation | Male | Female |
| Management | 66 (81.5%) | 15 (18.5%) |
| Business & Financial | 18 (50.0%) | 18 (50.0%) |
| Computers, Engineering & Science | 12 (80.0%) | 3 (20.0%) |
| Computers & Mathematics | 6 (100.0%) | 0 (0.0%) |
| Architecture & Engineering | 6 (66.7%) | 3 (33.3%) |
| Life, Physical & Social Science | 0 (0.0%) | 0 (0.0%) |
| Community & Social Service | 42 (52.5%) | 38 (47.5%) |
| Education, Arts & Media | 29 (100.0%) | 0 (0.0%) |
| Legal Services & Support | 0 (0.0%) | 0 (0.0%) |
| Education Instruction & Library | 10 (27.0%) | 27 (73.0%) |
| Arts, Media & Entertainment | 3 (21.4%) | 11 (78.6%) |
| Health Diagnosing & Treating | 0 (0.0%) | 42 (100.0%) |
| Health Technologists | 0 (0.0%) | 25 (100.0%) |
| Total (Category) | 138 (54.3%) | 116 (45.7%) |
| Total (Overall) | 269 (59.4%) | 184 (40.6%) |
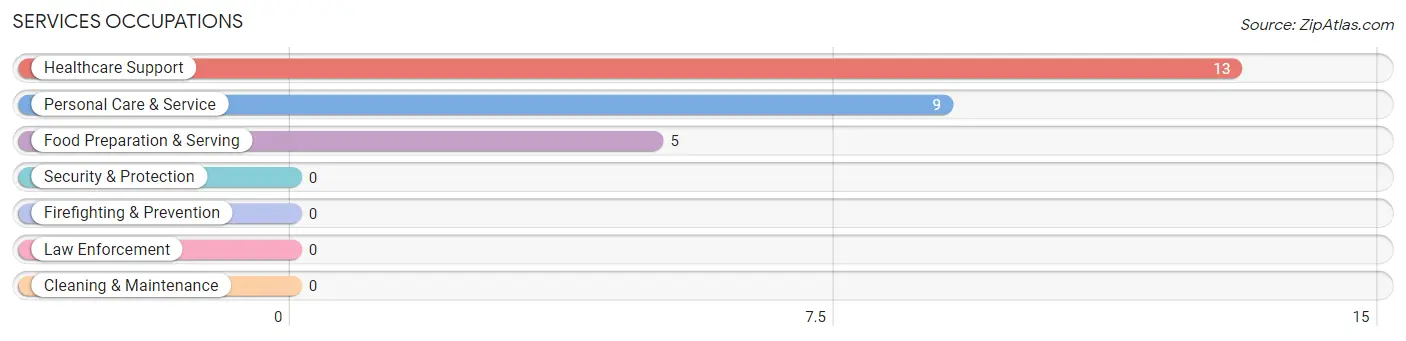
Services Occupations
The most common Services occupations in Germantown are Healthcare Support (13 | 2.9%), Personal Care & Service (9 | 2.0%), and Food Preparation & Serving (5 | 1.1%).
Services Occupations by Sex
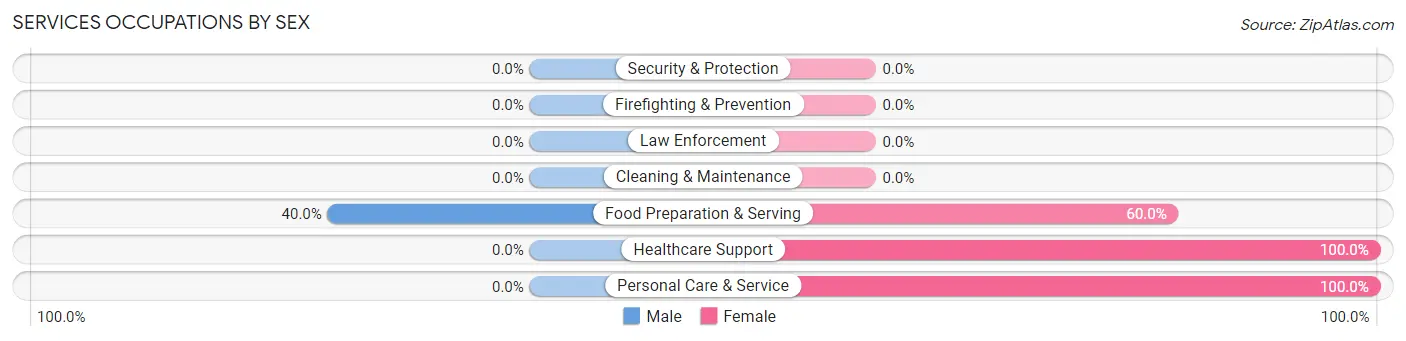
| Occupation | Male | Female |
| Healthcare Support | 0 (0.0%) | 13 (100.0%) |
| Security & Protection | 0 (0.0%) | 0 (0.0%) |
| Firefighting & Prevention | 0 (0.0%) | 0 (0.0%) |
| Law Enforcement | 0 (0.0%) | 0 (0.0%) |
| Food Preparation & Serving | 2 (40.0%) | 3 (60.0%) |
| Cleaning & Maintenance | 0 (0.0%) | 0 (0.0%) |
| Personal Care & Service | 0 (0.0%) | 9 (100.0%) |
| Total (Category) | 2 (7.4%) | 25 (92.6%) |
| Total (Overall) | 269 (59.4%) | 184 (40.6%) |
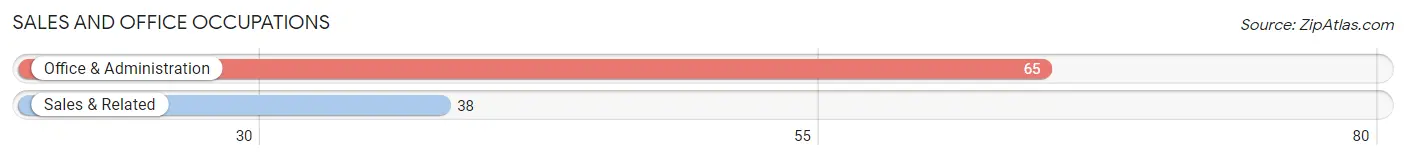
Sales and Office Occupations
The most common Sales and Office occupations in Germantown are Office & Administration (65 | 14.3%), and Sales & Related (38 | 8.4%).
Sales and Office Occupations by Sex
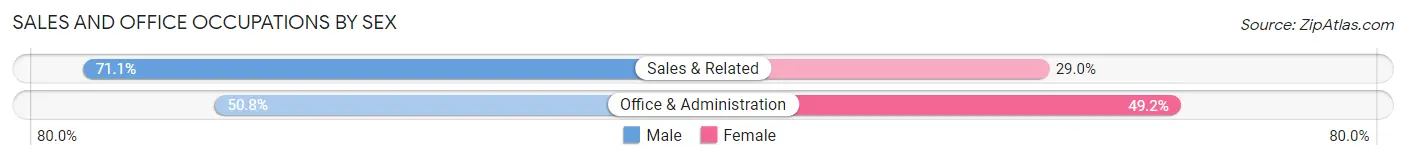
| Occupation | Male | Female |
| Sales & Related | 27 (71.1%) | 11 (28.9%) |
| Office & Administration | 33 (50.8%) | 32 (49.2%) |
| Total (Category) | 60 (58.3%) | 43 (41.7%) |
| Total (Overall) | 269 (59.4%) | 184 (40.6%) |
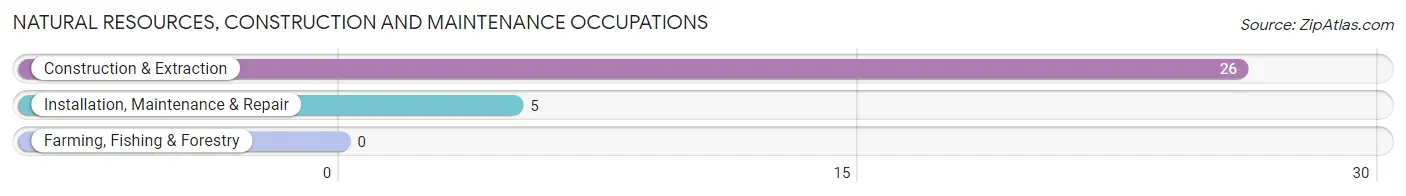
Natural Resources, Construction and Maintenance Occupations
The most common Natural Resources, Construction and Maintenance occupations in Germantown are Construction & Extraction (26 | 5.7%), and Installation, Maintenance & Repair (5 | 1.1%).
Natural Resources, Construction and Maintenance Occupations by Sex
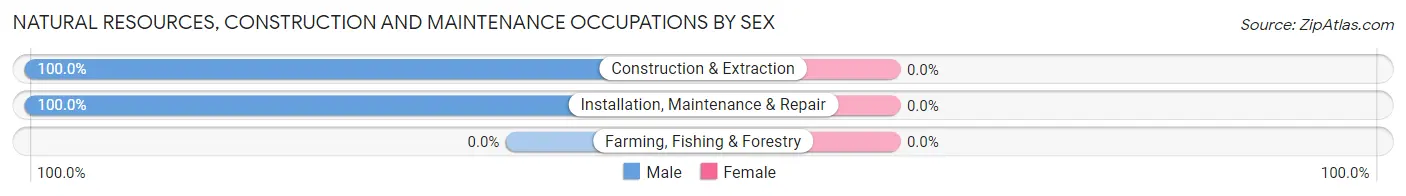
| Occupation | Male | Female |
| Farming, Fishing & Forestry | 0 (0.0%) | 0 (0.0%) |
| Construction & Extraction | 26 (100.0%) | 0 (0.0%) |
| Installation, Maintenance & Repair | 5 (100.0%) | 0 (0.0%) |
| Total (Category) | 31 (100.0%) | 0 (0.0%) |
| Total (Overall) | 269 (59.4%) | 184 (40.6%) |
Production, Transportation and Moving Occupations
The most common Production, Transportation and Moving occupations in Germantown are Production (20 | 4.4%), Transportation (15 | 3.3%), and Material Moving (3 | 0.7%).
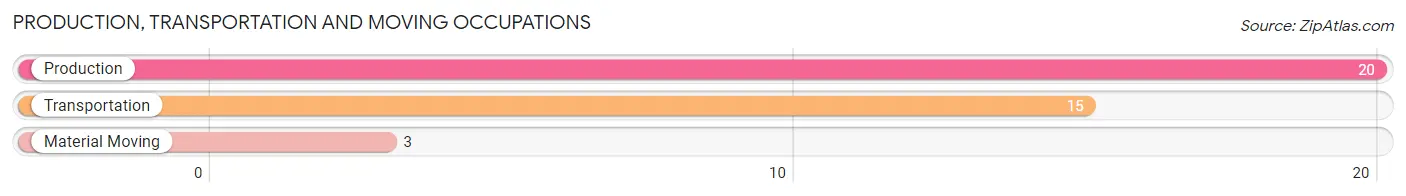
Production, Transportation and Moving Occupations by Sex
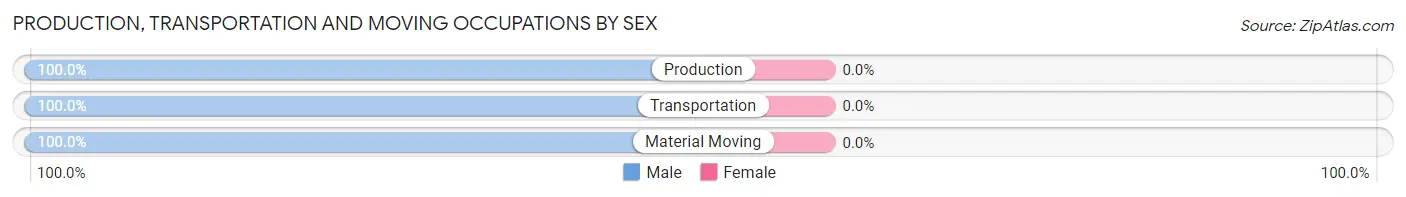
| Occupation | Male | Female |
| Production | 20 (100.0%) | 0 (0.0%) |
| Transportation | 15 (100.0%) | 0 (0.0%) |
| Material Moving | 3 (100.0%) | 0 (0.0%) |
| Total (Category) | 38 (100.0%) | 0 (0.0%) |
| Total (Overall) | 269 (59.4%) | 184 (40.6%) |
Employment Industries by Sex in Germantown
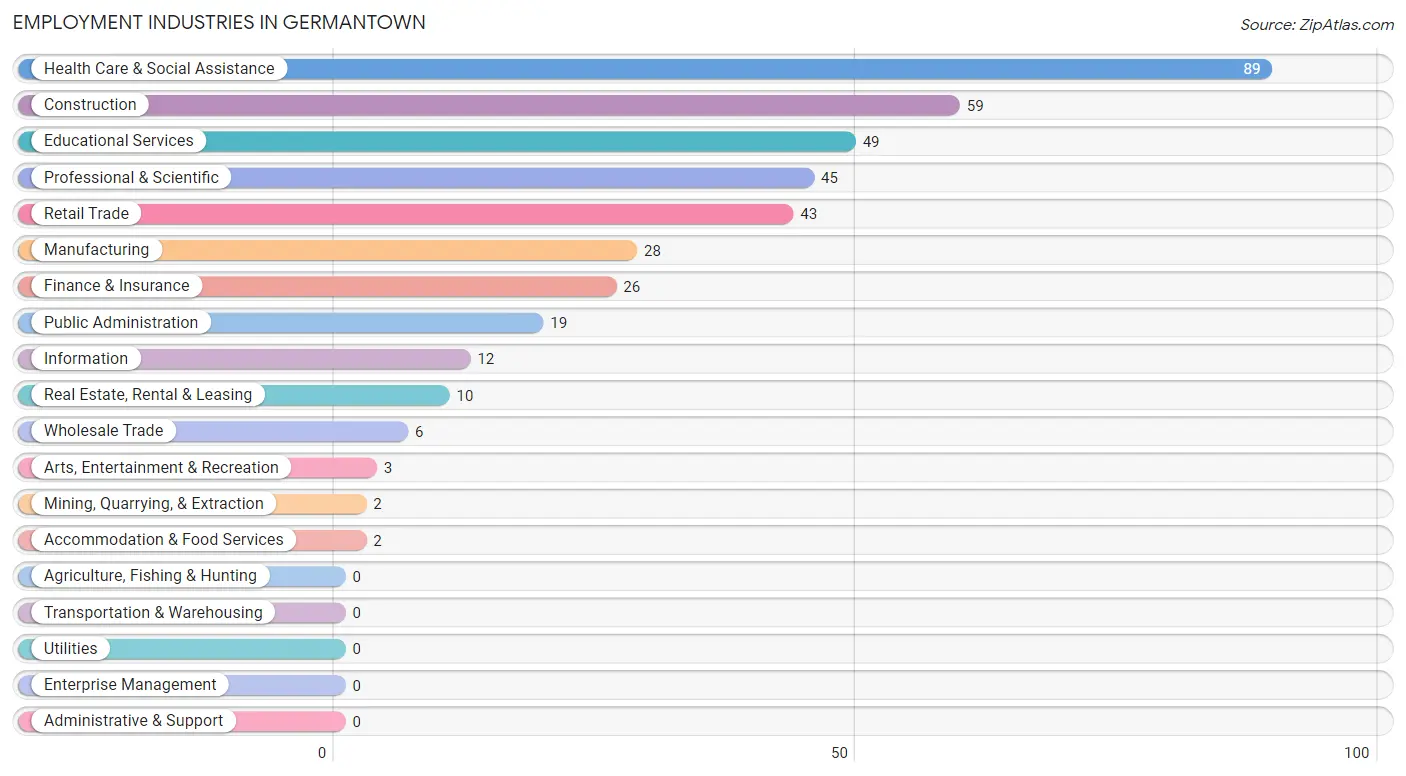
Employment Industries in Germantown
The major employment industries in Germantown include Health Care & Social Assistance (89 | 19.7%), Construction (59 | 13.0%), Educational Services (49 | 10.8%), Professional & Scientific (45 | 9.9%), and Retail Trade (43 | 9.5%).
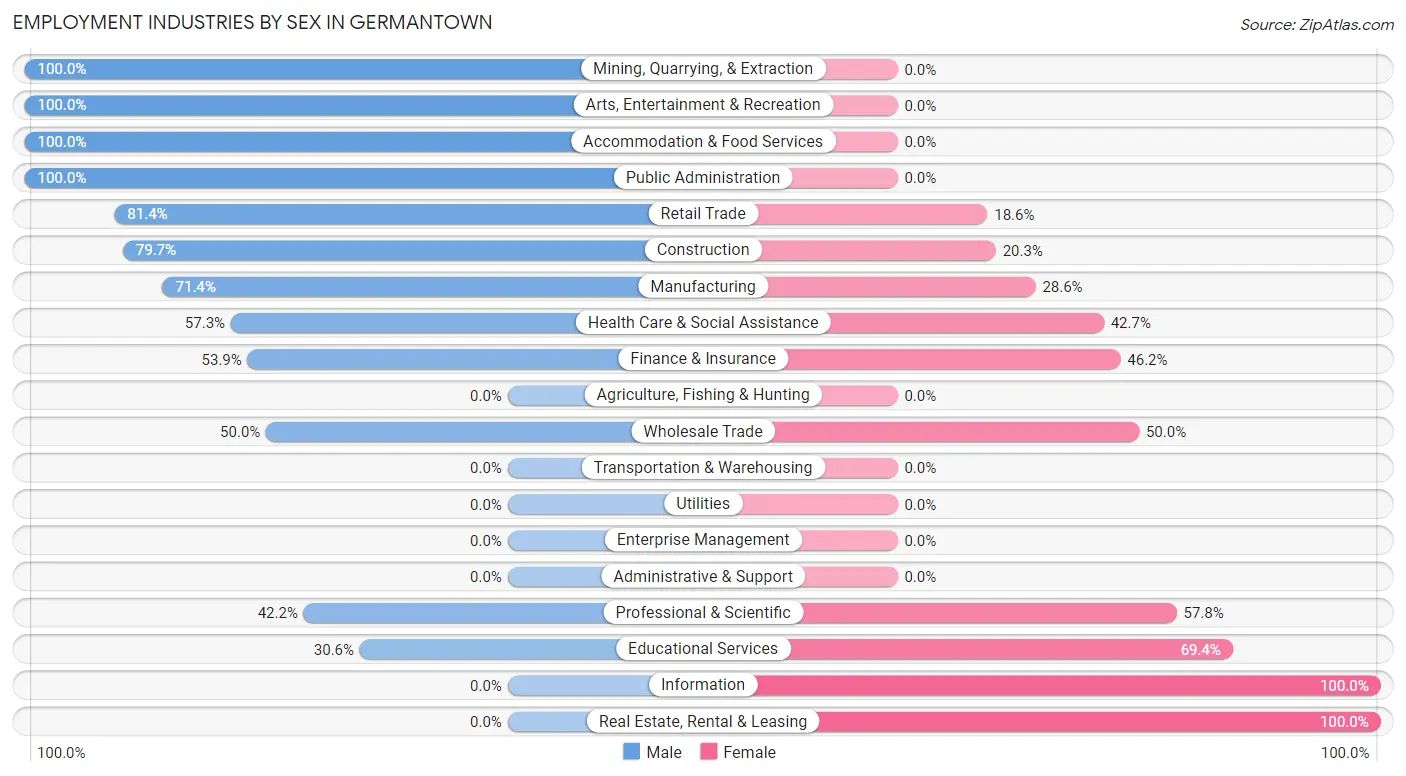
Employment Industries by Sex in Germantown
The Germantown industries that see more men than women are Mining, Quarrying, & Extraction (100.0%), Arts, Entertainment & Recreation (100.0%), and Accommodation & Food Services (100.0%), whereas the industries that tend to have a higher number of women are Information (100.0%), Real Estate, Rental & Leasing (100.0%), and Educational Services (69.4%).
| Industry | Male | Female |
| Agriculture, Fishing & Hunting | 0 (0.0%) | 0 (0.0%) |
| Mining, Quarrying, & Extraction | 2 (100.0%) | 0 (0.0%) |
| Construction | 47 (79.7%) | 12 (20.3%) |
| Manufacturing | 20 (71.4%) | 8 (28.6%) |
| Wholesale Trade | 3 (50.0%) | 3 (50.0%) |
| Retail Trade | 35 (81.4%) | 8 (18.6%) |
| Transportation & Warehousing | 0 (0.0%) | 0 (0.0%) |
| Utilities | 0 (0.0%) | 0 (0.0%) |
| Information | 0 (0.0%) | 12 (100.0%) |
| Finance & Insurance | 14 (53.8%) | 12 (46.2%) |
| Real Estate, Rental & Leasing | 0 (0.0%) | 10 (100.0%) |
| Professional & Scientific | 19 (42.2%) | 26 (57.8%) |
| Enterprise Management | 0 (0.0%) | 0 (0.0%) |
| Administrative & Support | 0 (0.0%) | 0 (0.0%) |
| Educational Services | 15 (30.6%) | 34 (69.4%) |
| Health Care & Social Assistance | 51 (57.3%) | 38 (42.7%) |
| Arts, Entertainment & Recreation | 3 (100.0%) | 0 (0.0%) |
| Accommodation & Food Services | 2 (100.0%) | 0 (0.0%) |
| Public Administration | 19 (100.0%) | 0 (0.0%) |
| Total | 269 (59.4%) | 184 (40.6%) |
Education in Germantown
School Enrollment in Germantown
The most common levels of schooling among the 124 students in Germantown are middle school (61 | 49.2%), elementary school (52 | 41.9%), and kindergarten (6 | 4.8%).
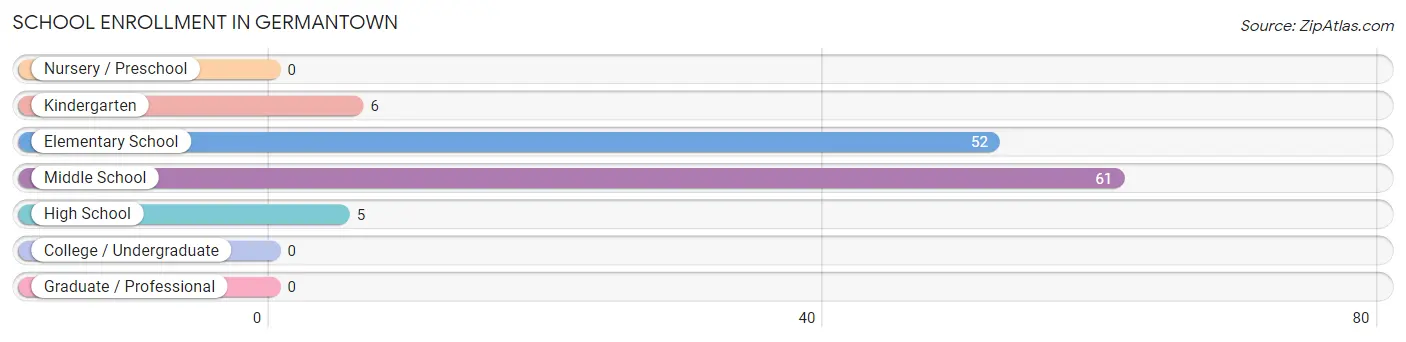
| School Level | # Students | % Students |
| Nursery / Preschool | 0 | 0.0% |
| Kindergarten | 6 | 4.8% |
| Elementary School | 52 | 41.9% |
| Middle School | 61 | 49.2% |
| High School | 5 | 4.0% |
| College / Undergraduate | 0 | 0.0% |
| Graduate / Professional | 0 | 0.0% |
| Total | 124 | 100.0% |
School Enrollment by Age by Funding Source in Germantown
Out of a total of 124 students who are enrolled in schools in Germantown, 6 (4.8%) attend a private institution, while the remaining 118 (95.2%) are enrolled in public schools. The age group of 5 to 9 year old has the highest likelihood of being enrolled in private schools, with 6 (14.0% in the age bracket) enrolled. Conversely, the age group of 10 to 14 year olds has the lowest likelihood of being enrolled in a private school, with 76 (100.0% in the age bracket) attending a public institution.
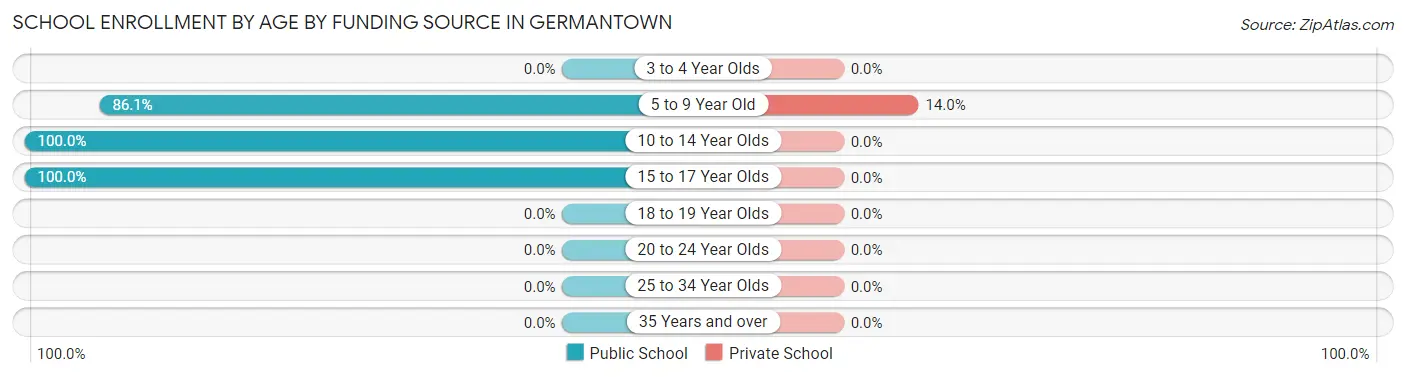
| Age Bracket | Public School | Private School |
| 3 to 4 Year Olds | 0 (0.0%) | 0 (0.0%) |
| 5 to 9 Year Old | 37 (86.1%) | 6 (14.0%) |
| 10 to 14 Year Olds | 76 (100.0%) | 0 (0.0%) |
| 15 to 17 Year Olds | 5 (100.0%) | 0 (0.0%) |
| 18 to 19 Year Olds | 0 (0.0%) | 0 (0.0%) |
| 20 to 24 Year Olds | 0 (0.0%) | 0 (0.0%) |
| 25 to 34 Year Olds | 0 (0.0%) | 0 (0.0%) |
| 35 Years and over | 0 (0.0%) | 0 (0.0%) |
| Total | 118 (95.2%) | 6 (4.8%) |
Educational Attainment by Field of Study in Germantown
Education (91 | 19.9%), visual & performing arts (81 | 17.7%), psychology (55 | 12.0%), social sciences (53 | 11.6%), and business (46 | 10.1%) are the most common fields of study among 457 individuals in Germantown who have obtained a bachelor's degree or higher.
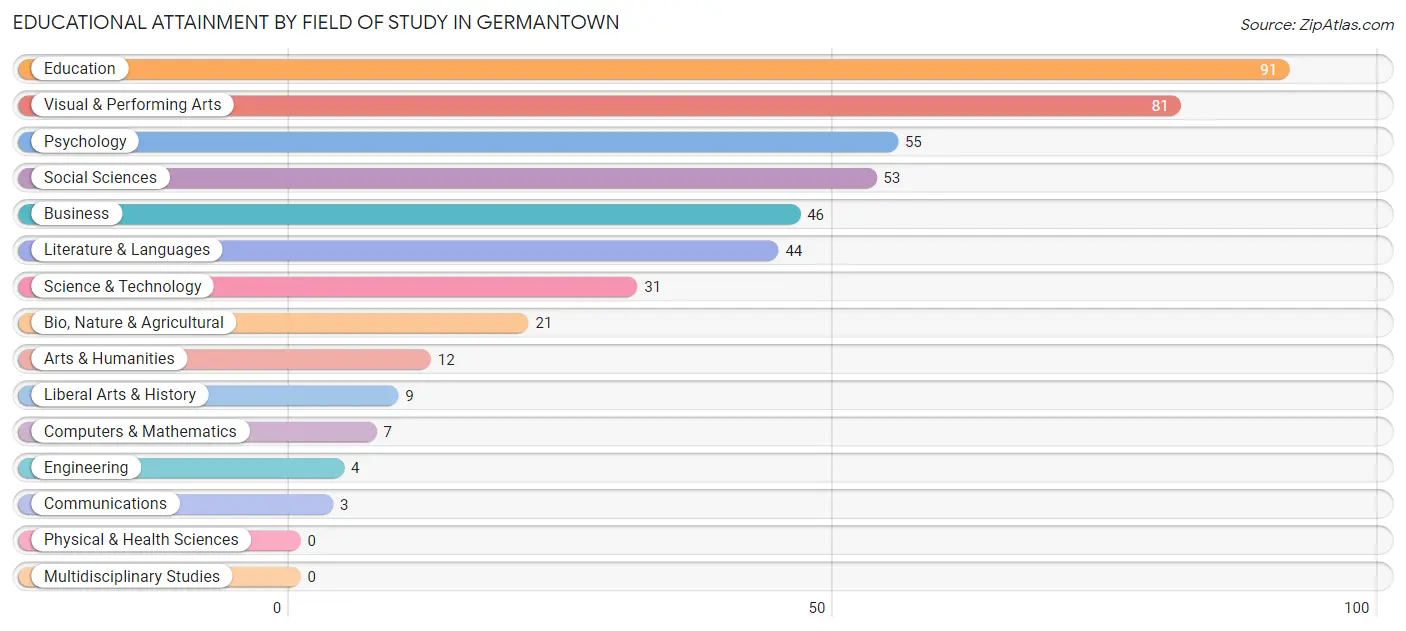
| Field of Study | # Graduates | % Graduates |
| Computers & Mathematics | 7 | 1.5% |
| Bio, Nature & Agricultural | 21 | 4.6% |
| Physical & Health Sciences | 0 | 0.0% |
| Psychology | 55 | 12.0% |
| Social Sciences | 53 | 11.6% |
| Engineering | 4 | 0.9% |
| Multidisciplinary Studies | 0 | 0.0% |
| Science & Technology | 31 | 6.8% |
| Business | 46 | 10.1% |
| Education | 91 | 19.9% |
| Literature & Languages | 44 | 9.6% |
| Liberal Arts & History | 9 | 2.0% |
| Visual & Performing Arts | 81 | 17.7% |
| Communications | 3 | 0.7% |
| Arts & Humanities | 12 | 2.6% |
| Total | 457 | 100.0% |
Transportation & Commute in Germantown
Vehicle Availability by Sex in Germantown
The most prevalent vehicle ownership categories in Germantown are males with 2 vehicles (137, accounting for 52.9%) and females with 2 vehicles (103, making up 74.5%).
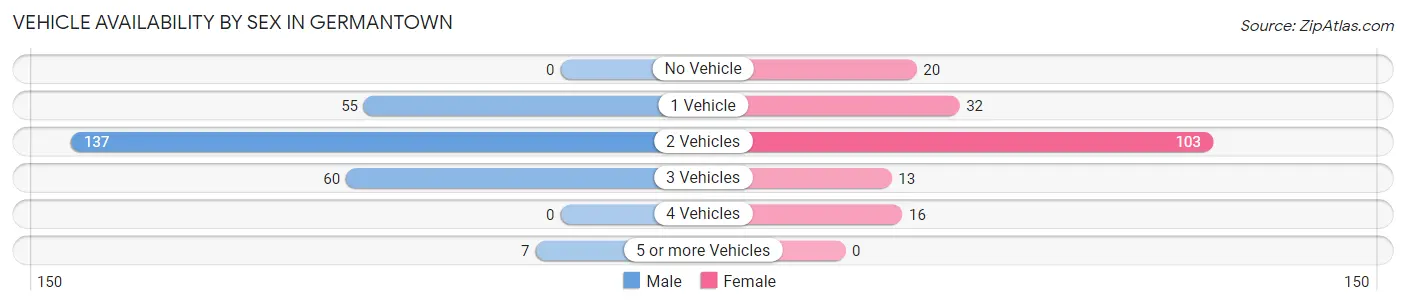
| Vehicles Available | Male | Female |
| No Vehicle | 0 (0.0%) | 20 (10.9%) |
| 1 Vehicle | 55 (21.2%) | 32 (17.4%) |
| 2 Vehicles | 137 (52.9%) | 103 (56.0%) |
| 3 Vehicles | 60 (23.2%) | 13 (7.1%) |
| 4 Vehicles | 0 (0.0%) | 16 (8.7%) |
| 5 or more Vehicles | 7 (2.7%) | 0 (0.0%) |
| Total | 259 (100.0%) | 184 (100.0%) |
Commute Time in Germantown
The most frequently occuring commute durations in Germantown are 20 to 24 minutes (80 commuters, 22.0%), less than 5 minutes (58 commuters, 16.0%), and 15 to 19 minutes (53 commuters, 14.6%).
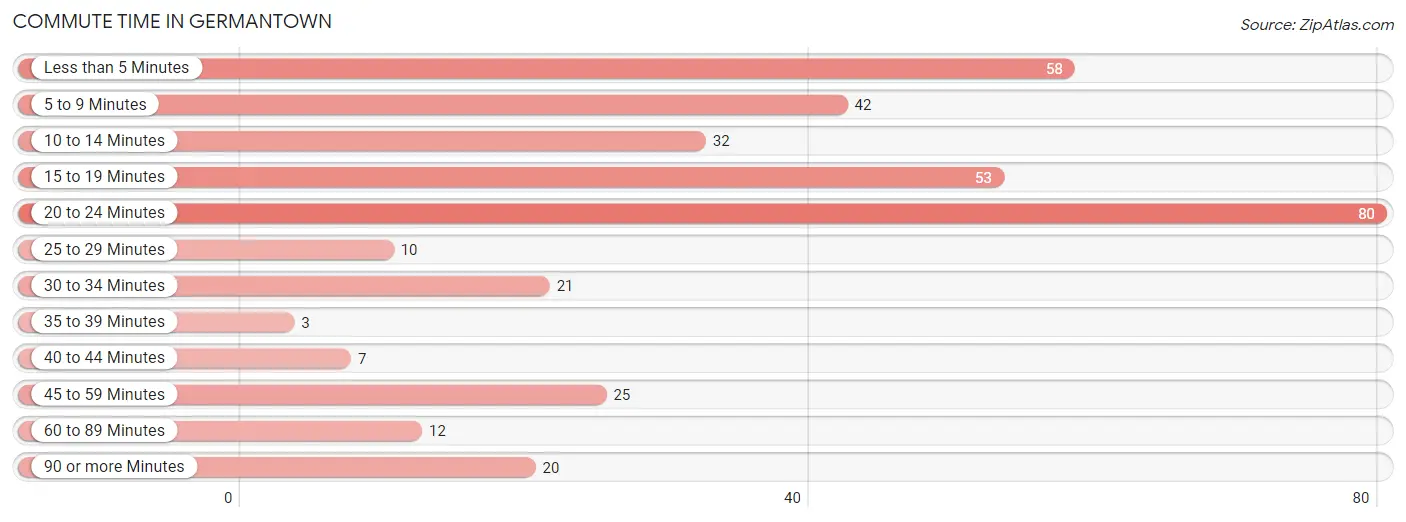
| Commute Time | # Commuters | % Commuters |
| Less than 5 Minutes | 58 | 16.0% |
| 5 to 9 Minutes | 42 | 11.6% |
| 10 to 14 Minutes | 32 | 8.8% |
| 15 to 19 Minutes | 53 | 14.6% |
| 20 to 24 Minutes | 80 | 22.0% |
| 25 to 29 Minutes | 10 | 2.8% |
| 30 to 34 Minutes | 21 | 5.8% |
| 35 to 39 Minutes | 3 | 0.8% |
| 40 to 44 Minutes | 7 | 1.9% |
| 45 to 59 Minutes | 25 | 6.9% |
| 60 to 89 Minutes | 12 | 3.3% |
| 90 or more Minutes | 20 | 5.5% |
Commute Time by Sex in Germantown
The most common commute times in Germantown are 20 to 24 minutes (60 commuters, 26.0%) for males and 15 to 19 minutes (39 commuters, 29.5%) for females.
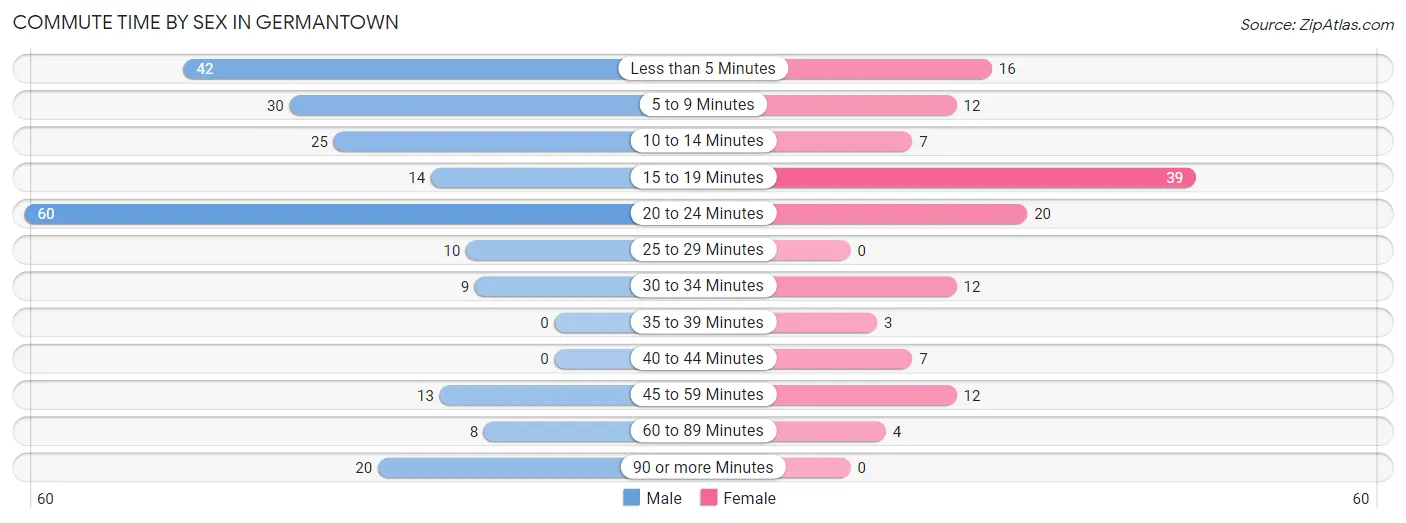
| Commute Time | Male | Female |
| Less than 5 Minutes | 42 (18.2%) | 16 (12.1%) |
| 5 to 9 Minutes | 30 (13.0%) | 12 (9.1%) |
| 10 to 14 Minutes | 25 (10.8%) | 7 (5.3%) |
| 15 to 19 Minutes | 14 (6.1%) | 39 (29.5%) |
| 20 to 24 Minutes | 60 (26.0%) | 20 (15.1%) |
| 25 to 29 Minutes | 10 (4.3%) | 0 (0.0%) |
| 30 to 34 Minutes | 9 (3.9%) | 12 (9.1%) |
| 35 to 39 Minutes | 0 (0.0%) | 3 (2.3%) |
| 40 to 44 Minutes | 0 (0.0%) | 7 (5.3%) |
| 45 to 59 Minutes | 13 (5.6%) | 12 (9.1%) |
| 60 to 89 Minutes | 8 (3.5%) | 4 (3.0%) |
| 90 or more Minutes | 20 (8.7%) | 0 (0.0%) |
Time of Departure to Work by Sex in Germantown
The most frequent times of departure to work in Germantown are 7:30 AM to 7:59 AM (66, 28.6%) for males and 8:30 AM to 8:59 AM (25, 18.9%) for females.
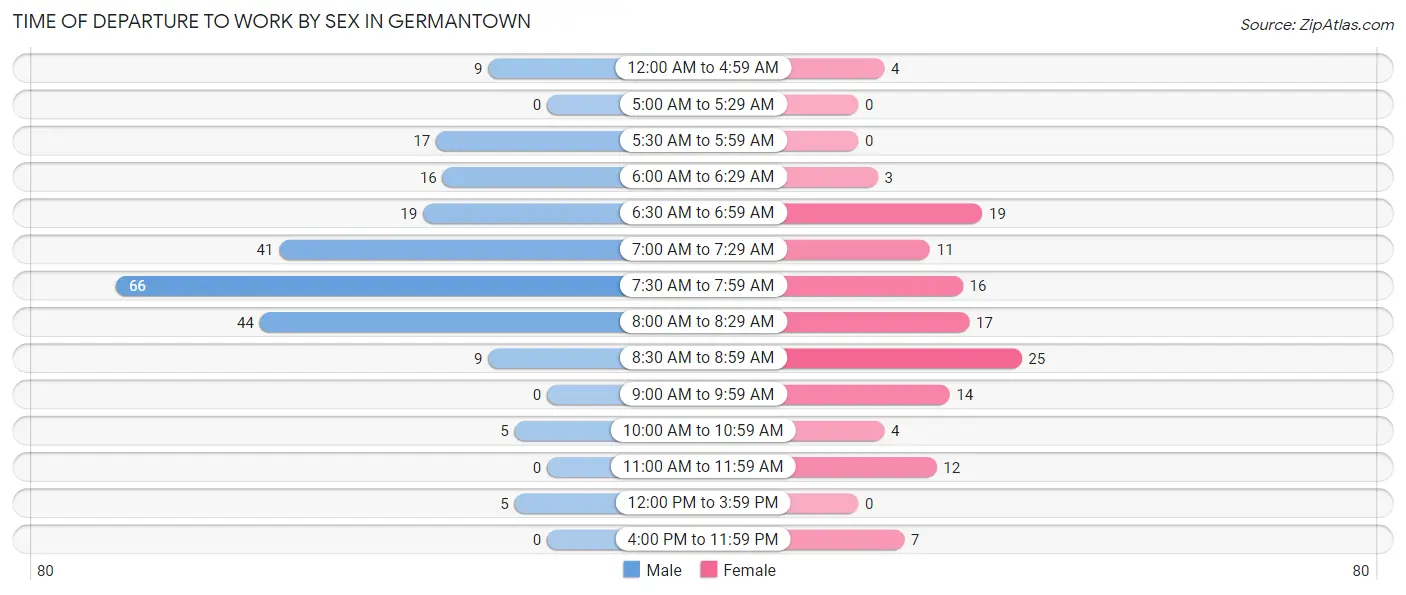
| Time of Departure | Male | Female |
| 12:00 AM to 4:59 AM | 9 (3.9%) | 4 (3.0%) |
| 5:00 AM to 5:29 AM | 0 (0.0%) | 0 (0.0%) |
| 5:30 AM to 5:59 AM | 17 (7.4%) | 0 (0.0%) |
| 6:00 AM to 6:29 AM | 16 (6.9%) | 3 (2.3%) |
| 6:30 AM to 6:59 AM | 19 (8.2%) | 19 (14.4%) |
| 7:00 AM to 7:29 AM | 41 (17.7%) | 11 (8.3%) |
| 7:30 AM to 7:59 AM | 66 (28.6%) | 16 (12.1%) |
| 8:00 AM to 8:29 AM | 44 (19.1%) | 17 (12.9%) |
| 8:30 AM to 8:59 AM | 9 (3.9%) | 25 (18.9%) |
| 9:00 AM to 9:59 AM | 0 (0.0%) | 14 (10.6%) |
| 10:00 AM to 10:59 AM | 5 (2.2%) | 4 (3.0%) |
| 11:00 AM to 11:59 AM | 0 (0.0%) | 12 (9.1%) |
| 12:00 PM to 3:59 PM | 5 (2.2%) | 0 (0.0%) |
| 4:00 PM to 11:59 PM | 0 (0.0%) | 7 (5.3%) |
| Total | 231 (100.0%) | 132 (100.0%) |
Housing Occupancy in Germantown
Occupancy by Ownership in Germantown
Of the total 565 dwellings in Germantown, owner-occupied units account for 416 (73.6%), while renter-occupied units make up 149 (26.4%).
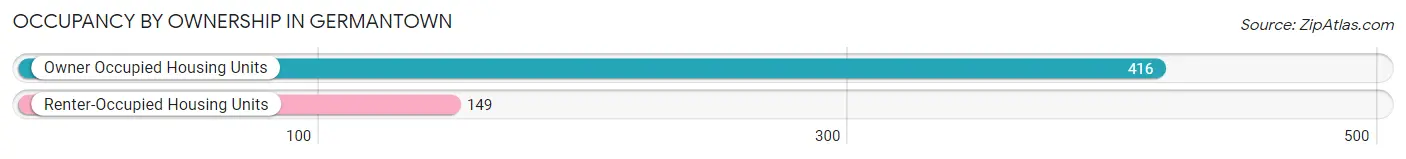
| Occupancy | # Housing Units | % Housing Units |
| Owner Occupied Housing Units | 416 | 73.6% |
| Renter-Occupied Housing Units | 149 | 26.4% |
| Total Occupied Housing Units | 565 | 100.0% |
Occupancy by Household Size in Germantown
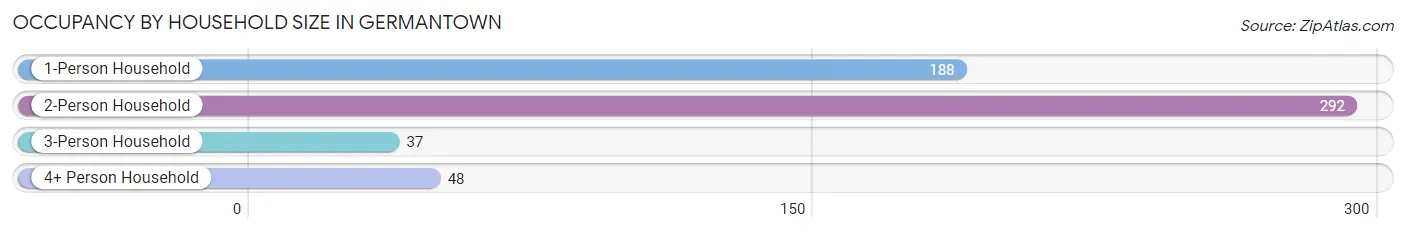
| Household Size | # Housing Units | % Housing Units |
| 1-Person Household | 188 | 33.3% |
| 2-Person Household | 292 | 51.7% |
| 3-Person Household | 37 | 6.6% |
| 4+ Person Household | 48 | 8.5% |
| Total Housing Units | 565 | 100.0% |
Occupancy by Ownership by Household Size in Germantown
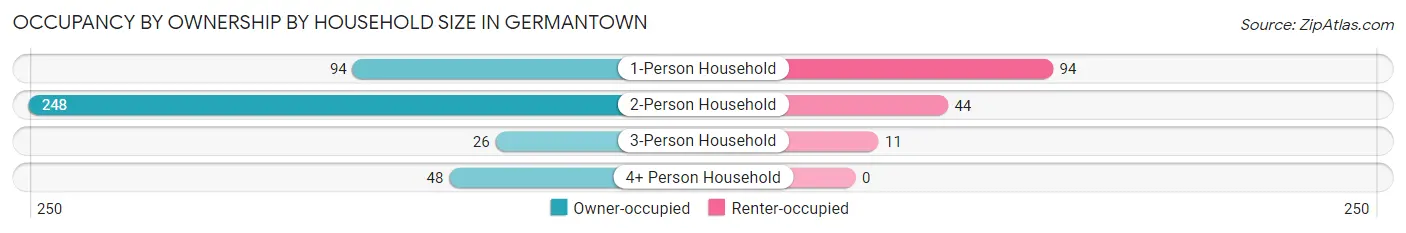
| Household Size | Owner-occupied | Renter-occupied |
| 1-Person Household | 94 (50.0%) | 94 (50.0%) |
| 2-Person Household | 248 (84.9%) | 44 (15.1%) |
| 3-Person Household | 26 (70.3%) | 11 (29.7%) |
| 4+ Person Household | 48 (100.0%) | 0 (0.0%) |
| Total Housing Units | 416 (73.6%) | 149 (26.4%) |
Occupancy by Educational Attainment in Germantown
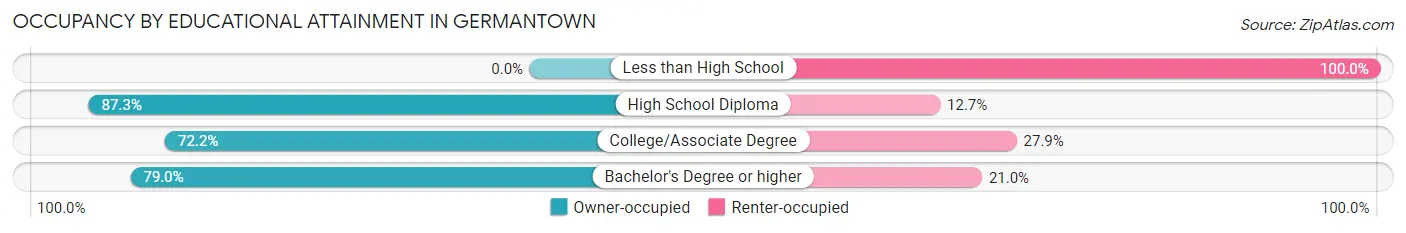
| Household Size | Owner-occupied | Renter-occupied |
| Less than High School | 0 (0.0%) | 27 (100.0%) |
| High School Diploma | 62 (87.3%) | 9 (12.7%) |
| College/Associate Degree | 158 (72.2%) | 61 (27.9%) |
| Bachelor's Degree or higher | 196 (79.0%) | 52 (21.0%) |
Occupancy by Age of Householder in Germantown
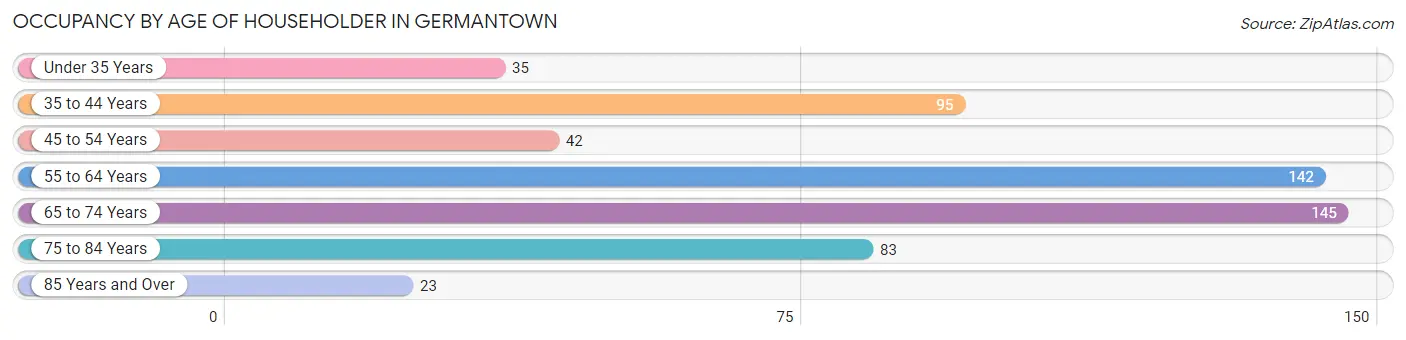
| Age Bracket | # Households | % Households |
| Under 35 Years | 35 | 6.2% |
| 35 to 44 Years | 95 | 16.8% |
| 45 to 54 Years | 42 | 7.4% |
| 55 to 64 Years | 142 | 25.1% |
| 65 to 74 Years | 145 | 25.7% |
| 75 to 84 Years | 83 | 14.7% |
| 85 Years and Over | 23 | 4.1% |
| Total | 565 | 100.0% |
Housing Finances in Germantown
Median Income by Occupancy in Germantown
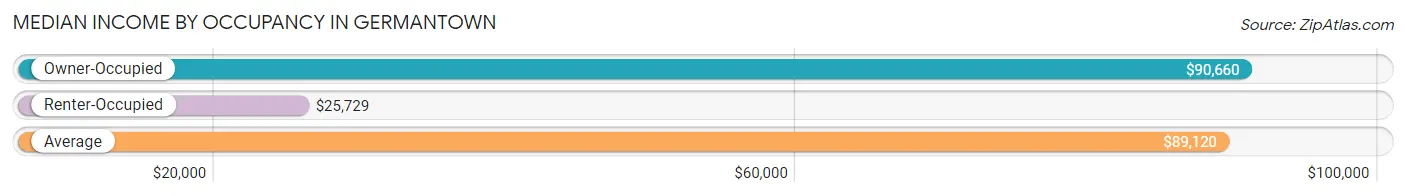
| Occupancy Type | # Households | Median Income |
| Owner-Occupied | 416 (73.6%) | $90,660 |
| Renter-Occupied | 149 (26.4%) | $25,729 |
| Average | 565 (100.0%) | $89,120 |
Occupancy by Householder Income Bracket in Germantown
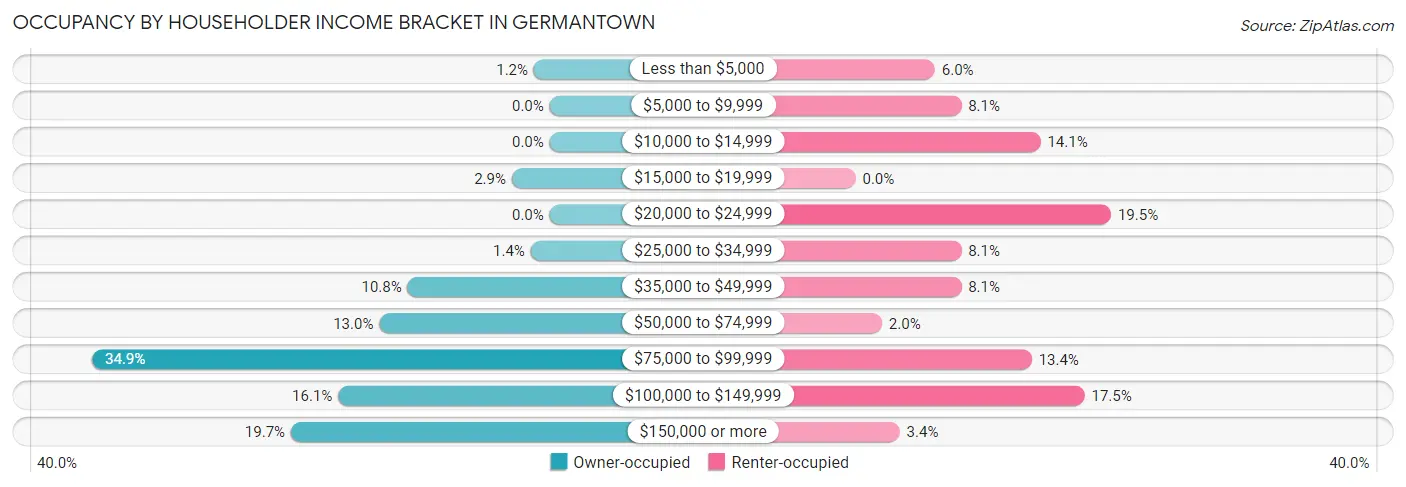
| Income Bracket | Owner-occupied | Renter-occupied |
| Less than $5,000 | 5 (1.2%) | 9 (6.0%) |
| $5,000 to $9,999 | 0 (0.0%) | 12 (8.1%) |
| $10,000 to $14,999 | 0 (0.0%) | 21 (14.1%) |
| $15,000 to $19,999 | 12 (2.9%) | 0 (0.0%) |
| $20,000 to $24,999 | 0 (0.0%) | 29 (19.5%) |
| $25,000 to $34,999 | 6 (1.4%) | 12 (8.1%) |
| $35,000 to $49,999 | 45 (10.8%) | 12 (8.1%) |
| $50,000 to $74,999 | 54 (13.0%) | 3 (2.0%) |
| $75,000 to $99,999 | 145 (34.9%) | 20 (13.4%) |
| $100,000 to $149,999 | 67 (16.1%) | 26 (17.4%) |
| $150,000 or more | 82 (19.7%) | 5 (3.4%) |
| Total | 416 (100.0%) | 149 (100.0%) |
Monthly Housing Cost Tiers in Germantown
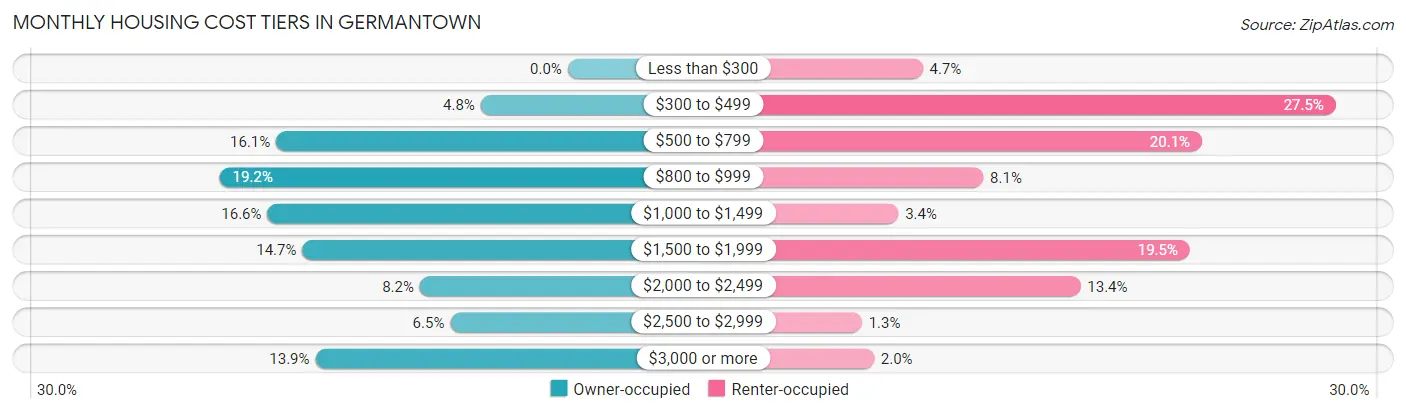
| Monthly Cost | Owner-occupied | Renter-occupied |
| Less than $300 | 0 (0.0%) | 7 (4.7%) |
| $300 to $499 | 20 (4.8%) | 41 (27.5%) |
| $500 to $799 | 67 (16.1%) | 30 (20.1%) |
| $800 to $999 | 80 (19.2%) | 12 (8.1%) |
| $1,000 to $1,499 | 69 (16.6%) | 5 (3.4%) |
| $1,500 to $1,999 | 61 (14.7%) | 29 (19.5%) |
| $2,000 to $2,499 | 34 (8.2%) | 20 (13.4%) |
| $2,500 to $2,999 | 27 (6.5%) | 2 (1.3%) |
| $3,000 or more | 58 (13.9%) | 3 (2.0%) |
| Total | 416 (100.0%) | 149 (100.0%) |
Physical Housing Characteristics in Germantown
Housing Structures in Germantown
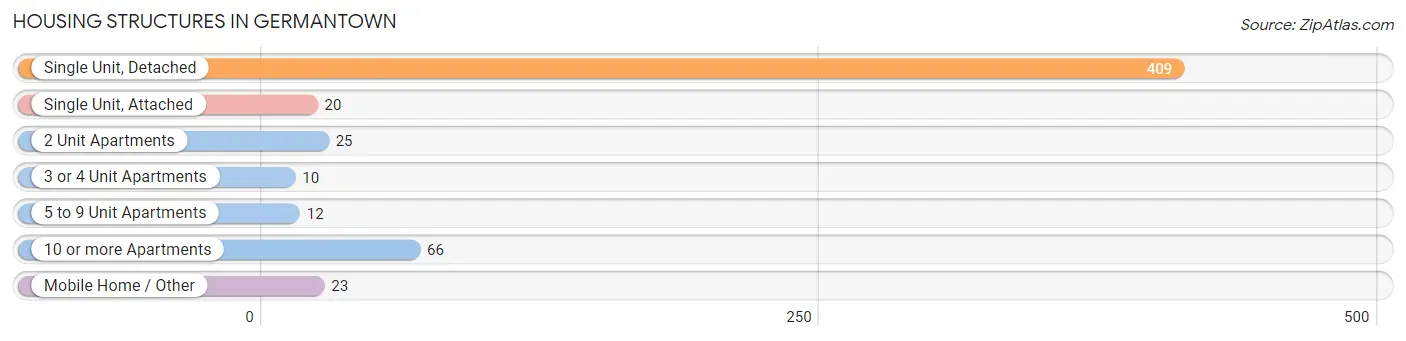
| Structure Type | # Housing Units | % Housing Units |
| Single Unit, Detached | 409 | 72.4% |
| Single Unit, Attached | 20 | 3.5% |
| 2 Unit Apartments | 25 | 4.4% |
| 3 or 4 Unit Apartments | 10 | 1.8% |
| 5 to 9 Unit Apartments | 12 | 2.1% |
| 10 or more Apartments | 66 | 11.7% |
| Mobile Home / Other | 23 | 4.1% |
| Total | 565 | 100.0% |
Housing Structures by Occupancy in Germantown
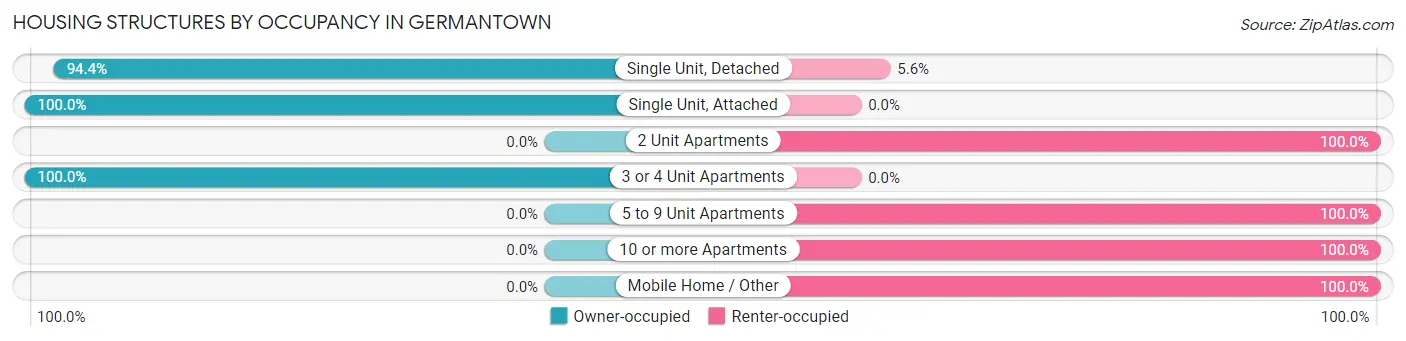
| Structure Type | Owner-occupied | Renter-occupied |
| Single Unit, Detached | 386 (94.4%) | 23 (5.6%) |
| Single Unit, Attached | 20 (100.0%) | 0 (0.0%) |
| 2 Unit Apartments | 0 (0.0%) | 25 (100.0%) |
| 3 or 4 Unit Apartments | 10 (100.0%) | 0 (0.0%) |
| 5 to 9 Unit Apartments | 0 (0.0%) | 12 (100.0%) |
| 10 or more Apartments | 0 (0.0%) | 66 (100.0%) |
| Mobile Home / Other | 0 (0.0%) | 23 (100.0%) |
| Total | 416 (73.6%) | 149 (26.4%) |
Housing Structures by Number of Rooms in Germantown
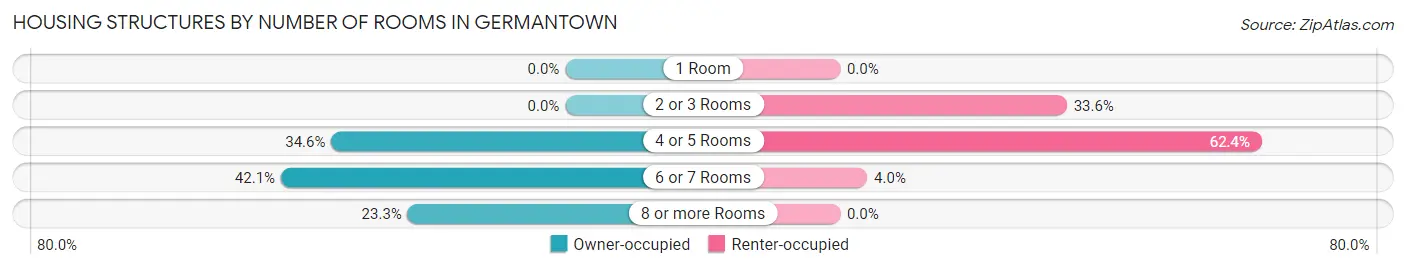
| Number of Rooms | Owner-occupied | Renter-occupied |
| 1 Room | 0 (0.0%) | 0 (0.0%) |
| 2 or 3 Rooms | 0 (0.0%) | 50 (33.6%) |
| 4 or 5 Rooms | 144 (34.6%) | 93 (62.4%) |
| 6 or 7 Rooms | 175 (42.1%) | 6 (4.0%) |
| 8 or more Rooms | 97 (23.3%) | 0 (0.0%) |
| Total | 416 (100.0%) | 149 (100.0%) |
Housing Structure by Heating Type in Germantown
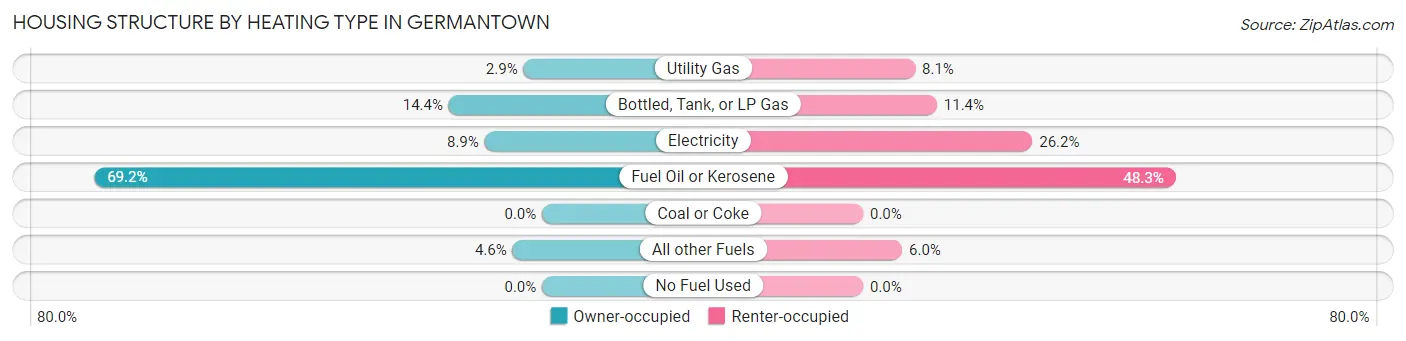
| Heating Type | Owner-occupied | Renter-occupied |
| Utility Gas | 12 (2.9%) | 12 (8.1%) |
| Bottled, Tank, or LP Gas | 60 (14.4%) | 17 (11.4%) |
| Electricity | 37 (8.9%) | 39 (26.2%) |
| Fuel Oil or Kerosene | 288 (69.2%) | 72 (48.3%) |
| Coal or Coke | 0 (0.0%) | 0 (0.0%) |
| All other Fuels | 19 (4.6%) | 9 (6.0%) |
| No Fuel Used | 0 (0.0%) | 0 (0.0%) |
| Total | 416 (100.0%) | 149 (100.0%) |
Household Vehicle Usage in Germantown
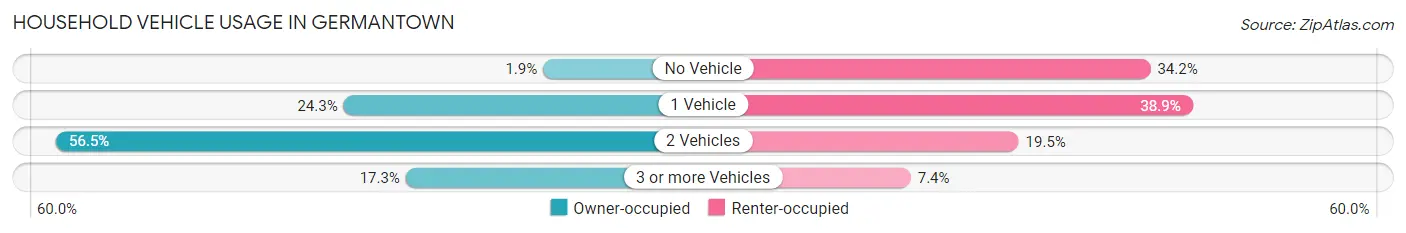
| Vehicles per Household | Owner-occupied | Renter-occupied |
| No Vehicle | 8 (1.9%) | 51 (34.2%) |
| 1 Vehicle | 101 (24.3%) | 58 (38.9%) |
| 2 Vehicles | 235 (56.5%) | 29 (19.5%) |
| 3 or more Vehicles | 72 (17.3%) | 11 (7.4%) |
| Total | 416 (100.0%) | 149 (100.0%) |
Real Estate & Mortgages in Germantown
Real Estate and Mortgage Overview in Germantown
| Characteristic | Without Mortgage | With Mortgage |
| Housing Units | 207 | 209 |
| Median Property Value | $516,100 | $285,500 |
| Median Household Income | $90,346 | $48 |
| Monthly Housing Costs | $841 | $58 |
| Real Estate Taxes | $3,493 | $10 |
Property Value by Mortgage Status in Germantown
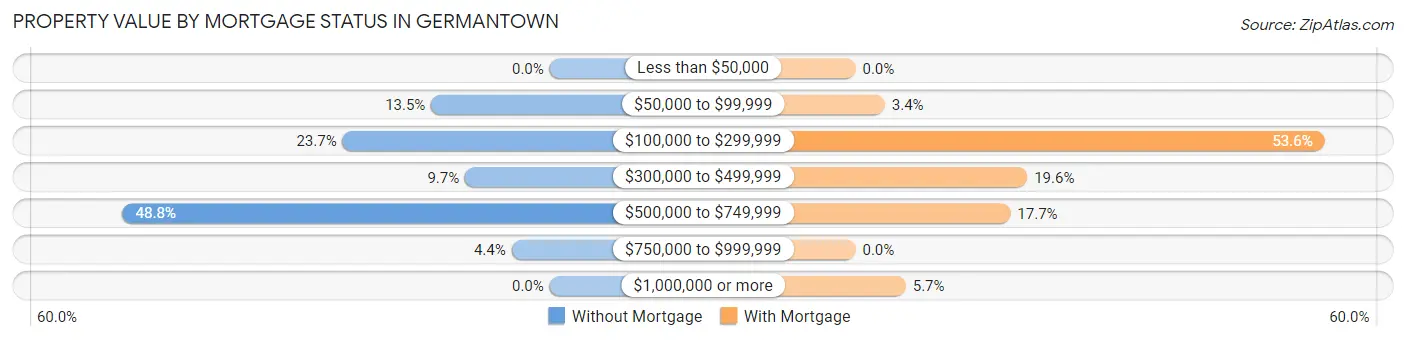
| Property Value | Without Mortgage | With Mortgage |
| Less than $50,000 | 0 (0.0%) | 0 (0.0%) |
| $50,000 to $99,999 | 28 (13.5%) | 7 (3.4%) |
| $100,000 to $299,999 | 49 (23.7%) | 112 (53.6%) |
| $300,000 to $499,999 | 20 (9.7%) | 41 (19.6%) |
| $500,000 to $749,999 | 101 (48.8%) | 37 (17.7%) |
| $750,000 to $999,999 | 9 (4.3%) | 0 (0.0%) |
| $1,000,000 or more | 0 (0.0%) | 12 (5.7%) |
| Total | 207 (100.0%) | 209 (100.0%) |
Household Income by Mortgage Status in Germantown
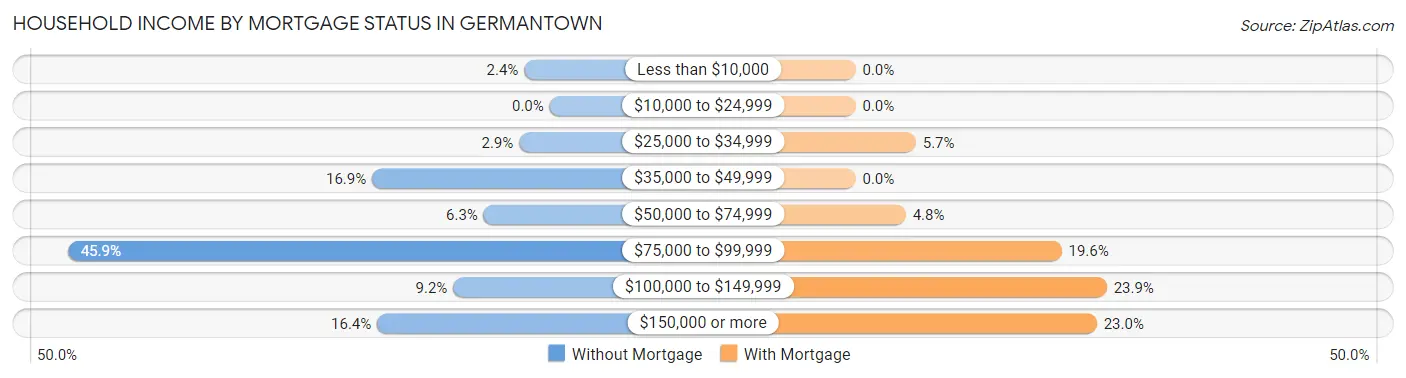
| Household Income | Without Mortgage | With Mortgage |
| Less than $10,000 | 5 (2.4%) | 0 (0.0%) |
| $10,000 to $24,999 | 0 (0.0%) | 0 (0.0%) |
| $25,000 to $34,999 | 6 (2.9%) | 12 (5.7%) |
| $35,000 to $49,999 | 35 (16.9%) | 0 (0.0%) |
| $50,000 to $74,999 | 13 (6.3%) | 10 (4.8%) |
| $75,000 to $99,999 | 95 (45.9%) | 41 (19.6%) |
| $100,000 to $149,999 | 19 (9.2%) | 50 (23.9%) |
| $150,000 or more | 34 (16.4%) | 48 (23.0%) |
| Total | 207 (100.0%) | 209 (100.0%) |
Property Value to Household Income Ratio in Germantown
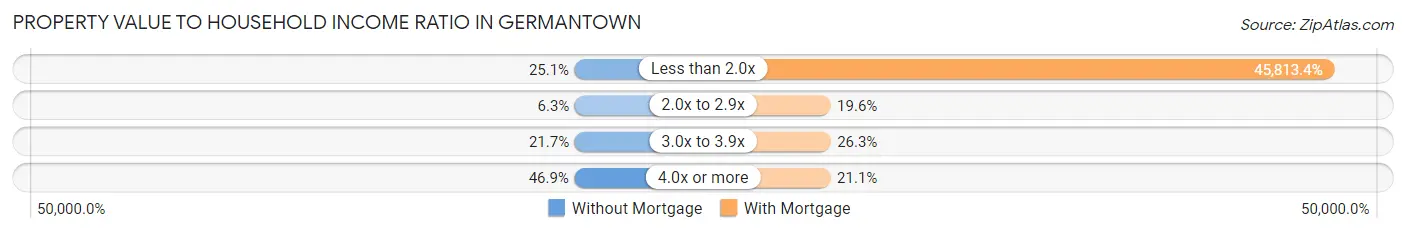
| Value-to-Income Ratio | Without Mortgage | With Mortgage |
| Less than 2.0x | 52 (25.1%) | 95,750 (45,813.4%) |
| 2.0x to 2.9x | 13 (6.3%) | 41 (19.6%) |
| 3.0x to 3.9x | 45 (21.7%) | 55 (26.3%) |
| 4.0x or more | 97 (46.9%) | 44 (21.0%) |
| Total | 207 (100.0%) | 209 (100.0%) |
Real Estate Taxes by Mortgage Status in Germantown
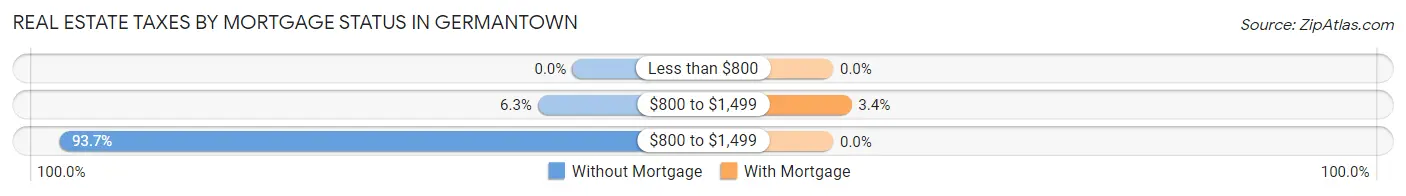
| Property Taxes | Without Mortgage | With Mortgage |
| Less than $800 | 0 (0.0%) | 0 (0.0%) |
| $800 to $1,499 | 13 (6.3%) | 7 (3.4%) |
| $800 to $1,499 | 194 (93.7%) | 0 (0.0%) |
| Total | 207 (100.0%) | 209 (100.0%) |
Health & Disability in Germantown
Health Insurance Coverage by Age in Germantown
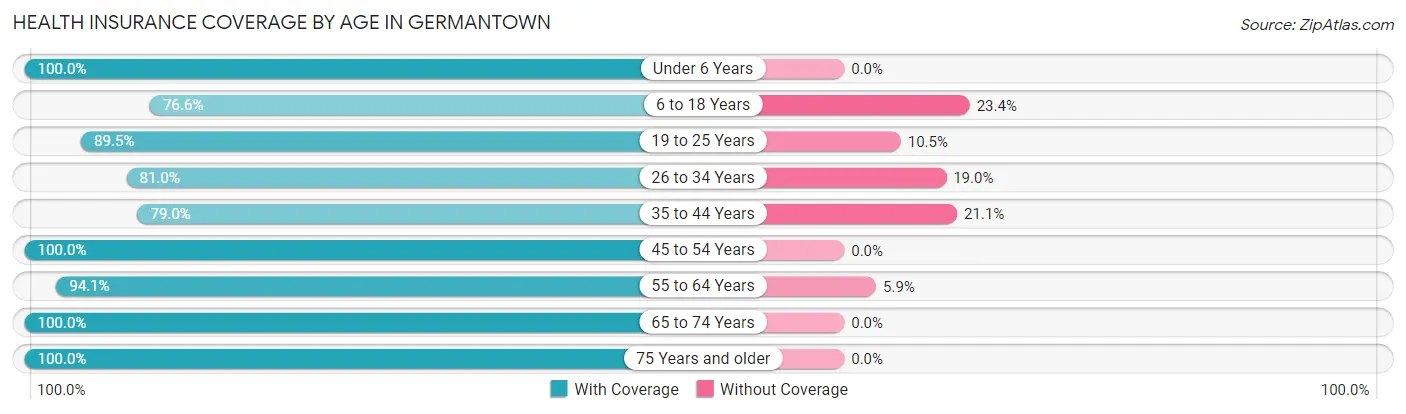
| Age Bracket | With Coverage | Without Coverage |
| Under 6 Years | 25 (100.0%) | 0 (0.0%) |
| 6 to 18 Years | 95 (76.6%) | 29 (23.4%) |
| 19 to 25 Years | 17 (89.5%) | 2 (10.5%) |
| 26 to 34 Years | 98 (81.0%) | 23 (19.0%) |
| 35 to 44 Years | 120 (78.9%) | 32 (21.0%) |
| 45 to 54 Years | 58 (100.0%) | 0 (0.0%) |
| 55 to 64 Years | 238 (94.1%) | 15 (5.9%) |
| 65 to 74 Years | 185 (100.0%) | 0 (0.0%) |
| 75 Years and older | 131 (100.0%) | 0 (0.0%) |
| Total | 967 (90.5%) | 101 (9.5%) |
Health Insurance Coverage by Citizenship Status in Germantown
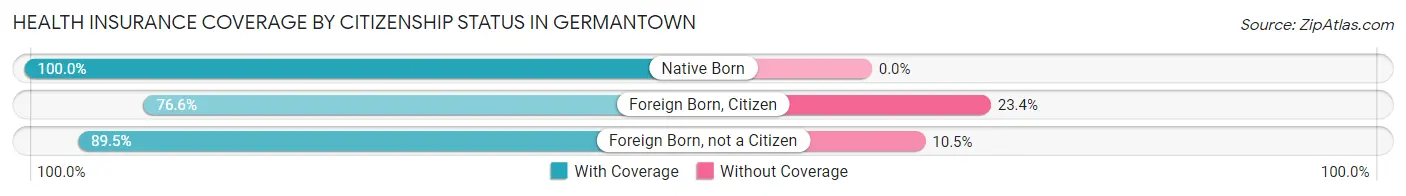
| Citizenship Status | With Coverage | Without Coverage |
| Native Born | 25 (100.0%) | 0 (0.0%) |
| Foreign Born, Citizen | 95 (76.6%) | 29 (23.4%) |
| Foreign Born, not a Citizen | 17 (89.5%) | 2 (10.5%) |
Health Insurance Coverage by Household Income in Germantown
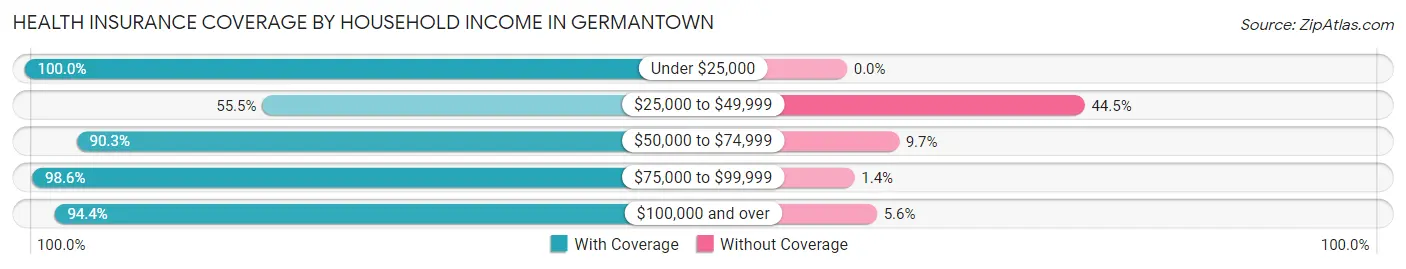
| Household Income | With Coverage | Without Coverage |
| Under $25,000 | 106 (100.0%) | 0 (0.0%) |
| $25,000 to $49,999 | 76 (55.5%) | 61 (44.5%) |
| $50,000 to $74,999 | 102 (90.3%) | 11 (9.7%) |
| $75,000 to $99,999 | 280 (98.6%) | 4 (1.4%) |
| $100,000 and over | 388 (94.4%) | 23 (5.6%) |
Public vs Private Health Insurance Coverage by Age in Germantown
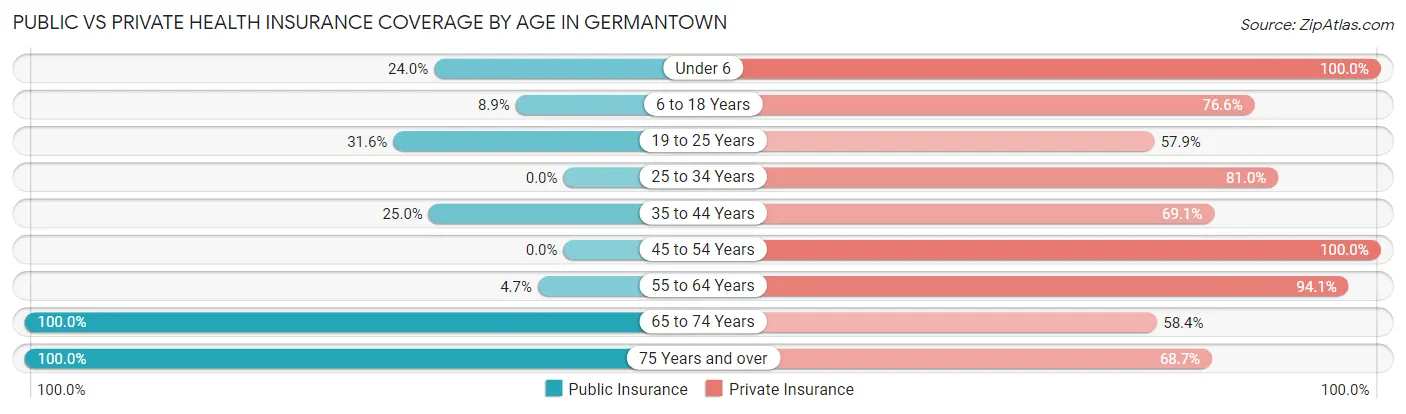
| Age Bracket | Public Insurance | Private Insurance |
| Under 6 | 6 (24.0%) | 25 (100.0%) |
| 6 to 18 Years | 11 (8.9%) | 95 (76.6%) |
| 19 to 25 Years | 6 (31.6%) | 11 (57.9%) |
| 25 to 34 Years | 0 (0.0%) | 98 (81.0%) |
| 35 to 44 Years | 38 (25.0%) | 105 (69.1%) |
| 45 to 54 Years | 0 (0.0%) | 58 (100.0%) |
| 55 to 64 Years | 12 (4.7%) | 238 (94.1%) |
| 65 to 74 Years | 185 (100.0%) | 108 (58.4%) |
| 75 Years and over | 131 (100.0%) | 90 (68.7%) |
| Total | 389 (36.4%) | 828 (77.5%) |
Disability Status by Sex by Age in Germantown
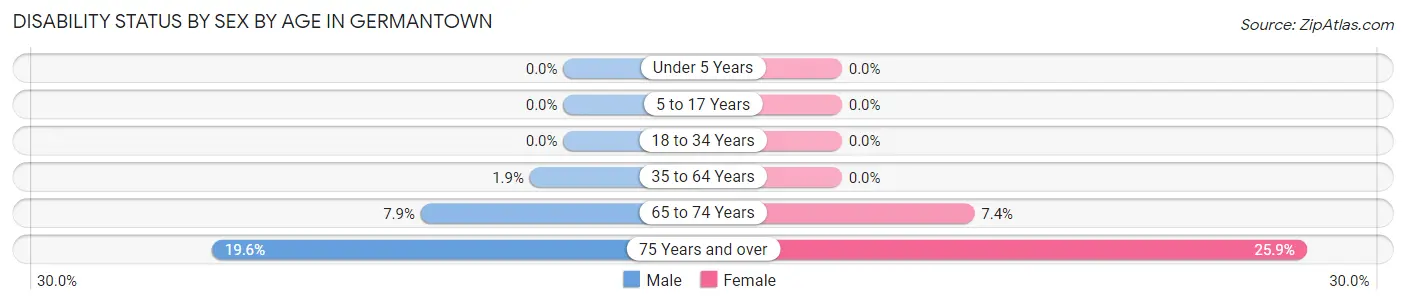
| Age Bracket | Male | Female |
| Under 5 Years | 0 (0.0%) | 0 (0.0%) |
| 5 to 17 Years | 0 (0.0%) | 0 (0.0%) |
| 18 to 34 Years | 0 (0.0%) | 0 (0.0%) |
| 35 to 64 Years | 5 (1.9%) | 0 (0.0%) |
| 65 to 74 Years | 5 (7.9%) | 9 (7.4%) |
| 75 Years and over | 9 (19.6%) | 22 (25.9%) |
Disability Class by Sex by Age in Germantown
Disability Class: Hearing Difficulty
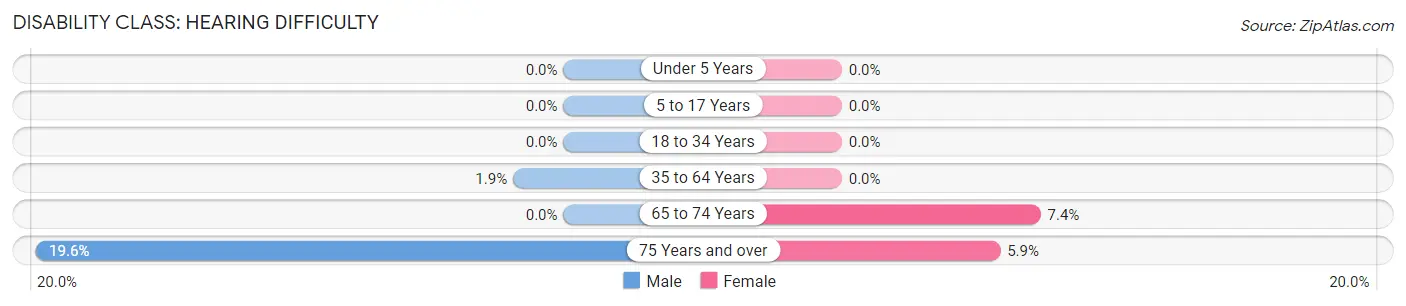
| Age Bracket | Male | Female |
| Under 5 Years | 0 (0.0%) | 0 (0.0%) |
| 5 to 17 Years | 0 (0.0%) | 0 (0.0%) |
| 18 to 34 Years | 0 (0.0%) | 0 (0.0%) |
| 35 to 64 Years | 5 (1.9%) | 0 (0.0%) |
| 65 to 74 Years | 0 (0.0%) | 9 (7.4%) |
| 75 Years and over | 9 (19.6%) | 5 (5.9%) |
Disability Class: Vision Difficulty
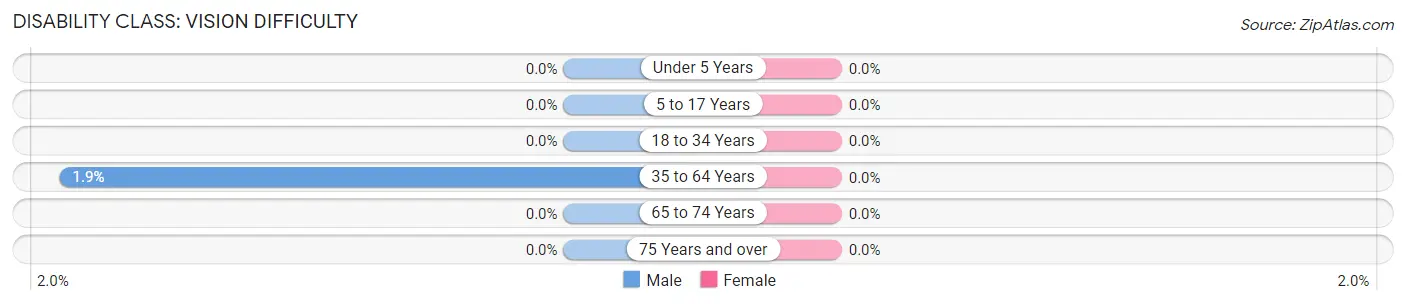
| Age Bracket | Male | Female |
| Under 5 Years | 0 (0.0%) | 0 (0.0%) |
| 5 to 17 Years | 0 (0.0%) | 0 (0.0%) |
| 18 to 34 Years | 0 (0.0%) | 0 (0.0%) |
| 35 to 64 Years | 5 (1.9%) | 0 (0.0%) |
| 65 to 74 Years | 0 (0.0%) | 0 (0.0%) |
| 75 Years and over | 0 (0.0%) | 0 (0.0%) |
Disability Class: Cognitive Difficulty
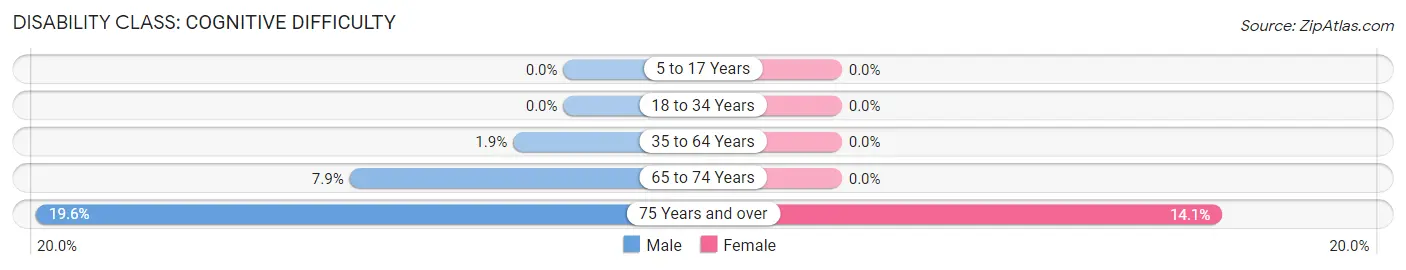
| Age Bracket | Male | Female |
| 5 to 17 Years | 0 (0.0%) | 0 (0.0%) |
| 18 to 34 Years | 0 (0.0%) | 0 (0.0%) |
| 35 to 64 Years | 5 (1.9%) | 0 (0.0%) |
| 65 to 74 Years | 5 (7.9%) | 0 (0.0%) |
| 75 Years and over | 9 (19.6%) | 12 (14.1%) |
Disability Class: Ambulatory Difficulty
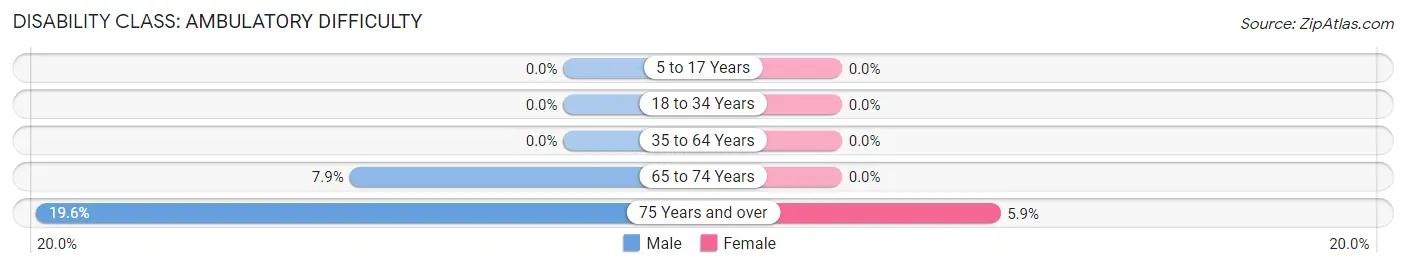
| Age Bracket | Male | Female |
| 5 to 17 Years | 0 (0.0%) | 0 (0.0%) |
| 18 to 34 Years | 0 (0.0%) | 0 (0.0%) |
| 35 to 64 Years | 0 (0.0%) | 0 (0.0%) |
| 65 to 74 Years | 5 (7.9%) | 0 (0.0%) |
| 75 Years and over | 9 (19.6%) | 5 (5.9%) |
Disability Class: Self-Care Difficulty
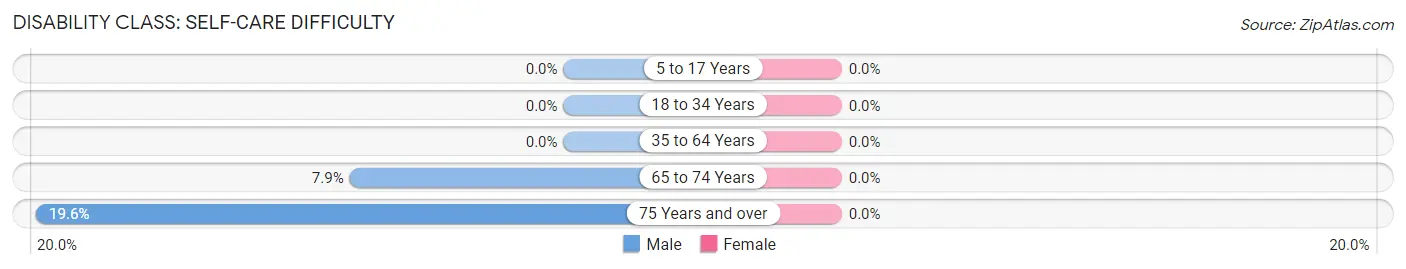
| Age Bracket | Male | Female |
| 5 to 17 Years | 0 (0.0%) | 0 (0.0%) |
| 18 to 34 Years | 0 (0.0%) | 0 (0.0%) |
| 35 to 64 Years | 0 (0.0%) | 0 (0.0%) |
| 65 to 74 Years | 5 (7.9%) | 0 (0.0%) |
| 75 Years and over | 9 (19.6%) | 0 (0.0%) |
Technology Access in Germantown
Computing Device Access in Germantown
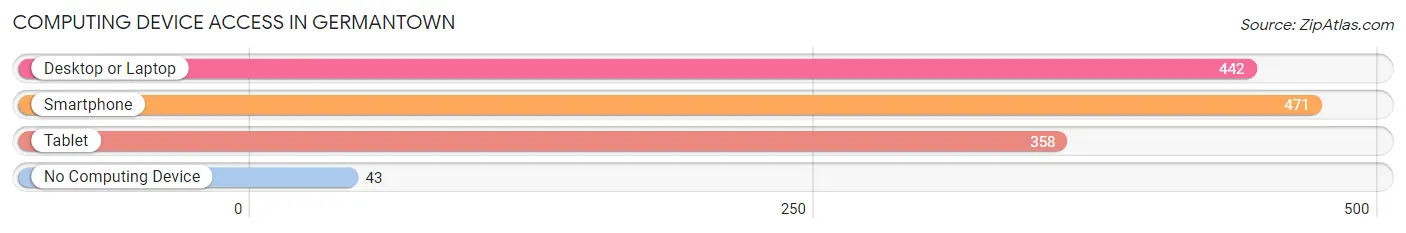
| Device Type | # Households | % Households |
| Desktop or Laptop | 442 | 78.2% |
| Smartphone | 471 | 83.4% |
| Tablet | 358 | 63.4% |
| No Computing Device | 43 | 7.6% |
| Total | 565 | 100.0% |
Internet Access in Germantown
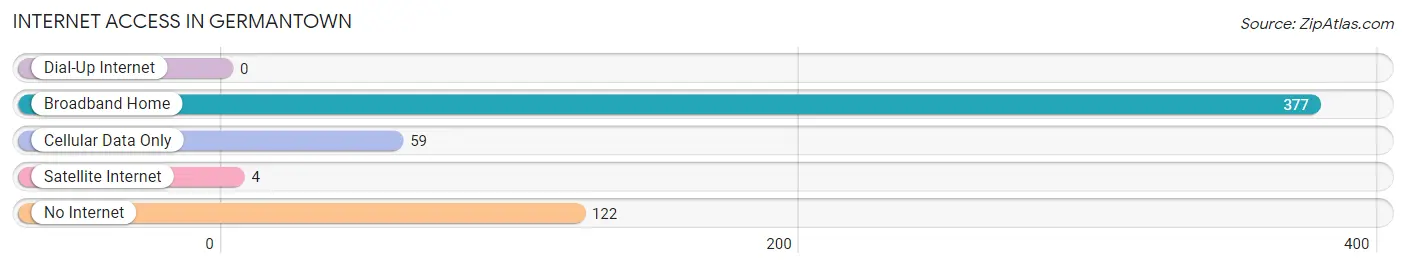
| Internet Type | # Households | % Households |
| Dial-Up Internet | 0 | 0.0% |
| Broadband Home | 377 | 66.7% |
| Cellular Data Only | 59 | 10.4% |
| Satellite Internet | 4 | 0.7% |
| No Internet | 122 | 21.6% |
| Total | 565 | 100.0% |
Germantown Summary
Germantown is a town located in Columbia County, New York, United States. The population was 2,731 at the 2010 census. The town is in the northwest corner of the county and is part of the Hudson Valley region.
History
Germantown was first settled in 1710 by German Palatines, who were fleeing religious persecution in their homeland. The town was originally known as German Flats, and was part of the larger Livingston Manor. The town was officially established in 1788, and was named after the German settlers.
In the 19th century, Germantown was an important center for the production of woolen goods. The town was also home to several iron forges, which produced tools and weapons for the Revolutionary War.
Geography
Germantown is located in the northwest corner of Columbia County, New York. It is bordered by the towns of Clermont to the north, Livingston to the east, Taghkanic to the south, and Ancram to the west.
The town is located in the Hudson Valley region of New York, and is situated on the east bank of the Hudson River. The town is home to several small lakes, including Lake Taghkanic and Lake Stissing.
The town has a total area of 33.2 square miles, of which 32.9 square miles is land and 0.3 square miles is water.
Economy
Germantown’s economy is largely based on agriculture and tourism. The town is home to several small farms, which produce a variety of fruits and vegetables. The town is also home to several wineries, which produce a variety of wines.
Tourism is also an important part of the town’s economy. The town is home to several historic sites, including the Germantown Historic District, which is listed on the National Register of Historic Places. The town is also home to several parks and recreational areas, including the Taconic State Park.
Demographics
As of the 2010 census, there were 2,731 people, 1,093 households, and 745 families residing in the town. The population density was 82.7 people per square mile. The racial makeup of the town was 94.3% White, 1.2% African American, 0.3% Native American, 0.7% Asian, 0.1% Pacific Islander, 1.2% from other races, and 2.3% from two or more races. Hispanic or Latino of any race were 4.2% of the population.
The median income for a household in the town was $50,000, and the median income for a family was $60,000. The per capita income for the town was $25,000. About 8.3% of families and 11.2% of the population were below the poverty line, including 16.2% of those under age 18 and 5.2% of those age 65 or over.
Common Questions
What is the Total Population of Germantown?
Total Population of Germantown is 1,068.
What is the Total Male Population of Germantown?
Total Male Population of Germantown is 520.
What is the Total Female Population of Germantown?
Total Female Population of Germantown is 548.
What is the Ratio of Males per 100 Females in Germantown?
There are 94.89 Males per 100 Females in Germantown.
What is the Ratio of Females per 100 Males in Germantown?
There are 105.38 Females per 100 Males in Germantown.
What is the Median Population Age in Germantown?
Median Population Age in Germantown is 56.3 Years.
What is the Average Family Size in Germantown
Average Family Size in Germantown is 2.3 People.
What is the Average Household Size in Germantown
Average Household Size in Germantown is 1.9 People.
What is Per Capita Income in Germantown?
Per Capita income in Germantown is $55,950.
What is the Median Family Income in Germantown?
Median Family Income in Germantown is $91,755.
What is the Median Household income in Germantown?
Median Household Income in Germantown is $89,120.
What is Income or Wage Gap in Germantown?
Income or Wage Gap in Germantown is 25.3%.
Women in Germantown earn 74.7 cents for every dollar earned by a man.
What is Inequality or Gini Index in Germantown?
Inequality or Gini Index in Germantown is 0.47.
How Large is the Labor Force in Germantown?
There are 500 People in the Labor Forcein in Germantown.
What is the Percentage of People in the Labor Force in Germantown?
54.4% of People are in the Labor Force in Germantown.
What is the Unemployment Rate in Germantown?
Unemployment Rate in Germantown is 9.4%.