Wynantskill, NY
Wynantskill Map
Wynantskill Overview
3,683
TOTAL POPULATION
1,732
MALE POPULATION
1,951
FEMALE POPULATION
88.77
MALES / 100 FEMALES
112.64
FEMALES / 100 MALES
44.5
MEDIAN AGE
2.6
AVG FAMILY SIZE
2.4
AVG HOUSEHOLD SIZE
$44,060
PER CAPITA INCOME
$108,250
AVG FAMILY INCOME
$92,115
AVG HOUSEHOLD INCOME
2.9%
WAGE / INCOME GAP [ % ]
97.1¢/ $1
WAGE / INCOME GAP [ $ ]
0.32
INEQUALITY / GINI INDEX
1,951
LABOR FORCE [ PEOPLE ]
66.8%
PERCENT IN LABOR FORCE
1.6%
UNEMPLOYMENT RATE
Wynantskill Zip Codes
Wynantskill Area Codes
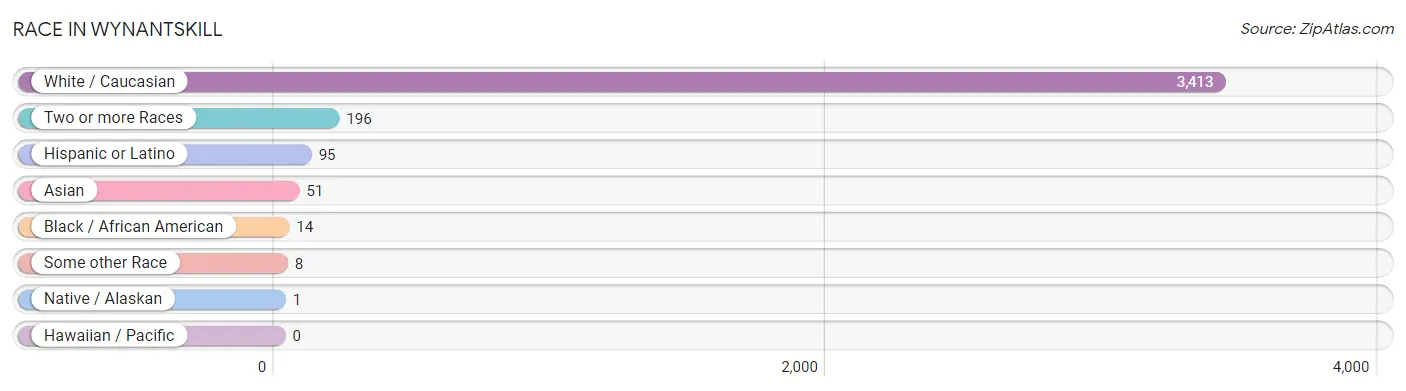
Race in Wynantskill
The most populous races in Wynantskill are White / Caucasian (3,413 | 92.7%), Two or more Races (196 | 5.3%), and Hispanic or Latino (95 | 2.6%).
| Race | # Population | % Population |
| Asian | 51 | 1.4% |
| Black / African American | 14 | 0.4% |
| Hawaiian / Pacific | 0 | 0.0% |
| Hispanic or Latino | 95 | 2.6% |
| Native / Alaskan | 1 | 0.0% |
| White / Caucasian | 3,413 | 92.7% |
| Two or more Races | 196 | 5.3% |
| Some other Race | 8 | 0.2% |
| Total | 3,683 | 100.0% |
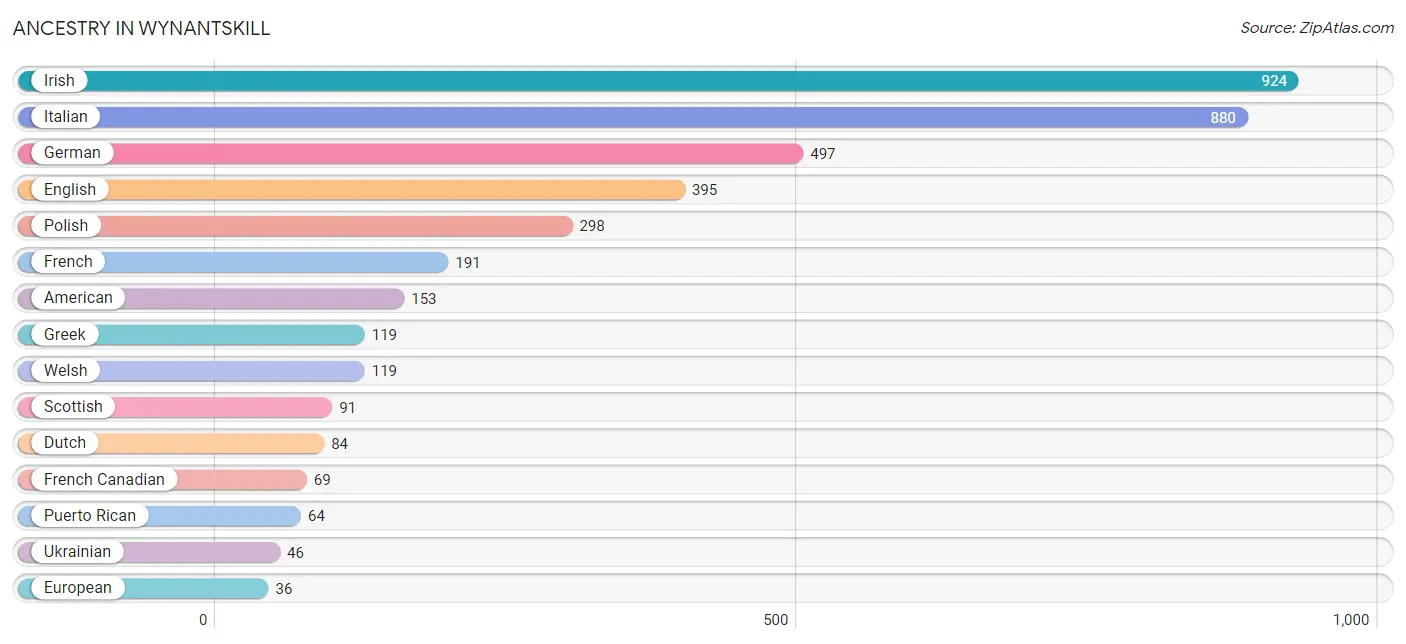
Ancestry in Wynantskill
The most populous ancestries reported in Wynantskill are Irish (924 | 25.1%), Italian (880 | 23.9%), German (497 | 13.5%), English (395 | 10.7%), and Polish (298 | 8.1%), together accounting for 81.3% of all Wynantskill residents.
| Ancestry | # Population | % Population |
| American | 153 | 4.2% |
| Arab | 25 | 0.7% |
| British | 30 | 0.8% |
| Central American | 31 | 0.8% |
| Cherokee | 1 | 0.0% |
| Cree | 21 | 0.6% |
| Danish | 6 | 0.2% |
| Dutch | 84 | 2.3% |
| English | 395 | 10.7% |
| European | 36 | 1.0% |
| French | 191 | 5.2% |
| French Canadian | 69 | 1.9% |
| German | 497 | 13.5% |
| Greek | 119 | 3.2% |
| Honduran | 31 | 0.8% |
| Indian (Asian) | 16 | 0.4% |
| Irish | 924 | 25.1% |
| Italian | 880 | 23.9% |
| Lebanese | 25 | 0.7% |
| Lithuanian | 20 | 0.5% |
| Norwegian | 17 | 0.5% |
| Polish | 298 | 8.1% |
| Puerto Rican | 64 | 1.7% |
| Russian | 34 | 0.9% |
| Scotch-Irish | 3 | 0.1% |
| Scottish | 91 | 2.5% |
| Swedish | 3 | 0.1% |
| Thai | 35 | 0.9% |
| Turkish | 24 | 0.6% |
| Ukrainian | 46 | 1.3% |
| Welsh | 119 | 3.2% | View All 31 Rows |
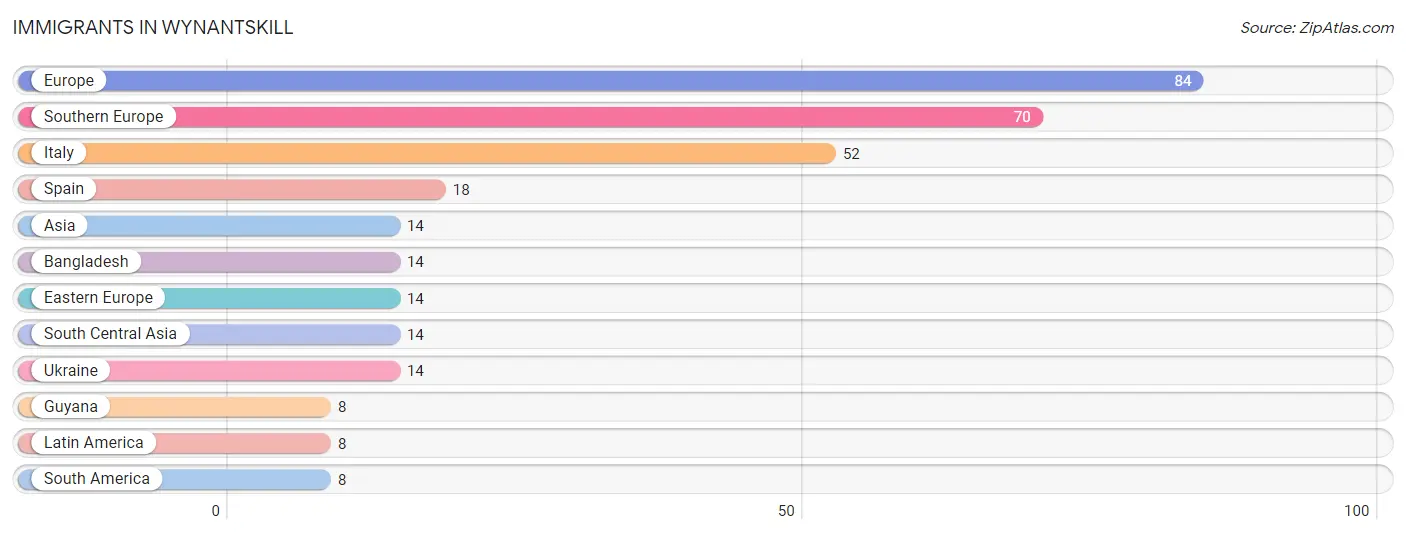
Immigrants in Wynantskill
The most numerous immigrant groups reported in Wynantskill came from Europe (84 | 2.3%), Southern Europe (70 | 1.9%), Italy (52 | 1.4%), Spain (18 | 0.5%), and Asia (14 | 0.4%), together accounting for 6.5% of all Wynantskill residents.
| Immigration Origin | # Population | % Population |
| Asia | 14 | 0.4% |
| Bangladesh | 14 | 0.4% |
| Eastern Europe | 14 | 0.4% |
| Europe | 84 | 2.3% |
| Guyana | 8 | 0.2% |
| Italy | 52 | 1.4% |
| Latin America | 8 | 0.2% |
| South America | 8 | 0.2% |
| South Central Asia | 14 | 0.4% |
| Southern Europe | 70 | 1.9% |
| Spain | 18 | 0.5% |
| Ukraine | 14 | 0.4% | View All 12 Rows |
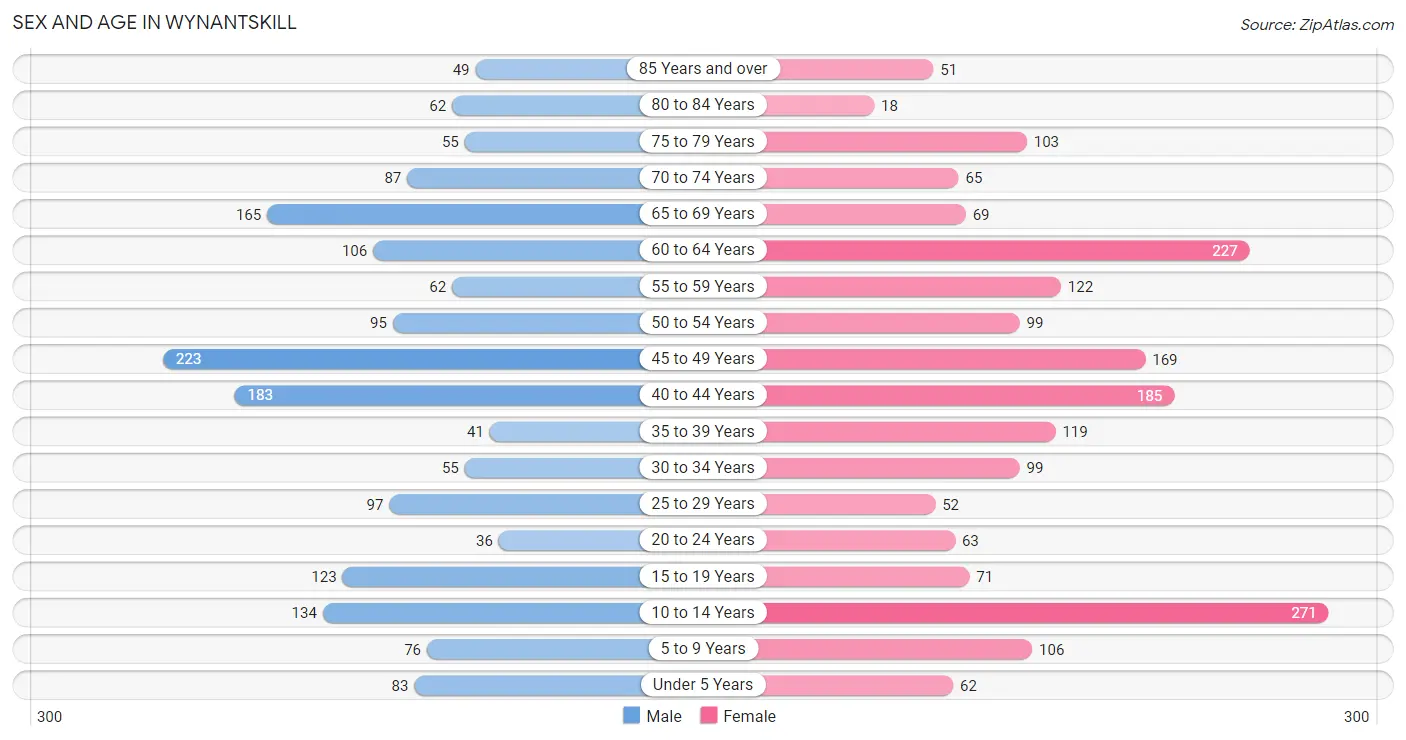
Sex and Age in Wynantskill
Sex and Age in Wynantskill
The most populous age groups in Wynantskill are 45 to 49 Years (223 | 12.9%) for men and 10 to 14 Years (271 | 13.9%) for women.
| Age Bracket | Male | Female |
| Under 5 Years | 83 (4.8%) | 62 (3.2%) |
| 5 to 9 Years | 76 (4.4%) | 106 (5.4%) |
| 10 to 14 Years | 134 (7.7%) | 271 (13.9%) |
| 15 to 19 Years | 123 (7.1%) | 71 (3.6%) |
| 20 to 24 Years | 36 (2.1%) | 63 (3.2%) |
| 25 to 29 Years | 97 (5.6%) | 52 (2.7%) |
| 30 to 34 Years | 55 (3.2%) | 99 (5.1%) |
| 35 to 39 Years | 41 (2.4%) | 119 (6.1%) |
| 40 to 44 Years | 183 (10.6%) | 185 (9.5%) |
| 45 to 49 Years | 223 (12.9%) | 169 (8.7%) |
| 50 to 54 Years | 95 (5.5%) | 99 (5.1%) |
| 55 to 59 Years | 62 (3.6%) | 122 (6.2%) |
| 60 to 64 Years | 106 (6.1%) | 227 (11.6%) |
| 65 to 69 Years | 165 (9.5%) | 69 (3.5%) |
| 70 to 74 Years | 87 (5.0%) | 65 (3.3%) |
| 75 to 79 Years | 55 (3.2%) | 103 (5.3%) |
| 80 to 84 Years | 62 (3.6%) | 18 (0.9%) |
| 85 Years and over | 49 (2.8%) | 51 (2.6%) |
| Total | 1,732 (100.0%) | 1,951 (100.0%) |
Families and Households in Wynantskill
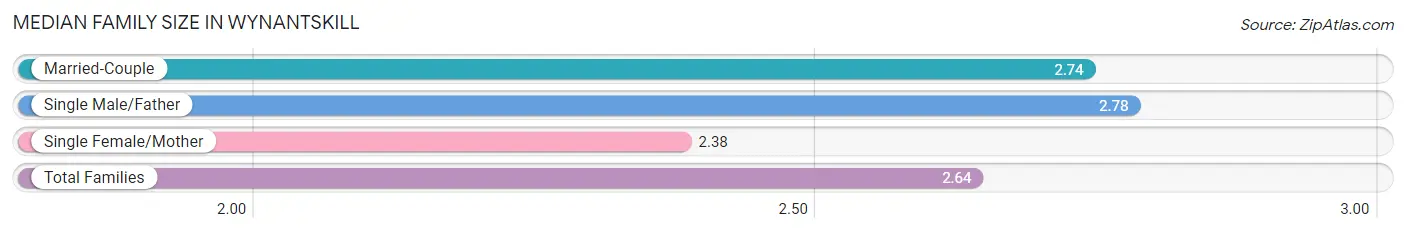
Median Family Size in Wynantskill
The median family size in Wynantskill is 2.64 persons per family, with single male/father families (67 | 5.8%) accounting for the largest median family size of 2.78 persons per family. On the other hand, single female/mother families (323 | 27.8%) represent the smallest median family size with 2.38 persons per family.
| Family Type | # Families | Family Size |
| Married-Couple | 770 (66.4%) | 2.74 |
| Single Male/Father | 67 (5.8%) | 2.78 |
| Single Female/Mother | 323 (27.8%) | 2.38 |
| Total Families | 1,160 (100.0%) | 2.64 |
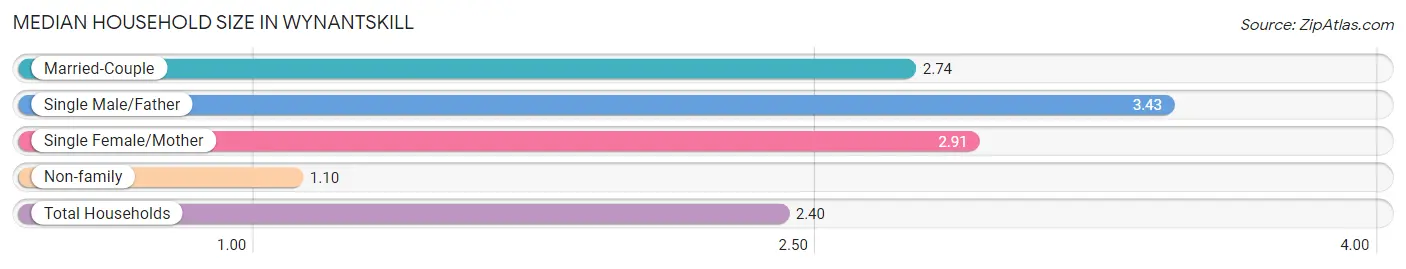
Median Household Size in Wynantskill
The median household size in Wynantskill is 2.40 persons per household, with single male/father households (67 | 4.4%) accounting for the largest median household size of 3.43 persons per household. non-family households (372 | 24.3%) represent the smallest median household size with 1.10 persons per household.
| Household Type | # Households | Household Size |
| Married-Couple | 770 (50.3%) | 2.74 |
| Single Male/Father | 67 (4.4%) | 3.43 |
| Single Female/Mother | 323 (21.1%) | 2.91 |
| Non-family | 372 (24.3%) | 1.10 |
| Total Households | 1,532 (100.0%) | 2.40 |
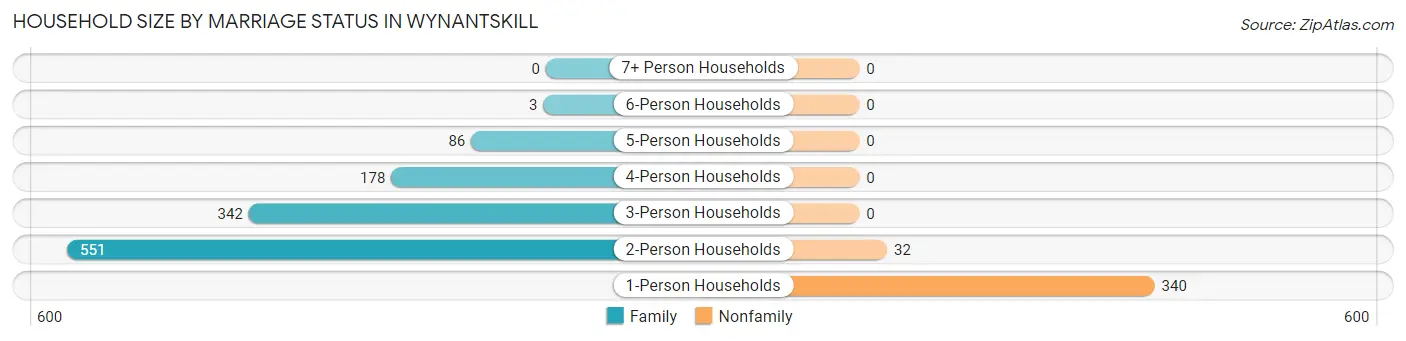
Household Size by Marriage Status in Wynantskill
Out of a total of 1,532 households in Wynantskill, 1,160 (75.7%) are family households, while 372 (24.3%) are nonfamily households. The most numerous type of family households are 2-person households, comprising 551, and the most common type of nonfamily households are 1-person households, comprising 340.
| Household Size | Family Households | Nonfamily Households |
| 1-Person Households | - | 340 (22.2%) |
| 2-Person Households | 551 (36.0%) | 32 (2.1%) |
| 3-Person Households | 342 (22.3%) | 0 (0.0%) |
| 4-Person Households | 178 (11.6%) | 0 (0.0%) |
| 5-Person Households | 86 (5.6%) | 0 (0.0%) |
| 6-Person Households | 3 (0.2%) | 0 (0.0%) |
| 7+ Person Households | 0 (0.0%) | 0 (0.0%) |
| Total | 1,160 (75.7%) | 372 (24.3%) |
Female Fertility in Wynantskill
Fertility by Age in Wynantskill
Average fertility rate in Wynantskill is 103.0 births per 1,000 women. Women in the age bracket of 35 to 50 years have the highest fertility rate with 150.0 births per 1,000 women. Women in the age bracket of 35 to 50 years acount for 91.1% of all women with births.
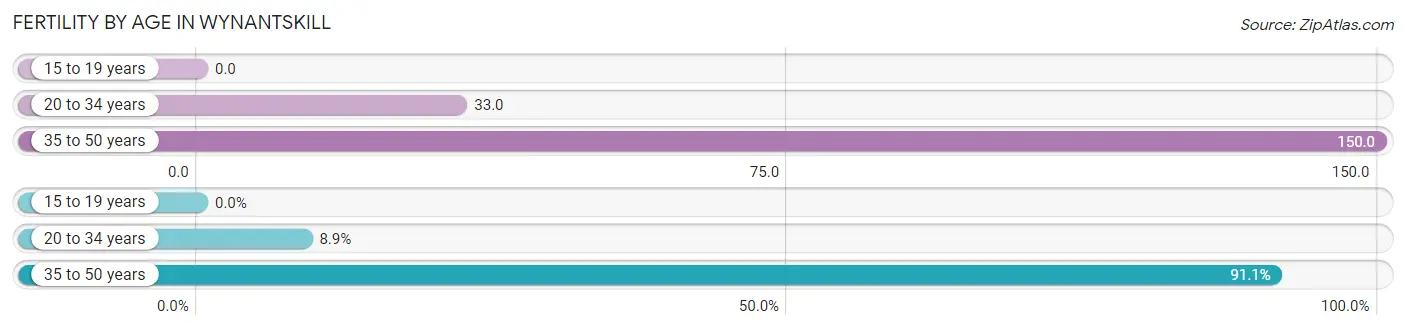
| Age Bracket | Women with Births | Births / 1,000 Women |
| 15 to 19 years | 0 (0.0%) | 0.0 |
| 20 to 34 years | 7 (8.9%) | 33.0 |
| 35 to 50 years | 72 (91.1%) | 150.0 |
| Total | 79 (100.0%) | 103.0 |
Fertility by Age by Marriage Status in Wynantskill
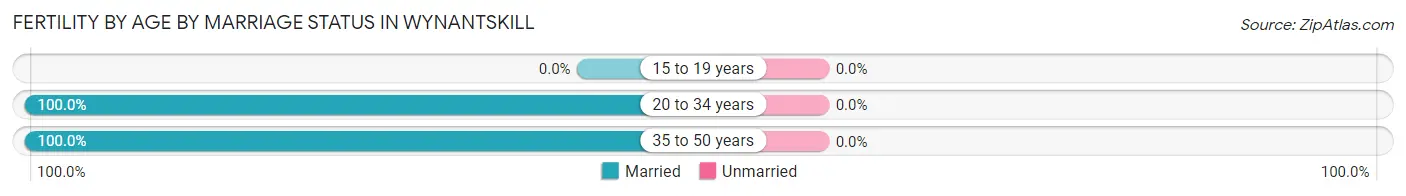
| Age Bracket | Married | Unmarried |
| 15 to 19 years | 0 (0.0%) | 0 (0.0%) |
| 20 to 34 years | 7 (100.0%) | 0 (0.0%) |
| 35 to 50 years | 72 (100.0%) | 0 (0.0%) |
| Total | 79 (100.0%) | 0 (0.0%) |
Fertility by Education in Wynantskill
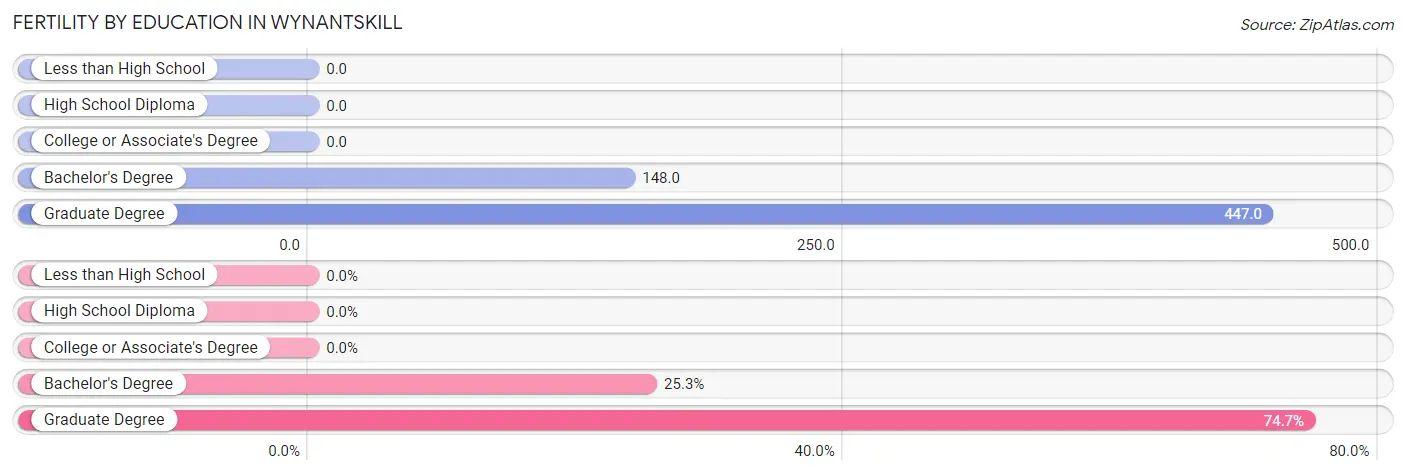
| Educational Attainment | Women with Births | Births / 1,000 Women |
| Less than High School | 0 (0.0%) | 0.0 |
| High School Diploma | 0 (0.0%) | 0.0 |
| College or Associate's Degree | 0 (0.0%) | 0.0 |
| Bachelor's Degree | 20 (25.3%) | 148.0 |
| Graduate Degree | 59 (74.7%) | 447.0 |
| Total | 79 (100.0%) | 103.0 |
Fertility by Education by Marriage Status in Wynantskill
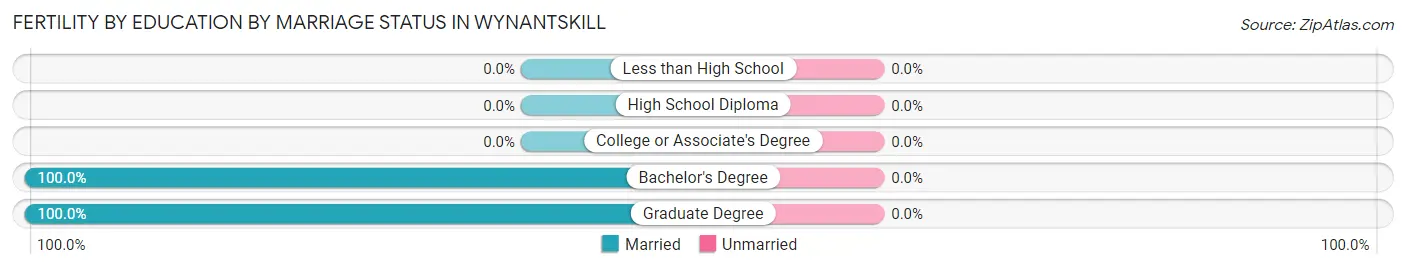
| Educational Attainment | Married | Unmarried |
| Less than High School | 0 (0.0%) | 0 (0.0%) |
| High School Diploma | 0 (0.0%) | 0 (0.0%) |
| College or Associate's Degree | 0 (0.0%) | 0 (0.0%) |
| Bachelor's Degree | 20 (100.0%) | 0 (0.0%) |
| Graduate Degree | 59 (100.0%) | 0 (0.0%) |
| Total | 79 (100.0%) | 0 (0.0%) |
Income in Wynantskill
Income Overview in Wynantskill
Per Capita Income in Wynantskill is $44,060, while median incomes of families and households are $108,250 and $92,115 respectively.
| Characteristic | Number | Measure |
| Per Capita Income | 3,683 | $44,060 |
| Median Family Income | 1,160 | $108,250 |
| Mean Family Income | 1,160 | $114,104 |
| Median Household Income | 1,532 | $92,115 |
| Mean Household Income | 1,532 | $105,062 |
| Income Deficit | 1,160 | $0 |
| Wage / Income Gap (%) | 3,683 | 2.89% |
| Wage / Income Gap ($) | 3,683 | 97.11¢ per $1 |
| Gini / Inequality Index | 3,683 | 0.32 |
Earnings by Sex in Wynantskill
Average Earnings in Wynantskill are $56,667, $58,148 for men and $56,468 for women, a difference of 2.9%.
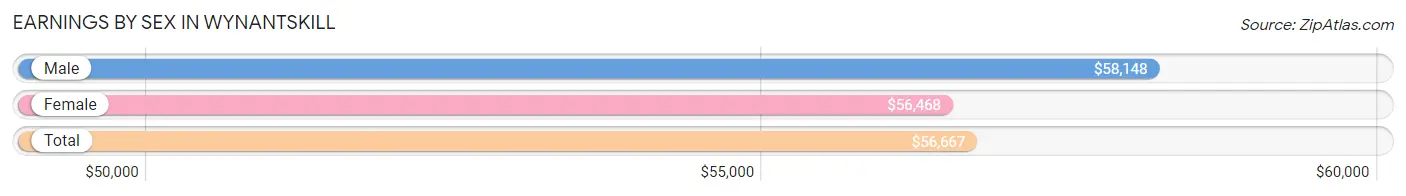
| Sex | Number | Average Earnings |
| Male | 980 (48.6%) | $58,148 |
| Female | 1,036 (51.4%) | $56,468 |
| Total | 2,016 (100.0%) | $56,667 |
Earnings by Sex by Income Bracket in Wynantskill
The most common earnings brackets in Wynantskill are $100,000+ for men (207 | 21.1%) and $100,000+ for women (177 | 17.1%).
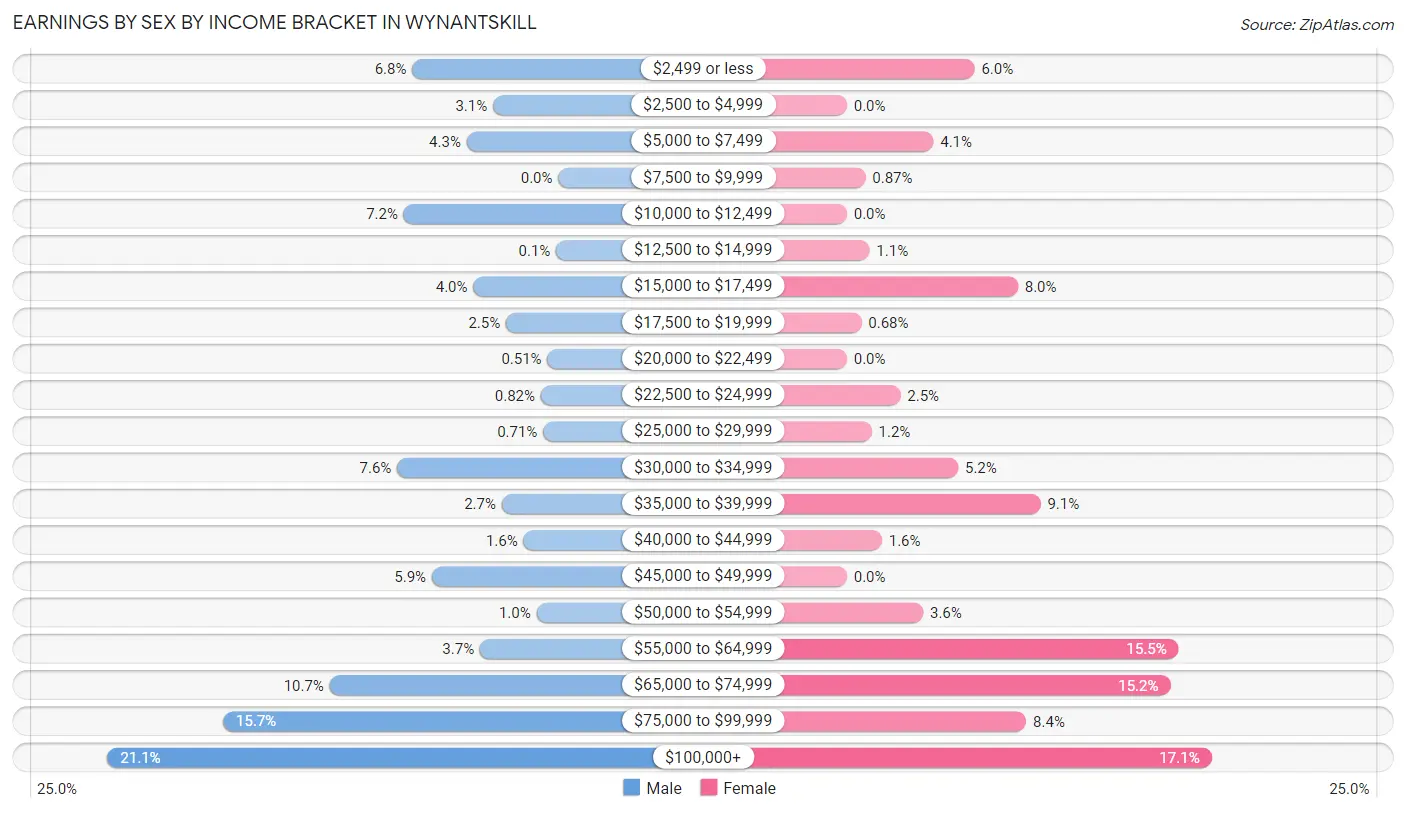
| Income | Male | Female |
| $2,499 or less | 67 (6.8%) | 62 (6.0%) |
| $2,500 to $4,999 | 30 (3.1%) | 0 (0.0%) |
| $5,000 to $7,499 | 42 (4.3%) | 42 (4.1%) |
| $7,500 to $9,999 | 0 (0.0%) | 9 (0.9%) |
| $10,000 to $12,499 | 71 (7.2%) | 0 (0.0%) |
| $12,500 to $14,999 | 1 (0.1%) | 11 (1.1%) |
| $15,000 to $17,499 | 39 (4.0%) | 83 (8.0%) |
| $17,500 to $19,999 | 24 (2.5%) | 7 (0.7%) |
| $20,000 to $22,499 | 5 (0.5%) | 0 (0.0%) |
| $22,500 to $24,999 | 8 (0.8%) | 26 (2.5%) |
| $25,000 to $29,999 | 7 (0.7%) | 12 (1.2%) |
| $30,000 to $34,999 | 74 (7.5%) | 54 (5.2%) |
| $35,000 to $39,999 | 26 (2.6%) | 94 (9.1%) |
| $40,000 to $44,999 | 16 (1.6%) | 17 (1.6%) |
| $45,000 to $49,999 | 58 (5.9%) | 0 (0.0%) |
| $50,000 to $54,999 | 10 (1.0%) | 37 (3.6%) |
| $55,000 to $64,999 | 36 (3.7%) | 161 (15.5%) |
| $65,000 to $74,999 | 105 (10.7%) | 157 (15.1%) |
| $75,000 to $99,999 | 154 (15.7%) | 87 (8.4%) |
| $100,000+ | 207 (21.1%) | 177 (17.1%) |
| Total | 980 (100.0%) | 1,036 (100.0%) |
Earnings by Sex by Educational Attainment in Wynantskill
Average earnings in Wynantskill are $68,175 for men and $57,774 for women, a difference of 15.3%. Men with an educational attainment of bachelor's degree enjoy the highest average annual earnings of $93,850, while those with high school diploma education earn the least with $33,542. Women with an educational attainment of bachelor's degree earn the most with the average annual earnings of $83,036, while those with high school diploma education have the smallest earnings of $33,516.
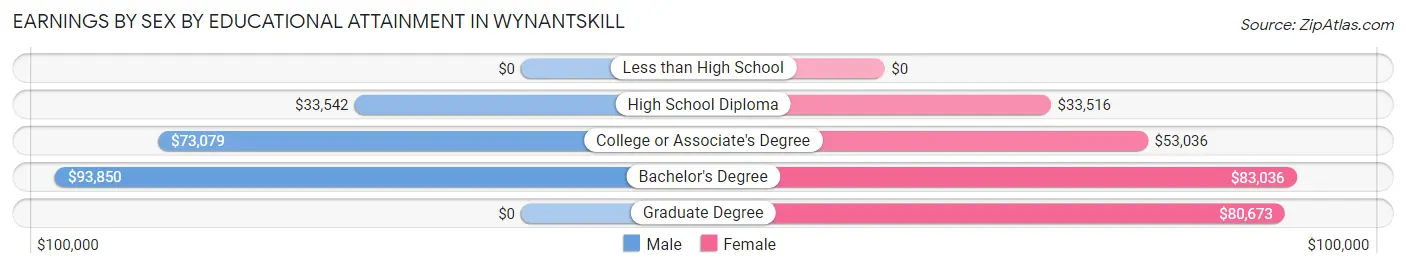
| Educational Attainment | Male Income | Female Income |
| Less than High School | - | - |
| High School Diploma | $33,542 | $33,516 |
| College or Associate's Degree | $73,079 | $53,036 |
| Bachelor's Degree | $93,850 | $83,036 |
| Graduate Degree | - | - |
| Total | $68,175 | $57,774 |
Family Income in Wynantskill
Family Income Brackets in Wynantskill
According to the Wynantskill family income data, there are 371 families falling into the $100,000 to $149,999 income range, which is the most common income bracket and makes up 32.0% of all families.
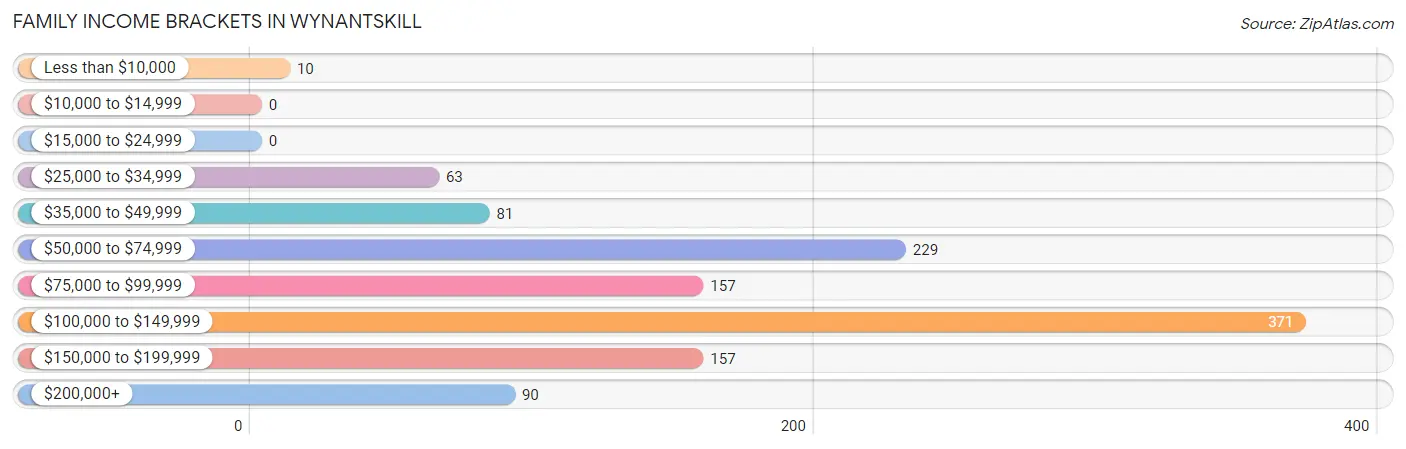
| Income Bracket | # Families | % Families |
| Less than $10,000 | 10 | 0.9% |
| $10,000 to $14,999 | 0 | 0.0% |
| $15,000 to $24,999 | 0 | 0.0% |
| $25,000 to $34,999 | 63 | 5.4% |
| $35,000 to $49,999 | 81 | 7.0% |
| $50,000 to $74,999 | 229 | 19.7% |
| $75,000 to $99,999 | 157 | 13.5% |
| $100,000 to $149,999 | 371 | 32.0% |
| $150,000 to $199,999 | 157 | 13.5% |
| $200,000+ | 90 | 7.8% |
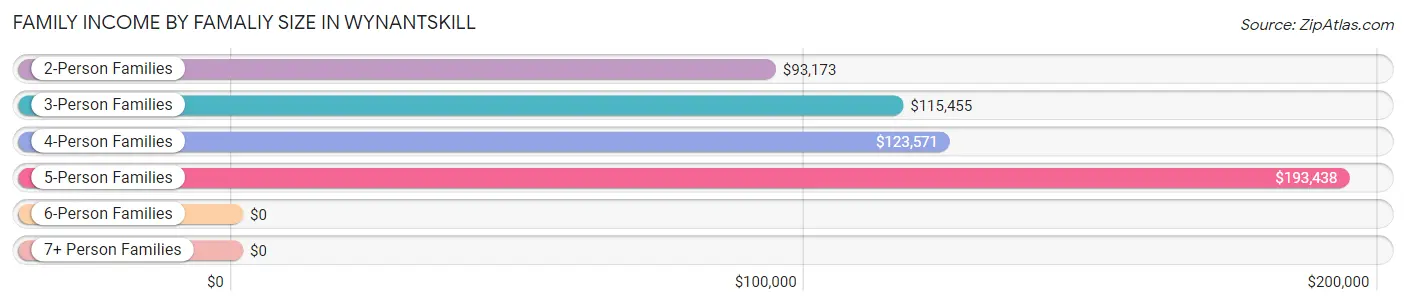
Family Income by Famaliy Size in Wynantskill
5-person families (34 | 2.9%) account for the highest median family income in Wynantskill with $193,438 per family, while 2-person families (685 | 59.1%) have the highest median income of $46,586 per family member.
| Income Bracket | # Families | Median Income |
| 2-Person Families | 685 (59.1%) | $93,173 |
| 3-Person Families | 224 (19.3%) | $115,455 |
| 4-Person Families | 214 (18.4%) | $123,571 |
| 5-Person Families | 34 (2.9%) | $193,438 |
| 6-Person Families | 3 (0.3%) | $0 |
| 7+ Person Families | 0 (0.0%) | $0 |
| Total | 1,160 (100.0%) | $108,250 |
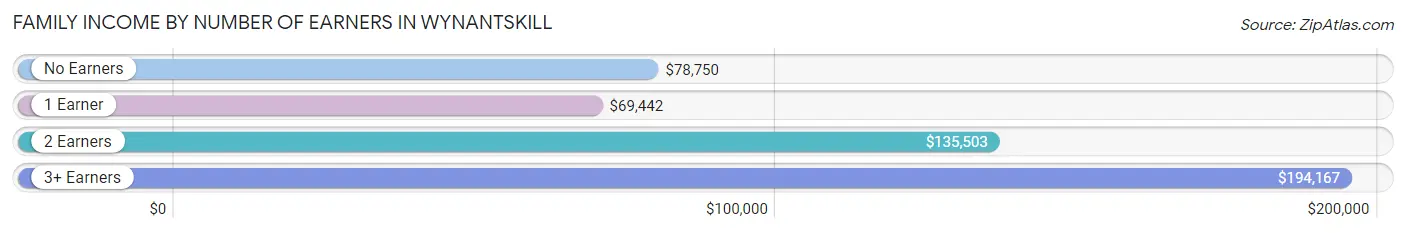
Family Income by Number of Earners in Wynantskill
The median family income in Wynantskill is $108,250, with families comprising 3+ earners (58) having the highest median family income of $194,167, while families with 1 earner (340) have the lowest median family income of $69,442, accounting for 5.0% and 29.3% of families, respectively.
| Number of Earners | # Families | Median Income |
| No Earners | 217 (18.7%) | $78,750 |
| 1 Earner | 340 (29.3%) | $69,442 |
| 2 Earners | 545 (47.0%) | $135,503 |
| 3+ Earners | 58 (5.0%) | $194,167 |
| Total | 1,160 (100.0%) | $108,250 |
Household Income in Wynantskill
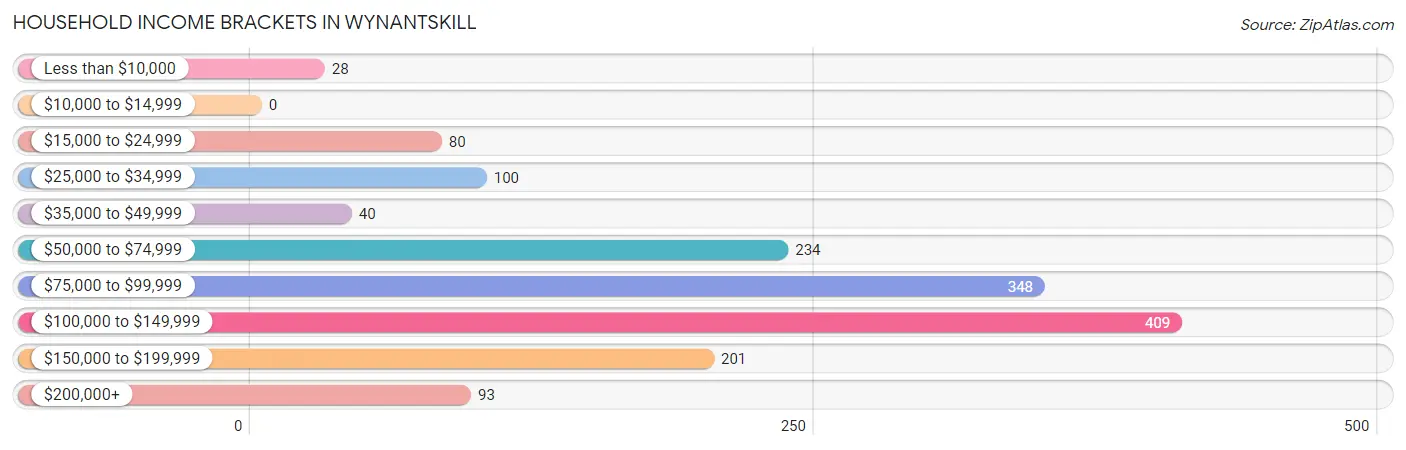
Household Income Brackets in Wynantskill
With 409 households falling in the category, the $100,000 to $149,999 income range is the most frequent in Wynantskill, accounting for 26.7% of all households.
| Income Bracket | # Households | % Households |
| Less than $10,000 | 28 | 1.8% |
| $10,000 to $14,999 | 0 | 0.0% |
| $15,000 to $24,999 | 80 | 5.2% |
| $25,000 to $34,999 | 100 | 6.5% |
| $35,000 to $49,999 | 40 | 2.6% |
| $50,000 to $74,999 | 234 | 15.3% |
| $75,000 to $99,999 | 348 | 22.7% |
| $100,000 to $149,999 | 409 | 26.7% |
| $150,000 to $199,999 | 201 | 13.1% |
| $200,000+ | 93 | 6.1% |
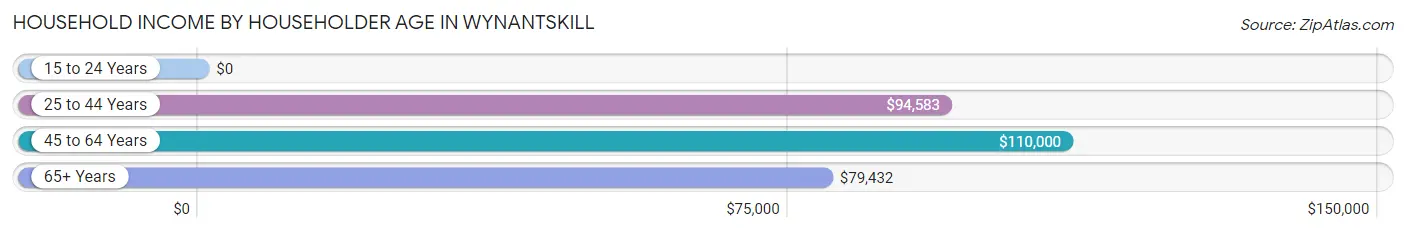
Household Income by Householder Age in Wynantskill
The median household income in Wynantskill is $92,115, with the highest median household income of $110,000 found in the 45 to 64 years age bracket for the primary householder. A total of 650 households (42.4%) fall into this category. Meanwhile, the 15 to 24 years age bracket for the primary householder has the lowest median household income of $0, with 10 households (0.6%) in this group.
| Income Bracket | # Households | Median Income |
| 15 to 24 Years | 10 (0.6%) | $0 |
| 25 to 44 Years | 479 (31.3%) | $94,583 |
| 45 to 64 Years | 650 (42.4%) | $110,000 |
| 65+ Years | 393 (25.7%) | $79,432 |
| Total | 1,532 (100.0%) | $92,115 |
Poverty in Wynantskill
Income Below Poverty by Sex and Age in Wynantskill
With 5.1% poverty level for males and 1.4% for females among the residents of Wynantskill, 45 to 54 year old males and 75 year old and over females are the most vulnerable to poverty, with 71 males (22.3%) and 16 females (9.3%) in their respective age groups living below the poverty level.
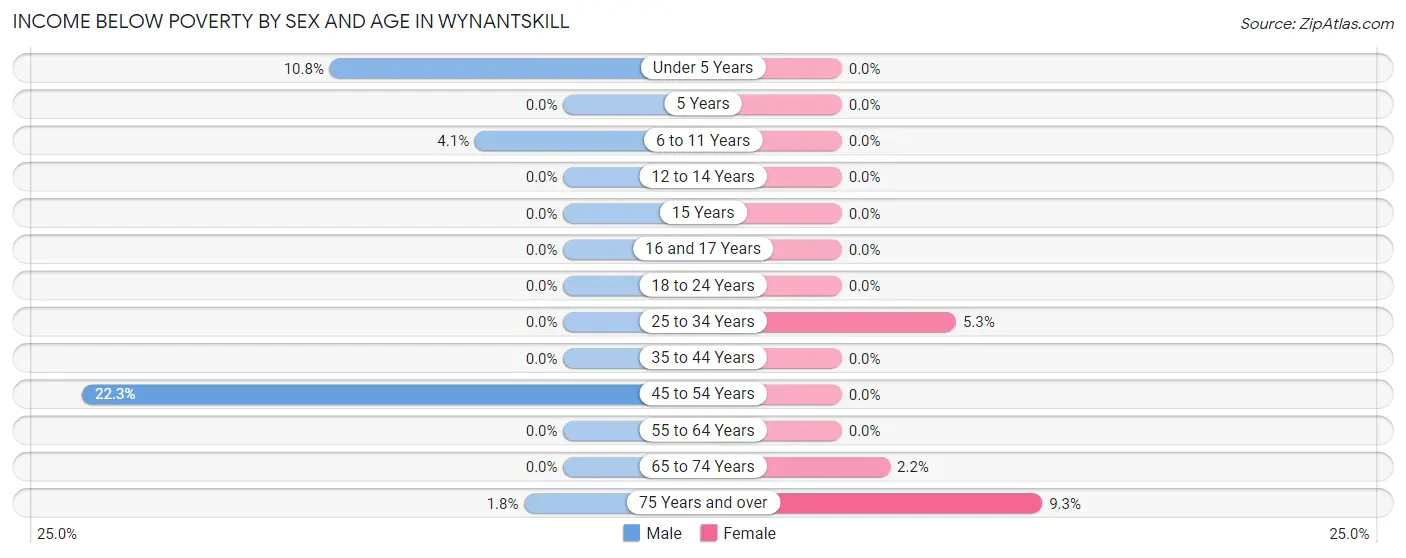
| Age Bracket | Male | Female |
| Under 5 Years | 9 (10.8%) | 0 (0.0%) |
| 5 Years | 0 (0.0%) | 0 (0.0%) |
| 6 to 11 Years | 5 (4.1%) | 0 (0.0%) |
| 12 to 14 Years | 0 (0.0%) | 0 (0.0%) |
| 15 Years | 0 (0.0%) | 0 (0.0%) |
| 16 and 17 Years | 0 (0.0%) | 0 (0.0%) |
| 18 to 24 Years | 0 (0.0%) | 0 (0.0%) |
| 25 to 34 Years | 0 (0.0%) | 8 (5.3%) |
| 35 to 44 Years | 0 (0.0%) | 0 (0.0%) |
| 45 to 54 Years | 71 (22.3%) | 0 (0.0%) |
| 55 to 64 Years | 0 (0.0%) | 0 (0.0%) |
| 65 to 74 Years | 0 (0.0%) | 3 (2.2%) |
| 75 Years and over | 3 (1.8%) | 16 (9.3%) |
| Total | 88 (5.1%) | 27 (1.4%) |
Income Above Poverty by Sex and Age in Wynantskill
According to the poverty statistics in Wynantskill, males aged 12 to 14 years and females aged under 5 years are the age groups that are most secure financially, with 100.0% of males and 100.0% of females in these age groups living above the poverty line.
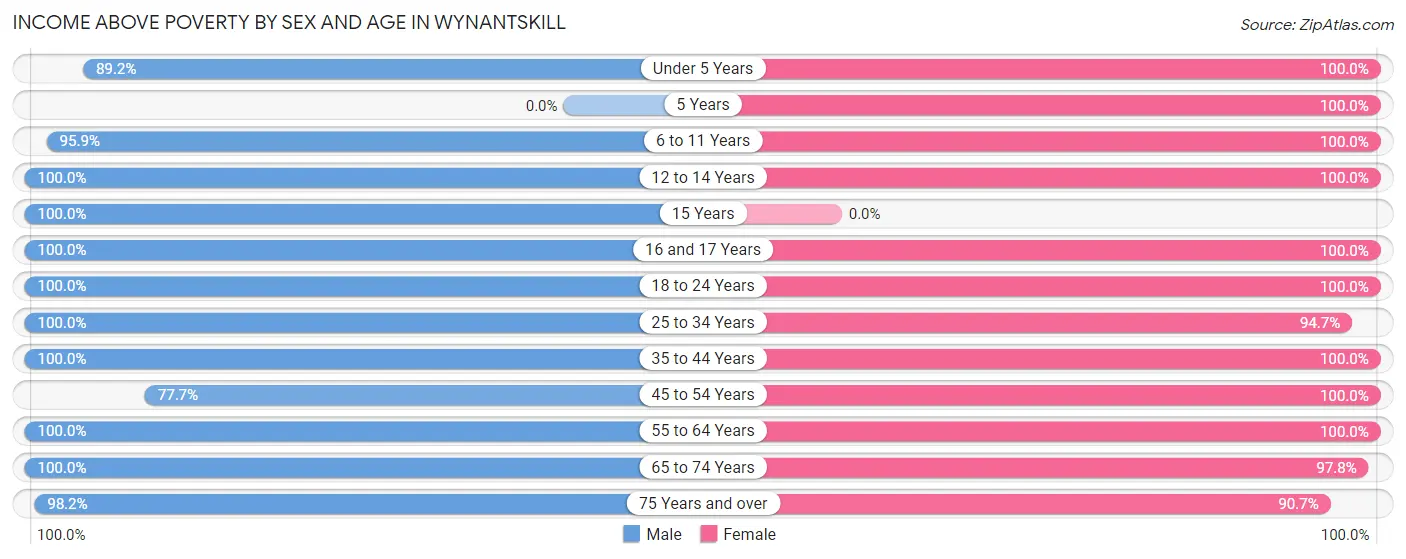
| Age Bracket | Male | Female |
| Under 5 Years | 74 (89.2%) | 62 (100.0%) |
| 5 Years | 0 (0.0%) | 9 (100.0%) |
| 6 to 11 Years | 117 (95.9%) | 235 (100.0%) |
| 12 to 14 Years | 88 (100.0%) | 133 (100.0%) |
| 15 Years | 31 (100.0%) | 0 (0.0%) |
| 16 and 17 Years | 39 (100.0%) | 62 (100.0%) |
| 18 to 24 Years | 89 (100.0%) | 72 (100.0%) |
| 25 to 34 Years | 152 (100.0%) | 143 (94.7%) |
| 35 to 44 Years | 224 (100.0%) | 304 (100.0%) |
| 45 to 54 Years | 247 (77.7%) | 268 (100.0%) |
| 55 to 64 Years | 168 (100.0%) | 349 (100.0%) |
| 65 to 74 Years | 252 (100.0%) | 131 (97.8%) |
| 75 Years and over | 163 (98.2%) | 156 (90.7%) |
| Total | 1,644 (94.9%) | 1,924 (98.6%) |
Income Below Poverty Among Married-Couple Families in Wynantskill
The poverty statistics for married-couple families in Wynantskill show that 0.4% or 3 of the total 770 families live below the poverty line. Families with no children have the highest poverty rate of 0.7%, comprising of 3 families. On the other hand, families with 1 or 2 children have the lowest poverty rate of 0.0%, which includes 0 families.
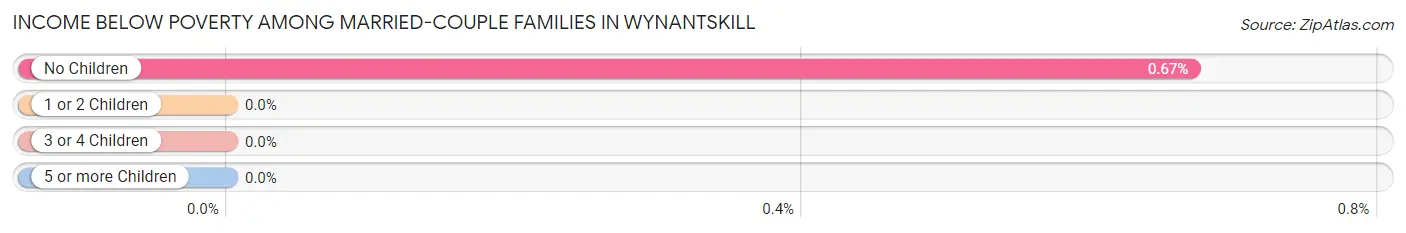
| Children | Above Poverty | Below Poverty |
| No Children | 442 (99.3%) | 3 (0.7%) |
| 1 or 2 Children | 288 (100.0%) | 0 (0.0%) |
| 3 or 4 Children | 37 (100.0%) | 0 (0.0%) |
| 5 or more Children | 0 (0.0%) | 0 (0.0%) |
| Total | 767 (99.6%) | 3 (0.4%) |
Income Below Poverty Among Single-Parent Households in Wynantskill
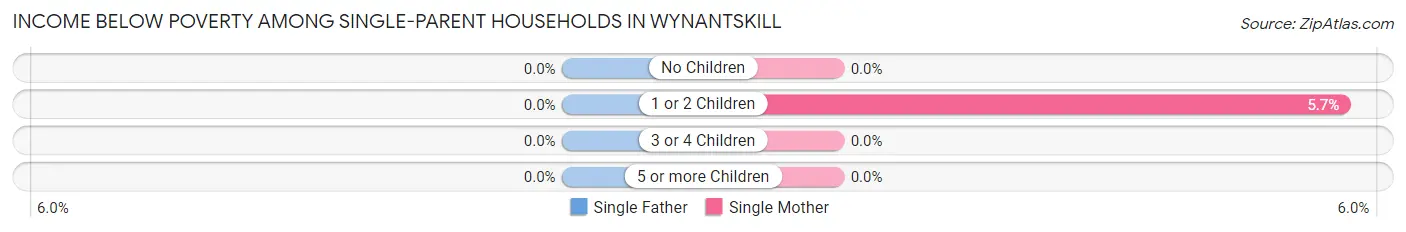
| Children | Single Father | Single Mother |
| No Children | 0 (0.0%) | 0 (0.0%) |
| 1 or 2 Children | 0 (0.0%) | 8 (5.7%) |
| 3 or 4 Children | 0 (0.0%) | 0 (0.0%) |
| 5 or more Children | 0 (0.0%) | 0 (0.0%) |
| Total | 0 (0.0%) | 8 (2.5%) |
Income Below Poverty Among Married-Couple vs Single-Parent Households in Wynantskill
The poverty data for Wynantskill shows that 3 of the married-couple family households (0.4%) and 8 of the single-parent households (2.1%) are living below the poverty level. Within the married-couple family households, those with no children have the highest poverty rate, with 3 households (0.7%) falling below the poverty line. Among the single-parent households, those with 1 or 2 children have the highest poverty rate, with 8 household (4.5%) living below poverty.
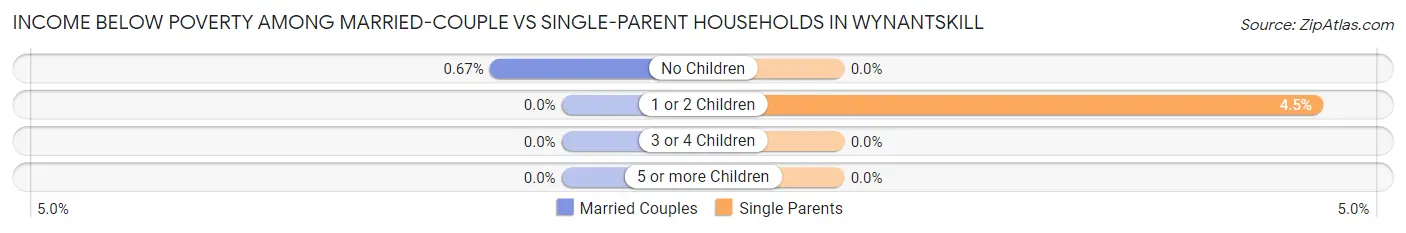
| Children | Married-Couple Families | Single-Parent Households |
| No Children | 3 (0.7%) | 0 (0.0%) |
| 1 or 2 Children | 0 (0.0%) | 8 (4.5%) |
| 3 or 4 Children | 0 (0.0%) | 0 (0.0%) |
| 5 or more Children | 0 (0.0%) | 0 (0.0%) |
| Total | 3 (0.4%) | 8 (2.1%) |
Employment Characteristics in Wynantskill
Employment by Class of Employer in Wynantskill
Among the 1,821 employed individuals in Wynantskill, private company employees (1,098 | 60.3%), state government employees (263 | 14.4%), and not-for-profit organizations (198 | 10.9%) make up the most common classes of employment.
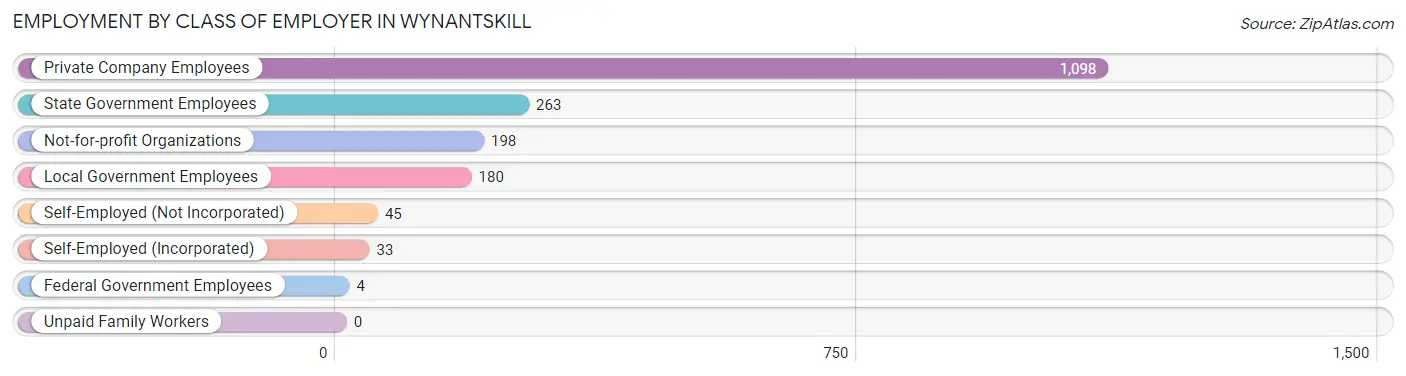
| Employer Class | # Employees | % Employees |
| Private Company Employees | 1,098 | 60.3% |
| Self-Employed (Incorporated) | 33 | 1.8% |
| Self-Employed (Not Incorporated) | 45 | 2.5% |
| Not-for-profit Organizations | 198 | 10.9% |
| Local Government Employees | 180 | 9.9% |
| State Government Employees | 263 | 14.4% |
| Federal Government Employees | 4 | 0.2% |
| Unpaid Family Workers | 0 | 0.0% |
| Total | 1,821 | 100.0% |
Employment Status by Age in Wynantskill
According to the labor force statistics for Wynantskill, out of the total population over 16 years of age (2,920), 66.8% or 1,951 individuals are in the labor force, with 1.6% or 31 of them unemployed. The age group with the highest labor force participation rate is 25 to 29 years, with 100.0% or 149 individuals in the labor force. Within the labor force, the 45 to 54 years age range has the highest percentage of unemployed individuals, with 4.5% or 26 of them being unemployed.
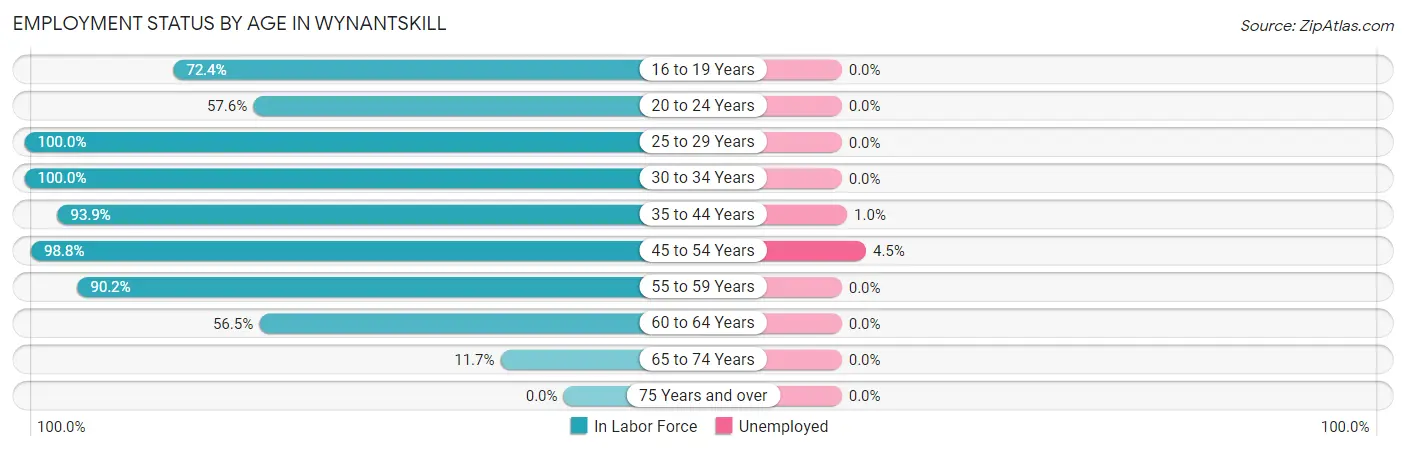
| Age Bracket | In Labor Force | Unemployed |
| 16 to 19 Years | 118 (72.4%) | 0 (0.0%) |
| 20 to 24 Years | 57 (57.6%) | 0 (0.0%) |
| 25 to 29 Years | 149 (100.0%) | 0 (0.0%) |
| 30 to 34 Years | 154 (100.0%) | 0 (0.0%) |
| 35 to 44 Years | 496 (93.9%) | 5 (1.0%) |
| 45 to 54 Years | 579 (98.8%) | 26 (4.5%) |
| 55 to 59 Years | 166 (90.2%) | 0 (0.0%) |
| 60 to 64 Years | 188 (56.5%) | 0 (0.0%) |
| 65 to 74 Years | 45 (11.7%) | 0 (0.0%) |
| 75 Years and over | 0 (0.0%) | 0 (0.0%) |
| Total | 1,951 (66.8%) | 31 (1.6%) |
Employment Status by Educational Attainment in Wynantskill
According to labor force statistics for Wynantskill, 89.6% of individuals (1,733) out of the total population between 25 and 64 years of age (1,934) are in the labor force, with 1.8% or 31 of them being unemployed. The group with the highest labor force participation rate are those with the educational attainment of less than high school, with 100.0% or 29 individuals in the labor force. Within the labor force, individuals with college / associate degree education have the highest percentage of unemployment, with 4.0% or 26 of them being unemployed.
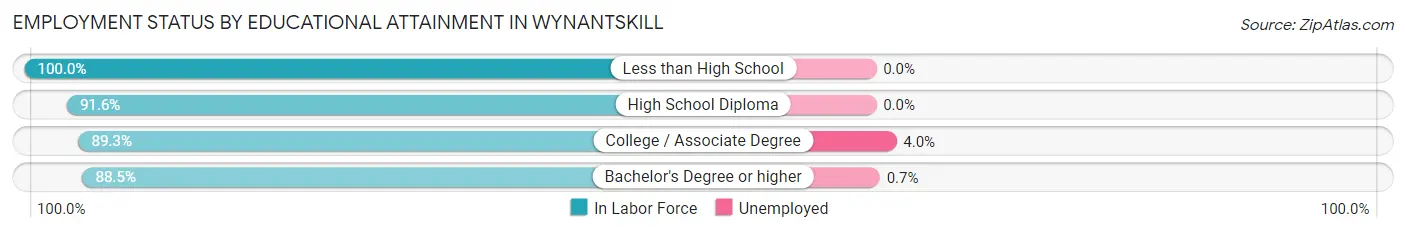
| Educational Attainment | In Labor Force | Unemployed |
| Less than High School | 29 (100.0%) | 0 (0.0%) |
| High School Diploma | 336 (91.6%) | 0 (0.0%) |
| College / Associate Degree | 653 (89.3%) | 29 (4.0%) |
| Bachelor's Degree or higher | 714 (88.5%) | 6 (0.7%) |
| Total | 1,733 (89.6%) | 35 (1.8%) |
Employment Occupations by Sex in Wynantskill
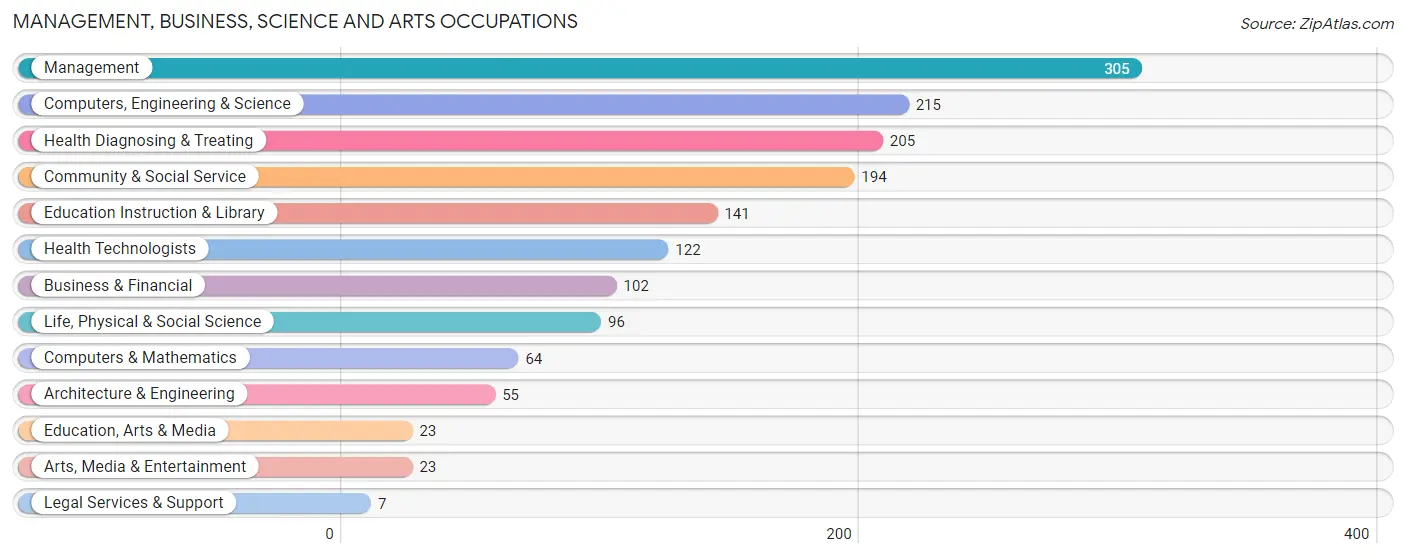
Management, Business, Science and Arts Occupations
The most common Management, Business, Science and Arts occupations in Wynantskill are Management (305 | 15.9%), Computers, Engineering & Science (215 | 11.2%), Health Diagnosing & Treating (205 | 10.7%), Community & Social Service (194 | 10.1%), and Education Instruction & Library (141 | 7.3%).
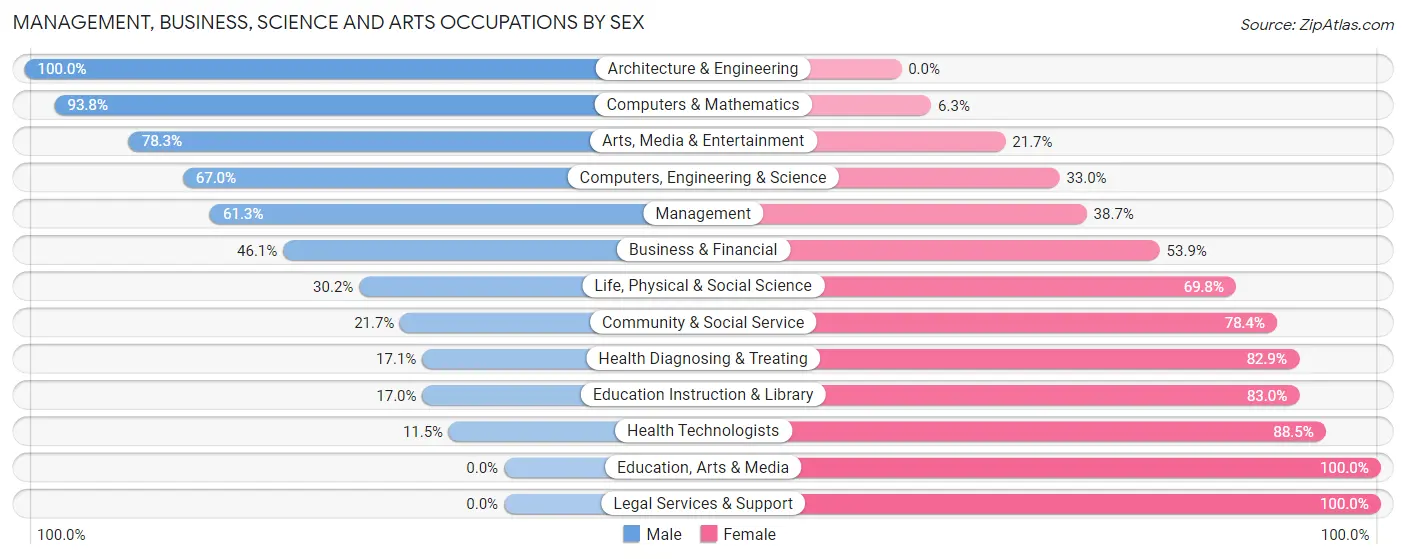
Management, Business, Science and Arts Occupations by Sex
Within the Management, Business, Science and Arts occupations in Wynantskill, the most male-oriented occupations are Architecture & Engineering (100.0%), Computers & Mathematics (93.8%), and Arts, Media & Entertainment (78.3%), while the most female-oriented occupations are Education, Arts & Media (100.0%), Legal Services & Support (100.0%), and Health Technologists (88.5%).
| Occupation | Male | Female |
| Management | 187 (61.3%) | 118 (38.7%) |
| Business & Financial | 47 (46.1%) | 55 (53.9%) |
| Computers, Engineering & Science | 144 (67.0%) | 71 (33.0%) |
| Computers & Mathematics | 60 (93.8%) | 4 (6.2%) |
| Architecture & Engineering | 55 (100.0%) | 0 (0.0%) |
| Life, Physical & Social Science | 29 (30.2%) | 67 (69.8%) |
| Community & Social Service | 42 (21.6%) | 152 (78.3%) |
| Education, Arts & Media | 0 (0.0%) | 23 (100.0%) |
| Legal Services & Support | 0 (0.0%) | 7 (100.0%) |
| Education Instruction & Library | 24 (17.0%) | 117 (83.0%) |
| Arts, Media & Entertainment | 18 (78.3%) | 5 (21.7%) |
| Health Diagnosing & Treating | 35 (17.1%) | 170 (82.9%) |
| Health Technologists | 14 (11.5%) | 108 (88.5%) |
| Total (Category) | 455 (44.6%) | 566 (55.4%) |
| Total (Overall) | 915 (47.6%) | 1,006 (52.4%) |
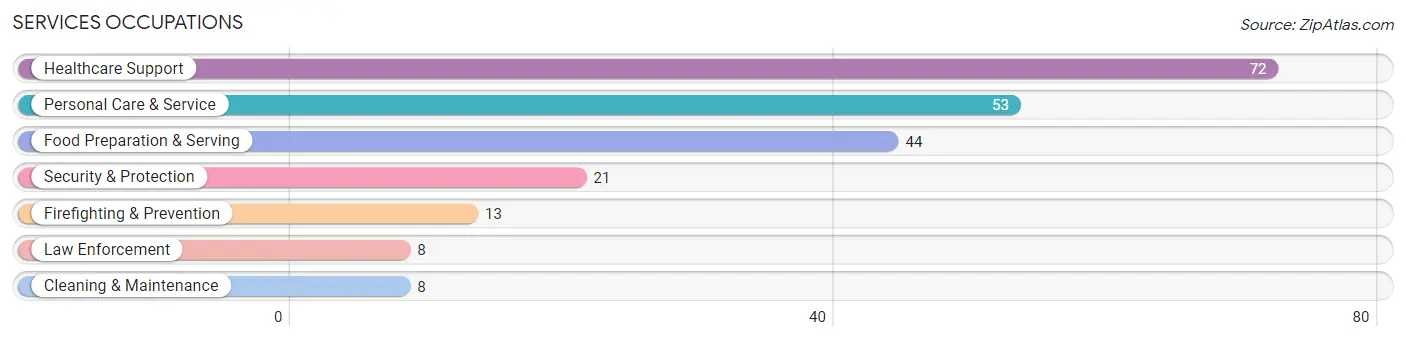
Services Occupations
The most common Services occupations in Wynantskill are Healthcare Support (72 | 3.7%), Personal Care & Service (53 | 2.8%), Food Preparation & Serving (44 | 2.3%), Security & Protection (21 | 1.1%), and Firefighting & Prevention (13 | 0.7%).
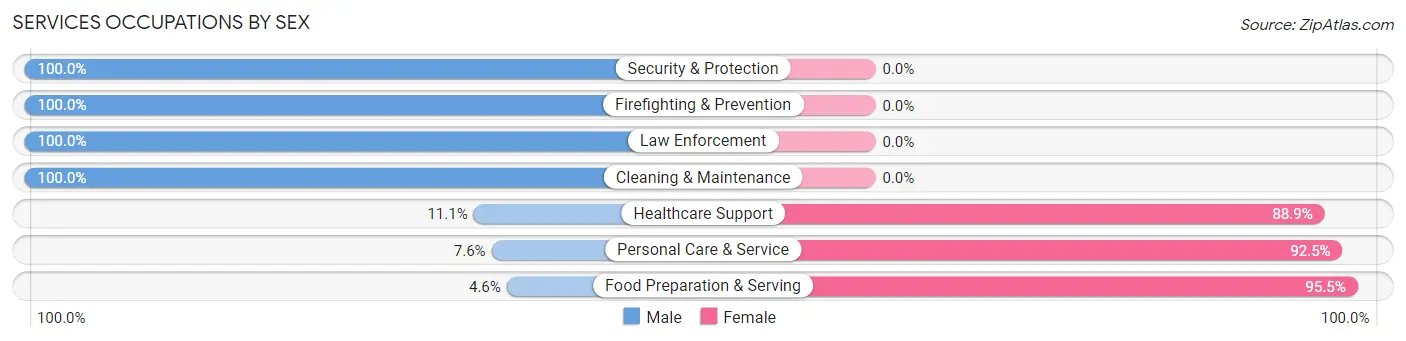
Services Occupations by Sex
Within the Services occupations in Wynantskill, the most male-oriented occupations are Security & Protection (100.0%), Firefighting & Prevention (100.0%), and Law Enforcement (100.0%), while the most female-oriented occupations are Food Preparation & Serving (95.5%), Personal Care & Service (92.4%), and Healthcare Support (88.9%).
| Occupation | Male | Female |
| Healthcare Support | 8 (11.1%) | 64 (88.9%) |
| Security & Protection | 21 (100.0%) | 0 (0.0%) |
| Firefighting & Prevention | 13 (100.0%) | 0 (0.0%) |
| Law Enforcement | 8 (100.0%) | 0 (0.0%) |
| Food Preparation & Serving | 2 (4.5%) | 42 (95.5%) |
| Cleaning & Maintenance | 8 (100.0%) | 0 (0.0%) |
| Personal Care & Service | 4 (7.5%) | 49 (92.4%) |
| Total (Category) | 43 (21.7%) | 155 (78.3%) |
| Total (Overall) | 915 (47.6%) | 1,006 (52.4%) |
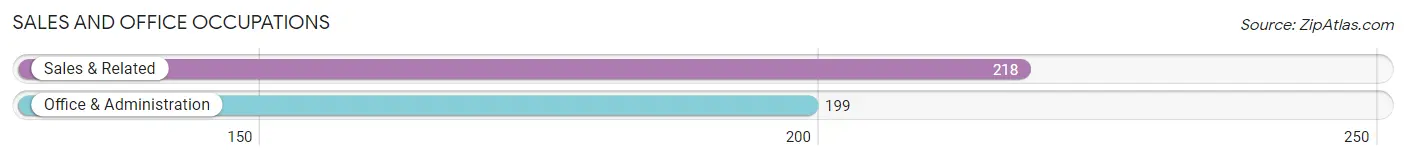
Sales and Office Occupations
The most common Sales and Office occupations in Wynantskill are Sales & Related (218 | 11.4%), and Office & Administration (199 | 10.4%).
Sales and Office Occupations by Sex
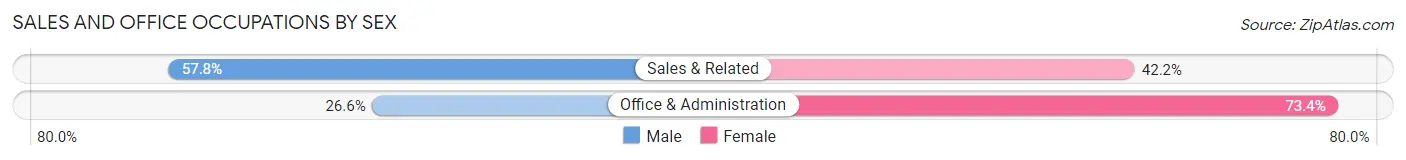
| Occupation | Male | Female |
| Sales & Related | 126 (57.8%) | 92 (42.2%) |
| Office & Administration | 53 (26.6%) | 146 (73.4%) |
| Total (Category) | 179 (42.9%) | 238 (57.1%) |
| Total (Overall) | 915 (47.6%) | 1,006 (52.4%) |
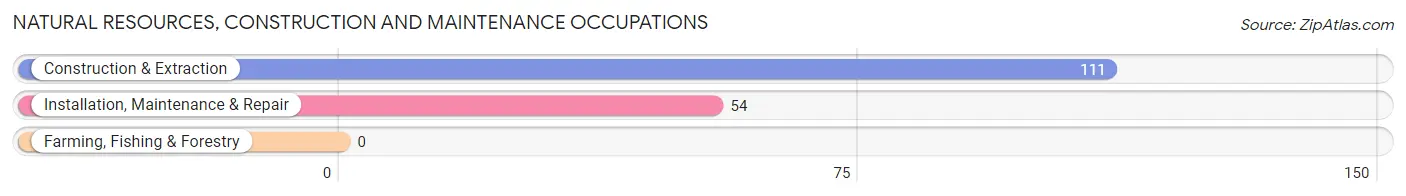
Natural Resources, Construction and Maintenance Occupations
The most common Natural Resources, Construction and Maintenance occupations in Wynantskill are Construction & Extraction (111 | 5.8%), and Installation, Maintenance & Repair (54 | 2.8%).
Natural Resources, Construction and Maintenance Occupations by Sex
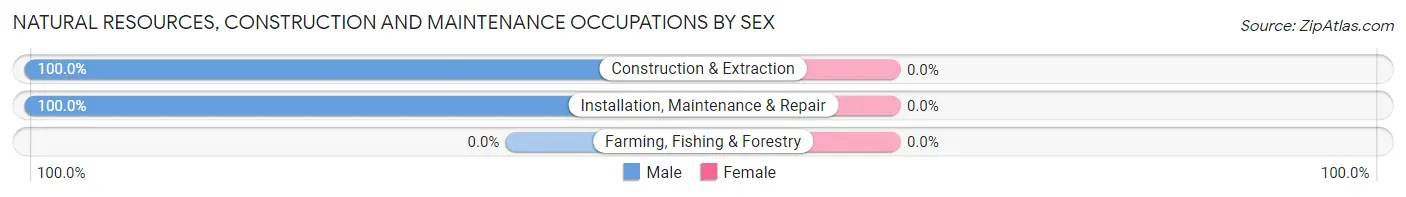
| Occupation | Male | Female |
| Farming, Fishing & Forestry | 0 (0.0%) | 0 (0.0%) |
| Construction & Extraction | 111 (100.0%) | 0 (0.0%) |
| Installation, Maintenance & Repair | 54 (100.0%) | 0 (0.0%) |
| Total (Category) | 165 (100.0%) | 0 (0.0%) |
| Total (Overall) | 915 (47.6%) | 1,006 (52.4%) |
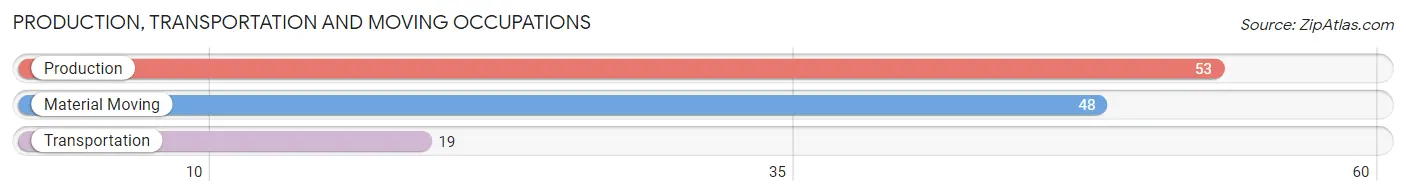
Production, Transportation and Moving Occupations
The most common Production, Transportation and Moving occupations in Wynantskill are Production (53 | 2.8%), Material Moving (48 | 2.5%), and Transportation (19 | 1.0%).
Production, Transportation and Moving Occupations by Sex
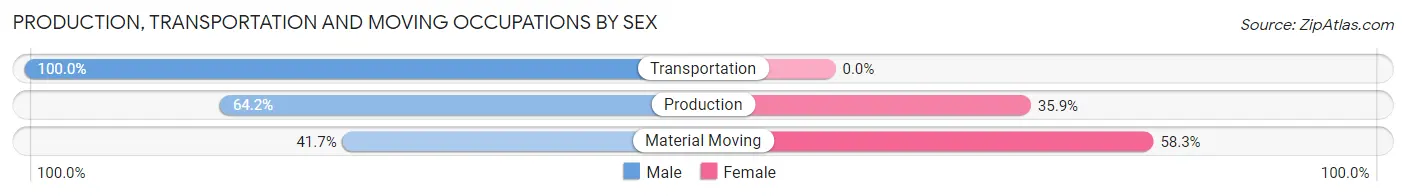
| Occupation | Male | Female |
| Production | 34 (64.1%) | 19 (35.8%) |
| Transportation | 19 (100.0%) | 0 (0.0%) |
| Material Moving | 20 (41.7%) | 28 (58.3%) |
| Total (Category) | 73 (60.8%) | 47 (39.2%) |
| Total (Overall) | 915 (47.6%) | 1,006 (52.4%) |
Employment Industries by Sex in Wynantskill
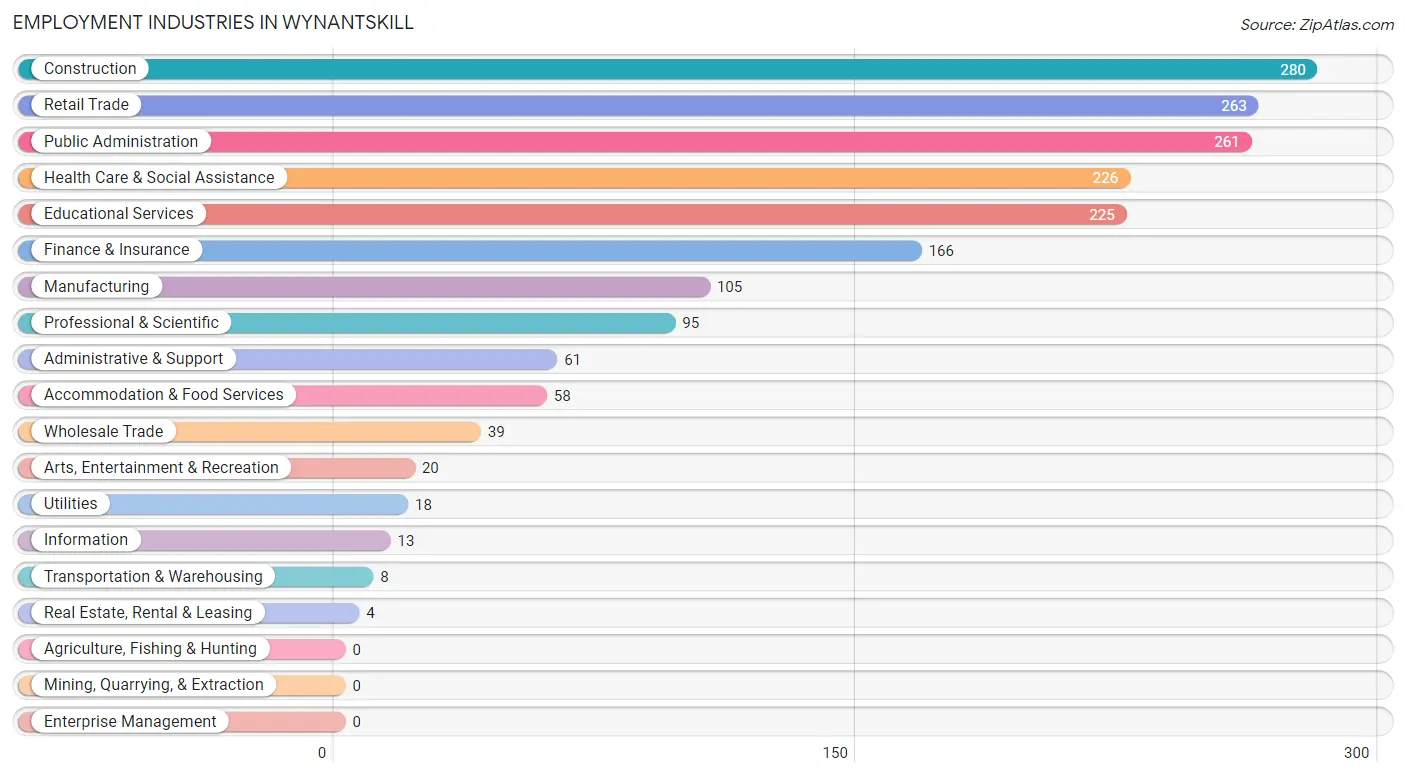
Employment Industries in Wynantskill
The major employment industries in Wynantskill include Construction (280 | 14.6%), Retail Trade (263 | 13.7%), Public Administration (261 | 13.6%), Health Care & Social Assistance (226 | 11.8%), and Educational Services (225 | 11.7%).
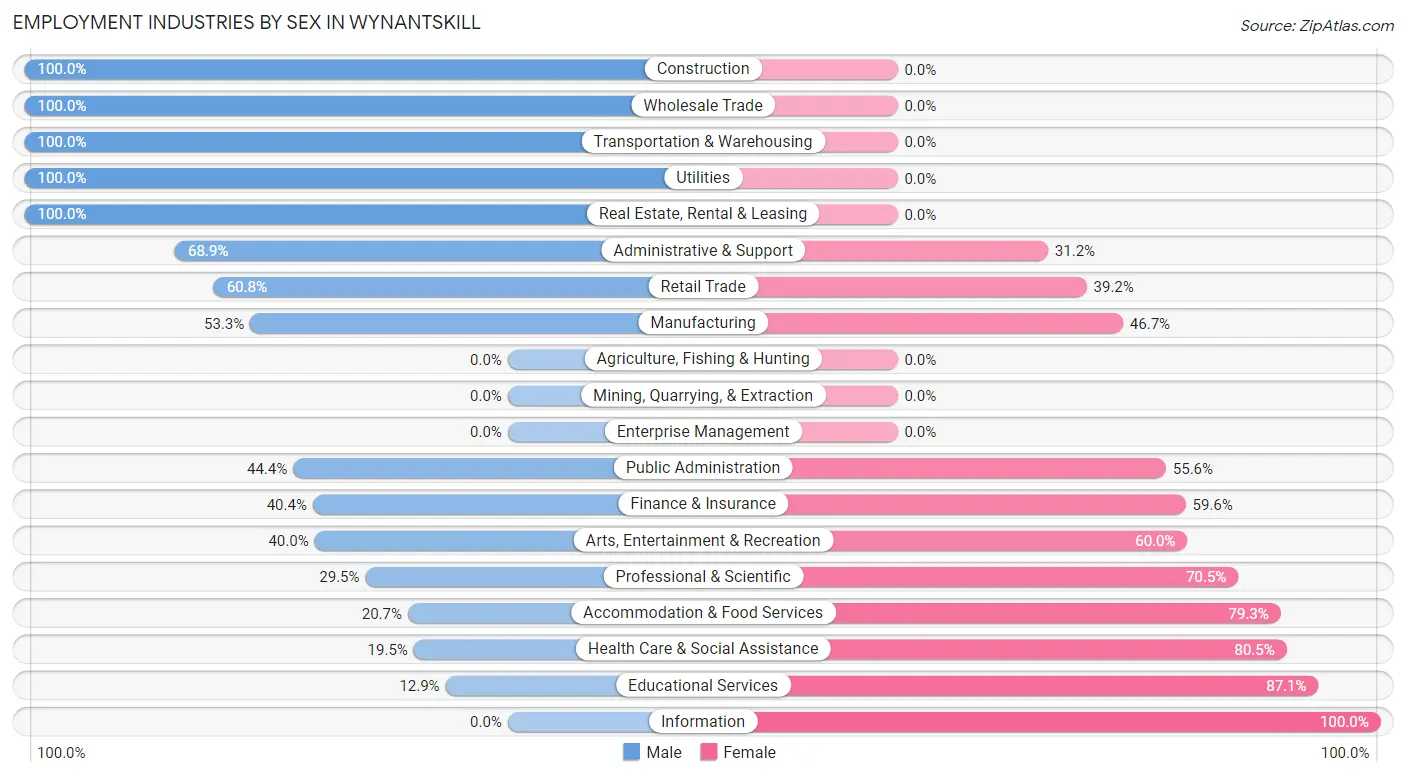
Employment Industries by Sex in Wynantskill
The Wynantskill industries that see more men than women are Construction (100.0%), Wholesale Trade (100.0%), and Transportation & Warehousing (100.0%), whereas the industries that tend to have a higher number of women are Information (100.0%), Educational Services (87.1%), and Health Care & Social Assistance (80.5%).
| Industry | Male | Female |
| Agriculture, Fishing & Hunting | 0 (0.0%) | 0 (0.0%) |
| Mining, Quarrying, & Extraction | 0 (0.0%) | 0 (0.0%) |
| Construction | 280 (100.0%) | 0 (0.0%) |
| Manufacturing | 56 (53.3%) | 49 (46.7%) |
| Wholesale Trade | 39 (100.0%) | 0 (0.0%) |
| Retail Trade | 160 (60.8%) | 103 (39.2%) |
| Transportation & Warehousing | 8 (100.0%) | 0 (0.0%) |
| Utilities | 18 (100.0%) | 0 (0.0%) |
| Information | 0 (0.0%) | 13 (100.0%) |
| Finance & Insurance | 67 (40.4%) | 99 (59.6%) |
| Real Estate, Rental & Leasing | 4 (100.0%) | 0 (0.0%) |
| Professional & Scientific | 28 (29.5%) | 67 (70.5%) |
| Enterprise Management | 0 (0.0%) | 0 (0.0%) |
| Administrative & Support | 42 (68.9%) | 19 (31.1%) |
| Educational Services | 29 (12.9%) | 196 (87.1%) |
| Health Care & Social Assistance | 44 (19.5%) | 182 (80.5%) |
| Arts, Entertainment & Recreation | 8 (40.0%) | 12 (60.0%) |
| Accommodation & Food Services | 12 (20.7%) | 46 (79.3%) |
| Public Administration | 116 (44.4%) | 145 (55.6%) |
| Total | 915 (47.6%) | 1,006 (52.4%) |
Education in Wynantskill
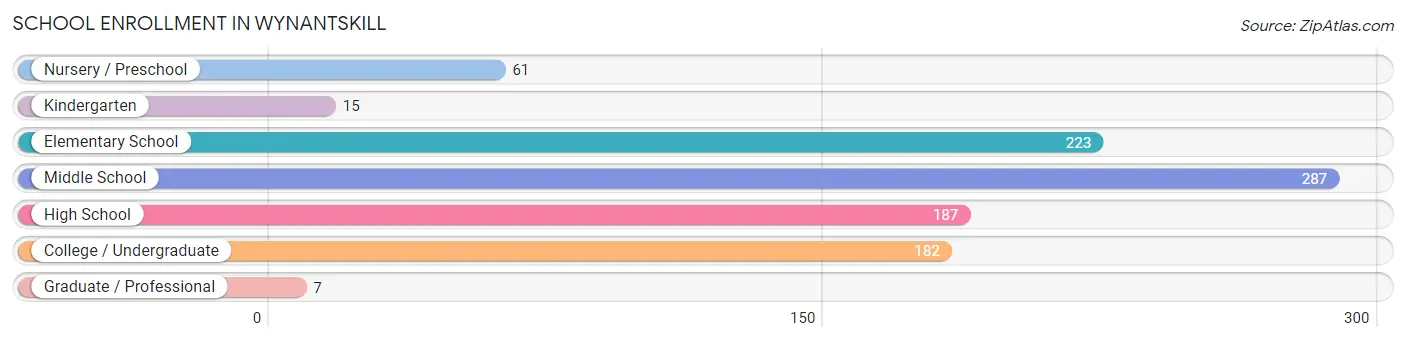
School Enrollment in Wynantskill
The most common levels of schooling among the 962 students in Wynantskill are middle school (287 | 29.8%), elementary school (223 | 23.2%), and high school (187 | 19.4%).
| School Level | # Students | % Students |
| Nursery / Preschool | 61 | 6.3% |
| Kindergarten | 15 | 1.6% |
| Elementary School | 223 | 23.2% |
| Middle School | 287 | 29.8% |
| High School | 187 | 19.4% |
| College / Undergraduate | 182 | 18.9% |
| Graduate / Professional | 7 | 0.7% |
| Total | 962 | 100.0% |
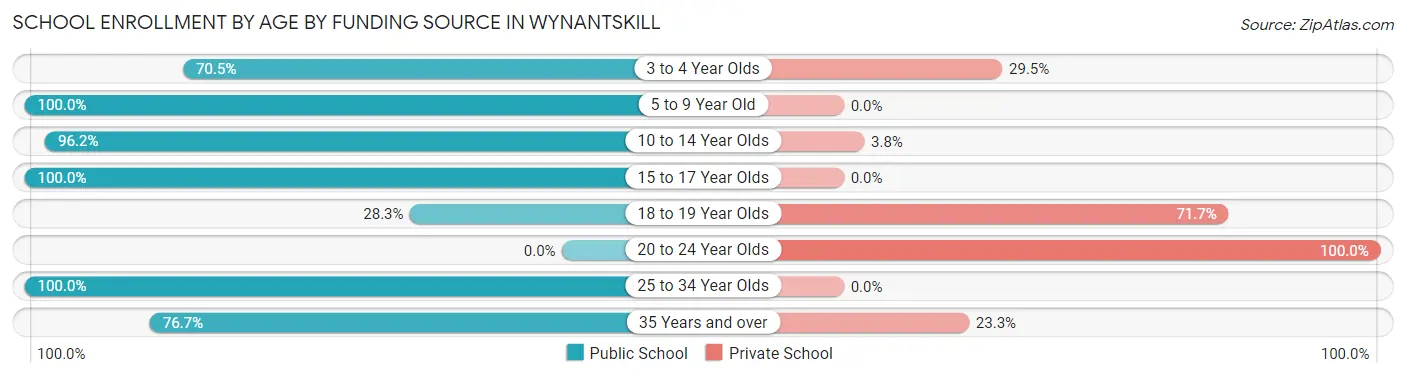
School Enrollment by Age by Funding Source in Wynantskill
Out of a total of 962 students who are enrolled in schools in Wynantskill, 104 (10.8%) attend a private institution, while the remaining 858 (89.2%) are enrolled in public schools. The age group of 20 to 24 year olds has the highest likelihood of being enrolled in private schools, with 21 (100.0% in the age bracket) enrolled. Conversely, the age group of 5 to 9 year old has the lowest likelihood of being enrolled in a private school, with 177 (100.0% in the age bracket) attending a public institution.
| Age Bracket | Public School | Private School |
| 3 to 4 Year Olds | 43 (70.5%) | 18 (29.5%) |
| 5 to 9 Year Old | 177 (100.0%) | 0 (0.0%) |
| 10 to 14 Year Olds | 379 (96.2%) | 15 (3.8%) |
| 15 to 17 Year Olds | 132 (100.0%) | 0 (0.0%) |
| 18 to 19 Year Olds | 17 (28.3%) | 43 (71.7%) |
| 20 to 24 Year Olds | 0 (0.0%) | 21 (100.0%) |
| 25 to 34 Year Olds | 87 (100.0%) | 0 (0.0%) |
| 35 Years and over | 23 (76.7%) | 7 (23.3%) |
| Total | 858 (89.2%) | 104 (10.8%) |
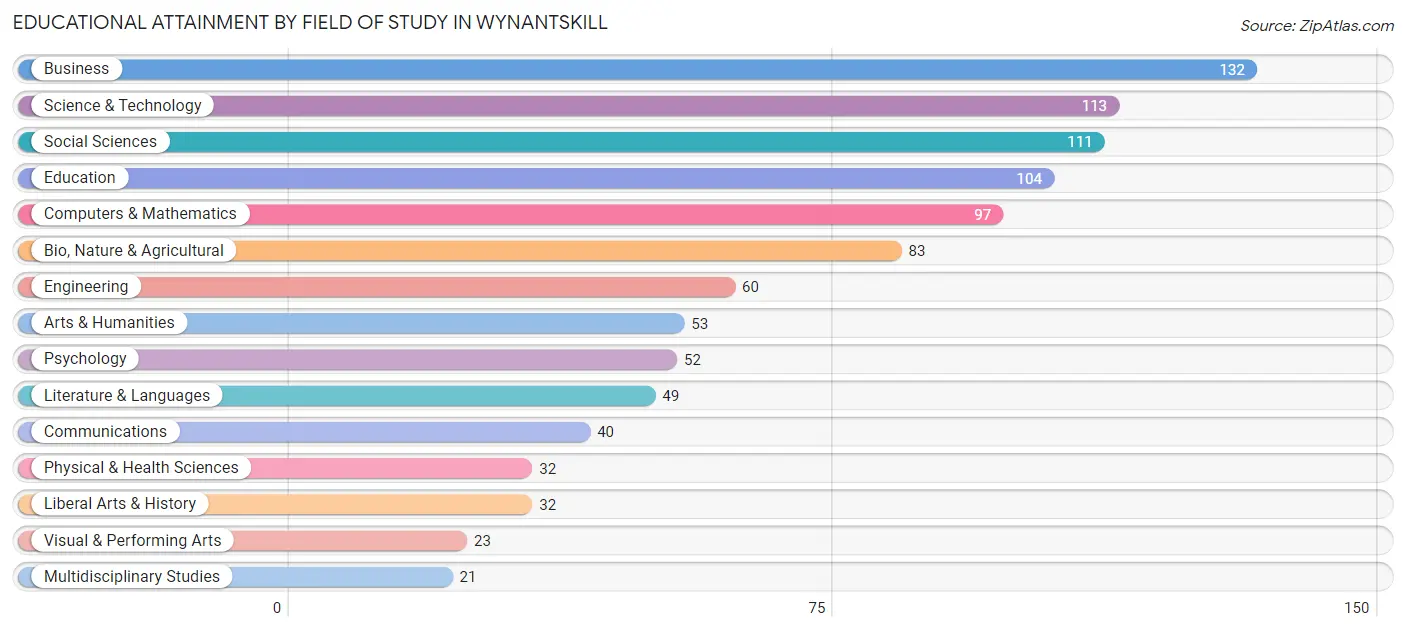
Educational Attainment by Field of Study in Wynantskill
Business (132 | 13.2%), science & technology (113 | 11.3%), social sciences (111 | 11.1%), education (104 | 10.4%), and computers & mathematics (97 | 9.7%) are the most common fields of study among 1,002 individuals in Wynantskill who have obtained a bachelor's degree or higher.
| Field of Study | # Graduates | % Graduates |
| Computers & Mathematics | 97 | 9.7% |
| Bio, Nature & Agricultural | 83 | 8.3% |
| Physical & Health Sciences | 32 | 3.2% |
| Psychology | 52 | 5.2% |
| Social Sciences | 111 | 11.1% |
| Engineering | 60 | 6.0% |
| Multidisciplinary Studies | 21 | 2.1% |
| Science & Technology | 113 | 11.3% |
| Business | 132 | 13.2% |
| Education | 104 | 10.4% |
| Literature & Languages | 49 | 4.9% |
| Liberal Arts & History | 32 | 3.2% |
| Visual & Performing Arts | 23 | 2.3% |
| Communications | 40 | 4.0% |
| Arts & Humanities | 53 | 5.3% |
| Total | 1,002 | 100.0% |
Transportation & Commute in Wynantskill
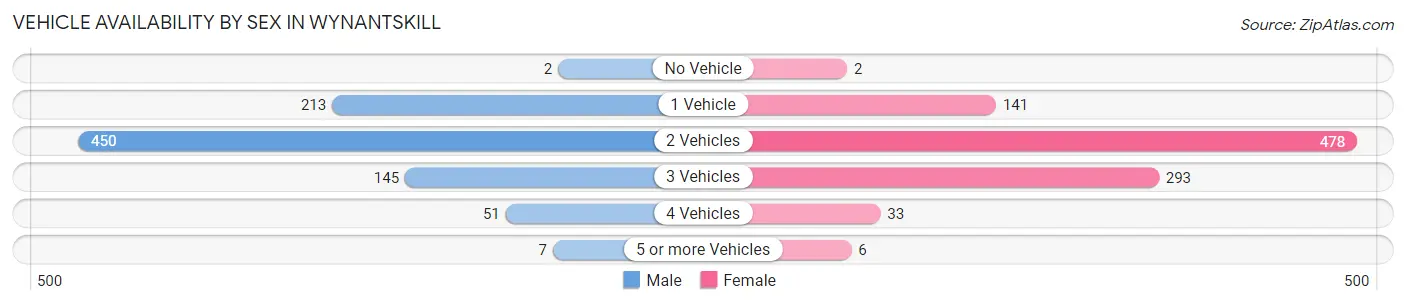
Vehicle Availability by Sex in Wynantskill
The most prevalent vehicle ownership categories in Wynantskill are males with 2 vehicles (450, accounting for 51.8%) and females with 2 vehicles (478, making up 47.2%).
| Vehicles Available | Male | Female |
| No Vehicle | 2 (0.2%) | 2 (0.2%) |
| 1 Vehicle | 213 (24.5%) | 141 (14.8%) |
| 2 Vehicles | 450 (51.8%) | 478 (50.2%) |
| 3 Vehicles | 145 (16.7%) | 293 (30.7%) |
| 4 Vehicles | 51 (5.9%) | 33 (3.5%) |
| 5 or more Vehicles | 7 (0.8%) | 6 (0.6%) |
| Total | 868 (100.0%) | 953 (100.0%) |
Commute Time in Wynantskill
The most frequently occuring commute durations in Wynantskill are 20 to 24 minutes (447 commuters, 30.5%), 15 to 19 minutes (289 commuters, 19.7%), and 25 to 29 minutes (248 commuters, 16.9%).
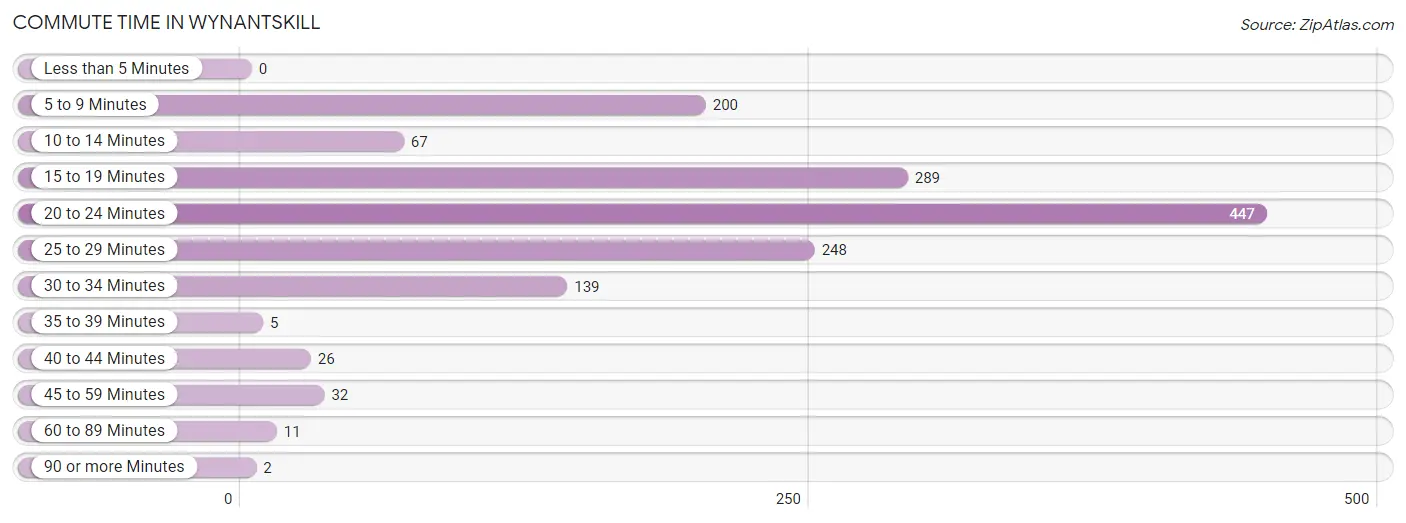
| Commute Time | # Commuters | % Commuters |
| Less than 5 Minutes | 0 | 0.0% |
| 5 to 9 Minutes | 200 | 13.6% |
| 10 to 14 Minutes | 67 | 4.6% |
| 15 to 19 Minutes | 289 | 19.7% |
| 20 to 24 Minutes | 447 | 30.5% |
| 25 to 29 Minutes | 248 | 16.9% |
| 30 to 34 Minutes | 139 | 9.5% |
| 35 to 39 Minutes | 5 | 0.3% |
| 40 to 44 Minutes | 26 | 1.8% |
| 45 to 59 Minutes | 32 | 2.2% |
| 60 to 89 Minutes | 11 | 0.7% |
| 90 or more Minutes | 2 | 0.1% |
Commute Time by Sex in Wynantskill
The most common commute times in Wynantskill are 20 to 24 minutes (211 commuters, 27.6%) for males and 20 to 24 minutes (236 commuters, 33.6%) for females.
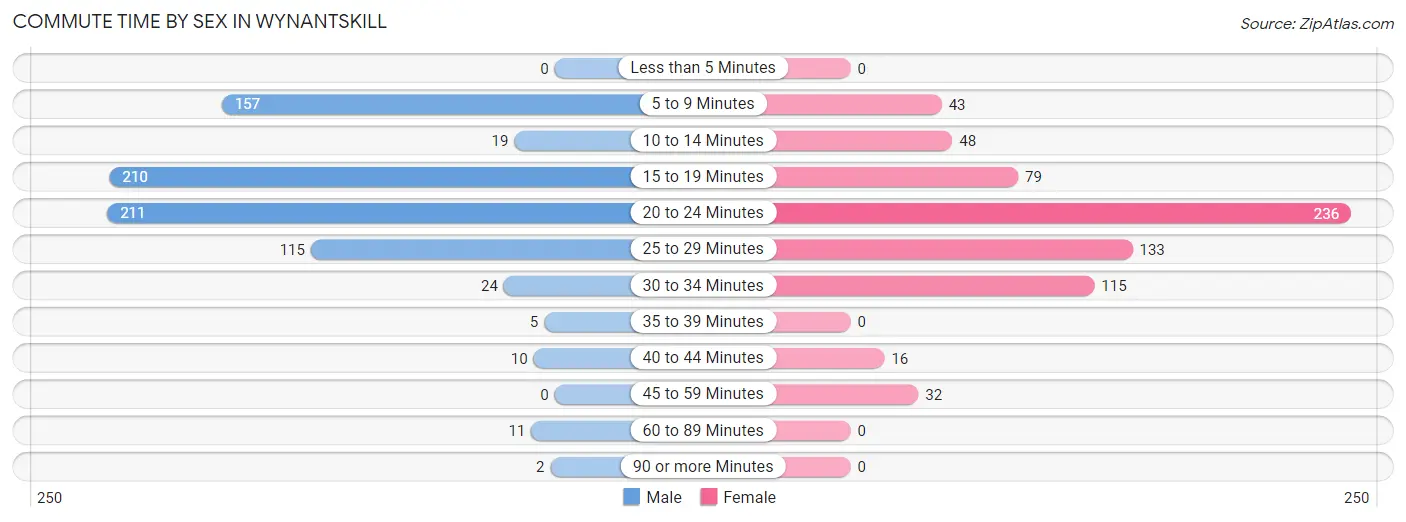
| Commute Time | Male | Female |
| Less than 5 Minutes | 0 (0.0%) | 0 (0.0%) |
| 5 to 9 Minutes | 157 (20.5%) | 43 (6.1%) |
| 10 to 14 Minutes | 19 (2.5%) | 48 (6.8%) |
| 15 to 19 Minutes | 210 (27.5%) | 79 (11.3%) |
| 20 to 24 Minutes | 211 (27.6%) | 236 (33.6%) |
| 25 to 29 Minutes | 115 (15.0%) | 133 (19.0%) |
| 30 to 34 Minutes | 24 (3.1%) | 115 (16.4%) |
| 35 to 39 Minutes | 5 (0.6%) | 0 (0.0%) |
| 40 to 44 Minutes | 10 (1.3%) | 16 (2.3%) |
| 45 to 59 Minutes | 0 (0.0%) | 32 (4.6%) |
| 60 to 89 Minutes | 11 (1.4%) | 0 (0.0%) |
| 90 or more Minutes | 2 (0.3%) | 0 (0.0%) |
Time of Departure to Work by Sex in Wynantskill
The most frequent times of departure to work in Wynantskill are 7:00 AM to 7:29 AM (164, 21.5%) for males and 7:30 AM to 7:59 AM (206, 29.3%) for females.
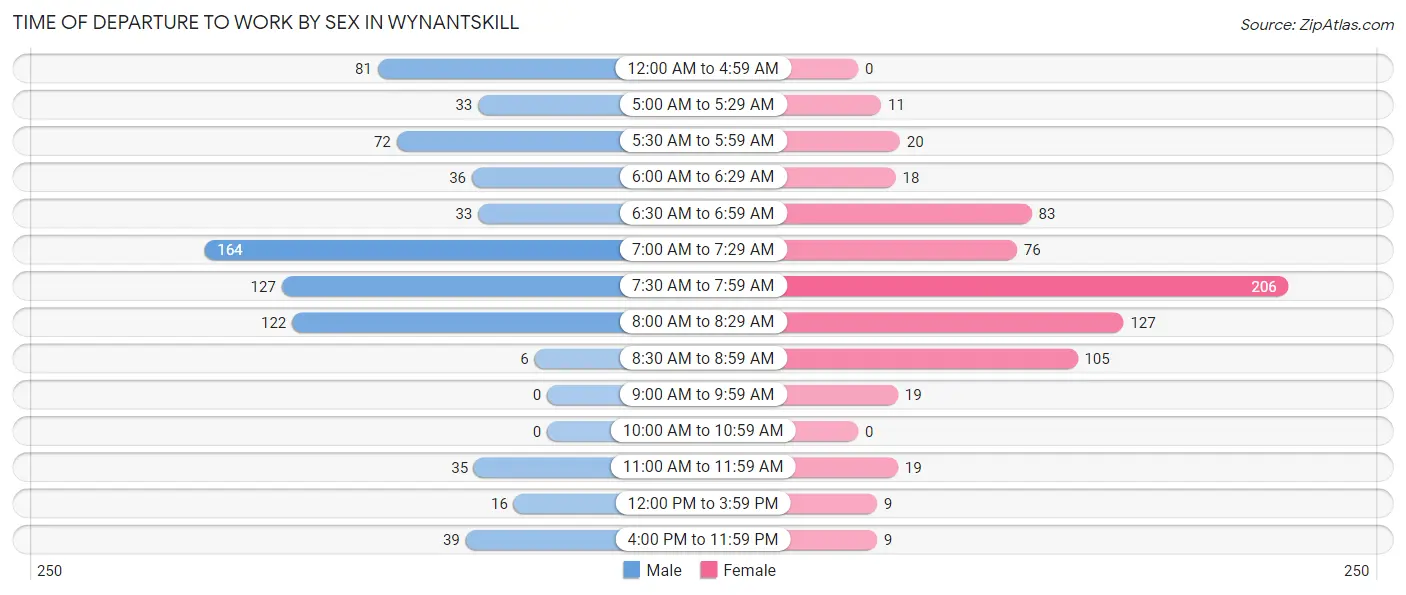
| Time of Departure | Male | Female |
| 12:00 AM to 4:59 AM | 81 (10.6%) | 0 (0.0%) |
| 5:00 AM to 5:29 AM | 33 (4.3%) | 11 (1.6%) |
| 5:30 AM to 5:59 AM | 72 (9.4%) | 20 (2.9%) |
| 6:00 AM to 6:29 AM | 36 (4.7%) | 18 (2.6%) |
| 6:30 AM to 6:59 AM | 33 (4.3%) | 83 (11.8%) |
| 7:00 AM to 7:29 AM | 164 (21.5%) | 76 (10.8%) |
| 7:30 AM to 7:59 AM | 127 (16.6%) | 206 (29.3%) |
| 8:00 AM to 8:29 AM | 122 (16.0%) | 127 (18.1%) |
| 8:30 AM to 8:59 AM | 6 (0.8%) | 105 (15.0%) |
| 9:00 AM to 9:59 AM | 0 (0.0%) | 19 (2.7%) |
| 10:00 AM to 10:59 AM | 0 (0.0%) | 0 (0.0%) |
| 11:00 AM to 11:59 AM | 35 (4.6%) | 19 (2.7%) |
| 12:00 PM to 3:59 PM | 16 (2.1%) | 9 (1.3%) |
| 4:00 PM to 11:59 PM | 39 (5.1%) | 9 (1.3%) |
| Total | 764 (100.0%) | 702 (100.0%) |
Housing Occupancy in Wynantskill
Occupancy by Ownership in Wynantskill
Of the total 1,532 dwellings in Wynantskill, owner-occupied units account for 1,170 (76.4%), while renter-occupied units make up 362 (23.6%).
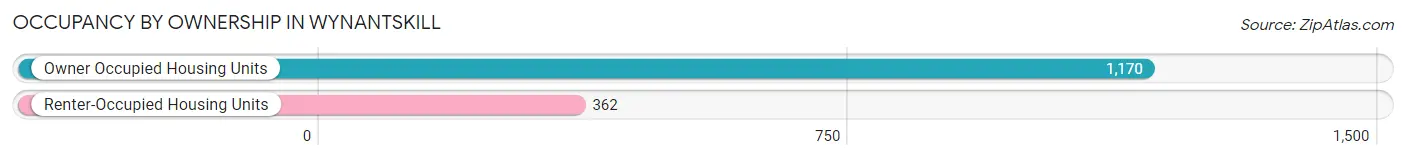
| Occupancy | # Housing Units | % Housing Units |
| Owner Occupied Housing Units | 1,170 | 76.4% |
| Renter-Occupied Housing Units | 362 | 23.6% |
| Total Occupied Housing Units | 1,532 | 100.0% |
Occupancy by Household Size in Wynantskill
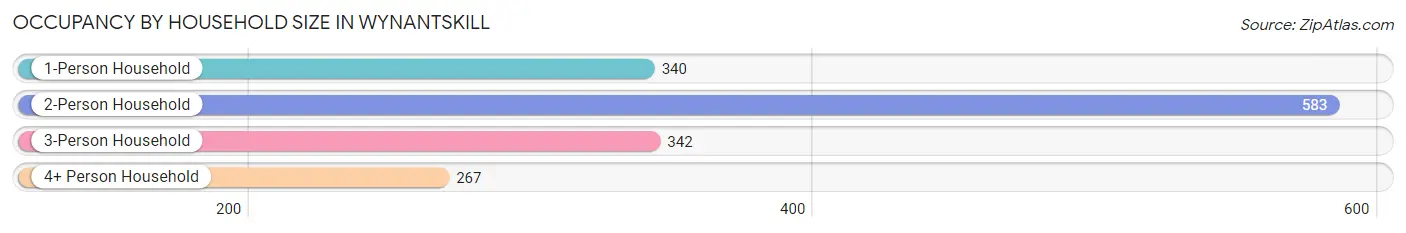
| Household Size | # Housing Units | % Housing Units |
| 1-Person Household | 340 | 22.2% |
| 2-Person Household | 583 | 38.1% |
| 3-Person Household | 342 | 22.3% |
| 4+ Person Household | 267 | 17.4% |
| Total Housing Units | 1,532 | 100.0% |
Occupancy by Ownership by Household Size in Wynantskill
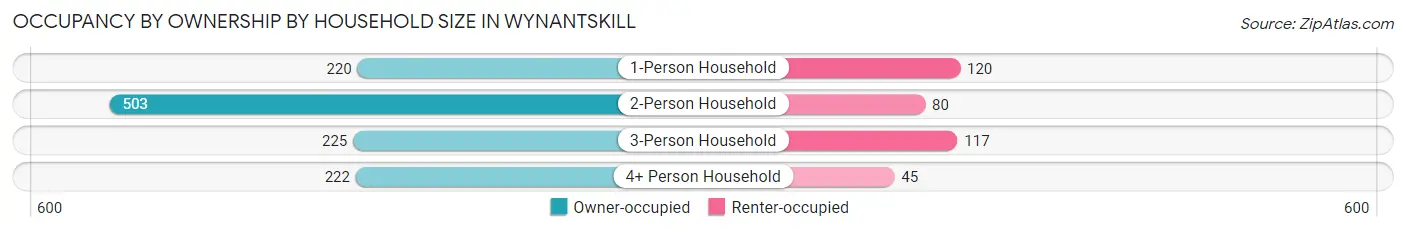
| Household Size | Owner-occupied | Renter-occupied |
| 1-Person Household | 220 (64.7%) | 120 (35.3%) |
| 2-Person Household | 503 (86.3%) | 80 (13.7%) |
| 3-Person Household | 225 (65.8%) | 117 (34.2%) |
| 4+ Person Household | 222 (83.2%) | 45 (16.9%) |
| Total Housing Units | 1,170 (76.4%) | 362 (23.6%) |
Occupancy by Educational Attainment in Wynantskill
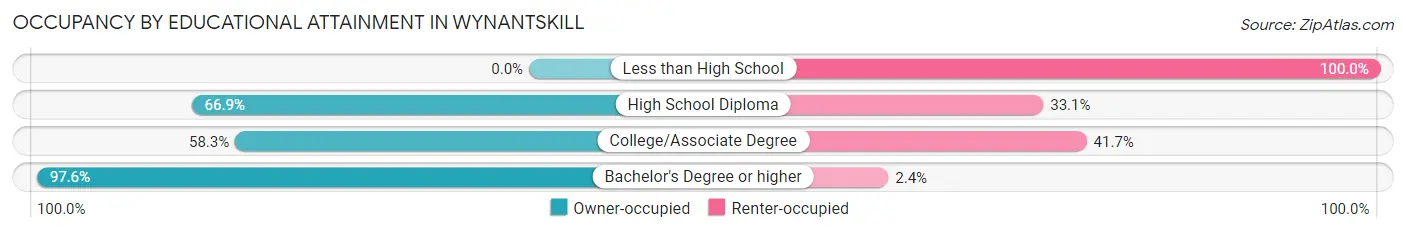
| Household Size | Owner-occupied | Renter-occupied |
| Less than High School | 0 (0.0%) | 17 (100.0%) |
| High School Diploma | 216 (66.9%) | 107 (33.1%) |
| College/Associate Degree | 310 (58.3%) | 222 (41.7%) |
| Bachelor's Degree or higher | 644 (97.6%) | 16 (2.4%) |
Occupancy by Age of Householder in Wynantskill
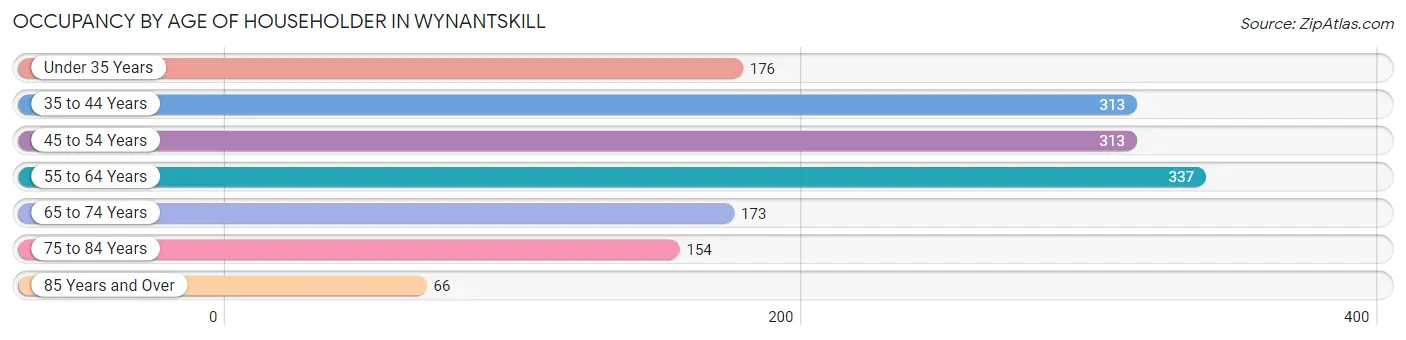
| Age Bracket | # Households | % Households |
| Under 35 Years | 176 | 11.5% |
| 35 to 44 Years | 313 | 20.4% |
| 45 to 54 Years | 313 | 20.4% |
| 55 to 64 Years | 337 | 22.0% |
| 65 to 74 Years | 173 | 11.3% |
| 75 to 84 Years | 154 | 10.1% |
| 85 Years and Over | 66 | 4.3% |
| Total | 1,532 | 100.0% |
Housing Finances in Wynantskill
Median Income by Occupancy in Wynantskill
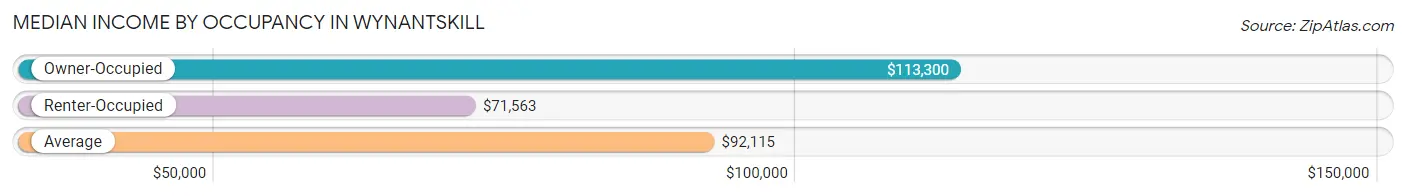
| Occupancy Type | # Households | Median Income |
| Owner-Occupied | 1,170 (76.4%) | $113,300 |
| Renter-Occupied | 362 (23.6%) | $71,563 |
| Average | 1,532 (100.0%) | $92,115 |
Occupancy by Householder Income Bracket in Wynantskill
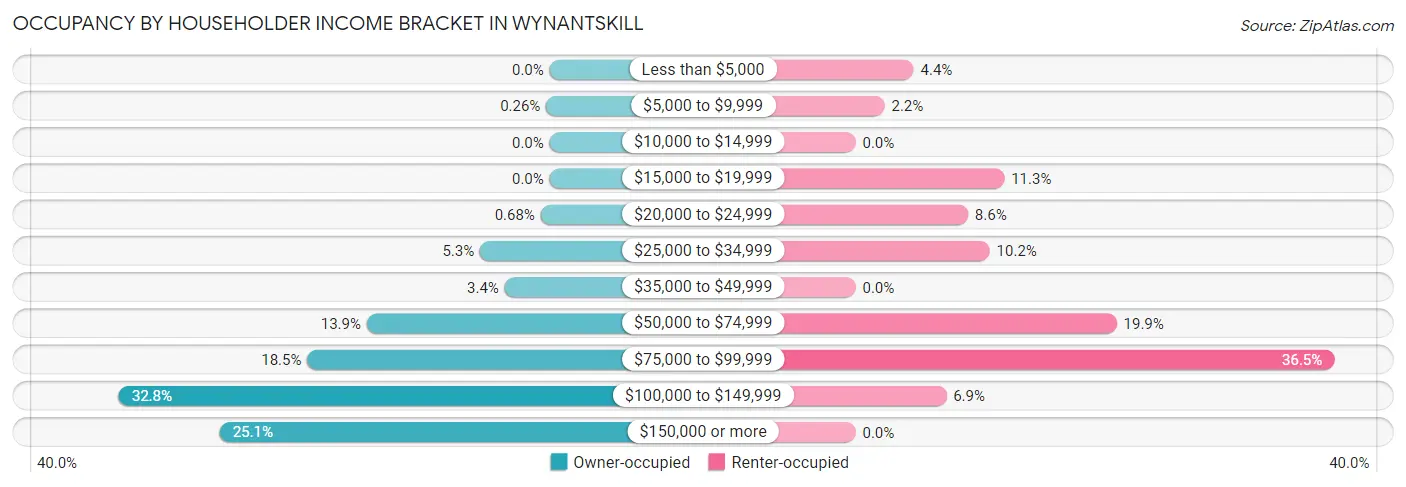
| Income Bracket | Owner-occupied | Renter-occupied |
| Less than $5,000 | 0 (0.0%) | 16 (4.4%) |
| $5,000 to $9,999 | 3 (0.3%) | 8 (2.2%) |
| $10,000 to $14,999 | 0 (0.0%) | 0 (0.0%) |
| $15,000 to $19,999 | 0 (0.0%) | 41 (11.3%) |
| $20,000 to $24,999 | 8 (0.7%) | 31 (8.6%) |
| $25,000 to $34,999 | 62 (5.3%) | 37 (10.2%) |
| $35,000 to $49,999 | 40 (3.4%) | 0 (0.0%) |
| $50,000 to $74,999 | 163 (13.9%) | 72 (19.9%) |
| $75,000 to $99,999 | 216 (18.5%) | 132 (36.5%) |
| $100,000 to $149,999 | 384 (32.8%) | 25 (6.9%) |
| $150,000 or more | 294 (25.1%) | 0 (0.0%) |
| Total | 1,170 (100.0%) | 362 (100.0%) |
Monthly Housing Cost Tiers in Wynantskill
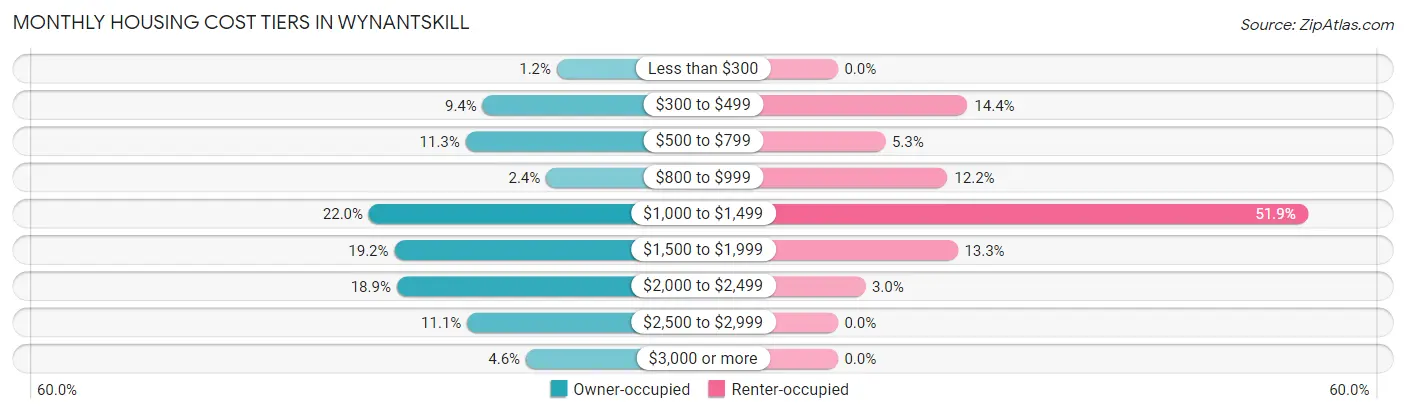
| Monthly Cost | Owner-occupied | Renter-occupied |
| Less than $300 | 14 (1.2%) | 0 (0.0%) |
| $300 to $499 | 110 (9.4%) | 52 (14.4%) |
| $500 to $799 | 132 (11.3%) | 19 (5.2%) |
| $800 to $999 | 28 (2.4%) | 44 (12.1%) |
| $1,000 to $1,499 | 257 (22.0%) | 188 (51.9%) |
| $1,500 to $1,999 | 224 (19.2%) | 48 (13.3%) |
| $2,000 to $2,499 | 221 (18.9%) | 11 (3.0%) |
| $2,500 to $2,999 | 130 (11.1%) | 0 (0.0%) |
| $3,000 or more | 54 (4.6%) | 0 (0.0%) |
| Total | 1,170 (100.0%) | 362 (100.0%) |
Physical Housing Characteristics in Wynantskill
Housing Structures in Wynantskill
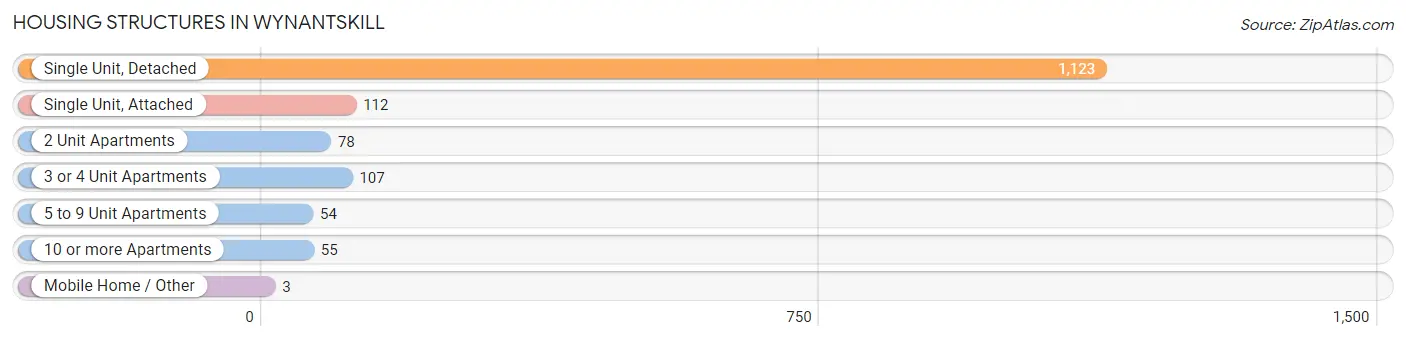
| Structure Type | # Housing Units | % Housing Units |
| Single Unit, Detached | 1,123 | 73.3% |
| Single Unit, Attached | 112 | 7.3% |
| 2 Unit Apartments | 78 | 5.1% |
| 3 or 4 Unit Apartments | 107 | 7.0% |
| 5 to 9 Unit Apartments | 54 | 3.5% |
| 10 or more Apartments | 55 | 3.6% |
| Mobile Home / Other | 3 | 0.2% |
| Total | 1,532 | 100.0% |
Housing Structures by Occupancy in Wynantskill
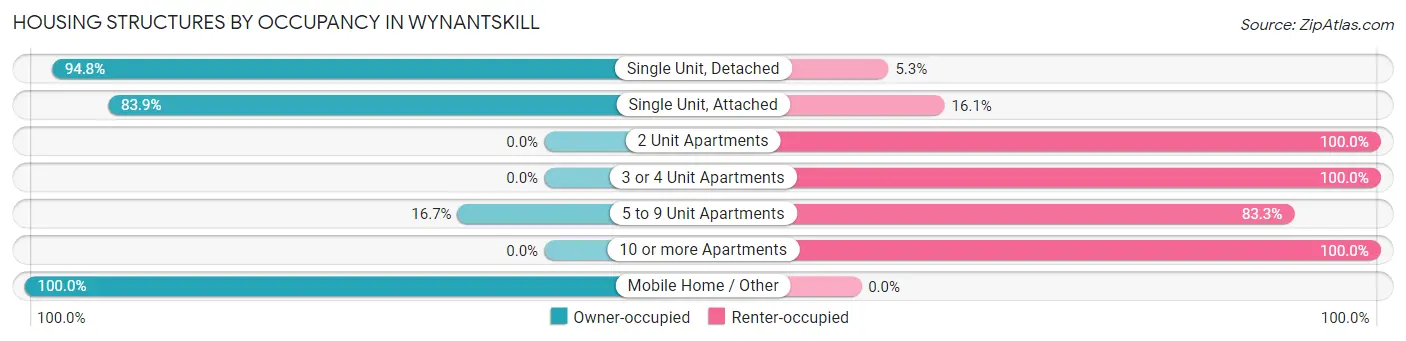
| Structure Type | Owner-occupied | Renter-occupied |
| Single Unit, Detached | 1,064 (94.8%) | 59 (5.2%) |
| Single Unit, Attached | 94 (83.9%) | 18 (16.1%) |
| 2 Unit Apartments | 0 (0.0%) | 78 (100.0%) |
| 3 or 4 Unit Apartments | 0 (0.0%) | 107 (100.0%) |
| 5 to 9 Unit Apartments | 9 (16.7%) | 45 (83.3%) |
| 10 or more Apartments | 0 (0.0%) | 55 (100.0%) |
| Mobile Home / Other | 3 (100.0%) | 0 (0.0%) |
| Total | 1,170 (76.4%) | 362 (23.6%) |
Housing Structures by Number of Rooms in Wynantskill
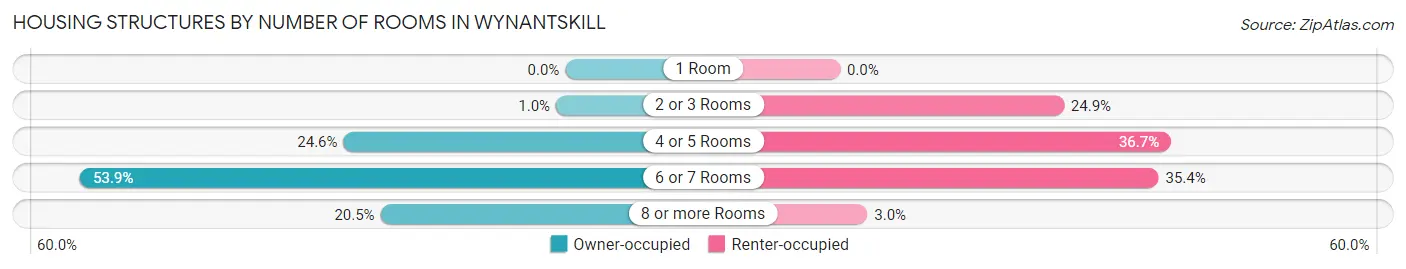
| Number of Rooms | Owner-occupied | Renter-occupied |
| 1 Room | 0 (0.0%) | 0 (0.0%) |
| 2 or 3 Rooms | 12 (1.0%) | 90 (24.9%) |
| 4 or 5 Rooms | 288 (24.6%) | 133 (36.7%) |
| 6 or 7 Rooms | 630 (53.8%) | 128 (35.4%) |
| 8 or more Rooms | 240 (20.5%) | 11 (3.0%) |
| Total | 1,170 (100.0%) | 362 (100.0%) |
Housing Structure by Heating Type in Wynantskill
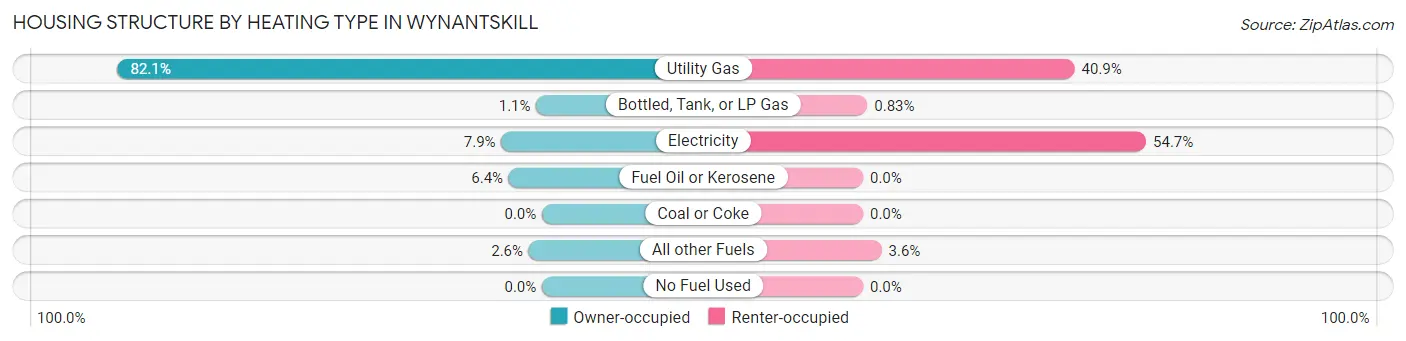
| Heating Type | Owner-occupied | Renter-occupied |
| Utility Gas | 960 (82.1%) | 148 (40.9%) |
| Bottled, Tank, or LP Gas | 13 (1.1%) | 3 (0.8%) |
| Electricity | 92 (7.9%) | 198 (54.7%) |
| Fuel Oil or Kerosene | 75 (6.4%) | 0 (0.0%) |
| Coal or Coke | 0 (0.0%) | 0 (0.0%) |
| All other Fuels | 30 (2.6%) | 13 (3.6%) |
| No Fuel Used | 0 (0.0%) | 0 (0.0%) |
| Total | 1,170 (100.0%) | 362 (100.0%) |
Household Vehicle Usage in Wynantskill
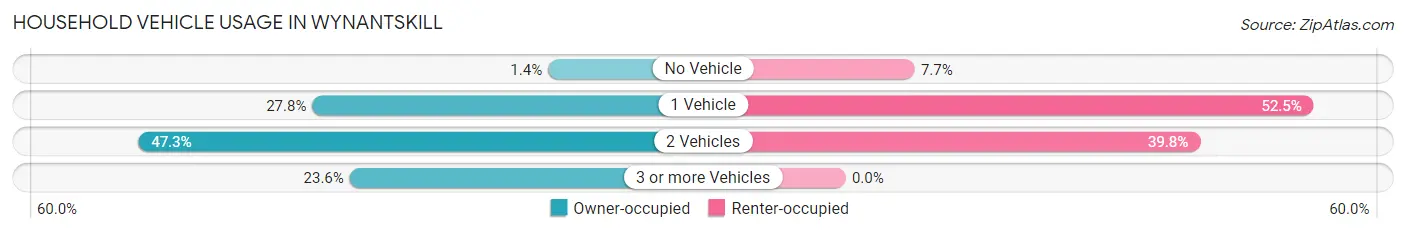
| Vehicles per Household | Owner-occupied | Renter-occupied |
| No Vehicle | 16 (1.4%) | 28 (7.7%) |
| 1 Vehicle | 325 (27.8%) | 190 (52.5%) |
| 2 Vehicles | 553 (47.3%) | 144 (39.8%) |
| 3 or more Vehicles | 276 (23.6%) | 0 (0.0%) |
| Total | 1,170 (100.0%) | 362 (100.0%) |
Real Estate & Mortgages in Wynantskill
Real Estate and Mortgage Overview in Wynantskill
| Characteristic | Without Mortgage | With Mortgage |
| Housing Units | 337 | 833 |
| Median Property Value | $235,700 | $276,300 |
| Median Household Income | $83,365 | $259 |
| Monthly Housing Costs | $619 | $54 |
| Real Estate Taxes | $3,651 | $30 |
Property Value by Mortgage Status in Wynantskill
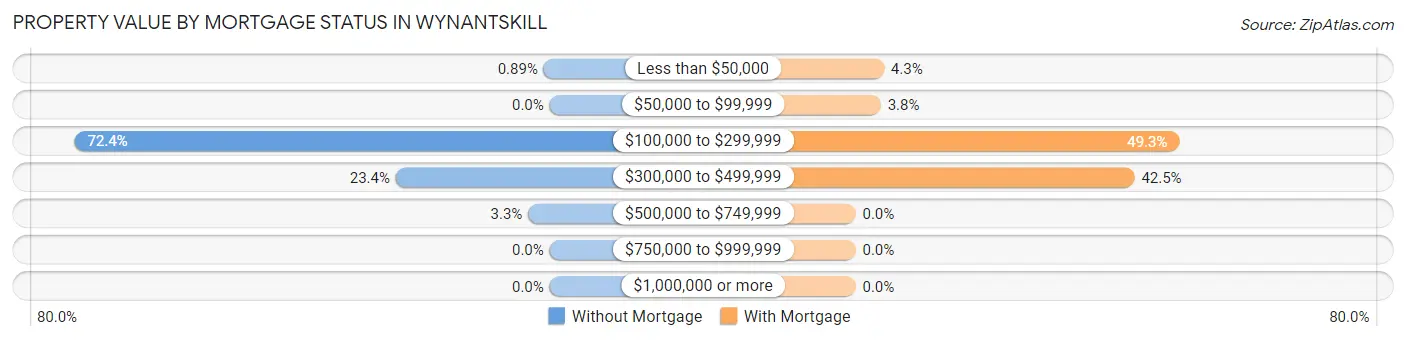
| Property Value | Without Mortgage | With Mortgage |
| Less than $50,000 | 3 (0.9%) | 36 (4.3%) |
| $50,000 to $99,999 | 0 (0.0%) | 32 (3.8%) |
| $100,000 to $299,999 | 244 (72.4%) | 411 (49.3%) |
| $300,000 to $499,999 | 79 (23.4%) | 354 (42.5%) |
| $500,000 to $749,999 | 11 (3.3%) | 0 (0.0%) |
| $750,000 to $999,999 | 0 (0.0%) | 0 (0.0%) |
| $1,000,000 or more | 0 (0.0%) | 0 (0.0%) |
| Total | 337 (100.0%) | 833 (100.0%) |
Household Income by Mortgage Status in Wynantskill
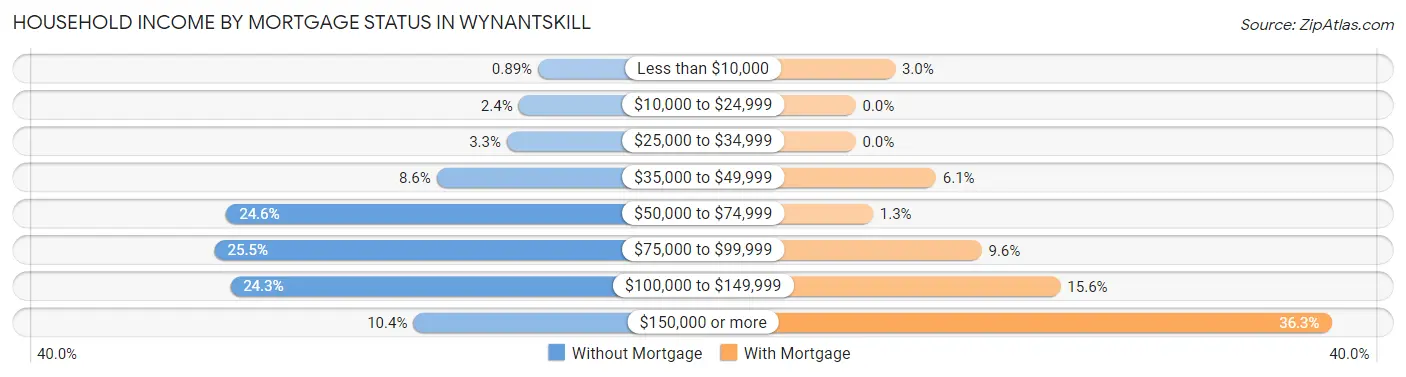
| Household Income | Without Mortgage | With Mortgage |
| Less than $10,000 | 3 (0.9%) | 25 (3.0%) |
| $10,000 to $24,999 | 8 (2.4%) | 0 (0.0%) |
| $25,000 to $34,999 | 11 (3.3%) | 0 (0.0%) |
| $35,000 to $49,999 | 29 (8.6%) | 51 (6.1%) |
| $50,000 to $74,999 | 83 (24.6%) | 11 (1.3%) |
| $75,000 to $99,999 | 86 (25.5%) | 80 (9.6%) |
| $100,000 to $149,999 | 82 (24.3%) | 130 (15.6%) |
| $150,000 or more | 35 (10.4%) | 302 (36.2%) |
| Total | 337 (100.0%) | 833 (100.0%) |
Property Value to Household Income Ratio in Wynantskill
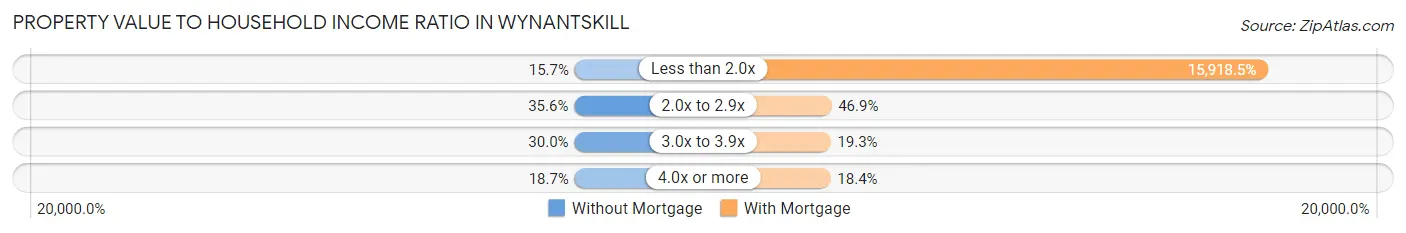
| Value-to-Income Ratio | Without Mortgage | With Mortgage |
| Less than 2.0x | 53 (15.7%) | 132,601 (15,918.5%) |
| 2.0x to 2.9x | 120 (35.6%) | 391 (46.9%) |
| 3.0x to 3.9x | 101 (30.0%) | 161 (19.3%) |
| 4.0x or more | 63 (18.7%) | 153 (18.4%) |
| Total | 337 (100.0%) | 833 (100.0%) |
Real Estate Taxes by Mortgage Status in Wynantskill
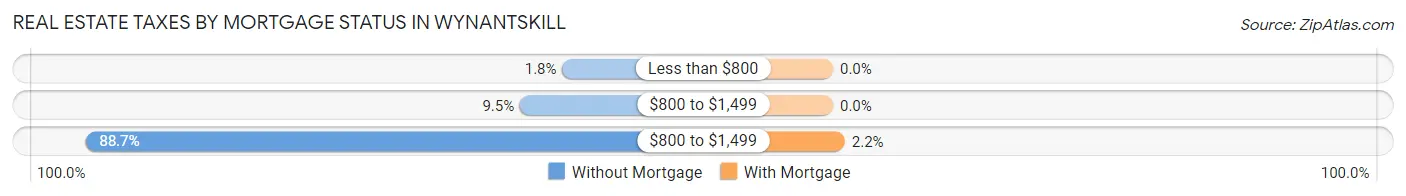
| Property Taxes | Without Mortgage | With Mortgage |
| Less than $800 | 6 (1.8%) | 0 (0.0%) |
| $800 to $1,499 | 32 (9.5%) | 0 (0.0%) |
| $800 to $1,499 | 299 (88.7%) | 18 (2.2%) |
| Total | 337 (100.0%) | 833 (100.0%) |
Health & Disability in Wynantskill
Health Insurance Coverage by Age in Wynantskill
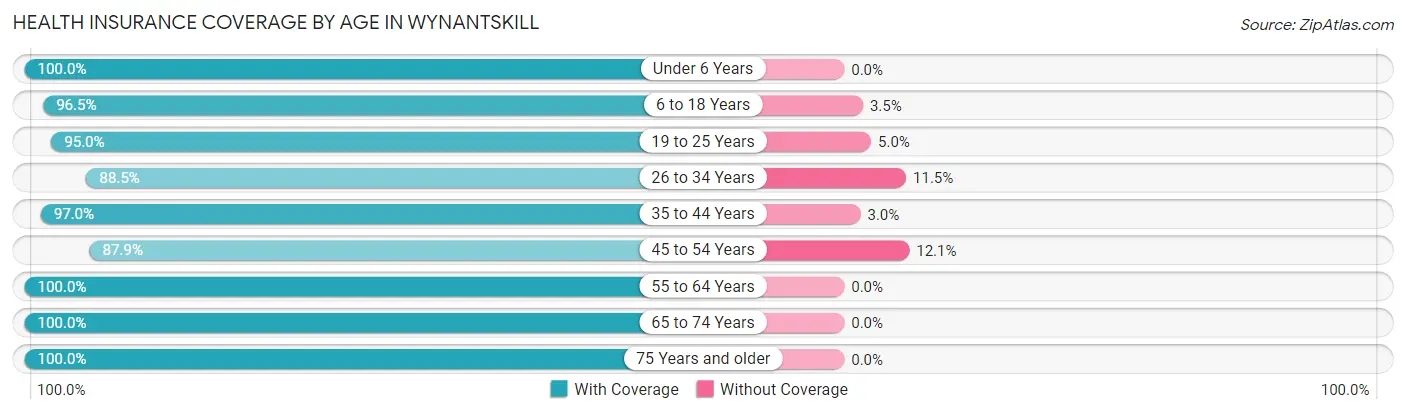
| Age Bracket | With Coverage | Without Coverage |
| Under 6 Years | 154 (100.0%) | 0 (0.0%) |
| 6 to 18 Years | 694 (96.5%) | 25 (3.5%) |
| 19 to 25 Years | 152 (95.0%) | 8 (5.0%) |
| 26 to 34 Years | 261 (88.5%) | 34 (11.5%) |
| 35 to 44 Years | 512 (97.0%) | 16 (3.0%) |
| 45 to 54 Years | 515 (87.9%) | 71 (12.1%) |
| 55 to 64 Years | 517 (100.0%) | 0 (0.0%) |
| 65 to 74 Years | 386 (100.0%) | 0 (0.0%) |
| 75 Years and older | 338 (100.0%) | 0 (0.0%) |
| Total | 3,529 (95.8%) | 154 (4.2%) |
Health Insurance Coverage by Citizenship Status in Wynantskill
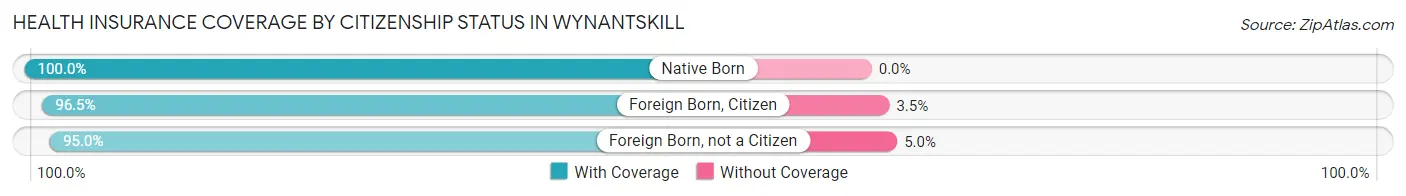
| Citizenship Status | With Coverage | Without Coverage |
| Native Born | 154 (100.0%) | 0 (0.0%) |
| Foreign Born, Citizen | 694 (96.5%) | 25 (3.5%) |
| Foreign Born, not a Citizen | 152 (95.0%) | 8 (5.0%) |
Health Insurance Coverage by Household Income in Wynantskill
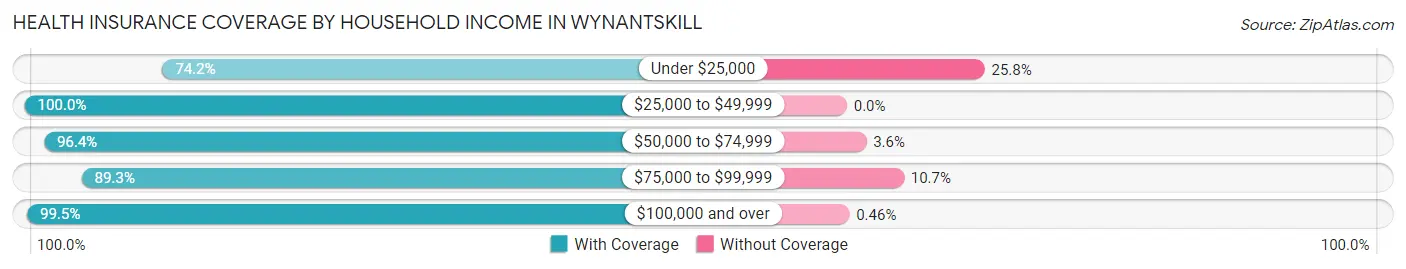
| Household Income | With Coverage | Without Coverage |
| Under $25,000 | 92 (74.2%) | 32 (25.8%) |
| $25,000 to $49,999 | 252 (100.0%) | 0 (0.0%) |
| $50,000 to $74,999 | 425 (96.4%) | 16 (3.6%) |
| $75,000 to $99,999 | 811 (89.3%) | 97 (10.7%) |
| $100,000 and over | 1,949 (99.5%) | 9 (0.5%) |
Public vs Private Health Insurance Coverage by Age in Wynantskill
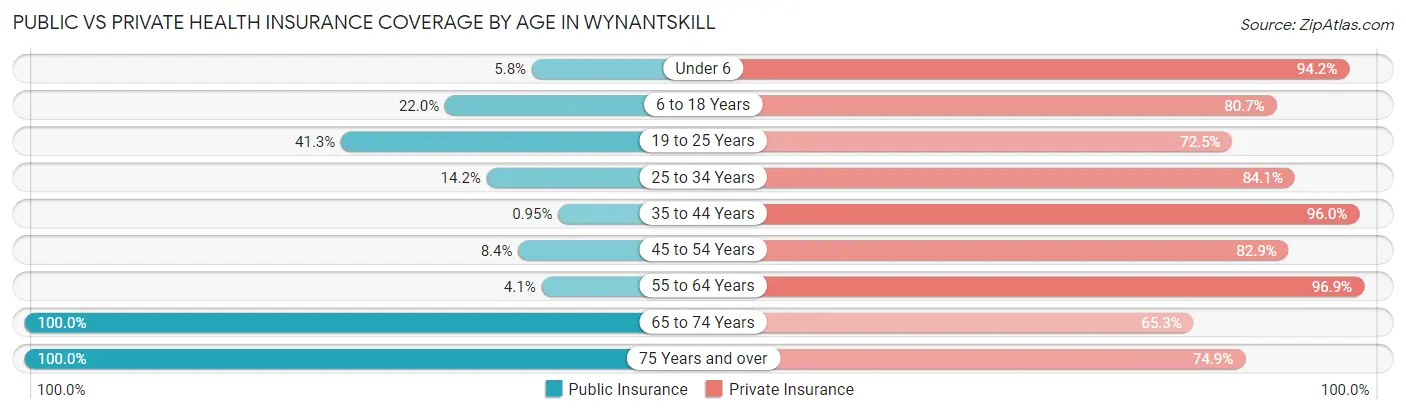
| Age Bracket | Public Insurance | Private Insurance |
| Under 6 | 9 (5.8%) | 145 (94.2%) |
| 6 to 18 Years | 158 (22.0%) | 580 (80.7%) |
| 19 to 25 Years | 66 (41.2%) | 116 (72.5%) |
| 25 to 34 Years | 42 (14.2%) | 248 (84.1%) |
| 35 to 44 Years | 5 (0.9%) | 507 (96.0%) |
| 45 to 54 Years | 49 (8.4%) | 486 (82.9%) |
| 55 to 64 Years | 21 (4.1%) | 501 (96.9%) |
| 65 to 74 Years | 386 (100.0%) | 252 (65.3%) |
| 75 Years and over | 338 (100.0%) | 253 (74.9%) |
| Total | 1,074 (29.2%) | 3,088 (83.8%) |
Disability Status by Sex by Age in Wynantskill
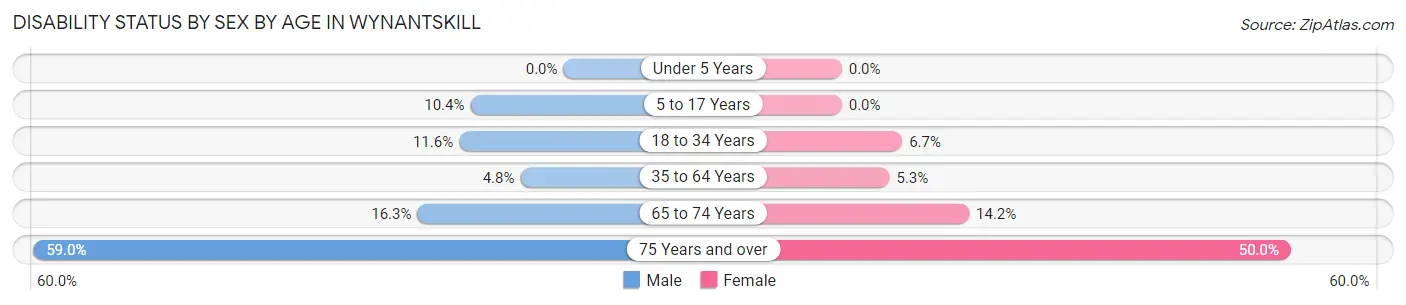
| Age Bracket | Male | Female |
| Under 5 Years | 0 (0.0%) | 0 (0.0%) |
| 5 to 17 Years | 29 (10.4%) | 0 (0.0%) |
| 18 to 34 Years | 28 (11.6%) | 15 (6.7%) |
| 35 to 64 Years | 34 (4.8%) | 49 (5.3%) |
| 65 to 74 Years | 41 (16.3%) | 19 (14.2%) |
| 75 Years and over | 98 (59.0%) | 86 (50.0%) |
Disability Class by Sex by Age in Wynantskill
Disability Class: Hearing Difficulty
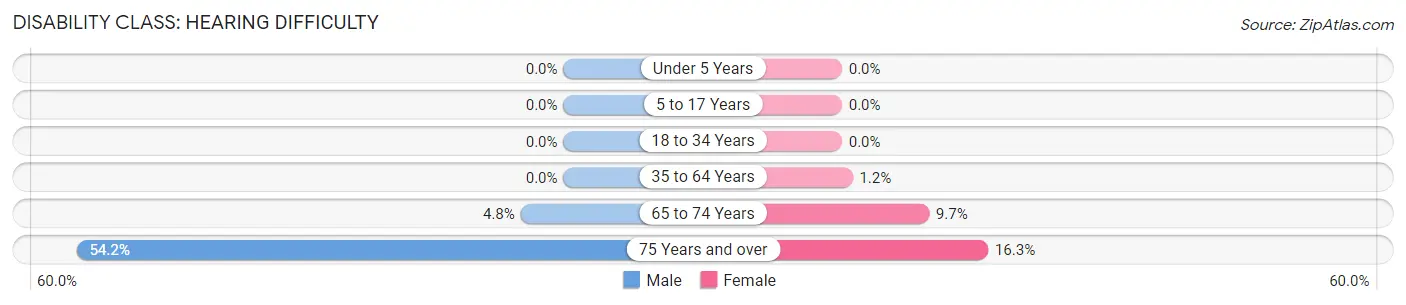
| Age Bracket | Male | Female |
| Under 5 Years | 0 (0.0%) | 0 (0.0%) |
| 5 to 17 Years | 0 (0.0%) | 0 (0.0%) |
| 18 to 34 Years | 0 (0.0%) | 0 (0.0%) |
| 35 to 64 Years | 0 (0.0%) | 11 (1.2%) |
| 65 to 74 Years | 12 (4.8%) | 13 (9.7%) |
| 75 Years and over | 90 (54.2%) | 28 (16.3%) |
Disability Class: Vision Difficulty
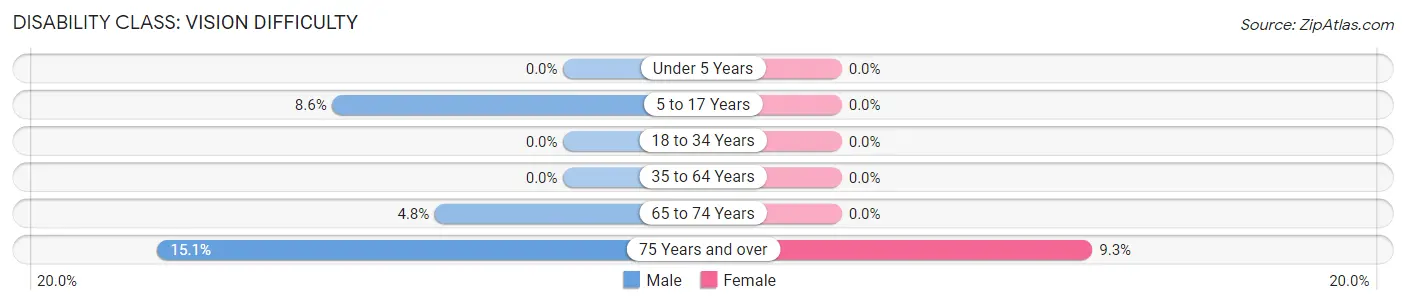
| Age Bracket | Male | Female |
| Under 5 Years | 0 (0.0%) | 0 (0.0%) |
| 5 to 17 Years | 24 (8.6%) | 0 (0.0%) |
| 18 to 34 Years | 0 (0.0%) | 0 (0.0%) |
| 35 to 64 Years | 0 (0.0%) | 0 (0.0%) |
| 65 to 74 Years | 12 (4.8%) | 0 (0.0%) |
| 75 Years and over | 25 (15.1%) | 16 (9.3%) |
Disability Class: Cognitive Difficulty
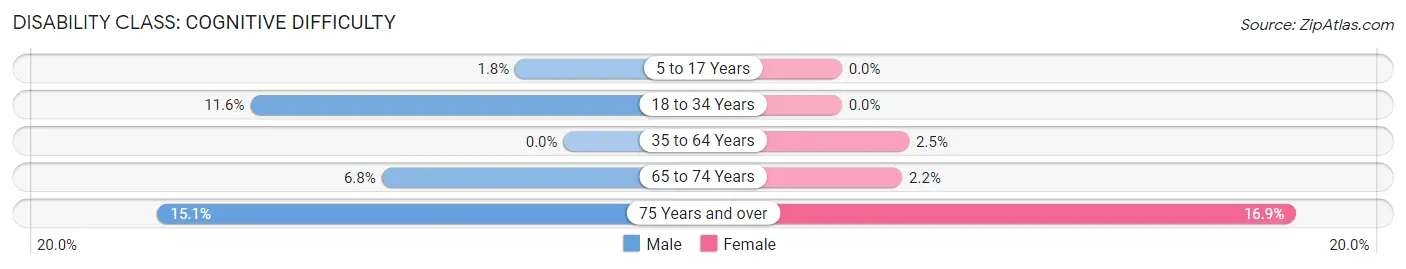
| Age Bracket | Male | Female |
| 5 to 17 Years | 5 (1.8%) | 0 (0.0%) |
| 18 to 34 Years | 28 (11.6%) | 0 (0.0%) |
| 35 to 64 Years | 0 (0.0%) | 23 (2.5%) |
| 65 to 74 Years | 17 (6.8%) | 3 (2.2%) |
| 75 Years and over | 25 (15.1%) | 29 (16.9%) |
Disability Class: Ambulatory Difficulty
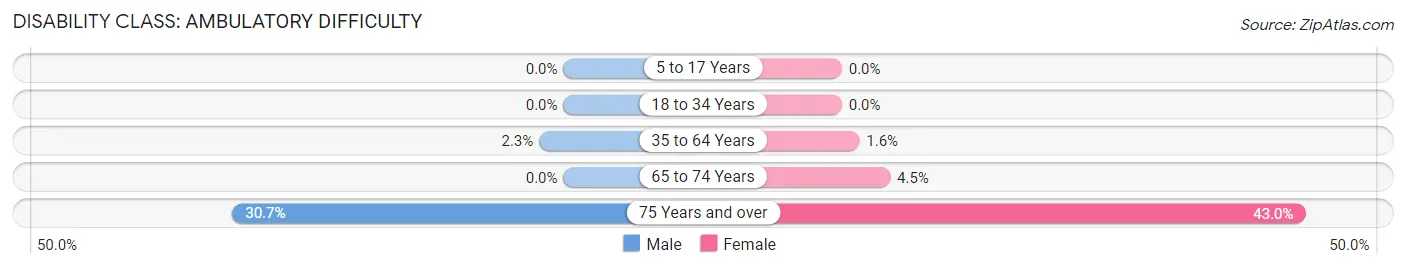
| Age Bracket | Male | Female |
| 5 to 17 Years | 0 (0.0%) | 0 (0.0%) |
| 18 to 34 Years | 0 (0.0%) | 0 (0.0%) |
| 35 to 64 Years | 16 (2.2%) | 15 (1.6%) |
| 65 to 74 Years | 0 (0.0%) | 6 (4.5%) |
| 75 Years and over | 51 (30.7%) | 74 (43.0%) |
Disability Class: Self-Care Difficulty
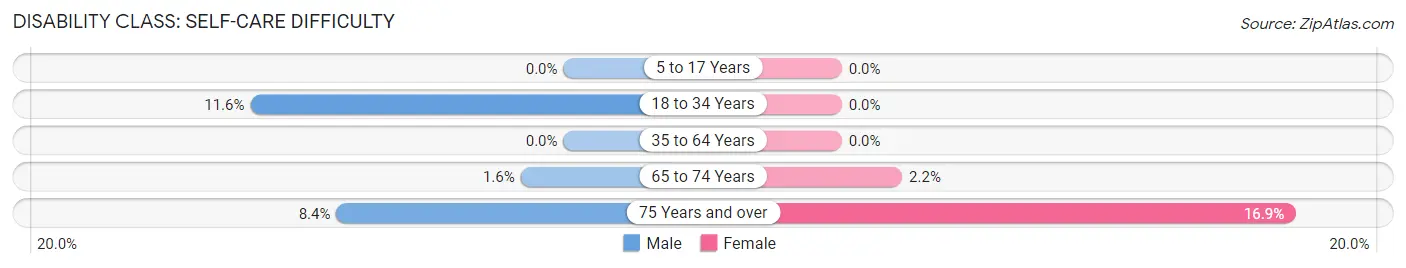
| Age Bracket | Male | Female |
| 5 to 17 Years | 0 (0.0%) | 0 (0.0%) |
| 18 to 34 Years | 28 (11.6%) | 0 (0.0%) |
| 35 to 64 Years | 0 (0.0%) | 0 (0.0%) |
| 65 to 74 Years | 4 (1.6%) | 3 (2.2%) |
| 75 Years and over | 14 (8.4%) | 29 (16.9%) |
Technology Access in Wynantskill
Computing Device Access in Wynantskill
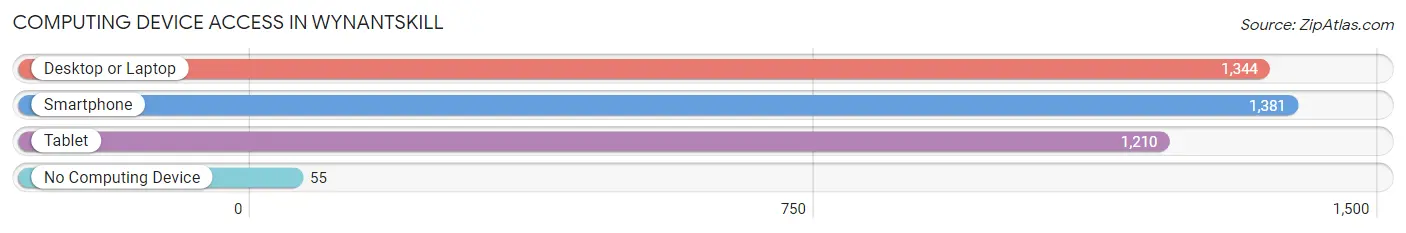
| Device Type | # Households | % Households |
| Desktop or Laptop | 1,344 | 87.7% |
| Smartphone | 1,381 | 90.1% |
| Tablet | 1,210 | 79.0% |
| No Computing Device | 55 | 3.6% |
| Total | 1,532 | 100.0% |
Internet Access in Wynantskill
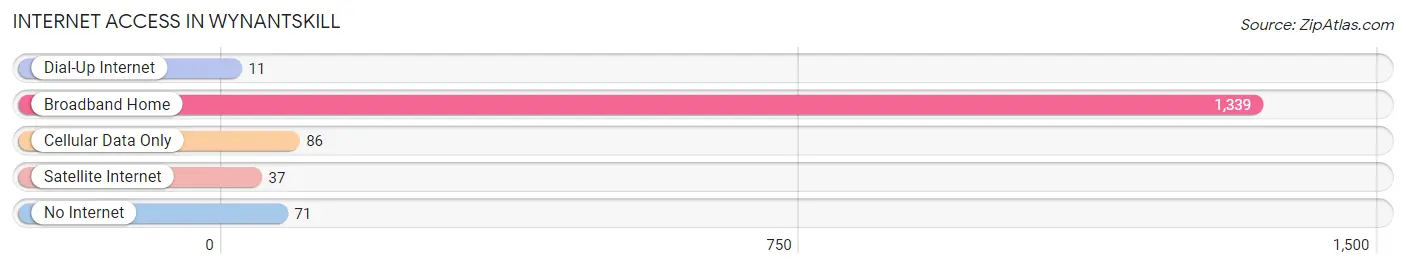
| Internet Type | # Households | % Households |
| Dial-Up Internet | 11 | 0.7% |
| Broadband Home | 1,339 | 87.4% |
| Cellular Data Only | 86 | 5.6% |
| Satellite Internet | 37 | 2.4% |
| No Internet | 71 | 4.6% |
| Total | 1,532 | 100.0% |
Wynantskill Summary
Wynantskill is a hamlet located in the town of North Greenbush in Rensselaer County, New York. It is located just south of Troy and is part of the Albany metropolitan area. The hamlet has a population of approximately 4,000 people and is home to a variety of businesses, schools, and recreational activities.
Geography
Wynantskill is located in the eastern part of Rensselaer County, New York. It is situated on the east bank of the Hudson River, just south of Troy. The hamlet is bordered by the towns of North Greenbush to the north, East Greenbush to the east, and Brunswick to the south. The hamlet is located in the Hudson Valley region of New York and is part of the Albany metropolitan area.
The terrain of Wynantskill is mostly flat, with some rolling hills in the northern part of the hamlet. The hamlet is located in a temperate climate, with hot summers and cold winters. The average annual temperature is around 50 degrees Fahrenheit.
Economy
Wynantskill is home to a variety of businesses, including retail stores, restaurants, and professional services. The hamlet is also home to several manufacturing companies, including a paper mill and a plastics factory. The hamlet is also home to a number of small businesses, such as auto repair shops, beauty salons, and pet stores.
The hamlet is served by the Wynantskill Union Free School District, which includes two elementary schools, a middle school, and a high school. The hamlet is also home to a number of churches, including the First Baptist Church of Wynantskill and the Wynantskill United Methodist Church.
Demographics
As of the 2010 census, the population of Wynantskill was 4,039. The racial makeup of the hamlet was 94.3% White, 1.7% African American, 0.3% Native American, 1.2% Asian, 0.1% Pacific Islander, and 2.4% from other races. Hispanic or Latino of any race were 5.2% of the population.
The median household income in Wynantskill was $60,938, and the median family income was $68,958. The per capita income for the hamlet was $25,945. About 5.2% of families and 7.2% of the population were below the poverty line, including 8.3% of those under age 18 and 5.2% of those age 65 or over.
Conclusion
Wynantskill is a hamlet located in the town of North Greenbush in Rensselaer County, New York. It is located just south of Troy and is part of the Albany metropolitan area. The hamlet has a population of approximately 4,000 people and is home to a variety of businesses, schools, and recreational activities. The hamlet is served by the Wynantskill Union Free School District, and is home to a number of churches, retail stores, restaurants, and professional services. The hamlet has a diverse population, with a median household income of $60,938 and a median family income of $68,958. Wynantskill is a vibrant community with a variety of activities and amenities for its residents.
Common Questions
What is the Total Population of Wynantskill?
Total Population of Wynantskill is 3,683.
What is the Total Male Population of Wynantskill?
Total Male Population of Wynantskill is 1,732.
What is the Total Female Population of Wynantskill?
Total Female Population of Wynantskill is 1,951.
What is the Ratio of Males per 100 Females in Wynantskill?
There are 88.77 Males per 100 Females in Wynantskill.
What is the Ratio of Females per 100 Males in Wynantskill?
There are 112.64 Females per 100 Males in Wynantskill.
What is the Median Population Age in Wynantskill?
Median Population Age in Wynantskill is 44.5 Years.
What is the Average Family Size in Wynantskill
Average Family Size in Wynantskill is 2.6 People.
What is the Average Household Size in Wynantskill
Average Household Size in Wynantskill is 2.4 People.
What is Per Capita Income in Wynantskill?
Per Capita income in Wynantskill is $44,060.
What is the Median Family Income in Wynantskill?
Median Family Income in Wynantskill is $108,250.
What is the Median Household income in Wynantskill?
Median Household Income in Wynantskill is $92,115.
What is Income or Wage Gap in Wynantskill?
Income or Wage Gap in Wynantskill is 2.9%.
Women in Wynantskill earn 97.1 cents for every dollar earned by a man.
What is Inequality or Gini Index in Wynantskill?
Inequality or Gini Index in Wynantskill is 0.32.
How Large is the Labor Force in Wynantskill?
There are 1,951 People in the Labor Forcein in Wynantskill.
What is the Percentage of People in the Labor Force in Wynantskill?
66.8% of People are in the Labor Force in Wynantskill.
What is the Unemployment Rate in Wynantskill?
Unemployment Rate in Wynantskill is 1.6%.