Unionville, NY
Unionville Map
Unionville Overview
670
TOTAL POPULATION
297
MALE POPULATION
373
FEMALE POPULATION
79.62
MALES / 100 FEMALES
125.59
FEMALES / 100 MALES
31.9
MEDIAN AGE
3.2
AVG FAMILY SIZE
2.9
AVG HOUSEHOLD SIZE
$37,919
PER CAPITA INCOME
$84,375
AVG FAMILY INCOME
$84,688
AVG HOUSEHOLD INCOME
17.9%
WAGE / INCOME GAP [ % ]
82.1¢/ $1
WAGE / INCOME GAP [ $ ]
0.37
INEQUALITY / GINI INDEX
376
LABOR FORCE [ PEOPLE ]
74.0%
PERCENT IN LABOR FORCE
Unionville Zip Codes
Unionville Area Codes
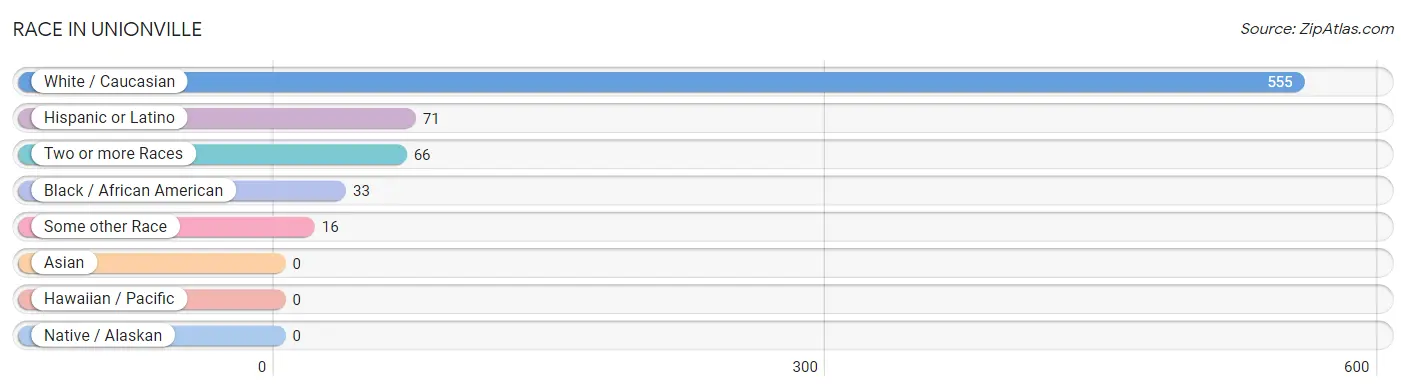
Race in Unionville
The most populous races in Unionville are White / Caucasian (555 | 82.8%), Hispanic or Latino (71 | 10.6%), and Two or more Races (66 | 9.9%).
| Race | # Population | % Population |
| Asian | 0 | 0.0% |
| Black / African American | 33 | 4.9% |
| Hawaiian / Pacific | 0 | 0.0% |
| Hispanic or Latino | 71 | 10.6% |
| Native / Alaskan | 0 | 0.0% |
| White / Caucasian | 555 | 82.8% |
| Two or more Races | 66 | 9.9% |
| Some other Race | 16 | 2.4% |
| Total | 670 | 100.0% |
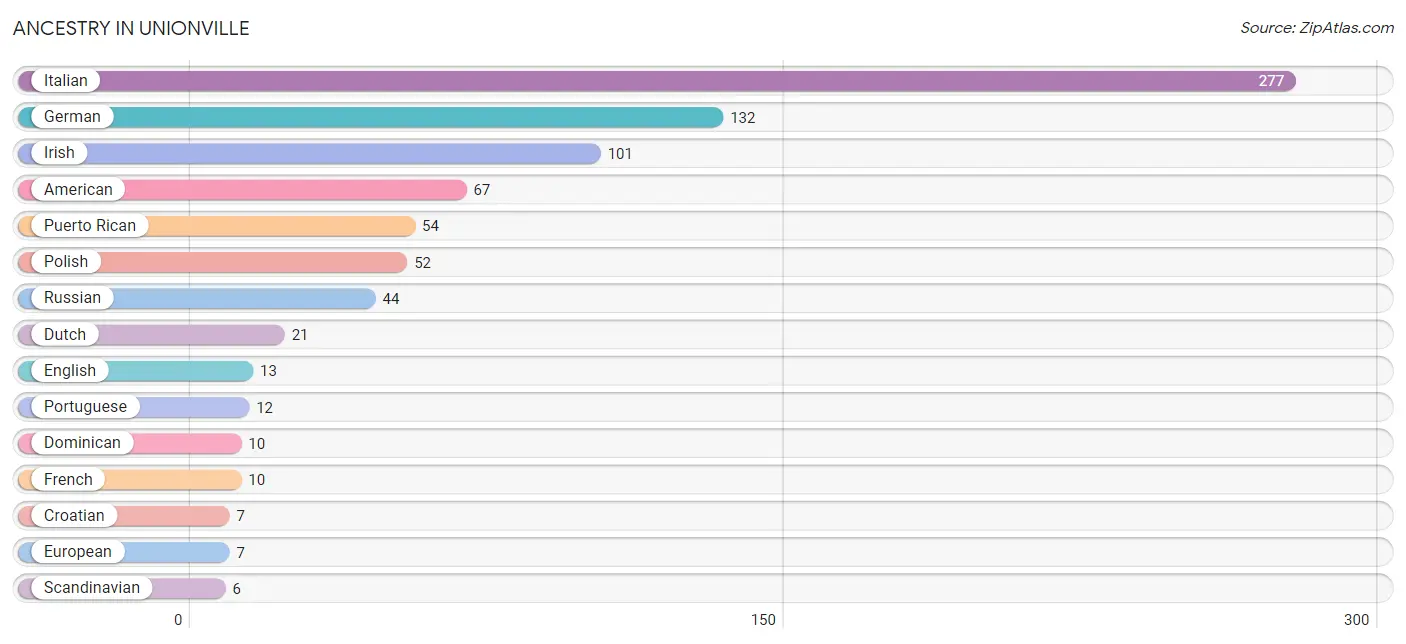
Ancestry in Unionville
The most populous ancestries reported in Unionville are Italian (277 | 41.3%), German (132 | 19.7%), Irish (101 | 15.1%), American (67 | 10.0%), and Puerto Rican (54 | 8.1%), together accounting for 94.2% of all Unionville residents.
| Ancestry | # Population | % Population |
| American | 67 | 10.0% |
| Croatian | 7 | 1.0% |
| Danish | 2 | 0.3% |
| Dominican | 10 | 1.5% |
| Dutch | 21 | 3.1% |
| English | 13 | 1.9% |
| European | 7 | 1.0% |
| French | 10 | 1.5% |
| German | 132 | 19.7% |
| Irish | 101 | 15.1% |
| Italian | 277 | 41.3% |
| Polish | 52 | 7.8% |
| Portuguese | 12 | 1.8% |
| Puerto Rican | 54 | 8.1% |
| Russian | 44 | 6.6% |
| Scandinavian | 6 | 0.9% |
| Scottish | 1 | 0.2% | View All 17 Rows |
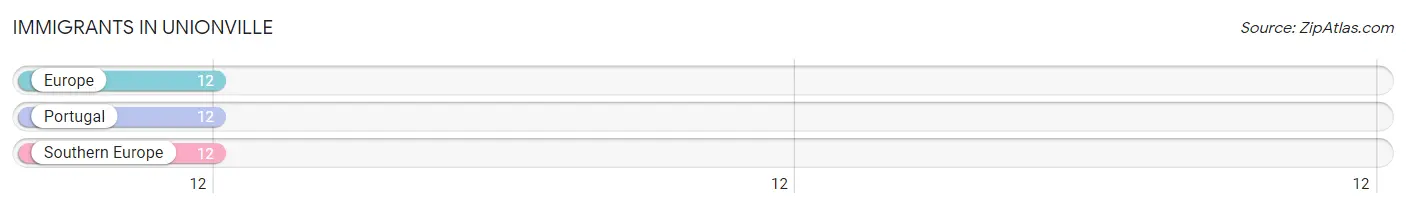
Immigrants in Unionville
The most numerous immigrant groups reported in Unionville came from Europe (12 | 1.8%), Portugal (12 | 1.8%), and Southern Europe (12 | 1.8%), together accounting for 5.4% of all Unionville residents.
| Immigration Origin | # Population | % Population |
| Europe | 12 | 1.8% |
| Portugal | 12 | 1.8% |
| Southern Europe | 12 | 1.8% | View All 3 Rows |
Sex and Age in Unionville
Sex and Age in Unionville
The most populous age groups in Unionville are 20 to 24 Years (78 | 26.3%) for men and Under 5 Years (53 | 14.2%) for women.
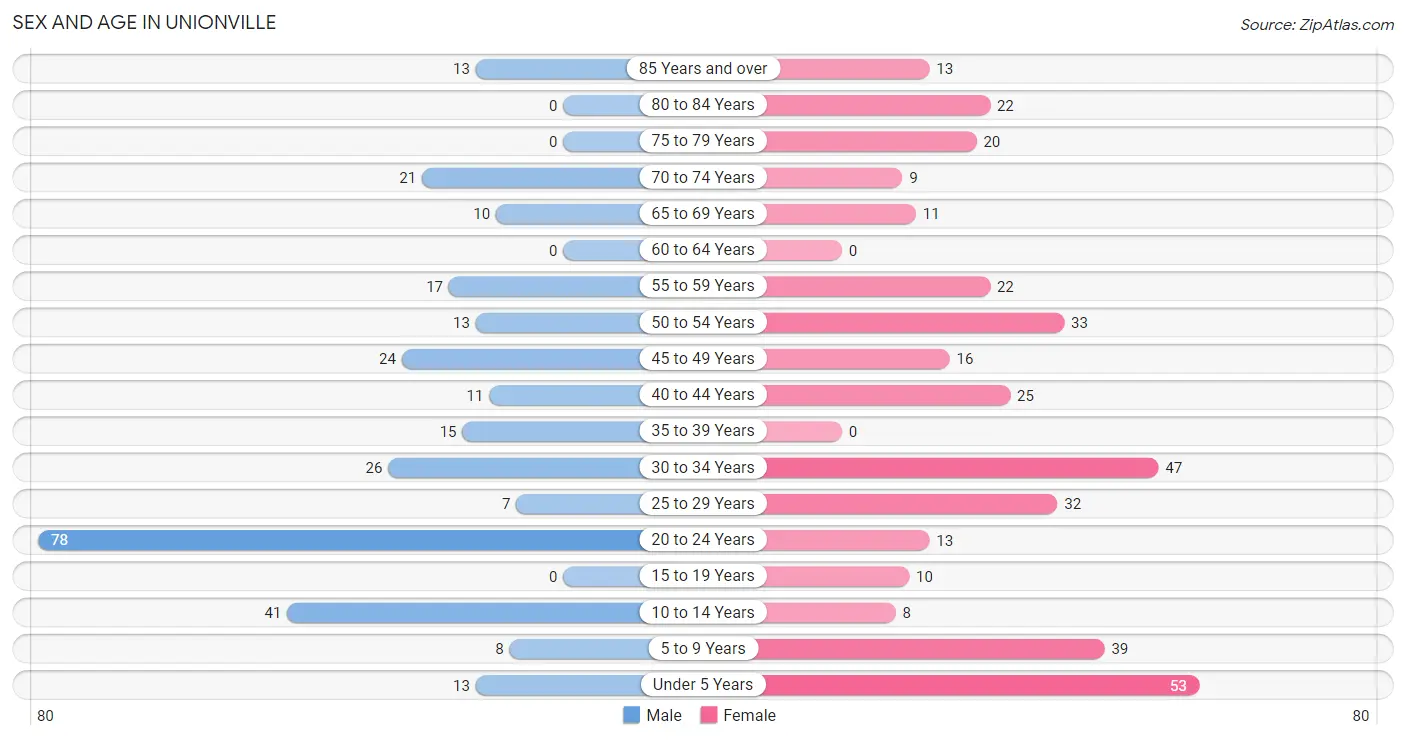
| Age Bracket | Male | Female |
| Under 5 Years | 13 (4.4%) | 53 (14.2%) |
| 5 to 9 Years | 8 (2.7%) | 39 (10.5%) |
| 10 to 14 Years | 41 (13.8%) | 8 (2.1%) |
| 15 to 19 Years | 0 (0.0%) | 10 (2.7%) |
| 20 to 24 Years | 78 (26.3%) | 13 (3.5%) |
| 25 to 29 Years | 7 (2.4%) | 32 (8.6%) |
| 30 to 34 Years | 26 (8.7%) | 47 (12.6%) |
| 35 to 39 Years | 15 (5.1%) | 0 (0.0%) |
| 40 to 44 Years | 11 (3.7%) | 25 (6.7%) |
| 45 to 49 Years | 24 (8.1%) | 16 (4.3%) |
| 50 to 54 Years | 13 (4.4%) | 33 (8.8%) |
| 55 to 59 Years | 17 (5.7%) | 22 (5.9%) |
| 60 to 64 Years | 0 (0.0%) | 0 (0.0%) |
| 65 to 69 Years | 10 (3.4%) | 11 (2.9%) |
| 70 to 74 Years | 21 (7.1%) | 9 (2.4%) |
| 75 to 79 Years | 0 (0.0%) | 20 (5.4%) |
| 80 to 84 Years | 0 (0.0%) | 22 (5.9%) |
| 85 Years and over | 13 (4.4%) | 13 (3.5%) |
| Total | 297 (100.0%) | 373 (100.0%) |
Families and Households in Unionville
Median Family Size in Unionville
The median family size in Unionville is 3.16 persons per family, with single male/father families (16 | 9.1%) accounting for the largest median family size of 3.63 persons per family. On the other hand, single female/mother families (85 | 48.3%) represent the smallest median family size with 2.85 persons per family.
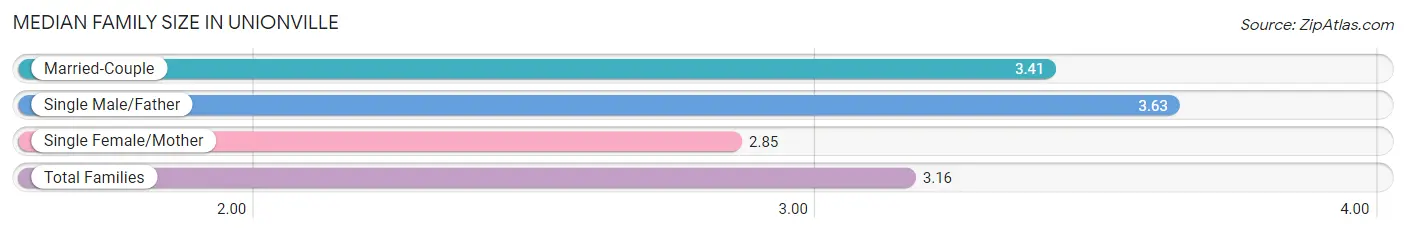
| Family Type | # Families | Family Size |
| Married-Couple | 75 (42.6%) | 3.41 |
| Single Male/Father | 16 (9.1%) | 3.63 |
| Single Female/Mother | 85 (48.3%) | 2.85 |
| Total Families | 176 (100.0%) | 3.16 |
Median Household Size in Unionville
The median household size in Unionville is 2.91 persons per household, with single male/father households (16 | 7.0%) accounting for the largest median household size of 4.81 persons per household. non-family households (52 | 22.8%) represent the smallest median household size with 1.38 persons per household.
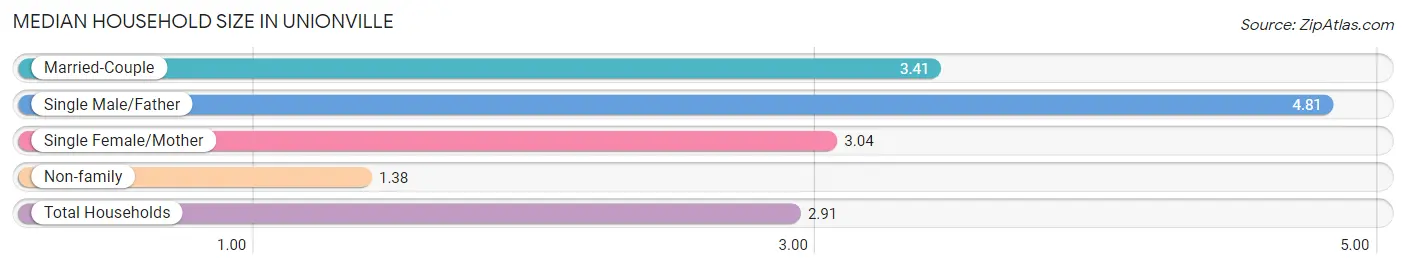
| Household Type | # Households | Household Size |
| Married-Couple | 75 (32.9%) | 3.41 |
| Single Male/Father | 16 (7.0%) | 4.81 |
| Single Female/Mother | 85 (37.3%) | 3.04 |
| Non-family | 52 (22.8%) | 1.38 |
| Total Households | 228 (100.0%) | 2.91 |
Household Size by Marriage Status in Unionville
Out of a total of 228 households in Unionville, 176 (77.2%) are family households, while 52 (22.8%) are nonfamily households. The most numerous type of family households are 3-person households, comprising 63, and the most common type of nonfamily households are 1-person households, comprising 34.
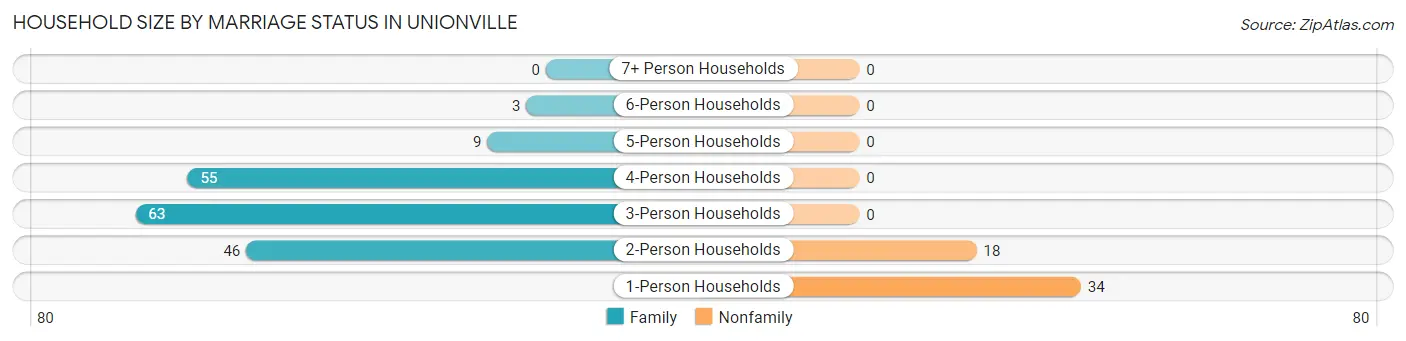
| Household Size | Family Households | Nonfamily Households |
| 1-Person Households | - | 34 (14.9%) |
| 2-Person Households | 46 (20.2%) | 18 (7.9%) |
| 3-Person Households | 63 (27.6%) | 0 (0.0%) |
| 4-Person Households | 55 (24.1%) | 0 (0.0%) |
| 5-Person Households | 9 (4.0%) | 0 (0.0%) |
| 6-Person Households | 3 (1.3%) | 0 (0.0%) |
| 7+ Person Households | 0 (0.0%) | 0 (0.0%) |
| Total | 176 (77.2%) | 52 (22.8%) |
Female Fertility in Unionville
Fertility by Age in Unionville
| Age Bracket | Women with Births | Births / 1,000 Women |
| 15 to 19 years | 0 (0.0%) | 0.0 |
| 20 to 34 years | 0 (0.0%) | 0.0 |
| 35 to 50 years | 0 (0.0%) | 0.0 |
| Total | 0 (0.0%) | 0.0 |
Fertility by Age by Marriage Status in Unionville
| Age Bracket | Married | Unmarried |
| 15 to 19 years | 0 (0.0%) | 0 (0.0%) |
| 20 to 34 years | 0 (0.0%) | 0 (0.0%) |
| 35 to 50 years | 0 (0.0%) | 0 (0.0%) |
| Total | 0 (0.0%) | 0 (0.0%) |
Fertility by Education in Unionville
| Educational Attainment | Women with Births | Births / 1,000 Women |
| Less than High School | 0 (0.0%) | 0.0 |
| High School Diploma | 0 (0.0%) | 0.0 |
| College or Associate's Degree | 0 (0.0%) | 0.0 |
| Bachelor's Degree | 0 (0.0%) | 0.0 |
| Graduate Degree | 0 (0.0%) | 0.0 |
| Total | 0 (0.0%) | 0.0 |
Fertility by Education by Marriage Status in Unionville
| Educational Attainment | Married | Unmarried |
| Less than High School | 0 (0.0%) | 0 (0.0%) |
| High School Diploma | 0 (0.0%) | 0 (0.0%) |
| College or Associate's Degree | 0 (0.0%) | 0 (0.0%) |
| Bachelor's Degree | 0 (0.0%) | 0 (0.0%) |
| Graduate Degree | 0 (0.0%) | 0 (0.0%) |
| Total | 0 (0.0%) | 0 (0.0%) |
Income in Unionville
Income Overview in Unionville
Per Capita Income in Unionville is $37,919, while median incomes of families and households are $84,375 and $84,688 respectively.
| Characteristic | Number | Measure |
| Per Capita Income | 670 | $37,919 |
| Median Family Income | 176 | $84,375 |
| Mean Family Income | 176 | $108,007 |
| Median Household Income | 228 | $84,688 |
| Mean Household Income | 228 | $106,782 |
| Income Deficit | 176 | $0 |
| Wage / Income Gap (%) | 670 | 17.88% |
| Wage / Income Gap ($) | 670 | 82.12¢ per $1 |
| Gini / Inequality Index | 670 | 0.37 |
Earnings by Sex in Unionville
Average Earnings in Unionville are $39,545, $38,750 for men and $47,188 for women, a difference of 17.9%.
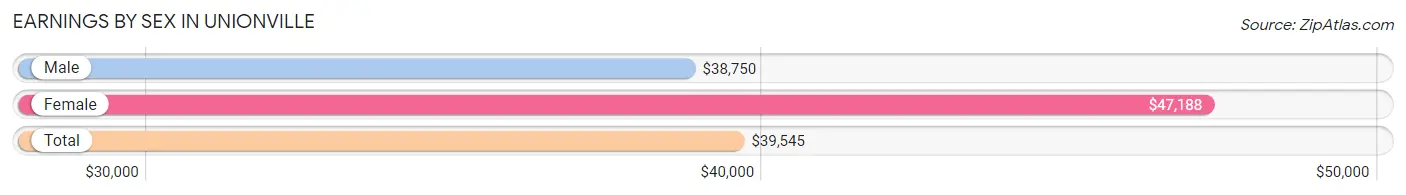
| Sex | Number | Average Earnings |
| Male | 196 (50.8%) | $38,750 |
| Female | 190 (49.2%) | $47,188 |
| Total | 386 (100.0%) | $39,545 |
Earnings by Sex by Income Bracket in Unionville
The most common earnings brackets in Unionville are $75,000 to $99,999 for men (32 | 16.3%) and $100,000+ for women (46 | 24.2%).
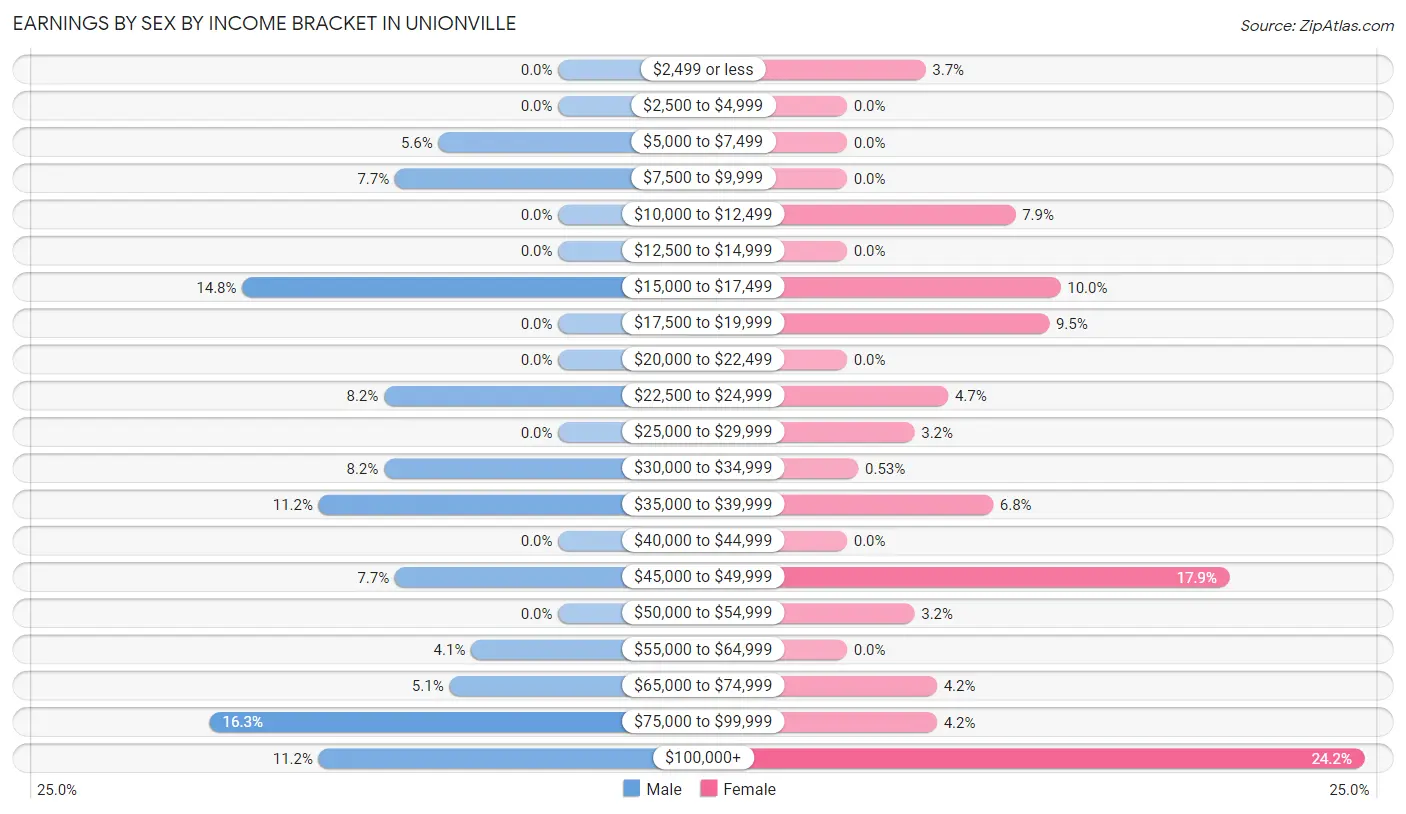
| Income | Male | Female |
| $2,499 or less | 0 (0.0%) | 7 (3.7%) |
| $2,500 to $4,999 | 0 (0.0%) | 0 (0.0%) |
| $5,000 to $7,499 | 11 (5.6%) | 0 (0.0%) |
| $7,500 to $9,999 | 15 (7.6%) | 0 (0.0%) |
| $10,000 to $12,499 | 0 (0.0%) | 15 (7.9%) |
| $12,500 to $14,999 | 0 (0.0%) | 0 (0.0%) |
| $15,000 to $17,499 | 29 (14.8%) | 19 (10.0%) |
| $17,500 to $19,999 | 0 (0.0%) | 18 (9.5%) |
| $20,000 to $22,499 | 0 (0.0%) | 0 (0.0%) |
| $22,500 to $24,999 | 16 (8.2%) | 9 (4.7%) |
| $25,000 to $29,999 | 0 (0.0%) | 6 (3.2%) |
| $30,000 to $34,999 | 16 (8.2%) | 1 (0.5%) |
| $35,000 to $39,999 | 22 (11.2%) | 13 (6.8%) |
| $40,000 to $44,999 | 0 (0.0%) | 0 (0.0%) |
| $45,000 to $49,999 | 15 (7.6%) | 34 (17.9%) |
| $50,000 to $54,999 | 0 (0.0%) | 6 (3.2%) |
| $55,000 to $64,999 | 8 (4.1%) | 0 (0.0%) |
| $65,000 to $74,999 | 10 (5.1%) | 8 (4.2%) |
| $75,000 to $99,999 | 32 (16.3%) | 8 (4.2%) |
| $100,000+ | 22 (11.2%) | 46 (24.2%) |
| Total | 196 (100.0%) | 190 (100.0%) |
Earnings by Sex by Educational Attainment in Unionville
Average earnings in Unionville are $73,750 for men and $48,029 for women, a difference of 34.9%. Men with an educational attainment of graduate degree enjoy the highest average annual earnings of $95,469, while those with college or associate's degree education earn the least with $45,938. Women with an educational attainment of graduate degree earn the most with the average annual earnings of $148,000, while those with college or associate's degree education have the smallest earnings of $18,958.
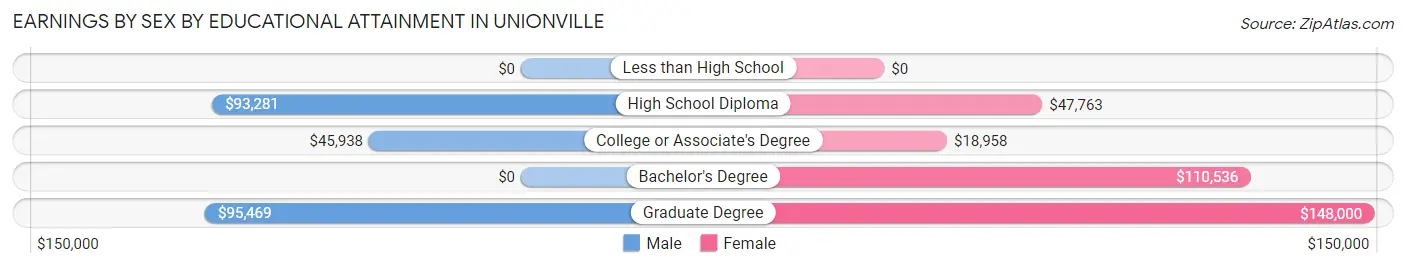
| Educational Attainment | Male Income | Female Income |
| Less than High School | - | - |
| High School Diploma | $93,281 | $47,763 |
| College or Associate's Degree | $45,938 | $18,958 |
| Bachelor's Degree | - | - |
| Graduate Degree | $95,469 | $148,000 |
| Total | $73,750 | $48,029 |
Family Income in Unionville
Family Income Brackets in Unionville
According to the Unionville family income data, there are 36 families falling into the $200,000+ income range, which is the most common income bracket and makes up 20.4% of all families.
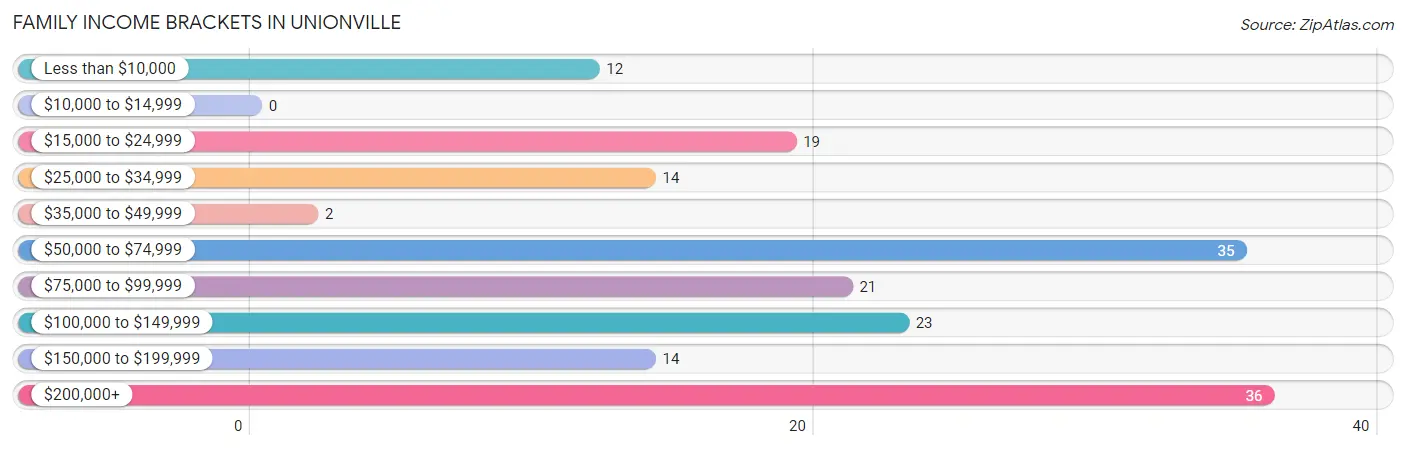
| Income Bracket | # Families | % Families |
| Less than $10,000 | 12 | 6.8% |
| $10,000 to $14,999 | 0 | 0.0% |
| $15,000 to $24,999 | 19 | 10.8% |
| $25,000 to $34,999 | 14 | 8.0% |
| $35,000 to $49,999 | 2 | 1.1% |
| $50,000 to $74,999 | 35 | 19.9% |
| $75,000 to $99,999 | 21 | 11.9% |
| $100,000 to $149,999 | 23 | 13.1% |
| $150,000 to $199,999 | 14 | 8.0% |
| $200,000+ | 36 | 20.5% |
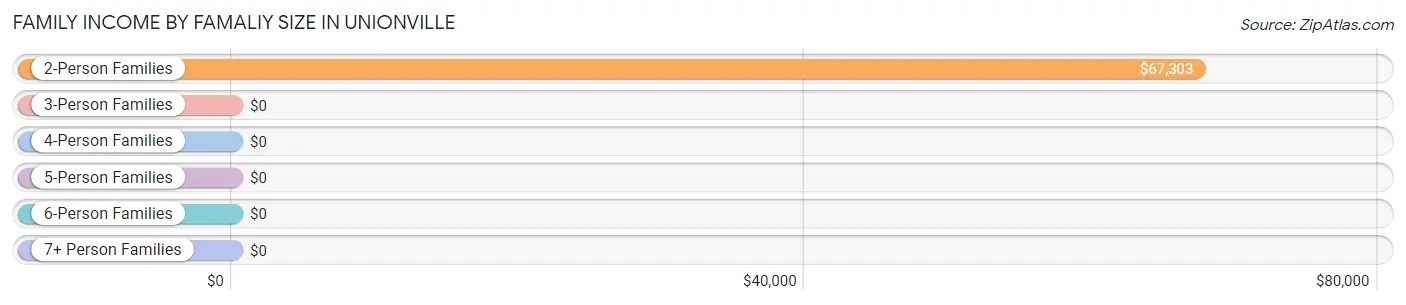
Family Income by Famaliy Size in Unionville
2-person families (53 | 30.1%) account for the highest median family income in Unionville with $67,303 per family, while 2-person families (53 | 30.1%) have the highest median income of $33,652 per family member.
| Income Bracket | # Families | Median Income |
| 2-Person Families | 53 (30.1%) | $67,303 |
| 3-Person Families | 75 (42.6%) | $0 |
| 4-Person Families | 45 (25.6%) | $0 |
| 5-Person Families | 0 (0.0%) | $0 |
| 6-Person Families | 3 (1.7%) | $0 |
| 7+ Person Families | 0 (0.0%) | $0 |
| Total | 176 (100.0%) | $84,375 |
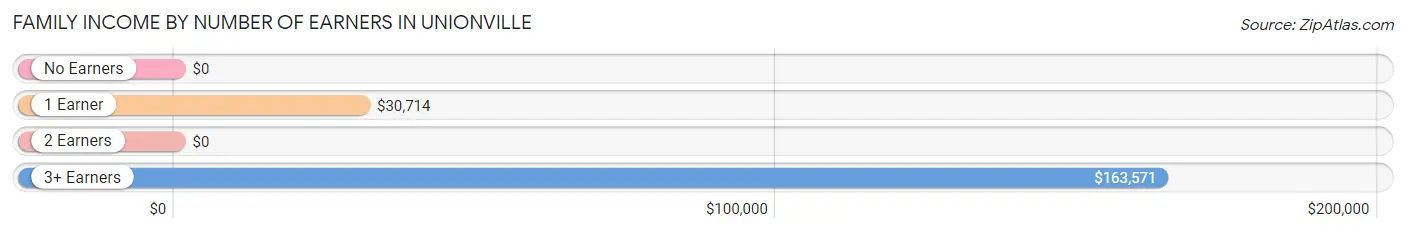
Family Income by Number of Earners in Unionville
| Number of Earners | # Families | Median Income |
| No Earners | 24 (13.6%) | $0 |
| 1 Earner | 42 (23.9%) | $30,714 |
| 2 Earners | 82 (46.6%) | $0 |
| 3+ Earners | 28 (15.9%) | $163,571 |
| Total | 176 (100.0%) | $84,375 |
Household Income in Unionville
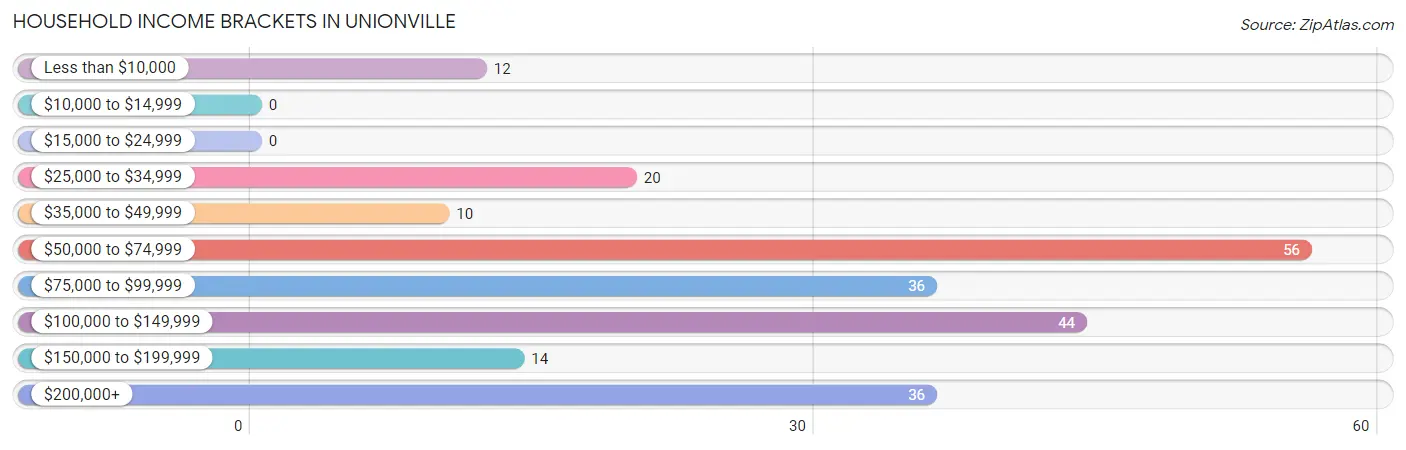
Household Income Brackets in Unionville
With 56 households falling in the category, the $50,000 to $74,999 income range is the most frequent in Unionville, accounting for 24.6% of all households.
| Income Bracket | # Households | % Households |
| Less than $10,000 | 12 | 5.3% |
| $10,000 to $14,999 | 0 | 0.0% |
| $15,000 to $24,999 | 0 | 0.0% |
| $25,000 to $34,999 | 20 | 8.8% |
| $35,000 to $49,999 | 10 | 4.4% |
| $50,000 to $74,999 | 56 | 24.6% |
| $75,000 to $99,999 | 36 | 15.8% |
| $100,000 to $149,999 | 44 | 19.3% |
| $150,000 to $199,999 | 14 | 6.1% |
| $200,000+ | 36 | 15.8% |
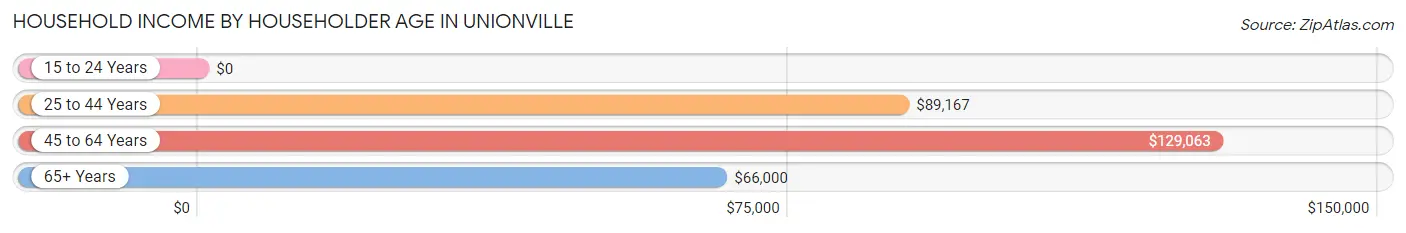
Household Income by Householder Age in Unionville
The median household income in Unionville is $84,688, with the highest median household income of $129,063 found in the 45 to 64 years age bracket for the primary householder. A total of 94 households (41.2%) fall into this category.
| Income Bracket | # Households | Median Income |
| 15 to 24 Years | 0 (0.0%) | $0 |
| 25 to 44 Years | 70 (30.7%) | $89,167 |
| 45 to 64 Years | 94 (41.2%) | $129,063 |
| 65+ Years | 64 (28.1%) | $66,000 |
| Total | 228 (100.0%) | $84,688 |
Poverty in Unionville
Income Below Poverty by Sex and Age in Unionville
With 18.9% poverty level for males and 15.0% for females among the residents of Unionville, under 5 year old males and 6 to 11 year old females are the most vulnerable to poverty, with 13 males (100.0%) and 13 females (86.7%) in their respective age groups living below the poverty level.
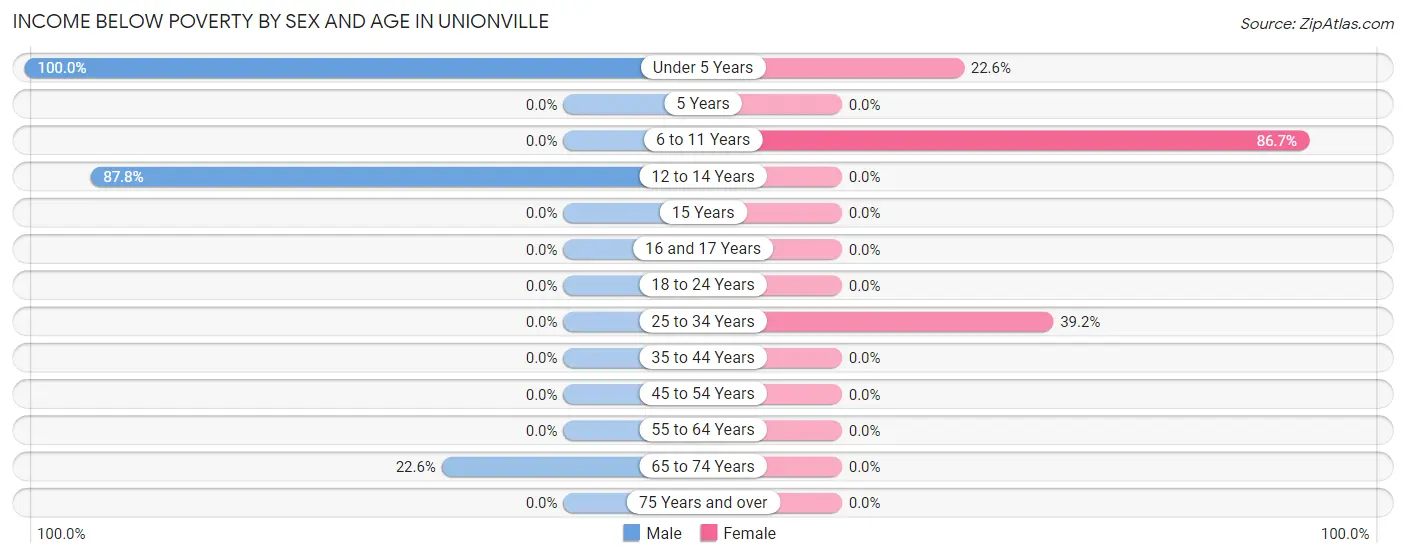
| Age Bracket | Male | Female |
| Under 5 Years | 13 (100.0%) | 12 (22.6%) |
| 5 Years | 0 (0.0%) | 0 (0.0%) |
| 6 to 11 Years | 0 (0.0%) | 13 (86.7%) |
| 12 to 14 Years | 36 (87.8%) | 0 (0.0%) |
| 15 Years | 0 (0.0%) | 0 (0.0%) |
| 16 and 17 Years | 0 (0.0%) | 0 (0.0%) |
| 18 to 24 Years | 0 (0.0%) | 0 (0.0%) |
| 25 to 34 Years | 0 (0.0%) | 31 (39.2%) |
| 35 to 44 Years | 0 (0.0%) | 0 (0.0%) |
| 45 to 54 Years | 0 (0.0%) | 0 (0.0%) |
| 55 to 64 Years | 0 (0.0%) | 0 (0.0%) |
| 65 to 74 Years | 7 (22.6%) | 0 (0.0%) |
| 75 Years and over | 0 (0.0%) | 0 (0.0%) |
| Total | 56 (18.9%) | 56 (15.0%) |
Income Above Poverty by Sex and Age in Unionville
According to the poverty statistics in Unionville, males aged 6 to 11 years and females aged 5 years are the age groups that are most secure financially, with 100.0% of males and 100.0% of females in these age groups living above the poverty line.
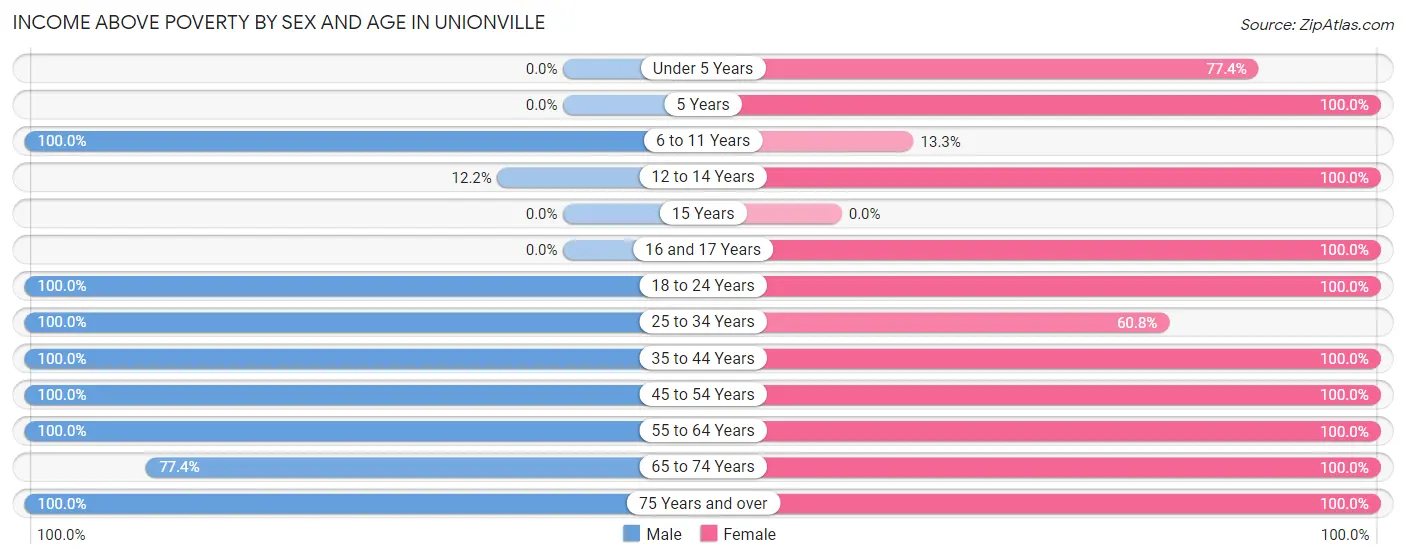
| Age Bracket | Male | Female |
| Under 5 Years | 0 (0.0%) | 41 (77.4%) |
| 5 Years | 0 (0.0%) | 24 (100.0%) |
| 6 to 11 Years | 8 (100.0%) | 2 (13.3%) |
| 12 to 14 Years | 5 (12.2%) | 8 (100.0%) |
| 15 Years | 0 (0.0%) | 0 (0.0%) |
| 16 and 17 Years | 0 (0.0%) | 10 (100.0%) |
| 18 to 24 Years | 78 (100.0%) | 13 (100.0%) |
| 25 to 34 Years | 33 (100.0%) | 48 (60.8%) |
| 35 to 44 Years | 26 (100.0%) | 25 (100.0%) |
| 45 to 54 Years | 37 (100.0%) | 49 (100.0%) |
| 55 to 64 Years | 17 (100.0%) | 22 (100.0%) |
| 65 to 74 Years | 24 (77.4%) | 20 (100.0%) |
| 75 Years and over | 13 (100.0%) | 55 (100.0%) |
| Total | 241 (81.1%) | 317 (85.0%) |
Income Below Poverty Among Married-Couple Families in Unionville
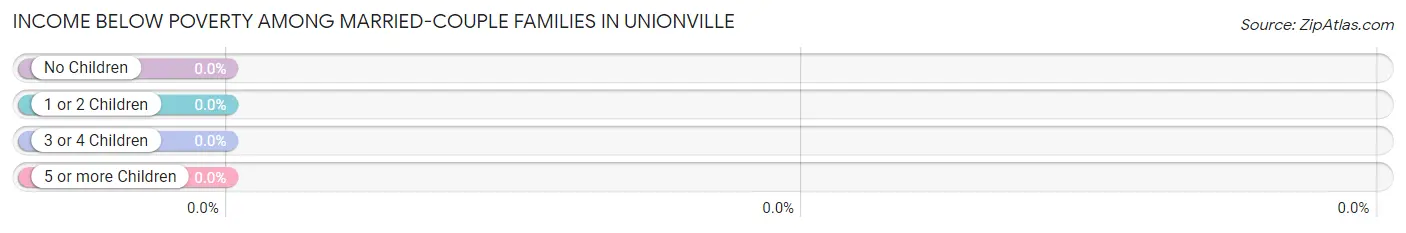
| Children | Above Poverty | Below Poverty |
| No Children | 34 (100.0%) | 0 (0.0%) |
| 1 or 2 Children | 38 (100.0%) | 0 (0.0%) |
| 3 or 4 Children | 3 (100.0%) | 0 (0.0%) |
| 5 or more Children | 0 (0.0%) | 0 (0.0%) |
| Total | 75 (100.0%) | 0 (0.0%) |
Income Below Poverty Among Single-Parent Households in Unionville
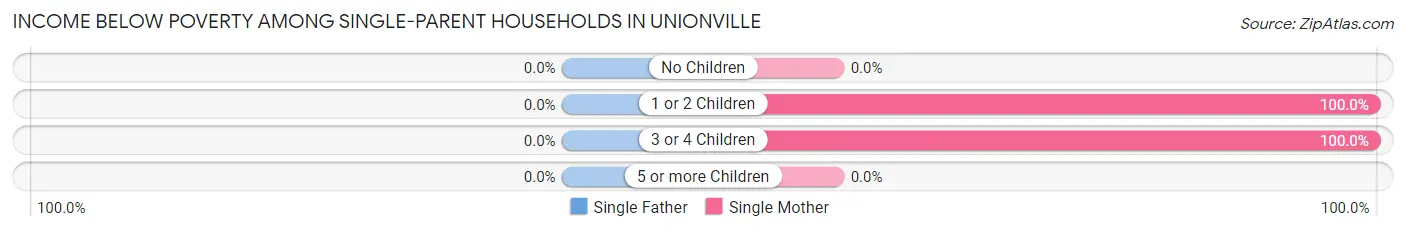
| Children | Single Father | Single Mother |
| No Children | 0 (0.0%) | 0 (0.0%) |
| 1 or 2 Children | 0 (0.0%) | 19 (100.0%) |
| 3 or 4 Children | 0 (0.0%) | 12 (100.0%) |
| 5 or more Children | 0 (0.0%) | 0 (0.0%) |
| Total | 0 (0.0%) | 31 (36.5%) |
Income Below Poverty Among Married-Couple vs Single-Parent Households in Unionville
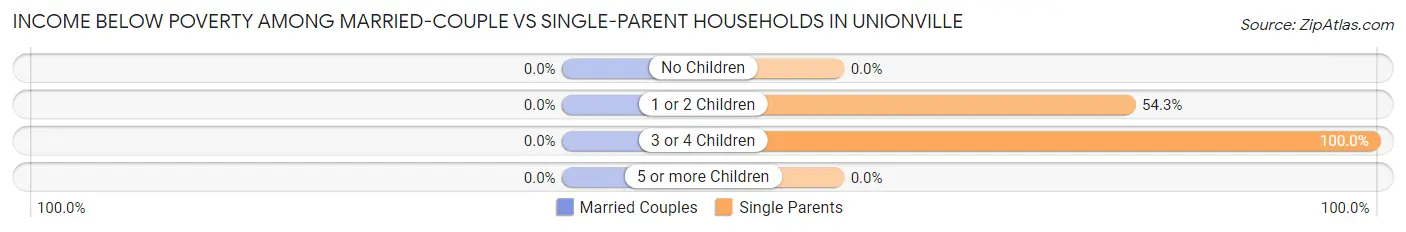
| Children | Married-Couple Families | Single-Parent Households |
| No Children | 0 (0.0%) | 0 (0.0%) |
| 1 or 2 Children | 0 (0.0%) | 19 (54.3%) |
| 3 or 4 Children | 0 (0.0%) | 12 (100.0%) |
| 5 or more Children | 0 (0.0%) | 0 (0.0%) |
| Total | 0 (0.0%) | 31 (30.7%) |
Employment Characteristics in Unionville
Employment by Class of Employer in Unionville
Among the 369 employed individuals in Unionville, private company employees (283 | 76.7%), self-employed (not incorporated) (36 | 9.8%), and not-for-profit organizations (30 | 8.1%) make up the most common classes of employment.
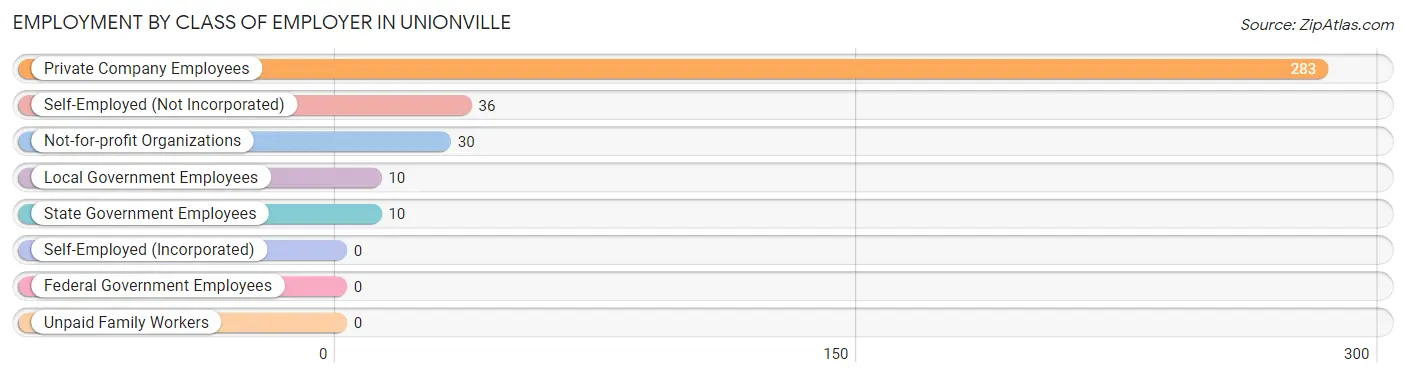
| Employer Class | # Employees | % Employees |
| Private Company Employees | 283 | 76.7% |
| Self-Employed (Incorporated) | 0 | 0.0% |
| Self-Employed (Not Incorporated) | 36 | 9.8% |
| Not-for-profit Organizations | 30 | 8.1% |
| Local Government Employees | 10 | 2.7% |
| State Government Employees | 10 | 2.7% |
| Federal Government Employees | 0 | 0.0% |
| Unpaid Family Workers | 0 | 0.0% |
| Total | 369 | 100.0% |
Employment Status by Age in Unionville
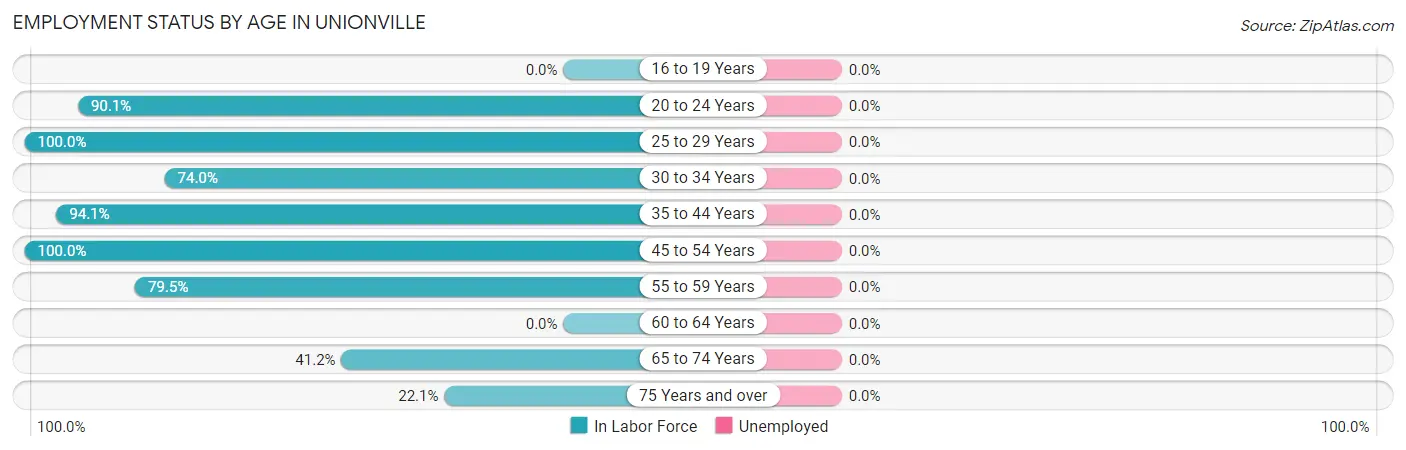
| Age Bracket | In Labor Force | Unemployed |
| 16 to 19 Years | 0 (0.0%) | 0 (0.0%) |
| 20 to 24 Years | 82 (90.1%) | 0 (0.0%) |
| 25 to 29 Years | 39 (100.0%) | 0 (0.0%) |
| 30 to 34 Years | 54 (74.0%) | 0 (0.0%) |
| 35 to 44 Years | 48 (94.1%) | 0 (0.0%) |
| 45 to 54 Years | 86 (100.0%) | 0 (0.0%) |
| 55 to 59 Years | 31 (79.5%) | 0 (0.0%) |
| 60 to 64 Years | 0 (0.0%) | 0 (0.0%) |
| 65 to 74 Years | 21 (41.2%) | 0 (0.0%) |
| 75 Years and over | 15 (22.1%) | 0 (0.0%) |
| Total | 376 (74.0%) | 0 (0.0%) |
Employment Status by Educational Attainment in Unionville
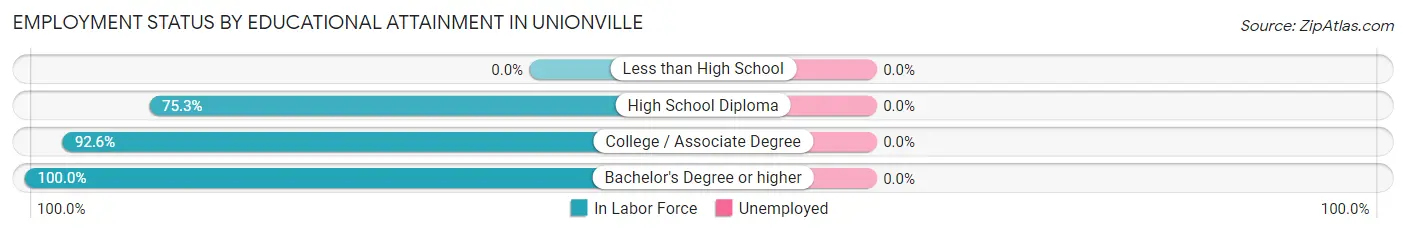
| Educational Attainment | In Labor Force | Unemployed |
| Less than High School | 0 (0.0%) | 0 (0.0%) |
| High School Diploma | 70 (75.3%) | 0 (0.0%) |
| College / Associate Degree | 87 (92.6%) | 0 (0.0%) |
| Bachelor's Degree or higher | 101 (100.0%) | 0 (0.0%) |
| Total | 258 (89.6%) | 0 (0.0%) |
Employment Occupations by Sex in Unionville
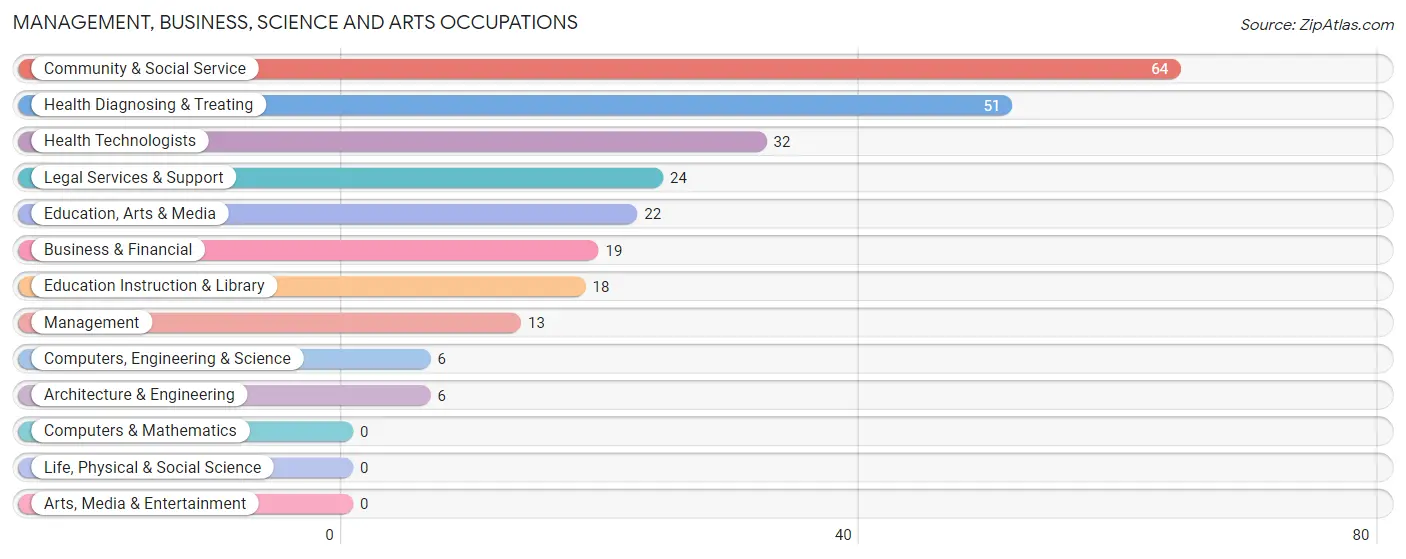
Management, Business, Science and Arts Occupations
The most common Management, Business, Science and Arts occupations in Unionville are Community & Social Service (64 | 17.0%), Health Diagnosing & Treating (51 | 13.6%), Health Technologists (32 | 8.5%), Legal Services & Support (24 | 6.4%), and Education, Arts & Media (22 | 5.9%).
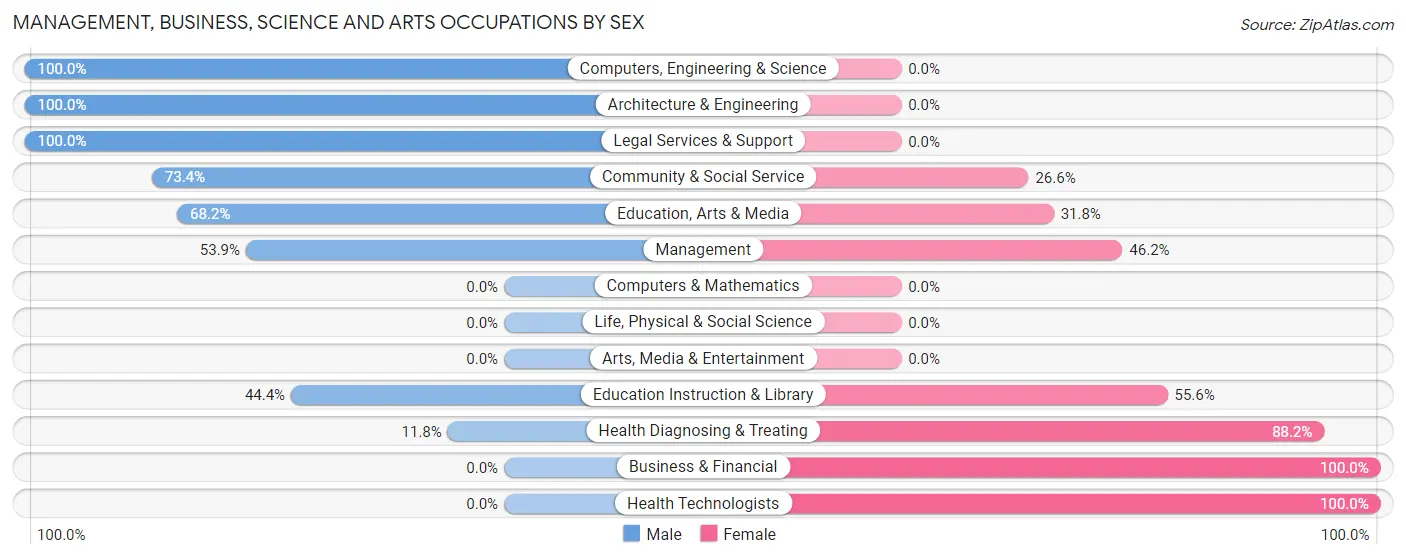
Management, Business, Science and Arts Occupations by Sex
Within the Management, Business, Science and Arts occupations in Unionville, the most male-oriented occupations are Computers, Engineering & Science (100.0%), Architecture & Engineering (100.0%), and Legal Services & Support (100.0%), while the most female-oriented occupations are Business & Financial (100.0%), Health Technologists (100.0%), and Health Diagnosing & Treating (88.2%).
| Occupation | Male | Female |
| Management | 7 (53.8%) | 6 (46.2%) |
| Business & Financial | 0 (0.0%) | 19 (100.0%) |
| Computers, Engineering & Science | 6 (100.0%) | 0 (0.0%) |
| Computers & Mathematics | 0 (0.0%) | 0 (0.0%) |
| Architecture & Engineering | 6 (100.0%) | 0 (0.0%) |
| Life, Physical & Social Science | 0 (0.0%) | 0 (0.0%) |
| Community & Social Service | 47 (73.4%) | 17 (26.6%) |
| Education, Arts & Media | 15 (68.2%) | 7 (31.8%) |
| Legal Services & Support | 24 (100.0%) | 0 (0.0%) |
| Education Instruction & Library | 8 (44.4%) | 10 (55.6%) |
| Arts, Media & Entertainment | 0 (0.0%) | 0 (0.0%) |
| Health Diagnosing & Treating | 6 (11.8%) | 45 (88.2%) |
| Health Technologists | 0 (0.0%) | 32 (100.0%) |
| Total (Category) | 66 (43.1%) | 87 (56.9%) |
| Total (Overall) | 187 (49.7%) | 189 (50.3%) |
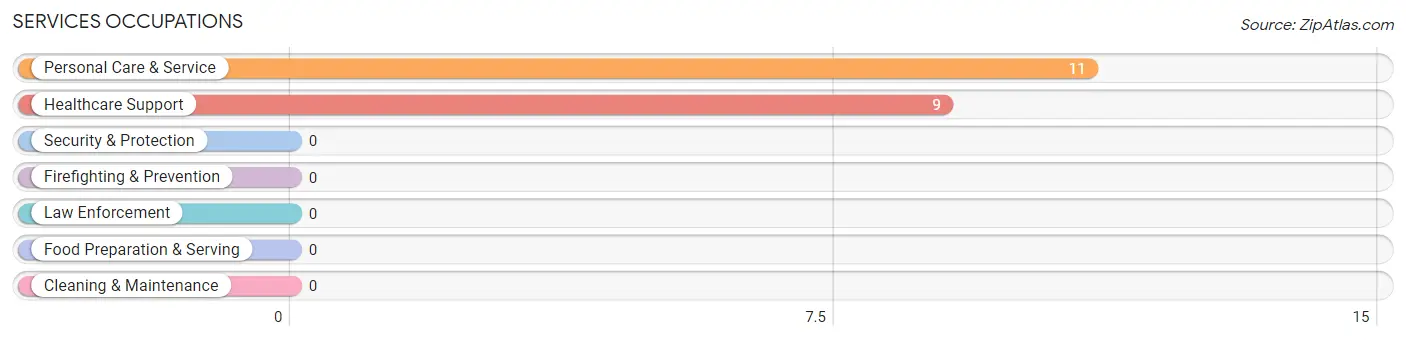
Services Occupations
The most common Services occupations in Unionville are Personal Care & Service (11 | 2.9%), and Healthcare Support (9 | 2.4%).
Services Occupations by Sex
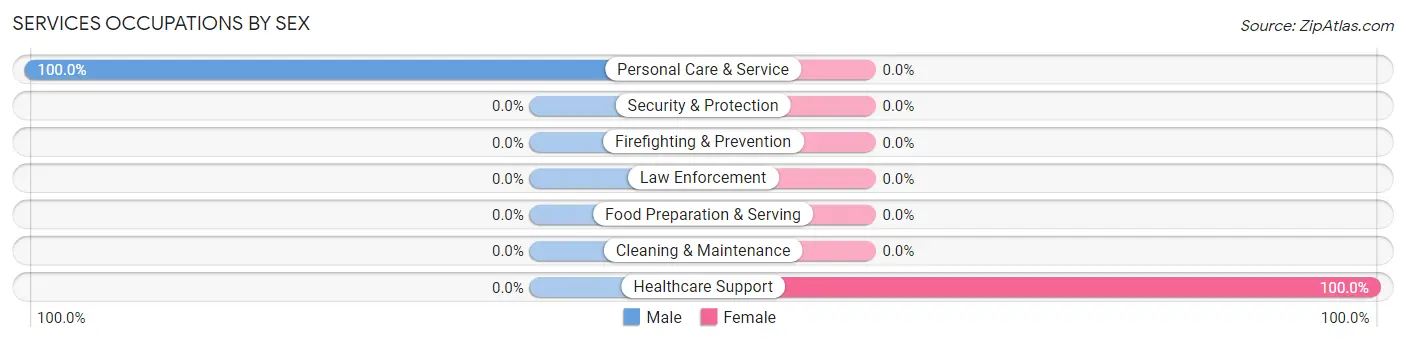
| Occupation | Male | Female |
| Healthcare Support | 0 (0.0%) | 9 (100.0%) |
| Security & Protection | 0 (0.0%) | 0 (0.0%) |
| Firefighting & Prevention | 0 (0.0%) | 0 (0.0%) |
| Law Enforcement | 0 (0.0%) | 0 (0.0%) |
| Food Preparation & Serving | 0 (0.0%) | 0 (0.0%) |
| Cleaning & Maintenance | 0 (0.0%) | 0 (0.0%) |
| Personal Care & Service | 11 (100.0%) | 0 (0.0%) |
| Total (Category) | 11 (55.0%) | 9 (45.0%) |
| Total (Overall) | 187 (49.7%) | 189 (50.3%) |
Sales and Office Occupations
The most common Sales and Office occupations in Unionville are Office & Administration (71 | 18.9%), and Sales & Related (16 | 4.3%).
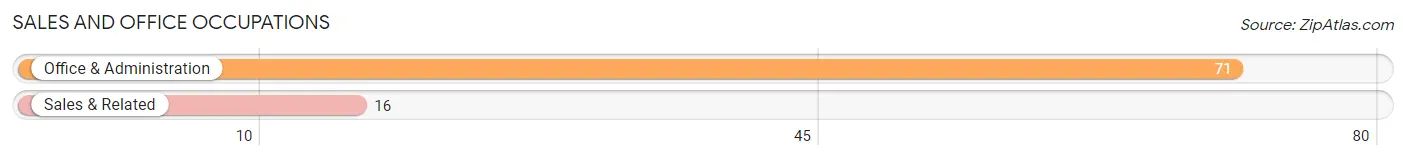
Sales and Office Occupations by Sex
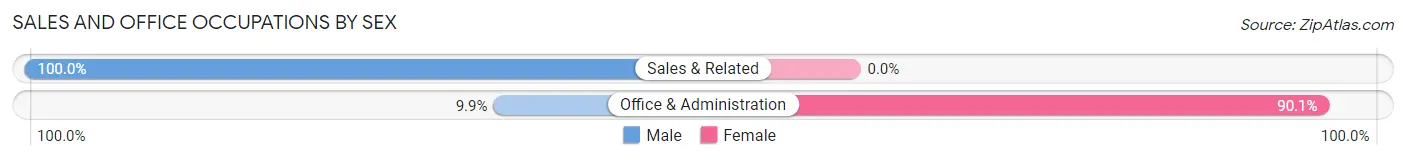
| Occupation | Male | Female |
| Sales & Related | 16 (100.0%) | 0 (0.0%) |
| Office & Administration | 7 (9.9%) | 64 (90.1%) |
| Total (Category) | 23 (26.4%) | 64 (73.6%) |
| Total (Overall) | 187 (49.7%) | 189 (50.3%) |
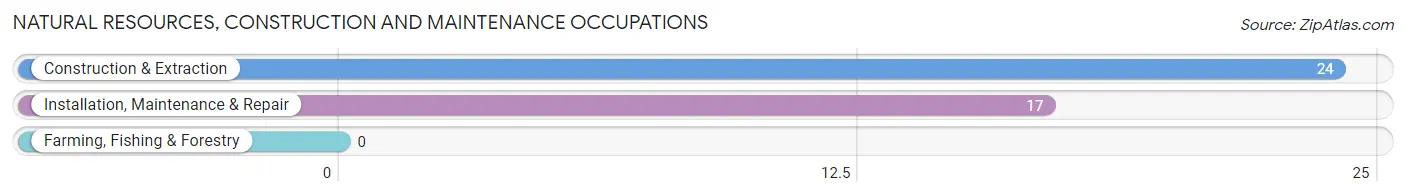
Natural Resources, Construction and Maintenance Occupations
The most common Natural Resources, Construction and Maintenance occupations in Unionville are Construction & Extraction (24 | 6.4%), and Installation, Maintenance & Repair (17 | 4.5%).
Natural Resources, Construction and Maintenance Occupations by Sex
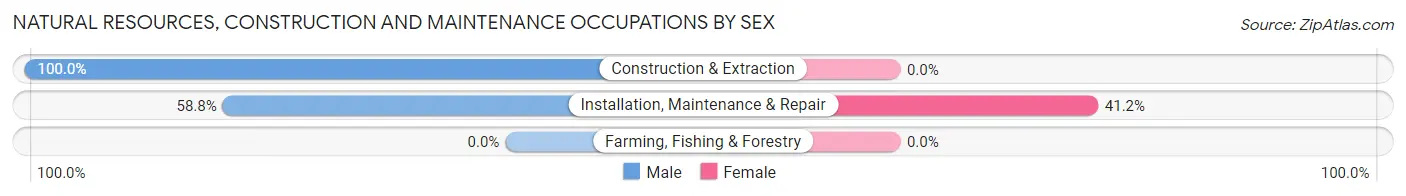
| Occupation | Male | Female |
| Farming, Fishing & Forestry | 0 (0.0%) | 0 (0.0%) |
| Construction & Extraction | 24 (100.0%) | 0 (0.0%) |
| Installation, Maintenance & Repair | 10 (58.8%) | 7 (41.2%) |
| Total (Category) | 34 (82.9%) | 7 (17.1%) |
| Total (Overall) | 187 (49.7%) | 189 (50.3%) |
Production, Transportation and Moving Occupations
The most common Production, Transportation and Moving occupations in Unionville are Transportation (61 | 16.2%), and Production (14 | 3.7%).
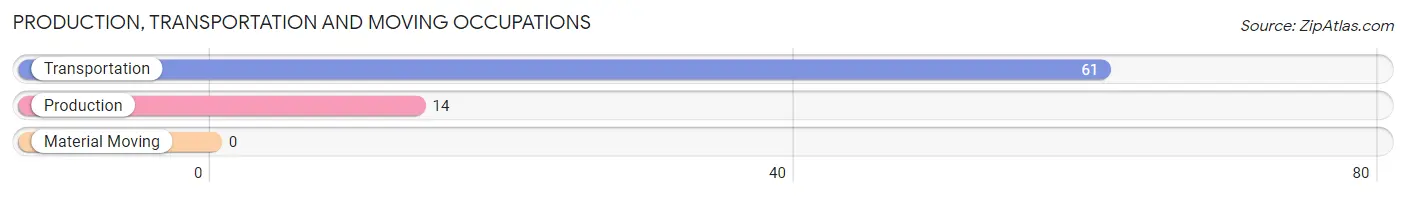
Production, Transportation and Moving Occupations by Sex
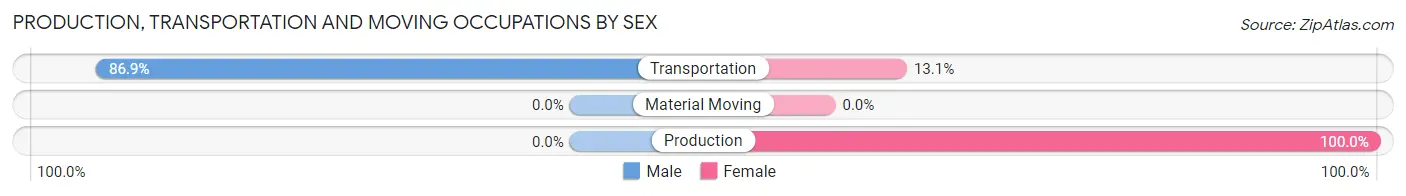
| Occupation | Male | Female |
| Production | 0 (0.0%) | 14 (100.0%) |
| Transportation | 53 (86.9%) | 8 (13.1%) |
| Material Moving | 0 (0.0%) | 0 (0.0%) |
| Total (Category) | 53 (70.7%) | 22 (29.3%) |
| Total (Overall) | 187 (49.7%) | 189 (50.3%) |
Employment Industries by Sex in Unionville
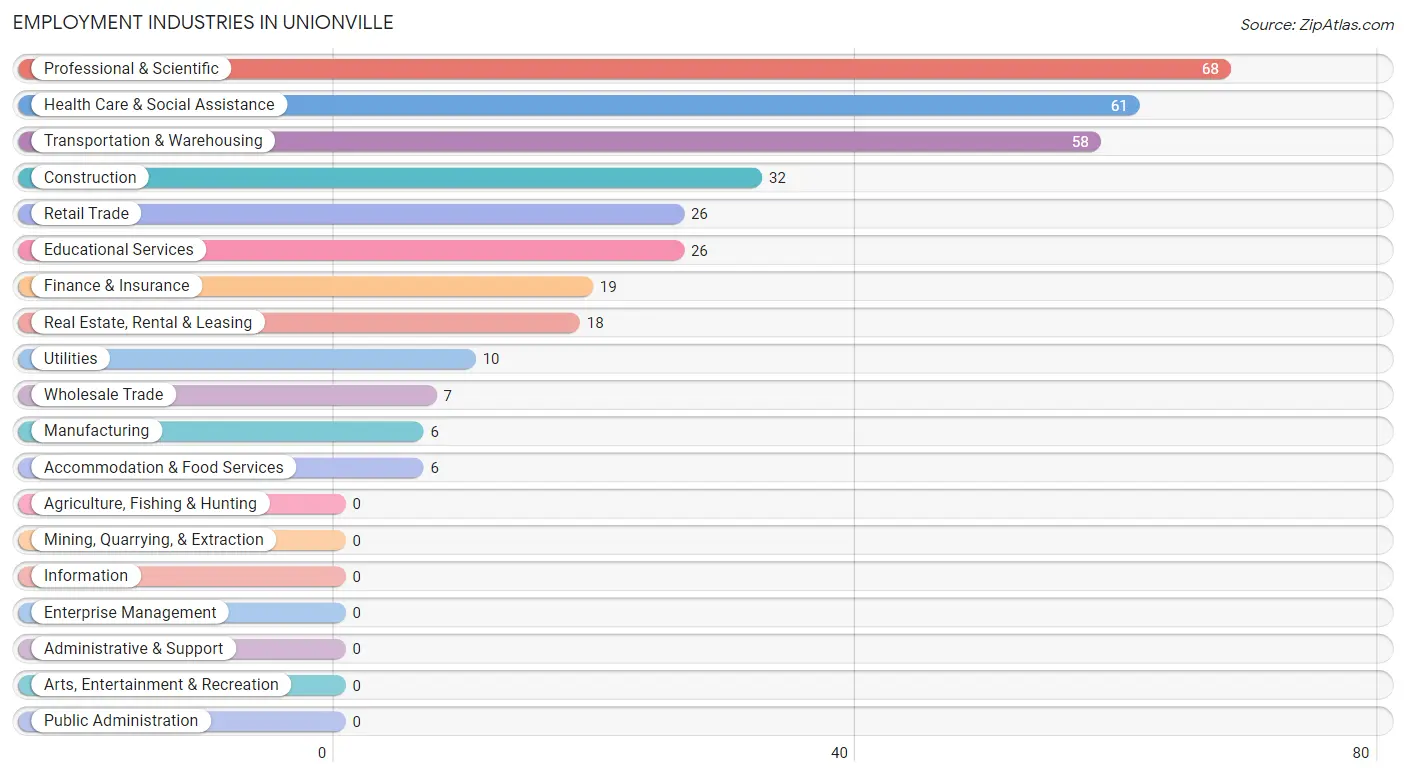
Employment Industries in Unionville
The major employment industries in Unionville include Professional & Scientific (68 | 18.1%), Health Care & Social Assistance (61 | 16.2%), Transportation & Warehousing (58 | 15.4%), Construction (32 | 8.5%), and Retail Trade (26 | 6.9%).
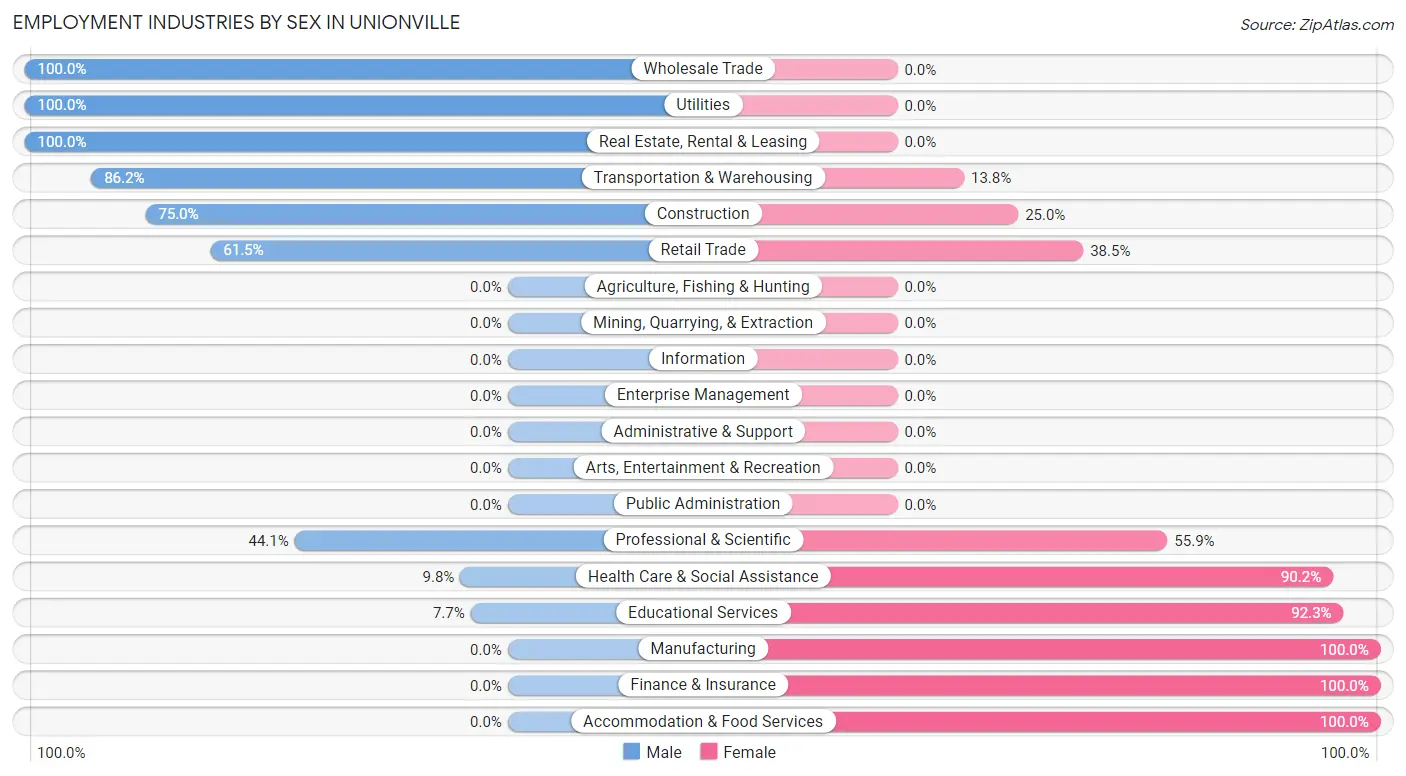
Employment Industries by Sex in Unionville
The Unionville industries that see more men than women are Wholesale Trade (100.0%), Utilities (100.0%), and Real Estate, Rental & Leasing (100.0%), whereas the industries that tend to have a higher number of women are Manufacturing (100.0%), Finance & Insurance (100.0%), and Accommodation & Food Services (100.0%).
| Industry | Male | Female |
| Agriculture, Fishing & Hunting | 0 (0.0%) | 0 (0.0%) |
| Mining, Quarrying, & Extraction | 0 (0.0%) | 0 (0.0%) |
| Construction | 24 (75.0%) | 8 (25.0%) |
| Manufacturing | 0 (0.0%) | 6 (100.0%) |
| Wholesale Trade | 7 (100.0%) | 0 (0.0%) |
| Retail Trade | 16 (61.5%) | 10 (38.5%) |
| Transportation & Warehousing | 50 (86.2%) | 8 (13.8%) |
| Utilities | 10 (100.0%) | 0 (0.0%) |
| Information | 0 (0.0%) | 0 (0.0%) |
| Finance & Insurance | 0 (0.0%) | 19 (100.0%) |
| Real Estate, Rental & Leasing | 18 (100.0%) | 0 (0.0%) |
| Professional & Scientific | 30 (44.1%) | 38 (55.9%) |
| Enterprise Management | 0 (0.0%) | 0 (0.0%) |
| Administrative & Support | 0 (0.0%) | 0 (0.0%) |
| Educational Services | 2 (7.7%) | 24 (92.3%) |
| Health Care & Social Assistance | 6 (9.8%) | 55 (90.2%) |
| Arts, Entertainment & Recreation | 0 (0.0%) | 0 (0.0%) |
| Accommodation & Food Services | 0 (0.0%) | 6 (100.0%) |
| Public Administration | 0 (0.0%) | 0 (0.0%) |
| Total | 187 (49.7%) | 189 (50.3%) |
Education in Unionville
School Enrollment in Unionville
The most common levels of schooling among the 170 students in Unionville are middle school (49 | 28.8%), nursery / preschool (25 | 14.7%), and kindergarten (24 | 14.1%).
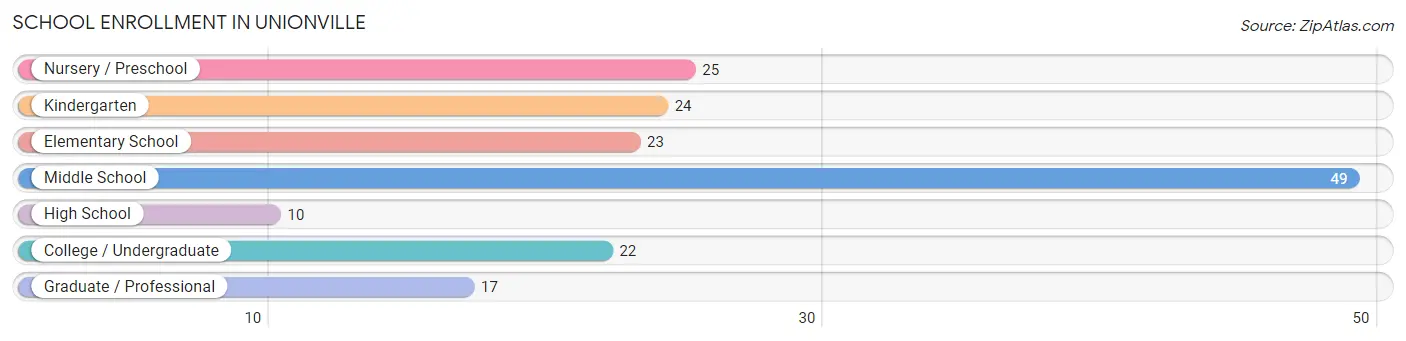
| School Level | # Students | % Students |
| Nursery / Preschool | 25 | 14.7% |
| Kindergarten | 24 | 14.1% |
| Elementary School | 23 | 13.5% |
| Middle School | 49 | 28.8% |
| High School | 10 | 5.9% |
| College / Undergraduate | 22 | 12.9% |
| Graduate / Professional | 17 | 10.0% |
| Total | 170 | 100.0% |
School Enrollment by Age by Funding Source in Unionville
Out of a total of 170 students who are enrolled in schools in Unionville, 17 (10.0%) attend a private institution, while the remaining 153 (90.0%) are enrolled in public schools. The age group of 25 to 34 year olds has the highest likelihood of being enrolled in private schools, with 8 (47.1% in the age bracket) enrolled. Conversely, the age group of 3 to 4 year olds has the lowest likelihood of being enrolled in a private school, with 25 (100.0% in the age bracket) attending a public institution.
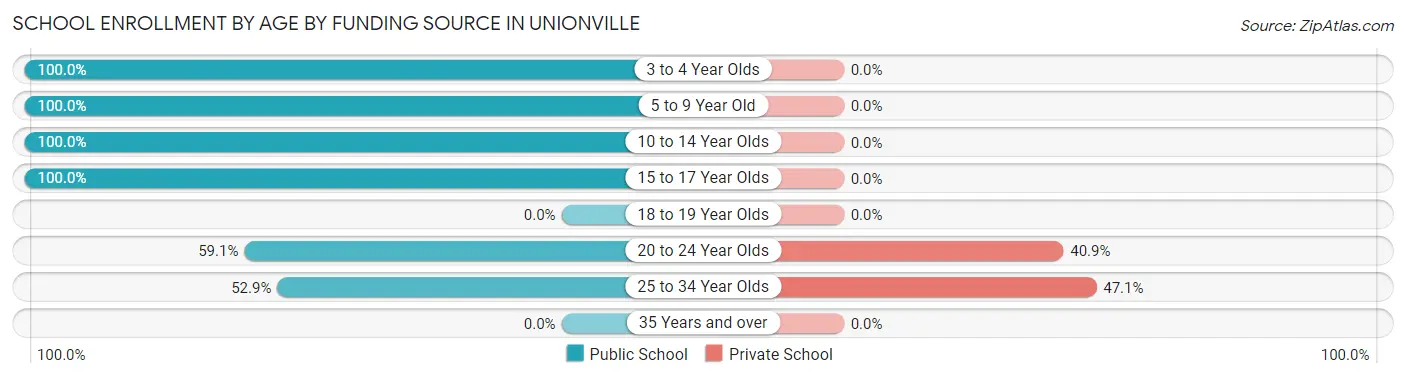
| Age Bracket | Public School | Private School |
| 3 to 4 Year Olds | 25 (100.0%) | 0 (0.0%) |
| 5 to 9 Year Old | 47 (100.0%) | 0 (0.0%) |
| 10 to 14 Year Olds | 49 (100.0%) | 0 (0.0%) |
| 15 to 17 Year Olds | 10 (100.0%) | 0 (0.0%) |
| 18 to 19 Year Olds | 0 (0.0%) | 0 (0.0%) |
| 20 to 24 Year Olds | 13 (59.1%) | 9 (40.9%) |
| 25 to 34 Year Olds | 9 (52.9%) | 8 (47.1%) |
| 35 Years and over | 0 (0.0%) | 0 (0.0%) |
| Total | 153 (90.0%) | 17 (10.0%) |
Educational Attainment by Field of Study in Unionville
Science & technology (31 | 20.0%), arts & humanities (26 | 16.8%), bio, nature & agricultural (25 | 16.1%), literature & languages (17 | 11.0%), and psychology (15 | 9.7%) are the most common fields of study among 155 individuals in Unionville who have obtained a bachelor's degree or higher.
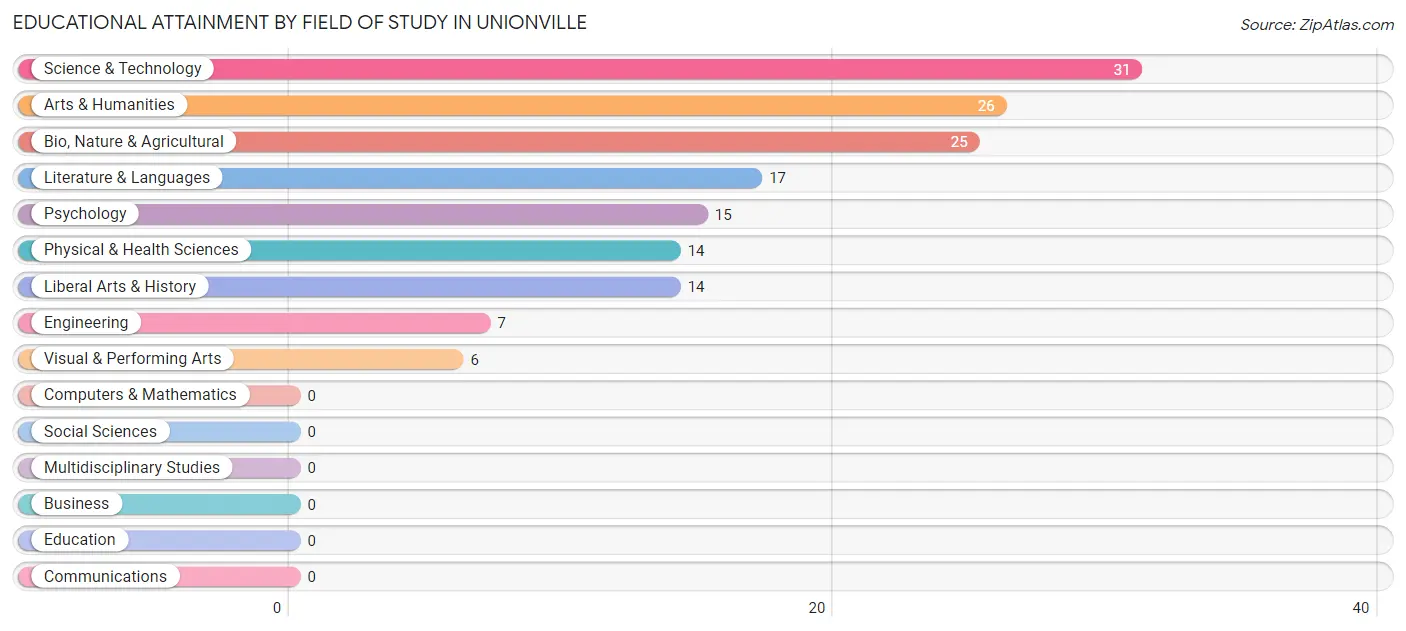
| Field of Study | # Graduates | % Graduates |
| Computers & Mathematics | 0 | 0.0% |
| Bio, Nature & Agricultural | 25 | 16.1% |
| Physical & Health Sciences | 14 | 9.0% |
| Psychology | 15 | 9.7% |
| Social Sciences | 0 | 0.0% |
| Engineering | 7 | 4.5% |
| Multidisciplinary Studies | 0 | 0.0% |
| Science & Technology | 31 | 20.0% |
| Business | 0 | 0.0% |
| Education | 0 | 0.0% |
| Literature & Languages | 17 | 11.0% |
| Liberal Arts & History | 14 | 9.0% |
| Visual & Performing Arts | 6 | 3.9% |
| Communications | 0 | 0.0% |
| Arts & Humanities | 26 | 16.8% |
| Total | 155 | 100.0% |
Transportation & Commute in Unionville
Vehicle Availability by Sex in Unionville
The most prevalent vehicle ownership categories in Unionville are males with 2 vehicles (139, accounting for 74.3%) and females with 2 vehicles (125, making up 76.4%).
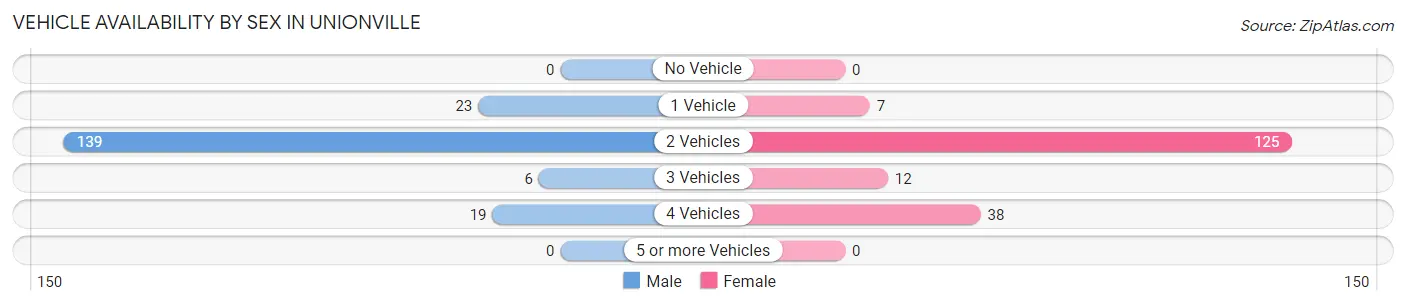
| Vehicles Available | Male | Female |
| No Vehicle | 0 (0.0%) | 0 (0.0%) |
| 1 Vehicle | 23 (12.3%) | 7 (3.8%) |
| 2 Vehicles | 139 (74.3%) | 125 (68.7%) |
| 3 Vehicles | 6 (3.2%) | 12 (6.6%) |
| 4 Vehicles | 19 (10.2%) | 38 (20.9%) |
| 5 or more Vehicles | 0 (0.0%) | 0 (0.0%) |
| Total | 187 (100.0%) | 182 (100.0%) |
Commute Time in Unionville
The most frequently occuring commute durations in Unionville are 25 to 29 minutes (52 commuters, 16.3%), 30 to 34 minutes (43 commuters, 13.4%), and less than 5 minutes (37 commuters, 11.6%).
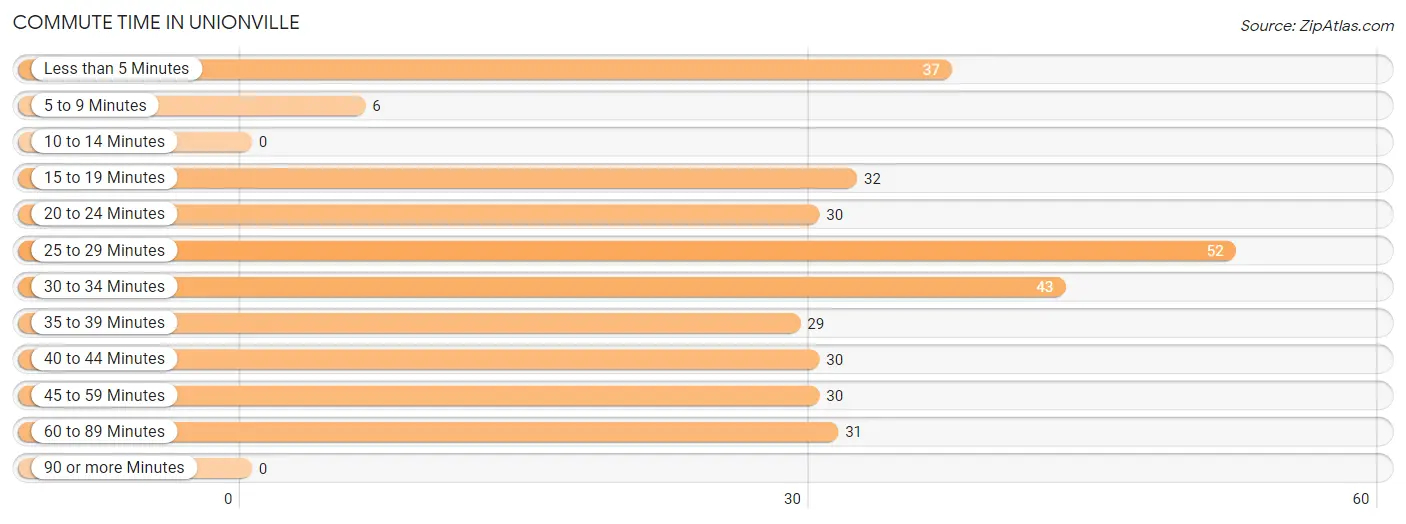
| Commute Time | # Commuters | % Commuters |
| Less than 5 Minutes | 37 | 11.6% |
| 5 to 9 Minutes | 6 | 1.9% |
| 10 to 14 Minutes | 0 | 0.0% |
| 15 to 19 Minutes | 32 | 10.0% |
| 20 to 24 Minutes | 30 | 9.4% |
| 25 to 29 Minutes | 52 | 16.3% |
| 30 to 34 Minutes | 43 | 13.4% |
| 35 to 39 Minutes | 29 | 9.1% |
| 40 to 44 Minutes | 30 | 9.4% |
| 45 to 59 Minutes | 30 | 9.4% |
| 60 to 89 Minutes | 31 | 9.7% |
| 90 or more Minutes | 0 | 0.0% |
Commute Time by Sex in Unionville
The most common commute times in Unionville are 15 to 19 minutes (32 commuters, 17.9%) for males and 25 to 29 minutes (46 commuters, 32.6%) for females.
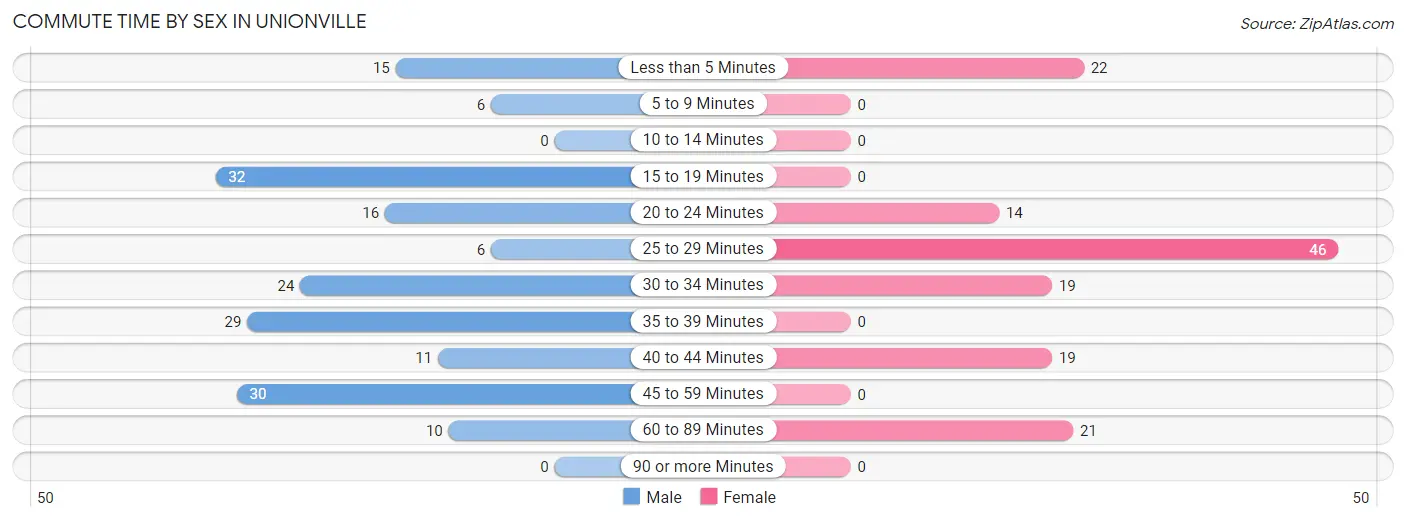
| Commute Time | Male | Female |
| Less than 5 Minutes | 15 (8.4%) | 22 (15.6%) |
| 5 to 9 Minutes | 6 (3.4%) | 0 (0.0%) |
| 10 to 14 Minutes | 0 (0.0%) | 0 (0.0%) |
| 15 to 19 Minutes | 32 (17.9%) | 0 (0.0%) |
| 20 to 24 Minutes | 16 (8.9%) | 14 (9.9%) |
| 25 to 29 Minutes | 6 (3.4%) | 46 (32.6%) |
| 30 to 34 Minutes | 24 (13.4%) | 19 (13.5%) |
| 35 to 39 Minutes | 29 (16.2%) | 0 (0.0%) |
| 40 to 44 Minutes | 11 (6.1%) | 19 (13.5%) |
| 45 to 59 Minutes | 30 (16.8%) | 0 (0.0%) |
| 60 to 89 Minutes | 10 (5.6%) | 21 (14.9%) |
| 90 or more Minutes | 0 (0.0%) | 0 (0.0%) |
Time of Departure to Work by Sex in Unionville
The most frequent times of departure to work in Unionville are 4:00 PM to 11:59 PM (42, 23.5%) for males and 7:00 AM to 7:29 AM (54, 38.3%) for females.
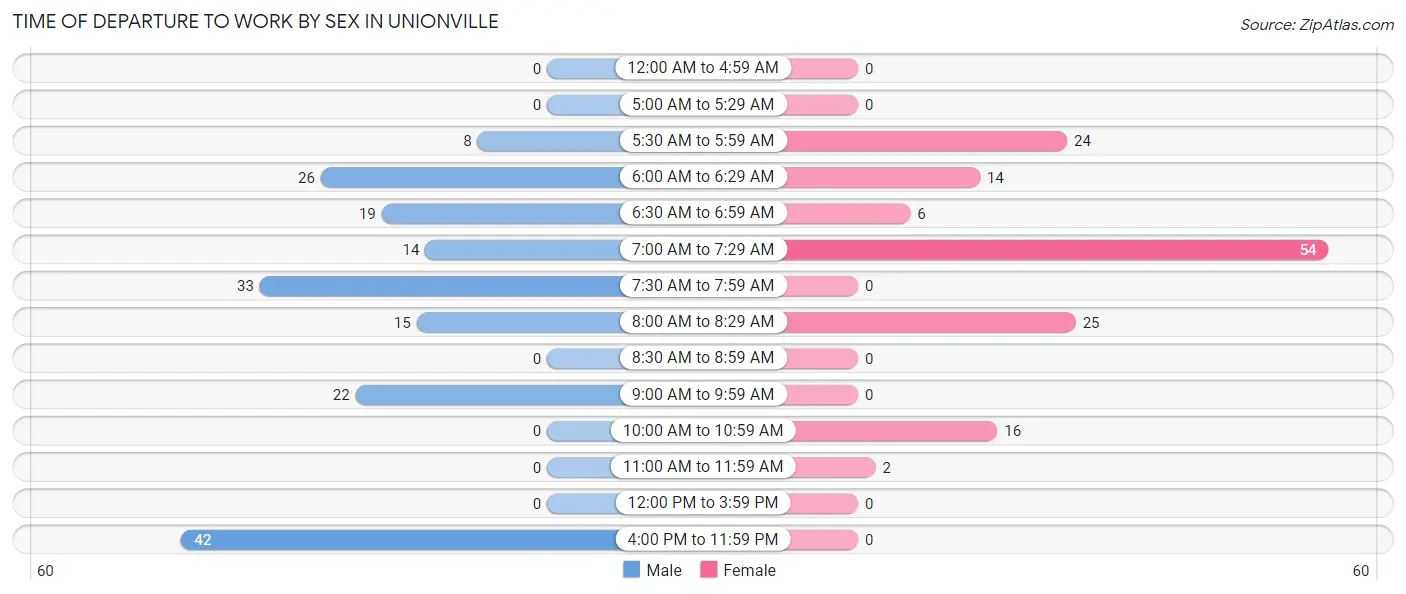
| Time of Departure | Male | Female |
| 12:00 AM to 4:59 AM | 0 (0.0%) | 0 (0.0%) |
| 5:00 AM to 5:29 AM | 0 (0.0%) | 0 (0.0%) |
| 5:30 AM to 5:59 AM | 8 (4.5%) | 24 (17.0%) |
| 6:00 AM to 6:29 AM | 26 (14.5%) | 14 (9.9%) |
| 6:30 AM to 6:59 AM | 19 (10.6%) | 6 (4.3%) |
| 7:00 AM to 7:29 AM | 14 (7.8%) | 54 (38.3%) |
| 7:30 AM to 7:59 AM | 33 (18.4%) | 0 (0.0%) |
| 8:00 AM to 8:29 AM | 15 (8.4%) | 25 (17.7%) |
| 8:30 AM to 8:59 AM | 0 (0.0%) | 0 (0.0%) |
| 9:00 AM to 9:59 AM | 22 (12.3%) | 0 (0.0%) |
| 10:00 AM to 10:59 AM | 0 (0.0%) | 16 (11.4%) |
| 11:00 AM to 11:59 AM | 0 (0.0%) | 2 (1.4%) |
| 12:00 PM to 3:59 PM | 0 (0.0%) | 0 (0.0%) |
| 4:00 PM to 11:59 PM | 42 (23.5%) | 0 (0.0%) |
| Total | 179 (100.0%) | 141 (100.0%) |
Housing Occupancy in Unionville
Occupancy by Ownership in Unionville
Of the total 228 dwellings in Unionville, owner-occupied units account for 136 (59.7%), while renter-occupied units make up 92 (40.4%).
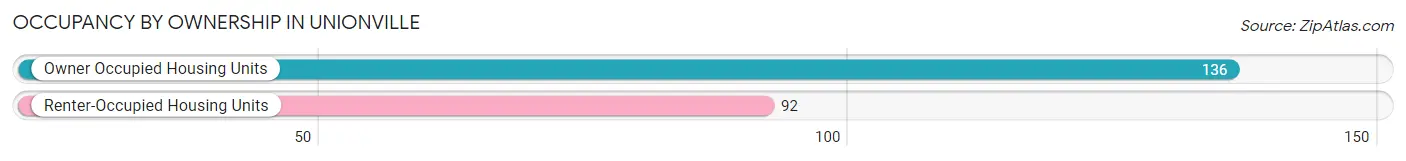
| Occupancy | # Housing Units | % Housing Units |
| Owner Occupied Housing Units | 136 | 59.7% |
| Renter-Occupied Housing Units | 92 | 40.4% |
| Total Occupied Housing Units | 228 | 100.0% |
Occupancy by Household Size in Unionville
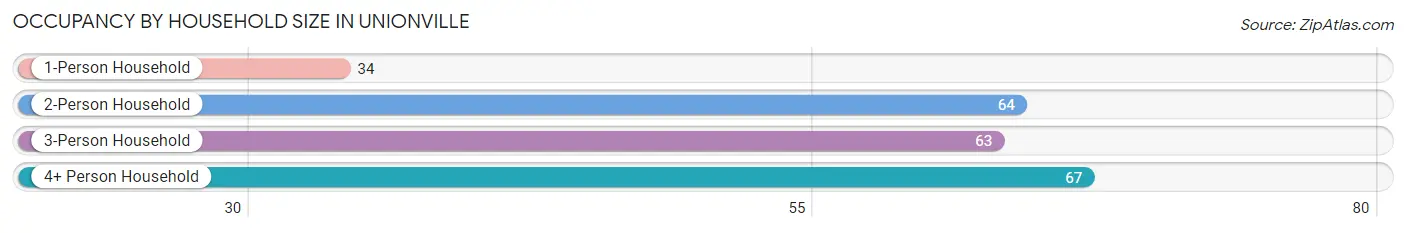
| Household Size | # Housing Units | % Housing Units |
| 1-Person Household | 34 | 14.9% |
| 2-Person Household | 64 | 28.1% |
| 3-Person Household | 63 | 27.6% |
| 4+ Person Household | 67 | 29.4% |
| Total Housing Units | 228 | 100.0% |
Occupancy by Ownership by Household Size in Unionville
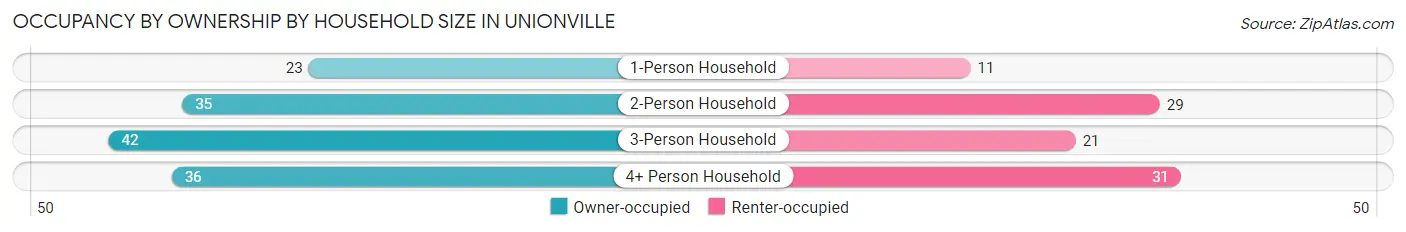
| Household Size | Owner-occupied | Renter-occupied |
| 1-Person Household | 23 (67.6%) | 11 (32.4%) |
| 2-Person Household | 35 (54.7%) | 29 (45.3%) |
| 3-Person Household | 42 (66.7%) | 21 (33.3%) |
| 4+ Person Household | 36 (53.7%) | 31 (46.3%) |
| Total Housing Units | 136 (59.7%) | 92 (40.4%) |
Occupancy by Educational Attainment in Unionville
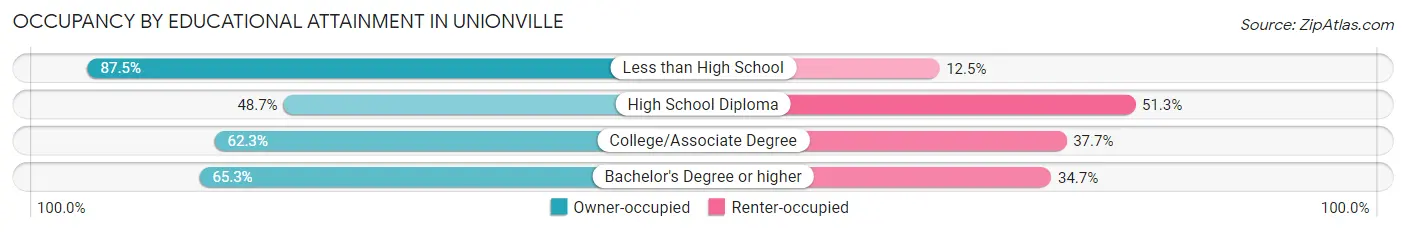
| Household Size | Owner-occupied | Renter-occupied |
| Less than High School | 7 (87.5%) | 1 (12.5%) |
| High School Diploma | 37 (48.7%) | 39 (51.3%) |
| College/Associate Degree | 43 (62.3%) | 26 (37.7%) |
| Bachelor's Degree or higher | 49 (65.3%) | 26 (34.7%) |
Occupancy by Age of Householder in Unionville
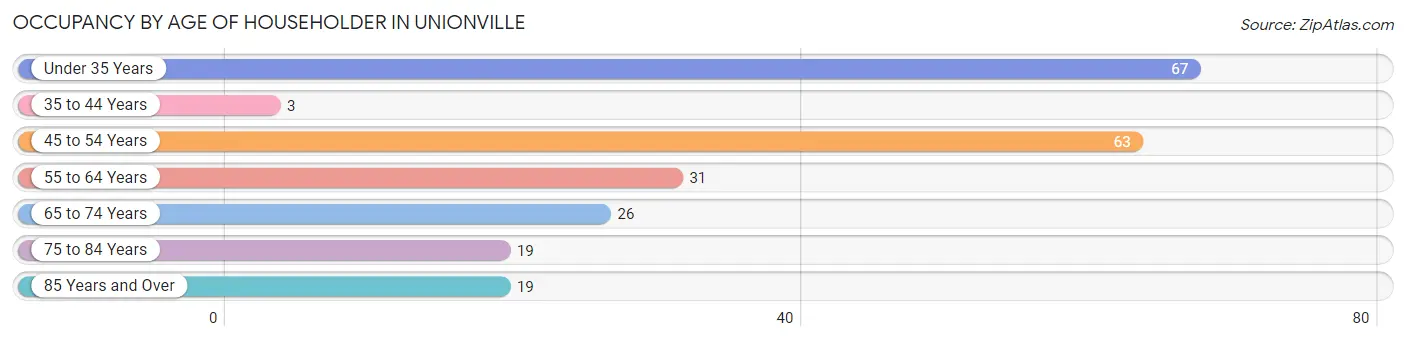
| Age Bracket | # Households | % Households |
| Under 35 Years | 67 | 29.4% |
| 35 to 44 Years | 3 | 1.3% |
| 45 to 54 Years | 63 | 27.6% |
| 55 to 64 Years | 31 | 13.6% |
| 65 to 74 Years | 26 | 11.4% |
| 75 to 84 Years | 19 | 8.3% |
| 85 Years and Over | 19 | 8.3% |
| Total | 228 | 100.0% |
Housing Finances in Unionville
Median Income by Occupancy in Unionville
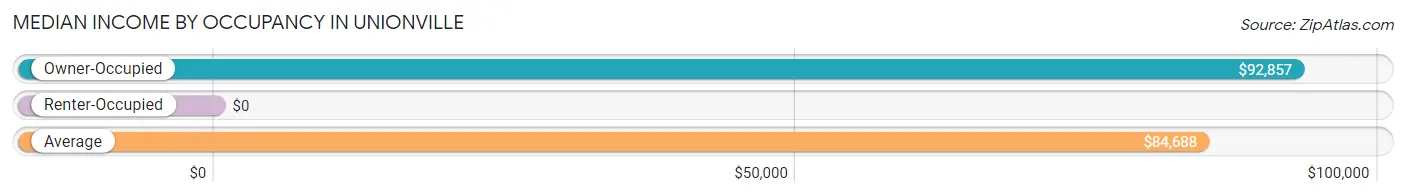
| Occupancy Type | # Households | Median Income |
| Owner-Occupied | 136 (59.7%) | $92,857 |
| Renter-Occupied | 92 (40.4%) | $0 |
| Average | 228 (100.0%) | $84,688 |
Occupancy by Householder Income Bracket in Unionville
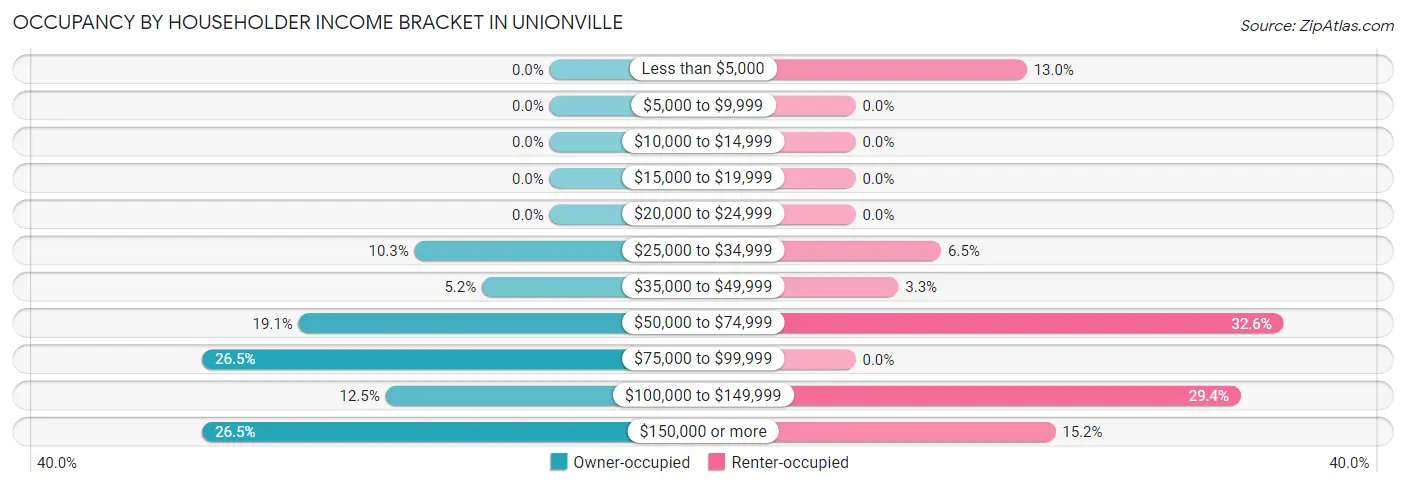
| Income Bracket | Owner-occupied | Renter-occupied |
| Less than $5,000 | 0 (0.0%) | 12 (13.0%) |
| $5,000 to $9,999 | 0 (0.0%) | 0 (0.0%) |
| $10,000 to $14,999 | 0 (0.0%) | 0 (0.0%) |
| $15,000 to $19,999 | 0 (0.0%) | 0 (0.0%) |
| $20,000 to $24,999 | 0 (0.0%) | 0 (0.0%) |
| $25,000 to $34,999 | 14 (10.3%) | 6 (6.5%) |
| $35,000 to $49,999 | 7 (5.1%) | 3 (3.3%) |
| $50,000 to $74,999 | 26 (19.1%) | 30 (32.6%) |
| $75,000 to $99,999 | 36 (26.5%) | 0 (0.0%) |
| $100,000 to $149,999 | 17 (12.5%) | 27 (29.3%) |
| $150,000 or more | 36 (26.5%) | 14 (15.2%) |
| Total | 136 (100.0%) | 92 (100.0%) |
Monthly Housing Cost Tiers in Unionville
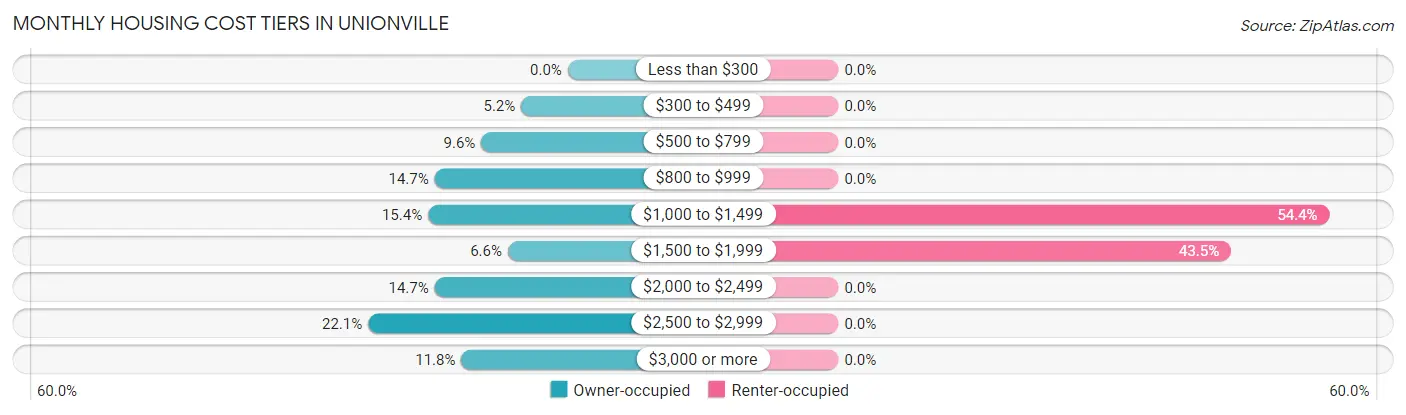
| Monthly Cost | Owner-occupied | Renter-occupied |
| Less than $300 | 0 (0.0%) | 0 (0.0%) |
| $300 to $499 | 7 (5.1%) | 0 (0.0%) |
| $500 to $799 | 13 (9.6%) | 0 (0.0%) |
| $800 to $999 | 20 (14.7%) | 0 (0.0%) |
| $1,000 to $1,499 | 21 (15.4%) | 50 (54.3%) |
| $1,500 to $1,999 | 9 (6.6%) | 40 (43.5%) |
| $2,000 to $2,499 | 20 (14.7%) | 0 (0.0%) |
| $2,500 to $2,999 | 30 (22.1%) | 0 (0.0%) |
| $3,000 or more | 16 (11.8%) | 0 (0.0%) |
| Total | 136 (100.0%) | 92 (100.0%) |
Physical Housing Characteristics in Unionville
Housing Structures in Unionville
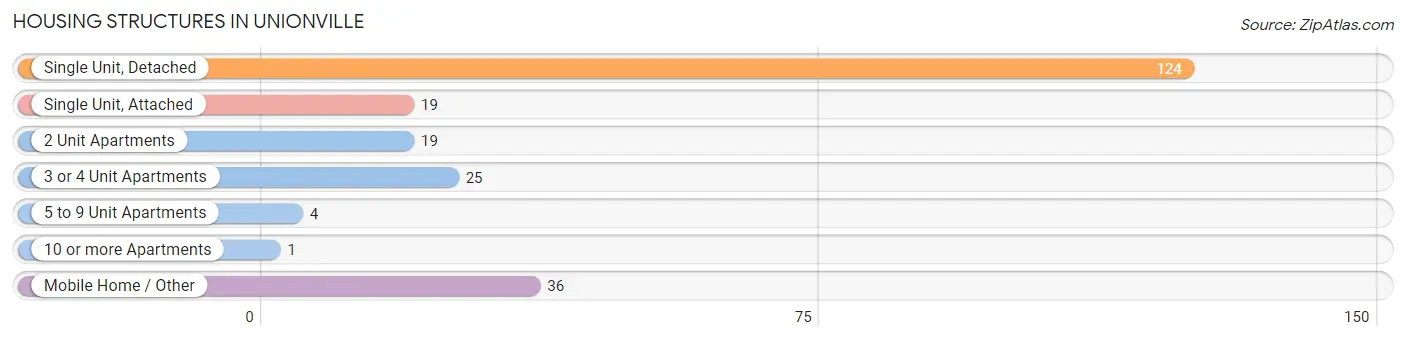
| Structure Type | # Housing Units | % Housing Units |
| Single Unit, Detached | 124 | 54.4% |
| Single Unit, Attached | 19 | 8.3% |
| 2 Unit Apartments | 19 | 8.3% |
| 3 or 4 Unit Apartments | 25 | 11.0% |
| 5 to 9 Unit Apartments | 4 | 1.8% |
| 10 or more Apartments | 1 | 0.4% |
| Mobile Home / Other | 36 | 15.8% |
| Total | 228 | 100.0% |
Housing Structures by Occupancy in Unionville
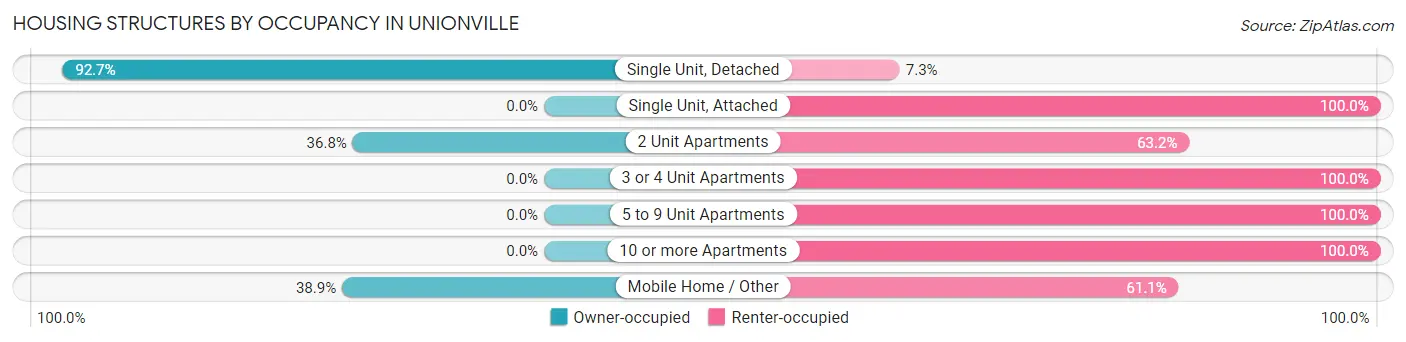
| Structure Type | Owner-occupied | Renter-occupied |
| Single Unit, Detached | 115 (92.7%) | 9 (7.3%) |
| Single Unit, Attached | 0 (0.0%) | 19 (100.0%) |
| 2 Unit Apartments | 7 (36.8%) | 12 (63.2%) |
| 3 or 4 Unit Apartments | 0 (0.0%) | 25 (100.0%) |
| 5 to 9 Unit Apartments | 0 (0.0%) | 4 (100.0%) |
| 10 or more Apartments | 0 (0.0%) | 1 (100.0%) |
| Mobile Home / Other | 14 (38.9%) | 22 (61.1%) |
| Total | 136 (59.7%) | 92 (40.4%) |
Housing Structures by Number of Rooms in Unionville
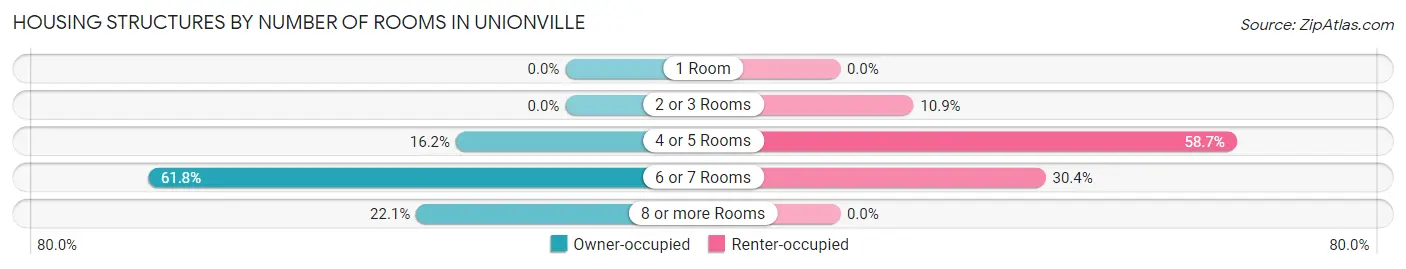
| Number of Rooms | Owner-occupied | Renter-occupied |
| 1 Room | 0 (0.0%) | 0 (0.0%) |
| 2 or 3 Rooms | 0 (0.0%) | 10 (10.9%) |
| 4 or 5 Rooms | 22 (16.2%) | 54 (58.7%) |
| 6 or 7 Rooms | 84 (61.8%) | 28 (30.4%) |
| 8 or more Rooms | 30 (22.1%) | 0 (0.0%) |
| Total | 136 (100.0%) | 92 (100.0%) |
Housing Structure by Heating Type in Unionville
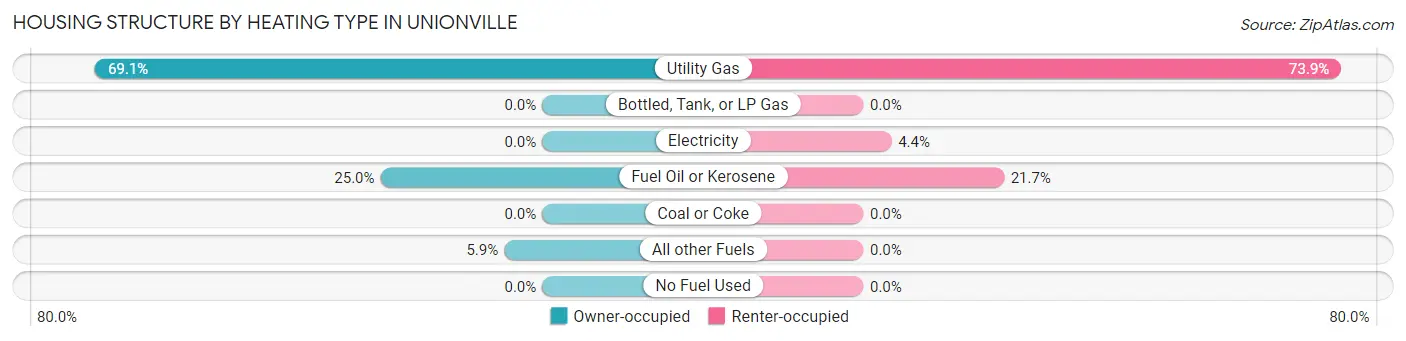
| Heating Type | Owner-occupied | Renter-occupied |
| Utility Gas | 94 (69.1%) | 68 (73.9%) |
| Bottled, Tank, or LP Gas | 0 (0.0%) | 0 (0.0%) |
| Electricity | 0 (0.0%) | 4 (4.3%) |
| Fuel Oil or Kerosene | 34 (25.0%) | 20 (21.7%) |
| Coal or Coke | 0 (0.0%) | 0 (0.0%) |
| All other Fuels | 8 (5.9%) | 0 (0.0%) |
| No Fuel Used | 0 (0.0%) | 0 (0.0%) |
| Total | 136 (100.0%) | 92 (100.0%) |
Household Vehicle Usage in Unionville
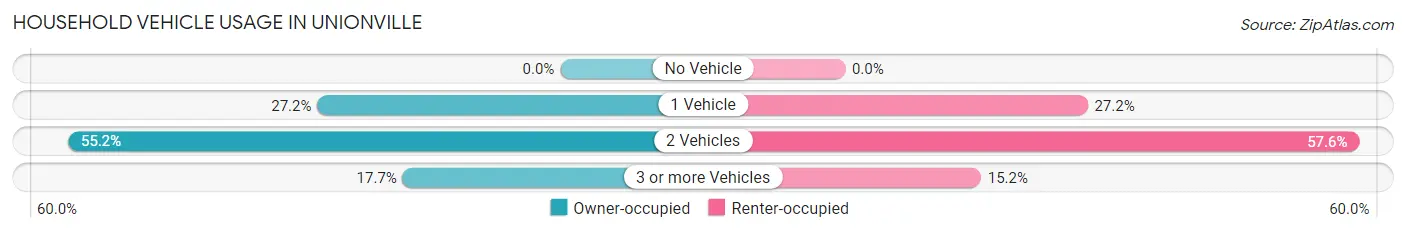
| Vehicles per Household | Owner-occupied | Renter-occupied |
| No Vehicle | 0 (0.0%) | 0 (0.0%) |
| 1 Vehicle | 37 (27.2%) | 25 (27.2%) |
| 2 Vehicles | 75 (55.1%) | 53 (57.6%) |
| 3 or more Vehicles | 24 (17.6%) | 14 (15.2%) |
| Total | 136 (100.0%) | 92 (100.0%) |
Real Estate & Mortgages in Unionville
Real Estate and Mortgage Overview in Unionville
| Characteristic | Without Mortgage | With Mortgage |
| Housing Units | 35 | 101 |
| Median Property Value | $195,800 | $323,800 |
| Median Household Income | $61,042 | $30 |
| Monthly Housing Costs | $758 | $16 |
| Real Estate Taxes | $3,500 | $0 |
Property Value by Mortgage Status in Unionville
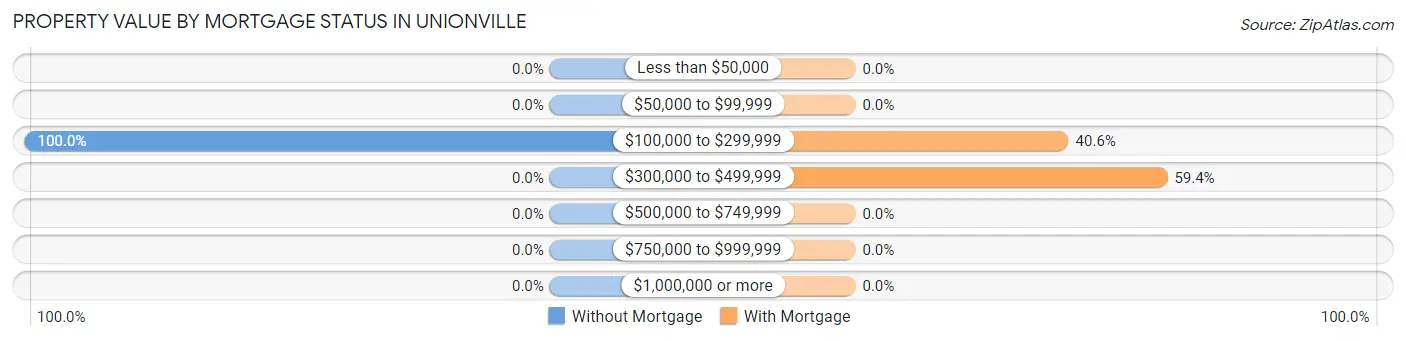
| Property Value | Without Mortgage | With Mortgage |
| Less than $50,000 | 0 (0.0%) | 0 (0.0%) |
| $50,000 to $99,999 | 0 (0.0%) | 0 (0.0%) |
| $100,000 to $299,999 | 35 (100.0%) | 41 (40.6%) |
| $300,000 to $499,999 | 0 (0.0%) | 60 (59.4%) |
| $500,000 to $749,999 | 0 (0.0%) | 0 (0.0%) |
| $750,000 to $999,999 | 0 (0.0%) | 0 (0.0%) |
| $1,000,000 or more | 0 (0.0%) | 0 (0.0%) |
| Total | 35 (100.0%) | 101 (100.0%) |
Household Income by Mortgage Status in Unionville
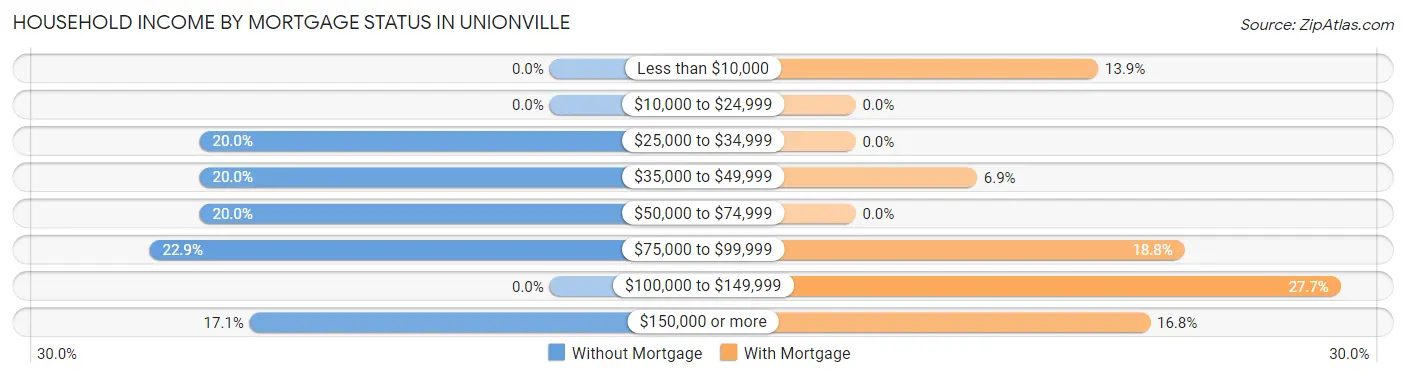
| Household Income | Without Mortgage | With Mortgage |
| Less than $10,000 | 0 (0.0%) | 14 (13.9%) |
| $10,000 to $24,999 | 0 (0.0%) | 0 (0.0%) |
| $25,000 to $34,999 | 7 (20.0%) | 0 (0.0%) |
| $35,000 to $49,999 | 7 (20.0%) | 7 (6.9%) |
| $50,000 to $74,999 | 7 (20.0%) | 0 (0.0%) |
| $75,000 to $99,999 | 8 (22.9%) | 19 (18.8%) |
| $100,000 to $149,999 | 0 (0.0%) | 28 (27.7%) |
| $150,000 or more | 6 (17.1%) | 17 (16.8%) |
| Total | 35 (100.0%) | 101 (100.0%) |
Property Value to Household Income Ratio in Unionville
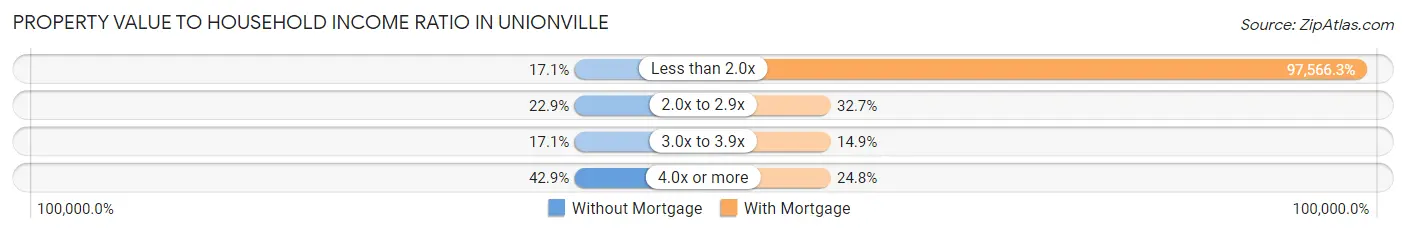
| Value-to-Income Ratio | Without Mortgage | With Mortgage |
| Less than 2.0x | 6 (17.1%) | 98,542 (97,566.3%) |
| 2.0x to 2.9x | 8 (22.9%) | 33 (32.7%) |
| 3.0x to 3.9x | 6 (17.1%) | 15 (14.8%) |
| 4.0x or more | 15 (42.9%) | 25 (24.7%) |
| Total | 35 (100.0%) | 101 (100.0%) |
Real Estate Taxes by Mortgage Status in Unionville
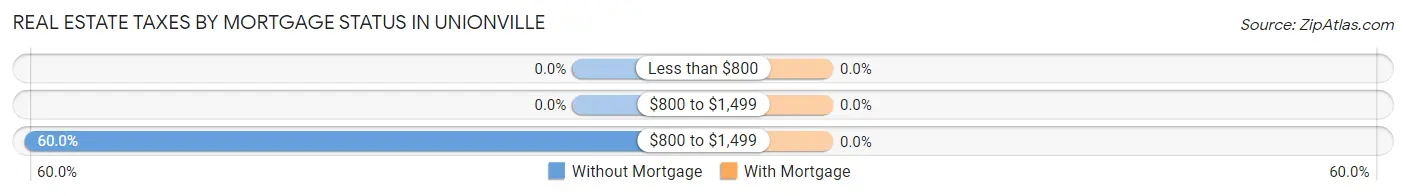
| Property Taxes | Without Mortgage | With Mortgage |
| Less than $800 | 0 (0.0%) | 0 (0.0%) |
| $800 to $1,499 | 0 (0.0%) | 0 (0.0%) |
| $800 to $1,499 | 21 (60.0%) | 0 (0.0%) |
| Total | 35 (100.0%) | 101 (100.0%) |
Health & Disability in Unionville
Health Insurance Coverage by Age in Unionville
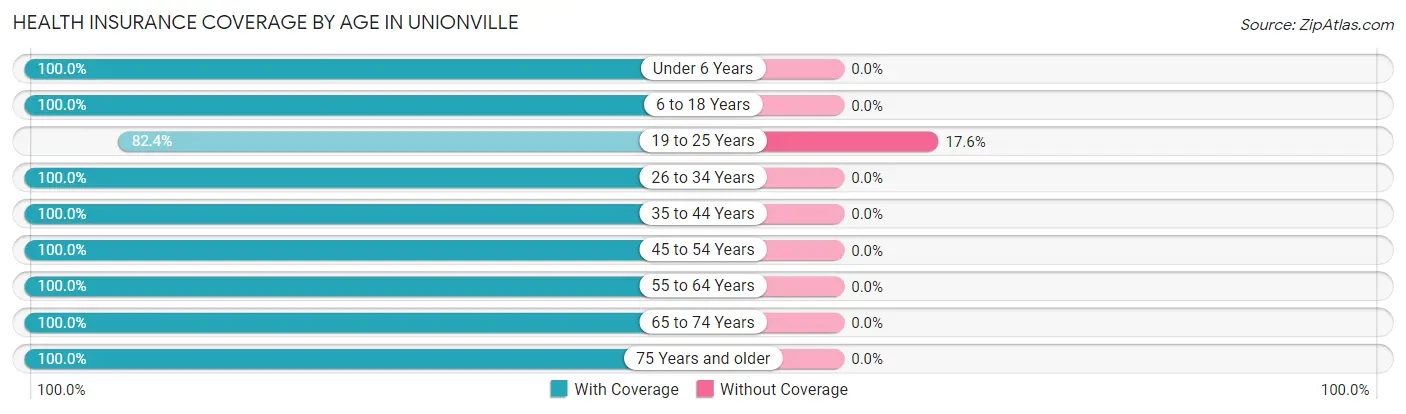
| Age Bracket | With Coverage | Without Coverage |
| Under 6 Years | 90 (100.0%) | 0 (0.0%) |
| 6 to 18 Years | 82 (100.0%) | 0 (0.0%) |
| 19 to 25 Years | 75 (82.4%) | 16 (17.6%) |
| 26 to 34 Years | 112 (100.0%) | 0 (0.0%) |
| 35 to 44 Years | 51 (100.0%) | 0 (0.0%) |
| 45 to 54 Years | 86 (100.0%) | 0 (0.0%) |
| 55 to 64 Years | 39 (100.0%) | 0 (0.0%) |
| 65 to 74 Years | 51 (100.0%) | 0 (0.0%) |
| 75 Years and older | 68 (100.0%) | 0 (0.0%) |
| Total | 654 (97.6%) | 16 (2.4%) |
Health Insurance Coverage by Citizenship Status in Unionville
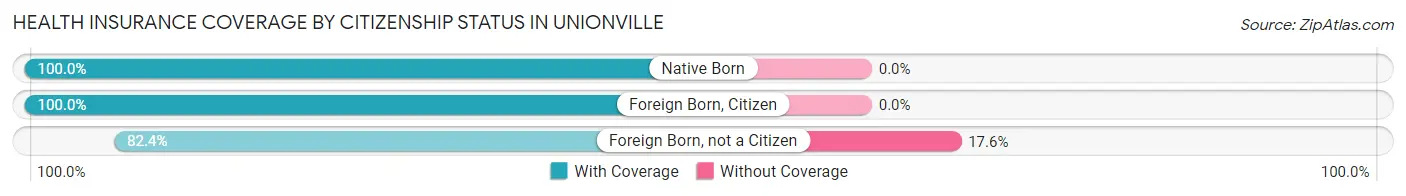
| Citizenship Status | With Coverage | Without Coverage |
| Native Born | 90 (100.0%) | 0 (0.0%) |
| Foreign Born, Citizen | 82 (100.0%) | 0 (0.0%) |
| Foreign Born, not a Citizen | 75 (82.4%) | 16 (17.6%) |
Health Insurance Coverage by Household Income in Unionville
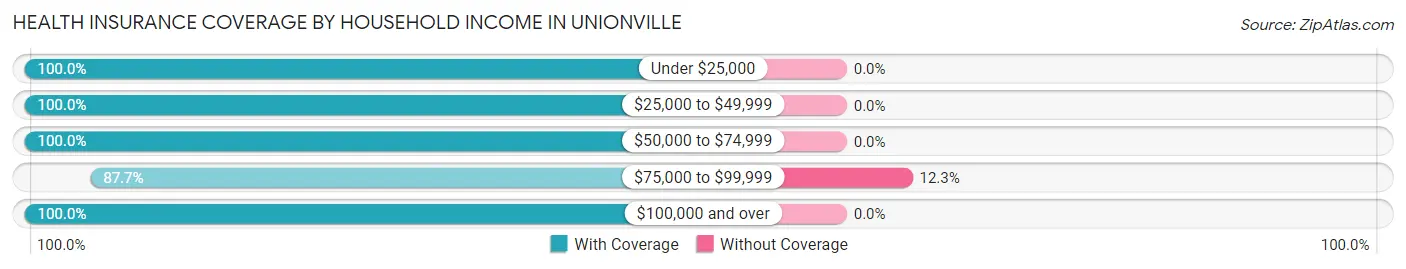
| Household Income | With Coverage | Without Coverage |
| Under $25,000 | 50 (100.0%) | 0 (0.0%) |
| $25,000 to $49,999 | 46 (100.0%) | 0 (0.0%) |
| $50,000 to $74,999 | 130 (100.0%) | 0 (0.0%) |
| $75,000 to $99,999 | 114 (87.7%) | 16 (12.3%) |
| $100,000 and over | 307 (100.0%) | 0 (0.0%) |
Public vs Private Health Insurance Coverage by Age in Unionville
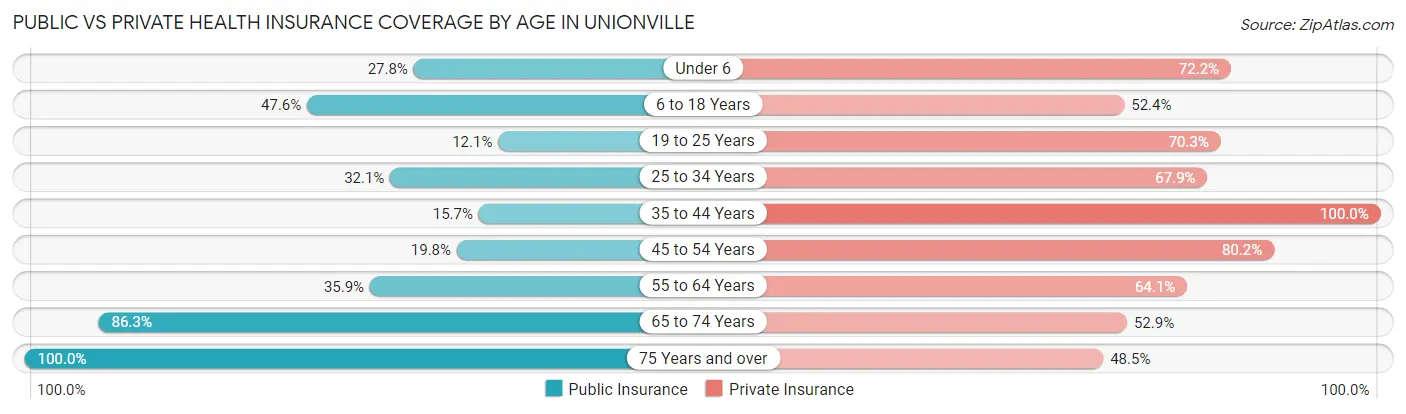
| Age Bracket | Public Insurance | Private Insurance |
| Under 6 | 25 (27.8%) | 65 (72.2%) |
| 6 to 18 Years | 39 (47.6%) | 43 (52.4%) |
| 19 to 25 Years | 11 (12.1%) | 64 (70.3%) |
| 25 to 34 Years | 36 (32.1%) | 76 (67.9%) |
| 35 to 44 Years | 8 (15.7%) | 51 (100.0%) |
| 45 to 54 Years | 17 (19.8%) | 69 (80.2%) |
| 55 to 64 Years | 14 (35.9%) | 25 (64.1%) |
| 65 to 74 Years | 44 (86.3%) | 27 (52.9%) |
| 75 Years and over | 68 (100.0%) | 33 (48.5%) |
| Total | 262 (39.1%) | 453 (67.6%) |
Disability Status by Sex by Age in Unionville
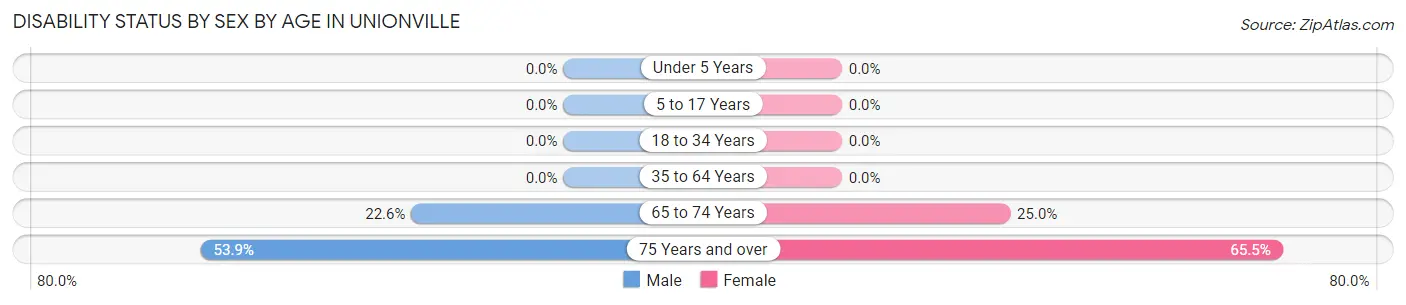
| Age Bracket | Male | Female |
| Under 5 Years | 0 (0.0%) | 0 (0.0%) |
| 5 to 17 Years | 0 (0.0%) | 0 (0.0%) |
| 18 to 34 Years | 0 (0.0%) | 0 (0.0%) |
| 35 to 64 Years | 0 (0.0%) | 0 (0.0%) |
| 65 to 74 Years | 7 (22.6%) | 5 (25.0%) |
| 75 Years and over | 7 (53.8%) | 36 (65.4%) |
Disability Class by Sex by Age in Unionville
Disability Class: Hearing Difficulty
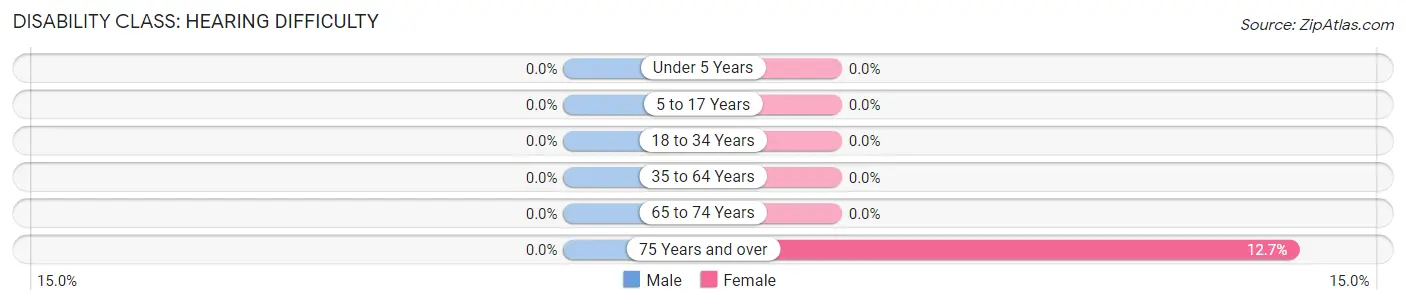
| Age Bracket | Male | Female |
| Under 5 Years | 0 (0.0%) | 0 (0.0%) |
| 5 to 17 Years | 0 (0.0%) | 0 (0.0%) |
| 18 to 34 Years | 0 (0.0%) | 0 (0.0%) |
| 35 to 64 Years | 0 (0.0%) | 0 (0.0%) |
| 65 to 74 Years | 0 (0.0%) | 0 (0.0%) |
| 75 Years and over | 0 (0.0%) | 7 (12.7%) |
Disability Class: Vision Difficulty
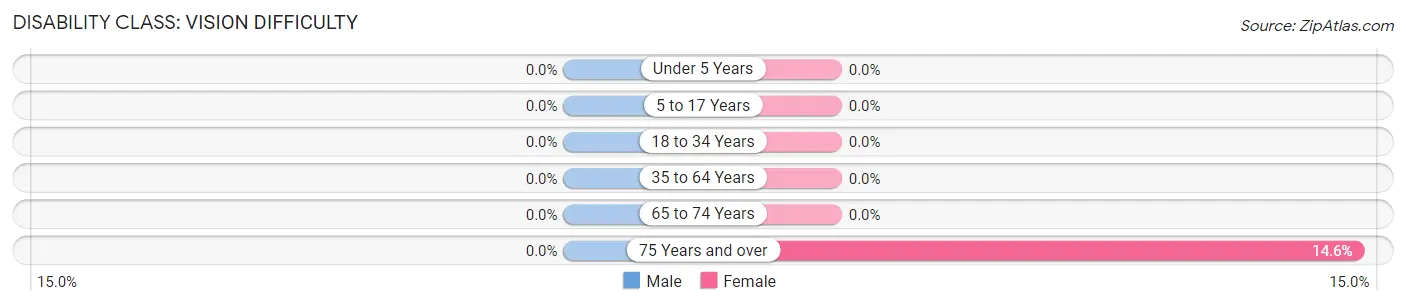
| Age Bracket | Male | Female |
| Under 5 Years | 0 (0.0%) | 0 (0.0%) |
| 5 to 17 Years | 0 (0.0%) | 0 (0.0%) |
| 18 to 34 Years | 0 (0.0%) | 0 (0.0%) |
| 35 to 64 Years | 0 (0.0%) | 0 (0.0%) |
| 65 to 74 Years | 0 (0.0%) | 0 (0.0%) |
| 75 Years and over | 0 (0.0%) | 8 (14.5%) |
Disability Class: Cognitive Difficulty
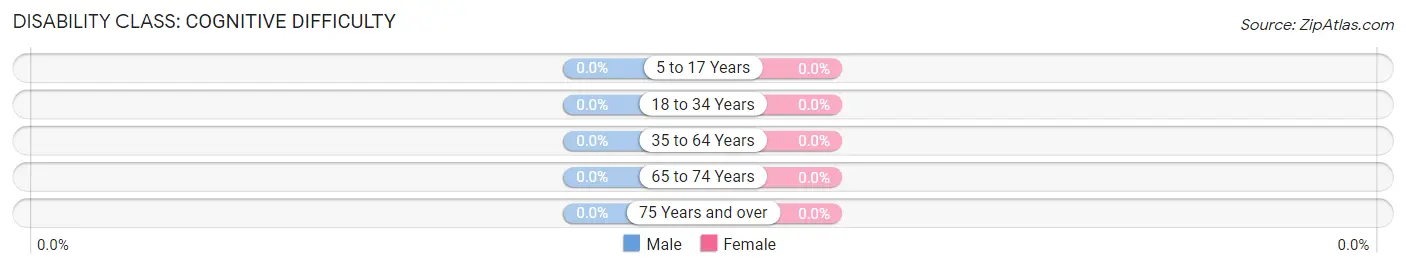
| Age Bracket | Male | Female |
| 5 to 17 Years | 0 (0.0%) | 0 (0.0%) |
| 18 to 34 Years | 0 (0.0%) | 0 (0.0%) |
| 35 to 64 Years | 0 (0.0%) | 0 (0.0%) |
| 65 to 74 Years | 0 (0.0%) | 0 (0.0%) |
| 75 Years and over | 0 (0.0%) | 0 (0.0%) |
Disability Class: Ambulatory Difficulty
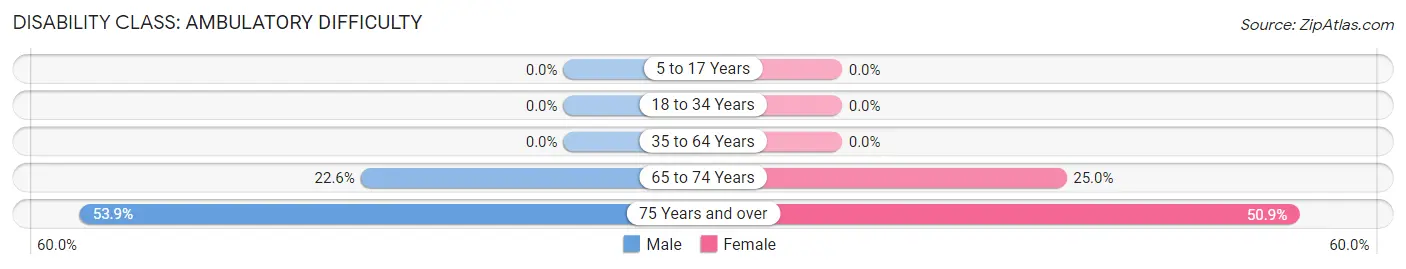
| Age Bracket | Male | Female |
| 5 to 17 Years | 0 (0.0%) | 0 (0.0%) |
| 18 to 34 Years | 0 (0.0%) | 0 (0.0%) |
| 35 to 64 Years | 0 (0.0%) | 0 (0.0%) |
| 65 to 74 Years | 7 (22.6%) | 5 (25.0%) |
| 75 Years and over | 7 (53.8%) | 28 (50.9%) |
Disability Class: Self-Care Difficulty
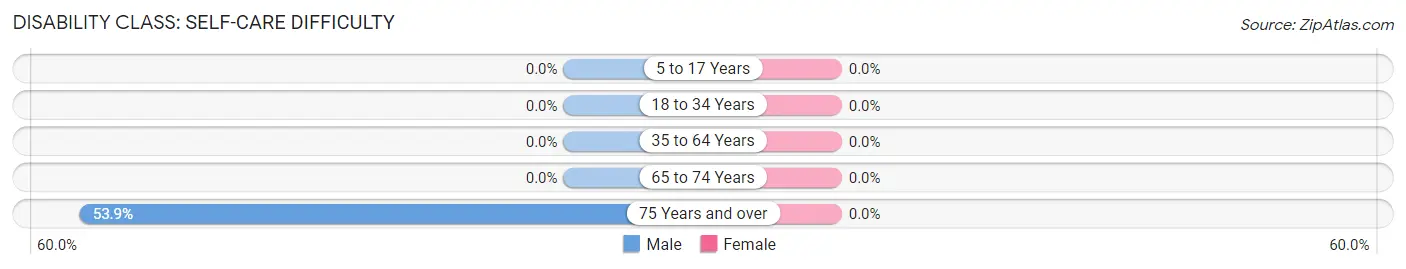
| Age Bracket | Male | Female |
| 5 to 17 Years | 0 (0.0%) | 0 (0.0%) |
| 18 to 34 Years | 0 (0.0%) | 0 (0.0%) |
| 35 to 64 Years | 0 (0.0%) | 0 (0.0%) |
| 65 to 74 Years | 0 (0.0%) | 0 (0.0%) |
| 75 Years and over | 7 (53.8%) | 0 (0.0%) |
Technology Access in Unionville
Computing Device Access in Unionville
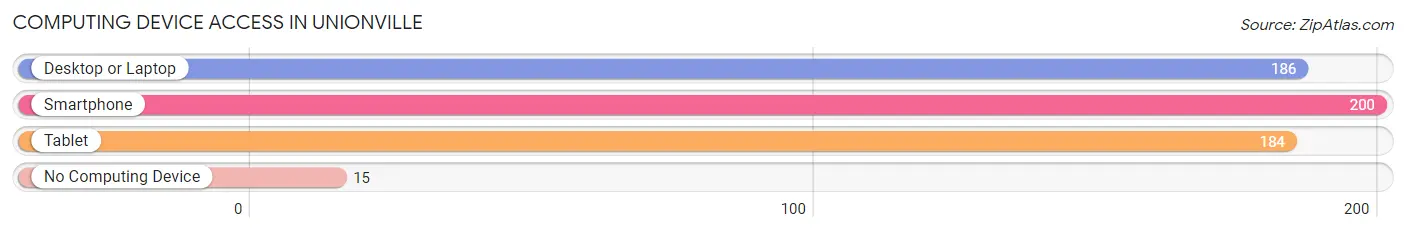
| Device Type | # Households | % Households |
| Desktop or Laptop | 186 | 81.6% |
| Smartphone | 200 | 87.7% |
| Tablet | 184 | 80.7% |
| No Computing Device | 15 | 6.6% |
| Total | 228 | 100.0% |
Internet Access in Unionville
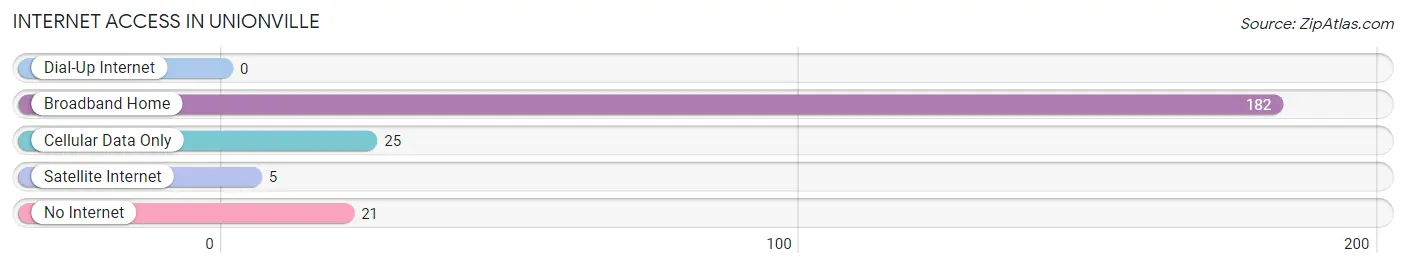
| Internet Type | # Households | % Households |
| Dial-Up Internet | 0 | 0.0% |
| Broadband Home | 182 | 79.8% |
| Cellular Data Only | 25 | 11.0% |
| Satellite Internet | 5 | 2.2% |
| No Internet | 21 | 9.2% |
| Total | 228 | 100.0% |
Unionville Summary
Introduction
Unionville is a small hamlet located in the town of Union, Broome County, New York. It is situated on the Susquehanna River, about 10 miles south of Binghamton. The hamlet has a population of about 1,000 people and is a popular tourist destination due to its proximity to the river and its historic buildings.
History
Unionville was first settled in 1790 by a group of settlers from Connecticut. The settlers were attracted to the area due to its fertile soil and abundant natural resources. The hamlet was originally known as “Union” and was later renamed “Unionville” in 1820.
The hamlet was an important stop on the Susquehanna and Chenango Canal, which was built in the early 1800s. The canal was used to transport goods and people between Binghamton and Owego. The canal was eventually replaced by the railroad in the late 1800s.
Unionville was also an important stop on the Underground Railroad. The hamlet was home to several abolitionists who helped runaway slaves escape to freedom.
Geography
Unionville is located in the Susquehanna Valley, which is part of the Appalachian Plateau. The hamlet is situated on the Susquehanna River, about 10 miles south of Binghamton. The terrain is mostly flat with some rolling hills. The climate is humid continental, with cold winters and hot, humid summers.
Economy
The economy of Unionville is largely based on agriculture and tourism. The hamlet is home to several farms, which produce a variety of crops, including corn, soybeans, hay, and apples. The hamlet is also home to several wineries, which produce a variety of wines.
Tourism is an important part of the economy of Unionville. The hamlet is home to several historic buildings, including the Unionville Presbyterian Church, which was built in 1820. The hamlet is also home to several parks, including the Unionville State Park, which offers camping, fishing, and hiking.
Demographics
As of the 2010 census, the population of Unionville was 1,000. The racial makeup of the hamlet was 97.2% White, 0.7% African American, 0.3% Native American, 0.3% Asian, and 1.5% from other races. The median household income was $45,000.
Conclusion
Unionville is a small hamlet located in the town of Union, Broome County, New York. It is situated on the Susquehanna River, about 10 miles south of Binghamton. The hamlet has a population of about 1,000 people and is a popular tourist destination due to its proximity to the river and its historic buildings. The economy of Unionville is largely based on agriculture and tourism. The hamlet is home to several farms, wineries, and parks. As of the 2010 census, the population of Unionville was 1,000. The racial makeup of the hamlet was 97.2% White, 0.7% African American, 0.3% Native American, 0.3% Asian, and 1.5% from other races. The median household income was $45,000.
Common Questions
What is the Total Population of Unionville?
Total Population of Unionville is 670.
What is the Total Male Population of Unionville?
Total Male Population of Unionville is 297.
What is the Total Female Population of Unionville?
Total Female Population of Unionville is 373.
What is the Ratio of Males per 100 Females in Unionville?
There are 79.62 Males per 100 Females in Unionville.
What is the Ratio of Females per 100 Males in Unionville?
There are 125.59 Females per 100 Males in Unionville.
What is the Median Population Age in Unionville?
Median Population Age in Unionville is 31.9 Years.
What is the Average Family Size in Unionville
Average Family Size in Unionville is 3.2 People.
What is the Average Household Size in Unionville
Average Household Size in Unionville is 2.9 People.
What is Per Capita Income in Unionville?
Per Capita income in Unionville is $37,919.
What is the Median Family Income in Unionville?
Median Family Income in Unionville is $84,375.
What is the Median Household income in Unionville?
Median Household Income in Unionville is $84,688.
What is Income or Wage Gap in Unionville?
Income or Wage Gap in Unionville is 17.9%.
Women in Unionville earn 82.1 cents for every dollar earned by a man.
What is Inequality or Gini Index in Unionville?
Inequality or Gini Index in Unionville is 0.37.
How Large is the Labor Force in Unionville?
There are 376 People in the Labor Forcein in Unionville.
What is the Percentage of People in the Labor Force in Unionville?
74.0% of People are in the Labor Force in Unionville.