Malverne, NY
Malverne Map
Malverne Overview
8,526
TOTAL POPULATION
4,228
MALE POPULATION
4,298
FEMALE POPULATION
98.37
MALES / 100 FEMALES
101.66
FEMALES / 100 MALES
45.0
MEDIAN AGE
3.3
AVG FAMILY SIZE
2.9
AVG HOUSEHOLD SIZE
$70,533
PER CAPITA INCOME
$186,250
AVG FAMILY INCOME
$158,333
AVG HOUSEHOLD INCOME
5.4%
WAGE / INCOME GAP [ % ]
94.6¢/ $1
WAGE / INCOME GAP [ $ ]
$9,408
FAMILY INCOME DEFICIT
0.42
INEQUALITY / GINI INDEX
5,078
LABOR FORCE [ PEOPLE ]
71.4%
PERCENT IN LABOR FORCE
2.4%
UNEMPLOYMENT RATE
Malverne Zip Codes
Malverne Area Codes
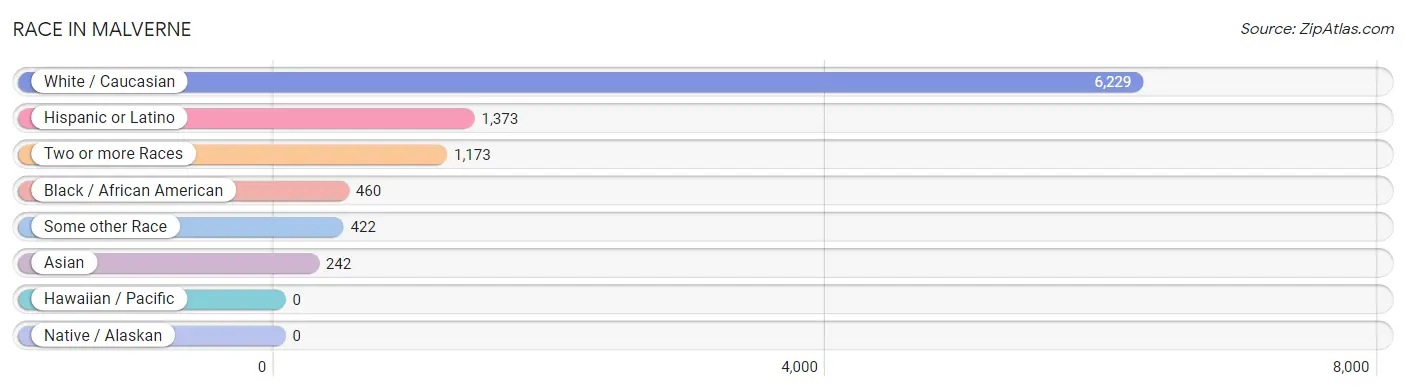
Race in Malverne
The most populous races in Malverne are White / Caucasian (6,229 | 73.1%), Hispanic or Latino (1,373 | 16.1%), and Two or more Races (1,173 | 13.8%).
| Race | # Population | % Population |
| Asian | 242 | 2.8% |
| Black / African American | 460 | 5.4% |
| Hawaiian / Pacific | 0 | 0.0% |
| Hispanic or Latino | 1,373 | 16.1% |
| Native / Alaskan | 0 | 0.0% |
| White / Caucasian | 6,229 | 73.1% |
| Two or more Races | 1,173 | 13.8% |
| Some other Race | 422 | 5.0% |
| Total | 8,526 | 100.0% |
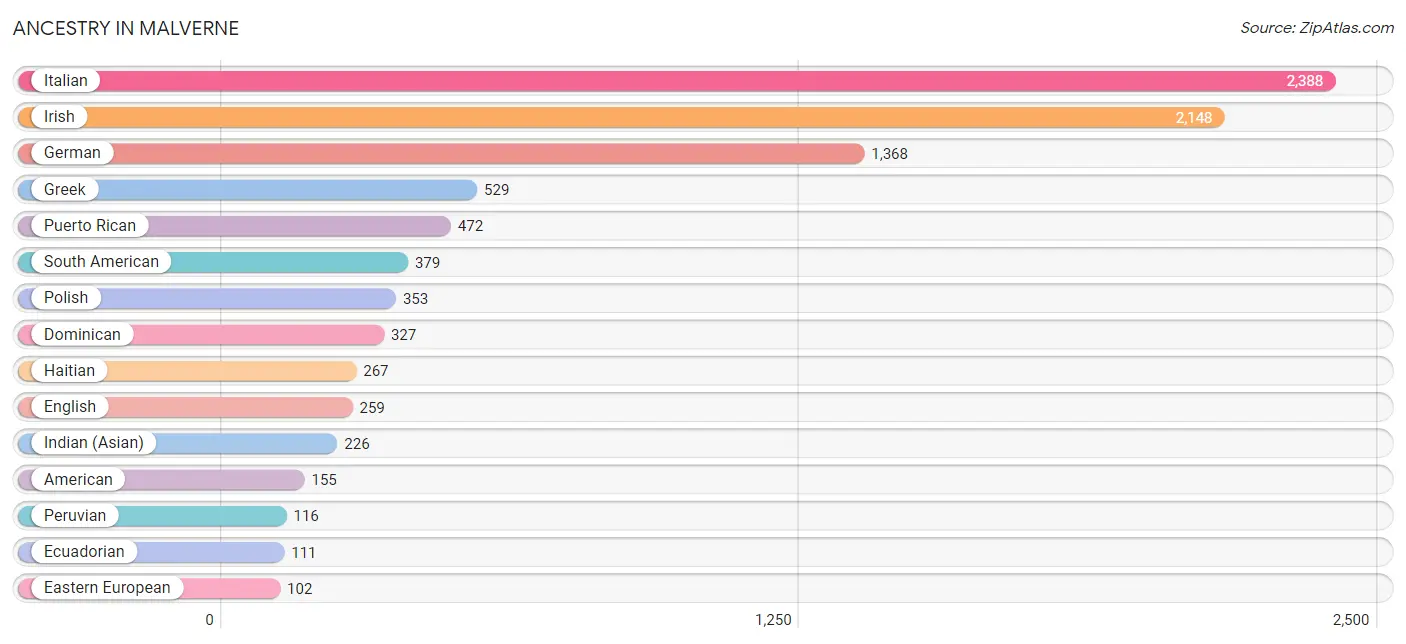
Ancestry in Malverne
The most populous ancestries reported in Malverne are Italian (2,388 | 28.0%), Irish (2,148 | 25.2%), German (1,368 | 16.1%), Greek (529 | 6.2%), and Puerto Rican (472 | 5.5%), together accounting for 81.0% of all Malverne residents.
| Ancestry | # Population | % Population |
| African | 51 | 0.6% |
| American | 155 | 1.8% |
| Arab | 7 | 0.1% |
| Argentinean | 68 | 0.8% |
| Austrian | 45 | 0.5% |
| British | 27 | 0.3% |
| Central American | 51 | 0.6% |
| Colombian | 55 | 0.6% |
| Cuban | 54 | 0.6% |
| Cypriot | 15 | 0.2% |
| Danish | 3 | 0.0% |
| Dominican | 327 | 3.8% |
| Dutch | 19 | 0.2% |
| Eastern European | 102 | 1.2% |
| Ecuadorian | 111 | 1.3% |
| English | 259 | 3.0% |
| European | 20 | 0.2% |
| French | 89 | 1.0% |
| French Canadian | 24 | 0.3% |
| German | 1,368 | 16.1% |
| Greek | 529 | 6.2% |
| Guatemalan | 13 | 0.2% |
| Guyanese | 26 | 0.3% |
| Haitian | 267 | 3.1% |
| Hungarian | 24 | 0.3% |
| Indian (Asian) | 226 | 2.6% |
| Irish | 2,148 | 25.2% |
| Italian | 2,388 | 28.0% |
| Korean | 71 | 0.8% |
| Lebanese | 7 | 0.1% |
| Northern European | 30 | 0.4% |
| Norwegian | 24 | 0.3% |
| Panamanian | 38 | 0.4% |
| Peruvian | 116 | 1.4% |
| Polish | 353 | 4.1% |
| Portuguese | 58 | 0.7% |
| Puerto Rican | 472 | 5.5% |
| Romanian | 6 | 0.1% |
| Russian | 87 | 1.0% |
| Scandinavian | 16 | 0.2% |
| Scotch-Irish | 20 | 0.2% |
| Scottish | 48 | 0.6% |
| Slovak | 8 | 0.1% |
| South American | 379 | 4.4% |
| Spaniard | 90 | 1.1% |
| Subsaharan African | 51 | 0.6% |
| Swedish | 13 | 0.2% |
| Thai | 68 | 0.8% |
| Welsh | 23 | 0.3% | View All 49 Rows |
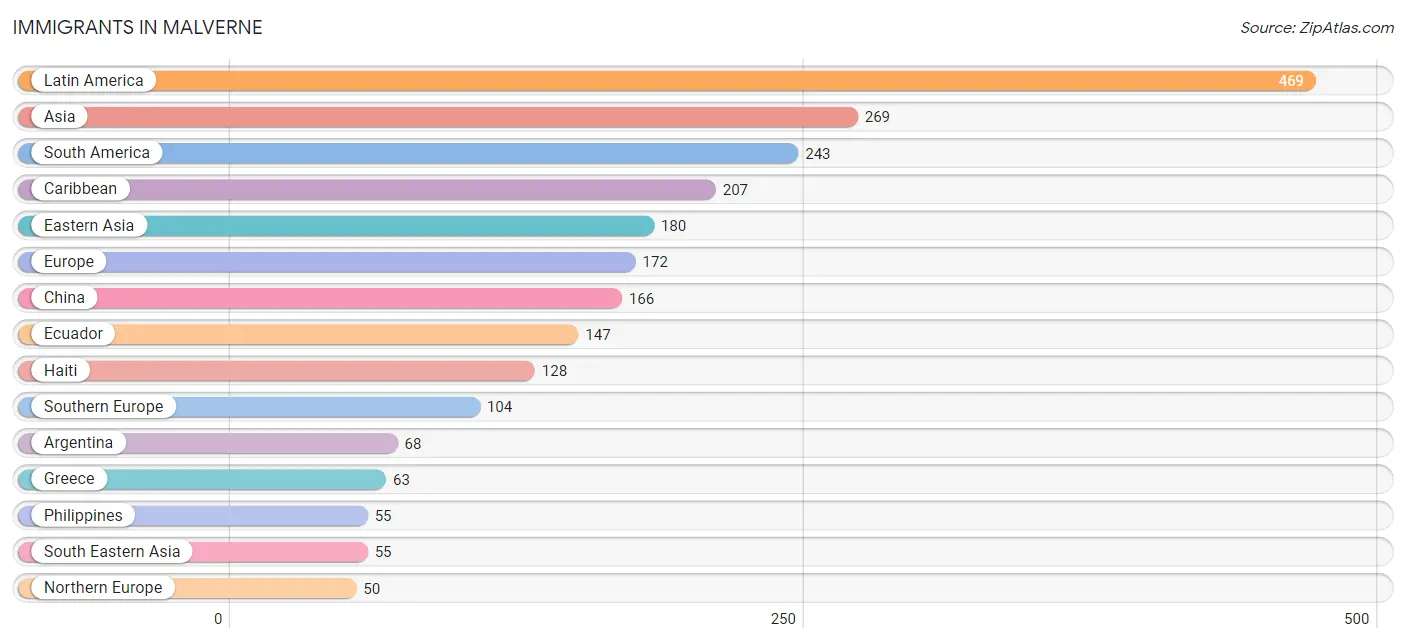
Immigrants in Malverne
The most numerous immigrant groups reported in Malverne came from Latin America (469 | 5.5%), Asia (269 | 3.2%), South America (243 | 2.9%), Caribbean (207 | 2.4%), and Eastern Asia (180 | 2.1%), together accounting for 16.1% of all Malverne residents.
| Immigration Origin | # Population | % Population |
| Afghanistan | 14 | 0.2% |
| Argentina | 68 | 0.8% |
| Asia | 269 | 3.2% |
| Caribbean | 207 | 2.4% |
| Central America | 19 | 0.2% |
| China | 166 | 1.9% |
| Colombia | 28 | 0.3% |
| Cuba | 18 | 0.2% |
| Dominican Republic | 28 | 0.3% |
| Eastern Asia | 180 | 2.1% |
| Eastern Europe | 9 | 0.1% |
| Ecuador | 147 | 1.7% |
| Europe | 172 | 2.0% |
| Germany | 9 | 0.1% |
| Greece | 63 | 0.7% |
| Haiti | 128 | 1.5% |
| Iraq | 20 | 0.2% |
| Ireland | 28 | 0.3% |
| Italy | 41 | 0.5% |
| Jamaica | 33 | 0.4% |
| Japan | 14 | 0.2% |
| Latin America | 469 | 5.5% |
| Northern Europe | 50 | 0.6% |
| Panama | 19 | 0.2% |
| Philippines | 55 | 0.6% |
| Poland | 9 | 0.1% |
| Scotland | 6 | 0.1% |
| South America | 243 | 2.9% |
| South Central Asia | 14 | 0.2% |
| South Eastern Asia | 55 | 0.6% |
| Southern Europe | 104 | 1.2% |
| Taiwan | 45 | 0.5% |
| Western Asia | 20 | 0.2% |
| Western Europe | 9 | 0.1% | View All 34 Rows |
Sex and Age in Malverne
Sex and Age in Malverne
The most populous age groups in Malverne are 55 to 59 Years (451 | 10.7%) for men and 40 to 44 Years (399 | 9.3%) for women.
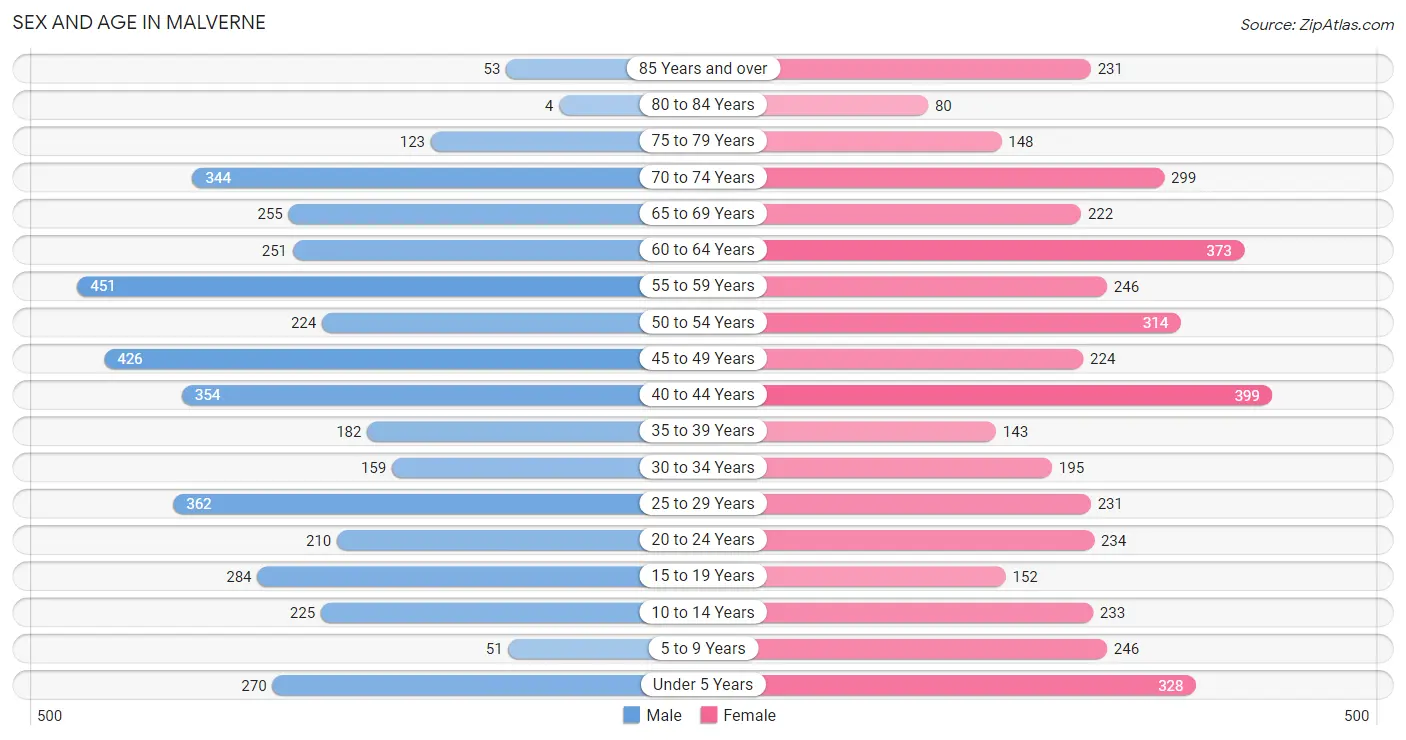
| Age Bracket | Male | Female |
| Under 5 Years | 270 (6.4%) | 328 (7.6%) |
| 5 to 9 Years | 51 (1.2%) | 246 (5.7%) |
| 10 to 14 Years | 225 (5.3%) | 233 (5.4%) |
| 15 to 19 Years | 284 (6.7%) | 152 (3.5%) |
| 20 to 24 Years | 210 (5.0%) | 234 (5.4%) |
| 25 to 29 Years | 362 (8.6%) | 231 (5.4%) |
| 30 to 34 Years | 159 (3.8%) | 195 (4.5%) |
| 35 to 39 Years | 182 (4.3%) | 143 (3.3%) |
| 40 to 44 Years | 354 (8.4%) | 399 (9.3%) |
| 45 to 49 Years | 426 (10.1%) | 224 (5.2%) |
| 50 to 54 Years | 224 (5.3%) | 314 (7.3%) |
| 55 to 59 Years | 451 (10.7%) | 246 (5.7%) |
| 60 to 64 Years | 251 (5.9%) | 373 (8.7%) |
| 65 to 69 Years | 255 (6.0%) | 222 (5.2%) |
| 70 to 74 Years | 344 (8.1%) | 299 (7.0%) |
| 75 to 79 Years | 123 (2.9%) | 148 (3.4%) |
| 80 to 84 Years | 4 (0.1%) | 80 (1.9%) |
| 85 Years and over | 53 (1.3%) | 231 (5.4%) |
| Total | 4,228 (100.0%) | 4,298 (100.0%) |
Families and Households in Malverne
Median Family Size in Malverne
The median family size in Malverne is 3.31 persons per family, with married-couple families (1,900 | 81.9%) accounting for the largest median family size of 3.41 persons per family. On the other hand, single male/father families (171 | 7.4%) represent the smallest median family size with 2.19 persons per family.
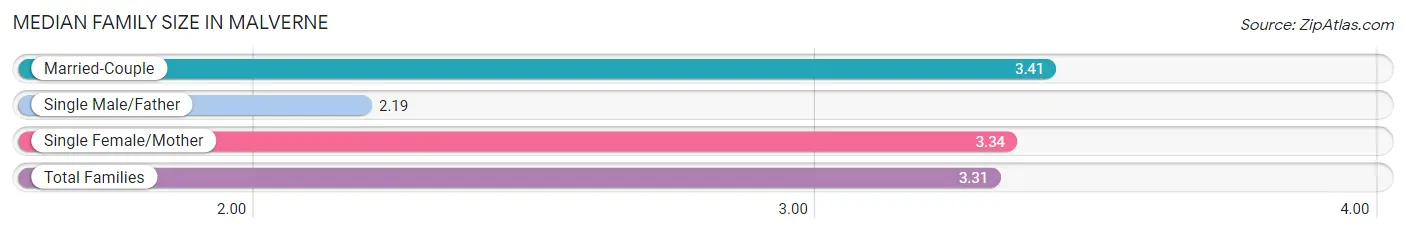
| Family Type | # Families | Family Size |
| Married-Couple | 1,900 (81.9%) | 3.41 |
| Single Male/Father | 171 (7.4%) | 2.19 |
| Single Female/Mother | 250 (10.8%) | 3.34 |
| Total Families | 2,321 (100.0%) | 3.31 |
Median Household Size in Malverne
The median household size in Malverne is 2.91 persons per household, with single female/mother households (250 | 8.6%) accounting for the largest median household size of 3.6 persons per household. non-family households (603 | 20.6%) represent the smallest median household size with 1.13 persons per household.
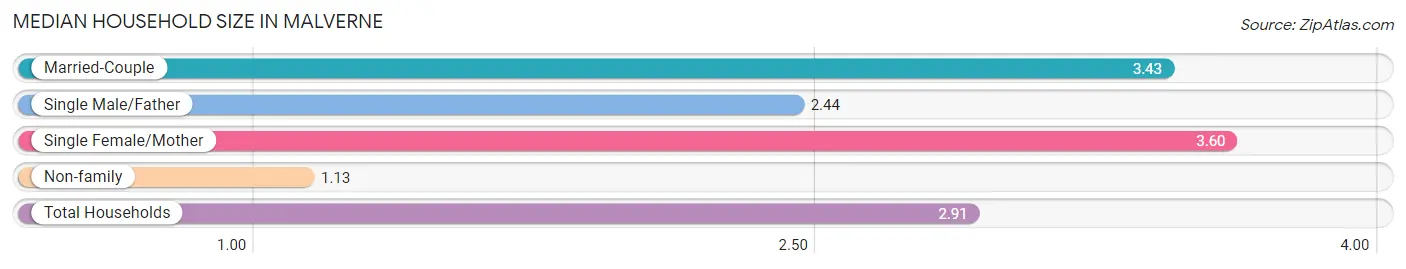
| Household Type | # Households | Household Size |
| Married-Couple | 1,900 (65.0%) | 3.43 |
| Single Male/Father | 171 (5.9%) | 2.44 |
| Single Female/Mother | 250 (8.6%) | 3.60 |
| Non-family | 603 (20.6%) | 1.13 |
| Total Households | 2,924 (100.0%) | 2.91 |
Household Size by Marriage Status in Malverne
Out of a total of 2,924 households in Malverne, 2,321 (79.4%) are family households, while 603 (20.6%) are nonfamily households. The most numerous type of family households are 2-person households, comprising 827, and the most common type of nonfamily households are 1-person households, comprising 542.
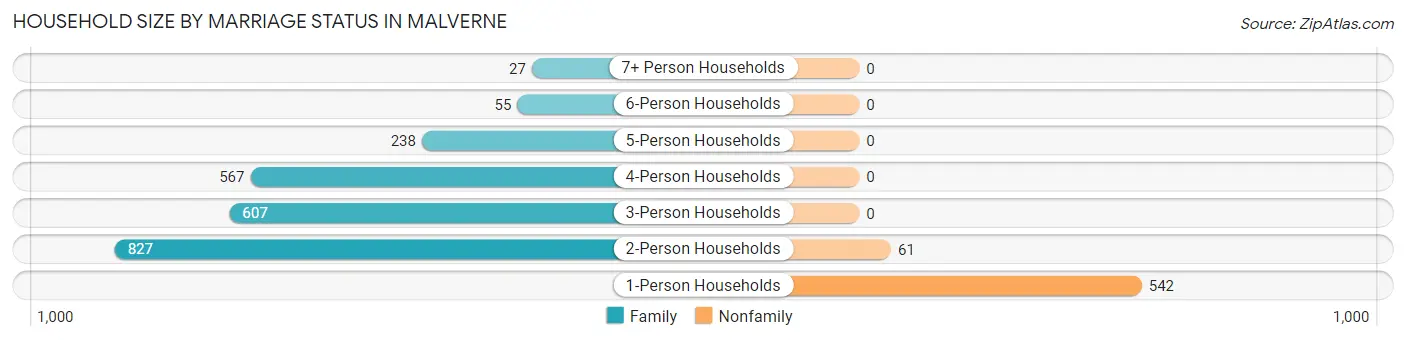
| Household Size | Family Households | Nonfamily Households |
| 1-Person Households | - | 542 (18.5%) |
| 2-Person Households | 827 (28.3%) | 61 (2.1%) |
| 3-Person Households | 607 (20.8%) | 0 (0.0%) |
| 4-Person Households | 567 (19.4%) | 0 (0.0%) |
| 5-Person Households | 238 (8.1%) | 0 (0.0%) |
| 6-Person Households | 55 (1.9%) | 0 (0.0%) |
| 7+ Person Households | 27 (0.9%) | 0 (0.0%) |
| Total | 2,321 (79.4%) | 603 (20.6%) |
Female Fertility in Malverne
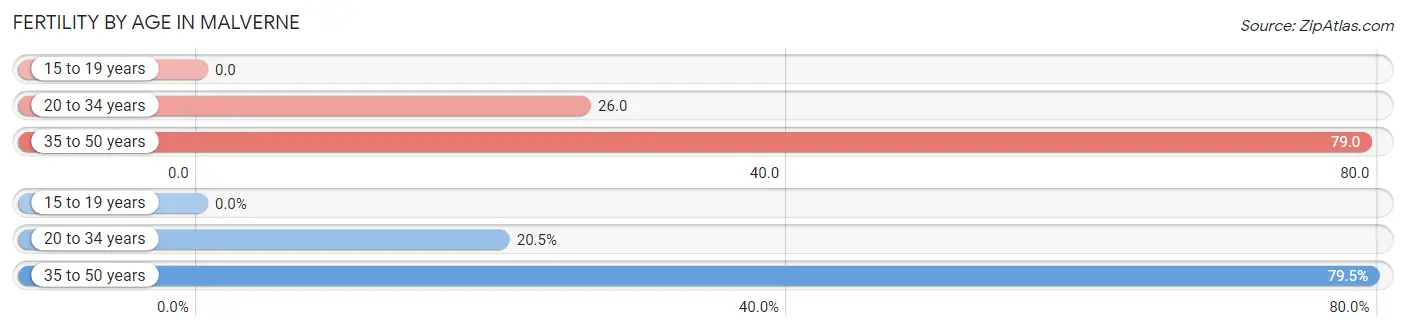
Fertility by Age in Malverne
Average fertility rate in Malverne is 50.0 births per 1,000 women. Women in the age bracket of 35 to 50 years have the highest fertility rate with 79.0 births per 1,000 women. Women in the age bracket of 35 to 50 years acount for 79.5% of all women with births.
| Age Bracket | Women with Births | Births / 1,000 Women |
| 15 to 19 years | 0 (0.0%) | 0.0 |
| 20 to 34 years | 17 (20.5%) | 26.0 |
| 35 to 50 years | 66 (79.5%) | 79.0 |
| Total | 83 (100.0%) | 50.0 |
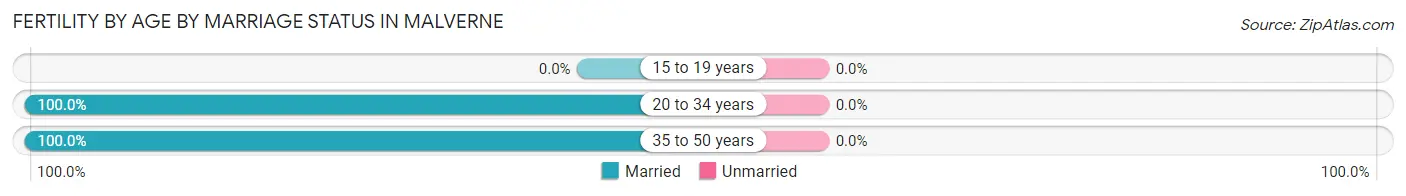
Fertility by Age by Marriage Status in Malverne
| Age Bracket | Married | Unmarried |
| 15 to 19 years | 0 (0.0%) | 0 (0.0%) |
| 20 to 34 years | 17 (100.0%) | 0 (0.0%) |
| 35 to 50 years | 66 (100.0%) | 0 (0.0%) |
| Total | 83 (100.0%) | 0 (0.0%) |
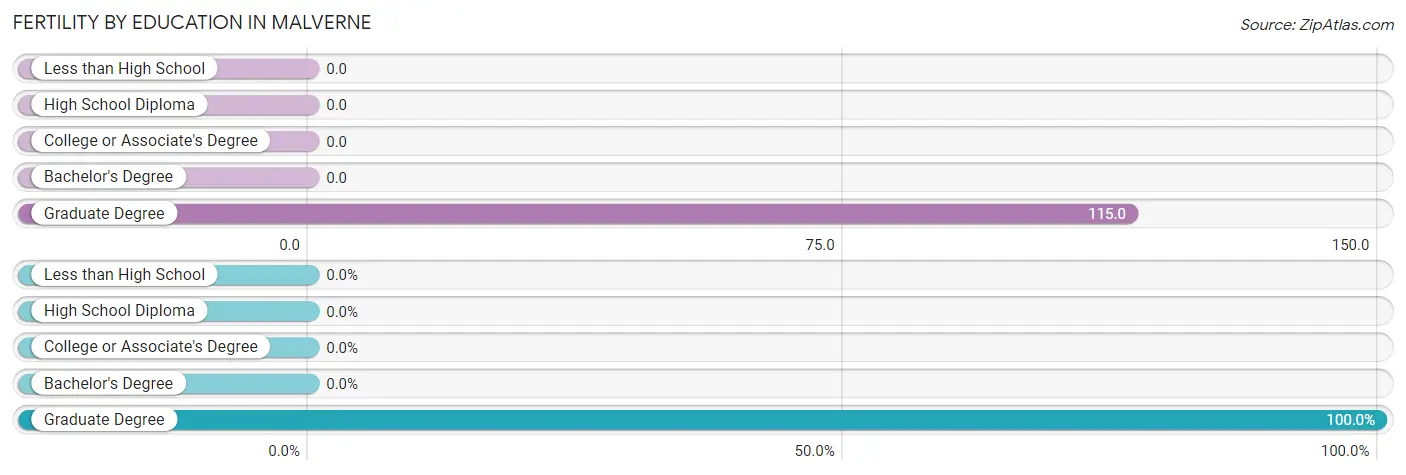
Fertility by Education in Malverne
| Educational Attainment | Women with Births | Births / 1,000 Women |
| Less than High School | 0 (0.0%) | 0.0 |
| High School Diploma | 0 (0.0%) | 0.0 |
| College or Associate's Degree | 0 (0.0%) | 0.0 |
| Bachelor's Degree | 0 (0.0%) | 0.0 |
| Graduate Degree | 83 (100.0%) | 115.0 |
| Total | 83 (100.0%) | 50.0 |
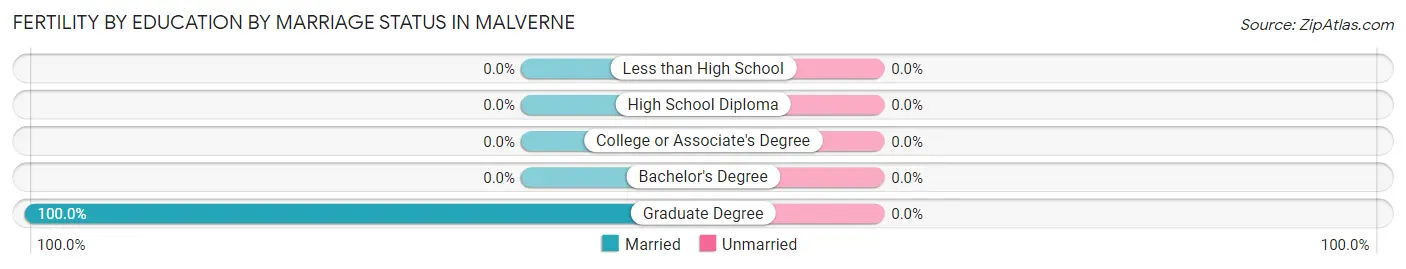
Fertility by Education by Marriage Status in Malverne
| Educational Attainment | Married | Unmarried |
| Less than High School | 0 (0.0%) | 0 (0.0%) |
| High School Diploma | 0 (0.0%) | 0 (0.0%) |
| College or Associate's Degree | 0 (0.0%) | 0 (0.0%) |
| Bachelor's Degree | 0 (0.0%) | 0 (0.0%) |
| Graduate Degree | 83 (100.0%) | 0 (0.0%) |
| Total | 83 (100.0%) | 0 (0.0%) |
Income in Malverne
Income Overview in Malverne
Per Capita Income in Malverne is $70,533, while median incomes of families and households are $186,250 and $158,333 respectively.
| Characteristic | Number | Measure |
| Per Capita Income | 8,526 | $70,533 |
| Median Family Income | 2,321 | $186,250 |
| Mean Family Income | 2,321 | $228,973 |
| Median Household Income | 2,924 | $158,333 |
| Mean Household Income | 2,924 | $200,089 |
| Income Deficit | 2,321 | $9,408 |
| Wage / Income Gap (%) | 8,526 | 5.42% |
| Wage / Income Gap ($) | 8,526 | 94.58¢ per $1 |
| Gini / Inequality Index | 8,526 | 0.42 |
Earnings by Sex in Malverne
Average Earnings in Malverne are $68,717, $70,184 for men and $66,378 for women, a difference of 5.4%.
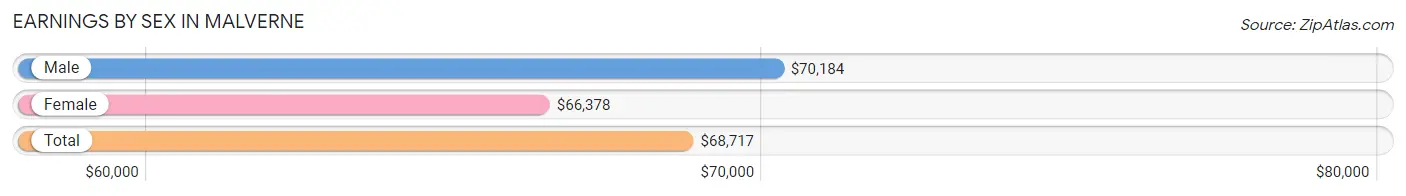
| Sex | Number | Average Earnings |
| Male | 2,788 (53.3%) | $70,184 |
| Female | 2,441 (46.7%) | $66,378 |
| Total | 5,229 (100.0%) | $68,717 |
Earnings by Sex by Income Bracket in Malverne
The most common earnings brackets in Malverne are $100,000+ for men (906 | 32.5%) and $100,000+ for women (652 | 26.7%).
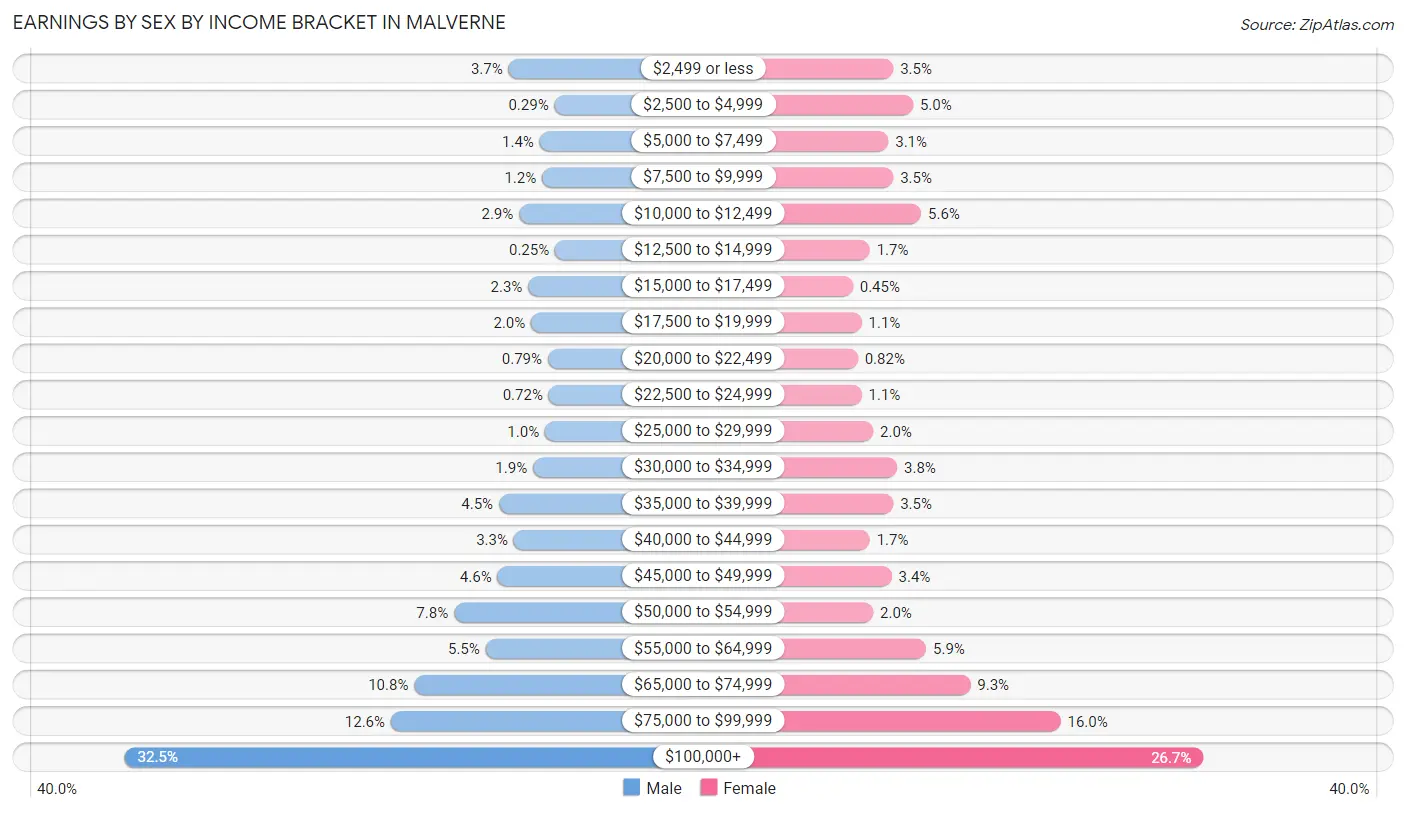
| Income | Male | Female |
| $2,499 or less | 104 (3.7%) | 85 (3.5%) |
| $2,500 to $4,999 | 8 (0.3%) | 121 (5.0%) |
| $5,000 to $7,499 | 39 (1.4%) | 76 (3.1%) |
| $7,500 to $9,999 | 34 (1.2%) | 85 (3.5%) |
| $10,000 to $12,499 | 82 (2.9%) | 136 (5.6%) |
| $12,500 to $14,999 | 7 (0.3%) | 42 (1.7%) |
| $15,000 to $17,499 | 63 (2.3%) | 11 (0.4%) |
| $17,500 to $19,999 | 57 (2.0%) | 27 (1.1%) |
| $20,000 to $22,499 | 22 (0.8%) | 20 (0.8%) |
| $22,500 to $24,999 | 20 (0.7%) | 27 (1.1%) |
| $25,000 to $29,999 | 28 (1.0%) | 48 (2.0%) |
| $30,000 to $34,999 | 53 (1.9%) | 92 (3.8%) |
| $35,000 to $39,999 | 124 (4.4%) | 85 (3.5%) |
| $40,000 to $44,999 | 93 (3.3%) | 42 (1.7%) |
| $45,000 to $49,999 | 127 (4.6%) | 82 (3.4%) |
| $50,000 to $54,999 | 218 (7.8%) | 48 (2.0%) |
| $55,000 to $64,999 | 152 (5.4%) | 145 (5.9%) |
| $65,000 to $74,999 | 301 (10.8%) | 226 (9.3%) |
| $75,000 to $99,999 | 350 (12.6%) | 391 (16.0%) |
| $100,000+ | 906 (32.5%) | 652 (26.7%) |
| Total | 2,788 (100.0%) | 2,441 (100.0%) |
Earnings by Sex by Educational Attainment in Malverne
Average earnings in Malverne are $76,532 for men and $72,379 for women, a difference of 5.4%. Men with an educational attainment of graduate degree enjoy the highest average annual earnings of $90,000, while those with high school diploma education earn the least with $70,150. Women with an educational attainment of graduate degree earn the most with the average annual earnings of $93,099, while those with bachelor's degree education have the smallest earnings of $65,284.
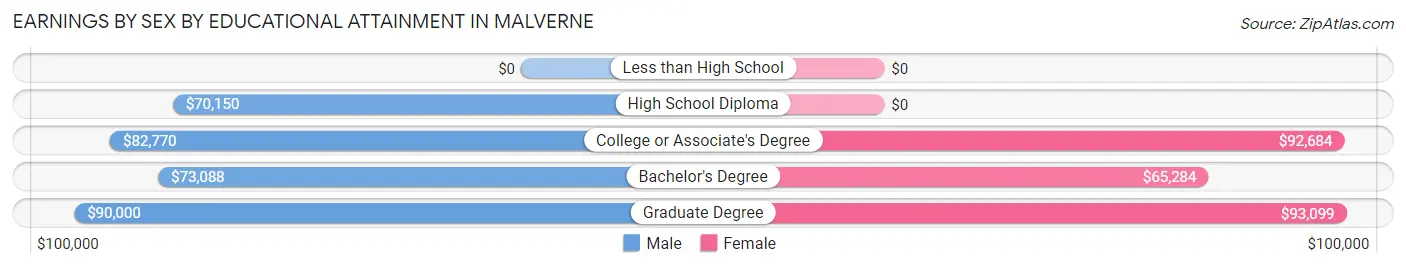
| Educational Attainment | Male Income | Female Income |
| Less than High School | - | - |
| High School Diploma | $70,150 | $0 |
| College or Associate's Degree | $82,770 | $92,684 |
| Bachelor's Degree | $73,088 | $65,284 |
| Graduate Degree | $90,000 | $93,099 |
| Total | $76,532 | $72,379 |
Family Income in Malverne
Family Income Brackets in Malverne
According to the Malverne family income data, there are 1,005 families falling into the $200,000+ income range, which is the most common income bracket and makes up 43.3% of all families. Conversely, the $10,000 to $14,999 income bracket is the least frequent group with only 12 families (0.5%) belonging to this category.
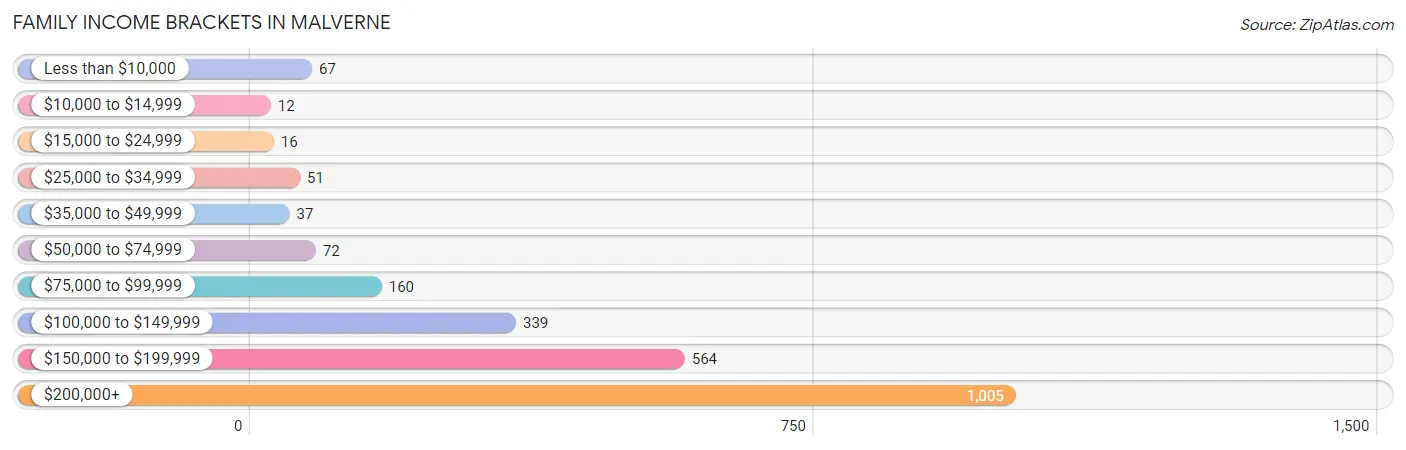
| Income Bracket | # Families | % Families |
| Less than $10,000 | 67 | 2.9% |
| $10,000 to $14,999 | 12 | 0.5% |
| $15,000 to $24,999 | 16 | 0.7% |
| $25,000 to $34,999 | 51 | 2.2% |
| $35,000 to $49,999 | 37 | 1.6% |
| $50,000 to $74,999 | 72 | 3.1% |
| $75,000 to $99,999 | 160 | 6.9% |
| $100,000 to $149,999 | 339 | 14.6% |
| $150,000 to $199,999 | 564 | 24.3% |
| $200,000+ | 1,005 | 43.3% |
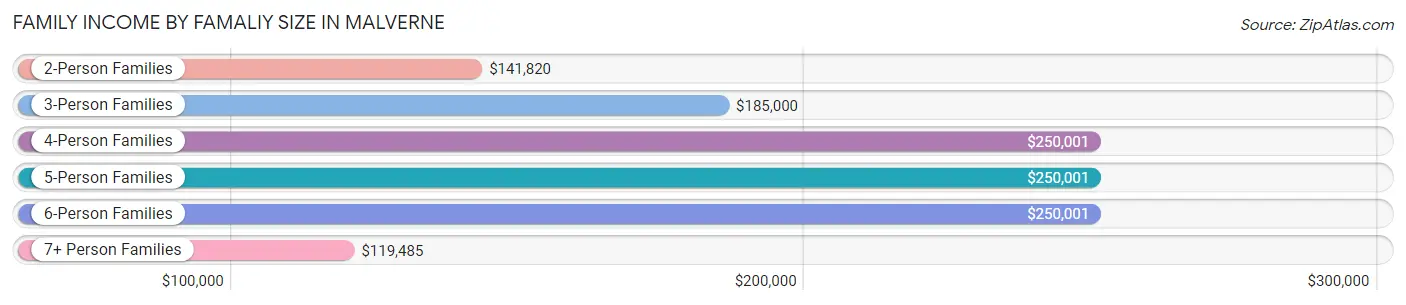
Family Income by Famaliy Size in Malverne
4-person families (518 | 22.3%) account for the highest median family income in Malverne with $250,001 per family, while 2-person families (875 | 37.7%) have the highest median income of $70,910 per family member.
| Income Bracket | # Families | Median Income |
| 2-Person Families | 875 (37.7%) | $141,820 |
| 3-Person Families | 628 (27.1%) | $185,000 |
| 4-Person Families | 518 (22.3%) | $250,001 |
| 5-Person Families | 218 (9.4%) | $250,001 |
| 6-Person Families | 55 (2.4%) | $250,001 |
| 7+ Person Families | 27 (1.2%) | $119,485 |
| Total | 2,321 (100.0%) | $186,250 |
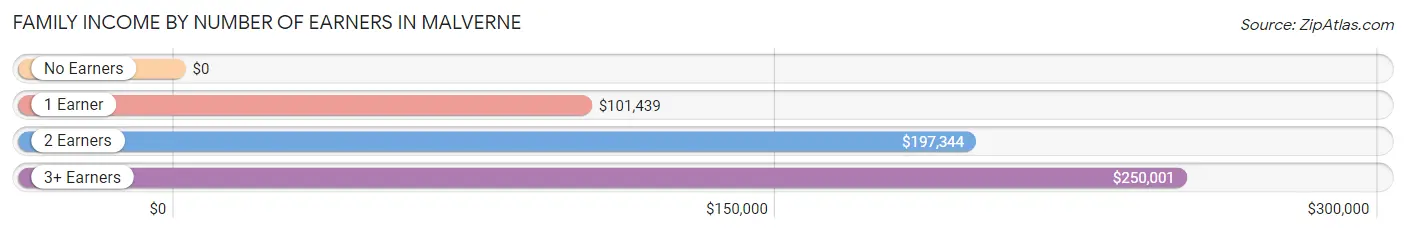
Family Income by Number of Earners in Malverne
| Number of Earners | # Families | Median Income |
| No Earners | 324 (14.0%) | $0 |
| 1 Earner | 292 (12.6%) | $101,439 |
| 2 Earners | 1,215 (52.3%) | $197,344 |
| 3+ Earners | 490 (21.1%) | $250,001 |
| Total | 2,321 (100.0%) | $186,250 |
Household Income in Malverne
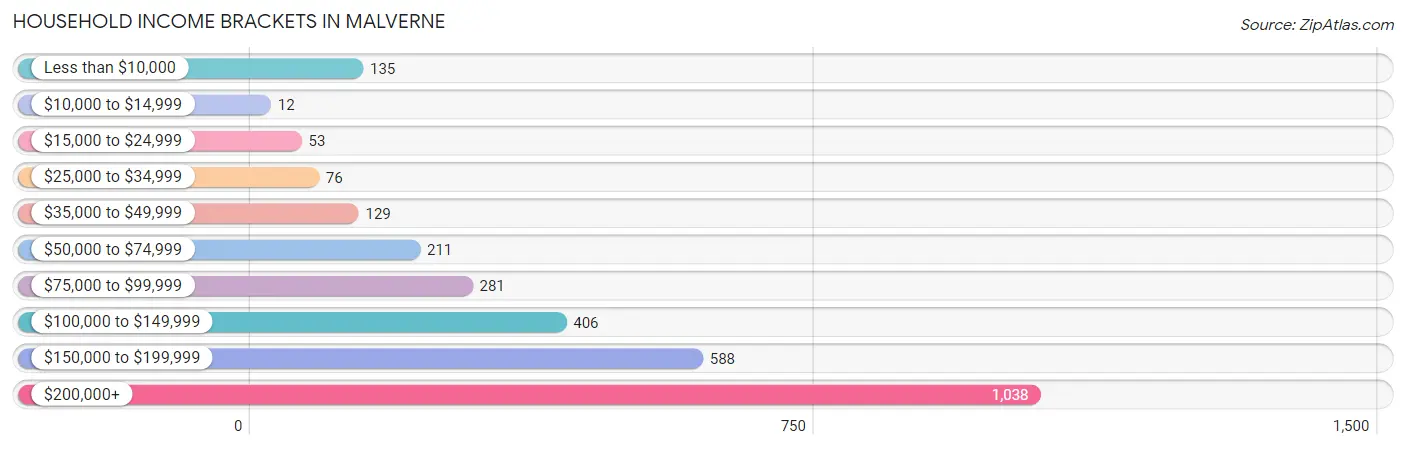
Household Income Brackets in Malverne
With 1,038 households falling in the category, the $200,000+ income range is the most frequent in Malverne, accounting for 35.5% of all households. In contrast, only 12 households (0.4%) fall into the $10,000 to $14,999 income bracket, making it the least populous group.
| Income Bracket | # Households | % Households |
| Less than $10,000 | 135 | 4.6% |
| $10,000 to $14,999 | 12 | 0.4% |
| $15,000 to $24,999 | 53 | 1.8% |
| $25,000 to $34,999 | 76 | 2.6% |
| $35,000 to $49,999 | 129 | 4.4% |
| $50,000 to $74,999 | 211 | 7.2% |
| $75,000 to $99,999 | 281 | 9.6% |
| $100,000 to $149,999 | 406 | 13.9% |
| $150,000 to $199,999 | 588 | 20.1% |
| $200,000+ | 1,038 | 35.5% |
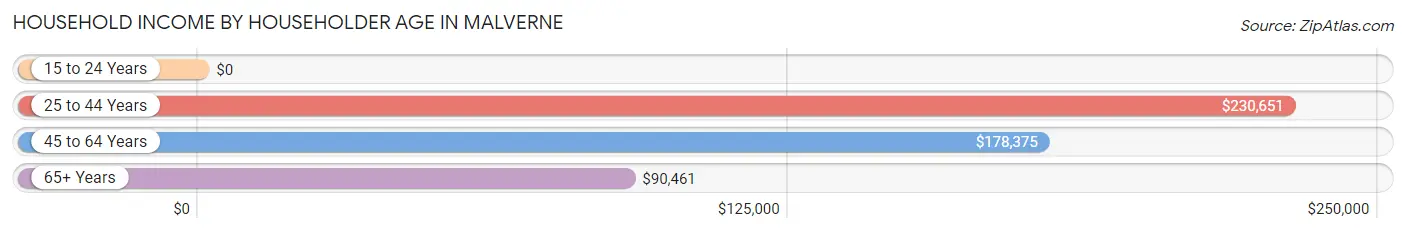
Household Income by Householder Age in Malverne
The median household income in Malverne is $158,333, with the highest median household income of $230,651 found in the 25 to 44 years age bracket for the primary householder. A total of 598 households (20.4%) fall into this category. Meanwhile, the 15 to 24 years age bracket for the primary householder has the lowest median household income of $0, with 6 households (0.2%) in this group.
| Income Bracket | # Households | Median Income |
| 15 to 24 Years | 6 (0.2%) | $0 |
| 25 to 44 Years | 598 (20.4%) | $230,651 |
| 45 to 64 Years | 1,177 (40.3%) | $178,375 |
| 65+ Years | 1,143 (39.1%) | $90,461 |
| Total | 2,924 (100.0%) | $158,333 |
Poverty in Malverne
Income Below Poverty by Sex and Age in Malverne
With 4.9% poverty level for males and 3.5% for females among the residents of Malverne, 65 to 74 year old males and 65 to 74 year old females are the most vulnerable to poverty, with 176 males (29.4%) and 82 females (15.7%) in their respective age groups living below the poverty level.
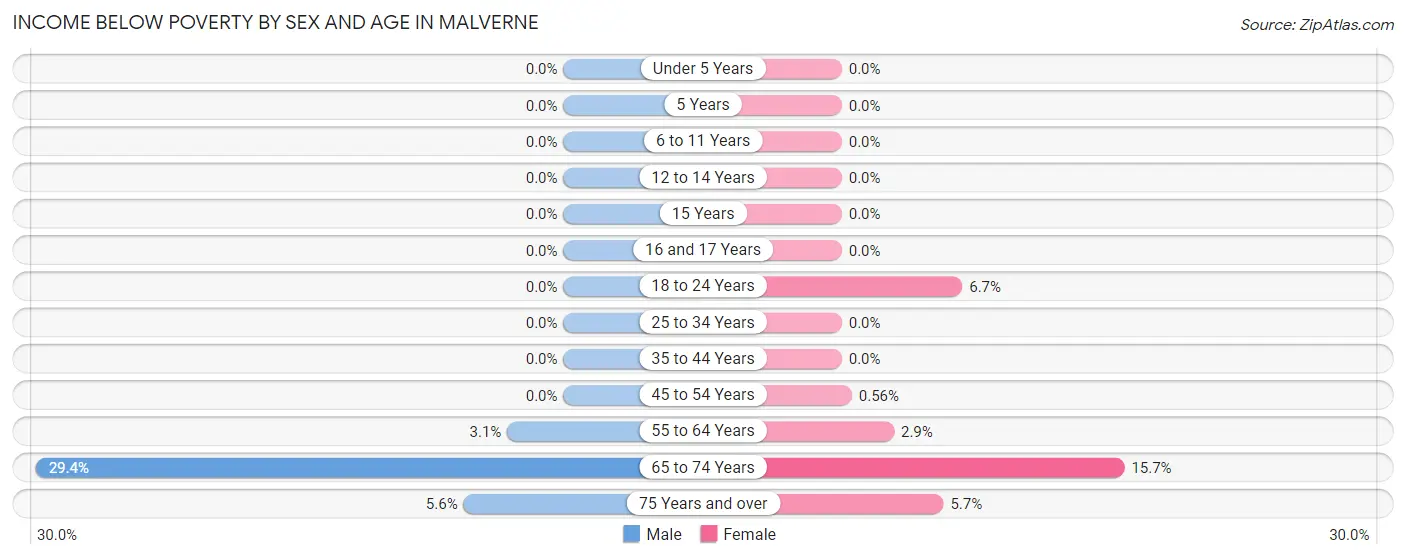
| Age Bracket | Male | Female |
| Under 5 Years | 0 (0.0%) | 0 (0.0%) |
| 5 Years | 0 (0.0%) | 0 (0.0%) |
| 6 to 11 Years | 0 (0.0%) | 0 (0.0%) |
| 12 to 14 Years | 0 (0.0%) | 0 (0.0%) |
| 15 Years | 0 (0.0%) | 0 (0.0%) |
| 16 and 17 Years | 0 (0.0%) | 0 (0.0%) |
| 18 to 24 Years | 0 (0.0%) | 22 (6.7%) |
| 25 to 34 Years | 0 (0.0%) | 0 (0.0%) |
| 35 to 44 Years | 0 (0.0%) | 0 (0.0%) |
| 45 to 54 Years | 0 (0.0%) | 3 (0.6%) |
| 55 to 64 Years | 22 (3.1%) | 18 (2.9%) |
| 65 to 74 Years | 176 (29.4%) | 82 (15.7%) |
| 75 Years and over | 10 (5.6%) | 26 (5.7%) |
| Total | 208 (4.9%) | 151 (3.5%) |
Income Above Poverty by Sex and Age in Malverne
According to the poverty statistics in Malverne, males aged under 5 years and females aged under 5 years are the age groups that are most secure financially, with 100.0% of males and 100.0% of females in these age groups living above the poverty line.
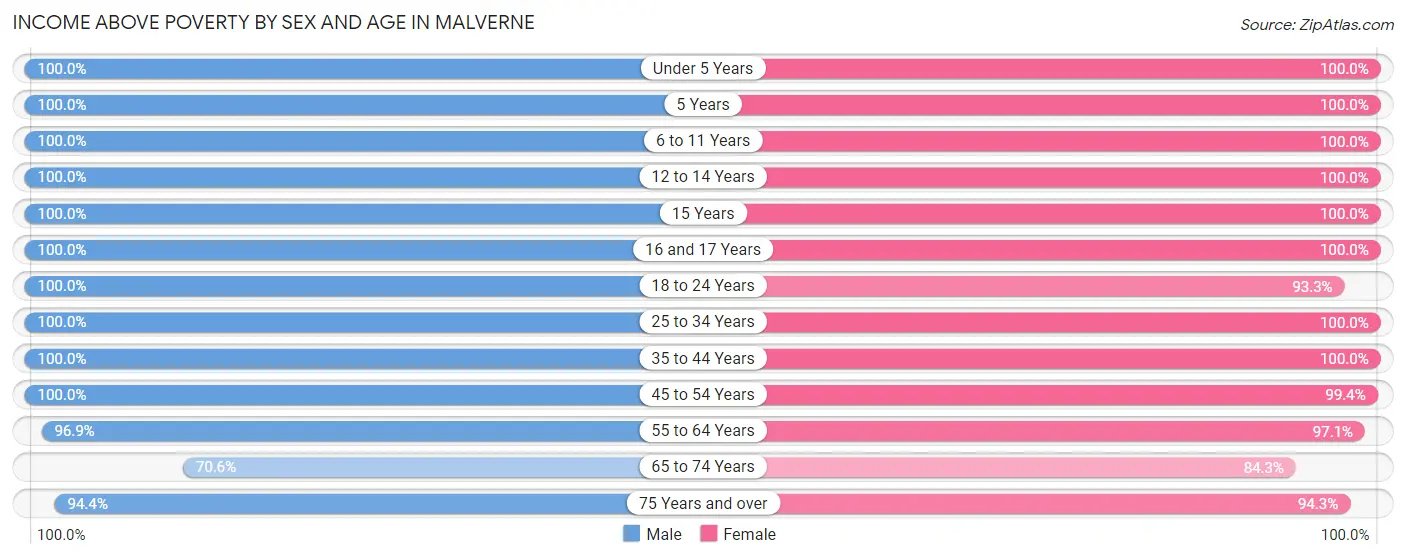
| Age Bracket | Male | Female |
| Under 5 Years | 270 (100.0%) | 328 (100.0%) |
| 5 Years | 51 (100.0%) | 12 (100.0%) |
| 6 to 11 Years | 146 (100.0%) | 358 (100.0%) |
| 12 to 14 Years | 79 (100.0%) | 109 (100.0%) |
| 15 Years | 42 (100.0%) | 19 (100.0%) |
| 16 and 17 Years | 179 (100.0%) | 39 (100.0%) |
| 18 to 24 Years | 273 (100.0%) | 306 (93.3%) |
| 25 to 34 Years | 521 (100.0%) | 426 (100.0%) |
| 35 to 44 Years | 536 (100.0%) | 542 (100.0%) |
| 45 to 54 Years | 650 (100.0%) | 535 (99.4%) |
| 55 to 64 Years | 680 (96.9%) | 601 (97.1%) |
| 65 to 74 Years | 423 (70.6%) | 439 (84.3%) |
| 75 Years and over | 170 (94.4%) | 433 (94.3%) |
| Total | 4,020 (95.1%) | 4,147 (96.5%) |
Income Below Poverty Among Married-Couple Families in Malverne
The poverty statistics for married-couple families in Malverne show that 5.0% or 95 of the total 1,900 families live below the poverty line. Families with no children have the highest poverty rate of 8.3%, comprising of 95 families. On the other hand, families with 1 or 2 children have the lowest poverty rate of 0.0%, which includes 0 families.
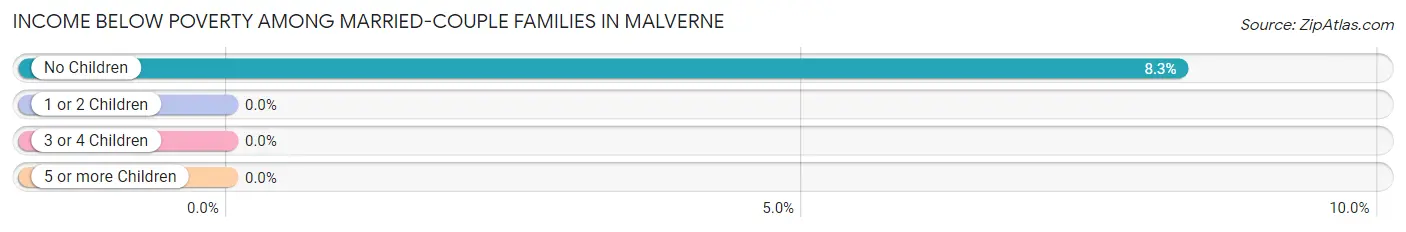
| Children | Above Poverty | Below Poverty |
| No Children | 1,054 (91.7%) | 95 (8.3%) |
| 1 or 2 Children | 592 (100.0%) | 0 (0.0%) |
| 3 or 4 Children | 136 (100.0%) | 0 (0.0%) |
| 5 or more Children | 23 (100.0%) | 0 (0.0%) |
| Total | 1,805 (95.0%) | 95 (5.0%) |
Income Below Poverty Among Single-Parent Households in Malverne
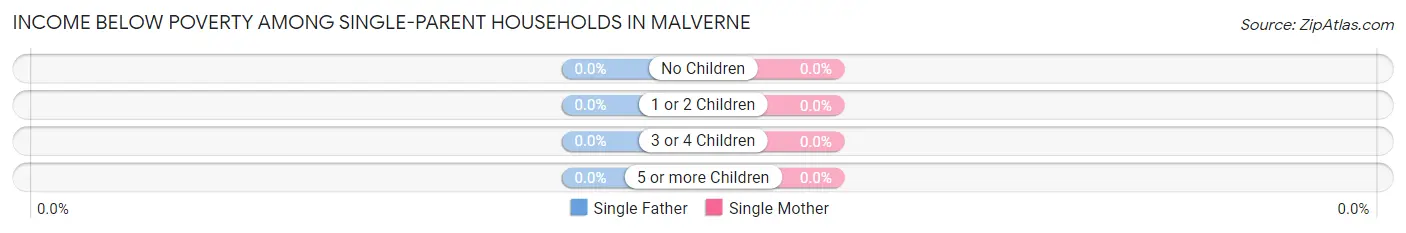
| Children | Single Father | Single Mother |
| No Children | 0 (0.0%) | 0 (0.0%) |
| 1 or 2 Children | 0 (0.0%) | 0 (0.0%) |
| 3 or 4 Children | 0 (0.0%) | 0 (0.0%) |
| 5 or more Children | 0 (0.0%) | 0 (0.0%) |
| Total | 0 (0.0%) | 0 (0.0%) |
Income Below Poverty Among Married-Couple vs Single-Parent Households in Malverne
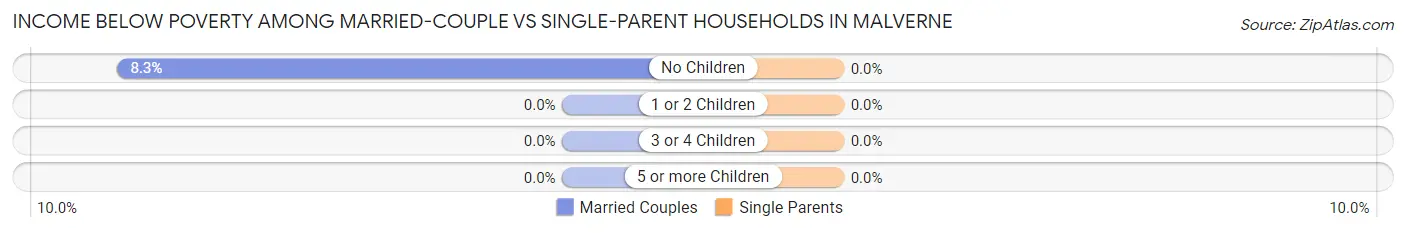
| Children | Married-Couple Families | Single-Parent Households |
| No Children | 95 (8.3%) | 0 (0.0%) |
| 1 or 2 Children | 0 (0.0%) | 0 (0.0%) |
| 3 or 4 Children | 0 (0.0%) | 0 (0.0%) |
| 5 or more Children | 0 (0.0%) | 0 (0.0%) |
| Total | 95 (5.0%) | 0 (0.0%) |
Employment Characteristics in Malverne
Employment by Class of Employer in Malverne
Among the 4,888 employed individuals in Malverne, private company employees (2,649 | 54.2%), not-for-profit organizations (746 | 15.3%), and local government employees (717 | 14.7%) make up the most common classes of employment.
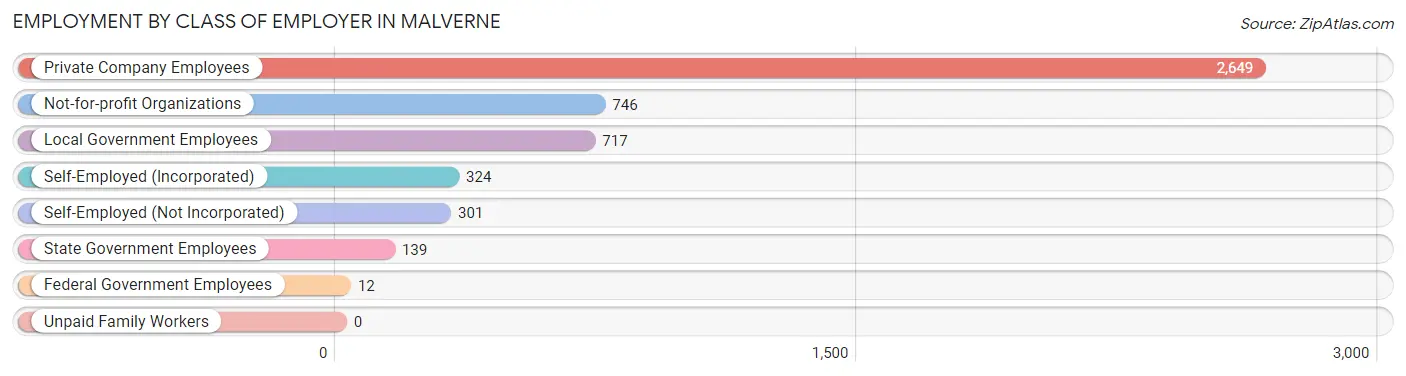
| Employer Class | # Employees | % Employees |
| Private Company Employees | 2,649 | 54.2% |
| Self-Employed (Incorporated) | 324 | 6.6% |
| Self-Employed (Not Incorporated) | 301 | 6.2% |
| Not-for-profit Organizations | 746 | 15.3% |
| Local Government Employees | 717 | 14.7% |
| State Government Employees | 139 | 2.8% |
| Federal Government Employees | 12 | 0.3% |
| Unpaid Family Workers | 0 | 0.0% |
| Total | 4,888 | 100.0% |
Employment Status by Age in Malverne
According to the labor force statistics for Malverne, out of the total population over 16 years of age (7,112), 71.4% or 5,078 individuals are in the labor force, with 2.4% or 122 of them unemployed. The age group with the highest labor force participation rate is 20 to 24 years, with 97.5% or 433 individuals in the labor force. Within the labor force, the 60 to 64 years age range has the highest percentage of unemployed individuals, with 6.7% or 33 of them being unemployed.
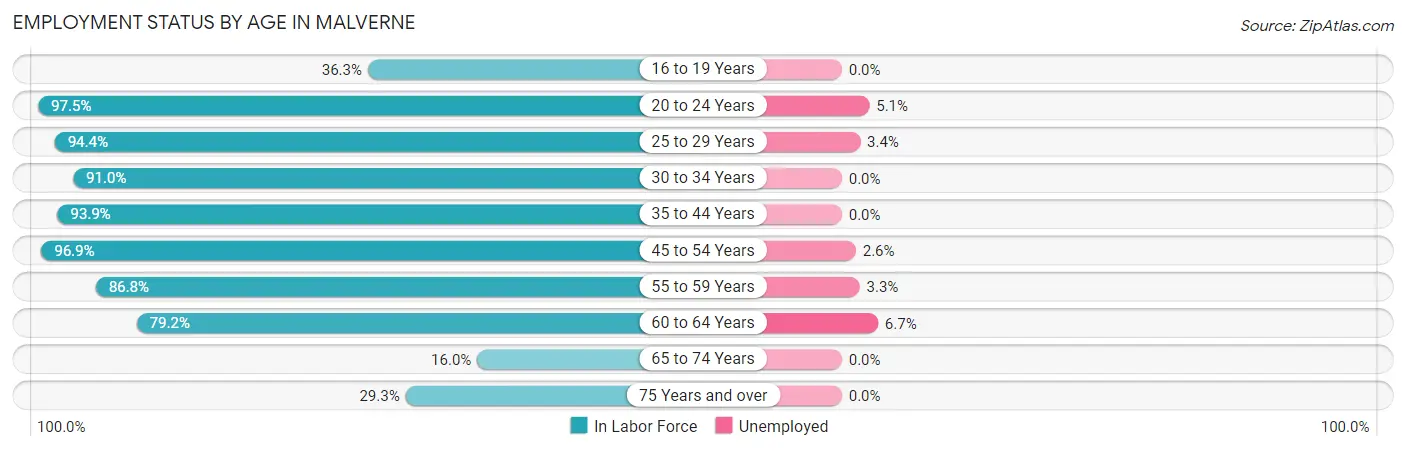
| Age Bracket | In Labor Force | Unemployed |
| 16 to 19 Years | 136 (36.3%) | 0 (0.0%) |
| 20 to 24 Years | 433 (97.5%) | 22 (5.1%) |
| 25 to 29 Years | 560 (94.4%) | 19 (3.4%) |
| 30 to 34 Years | 322 (91.0%) | 0 (0.0%) |
| 35 to 44 Years | 1,012 (93.9%) | 0 (0.0%) |
| 45 to 54 Years | 1,151 (96.9%) | 30 (2.6%) |
| 55 to 59 Years | 605 (86.8%) | 20 (3.3%) |
| 60 to 64 Years | 494 (79.2%) | 33 (6.7%) |
| 65 to 74 Years | 179 (16.0%) | 0 (0.0%) |
| 75 Years and over | 187 (29.3%) | 0 (0.0%) |
| Total | 5,078 (71.4%) | 122 (2.4%) |
Employment Status by Educational Attainment in Malverne
According to labor force statistics for Malverne, 91.4% of individuals (4,144) out of the total population between 25 and 64 years of age (4,534) are in the labor force, with 2.5% or 104 of them being unemployed. The group with the highest labor force participation rate are those with the educational attainment of bachelor's degree or higher, with 94.6% or 2,859 individuals in the labor force. Within the labor force, individuals with college / associate degree education have the highest percentage of unemployment, with 3.5% or 28 of them being unemployed.

| Educational Attainment | In Labor Force | Unemployed |
| Less than High School | 82 (92.1%) | 0 (0.0%) |
| High School Diploma | 404 (74.5%) | 16 (3.0%) |
| College / Associate Degree | 800 (90.8%) | 31 (3.5%) |
| Bachelor's Degree or higher | 2,859 (94.6%) | 66 (2.2%) |
| Total | 4,144 (91.4%) | 113 (2.5%) |
Employment Occupations by Sex in Malverne
Management, Business, Science and Arts Occupations
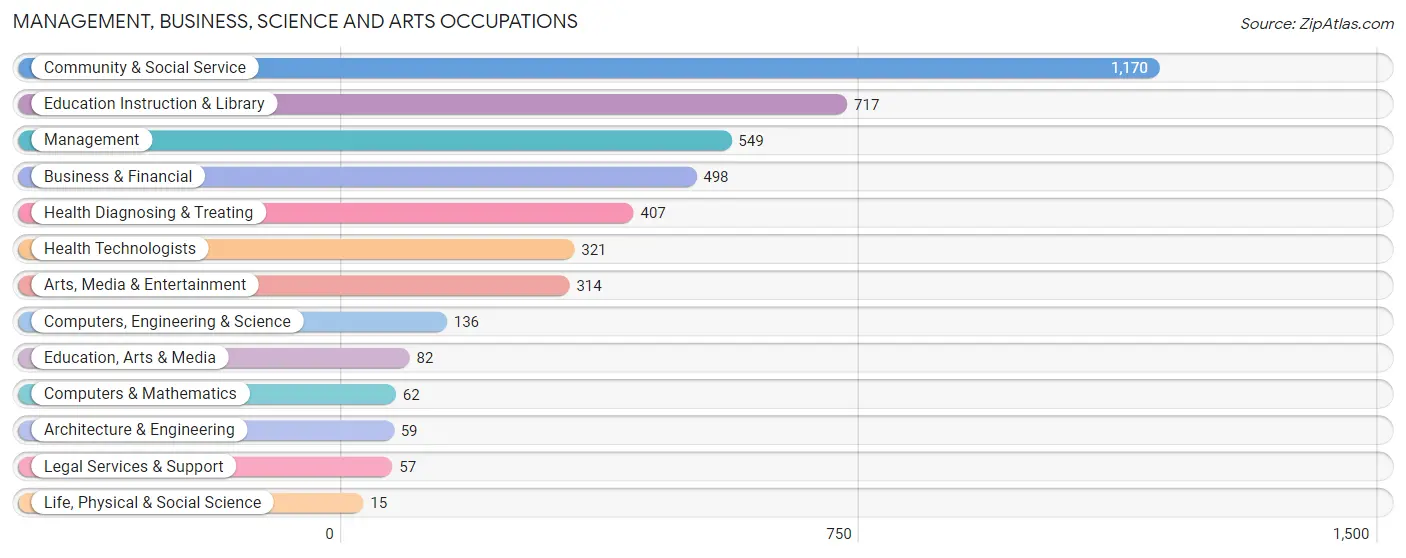
The most common Management, Business, Science and Arts occupations in Malverne are Community & Social Service (1,170 | 23.6%), Education Instruction & Library (717 | 14.5%), Management (549 | 11.1%), Business & Financial (498 | 10.1%), and Health Diagnosing & Treating (407 | 8.2%).
Management, Business, Science and Arts Occupations by Sex
Within the Management, Business, Science and Arts occupations in Malverne, the most male-oriented occupations are Architecture & Engineering (100.0%), Computers, Engineering & Science (65.4%), and Arts, Media & Entertainment (62.1%), while the most female-oriented occupations are Life, Physical & Social Science (100.0%), Education Instruction & Library (78.7%), and Health Technologists (76.6%).
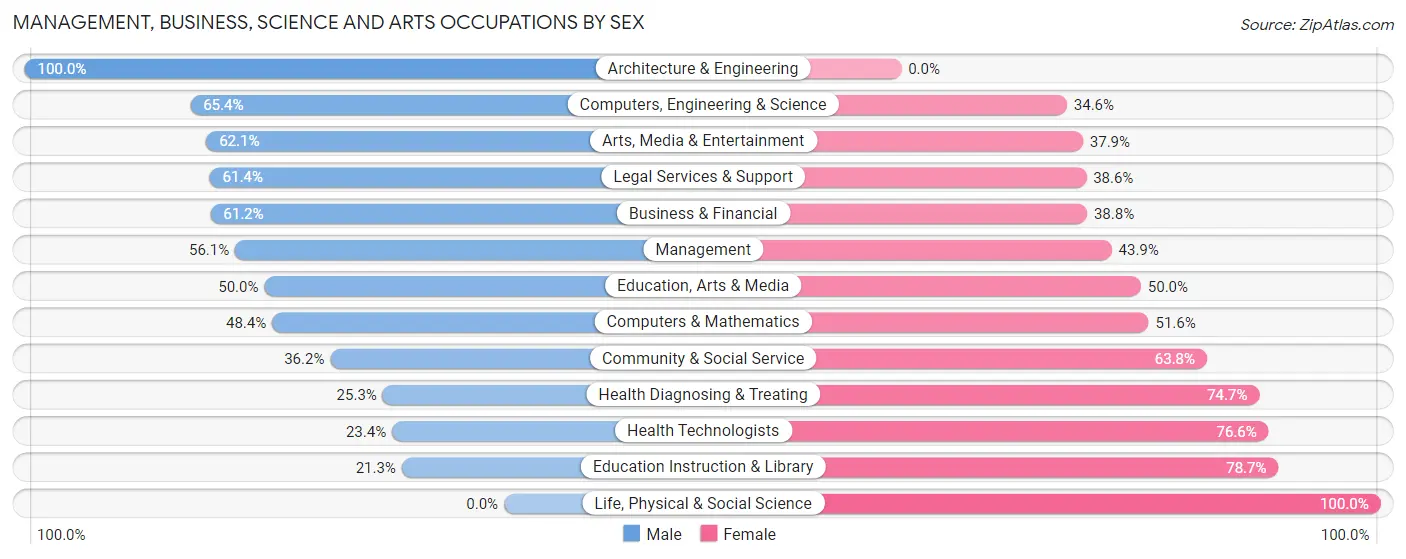
| Occupation | Male | Female |
| Management | 308 (56.1%) | 241 (43.9%) |
| Business & Financial | 305 (61.2%) | 193 (38.8%) |
| Computers, Engineering & Science | 89 (65.4%) | 47 (34.6%) |
| Computers & Mathematics | 30 (48.4%) | 32 (51.6%) |
| Architecture & Engineering | 59 (100.0%) | 0 (0.0%) |
| Life, Physical & Social Science | 0 (0.0%) | 15 (100.0%) |
| Community & Social Service | 424 (36.2%) | 746 (63.8%) |
| Education, Arts & Media | 41 (50.0%) | 41 (50.0%) |
| Legal Services & Support | 35 (61.4%) | 22 (38.6%) |
| Education Instruction & Library | 153 (21.3%) | 564 (78.7%) |
| Arts, Media & Entertainment | 195 (62.1%) | 119 (37.9%) |
| Health Diagnosing & Treating | 103 (25.3%) | 304 (74.7%) |
| Health Technologists | 75 (23.4%) | 246 (76.6%) |
| Total (Category) | 1,229 (44.5%) | 1,531 (55.5%) |
| Total (Overall) | 2,626 (53.0%) | 2,329 (47.0%) |
Services Occupations
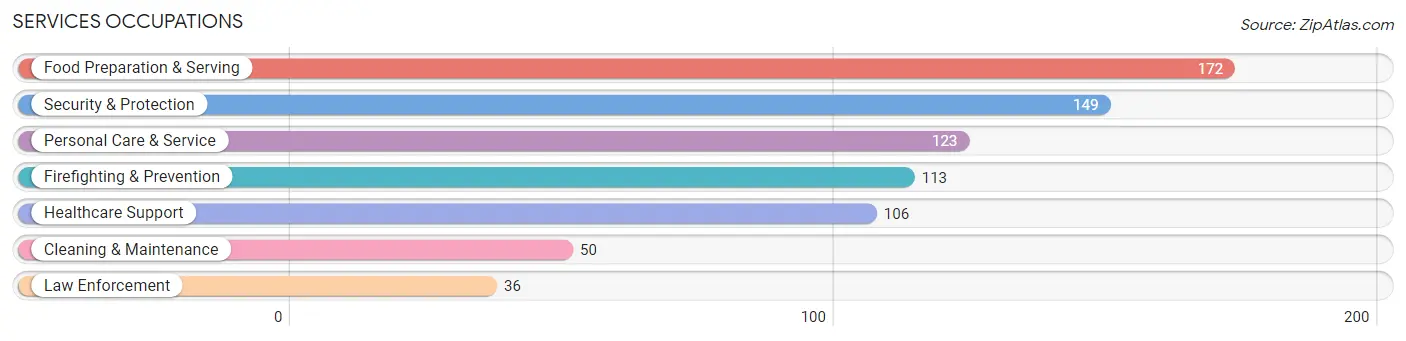
The most common Services occupations in Malverne are Food Preparation & Serving (172 | 3.5%), Security & Protection (149 | 3.0%), Personal Care & Service (123 | 2.5%), Firefighting & Prevention (113 | 2.3%), and Healthcare Support (106 | 2.1%).
Services Occupations by Sex
Within the Services occupations in Malverne, the most male-oriented occupations are Law Enforcement (100.0%), Security & Protection (88.6%), and Firefighting & Prevention (85.0%), while the most female-oriented occupations are Healthcare Support (96.2%), Personal Care & Service (69.1%), and Food Preparation & Serving (50.0%).
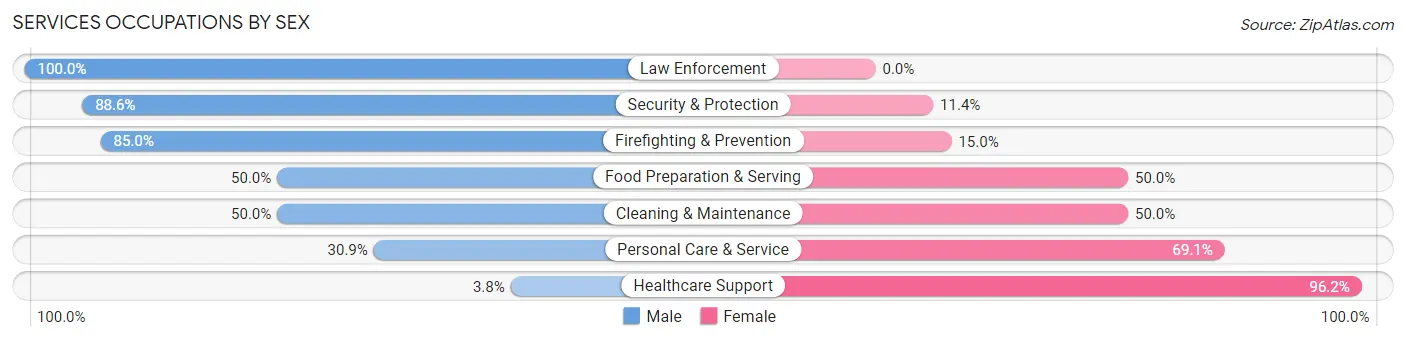
| Occupation | Male | Female |
| Healthcare Support | 4 (3.8%) | 102 (96.2%) |
| Security & Protection | 132 (88.6%) | 17 (11.4%) |
| Firefighting & Prevention | 96 (85.0%) | 17 (15.0%) |
| Law Enforcement | 36 (100.0%) | 0 (0.0%) |
| Food Preparation & Serving | 86 (50.0%) | 86 (50.0%) |
| Cleaning & Maintenance | 25 (50.0%) | 25 (50.0%) |
| Personal Care & Service | 38 (30.9%) | 85 (69.1%) |
| Total (Category) | 285 (47.5%) | 315 (52.5%) |
| Total (Overall) | 2,626 (53.0%) | 2,329 (47.0%) |
Sales and Office Occupations
The most common Sales and Office occupations in Malverne are Office & Administration (696 | 14.1%), and Sales & Related (280 | 5.7%).

Sales and Office Occupations by Sex

| Occupation | Male | Female |
| Sales & Related | 167 (59.6%) | 113 (40.4%) |
| Office & Administration | 369 (53.0%) | 327 (47.0%) |
| Total (Category) | 536 (54.9%) | 440 (45.1%) |
| Total (Overall) | 2,626 (53.0%) | 2,329 (47.0%) |
Natural Resources, Construction and Maintenance Occupations
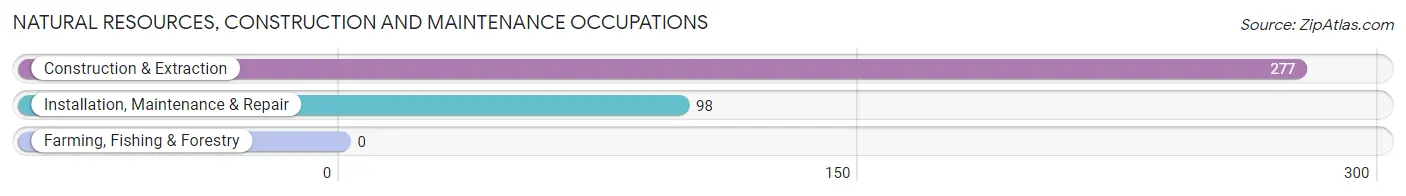
The most common Natural Resources, Construction and Maintenance occupations in Malverne are Construction & Extraction (277 | 5.6%), and Installation, Maintenance & Repair (98 | 2.0%).
Natural Resources, Construction and Maintenance Occupations by Sex

| Occupation | Male | Female |
| Farming, Fishing & Forestry | 0 (0.0%) | 0 (0.0%) |
| Construction & Extraction | 277 (100.0%) | 0 (0.0%) |
| Installation, Maintenance & Repair | 98 (100.0%) | 0 (0.0%) |
| Total (Category) | 375 (100.0%) | 0 (0.0%) |
| Total (Overall) | 2,626 (53.0%) | 2,329 (47.0%) |
Production, Transportation and Moving Occupations
The most common Production, Transportation and Moving occupations in Malverne are Transportation (135 | 2.7%), and Production (109 | 2.2%).
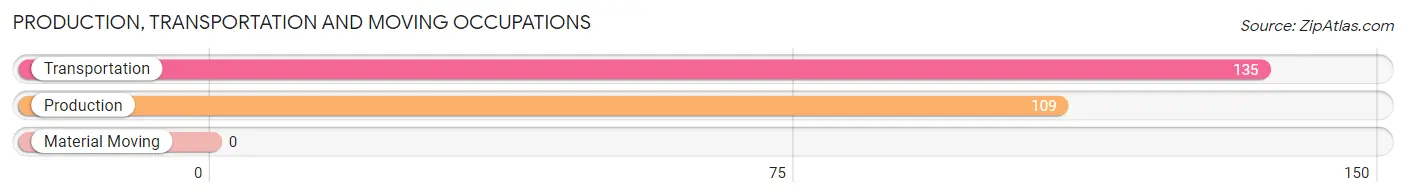
Production, Transportation and Moving Occupations by Sex

| Occupation | Male | Female |
| Production | 66 (60.6%) | 43 (39.5%) |
| Transportation | 135 (100.0%) | 0 (0.0%) |
| Material Moving | 0 (0.0%) | 0 (0.0%) |
| Total (Category) | 201 (82.4%) | 43 (17.6%) |
| Total (Overall) | 2,626 (53.0%) | 2,329 (47.0%) |
Employment Industries by Sex in Malverne
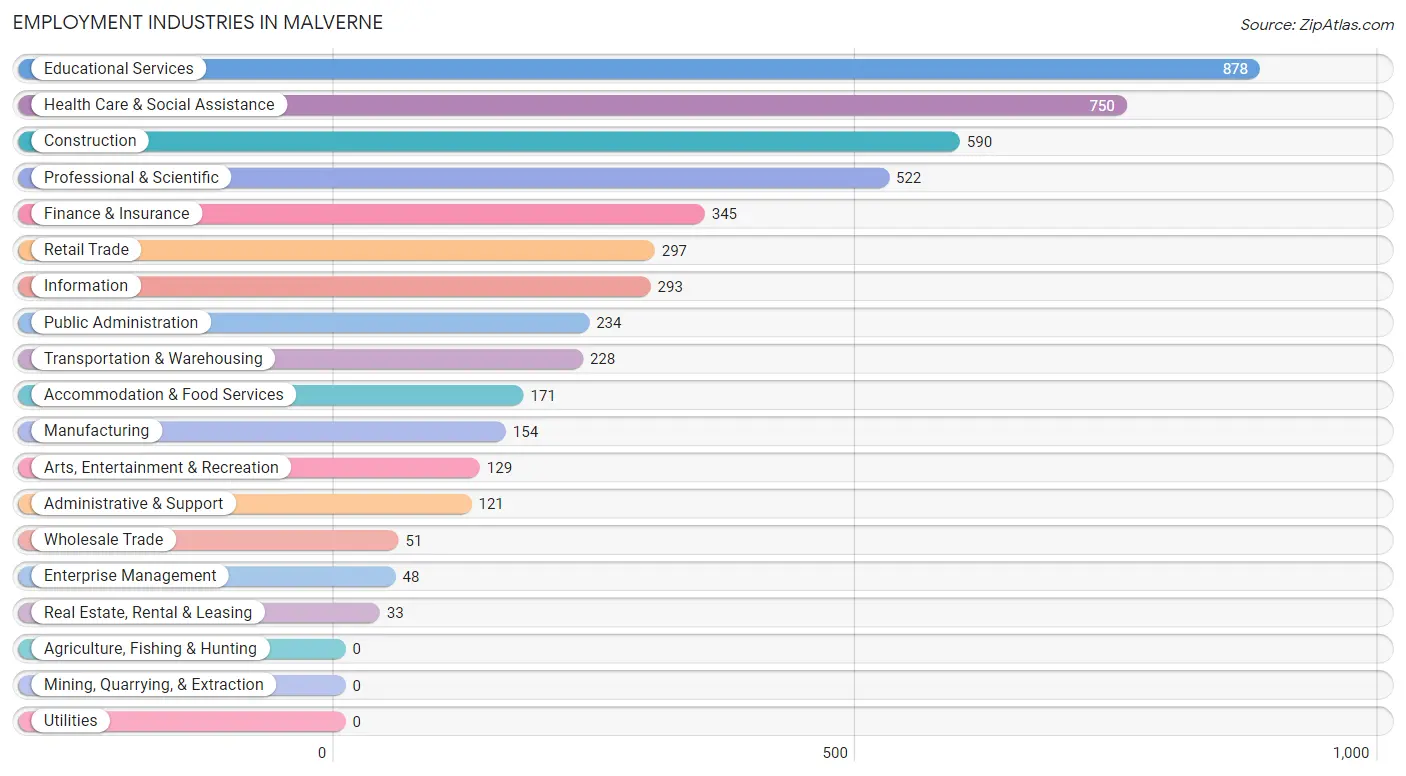
Employment Industries in Malverne
The major employment industries in Malverne include Educational Services (878 | 17.7%), Health Care & Social Assistance (750 | 15.1%), Construction (590 | 11.9%), Professional & Scientific (522 | 10.5%), and Finance & Insurance (345 | 7.0%).
Employment Industries by Sex in Malverne
The Malverne industries that see more men than women are Wholesale Trade (100.0%), Transportation & Warehousing (96.9%), and Construction (87.6%), whereas the industries that tend to have a higher number of women are Real Estate, Rental & Leasing (100.0%), Enterprise Management (100.0%), and Administrative & Support (92.6%).
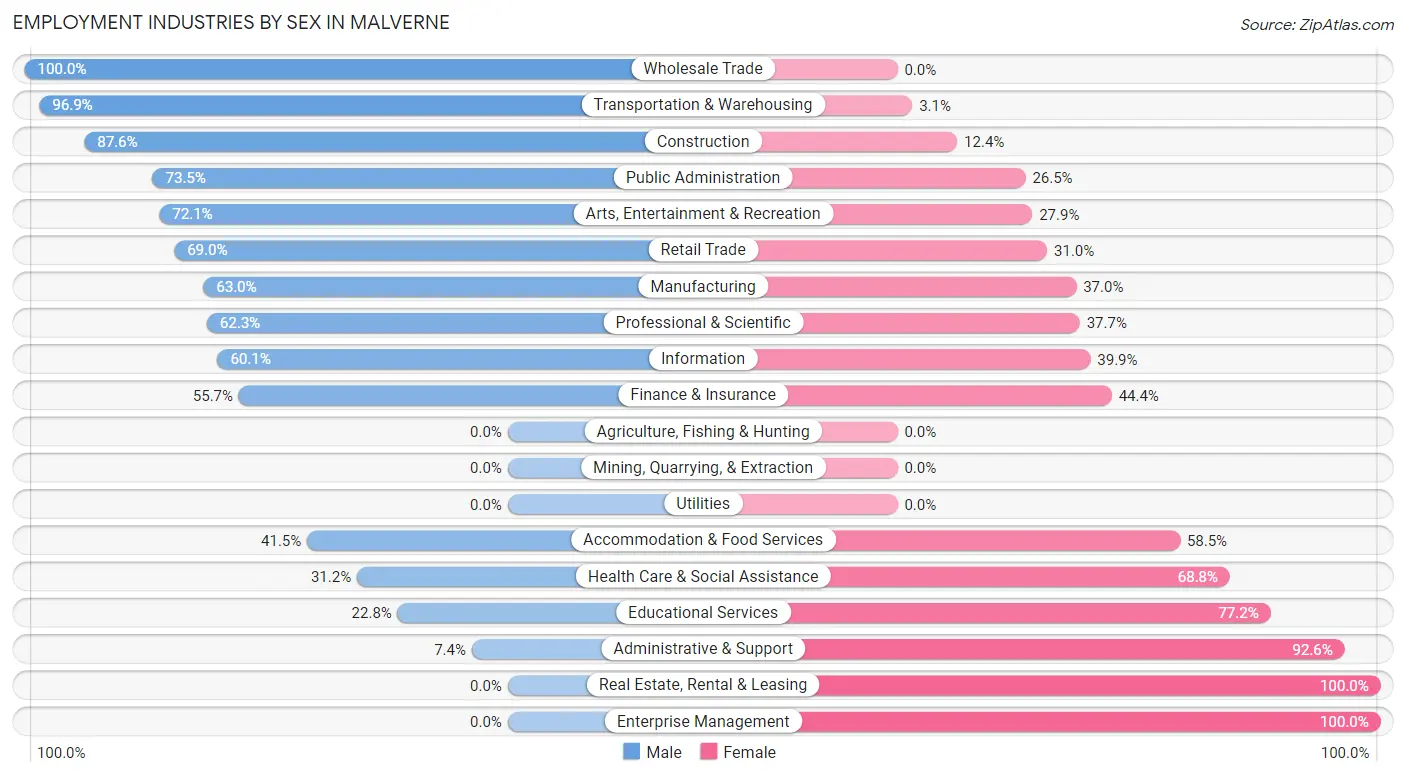
| Industry | Male | Female |
| Agriculture, Fishing & Hunting | 0 (0.0%) | 0 (0.0%) |
| Mining, Quarrying, & Extraction | 0 (0.0%) | 0 (0.0%) |
| Construction | 517 (87.6%) | 73 (12.4%) |
| Manufacturing | 97 (63.0%) | 57 (37.0%) |
| Wholesale Trade | 51 (100.0%) | 0 (0.0%) |
| Retail Trade | 205 (69.0%) | 92 (31.0%) |
| Transportation & Warehousing | 221 (96.9%) | 7 (3.1%) |
| Utilities | 0 (0.0%) | 0 (0.0%) |
| Information | 176 (60.1%) | 117 (39.9%) |
| Finance & Insurance | 192 (55.6%) | 153 (44.4%) |
| Real Estate, Rental & Leasing | 0 (0.0%) | 33 (100.0%) |
| Professional & Scientific | 325 (62.3%) | 197 (37.7%) |
| Enterprise Management | 0 (0.0%) | 48 (100.0%) |
| Administrative & Support | 9 (7.4%) | 112 (92.6%) |
| Educational Services | 200 (22.8%) | 678 (77.2%) |
| Health Care & Social Assistance | 234 (31.2%) | 516 (68.8%) |
| Arts, Entertainment & Recreation | 93 (72.1%) | 36 (27.9%) |
| Accommodation & Food Services | 71 (41.5%) | 100 (58.5%) |
| Public Administration | 172 (73.5%) | 62 (26.5%) |
| Total | 2,626 (53.0%) | 2,329 (47.0%) |
Education in Malverne
School Enrollment in Malverne
The most common levels of schooling among the 1,876 students in Malverne are high school (413 | 22.0%), middle school (352 | 18.8%), and college / undergraduate (350 | 18.7%).
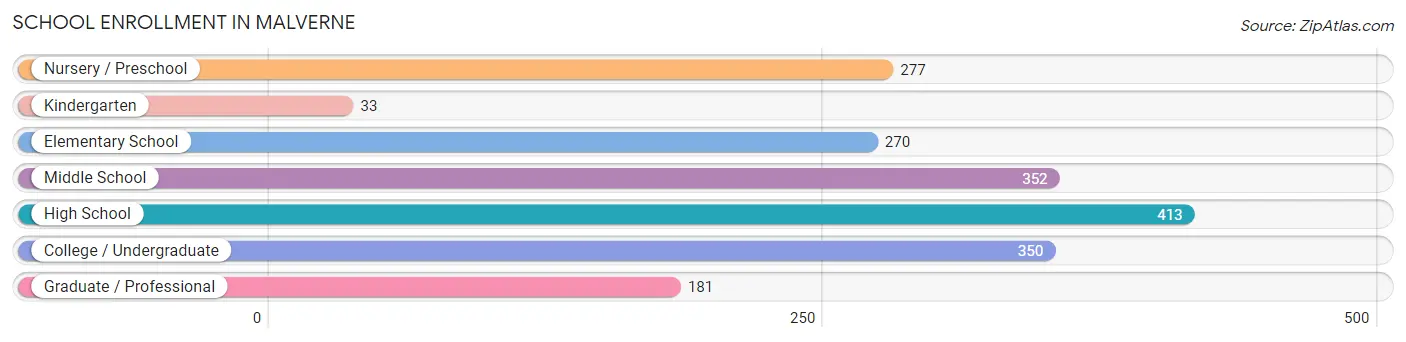
| School Level | # Students | % Students |
| Nursery / Preschool | 277 | 14.8% |
| Kindergarten | 33 | 1.8% |
| Elementary School | 270 | 14.4% |
| Middle School | 352 | 18.8% |
| High School | 413 | 22.0% |
| College / Undergraduate | 350 | 18.7% |
| Graduate / Professional | 181 | 9.7% |
| Total | 1,876 | 100.0% |
School Enrollment by Age by Funding Source in Malverne
Out of a total of 1,876 students who are enrolled in schools in Malverne, 792 (42.2%) attend a private institution, while the remaining 1,084 (57.8%) are enrolled in public schools. The age group of 25 to 34 year olds has the highest likelihood of being enrolled in private schools, with 123 (93.2% in the age bracket) enrolled. Conversely, the age group of 35 years and over has the lowest likelihood of being enrolled in a private school, with 154 (90.1% in the age bracket) attending a public institution.
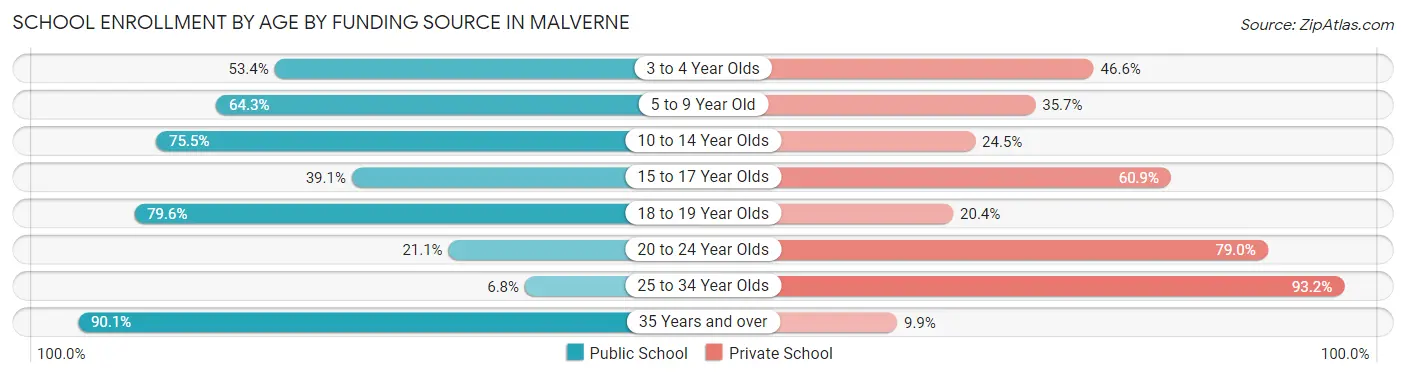
| Age Bracket | Public School | Private School |
| 3 to 4 Year Olds | 132 (53.4%) | 115 (46.6%) |
| 5 to 9 Year Old | 191 (64.3%) | 106 (35.7%) |
| 10 to 14 Year Olds | 333 (75.5%) | 108 (24.5%) |
| 15 to 17 Year Olds | 109 (39.1%) | 170 (60.9%) |
| 18 to 19 Year Olds | 125 (79.6%) | 32 (20.4%) |
| 20 to 24 Year Olds | 32 (21.0%) | 120 (78.9%) |
| 25 to 34 Year Olds | 9 (6.8%) | 123 (93.2%) |
| 35 Years and over | 154 (90.1%) | 17 (9.9%) |
| Total | 1,084 (57.8%) | 792 (42.2%) |
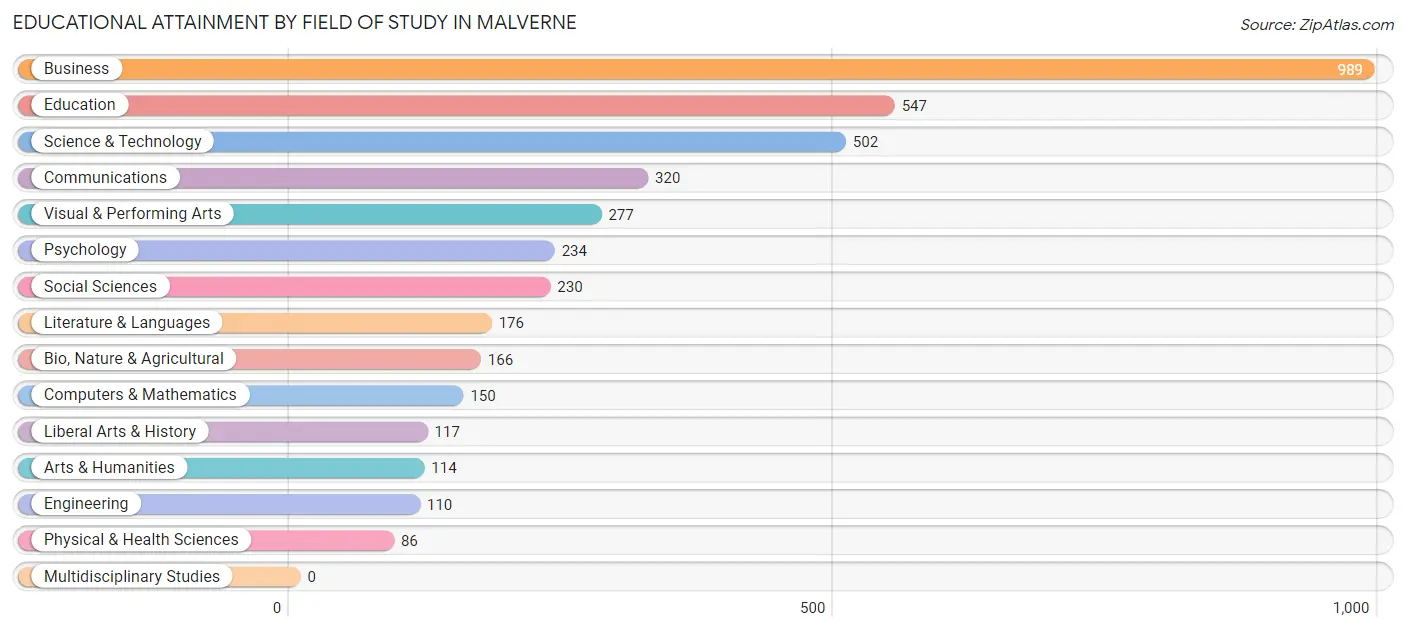
Educational Attainment by Field of Study in Malverne
Business (989 | 24.6%), education (547 | 13.6%), science & technology (502 | 12.5%), communications (320 | 8.0%), and visual & performing arts (277 | 6.9%) are the most common fields of study among 4,018 individuals in Malverne who have obtained a bachelor's degree or higher.
| Field of Study | # Graduates | % Graduates |
| Computers & Mathematics | 150 | 3.7% |
| Bio, Nature & Agricultural | 166 | 4.1% |
| Physical & Health Sciences | 86 | 2.1% |
| Psychology | 234 | 5.8% |
| Social Sciences | 230 | 5.7% |
| Engineering | 110 | 2.7% |
| Multidisciplinary Studies | 0 | 0.0% |
| Science & Technology | 502 | 12.5% |
| Business | 989 | 24.6% |
| Education | 547 | 13.6% |
| Literature & Languages | 176 | 4.4% |
| Liberal Arts & History | 117 | 2.9% |
| Visual & Performing Arts | 277 | 6.9% |
| Communications | 320 | 8.0% |
| Arts & Humanities | 114 | 2.8% |
| Total | 4,018 | 100.0% |
Transportation & Commute in Malverne
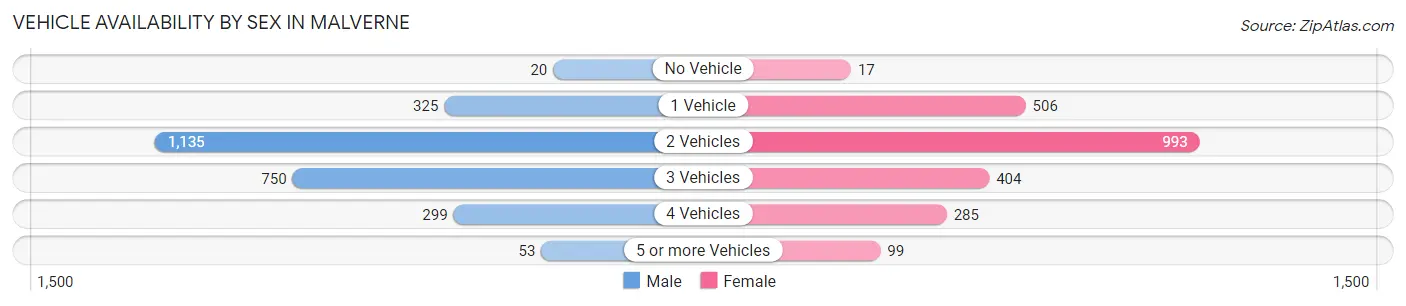
Vehicle Availability by Sex in Malverne
The most prevalent vehicle ownership categories in Malverne are males with 2 vehicles (1,135, accounting for 44.0%) and females with 2 vehicles (993, making up 49.3%).
| Vehicles Available | Male | Female |
| No Vehicle | 20 (0.8%) | 17 (0.7%) |
| 1 Vehicle | 325 (12.6%) | 506 (22.0%) |
| 2 Vehicles | 1,135 (44.0%) | 993 (43.1%) |
| 3 Vehicles | 750 (29.0%) | 404 (17.5%) |
| 4 Vehicles | 299 (11.6%) | 285 (12.4%) |
| 5 or more Vehicles | 53 (2.1%) | 99 (4.3%) |
| Total | 2,582 (100.0%) | 2,304 (100.0%) |
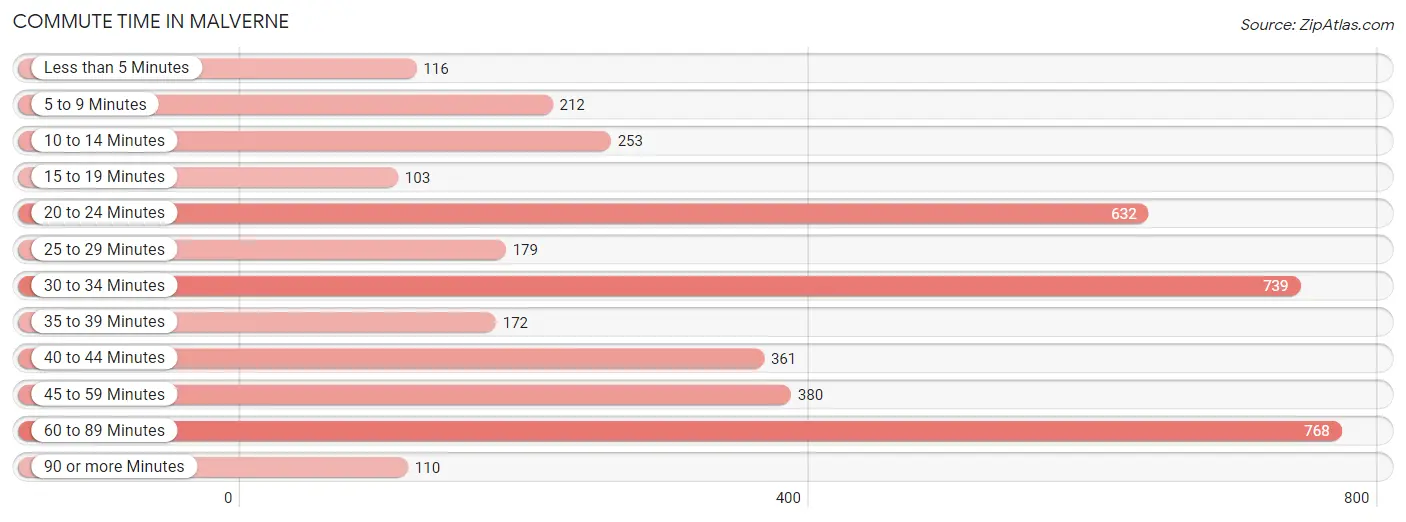
Commute Time in Malverne
The most frequently occuring commute durations in Malverne are 60 to 89 minutes (768 commuters, 19.1%), 30 to 34 minutes (739 commuters, 18.4%), and 20 to 24 minutes (632 commuters, 15.7%).
| Commute Time | # Commuters | % Commuters |
| Less than 5 Minutes | 116 | 2.9% |
| 5 to 9 Minutes | 212 | 5.3% |
| 10 to 14 Minutes | 253 | 6.3% |
| 15 to 19 Minutes | 103 | 2.6% |
| 20 to 24 Minutes | 632 | 15.7% |
| 25 to 29 Minutes | 179 | 4.4% |
| 30 to 34 Minutes | 739 | 18.4% |
| 35 to 39 Minutes | 172 | 4.3% |
| 40 to 44 Minutes | 361 | 9.0% |
| 45 to 59 Minutes | 380 | 9.4% |
| 60 to 89 Minutes | 768 | 19.1% |
| 90 or more Minutes | 110 | 2.7% |
Commute Time by Sex in Malverne
The most common commute times in Malverne are 60 to 89 minutes (493 commuters, 22.8%) for males and 30 to 34 minutes (326 commuters, 17.5%) for females.
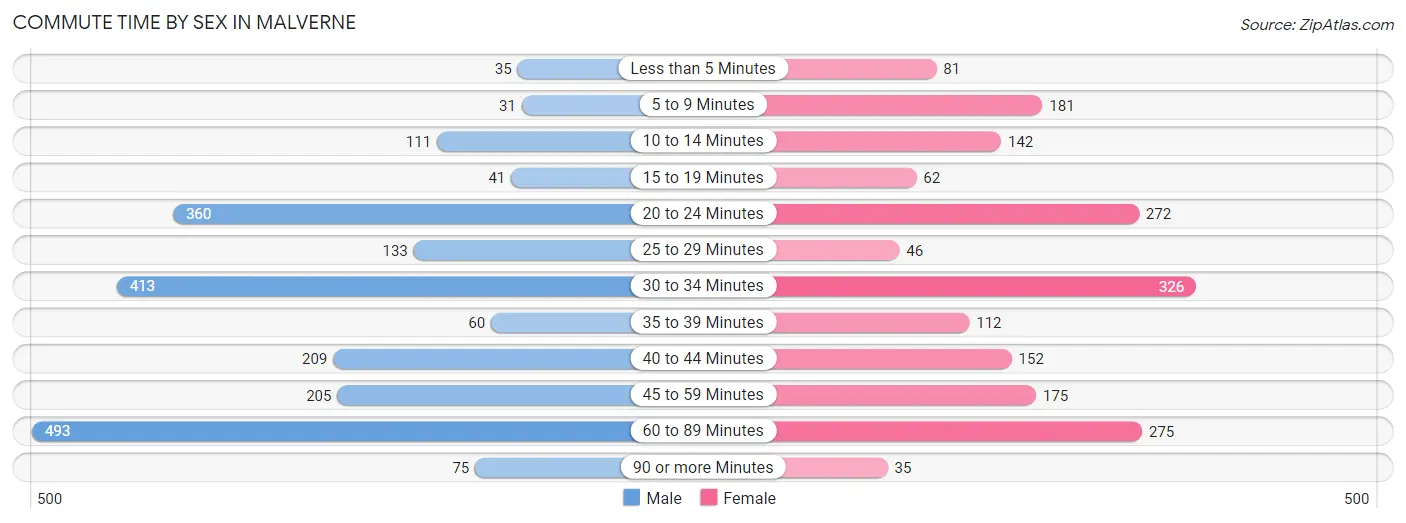
| Commute Time | Male | Female |
| Less than 5 Minutes | 35 (1.6%) | 81 (4.4%) |
| 5 to 9 Minutes | 31 (1.4%) | 181 (9.7%) |
| 10 to 14 Minutes | 111 (5.1%) | 142 (7.6%) |
| 15 to 19 Minutes | 41 (1.9%) | 62 (3.3%) |
| 20 to 24 Minutes | 360 (16.6%) | 272 (14.6%) |
| 25 to 29 Minutes | 133 (6.1%) | 46 (2.5%) |
| 30 to 34 Minutes | 413 (19.1%) | 326 (17.5%) |
| 35 to 39 Minutes | 60 (2.8%) | 112 (6.0%) |
| 40 to 44 Minutes | 209 (9.7%) | 152 (8.2%) |
| 45 to 59 Minutes | 205 (9.5%) | 175 (9.4%) |
| 60 to 89 Minutes | 493 (22.8%) | 275 (14.8%) |
| 90 or more Minutes | 75 (3.5%) | 35 (1.9%) |
Time of Departure to Work by Sex in Malverne
The most frequent times of departure to work in Malverne are 8:00 AM to 8:29 AM (419, 19.3%) for males and 7:00 AM to 7:29 AM (381, 20.5%) for females.
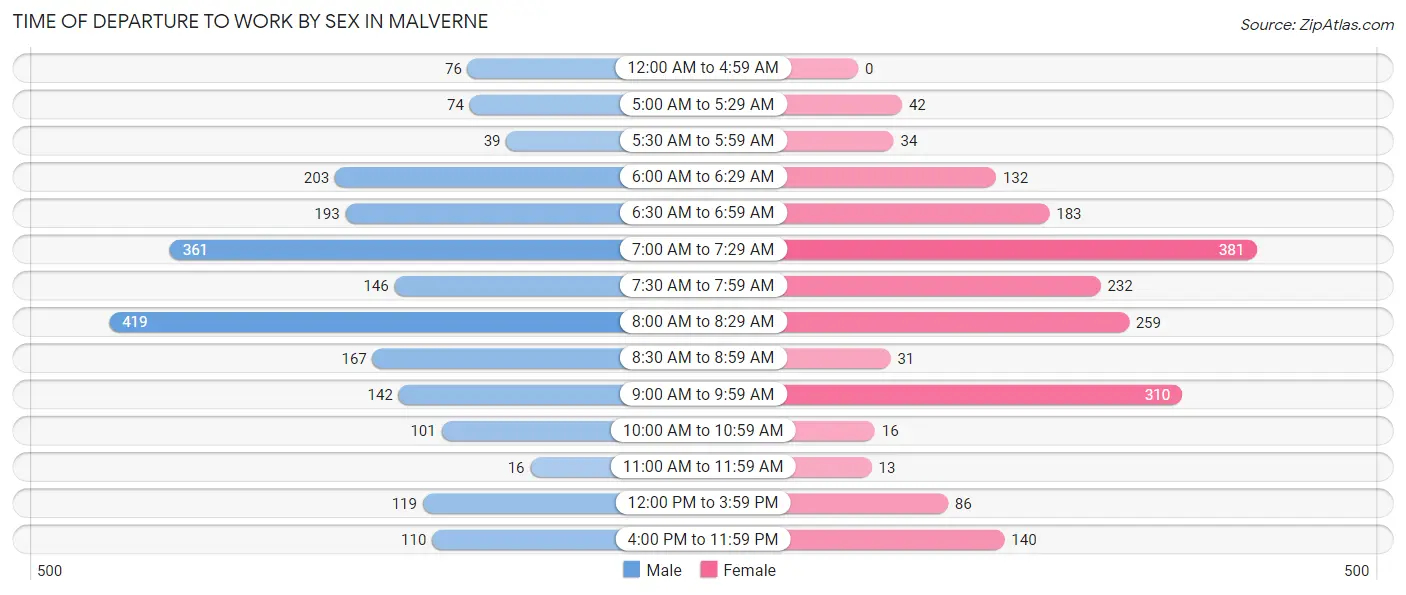
| Time of Departure | Male | Female |
| 12:00 AM to 4:59 AM | 76 (3.5%) | 0 (0.0%) |
| 5:00 AM to 5:29 AM | 74 (3.4%) | 42 (2.3%) |
| 5:30 AM to 5:59 AM | 39 (1.8%) | 34 (1.8%) |
| 6:00 AM to 6:29 AM | 203 (9.4%) | 132 (7.1%) |
| 6:30 AM to 6:59 AM | 193 (8.9%) | 183 (9.8%) |
| 7:00 AM to 7:29 AM | 361 (16.7%) | 381 (20.5%) |
| 7:30 AM to 7:59 AM | 146 (6.7%) | 232 (12.5%) |
| 8:00 AM to 8:29 AM | 419 (19.3%) | 259 (13.9%) |
| 8:30 AM to 8:59 AM | 167 (7.7%) | 31 (1.7%) |
| 9:00 AM to 9:59 AM | 142 (6.6%) | 310 (16.7%) |
| 10:00 AM to 10:59 AM | 101 (4.7%) | 16 (0.9%) |
| 11:00 AM to 11:59 AM | 16 (0.7%) | 13 (0.7%) |
| 12:00 PM to 3:59 PM | 119 (5.5%) | 86 (4.6%) |
| 4:00 PM to 11:59 PM | 110 (5.1%) | 140 (7.5%) |
| Total | 2,166 (100.0%) | 1,859 (100.0%) |
Housing Occupancy in Malverne
Occupancy by Ownership in Malverne
Of the total 2,924 dwellings in Malverne, owner-occupied units account for 2,779 (95.0%), while renter-occupied units make up 145 (5.0%).
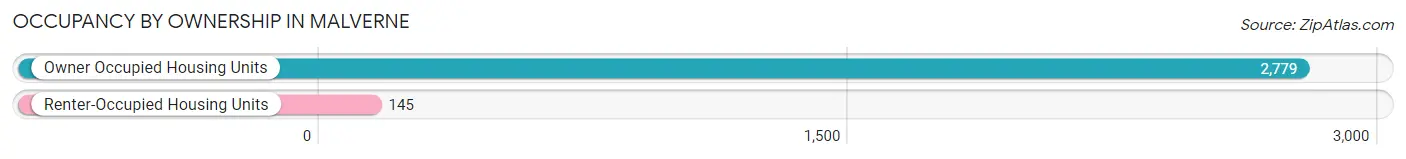
| Occupancy | # Housing Units | % Housing Units |
| Owner Occupied Housing Units | 2,779 | 95.0% |
| Renter-Occupied Housing Units | 145 | 5.0% |
| Total Occupied Housing Units | 2,924 | 100.0% |
Occupancy by Household Size in Malverne
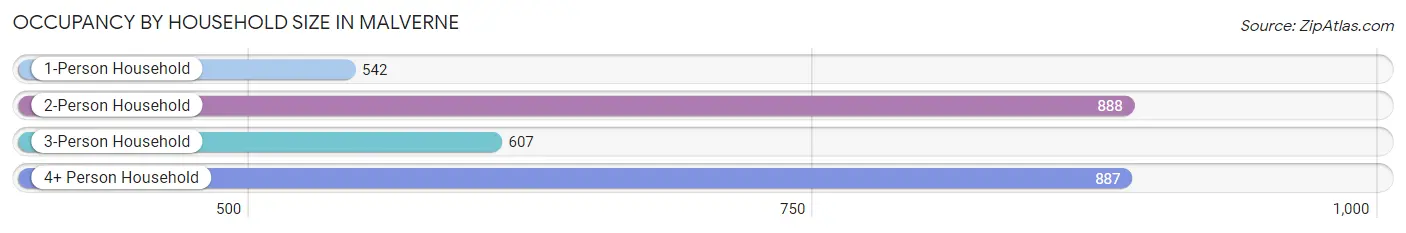
| Household Size | # Housing Units | % Housing Units |
| 1-Person Household | 542 | 18.5% |
| 2-Person Household | 888 | 30.4% |
| 3-Person Household | 607 | 20.8% |
| 4+ Person Household | 887 | 30.3% |
| Total Housing Units | 2,924 | 100.0% |
Occupancy by Ownership by Household Size in Malverne
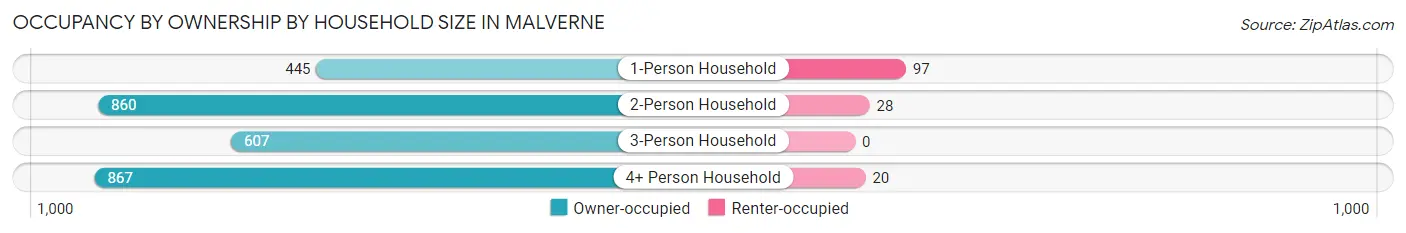
| Household Size | Owner-occupied | Renter-occupied |
| 1-Person Household | 445 (82.1%) | 97 (17.9%) |
| 2-Person Household | 860 (96.9%) | 28 (3.2%) |
| 3-Person Household | 607 (100.0%) | 0 (0.0%) |
| 4+ Person Household | 867 (97.8%) | 20 (2.2%) |
| Total Housing Units | 2,779 (95.0%) | 145 (5.0%) |
Occupancy by Educational Attainment in Malverne
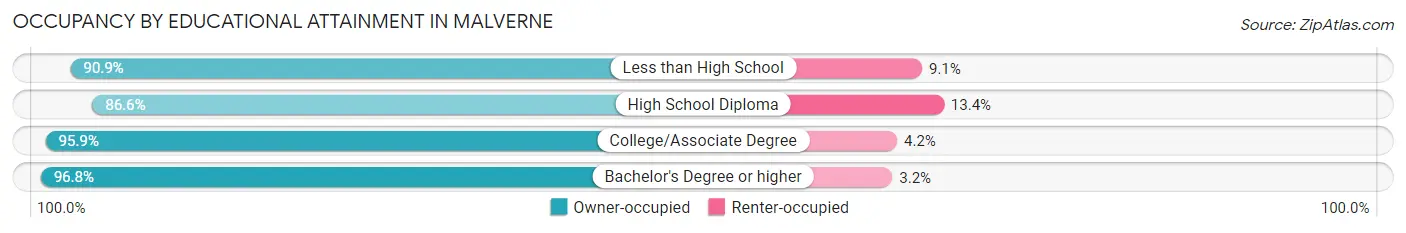
| Household Size | Owner-occupied | Renter-occupied |
| Less than High School | 70 (90.9%) | 7 (9.1%) |
| High School Diploma | 348 (86.6%) | 54 (13.4%) |
| College/Associate Degree | 578 (95.9%) | 25 (4.2%) |
| Bachelor's Degree or higher | 1,783 (96.8%) | 59 (3.2%) |
Occupancy by Age of Householder in Malverne
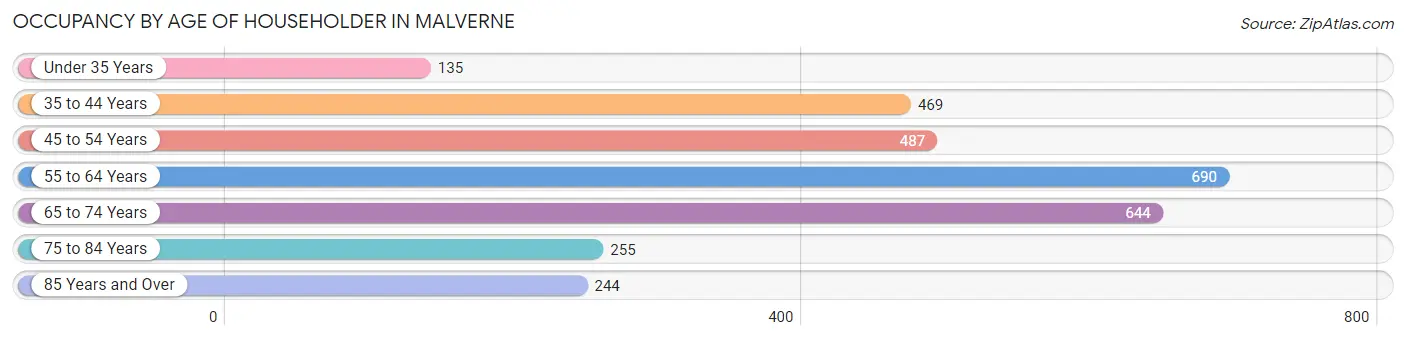
| Age Bracket | # Households | % Households |
| Under 35 Years | 135 | 4.6% |
| 35 to 44 Years | 469 | 16.0% |
| 45 to 54 Years | 487 | 16.7% |
| 55 to 64 Years | 690 | 23.6% |
| 65 to 74 Years | 644 | 22.0% |
| 75 to 84 Years | 255 | 8.7% |
| 85 Years and Over | 244 | 8.3% |
| Total | 2,924 | 100.0% |
Housing Finances in Malverne
Median Income by Occupancy in Malverne
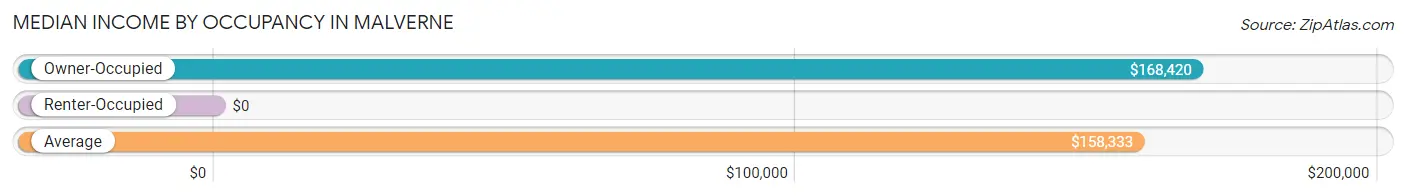
| Occupancy Type | # Households | Median Income |
| Owner-Occupied | 2,779 (95.0%) | $168,420 |
| Renter-Occupied | 145 (5.0%) | $0 |
| Average | 2,924 (100.0%) | $158,333 |
Occupancy by Householder Income Bracket in Malverne
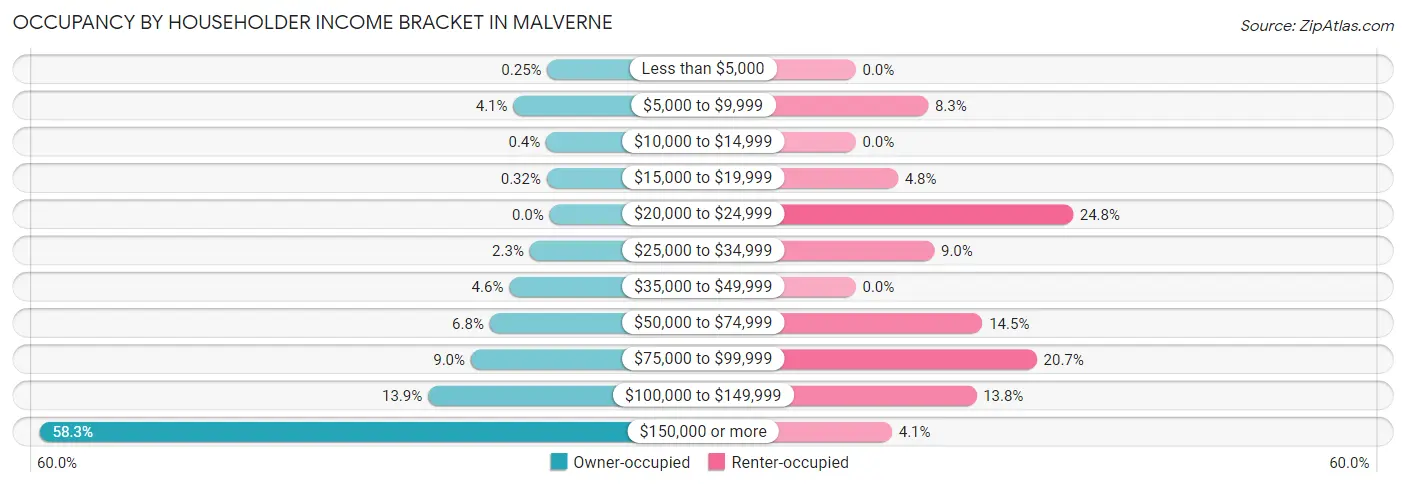
| Income Bracket | Owner-occupied | Renter-occupied |
| Less than $5,000 | 7 (0.3%) | 0 (0.0%) |
| $5,000 to $9,999 | 115 (4.1%) | 12 (8.3%) |
| $10,000 to $14,999 | 11 (0.4%) | 0 (0.0%) |
| $15,000 to $19,999 | 9 (0.3%) | 7 (4.8%) |
| $20,000 to $24,999 | 0 (0.0%) | 36 (24.8%) |
| $25,000 to $34,999 | 63 (2.3%) | 13 (9.0%) |
| $35,000 to $49,999 | 128 (4.6%) | 0 (0.0%) |
| $50,000 to $74,999 | 190 (6.8%) | 21 (14.5%) |
| $75,000 to $99,999 | 250 (9.0%) | 30 (20.7%) |
| $100,000 to $149,999 | 386 (13.9%) | 20 (13.8%) |
| $150,000 or more | 1,620 (58.3%) | 6 (4.1%) |
| Total | 2,779 (100.0%) | 145 (100.0%) |
Monthly Housing Cost Tiers in Malverne
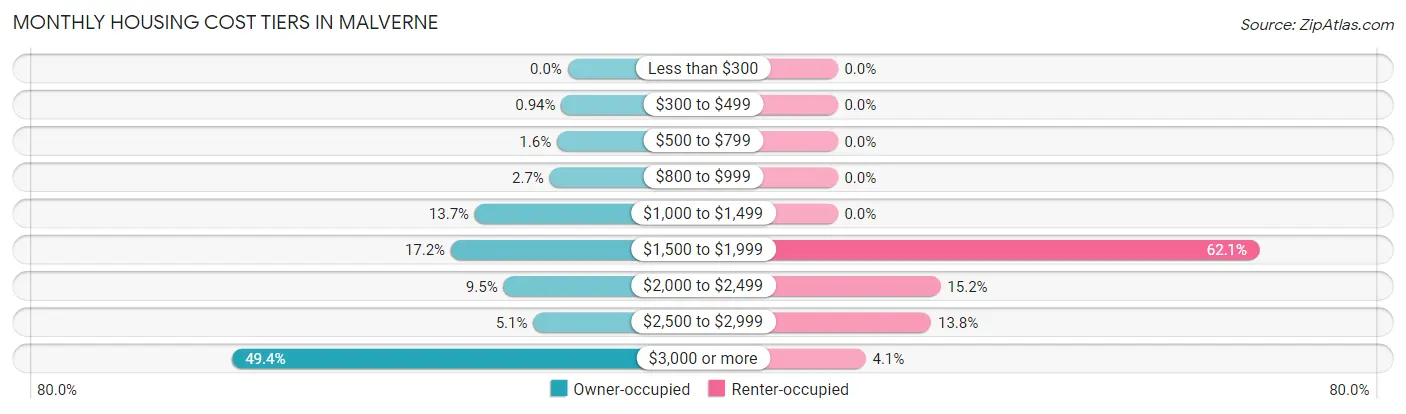
| Monthly Cost | Owner-occupied | Renter-occupied |
| Less than $300 | 0 (0.0%) | 0 (0.0%) |
| $300 to $499 | 26 (0.9%) | 0 (0.0%) |
| $500 to $799 | 44 (1.6%) | 0 (0.0%) |
| $800 to $999 | 74 (2.7%) | 0 (0.0%) |
| $1,000 to $1,499 | 380 (13.7%) | 0 (0.0%) |
| $1,500 to $1,999 | 478 (17.2%) | 90 (62.1%) |
| $2,000 to $2,499 | 263 (9.5%) | 22 (15.2%) |
| $2,500 to $2,999 | 141 (5.1%) | 20 (13.8%) |
| $3,000 or more | 1,373 (49.4%) | 6 (4.1%) |
| Total | 2,779 (100.0%) | 145 (100.0%) |
Physical Housing Characteristics in Malverne
Housing Structures in Malverne
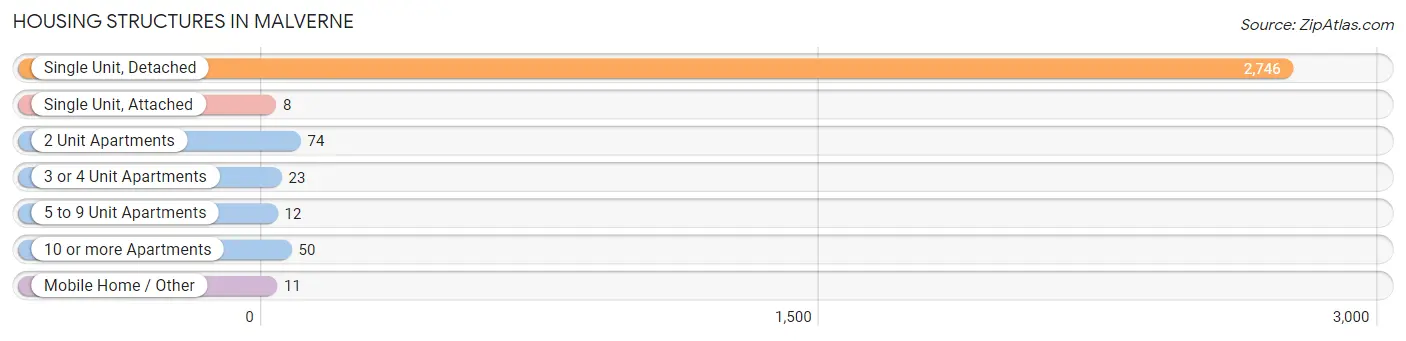
| Structure Type | # Housing Units | % Housing Units |
| Single Unit, Detached | 2,746 | 93.9% |
| Single Unit, Attached | 8 | 0.3% |
| 2 Unit Apartments | 74 | 2.5% |
| 3 or 4 Unit Apartments | 23 | 0.8% |
| 5 to 9 Unit Apartments | 12 | 0.4% |
| 10 or more Apartments | 50 | 1.7% |
| Mobile Home / Other | 11 | 0.4% |
| Total | 2,924 | 100.0% |
Housing Structures by Occupancy in Malverne
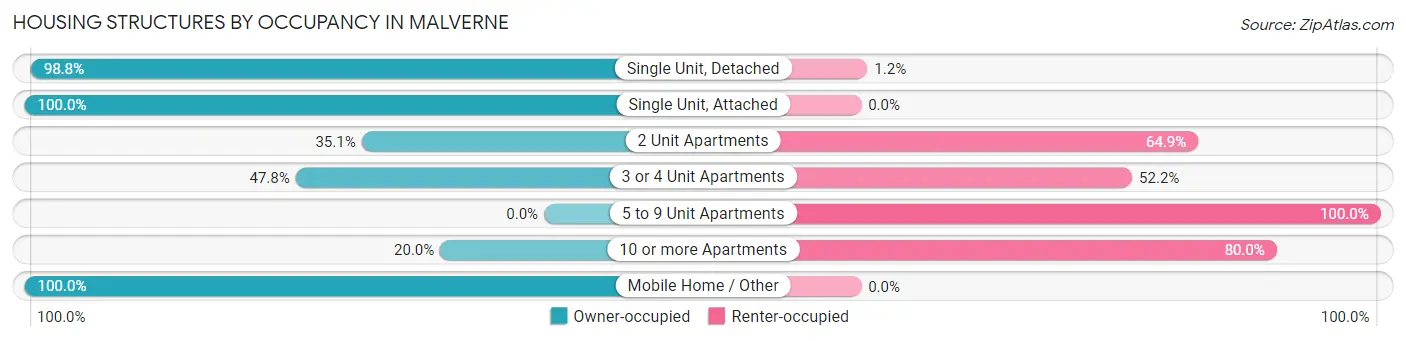
| Structure Type | Owner-occupied | Renter-occupied |
| Single Unit, Detached | 2,713 (98.8%) | 33 (1.2%) |
| Single Unit, Attached | 8 (100.0%) | 0 (0.0%) |
| 2 Unit Apartments | 26 (35.1%) | 48 (64.9%) |
| 3 or 4 Unit Apartments | 11 (47.8%) | 12 (52.2%) |
| 5 to 9 Unit Apartments | 0 (0.0%) | 12 (100.0%) |
| 10 or more Apartments | 10 (20.0%) | 40 (80.0%) |
| Mobile Home / Other | 11 (100.0%) | 0 (0.0%) |
| Total | 2,779 (95.0%) | 145 (5.0%) |
Housing Structures by Number of Rooms in Malverne
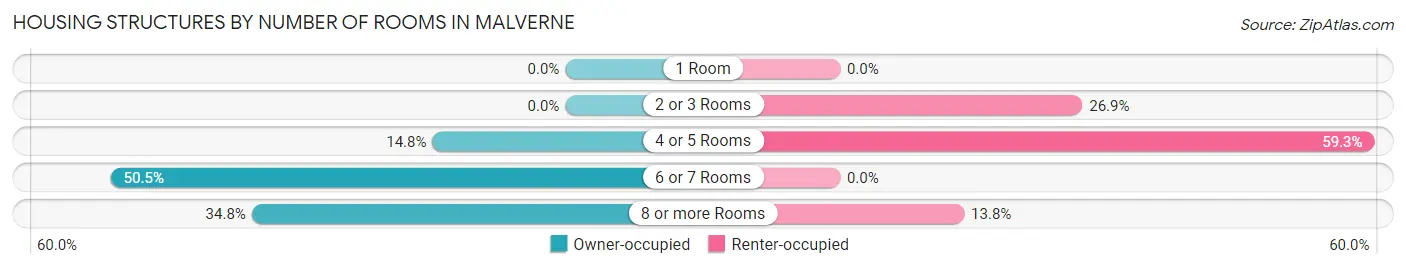
| Number of Rooms | Owner-occupied | Renter-occupied |
| 1 Room | 0 (0.0%) | 0 (0.0%) |
| 2 or 3 Rooms | 0 (0.0%) | 39 (26.9%) |
| 4 or 5 Rooms | 410 (14.7%) | 86 (59.3%) |
| 6 or 7 Rooms | 1,402 (50.4%) | 0 (0.0%) |
| 8 or more Rooms | 967 (34.8%) | 20 (13.8%) |
| Total | 2,779 (100.0%) | 145 (100.0%) |
Housing Structure by Heating Type in Malverne
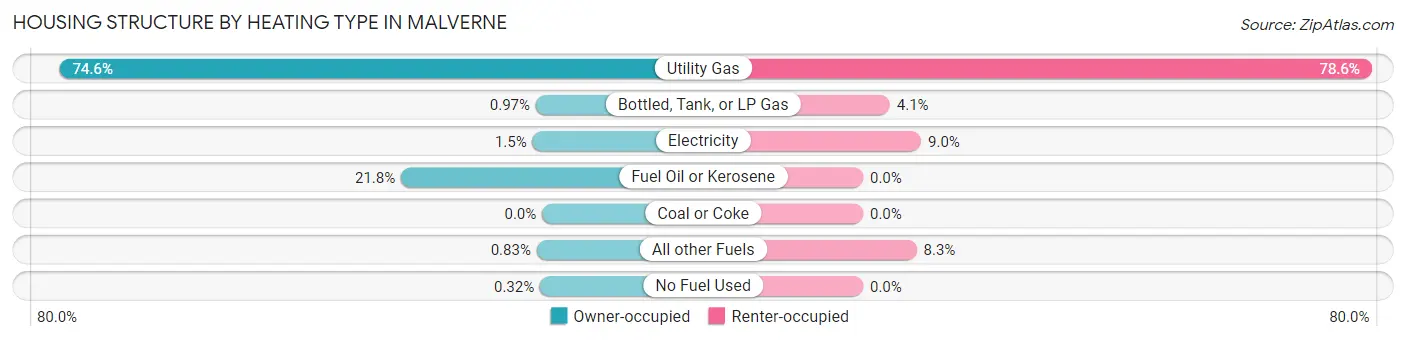
| Heating Type | Owner-occupied | Renter-occupied |
| Utility Gas | 2,073 (74.6%) | 114 (78.6%) |
| Bottled, Tank, or LP Gas | 27 (1.0%) | 6 (4.1%) |
| Electricity | 41 (1.5%) | 13 (9.0%) |
| Fuel Oil or Kerosene | 606 (21.8%) | 0 (0.0%) |
| Coal or Coke | 0 (0.0%) | 0 (0.0%) |
| All other Fuels | 23 (0.8%) | 12 (8.3%) |
| No Fuel Used | 9 (0.3%) | 0 (0.0%) |
| Total | 2,779 (100.0%) | 145 (100.0%) |
Household Vehicle Usage in Malverne
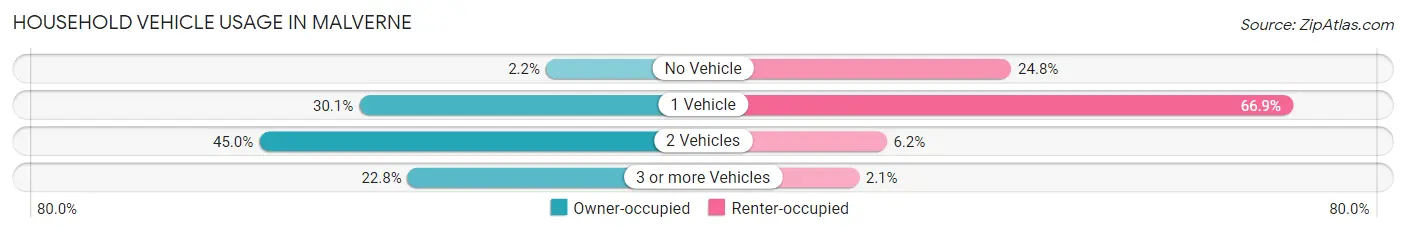
| Vehicles per Household | Owner-occupied | Renter-occupied |
| No Vehicle | 60 (2.2%) | 36 (24.8%) |
| 1 Vehicle | 835 (30.0%) | 97 (66.9%) |
| 2 Vehicles | 1,250 (45.0%) | 9 (6.2%) |
| 3 or more Vehicles | 634 (22.8%) | 3 (2.1%) |
| Total | 2,779 (100.0%) | 145 (100.0%) |
Real Estate & Mortgages in Malverne
Real Estate and Mortgage Overview in Malverne
| Characteristic | Without Mortgage | With Mortgage |
| Housing Units | 1,062 | 1,717 |
| Median Property Value | $590,600 | $622,700 |
| Median Household Income | $104,688 | $1,176 |
| Monthly Housing Costs | $1,501 | $1,350 |
| Real Estate Taxes | $10,001 | $11 |
Property Value by Mortgage Status in Malverne
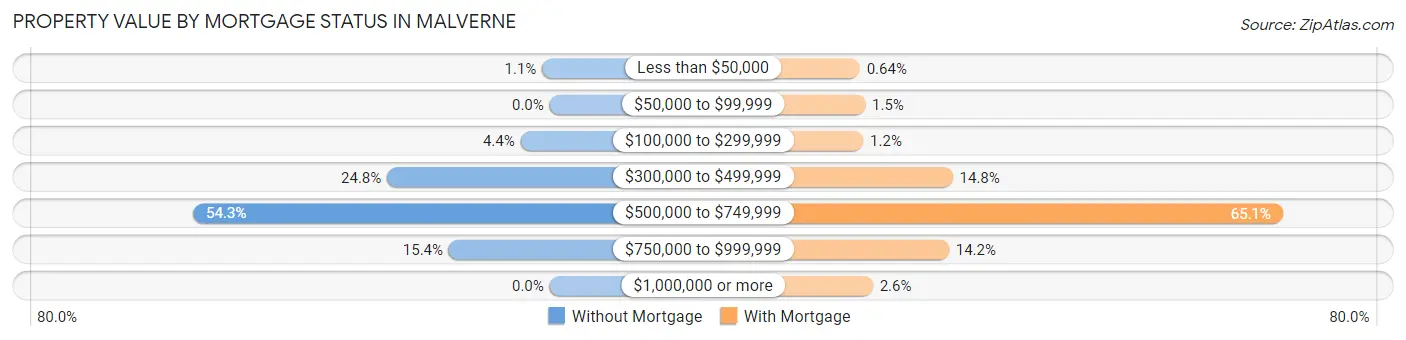
| Property Value | Without Mortgage | With Mortgage |
| Less than $50,000 | 12 (1.1%) | 11 (0.6%) |
| $50,000 to $99,999 | 0 (0.0%) | 25 (1.5%) |
| $100,000 to $299,999 | 47 (4.4%) | 20 (1.2%) |
| $300,000 to $499,999 | 263 (24.8%) | 254 (14.8%) |
| $500,000 to $749,999 | 577 (54.3%) | 1,118 (65.1%) |
| $750,000 to $999,999 | 163 (15.3%) | 244 (14.2%) |
| $1,000,000 or more | 0 (0.0%) | 45 (2.6%) |
| Total | 1,062 (100.0%) | 1,717 (100.0%) |
Household Income by Mortgage Status in Malverne
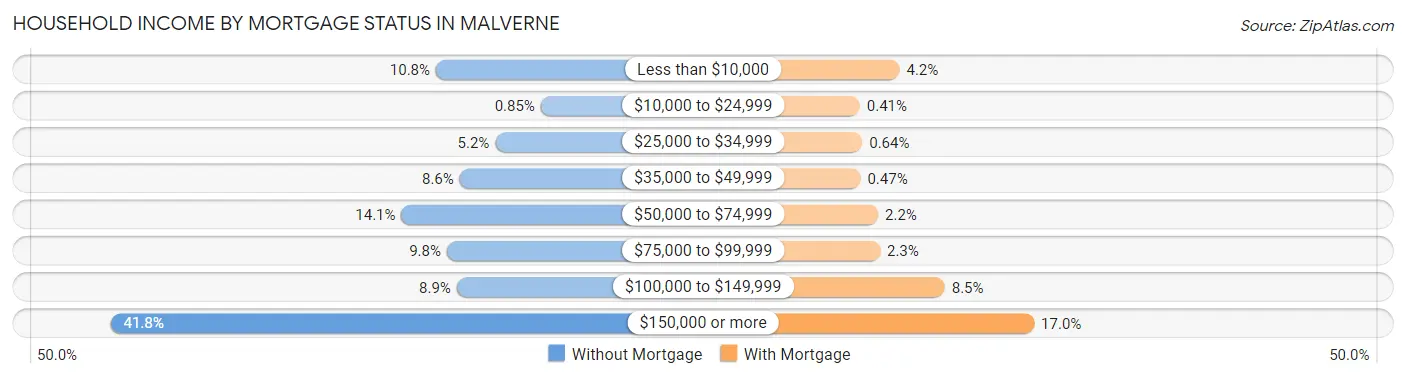
| Household Income | Without Mortgage | With Mortgage |
| Less than $10,000 | 115 (10.8%) | 72 (4.2%) |
| $10,000 to $24,999 | 9 (0.9%) | 7 (0.4%) |
| $25,000 to $34,999 | 55 (5.2%) | 11 (0.6%) |
| $35,000 to $49,999 | 91 (8.6%) | 8 (0.5%) |
| $50,000 to $74,999 | 150 (14.1%) | 37 (2.1%) |
| $75,000 to $99,999 | 104 (9.8%) | 40 (2.3%) |
| $100,000 to $149,999 | 94 (8.8%) | 146 (8.5%) |
| $150,000 or more | 444 (41.8%) | 292 (17.0%) |
| Total | 1,062 (100.0%) | 1,717 (100.0%) |
Property Value to Household Income Ratio in Malverne
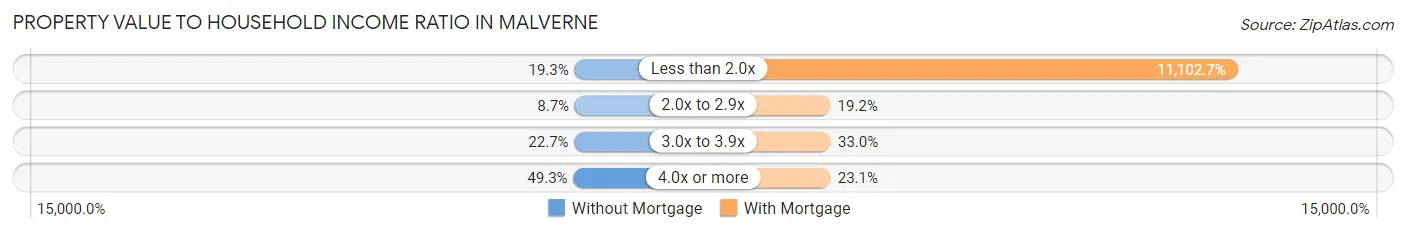
| Value-to-Income Ratio | Without Mortgage | With Mortgage |
| Less than 2.0x | 205 (19.3%) | 190,634 (11,102.7%) |
| 2.0x to 2.9x | 92 (8.7%) | 329 (19.2%) |
| 3.0x to 3.9x | 241 (22.7%) | 566 (33.0%) |
| 4.0x or more | 524 (49.3%) | 396 (23.1%) |
| Total | 1,062 (100.0%) | 1,717 (100.0%) |
Real Estate Taxes by Mortgage Status in Malverne

| Property Taxes | Without Mortgage | With Mortgage |
| Less than $800 | 0 (0.0%) | 0 (0.0%) |
| $800 to $1,499 | 0 (0.0%) | 0 (0.0%) |
| $800 to $1,499 | 1,062 (100.0%) | 0 (0.0%) |
| Total | 1,062 (100.0%) | 1,717 (100.0%) |
Health & Disability in Malverne
Health Insurance Coverage by Age in Malverne
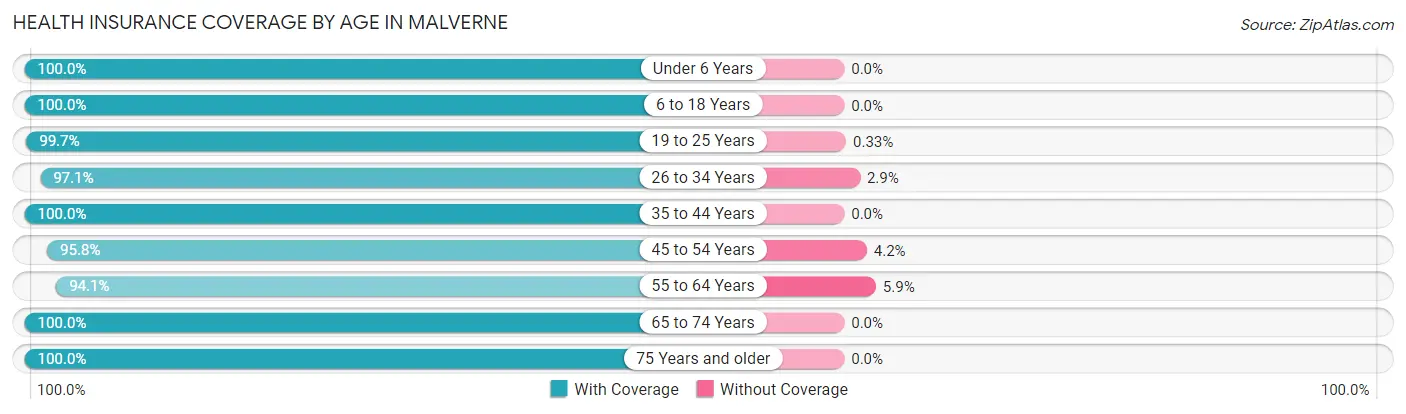
| Age Bracket | With Coverage | Without Coverage |
| Under 6 Years | 661 (100.0%) | 0 (0.0%) |
| 6 to 18 Years | 1,093 (100.0%) | 0 (0.0%) |
| 19 to 25 Years | 602 (99.7%) | 2 (0.3%) |
| 26 to 34 Years | 798 (97.1%) | 24 (2.9%) |
| 35 to 44 Years | 1,078 (100.0%) | 0 (0.0%) |
| 45 to 54 Years | 1,138 (95.8%) | 50 (4.2%) |
| 55 to 64 Years | 1,243 (94.1%) | 78 (5.9%) |
| 65 to 74 Years | 1,120 (100.0%) | 0 (0.0%) |
| 75 Years and older | 639 (100.0%) | 0 (0.0%) |
| Total | 8,372 (98.2%) | 154 (1.8%) |
Health Insurance Coverage by Citizenship Status in Malverne

| Citizenship Status | With Coverage | Without Coverage |
| Native Born | 661 (100.0%) | 0 (0.0%) |
| Foreign Born, Citizen | 1,093 (100.0%) | 0 (0.0%) |
| Foreign Born, not a Citizen | 602 (99.7%) | 2 (0.3%) |
Health Insurance Coverage by Household Income in Malverne

| Household Income | With Coverage | Without Coverage |
| Under $25,000 | 277 (100.0%) | 0 (0.0%) |
| $25,000 to $49,999 | 374 (100.0%) | 0 (0.0%) |
| $50,000 to $74,999 | 314 (100.0%) | 0 (0.0%) |
| $75,000 to $99,999 | 541 (100.0%) | 0 (0.0%) |
| $100,000 and over | 6,856 (97.8%) | 152 (2.2%) |
Public vs Private Health Insurance Coverage by Age in Malverne
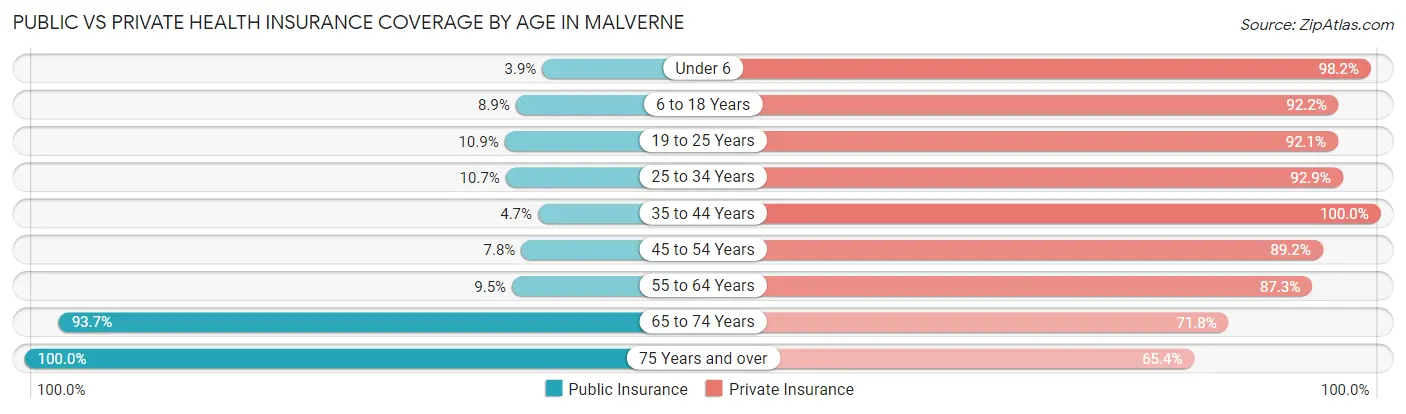
| Age Bracket | Public Insurance | Private Insurance |
| Under 6 | 26 (3.9%) | 649 (98.2%) |
| 6 to 18 Years | 97 (8.9%) | 1,008 (92.2%) |
| 19 to 25 Years | 66 (10.9%) | 556 (92.0%) |
| 25 to 34 Years | 88 (10.7%) | 764 (92.9%) |
| 35 to 44 Years | 51 (4.7%) | 1,078 (100.0%) |
| 45 to 54 Years | 93 (7.8%) | 1,060 (89.2%) |
| 55 to 64 Years | 126 (9.5%) | 1,153 (87.3%) |
| 65 to 74 Years | 1,049 (93.7%) | 804 (71.8%) |
| 75 Years and over | 639 (100.0%) | 418 (65.4%) |
| Total | 2,235 (26.2%) | 7,490 (87.8%) |
Disability Status by Sex by Age in Malverne
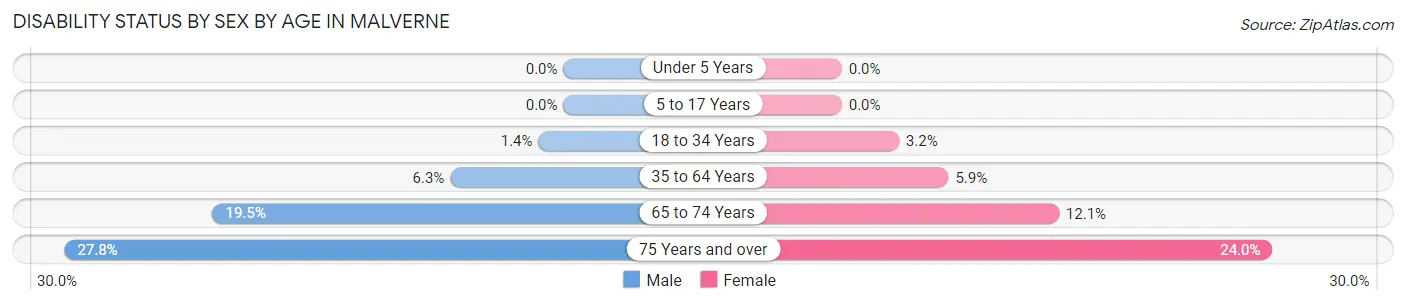
| Age Bracket | Male | Female |
| Under 5 Years | 0 (0.0%) | 0 (0.0%) |
| 5 to 17 Years | 0 (0.0%) | 0 (0.0%) |
| 18 to 34 Years | 11 (1.4%) | 24 (3.2%) |
| 35 to 64 Years | 119 (6.3%) | 101 (5.9%) |
| 65 to 74 Years | 117 (19.5%) | 63 (12.1%) |
| 75 Years and over | 50 (27.8%) | 110 (24.0%) |
Disability Class by Sex by Age in Malverne
Disability Class: Hearing Difficulty
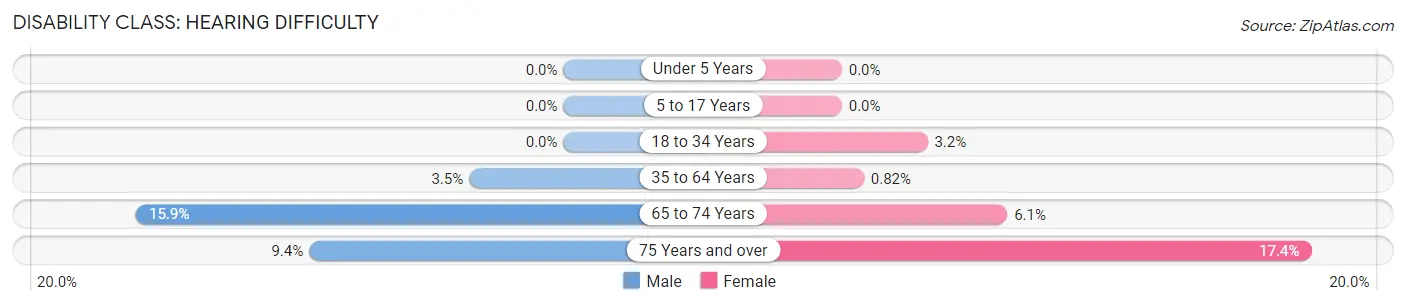
| Age Bracket | Male | Female |
| Under 5 Years | 0 (0.0%) | 0 (0.0%) |
| 5 to 17 Years | 0 (0.0%) | 0 (0.0%) |
| 18 to 34 Years | 0 (0.0%) | 24 (3.2%) |
| 35 to 64 Years | 66 (3.5%) | 14 (0.8%) |
| 65 to 74 Years | 95 (15.9%) | 32 (6.1%) |
| 75 Years and over | 17 (9.4%) | 80 (17.4%) |
Disability Class: Vision Difficulty
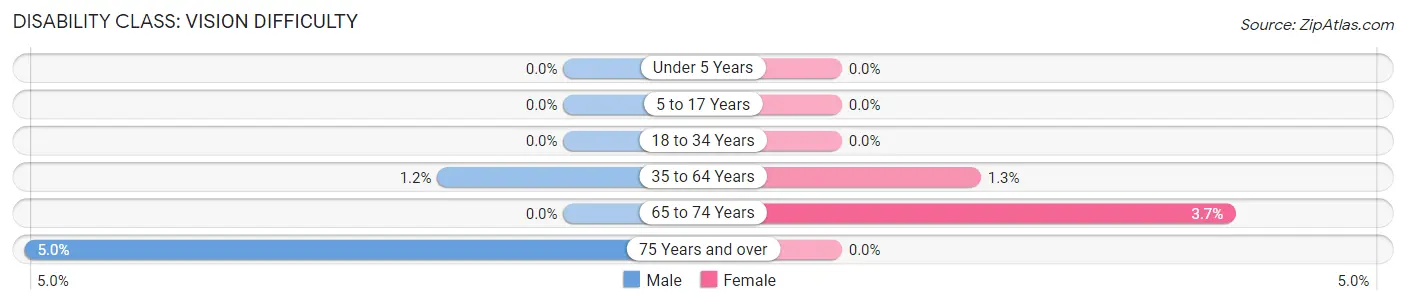
| Age Bracket | Male | Female |
| Under 5 Years | 0 (0.0%) | 0 (0.0%) |
| 5 to 17 Years | 0 (0.0%) | 0 (0.0%) |
| 18 to 34 Years | 0 (0.0%) | 0 (0.0%) |
| 35 to 64 Years | 22 (1.2%) | 22 (1.3%) |
| 65 to 74 Years | 0 (0.0%) | 19 (3.6%) |
| 75 Years and over | 9 (5.0%) | 0 (0.0%) |
Disability Class: Cognitive Difficulty
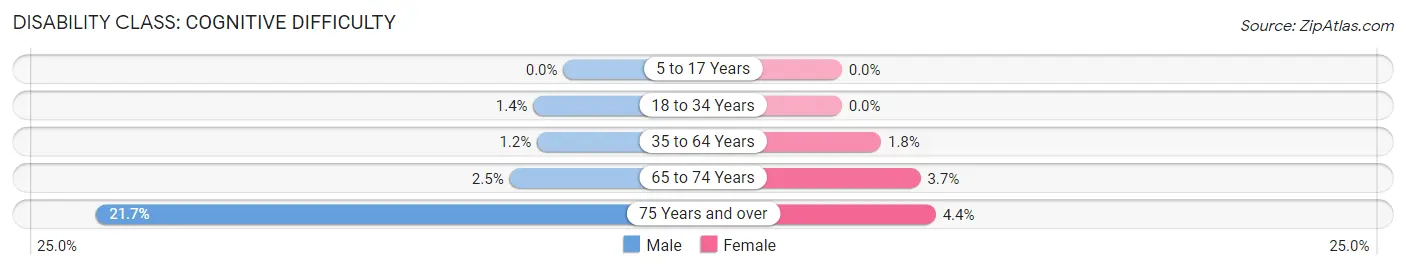
| Age Bracket | Male | Female |
| 5 to 17 Years | 0 (0.0%) | 0 (0.0%) |
| 18 to 34 Years | 11 (1.4%) | 0 (0.0%) |
| 35 to 64 Years | 23 (1.2%) | 31 (1.8%) |
| 65 to 74 Years | 15 (2.5%) | 19 (3.6%) |
| 75 Years and over | 39 (21.7%) | 20 (4.4%) |
Disability Class: Ambulatory Difficulty
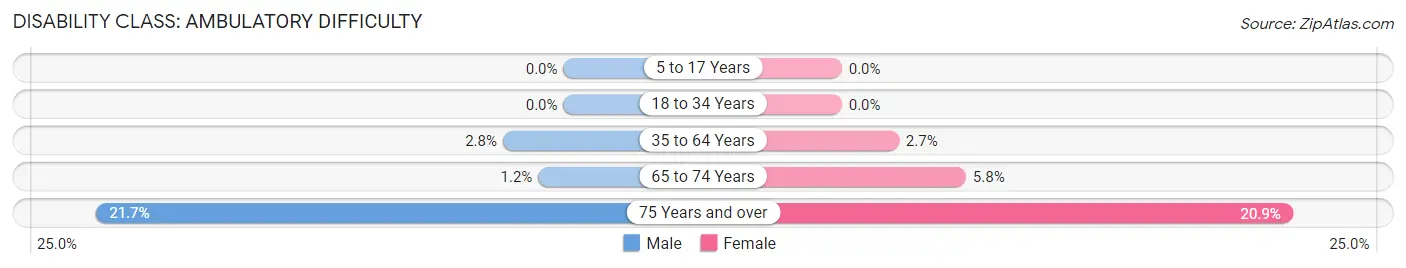
| Age Bracket | Male | Female |
| 5 to 17 Years | 0 (0.0%) | 0 (0.0%) |
| 18 to 34 Years | 0 (0.0%) | 0 (0.0%) |
| 35 to 64 Years | 53 (2.8%) | 45 (2.6%) |
| 65 to 74 Years | 7 (1.2%) | 30 (5.8%) |
| 75 Years and over | 39 (21.7%) | 96 (20.9%) |
Disability Class: Self-Care Difficulty

| Age Bracket | Male | Female |
| 5 to 17 Years | 0 (0.0%) | 0 (0.0%) |
| 18 to 34 Years | 1 (0.1%) | 0 (0.0%) |
| 35 to 64 Years | 53 (2.8%) | 30 (1.8%) |
| 65 to 74 Years | 0 (0.0%) | 19 (3.6%) |
| 75 Years and over | 42 (23.3%) | 9 (2.0%) |
Technology Access in Malverne
Computing Device Access in Malverne
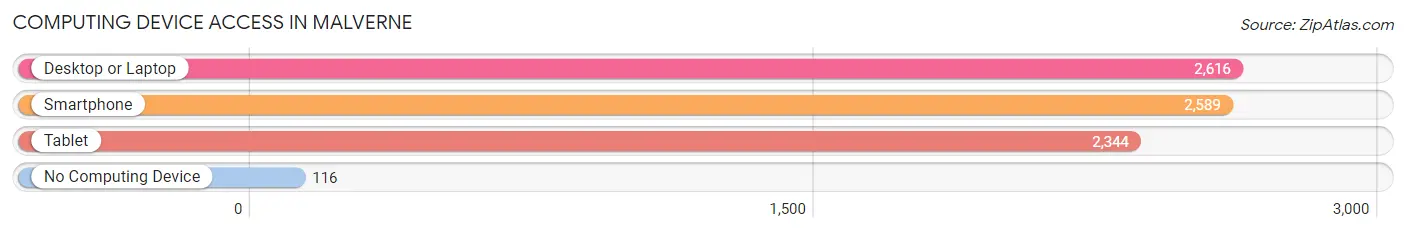
| Device Type | # Households | % Households |
| Desktop or Laptop | 2,616 | 89.5% |
| Smartphone | 2,589 | 88.5% |
| Tablet | 2,344 | 80.2% |
| No Computing Device | 116 | 4.0% |
| Total | 2,924 | 100.0% |
Internet Access in Malverne
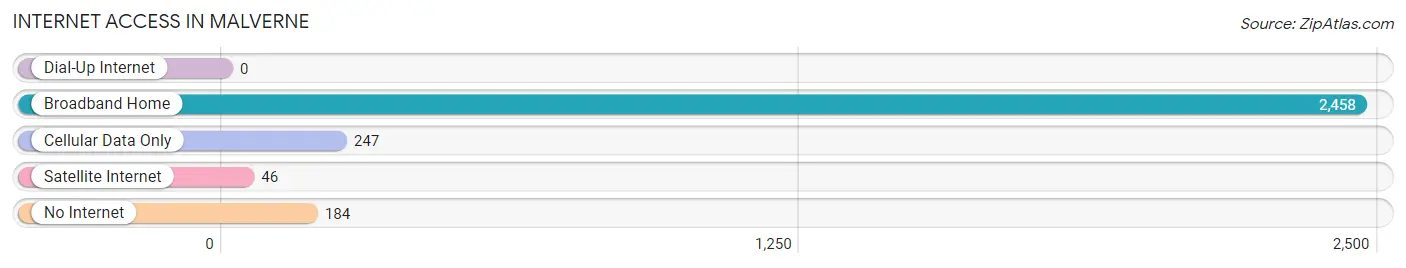
| Internet Type | # Households | % Households |
| Dial-Up Internet | 0 | 0.0% |
| Broadband Home | 2,458 | 84.1% |
| Cellular Data Only | 247 | 8.5% |
| Satellite Internet | 46 | 1.6% |
| No Internet | 184 | 6.3% |
| Total | 2,924 | 100.0% |
Malverne Summary
Malverne is a village located in Nassau County, New York, United States. It is located within the Town of Hempstead. As of the 2010 census, the village population was 8,514.
History
The area that is now Malverne was originally inhabited by the Rockaway Indians. The first European settlers arrived in the area in 1643. The area was known as Hempstead Plains, and was part of the Town of Hempstead. In 1891, the area was renamed Malverne after a local landowner, William Malvern.
In the early 1900s, Malverne was a rural farming community. The village was incorporated in 1921. In the 1950s, the village began to experience rapid growth as the Long Island Rail Road was extended to the area. This led to an influx of new residents and businesses.
Geography
Malverne is located at 40°39'25" North, 73°41'17" West (40.656944, -73.688056). According to the United States Census Bureau, the village has a total area of 2.2 square miles, all of it land.
The village is bordered by the villages of Lynbrook to the east, West Hempstead to the south, and Valley Stream to the west. It is also bordered by the hamlet of Lakeview to the north.
Economy
Malverne's economy is largely based on retail and services. The village is home to a variety of small businesses, including restaurants, shops, and professional services. The village is also home to a number of corporate offices, including a regional office of the New York State Department of Motor Vehicles.
Demographics
As of the 2010 census, there were 8,514 people, 3,072 households, and 2,092 families residing in the village. The population density was 3,845.3 people per square mile. The racial makeup of the village was 79.2% White, 11.2% African American, 0.3% Native American, 3.2% Asian, 0.1% Pacific Islander, 3.2% from other races, and 3.0% from two or more races. Hispanic or Latino of any race were 8.7% of the population.
There were 3,072 households, out of which 33.2% had children under the age of 18 living with them, 51.2% were married couples living together, 11.7% had a female householder with no husband present, and 32.2% were non-families. 26.2% of all households were made up of individuals, and 10.2% had someone living alone who was 65 years of age or older. The average household size was 2.76 and the average family size was 3.37.
In the village, the population was spread out, with 24.7% under the age of 18, 7.2% from 18 to 24, 30.2% from 25 to 44, 24.2% from 45 to 64, and 13.7% who were 65 years of age or older. The median age was 38 years. For every 100 females, there were 92.2 males. For every 100 females age 18 and over, there were 88.3 males.
The median income for a household in the village was $76,945, and the median income for a family was $90,945. Males had a median income of $51,945 versus $41,945 for females. The per capita income for the village was $31,945. About 2.7% of families and 4.2% of the population were below the poverty line, including 4.2% of those under age 18 and 4.2% of those age 65 or over.
Common Questions
What is the Total Population of Malverne?
Total Population of Malverne is 8,526.
What is the Total Male Population of Malverne?
Total Male Population of Malverne is 4,228.
What is the Total Female Population of Malverne?
Total Female Population of Malverne is 4,298.
What is the Ratio of Males per 100 Females in Malverne?
There are 98.37 Males per 100 Females in Malverne.
What is the Ratio of Females per 100 Males in Malverne?
There are 101.66 Females per 100 Males in Malverne.
What is the Median Population Age in Malverne?
Median Population Age in Malverne is 45.0 Years.
What is the Average Family Size in Malverne
Average Family Size in Malverne is 3.3 People.
What is the Average Household Size in Malverne
Average Household Size in Malverne is 2.9 People.
What is Per Capita Income in Malverne?
Per Capita income in Malverne is $70,533.
What is the Median Family Income in Malverne?
Median Family Income in Malverne is $186,250.
What is the Median Household income in Malverne?
Median Household Income in Malverne is $158,333.
What is Income or Wage Gap in Malverne?
Income or Wage Gap in Malverne is 5.4%.
Women in Malverne earn 94.6 cents for every dollar earned by a man.
What is Family Income Deficit in Malverne?
Family Income Deficit in Malverne is $9,408.
Families that are below poverty line in Malverne earn $9,408 less on average than the poverty threshold level.
What is Inequality or Gini Index in Malverne?
Inequality or Gini Index in Malverne is 0.42.
How Large is the Labor Force in Malverne?
There are 5,078 People in the Labor Forcein in Malverne.
What is the Percentage of People in the Labor Force in Malverne?
71.4% of People are in the Labor Force in Malverne.
What is the Unemployment Rate in Malverne?
Unemployment Rate in Malverne is 2.4%.