Oswego, NY
Oswego Map
Oswego Overview
17,092
TOTAL POPULATION
8,627
MALE POPULATION
8,465
FEMALE POPULATION
101.91
MALES / 100 FEMALES
98.12
FEMALES / 100 MALES
35.7
MEDIAN AGE
3.0
AVG FAMILY SIZE
2.2
AVG HOUSEHOLD SIZE
$30,310
PER CAPITA INCOME
$70,833
AVG FAMILY INCOME
$50,266
AVG HOUSEHOLD INCOME
19.4%
WAGE / INCOME GAP [ % ]
80.6¢/ $1
WAGE / INCOME GAP [ $ ]
$14,266
FAMILY INCOME DEFICIT
0.47
INEQUALITY / GINI INDEX
8,297
LABOR FORCE [ PEOPLE ]
60.0%
PERCENT IN LABOR FORCE
10.7%
UNEMPLOYMENT RATE
Oswego Zip Codes
Oswego Area Codes
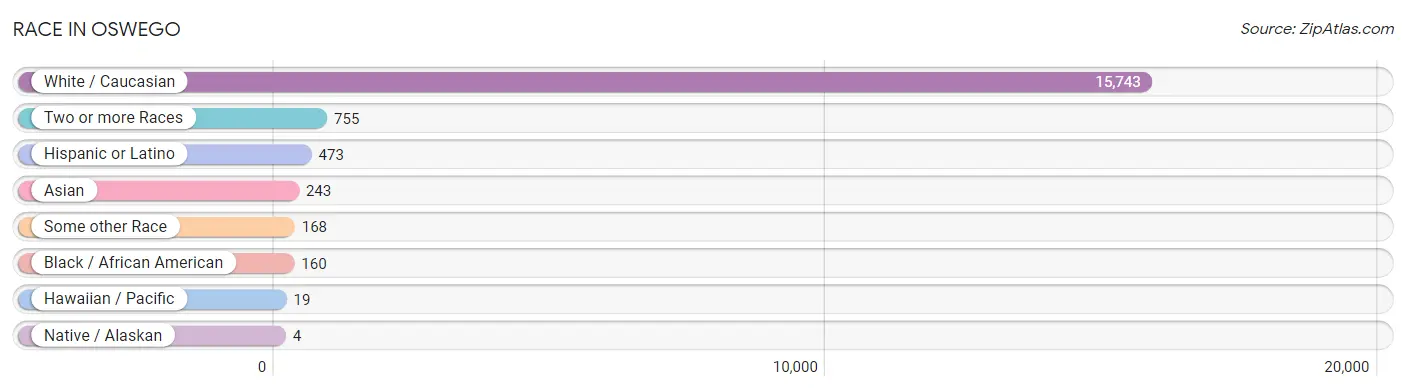
Race in Oswego
The most populous races in Oswego are White / Caucasian (15,743 | 92.1%), Two or more Races (755 | 4.4%), and Hispanic or Latino (473 | 2.8%).
| Race | # Population | % Population |
| Asian | 243 | 1.4% |
| Black / African American | 160 | 0.9% |
| Hawaiian / Pacific | 19 | 0.1% |
| Hispanic or Latino | 473 | 2.8% |
| Native / Alaskan | 4 | 0.0% |
| White / Caucasian | 15,743 | 92.1% |
| Two or more Races | 755 | 4.4% |
| Some other Race | 168 | 1.0% |
| Total | 17,092 | 100.0% |
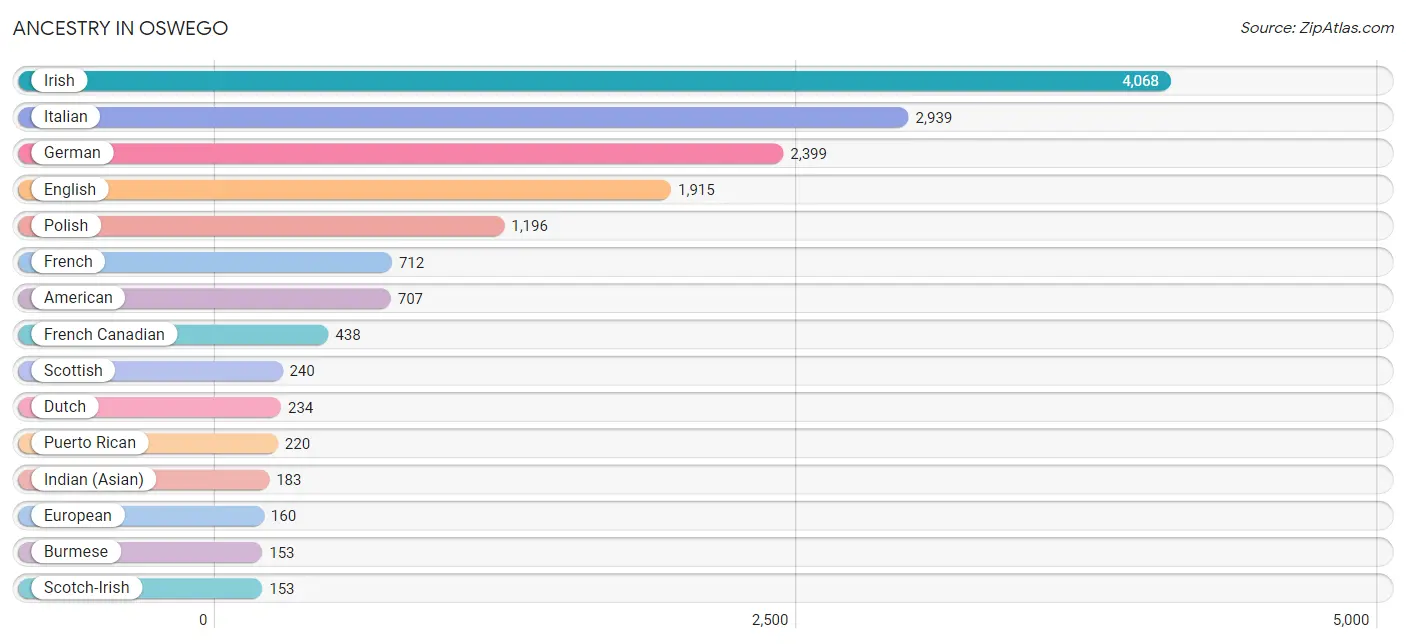
Ancestry in Oswego
The most populous ancestries reported in Oswego are Irish (4,068 | 23.8%), Italian (2,939 | 17.2%), German (2,399 | 14.0%), English (1,915 | 11.2%), and Polish (1,196 | 7.0%), together accounting for 73.2% of all Oswego residents.
| Ancestry | # Population | % Population |
| African | 100 | 0.6% |
| American | 707 | 4.1% |
| Arab | 38 | 0.2% |
| Argentinean | 8 | 0.1% |
| Armenian | 44 | 0.3% |
| Australian | 19 | 0.1% |
| Austrian | 18 | 0.1% |
| Bhutanese | 48 | 0.3% |
| Brazilian | 29 | 0.2% |
| British | 50 | 0.3% |
| Burmese | 153 | 0.9% |
| Canadian | 76 | 0.4% |
| Central American | 33 | 0.2% |
| Central American Indian | 12 | 0.1% |
| Cherokee | 43 | 0.3% |
| Chippewa | 4 | 0.0% |
| Cuban | 7 | 0.0% |
| Czech | 9 | 0.1% |
| Czechoslovakian | 8 | 0.1% |
| Danish | 6 | 0.0% |
| Dominican | 16 | 0.1% |
| Dutch | 234 | 1.4% |
| Eastern European | 57 | 0.3% |
| Ecuadorian | 88 | 0.5% |
| English | 1,915 | 11.2% |
| Ethiopian | 7 | 0.0% |
| European | 160 | 0.9% |
| French | 712 | 4.2% |
| French Canadian | 438 | 2.6% |
| German | 2,399 | 14.0% |
| Greek | 28 | 0.2% |
| Guatemalan | 12 | 0.1% |
| Haitian | 7 | 0.0% |
| Honduran | 10 | 0.1% |
| Hungarian | 24 | 0.1% |
| Indian (Asian) | 183 | 1.1% |
| Irish | 4,068 | 23.8% |
| Iroquois | 1 | 0.0% |
| Italian | 2,939 | 17.2% |
| Jamaican | 47 | 0.3% |
| Korean | 15 | 0.1% |
| Latvian | 6 | 0.0% |
| Lebanese | 14 | 0.1% |
| Lithuanian | 20 | 0.1% |
| Mexican | 68 | 0.4% |
| Navajo | 4 | 0.0% |
| Northern European | 27 | 0.2% |
| Norwegian | 63 | 0.4% |
| Pakistani | 7 | 0.0% |
| Panamanian | 7 | 0.0% |
| Polish | 1,196 | 7.0% |
| Portuguese | 25 | 0.2% |
| Puerto Rican | 220 | 1.3% |
| Russian | 114 | 0.7% |
| Salvadoran | 4 | 0.0% |
| Scandinavian | 53 | 0.3% |
| Scotch-Irish | 153 | 0.9% |
| Scottish | 240 | 1.4% |
| Slovak | 14 | 0.1% |
| South American | 96 | 0.6% |
| Spaniard | 6 | 0.0% |
| Spanish | 14 | 0.1% |
| Subsaharan African | 107 | 0.6% |
| Swedish | 87 | 0.5% |
| Syrian | 16 | 0.1% |
| Thai | 59 | 0.4% |
| Trinidadian and Tobagonian | 23 | 0.1% |
| Turkish | 58 | 0.3% |
| Ukrainian | 129 | 0.7% |
| Welsh | 139 | 0.8% |
| Yugoslavian | 13 | 0.1% | View All 71 Rows |
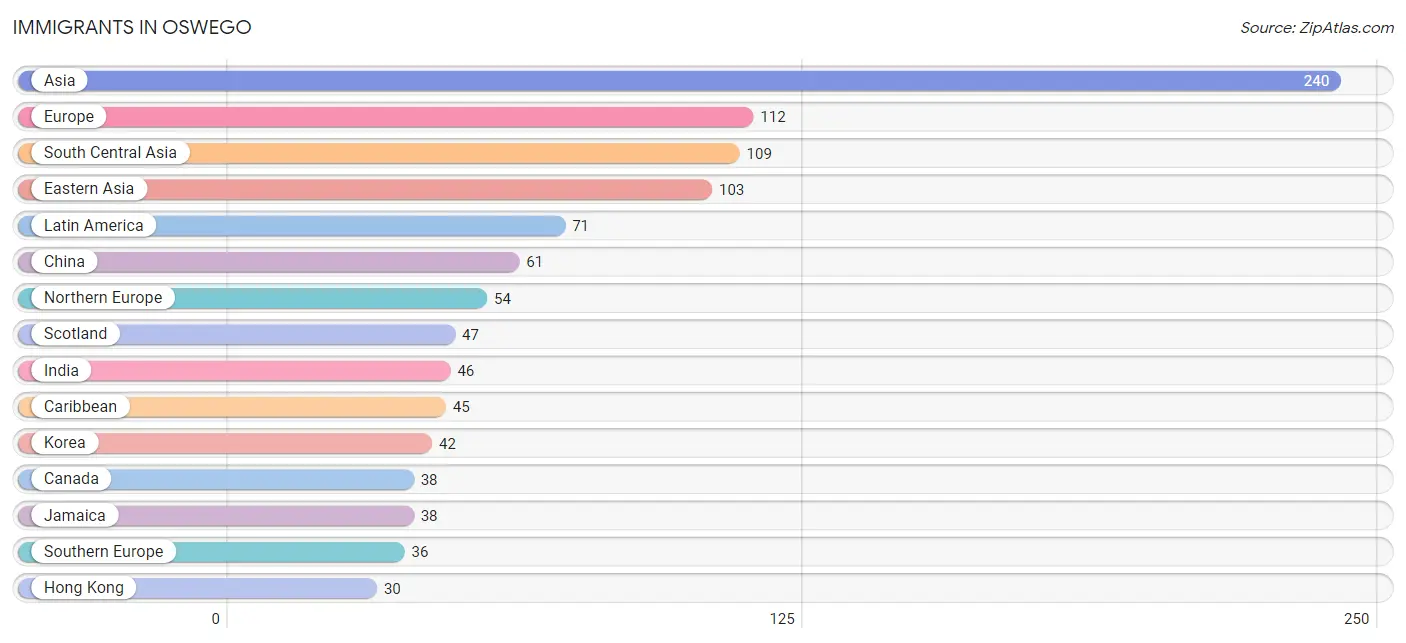
Immigrants in Oswego
The most numerous immigrant groups reported in Oswego came from Asia (240 | 1.4%), Europe (112 | 0.7%), South Central Asia (109 | 0.6%), Eastern Asia (103 | 0.6%), and Latin America (71 | 0.4%), together accounting for 3.7% of all Oswego residents.
| Immigration Origin | # Population | % Population |
| Africa | 16 | 0.1% |
| Argentina | 8 | 0.1% |
| Asia | 240 | 1.4% |
| Brazil | 9 | 0.1% |
| Canada | 38 | 0.2% |
| Caribbean | 45 | 0.3% |
| Central America | 9 | 0.1% |
| China | 61 | 0.4% |
| Dominican Republic | 7 | 0.0% |
| Eastern Africa | 16 | 0.1% |
| Eastern Asia | 103 | 0.6% |
| Eastern Europe | 22 | 0.1% |
| El Salvador | 5 | 0.0% |
| Ethiopia | 7 | 0.0% |
| Europe | 112 | 0.7% |
| Hong Kong | 30 | 0.2% |
| India | 46 | 0.3% |
| Ireland | 7 | 0.0% |
| Italy | 24 | 0.1% |
| Jamaica | 38 | 0.2% |
| Korea | 42 | 0.3% |
| Latin America | 71 | 0.4% |
| Mexico | 4 | 0.0% |
| Nepal | 18 | 0.1% |
| Northern Europe | 54 | 0.3% |
| Pakistan | 6 | 0.0% |
| Philippines | 10 | 0.1% |
| Scotland | 47 | 0.3% |
| South America | 17 | 0.1% |
| South Central Asia | 109 | 0.6% |
| South Eastern Asia | 10 | 0.1% |
| Southern Europe | 36 | 0.2% |
| Spain | 12 | 0.1% |
| Sri Lanka | 16 | 0.1% |
| Taiwan | 8 | 0.1% |
| Ukraine | 22 | 0.1% |
| Uzbekistan | 23 | 0.1% |
| Western Asia | 18 | 0.1% |
| Zimbabwe | 9 | 0.1% | View All 39 Rows |
Sex and Age in Oswego
Sex and Age in Oswego
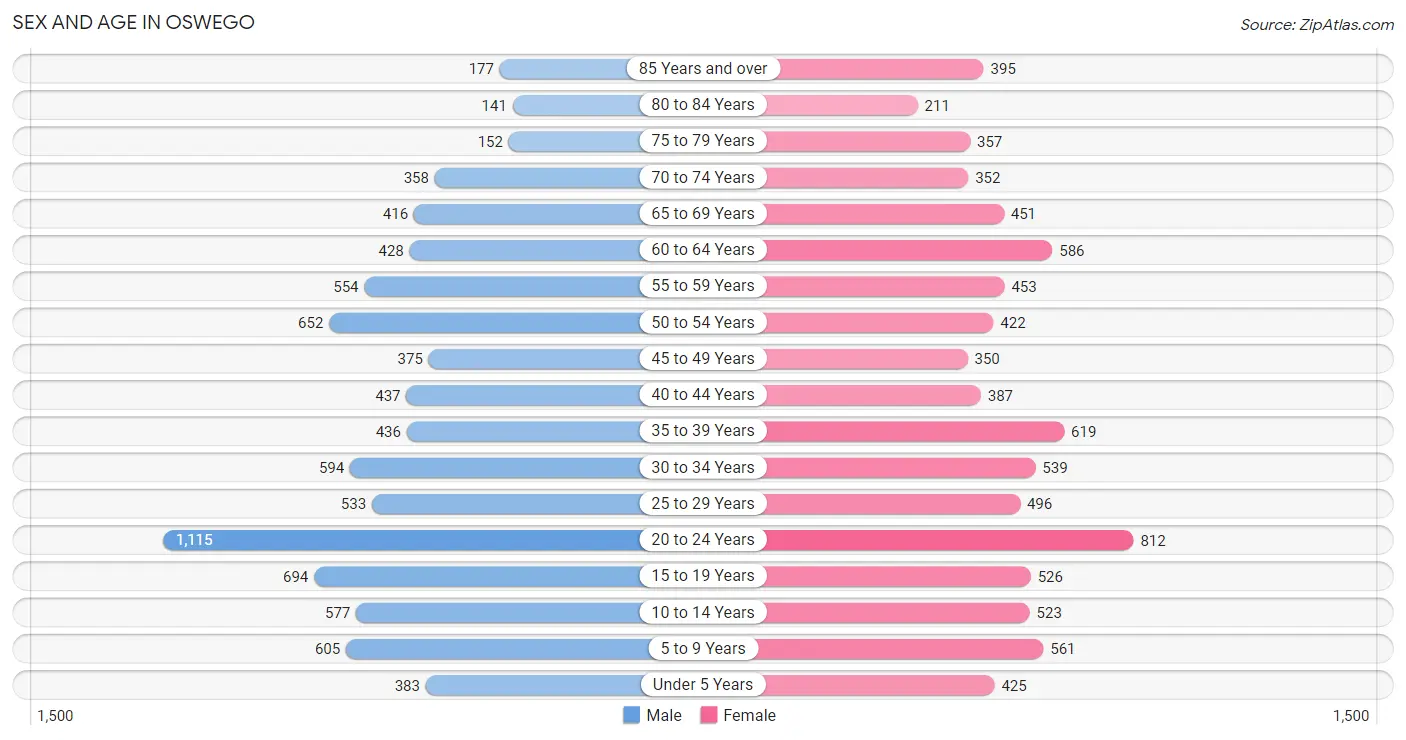
The most populous age groups in Oswego are 20 to 24 Years (1,115 | 12.9%) for men and 20 to 24 Years (812 | 9.6%) for women.
| Age Bracket | Male | Female |
| Under 5 Years | 383 (4.4%) | 425 (5.0%) |
| 5 to 9 Years | 605 (7.0%) | 561 (6.6%) |
| 10 to 14 Years | 577 (6.7%) | 523 (6.2%) |
| 15 to 19 Years | 694 (8.0%) | 526 (6.2%) |
| 20 to 24 Years | 1,115 (12.9%) | 812 (9.6%) |
| 25 to 29 Years | 533 (6.2%) | 496 (5.9%) |
| 30 to 34 Years | 594 (6.9%) | 539 (6.4%) |
| 35 to 39 Years | 436 (5.1%) | 619 (7.3%) |
| 40 to 44 Years | 437 (5.1%) | 387 (4.6%) |
| 45 to 49 Years | 375 (4.3%) | 350 (4.1%) |
| 50 to 54 Years | 652 (7.6%) | 422 (5.0%) |
| 55 to 59 Years | 554 (6.4%) | 453 (5.3%) |
| 60 to 64 Years | 428 (5.0%) | 586 (6.9%) |
| 65 to 69 Years | 416 (4.8%) | 451 (5.3%) |
| 70 to 74 Years | 358 (4.2%) | 352 (4.2%) |
| 75 to 79 Years | 152 (1.8%) | 357 (4.2%) |
| 80 to 84 Years | 141 (1.6%) | 211 (2.5%) |
| 85 Years and over | 177 (2.1%) | 395 (4.7%) |
| Total | 8,627 (100.0%) | 8,465 (100.0%) |
Families and Households in Oswego
Median Family Size in Oswego
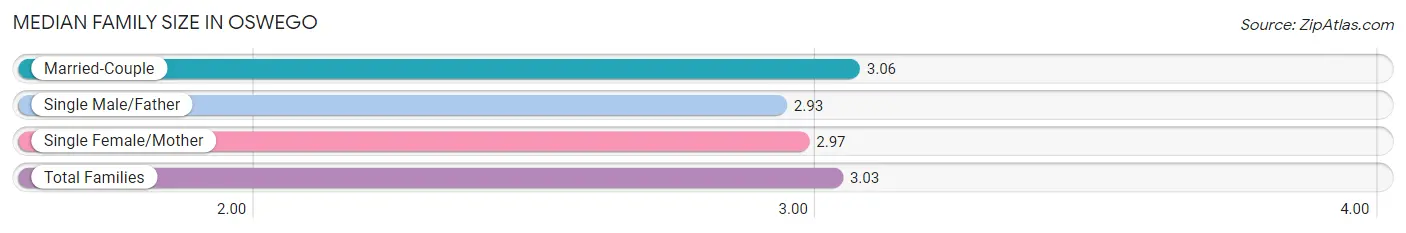
The median family size in Oswego is 3.03 persons per family, with married-couple families (2,428 | 65.7%) accounting for the largest median family size of 3.06 persons per family. On the other hand, single male/father families (225 | 6.1%) represent the smallest median family size with 2.93 persons per family.
| Family Type | # Families | Family Size |
| Married-Couple | 2,428 (65.7%) | 3.06 |
| Single Male/Father | 225 (6.1%) | 2.93 |
| Single Female/Mother | 1,041 (28.2%) | 2.97 |
| Total Families | 3,694 (100.0%) | 3.03 |
Median Household Size in Oswego
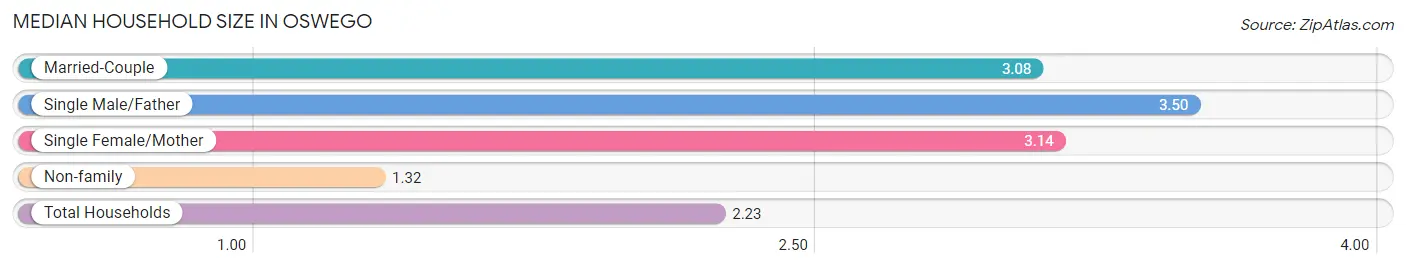
The median household size in Oswego is 2.23 persons per household, with single male/father households (225 | 3.1%) accounting for the largest median household size of 3.5 persons per household. non-family households (3,659 | 49.8%) represent the smallest median household size with 1.32 persons per household.
| Household Type | # Households | Household Size |
| Married-Couple | 2,428 (33.0%) | 3.08 |
| Single Male/Father | 225 (3.1%) | 3.50 |
| Single Female/Mother | 1,041 (14.2%) | 3.14 |
| Non-family | 3,659 (49.8%) | 1.32 |
| Total Households | 7,353 (100.0%) | 2.23 |
Household Size by Marriage Status in Oswego
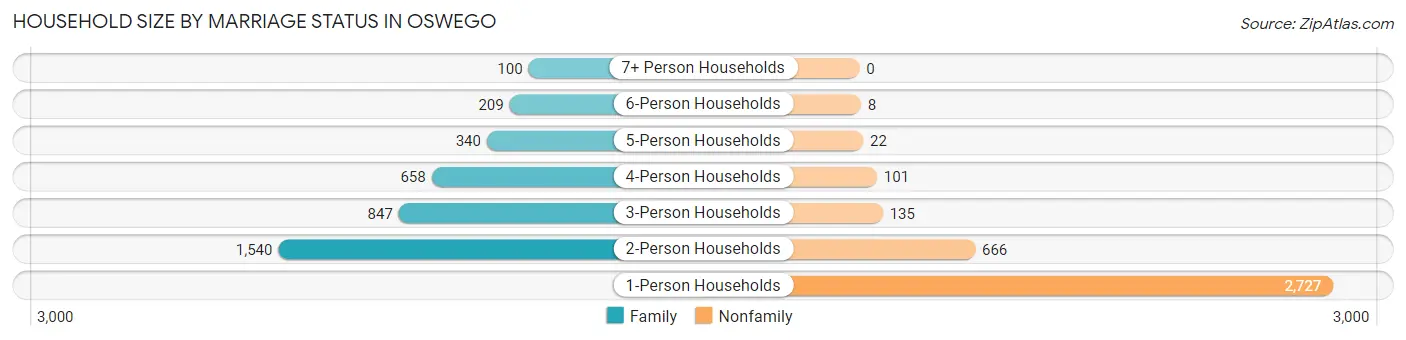
Out of a total of 7,353 households in Oswego, 3,694 (50.2%) are family households, while 3,659 (49.8%) are nonfamily households. The most numerous type of family households are 2-person households, comprising 1,540, and the most common type of nonfamily households are 1-person households, comprising 2,727.
| Household Size | Family Households | Nonfamily Households |
| 1-Person Households | - | 2,727 (37.1%) |
| 2-Person Households | 1,540 (20.9%) | 666 (9.1%) |
| 3-Person Households | 847 (11.5%) | 135 (1.8%) |
| 4-Person Households | 658 (8.9%) | 101 (1.4%) |
| 5-Person Households | 340 (4.6%) | 22 (0.3%) |
| 6-Person Households | 209 (2.8%) | 8 (0.1%) |
| 7+ Person Households | 100 (1.4%) | 0 (0.0%) |
| Total | 3,694 (50.2%) | 3,659 (49.8%) |
Female Fertility in Oswego
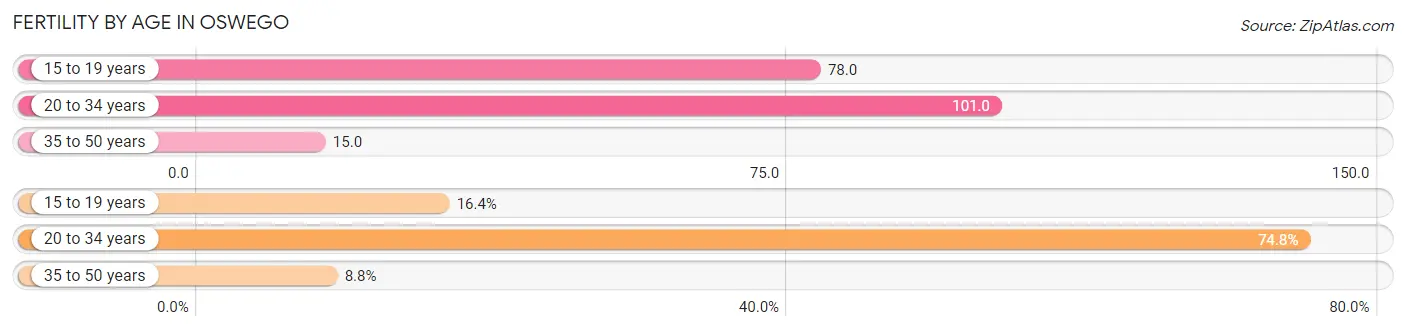
Fertility by Age in Oswego
Average fertility rate in Oswego is 65.0 births per 1,000 women. Women in the age bracket of 20 to 34 years have the highest fertility rate with 101.0 births per 1,000 women. Women in the age bracket of 20 to 34 years acount for 74.8% of all women with births.
| Age Bracket | Women with Births | Births / 1,000 Women |
| 15 to 19 years | 41 (16.4%) | 78.0 |
| 20 to 34 years | 187 (74.8%) | 101.0 |
| 35 to 50 years | 22 (8.8%) | 15.0 |
| Total | 250 (100.0%) | 65.0 |
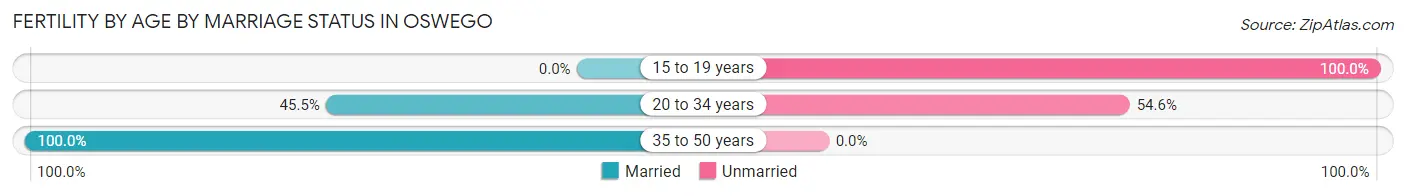
Fertility by Age by Marriage Status in Oswego
42.8% of women with births (250) in Oswego are married. The highest percentage of unmarried women with births falls into 15 to 19 years age bracket with 100.0% of them unmarried at the time of birth, while the lowest percentage of unmarried women with births belong to 35 to 50 years age bracket with 0.0% of them unmarried.
| Age Bracket | Married | Unmarried |
| 15 to 19 years | 0 (0.0%) | 41 (100.0%) |
| 20 to 34 years | 85 (45.5%) | 102 (54.5%) |
| 35 to 50 years | 22 (100.0%) | 0 (0.0%) |
| Total | 107 (42.8%) | 143 (57.2%) |
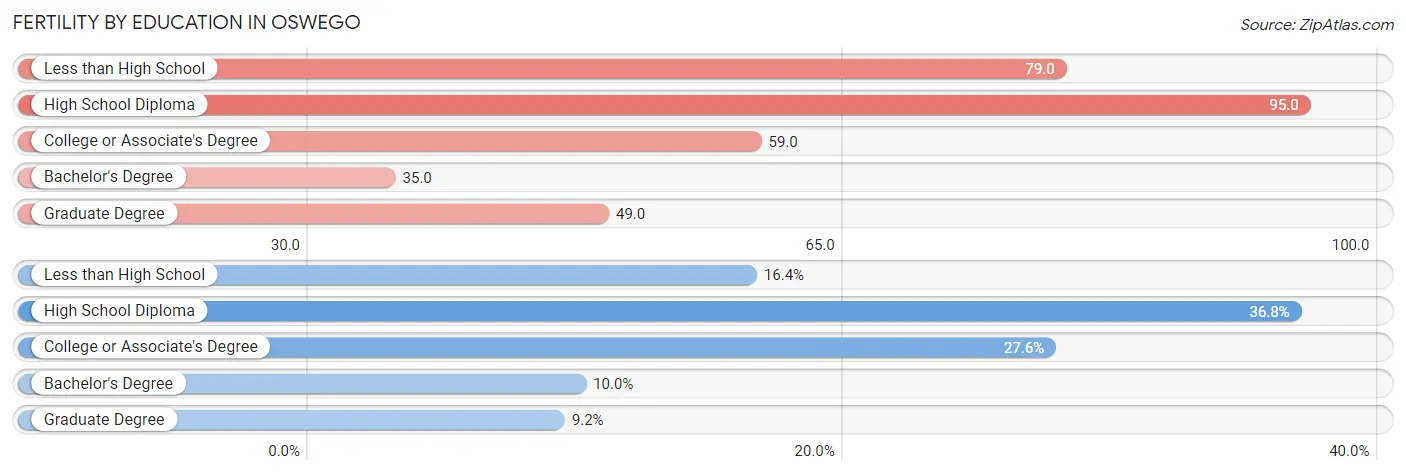
Fertility by Education in Oswego
Average fertility rate in Oswego is 65.0 births per 1,000 women. Women with the education attainment of high school diploma have the highest fertility rate of 95.0 births per 1,000 women, while women with the education attainment of bachelor's degree have the lowest fertility at 35.0 births per 1,000 women. Women with the education attainment of high school diploma represent 36.8% of all women with births.
| Educational Attainment | Women with Births | Births / 1,000 Women |
| Less than High School | 41 (16.4%) | 79.0 |
| High School Diploma | 92 (36.8%) | 95.0 |
| College or Associate's Degree | 69 (27.6%) | 59.0 |
| Bachelor's Degree | 25 (10.0%) | 35.0 |
| Graduate Degree | 23 (9.2%) | 49.0 |
| Total | 250 (100.0%) | 65.0 |
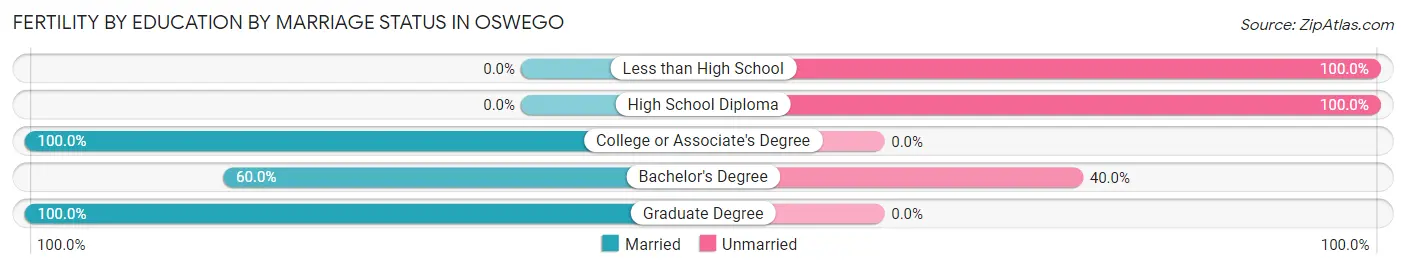
Fertility by Education by Marriage Status in Oswego
57.2% of women with births in Oswego are unmarried. Women with the educational attainment of college or associate's degree are most likely to be married with 100.0% of them married at childbirth, while women with the educational attainment of less than high school are least likely to be married with 100.0% of them unmarried at childbirth.
| Educational Attainment | Married | Unmarried |
| Less than High School | 0 (0.0%) | 41 (100.0%) |
| High School Diploma | 0 (0.0%) | 92 (100.0%) |
| College or Associate's Degree | 69 (100.0%) | 0 (0.0%) |
| Bachelor's Degree | 15 (60.0%) | 10 (40.0%) |
| Graduate Degree | 23 (100.0%) | 0 (0.0%) |
| Total | 107 (42.8%) | 143 (57.2%) |
Income in Oswego
Income Overview in Oswego
Per Capita Income in Oswego is $30,310, while median incomes of families and households are $70,833 and $50,266 respectively.
| Characteristic | Number | Measure |
| Per Capita Income | 17,092 | $30,310 |
| Median Family Income | 3,694 | $70,833 |
| Mean Family Income | 3,694 | $87,520 |
| Median Household Income | 7,353 | $50,266 |
| Mean Household Income | 7,353 | $69,228 |
| Income Deficit | 3,694 | $14,266 |
| Wage / Income Gap (%) | 17,092 | 19.37% |
| Wage / Income Gap ($) | 17,092 | 80.63¢ per $1 |
| Gini / Inequality Index | 17,092 | 0.47 |
Earnings by Sex in Oswego
Average Earnings in Oswego are $31,135, $35,613 for men and $28,713 for women, a difference of 19.4%.
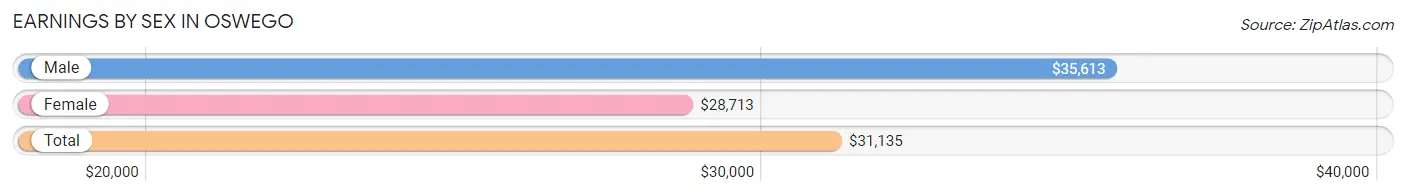
| Sex | Number | Average Earnings |
| Male | 4,670 (53.0%) | $35,613 |
| Female | 4,138 (47.0%) | $28,713 |
| Total | 8,808 (100.0%) | $31,135 |
Earnings by Sex by Income Bracket in Oswego
The most common earnings brackets in Oswego are $100,000+ for men (550 | 11.8%) and $25,000 to $29,999 for women (474 | 11.5%).
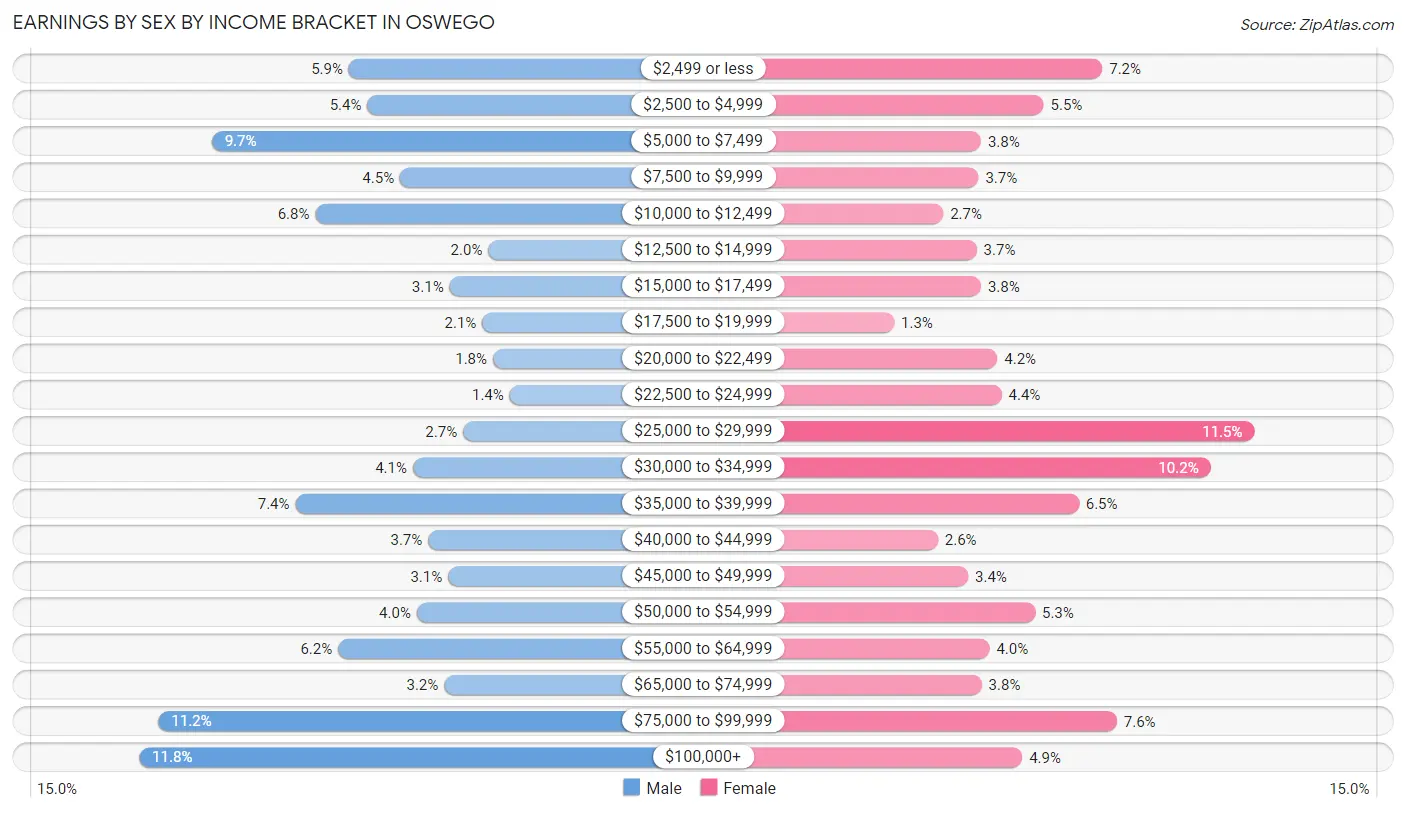
| Income | Male | Female |
| $2,499 or less | 275 (5.9%) | 297 (7.2%) |
| $2,500 to $4,999 | 251 (5.4%) | 229 (5.5%) |
| $5,000 to $7,499 | 455 (9.7%) | 156 (3.8%) |
| $7,500 to $9,999 | 208 (4.4%) | 153 (3.7%) |
| $10,000 to $12,499 | 319 (6.8%) | 112 (2.7%) |
| $12,500 to $14,999 | 92 (2.0%) | 151 (3.6%) |
| $15,000 to $17,499 | 143 (3.1%) | 156 (3.8%) |
| $17,500 to $19,999 | 100 (2.1%) | 55 (1.3%) |
| $20,000 to $22,499 | 86 (1.8%) | 175 (4.2%) |
| $22,500 to $24,999 | 64 (1.4%) | 180 (4.3%) |
| $25,000 to $29,999 | 125 (2.7%) | 474 (11.5%) |
| $30,000 to $34,999 | 191 (4.1%) | 423 (10.2%) |
| $35,000 to $39,999 | 345 (7.4%) | 270 (6.5%) |
| $40,000 to $44,999 | 171 (3.7%) | 106 (2.6%) |
| $45,000 to $49,999 | 145 (3.1%) | 141 (3.4%) |
| $50,000 to $54,999 | 186 (4.0%) | 219 (5.3%) |
| $55,000 to $64,999 | 289 (6.2%) | 166 (4.0%) |
| $65,000 to $74,999 | 150 (3.2%) | 157 (3.8%) |
| $75,000 to $99,999 | 525 (11.2%) | 314 (7.6%) |
| $100,000+ | 550 (11.8%) | 204 (4.9%) |
| Total | 4,670 (100.0%) | 4,138 (100.0%) |
Earnings by Sex by Educational Attainment in Oswego
Average earnings in Oswego are $48,468 for men and $33,261 for women, a difference of 31.4%. Men with an educational attainment of bachelor's degree enjoy the highest average annual earnings of $77,917, while those with high school diploma education earn the least with $38,527. Women with an educational attainment of graduate degree earn the most with the average annual earnings of $65,926, while those with less than high school education have the smallest earnings of $23,879.
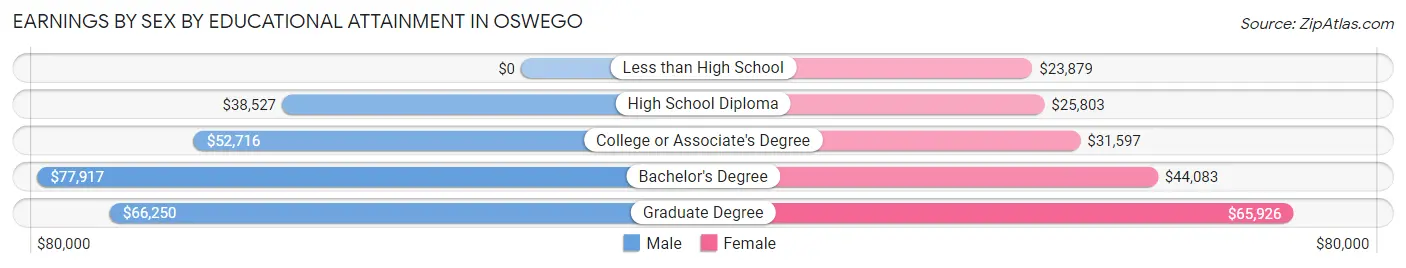
| Educational Attainment | Male Income | Female Income |
| Less than High School | - | - |
| High School Diploma | $38,527 | $25,803 |
| College or Associate's Degree | $52,716 | $31,597 |
| Bachelor's Degree | $77,917 | $44,083 |
| Graduate Degree | $66,250 | $65,926 |
| Total | $48,468 | $33,261 |
Family Income in Oswego
Family Income Brackets in Oswego
According to the Oswego family income data, there are 687 families falling into the $75,000 to $99,999 income range, which is the most common income bracket and makes up 18.6% of all families. Conversely, the $10,000 to $14,999 income bracket is the least frequent group with only 196 families (5.3%) belonging to this category.
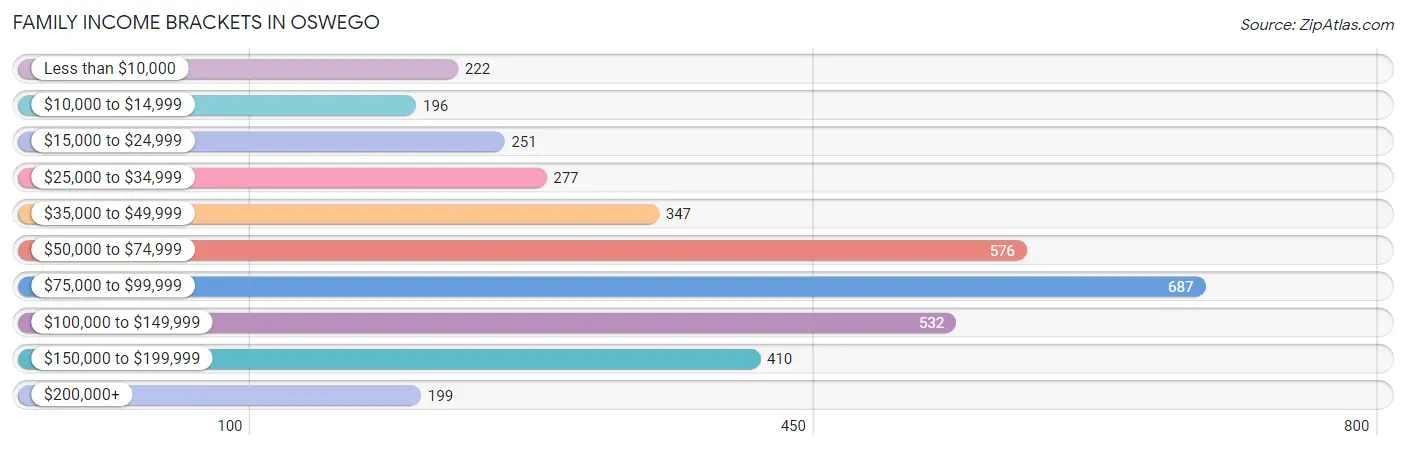
| Income Bracket | # Families | % Families |
| Less than $10,000 | 222 | 6.0% |
| $10,000 to $14,999 | 196 | 5.3% |
| $15,000 to $24,999 | 251 | 6.8% |
| $25,000 to $34,999 | 277 | 7.5% |
| $35,000 to $49,999 | 347 | 9.4% |
| $50,000 to $74,999 | 576 | 15.6% |
| $75,000 to $99,999 | 687 | 18.6% |
| $100,000 to $149,999 | 532 | 14.4% |
| $150,000 to $199,999 | 410 | 11.1% |
| $200,000+ | 199 | 5.4% |
Family Income by Famaliy Size in Oswego
5-person families (284 | 7.7%) account for the highest median family income in Oswego with $91,494 per family, while 2-person families (1,623 | 43.9%) have the highest median income of $35,886 per family member.
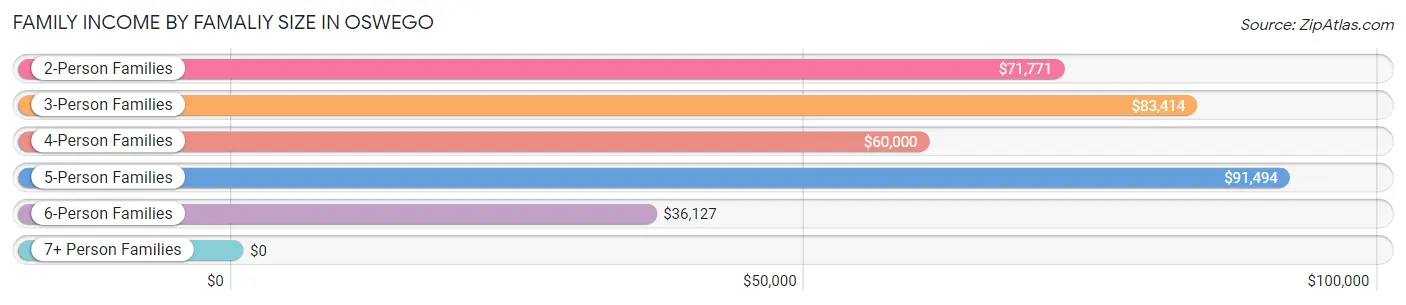
| Income Bracket | # Families | Median Income |
| 2-Person Families | 1,623 (43.9%) | $71,771 |
| 3-Person Families | 851 (23.0%) | $83,414 |
| 4-Person Families | 644 (17.4%) | $60,000 |
| 5-Person Families | 284 (7.7%) | $91,494 |
| 6-Person Families | 238 (6.4%) | $36,127 |
| 7+ Person Families | 54 (1.5%) | $0 |
| Total | 3,694 (100.0%) | $70,833 |
Family Income by Number of Earners in Oswego
The median family income in Oswego is $70,833, with families comprising 3+ earners (363) having the highest median family income of $132,379, while families with no earners (743) have the lowest median family income of $33,407, accounting for 9.8% and 20.1% of families, respectively.
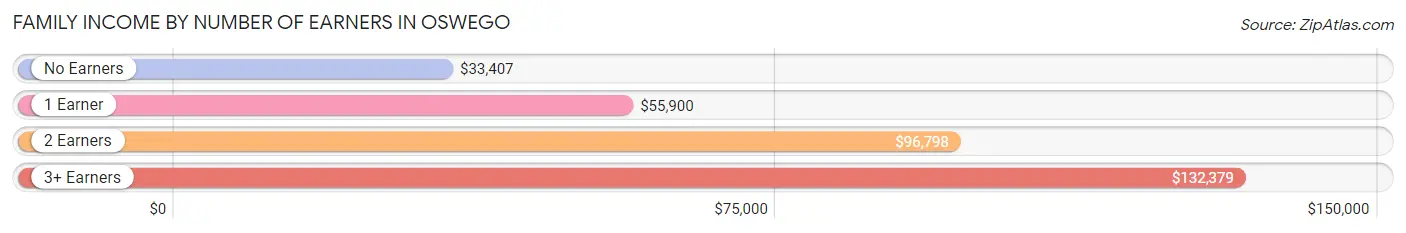
| Number of Earners | # Families | Median Income |
| No Earners | 743 (20.1%) | $33,407 |
| 1 Earner | 1,276 (34.5%) | $55,900 |
| 2 Earners | 1,312 (35.5%) | $96,798 |
| 3+ Earners | 363 (9.8%) | $132,379 |
| Total | 3,694 (100.0%) | $70,833 |
Household Income in Oswego
Household Income Brackets in Oswego
With 1,088 households falling in the category, the $75,000 to $99,999 income range is the most frequent in Oswego, accounting for 14.8% of all households. In contrast, only 279 households (3.8%) fall into the $200,000+ income bracket, making it the least populous group.
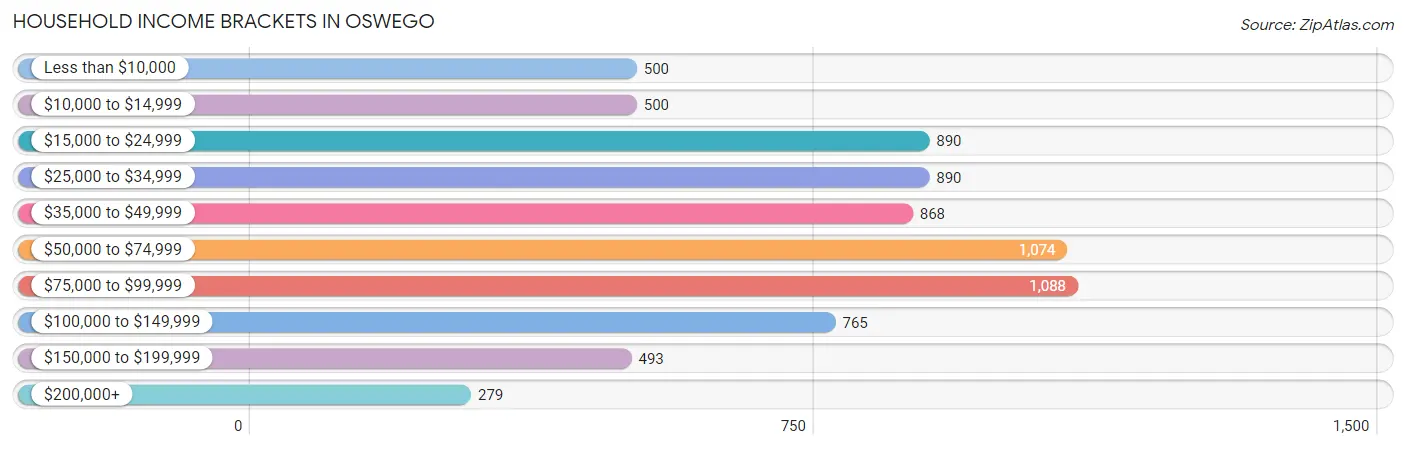
| Income Bracket | # Households | % Households |
| Less than $10,000 | 500 | 6.8% |
| $10,000 to $14,999 | 500 | 6.8% |
| $15,000 to $24,999 | 890 | 12.1% |
| $25,000 to $34,999 | 890 | 12.1% |
| $35,000 to $49,999 | 868 | 11.8% |
| $50,000 to $74,999 | 1,074 | 14.6% |
| $75,000 to $99,999 | 1,088 | 14.8% |
| $100,000 to $149,999 | 765 | 10.4% |
| $150,000 to $199,999 | 493 | 6.7% |
| $200,000+ | 279 | 3.8% |
Household Income by Householder Age in Oswego
The median household income in Oswego is $50,266, with the highest median household income of $65,948 found in the 45 to 64 years age bracket for the primary householder. A total of 2,240 households (30.5%) fall into this category. Meanwhile, the 15 to 24 years age bracket for the primary householder has the lowest median household income of $30,525, with 837 households (11.4%) in this group.
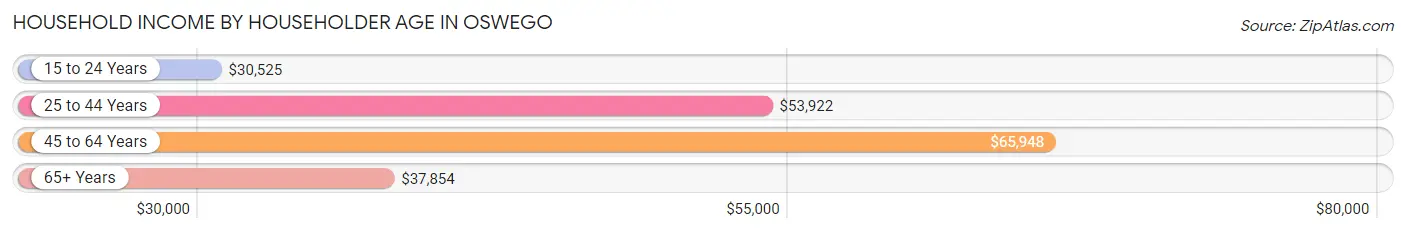
| Income Bracket | # Households | Median Income |
| 15 to 24 Years | 837 (11.4%) | $30,525 |
| 25 to 44 Years | 2,297 (31.2%) | $53,922 |
| 45 to 64 Years | 2,240 (30.5%) | $65,948 |
| 65+ Years | 1,979 (26.9%) | $37,854 |
| Total | 7,353 (100.0%) | $50,266 |
Poverty in Oswego
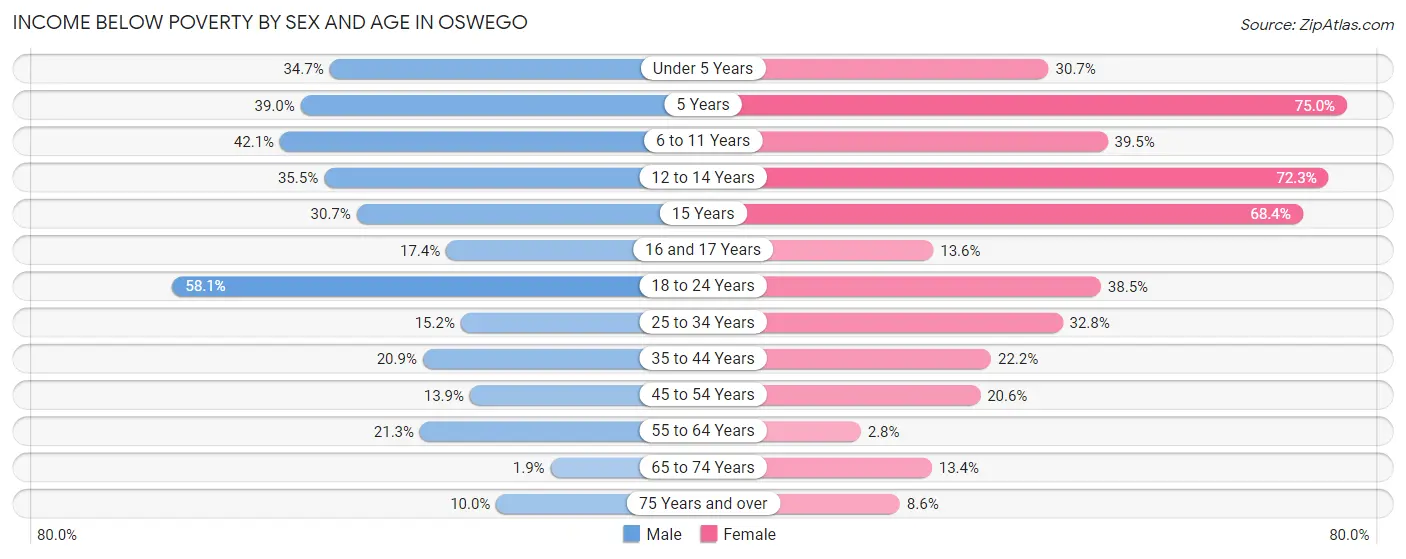
Income Below Poverty by Sex and Age in Oswego
With 26.3% poverty level for males and 24.6% for females among the residents of Oswego, 18 to 24 year old males and 5 year old females are the most vulnerable to poverty, with 728 males (58.1%) and 66 females (75.0%) in their respective age groups living below the poverty level.
| Age Bracket | Male | Female |
| Under 5 Years | 133 (34.7%) | 125 (30.7%) |
| 5 Years | 48 (39.0%) | 66 (75.0%) |
| 6 to 11 Years | 338 (42.1%) | 264 (39.5%) |
| 12 to 14 Years | 86 (35.5%) | 185 (72.3%) |
| 15 Years | 35 (30.7%) | 52 (68.4%) |
| 16 and 17 Years | 46 (17.4%) | 39 (13.6%) |
| 18 to 24 Years | 728 (58.1%) | 344 (38.5%) |
| 25 to 34 Years | 164 (15.2%) | 338 (32.8%) |
| 35 to 44 Years | 175 (20.9%) | 222 (22.2%) |
| 45 to 54 Years | 140 (13.9%) | 157 (20.5%) |
| 55 to 64 Years | 208 (21.3%) | 29 (2.8%) |
| 65 to 74 Years | 14 (1.9%) | 101 (13.4%) |
| 75 Years and over | 39 (10.0%) | 74 (8.6%) |
| Total | 2,154 (26.3%) | 1,996 (24.6%) |
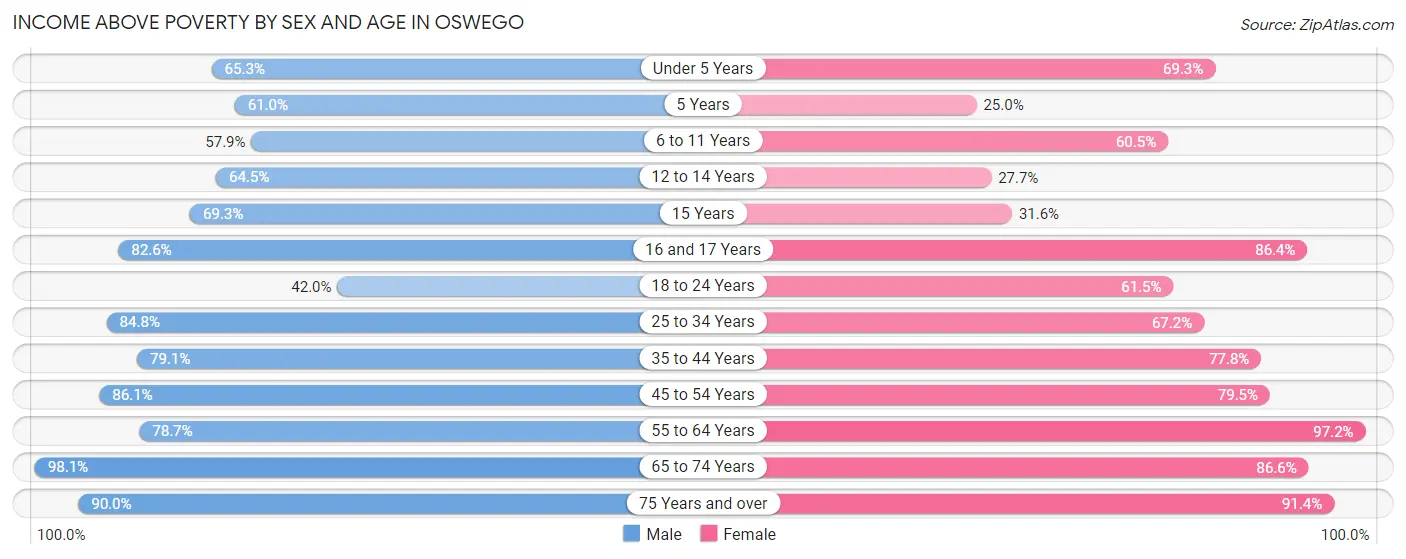
Income Above Poverty by Sex and Age in Oswego
According to the poverty statistics in Oswego, males aged 65 to 74 years and females aged 55 to 64 years are the age groups that are most secure financially, with 98.1% of males and 97.2% of females in these age groups living above the poverty line.
| Age Bracket | Male | Female |
| Under 5 Years | 250 (65.3%) | 282 (69.3%) |
| 5 Years | 75 (61.0%) | 22 (25.0%) |
| 6 to 11 Years | 465 (57.9%) | 405 (60.5%) |
| 12 to 14 Years | 156 (64.5%) | 71 (27.7%) |
| 15 Years | 79 (69.3%) | 24 (31.6%) |
| 16 and 17 Years | 218 (82.6%) | 248 (86.4%) |
| 18 to 24 Years | 526 (41.9%) | 550 (61.5%) |
| 25 to 34 Years | 912 (84.8%) | 693 (67.2%) |
| 35 to 44 Years | 663 (79.1%) | 780 (77.8%) |
| 45 to 54 Years | 868 (86.1%) | 607 (79.4%) |
| 55 to 64 Years | 768 (78.7%) | 998 (97.2%) |
| 65 to 74 Years | 715 (98.1%) | 655 (86.6%) |
| 75 Years and over | 352 (90.0%) | 783 (91.4%) |
| Total | 6,047 (73.7%) | 6,118 (75.4%) |
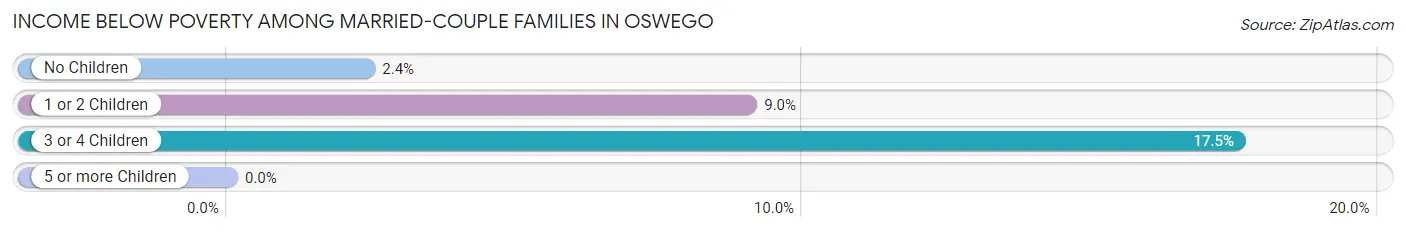
Income Below Poverty Among Married-Couple Families in Oswego
The poverty statistics for married-couple families in Oswego show that 6.0% or 145 of the total 2,428 families live below the poverty line. Families with 3 or 4 children have the highest poverty rate of 17.5%, comprising of 50 families. On the other hand, families with 5 or more children have the lowest poverty rate of 0.0%, which includes 0 families.
| Children | Above Poverty | Below Poverty |
| No Children | 1,429 (97.6%) | 35 (2.4%) |
| 1 or 2 Children | 604 (91.0%) | 60 (9.0%) |
| 3 or 4 Children | 235 (82.5%) | 50 (17.5%) |
| 5 or more Children | 15 (100.0%) | 0 (0.0%) |
| Total | 2,283 (94.0%) | 145 (6.0%) |
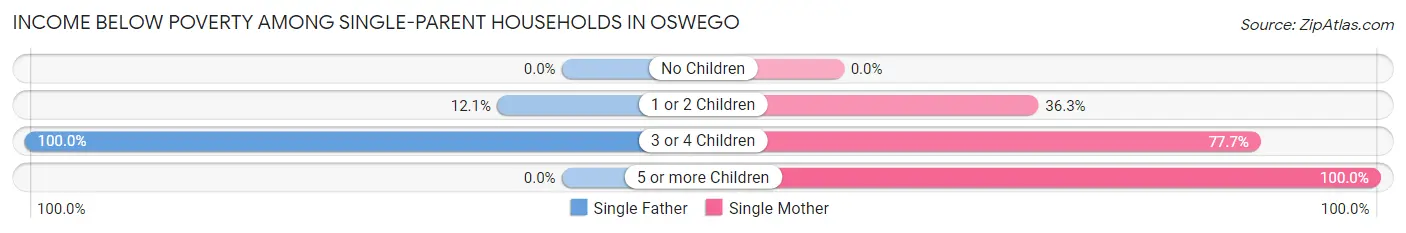
Income Below Poverty Among Single-Parent Households in Oswego
According to the poverty data in Oswego, 38.2% or 86 single-father households and 41.1% or 428 single-mother households are living below the poverty line. Among single-father households, those with 3 or 4 children have the highest poverty rate, with 76 households (100.0%) experiencing poverty. Likewise, among single-mother households, those with 5 or more children have the highest poverty rate, with 76 households (100.0%) falling below the poverty line.
| Children | Single Father | Single Mother |
| No Children | 0 (0.0%) | 0 (0.0%) |
| 1 or 2 Children | 10 (12.0%) | 185 (36.3%) |
| 3 or 4 Children | 76 (100.0%) | 167 (77.7%) |
| 5 or more Children | 0 (0.0%) | 76 (100.0%) |
| Total | 86 (38.2%) | 428 (41.1%) |
Income Below Poverty Among Married-Couple vs Single-Parent Households in Oswego
The poverty data for Oswego shows that 145 of the married-couple family households (6.0%) and 514 of the single-parent households (40.6%) are living below the poverty level. Within the married-couple family households, those with 3 or 4 children have the highest poverty rate, with 50 households (17.5%) falling below the poverty line. Among the single-parent households, those with 5 or more children have the highest poverty rate, with 76 household (100.0%) living below poverty.
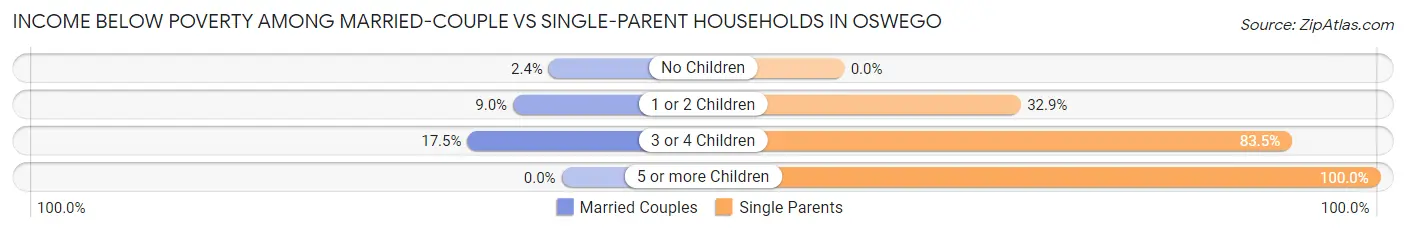
| Children | Married-Couple Families | Single-Parent Households |
| No Children | 35 (2.4%) | 0 (0.0%) |
| 1 or 2 Children | 60 (9.0%) | 195 (32.9%) |
| 3 or 4 Children | 50 (17.5%) | 243 (83.5%) |
| 5 or more Children | 0 (0.0%) | 76 (100.0%) |
| Total | 145 (6.0%) | 514 (40.6%) |
Employment Characteristics in Oswego
Employment by Class of Employer in Oswego
Among the 7,297 employed individuals in Oswego, private company employees (4,176 | 57.2%), not-for-profit organizations (958 | 13.1%), and state government employees (775 | 10.6%) make up the most common classes of employment.
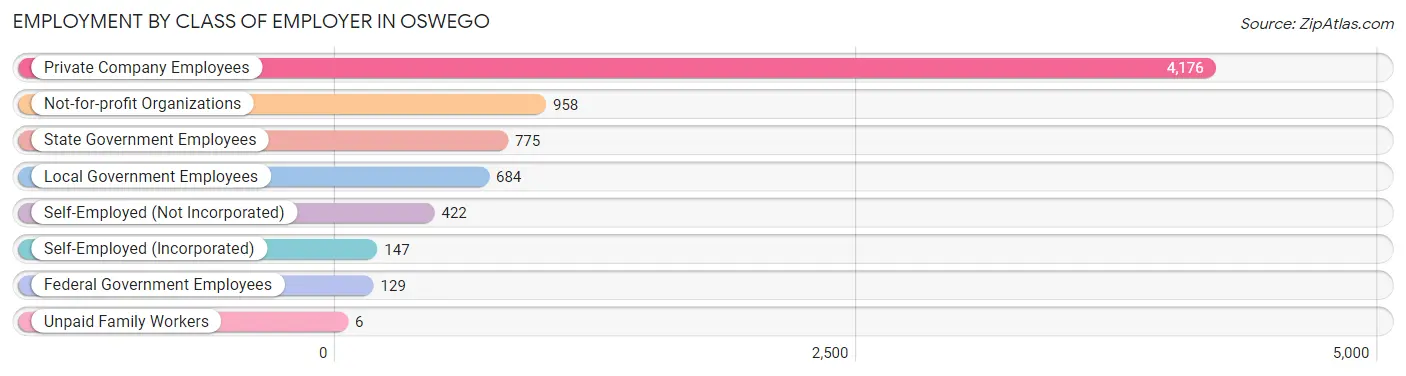
| Employer Class | # Employees | % Employees |
| Private Company Employees | 4,176 | 57.2% |
| Self-Employed (Incorporated) | 147 | 2.0% |
| Self-Employed (Not Incorporated) | 422 | 5.8% |
| Not-for-profit Organizations | 958 | 13.1% |
| Local Government Employees | 684 | 9.4% |
| State Government Employees | 775 | 10.6% |
| Federal Government Employees | 129 | 1.8% |
| Unpaid Family Workers | 6 | 0.1% |
| Total | 7,297 | 100.0% |
Employment Status by Age in Oswego
According to the labor force statistics for Oswego, out of the total population over 16 years of age (13,828), 60.0% or 8,297 individuals are in the labor force, with 10.7% or 888 of them unemployed. The age group with the highest labor force participation rate is 25 to 29 years, with 84.8% or 873 individuals in the labor force. Within the labor force, the 16 to 19 years age range has the highest percentage of unemployed individuals, with 27.8% or 147 of them being unemployed.
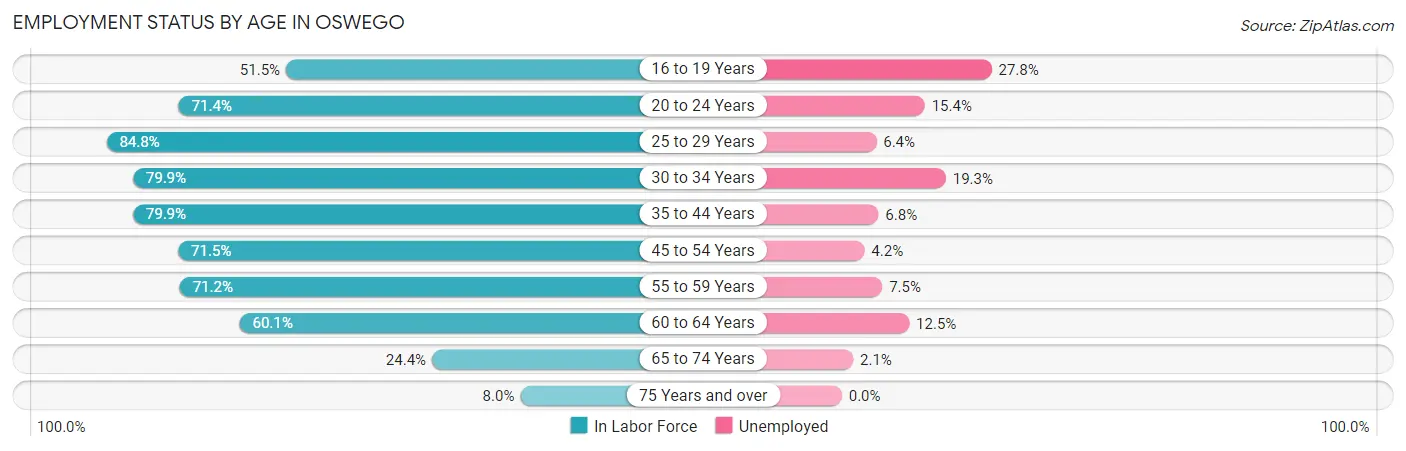
| Age Bracket | In Labor Force | Unemployed |
| 16 to 19 Years | 530 (51.5%) | 147 (27.8%) |
| 20 to 24 Years | 1,376 (71.4%) | 212 (15.4%) |
| 25 to 29 Years | 873 (84.8%) | 56 (6.4%) |
| 30 to 34 Years | 905 (79.9%) | 175 (19.3%) |
| 35 to 44 Years | 1,501 (79.9%) | 102 (6.8%) |
| 45 to 54 Years | 1,286 (71.5%) | 54 (4.2%) |
| 55 to 59 Years | 717 (71.2%) | 54 (7.5%) |
| 60 to 64 Years | 609 (60.1%) | 76 (12.5%) |
| 65 to 74 Years | 385 (24.4%) | 8 (2.1%) |
| 75 Years and over | 115 (8.0%) | 0 (0.0%) |
| Total | 8,297 (60.0%) | 888 (10.7%) |
Employment Status by Educational Attainment in Oswego
According to labor force statistics for Oswego, 75.0% of individuals (5,896) out of the total population between 25 and 64 years of age (7,861) are in the labor force, with 8.8% or 519 of them being unemployed. The group with the highest labor force participation rate are those with the educational attainment of bachelor's degree or higher, with 87.5% or 2,021 individuals in the labor force. Within the labor force, individuals with less than high school education have the highest percentage of unemployment, with 48.5% or 130 of them being unemployed.
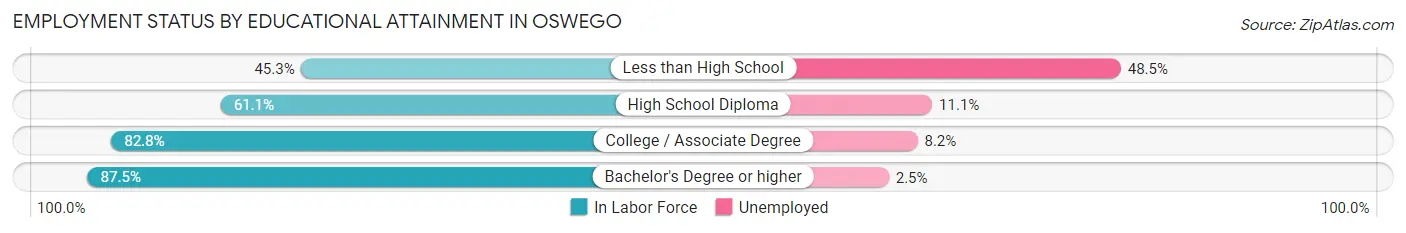
| Educational Attainment | In Labor Force | Unemployed |
| Less than High School | 268 (45.3%) | 287 (48.5%) |
| High School Diploma | 1,420 (61.1%) | 258 (11.1%) |
| College / Associate Degree | 2,183 (82.8%) | 216 (8.2%) |
| Bachelor's Degree or higher | 2,021 (87.5%) | 58 (2.5%) |
| Total | 5,896 (75.0%) | 692 (8.8%) |
Employment Occupations by Sex in Oswego
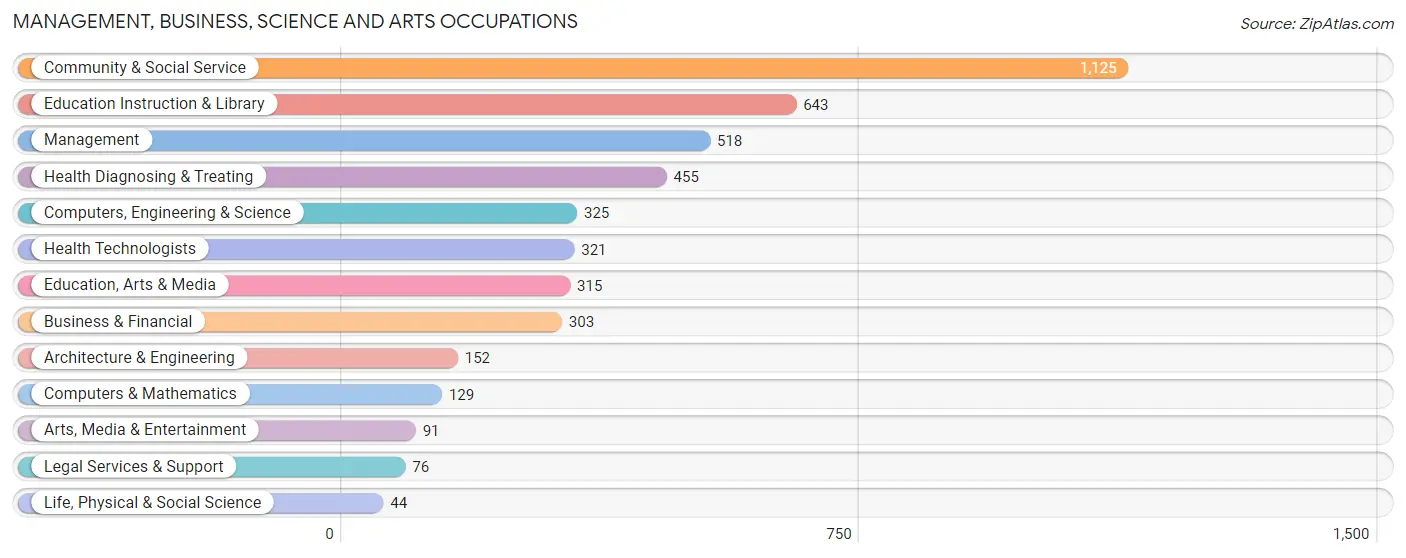
Management, Business, Science and Arts Occupations
The most common Management, Business, Science and Arts occupations in Oswego are Community & Social Service (1,125 | 15.3%), Education Instruction & Library (643 | 8.7%), Management (518 | 7.0%), Health Diagnosing & Treating (455 | 6.2%), and Computers, Engineering & Science (325 | 4.4%).
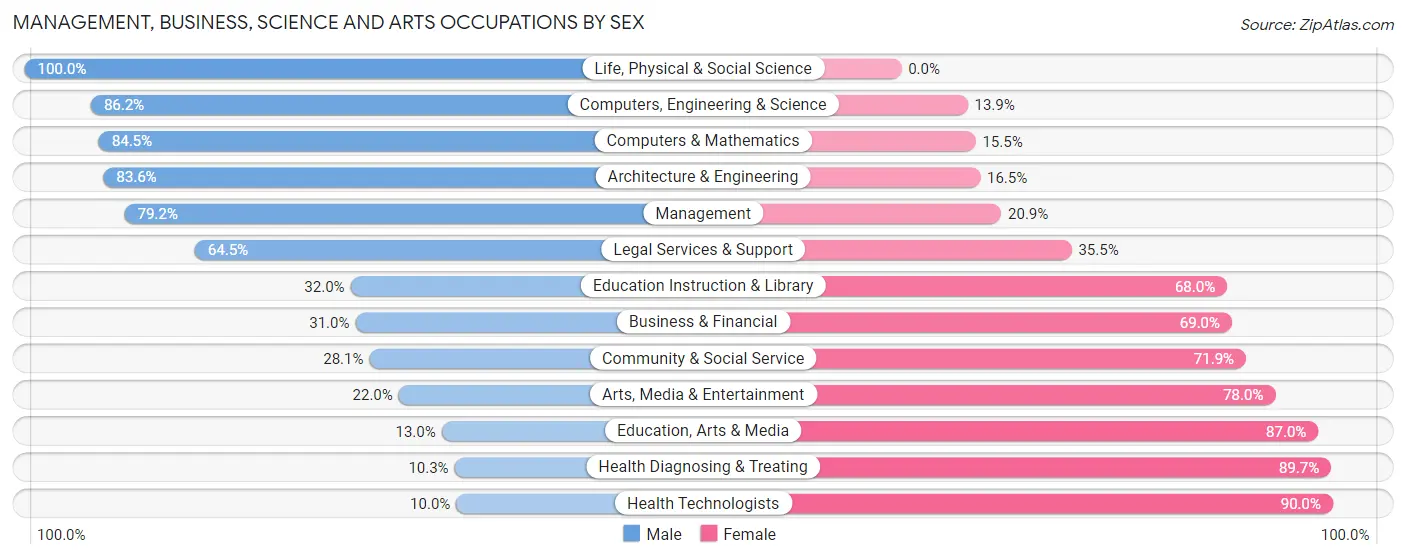
Management, Business, Science and Arts Occupations by Sex
Within the Management, Business, Science and Arts occupations in Oswego, the most male-oriented occupations are Life, Physical & Social Science (100.0%), Computers, Engineering & Science (86.2%), and Computers & Mathematics (84.5%), while the most female-oriented occupations are Health Technologists (90.0%), Health Diagnosing & Treating (89.7%), and Education, Arts & Media (87.0%).
| Occupation | Male | Female |
| Management | 410 (79.1%) | 108 (20.8%) |
| Business & Financial | 94 (31.0%) | 209 (69.0%) |
| Computers, Engineering & Science | 280 (86.2%) | 45 (13.9%) |
| Computers & Mathematics | 109 (84.5%) | 20 (15.5%) |
| Architecture & Engineering | 127 (83.6%) | 25 (16.5%) |
| Life, Physical & Social Science | 44 (100.0%) | 0 (0.0%) |
| Community & Social Service | 316 (28.1%) | 809 (71.9%) |
| Education, Arts & Media | 41 (13.0%) | 274 (87.0%) |
| Legal Services & Support | 49 (64.5%) | 27 (35.5%) |
| Education Instruction & Library | 206 (32.0%) | 437 (68.0%) |
| Arts, Media & Entertainment | 20 (22.0%) | 71 (78.0%) |
| Health Diagnosing & Treating | 47 (10.3%) | 408 (89.7%) |
| Health Technologists | 32 (10.0%) | 289 (90.0%) |
| Total (Category) | 1,147 (42.1%) | 1,579 (57.9%) |
| Total (Overall) | 3,598 (48.8%) | 3,769 (51.2%) |
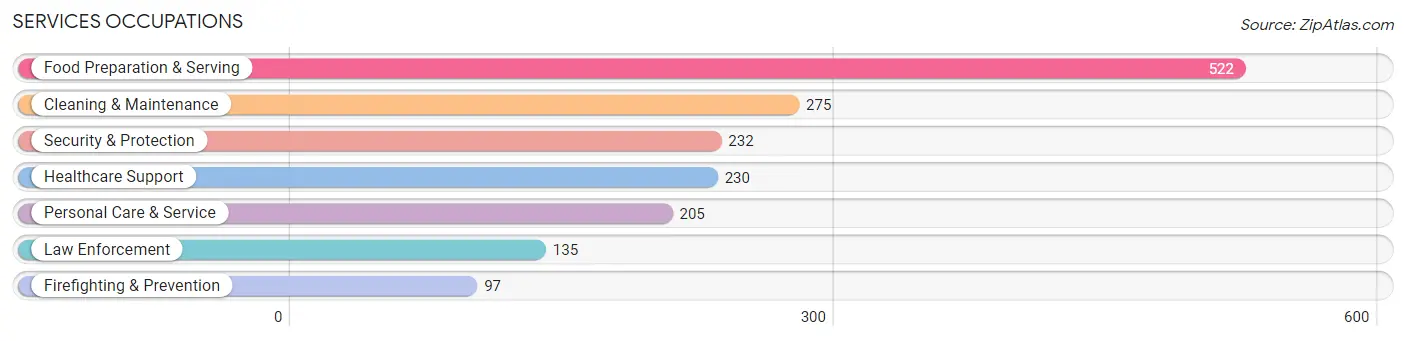
Services Occupations
The most common Services occupations in Oswego are Food Preparation & Serving (522 | 7.1%), Cleaning & Maintenance (275 | 3.7%), Security & Protection (232 | 3.2%), Healthcare Support (230 | 3.1%), and Personal Care & Service (205 | 2.8%).
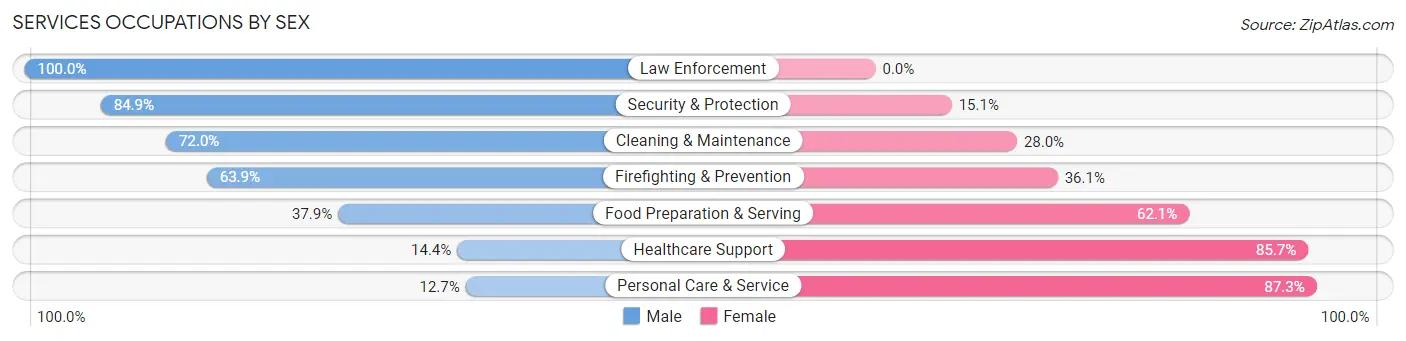
Services Occupations by Sex
Within the Services occupations in Oswego, the most male-oriented occupations are Law Enforcement (100.0%), Security & Protection (84.9%), and Cleaning & Maintenance (72.0%), while the most female-oriented occupations are Personal Care & Service (87.3%), Healthcare Support (85.7%), and Food Preparation & Serving (62.1%).
| Occupation | Male | Female |
| Healthcare Support | 33 (14.3%) | 197 (85.7%) |
| Security & Protection | 197 (84.9%) | 35 (15.1%) |
| Firefighting & Prevention | 62 (63.9%) | 35 (36.1%) |
| Law Enforcement | 135 (100.0%) | 0 (0.0%) |
| Food Preparation & Serving | 198 (37.9%) | 324 (62.1%) |
| Cleaning & Maintenance | 198 (72.0%) | 77 (28.0%) |
| Personal Care & Service | 26 (12.7%) | 179 (87.3%) |
| Total (Category) | 652 (44.5%) | 812 (55.5%) |
| Total (Overall) | 3,598 (48.8%) | 3,769 (51.2%) |
Sales and Office Occupations
The most common Sales and Office occupations in Oswego are Office & Administration (900 | 12.2%), and Sales & Related (882 | 12.0%).

Sales and Office Occupations by Sex
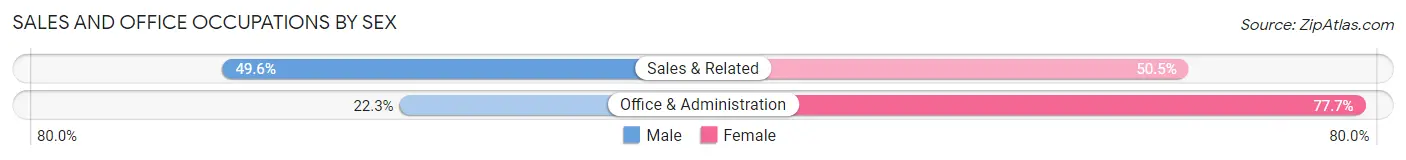
| Occupation | Male | Female |
| Sales & Related | 437 (49.5%) | 445 (50.4%) |
| Office & Administration | 201 (22.3%) | 699 (77.7%) |
| Total (Category) | 638 (35.8%) | 1,144 (64.2%) |
| Total (Overall) | 3,598 (48.8%) | 3,769 (51.2%) |
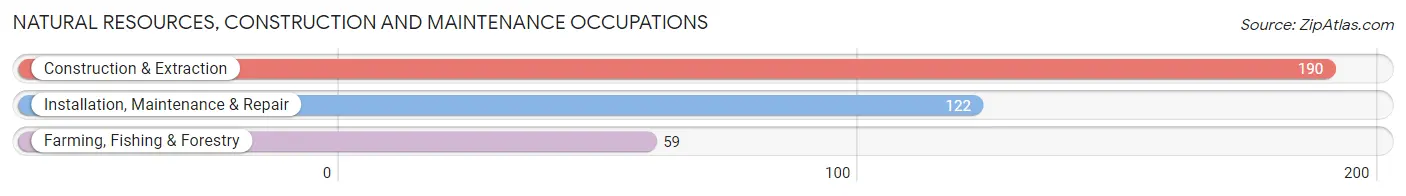
Natural Resources, Construction and Maintenance Occupations
The most common Natural Resources, Construction and Maintenance occupations in Oswego are Construction & Extraction (190 | 2.6%), Installation, Maintenance & Repair (122 | 1.7%), and Farming, Fishing & Forestry (59 | 0.8%).
Natural Resources, Construction and Maintenance Occupations by Sex
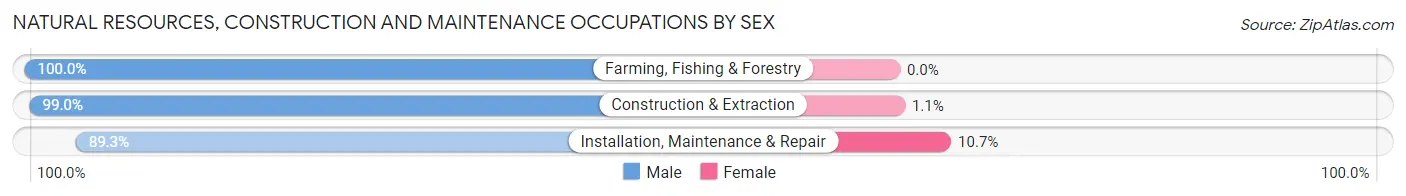
| Occupation | Male | Female |
| Farming, Fishing & Forestry | 59 (100.0%) | 0 (0.0%) |
| Construction & Extraction | 188 (99.0%) | 2 (1.1%) |
| Installation, Maintenance & Repair | 109 (89.3%) | 13 (10.7%) |
| Total (Category) | 356 (96.0%) | 15 (4.0%) |
| Total (Overall) | 3,598 (48.8%) | 3,769 (51.2%) |
Production, Transportation and Moving Occupations
The most common Production, Transportation and Moving occupations in Oswego are Production (443 | 6.0%), Material Moving (337 | 4.6%), and Transportation (244 | 3.3%).
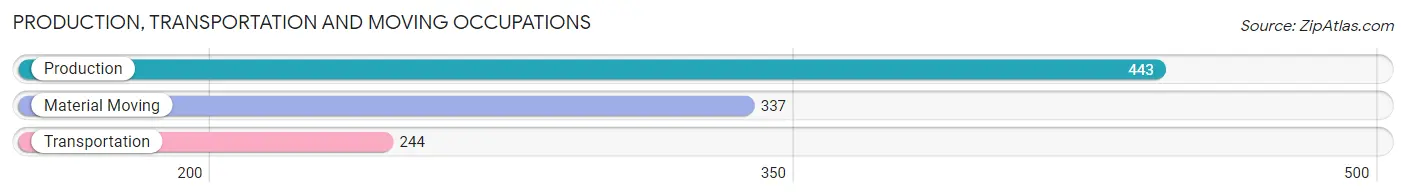
Production, Transportation and Moving Occupations by Sex
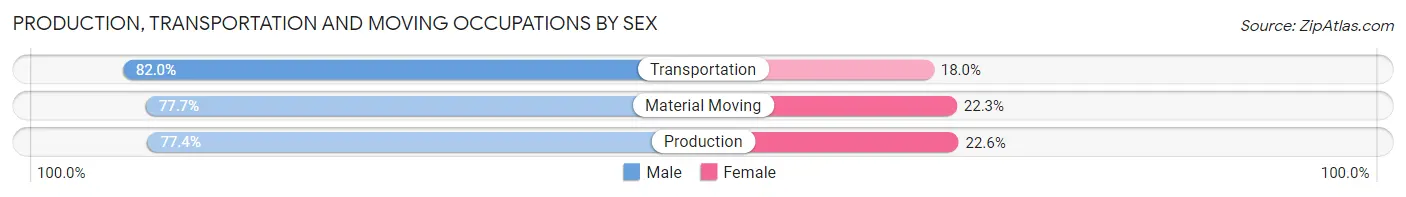
| Occupation | Male | Female |
| Production | 343 (77.4%) | 100 (22.6%) |
| Transportation | 200 (82.0%) | 44 (18.0%) |
| Material Moving | 262 (77.7%) | 75 (22.3%) |
| Total (Category) | 805 (78.6%) | 219 (21.4%) |
| Total (Overall) | 3,598 (48.8%) | 3,769 (51.2%) |
Employment Industries by Sex in Oswego
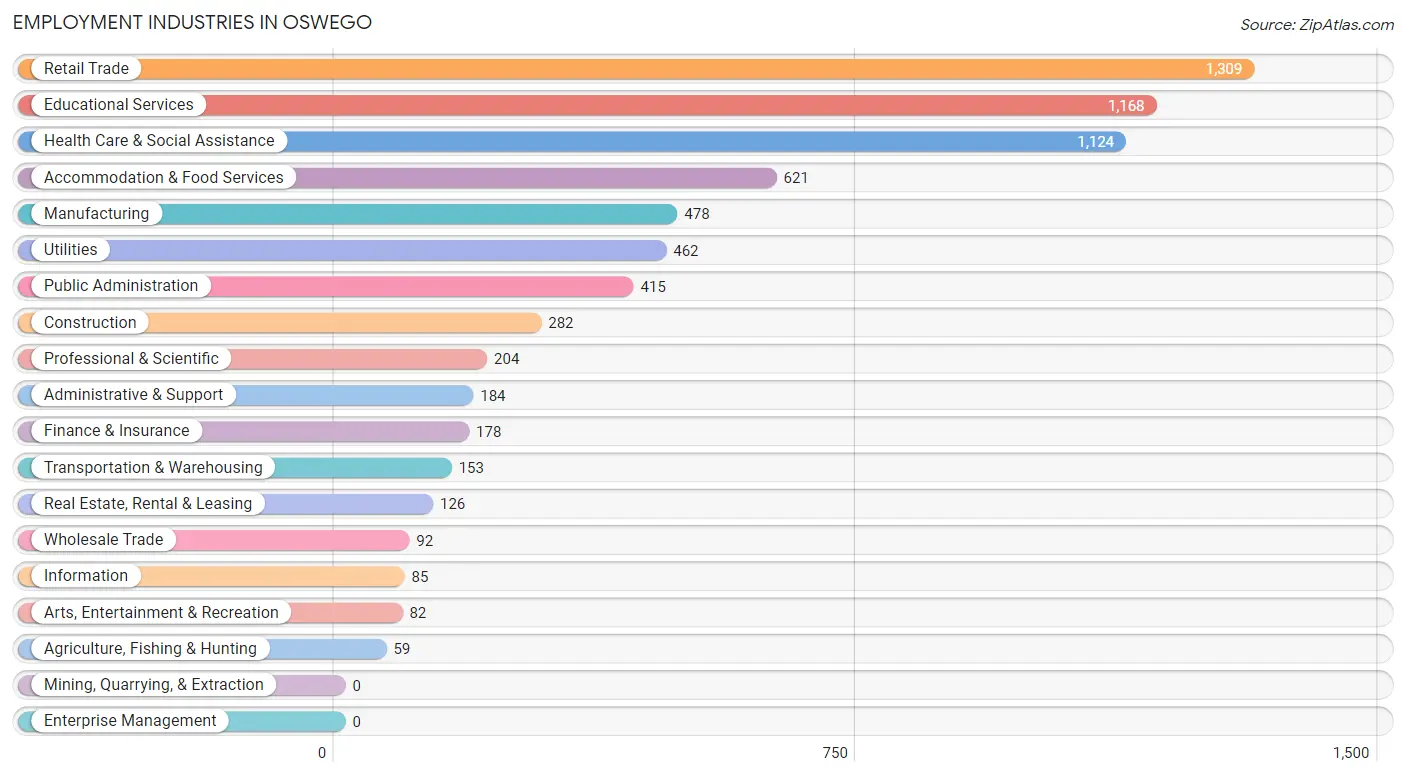
Employment Industries in Oswego
The major employment industries in Oswego include Retail Trade (1,309 | 17.8%), Educational Services (1,168 | 15.9%), Health Care & Social Assistance (1,124 | 15.3%), Accommodation & Food Services (621 | 8.4%), and Manufacturing (478 | 6.5%).
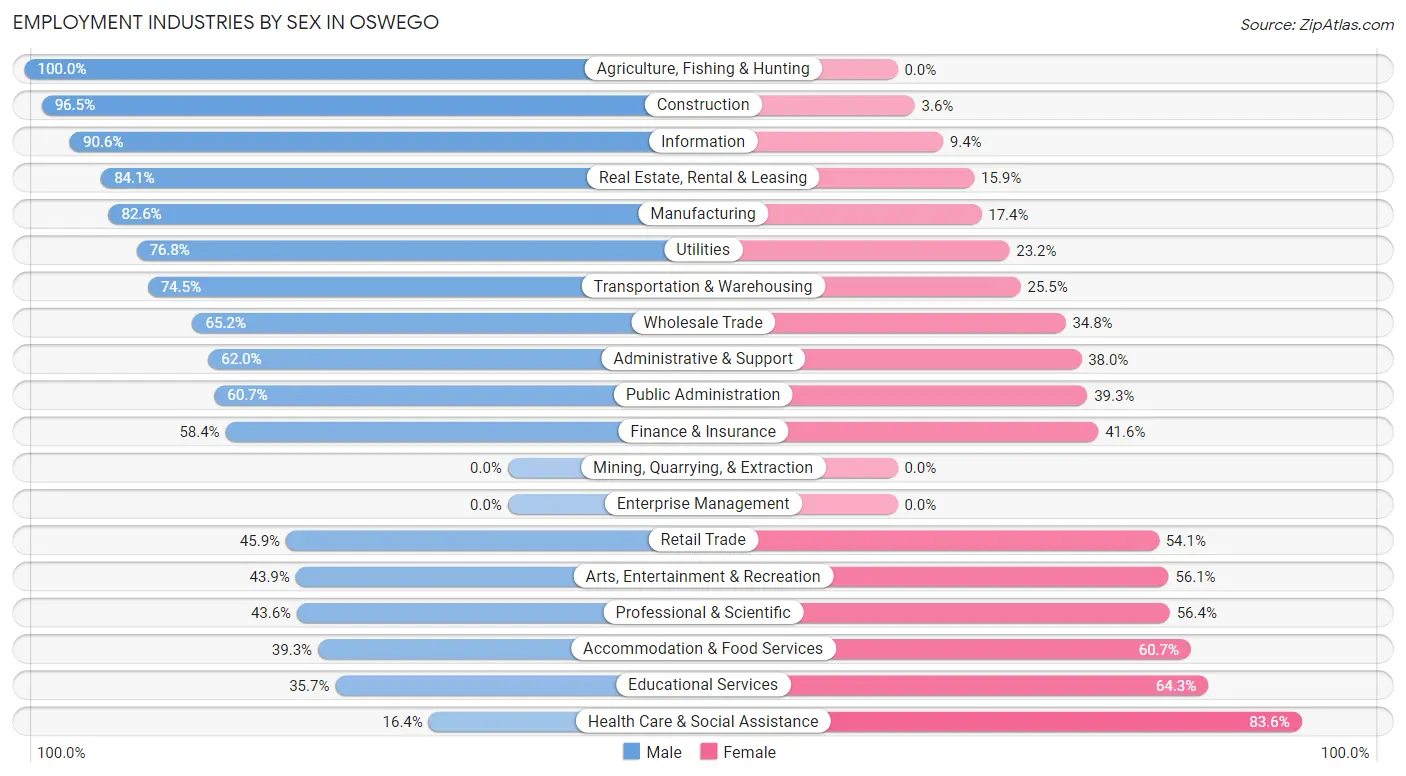
Employment Industries by Sex in Oswego
The Oswego industries that see more men than women are Agriculture, Fishing & Hunting (100.0%), Construction (96.5%), and Information (90.6%), whereas the industries that tend to have a higher number of women are Health Care & Social Assistance (83.6%), Educational Services (64.3%), and Accommodation & Food Services (60.7%).
| Industry | Male | Female |
| Agriculture, Fishing & Hunting | 59 (100.0%) | 0 (0.0%) |
| Mining, Quarrying, & Extraction | 0 (0.0%) | 0 (0.0%) |
| Construction | 272 (96.5%) | 10 (3.5%) |
| Manufacturing | 395 (82.6%) | 83 (17.4%) |
| Wholesale Trade | 60 (65.2%) | 32 (34.8%) |
| Retail Trade | 601 (45.9%) | 708 (54.1%) |
| Transportation & Warehousing | 114 (74.5%) | 39 (25.5%) |
| Utilities | 355 (76.8%) | 107 (23.2%) |
| Information | 77 (90.6%) | 8 (9.4%) |
| Finance & Insurance | 104 (58.4%) | 74 (41.6%) |
| Real Estate, Rental & Leasing | 106 (84.1%) | 20 (15.9%) |
| Professional & Scientific | 89 (43.6%) | 115 (56.4%) |
| Enterprise Management | 0 (0.0%) | 0 (0.0%) |
| Administrative & Support | 114 (62.0%) | 70 (38.0%) |
| Educational Services | 417 (35.7%) | 751 (64.3%) |
| Health Care & Social Assistance | 184 (16.4%) | 940 (83.6%) |
| Arts, Entertainment & Recreation | 36 (43.9%) | 46 (56.1%) |
| Accommodation & Food Services | 244 (39.3%) | 377 (60.7%) |
| Public Administration | 252 (60.7%) | 163 (39.3%) |
| Total | 3,598 (48.8%) | 3,769 (51.2%) |
Education in Oswego
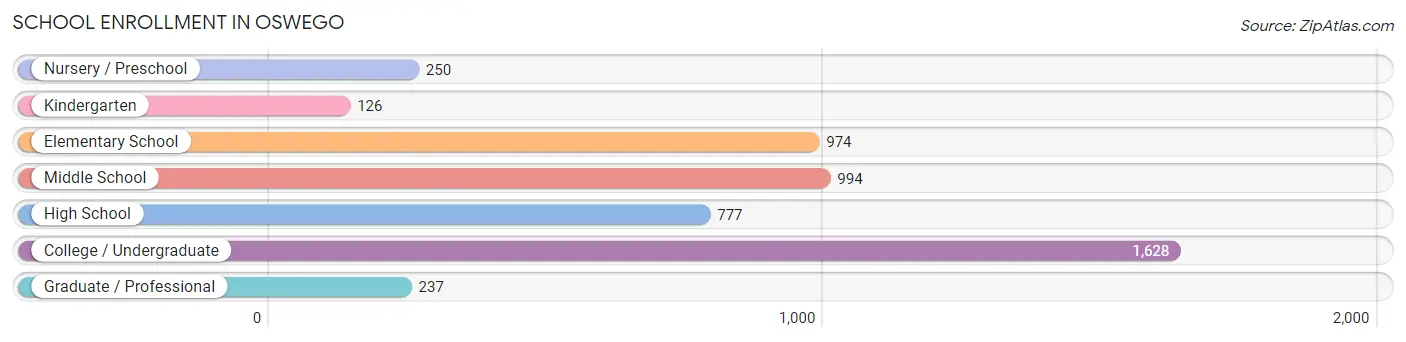
School Enrollment in Oswego
The most common levels of schooling among the 4,986 students in Oswego are college / undergraduate (1,628 | 32.7%), middle school (994 | 19.9%), and elementary school (974 | 19.5%).
| School Level | # Students | % Students |
| Nursery / Preschool | 250 | 5.0% |
| Kindergarten | 126 | 2.5% |
| Elementary School | 974 | 19.5% |
| Middle School | 994 | 19.9% |
| High School | 777 | 15.6% |
| College / Undergraduate | 1,628 | 32.7% |
| Graduate / Professional | 237 | 4.8% |
| Total | 4,986 | 100.0% |
School Enrollment by Age by Funding Source in Oswego
Out of a total of 4,986 students who are enrolled in schools in Oswego, 588 (11.8%) attend a private institution, while the remaining 4,398 (88.2%) are enrolled in public schools. The age group of 3 to 4 year olds has the highest likelihood of being enrolled in private schools, with 154 (77.8% in the age bracket) enrolled. Conversely, the age group of 15 to 17 year olds has the lowest likelihood of being enrolled in a private school, with 639 (98.6% in the age bracket) attending a public institution.
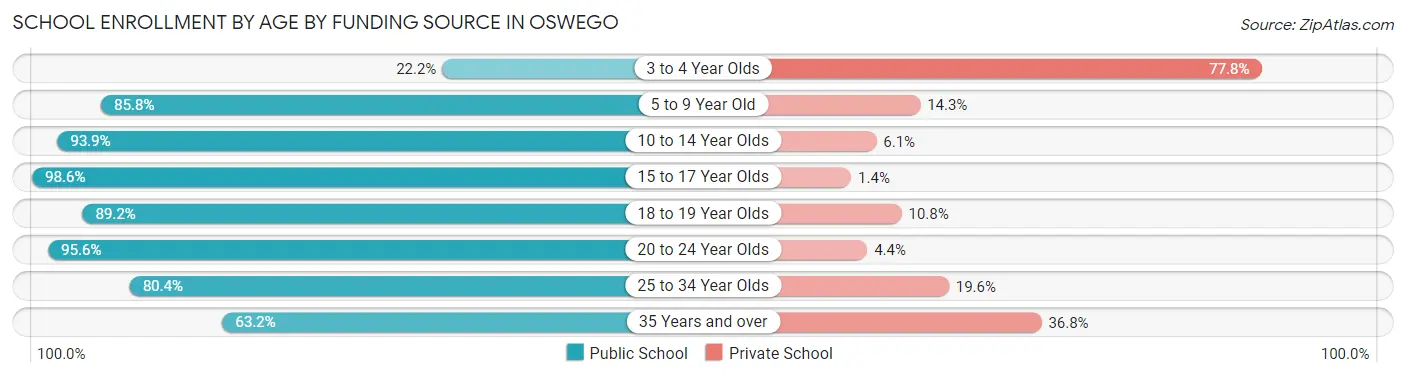
| Age Bracket | Public School | Private School |
| 3 to 4 Year Olds | 44 (22.2%) | 154 (77.8%) |
| 5 to 9 Year Old | 939 (85.8%) | 156 (14.2%) |
| 10 to 14 Year Olds | 1,033 (93.9%) | 67 (6.1%) |
| 15 to 17 Year Olds | 639 (98.6%) | 9 (1.4%) |
| 18 to 19 Year Olds | 331 (89.2%) | 40 (10.8%) |
| 20 to 24 Year Olds | 1,112 (95.6%) | 51 (4.4%) |
| 25 to 34 Year Olds | 193 (80.4%) | 47 (19.6%) |
| 35 Years and over | 108 (63.2%) | 63 (36.8%) |
| Total | 4,398 (88.2%) | 588 (11.8%) |
Educational Attainment by Field of Study in Oswego
Education (682 | 20.6%), psychology (450 | 13.6%), business (335 | 10.1%), liberal arts & history (252 | 7.6%), and science & technology (218 | 6.6%) are the most common fields of study among 3,307 individuals in Oswego who have obtained a bachelor's degree or higher.
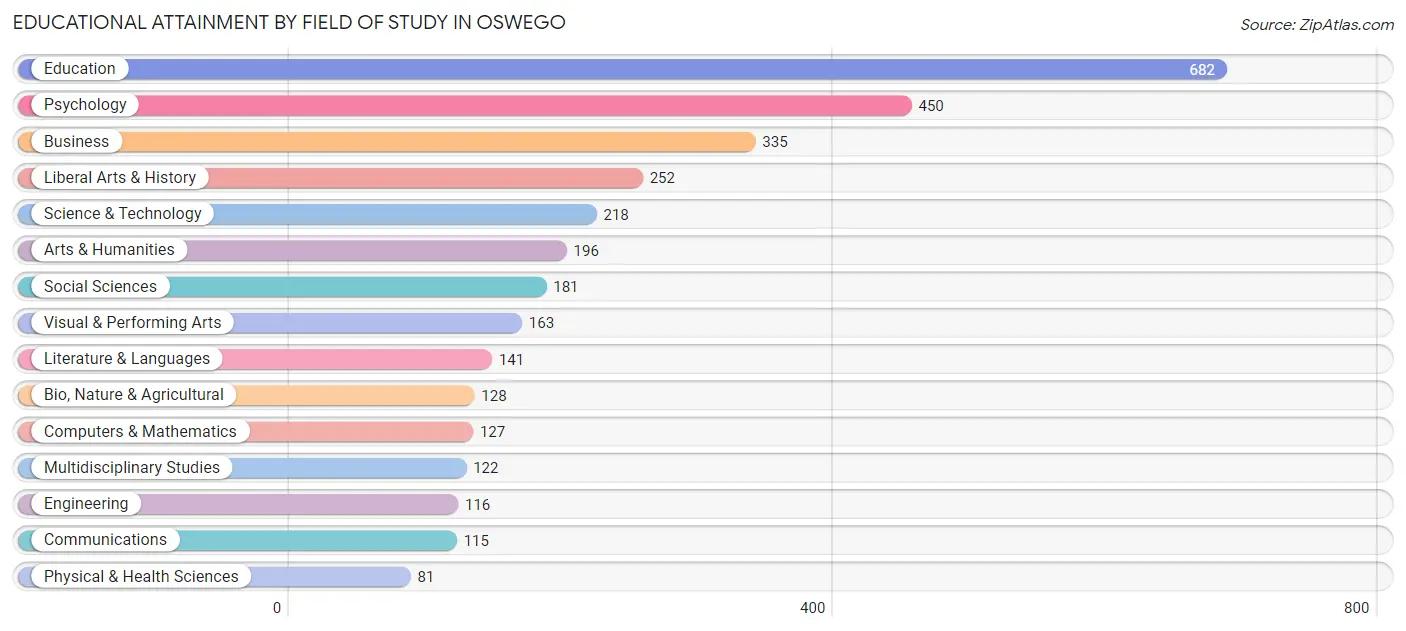
| Field of Study | # Graduates | % Graduates |
| Computers & Mathematics | 127 | 3.8% |
| Bio, Nature & Agricultural | 128 | 3.9% |
| Physical & Health Sciences | 81 | 2.5% |
| Psychology | 450 | 13.6% |
| Social Sciences | 181 | 5.5% |
| Engineering | 116 | 3.5% |
| Multidisciplinary Studies | 122 | 3.7% |
| Science & Technology | 218 | 6.6% |
| Business | 335 | 10.1% |
| Education | 682 | 20.6% |
| Literature & Languages | 141 | 4.3% |
| Liberal Arts & History | 252 | 7.6% |
| Visual & Performing Arts | 163 | 4.9% |
| Communications | 115 | 3.5% |
| Arts & Humanities | 196 | 5.9% |
| Total | 3,307 | 100.0% |
Transportation & Commute in Oswego
Vehicle Availability by Sex in Oswego
The most prevalent vehicle ownership categories in Oswego are males with 2 vehicles (1,558, accounting for 44.0%) and females with 2 vehicles (1,400, making up 42.4%).
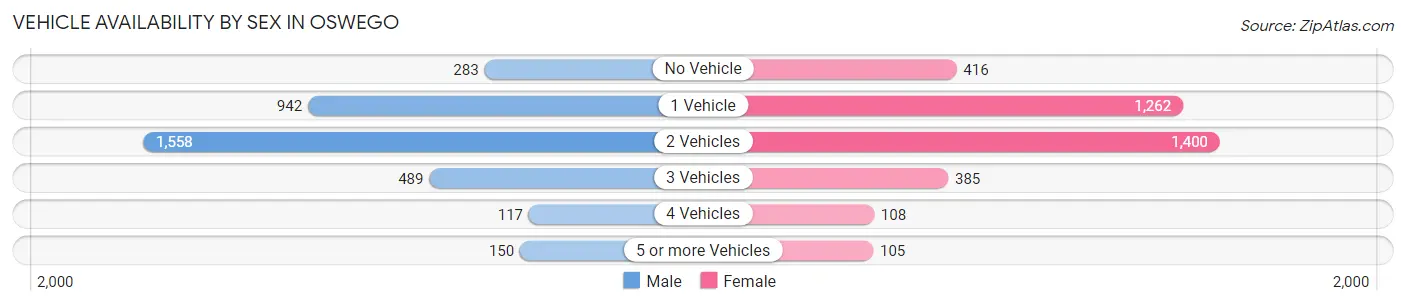
| Vehicles Available | Male | Female |
| No Vehicle | 283 (8.0%) | 416 (11.3%) |
| 1 Vehicle | 942 (26.6%) | 1,262 (34.3%) |
| 2 Vehicles | 1,558 (44.0%) | 1,400 (38.1%) |
| 3 Vehicles | 489 (13.8%) | 385 (10.5%) |
| 4 Vehicles | 117 (3.3%) | 108 (2.9%) |
| 5 or more Vehicles | 150 (4.2%) | 105 (2.9%) |
| Total | 3,539 (100.0%) | 3,676 (100.0%) |
Commute Time in Oswego
The most frequently occuring commute durations in Oswego are 5 to 9 minutes (1,856 commuters, 27.3%), 10 to 14 minutes (1,280 commuters, 18.9%), and 15 to 19 minutes (964 commuters, 14.2%).
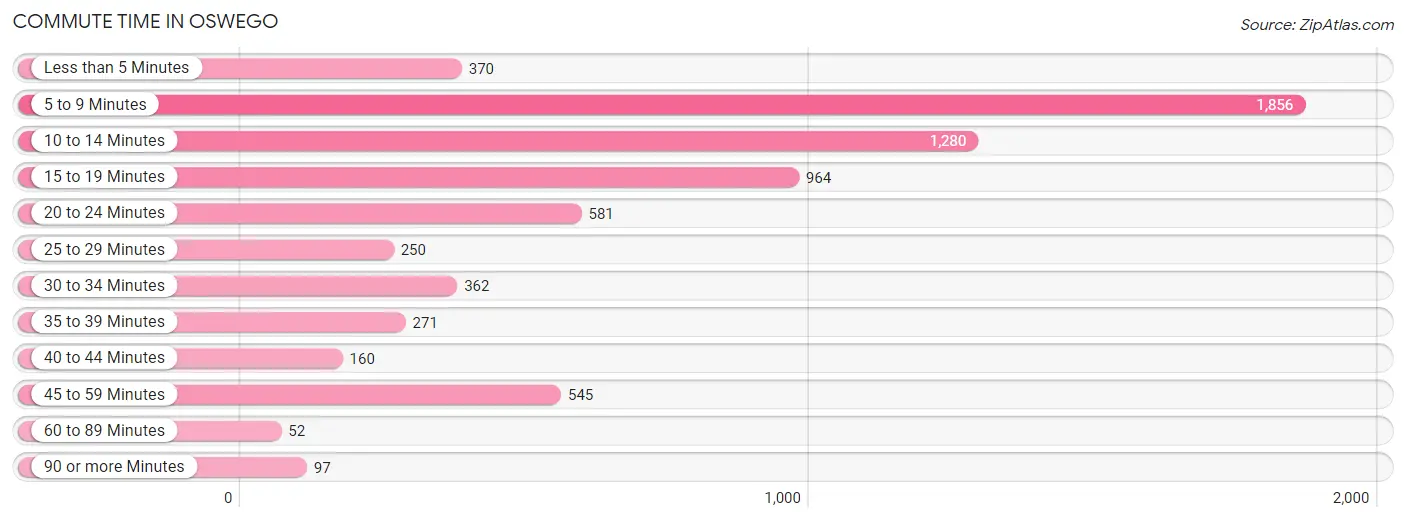
| Commute Time | # Commuters | % Commuters |
| Less than 5 Minutes | 370 | 5.4% |
| 5 to 9 Minutes | 1,856 | 27.3% |
| 10 to 14 Minutes | 1,280 | 18.9% |
| 15 to 19 Minutes | 964 | 14.2% |
| 20 to 24 Minutes | 581 | 8.6% |
| 25 to 29 Minutes | 250 | 3.7% |
| 30 to 34 Minutes | 362 | 5.3% |
| 35 to 39 Minutes | 271 | 4.0% |
| 40 to 44 Minutes | 160 | 2.4% |
| 45 to 59 Minutes | 545 | 8.0% |
| 60 to 89 Minutes | 52 | 0.8% |
| 90 or more Minutes | 97 | 1.4% |
Commute Time by Sex in Oswego
The most common commute times in Oswego are 5 to 9 minutes (843 commuters, 24.4%) for males and 5 to 9 minutes (1,013 commuters, 30.3%) for females.
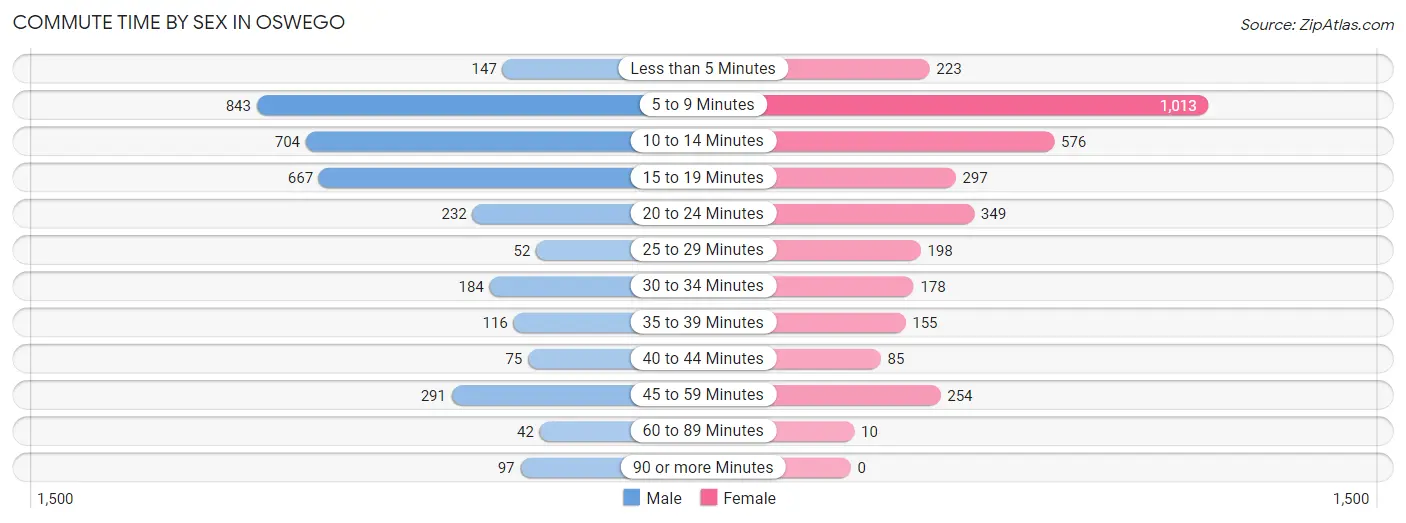
| Commute Time | Male | Female |
| Less than 5 Minutes | 147 (4.3%) | 223 (6.7%) |
| 5 to 9 Minutes | 843 (24.4%) | 1,013 (30.3%) |
| 10 to 14 Minutes | 704 (20.4%) | 576 (17.3%) |
| 15 to 19 Minutes | 667 (19.3%) | 297 (8.9%) |
| 20 to 24 Minutes | 232 (6.7%) | 349 (10.5%) |
| 25 to 29 Minutes | 52 (1.5%) | 198 (5.9%) |
| 30 to 34 Minutes | 184 (5.3%) | 178 (5.3%) |
| 35 to 39 Minutes | 116 (3.4%) | 155 (4.6%) |
| 40 to 44 Minutes | 75 (2.2%) | 85 (2.5%) |
| 45 to 59 Minutes | 291 (8.4%) | 254 (7.6%) |
| 60 to 89 Minutes | 42 (1.2%) | 10 (0.3%) |
| 90 or more Minutes | 97 (2.8%) | 0 (0.0%) |
Time of Departure to Work by Sex in Oswego
The most frequent times of departure to work in Oswego are 5:00 AM to 5:29 AM (383, 11.1%) for males and 7:30 AM to 7:59 AM (500, 15.0%) for females.
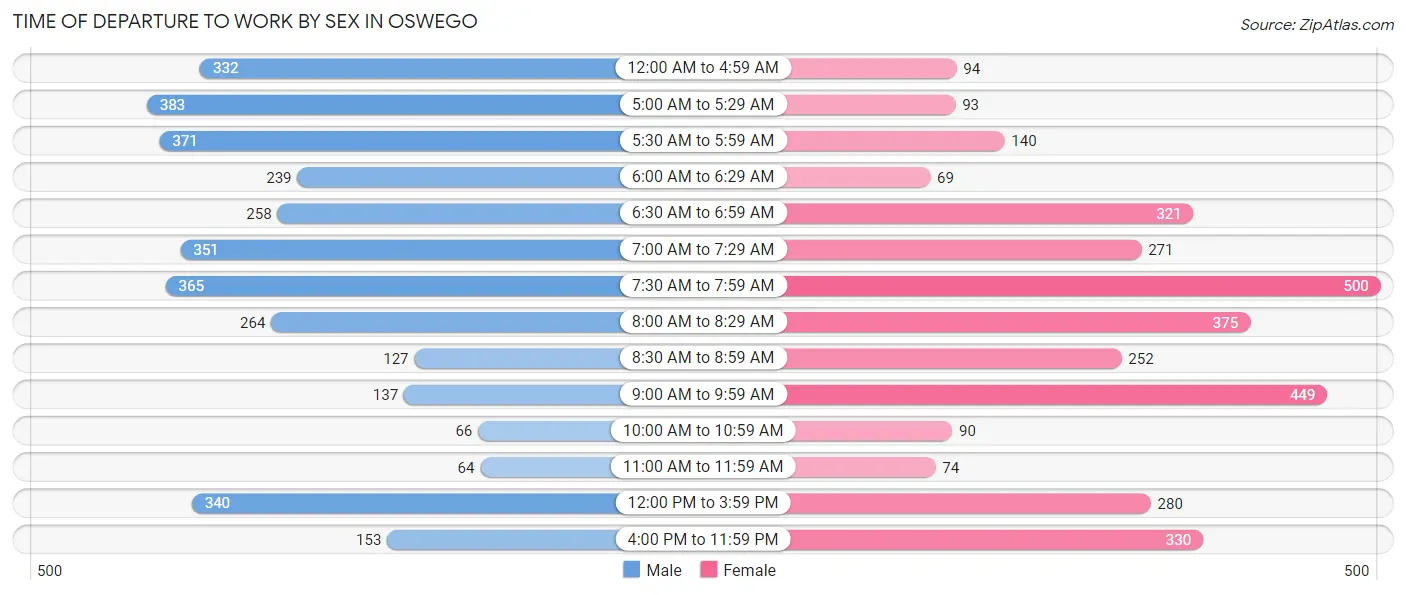
| Time of Departure | Male | Female |
| 12:00 AM to 4:59 AM | 332 (9.6%) | 94 (2.8%) |
| 5:00 AM to 5:29 AM | 383 (11.1%) | 93 (2.8%) |
| 5:30 AM to 5:59 AM | 371 (10.7%) | 140 (4.2%) |
| 6:00 AM to 6:29 AM | 239 (6.9%) | 69 (2.1%) |
| 6:30 AM to 6:59 AM | 258 (7.5%) | 321 (9.6%) |
| 7:00 AM to 7:29 AM | 351 (10.2%) | 271 (8.1%) |
| 7:30 AM to 7:59 AM | 365 (10.6%) | 500 (15.0%) |
| 8:00 AM to 8:29 AM | 264 (7.6%) | 375 (11.2%) |
| 8:30 AM to 8:59 AM | 127 (3.7%) | 252 (7.5%) |
| 9:00 AM to 9:59 AM | 137 (4.0%) | 449 (13.5%) |
| 10:00 AM to 10:59 AM | 66 (1.9%) | 90 (2.7%) |
| 11:00 AM to 11:59 AM | 64 (1.9%) | 74 (2.2%) |
| 12:00 PM to 3:59 PM | 340 (9.9%) | 280 (8.4%) |
| 4:00 PM to 11:59 PM | 153 (4.4%) | 330 (9.9%) |
| Total | 3,450 (100.0%) | 3,338 (100.0%) |
Housing Occupancy in Oswego
Occupancy by Ownership in Oswego
Of the total 7,353 dwellings in Oswego, owner-occupied units account for 3,607 (49.0%), while renter-occupied units make up 3,746 (50.9%).
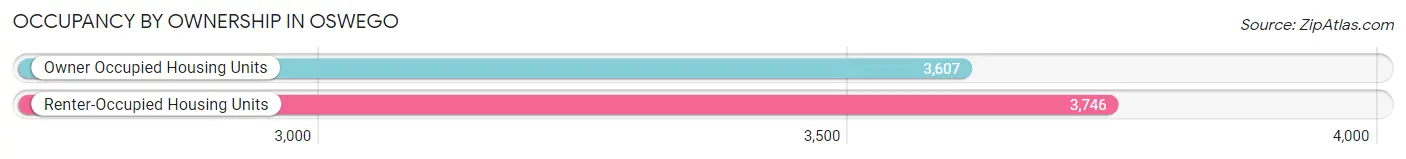
| Occupancy | # Housing Units | % Housing Units |
| Owner Occupied Housing Units | 3,607 | 49.0% |
| Renter-Occupied Housing Units | 3,746 | 50.9% |
| Total Occupied Housing Units | 7,353 | 100.0% |
Occupancy by Household Size in Oswego
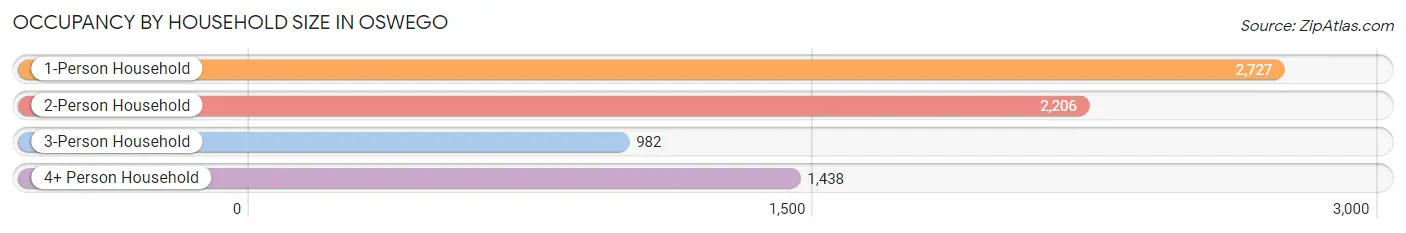
| Household Size | # Housing Units | % Housing Units |
| 1-Person Household | 2,727 | 37.1% |
| 2-Person Household | 2,206 | 30.0% |
| 3-Person Household | 982 | 13.4% |
| 4+ Person Household | 1,438 | 19.6% |
| Total Housing Units | 7,353 | 100.0% |
Occupancy by Ownership by Household Size in Oswego
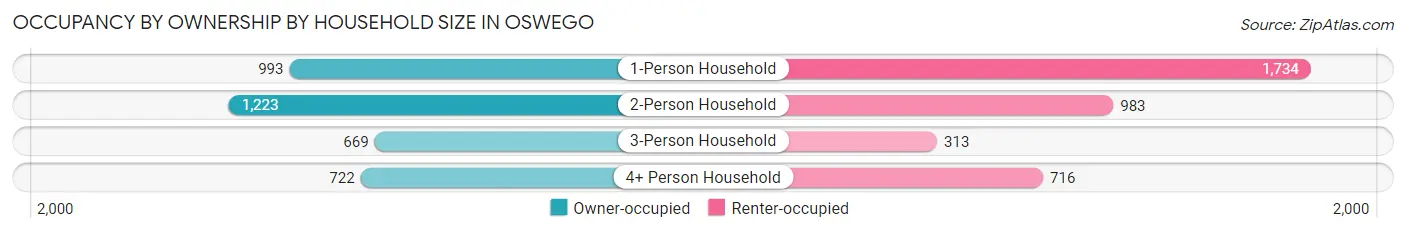
| Household Size | Owner-occupied | Renter-occupied |
| 1-Person Household | 993 (36.4%) | 1,734 (63.6%) |
| 2-Person Household | 1,223 (55.4%) | 983 (44.6%) |
| 3-Person Household | 669 (68.1%) | 313 (31.9%) |
| 4+ Person Household | 722 (50.2%) | 716 (49.8%) |
| Total Housing Units | 3,607 (49.0%) | 3,746 (50.9%) |
Occupancy by Educational Attainment in Oswego
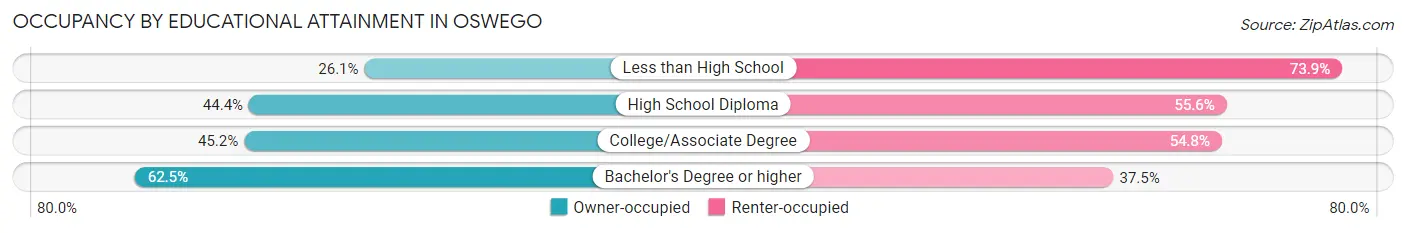
| Household Size | Owner-occupied | Renter-occupied |
| Less than High School | 123 (26.1%) | 348 (73.9%) |
| High School Diploma | 939 (44.4%) | 1,175 (55.6%) |
| College/Associate Degree | 1,136 (45.2%) | 1,378 (54.8%) |
| Bachelor's Degree or higher | 1,409 (62.5%) | 845 (37.5%) |
Occupancy by Age of Householder in Oswego
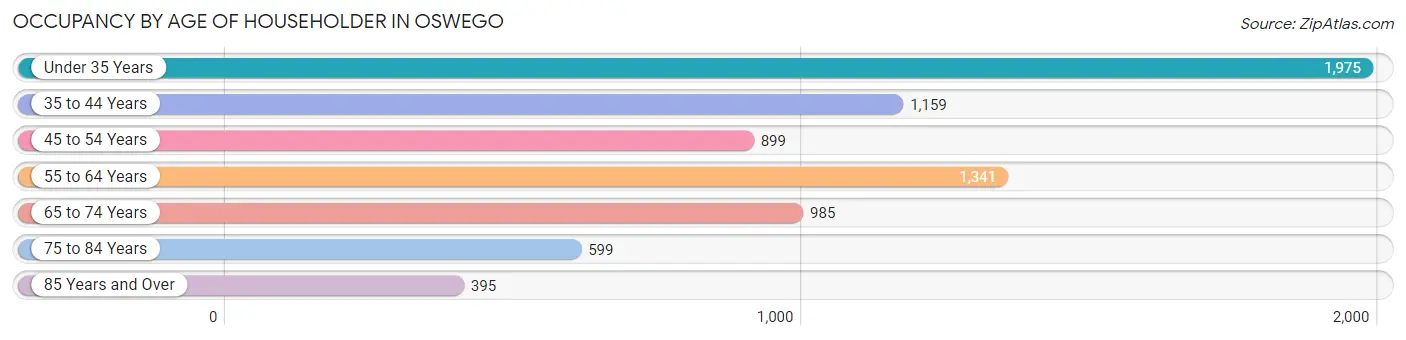
| Age Bracket | # Households | % Households |
| Under 35 Years | 1,975 | 26.9% |
| 35 to 44 Years | 1,159 | 15.8% |
| 45 to 54 Years | 899 | 12.2% |
| 55 to 64 Years | 1,341 | 18.2% |
| 65 to 74 Years | 985 | 13.4% |
| 75 to 84 Years | 599 | 8.2% |
| 85 Years and Over | 395 | 5.4% |
| Total | 7,353 | 100.0% |
Housing Finances in Oswego
Median Income by Occupancy in Oswego
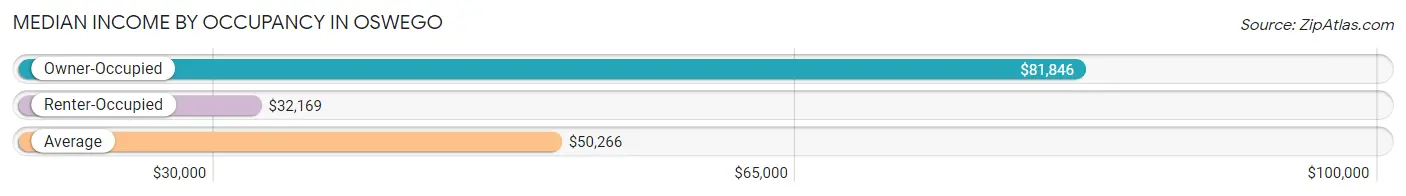
| Occupancy Type | # Households | Median Income |
| Owner-Occupied | 3,607 (49.0%) | $81,846 |
| Renter-Occupied | 3,746 (50.9%) | $32,169 |
| Average | 7,353 (100.0%) | $50,266 |
Occupancy by Householder Income Bracket in Oswego
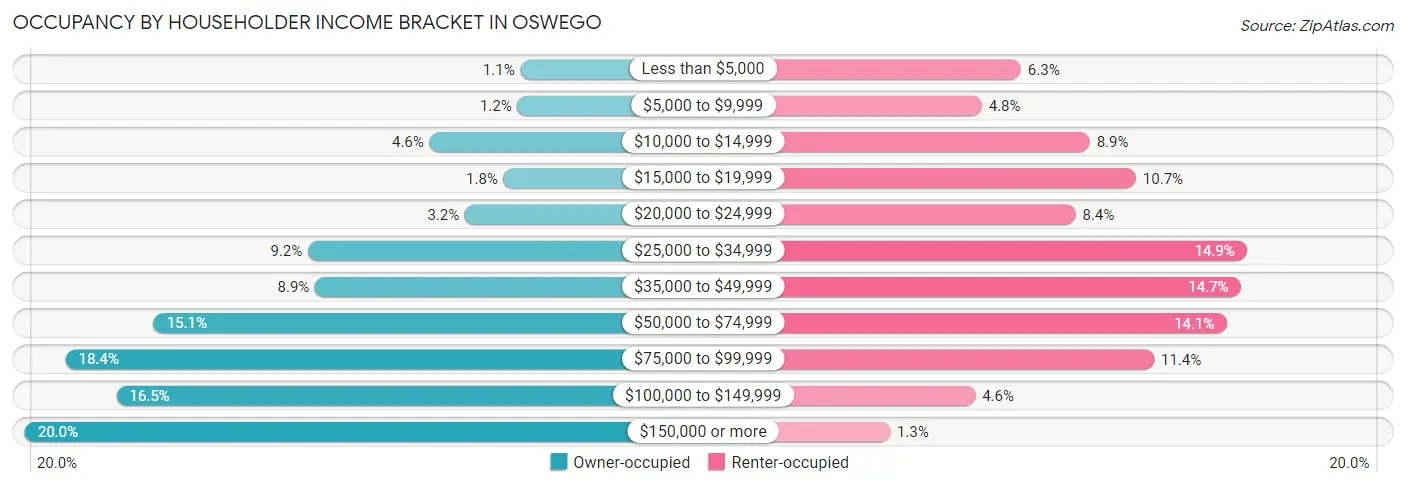
| Income Bracket | Owner-occupied | Renter-occupied |
| Less than $5,000 | 40 (1.1%) | 236 (6.3%) |
| $5,000 to $9,999 | 44 (1.2%) | 180 (4.8%) |
| $10,000 to $14,999 | 165 (4.6%) | 334 (8.9%) |
| $15,000 to $19,999 | 63 (1.8%) | 400 (10.7%) |
| $20,000 to $24,999 | 116 (3.2%) | 314 (8.4%) |
| $25,000 to $34,999 | 332 (9.2%) | 558 (14.9%) |
| $35,000 to $49,999 | 322 (8.9%) | 549 (14.7%) |
| $50,000 to $74,999 | 544 (15.1%) | 529 (14.1%) |
| $75,000 to $99,999 | 665 (18.4%) | 426 (11.4%) |
| $100,000 to $149,999 | 595 (16.5%) | 171 (4.6%) |
| $150,000 or more | 721 (20.0%) | 49 (1.3%) |
| Total | 3,607 (100.0%) | 3,746 (100.0%) |
Monthly Housing Cost Tiers in Oswego
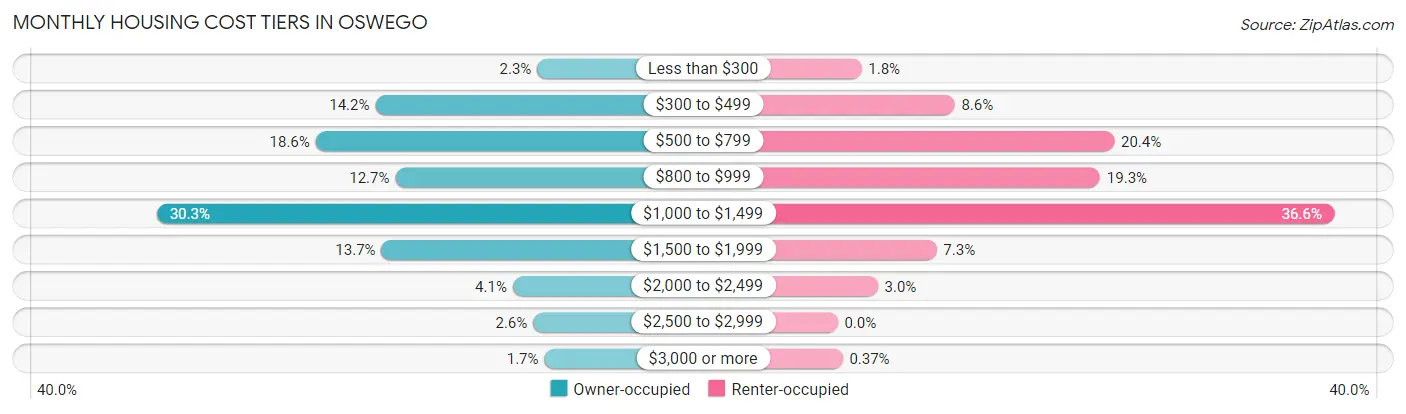
| Monthly Cost | Owner-occupied | Renter-occupied |
| Less than $300 | 81 (2.2%) | 66 (1.8%) |
| $300 to $499 | 511 (14.2%) | 323 (8.6%) |
| $500 to $799 | 670 (18.6%) | 763 (20.4%) |
| $800 to $999 | 458 (12.7%) | 724 (19.3%) |
| $1,000 to $1,499 | 1,092 (30.3%) | 1,369 (36.5%) |
| $1,500 to $1,999 | 495 (13.7%) | 273 (7.3%) |
| $2,000 to $2,499 | 146 (4.1%) | 111 (3.0%) |
| $2,500 to $2,999 | 92 (2.5%) | 0 (0.0%) |
| $3,000 or more | 62 (1.7%) | 14 (0.4%) |
| Total | 3,607 (100.0%) | 3,746 (100.0%) |
Physical Housing Characteristics in Oswego
Housing Structures in Oswego
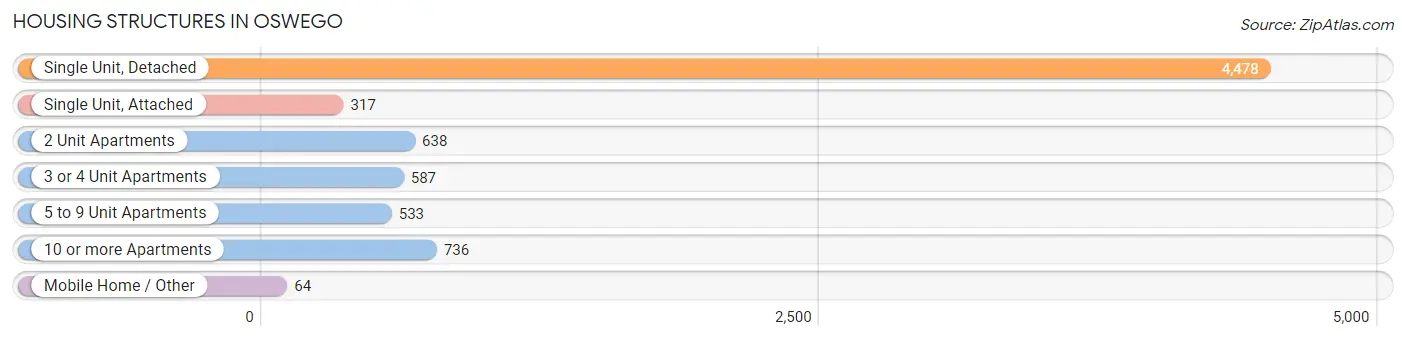
| Structure Type | # Housing Units | % Housing Units |
| Single Unit, Detached | 4,478 | 60.9% |
| Single Unit, Attached | 317 | 4.3% |
| 2 Unit Apartments | 638 | 8.7% |
| 3 or 4 Unit Apartments | 587 | 8.0% |
| 5 to 9 Unit Apartments | 533 | 7.2% |
| 10 or more Apartments | 736 | 10.0% |
| Mobile Home / Other | 64 | 0.9% |
| Total | 7,353 | 100.0% |
Housing Structures by Occupancy in Oswego
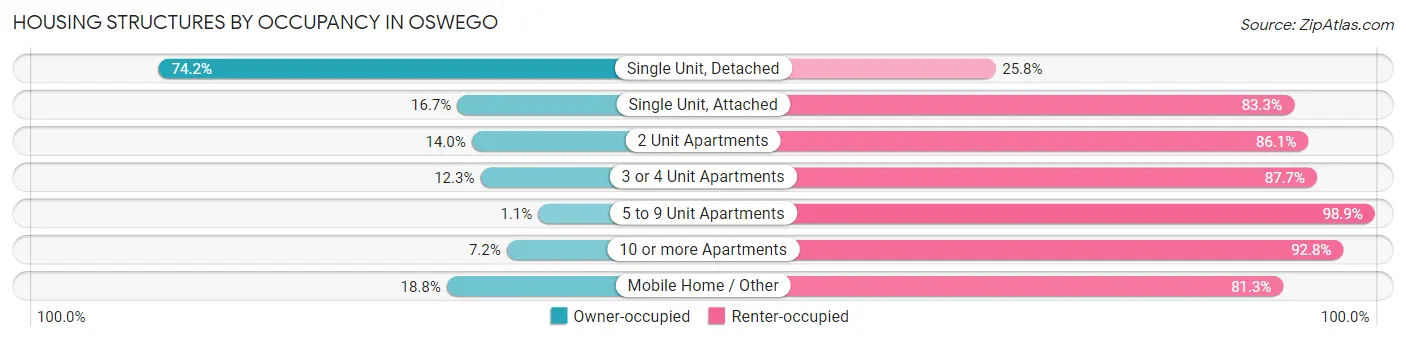
| Structure Type | Owner-occupied | Renter-occupied |
| Single Unit, Detached | 3,322 (74.2%) | 1,156 (25.8%) |
| Single Unit, Attached | 53 (16.7%) | 264 (83.3%) |
| 2 Unit Apartments | 89 (14.0%) | 549 (86.1%) |
| 3 or 4 Unit Apartments | 72 (12.3%) | 515 (87.7%) |
| 5 to 9 Unit Apartments | 6 (1.1%) | 527 (98.9%) |
| 10 or more Apartments | 53 (7.2%) | 683 (92.8%) |
| Mobile Home / Other | 12 (18.8%) | 52 (81.2%) |
| Total | 3,607 (49.0%) | 3,746 (50.9%) |
Housing Structures by Number of Rooms in Oswego
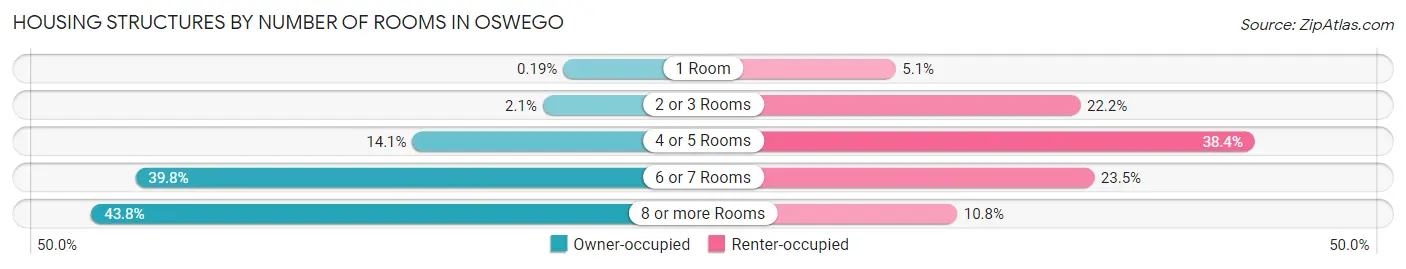
| Number of Rooms | Owner-occupied | Renter-occupied |
| 1 Room | 7 (0.2%) | 192 (5.1%) |
| 2 or 3 Rooms | 75 (2.1%) | 832 (22.2%) |
| 4 or 5 Rooms | 510 (14.1%) | 1,437 (38.4%) |
| 6 or 7 Rooms | 1,434 (39.8%) | 880 (23.5%) |
| 8 or more Rooms | 1,581 (43.8%) | 405 (10.8%) |
| Total | 3,607 (100.0%) | 3,746 (100.0%) |
Housing Structure by Heating Type in Oswego
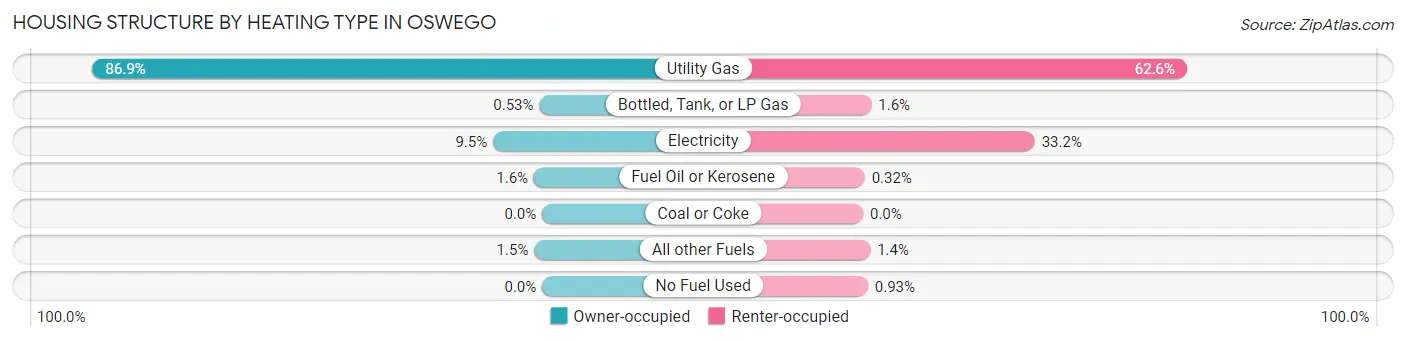
| Heating Type | Owner-occupied | Renter-occupied |
| Utility Gas | 3,134 (86.9%) | 2,344 (62.6%) |
| Bottled, Tank, or LP Gas | 19 (0.5%) | 60 (1.6%) |
| Electricity | 342 (9.5%) | 1,243 (33.2%) |
| Fuel Oil or Kerosene | 57 (1.6%) | 12 (0.3%) |
| Coal or Coke | 0 (0.0%) | 0 (0.0%) |
| All other Fuels | 55 (1.5%) | 52 (1.4%) |
| No Fuel Used | 0 (0.0%) | 35 (0.9%) |
| Total | 3,607 (100.0%) | 3,746 (100.0%) |
Household Vehicle Usage in Oswego
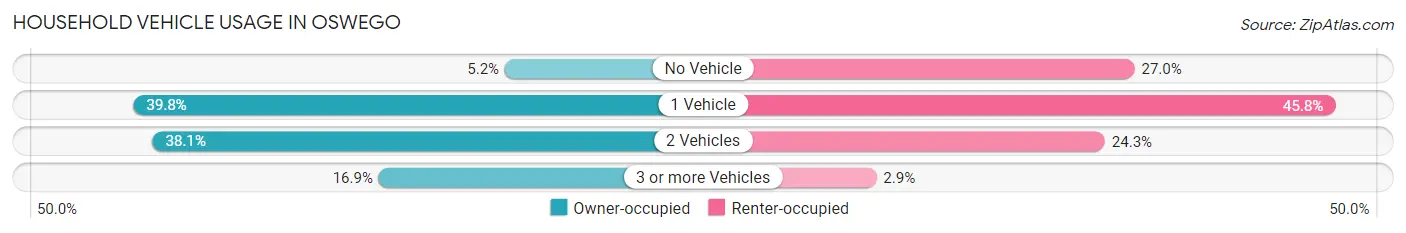
| Vehicles per Household | Owner-occupied | Renter-occupied |
| No Vehicle | 186 (5.2%) | 1,013 (27.0%) |
| 1 Vehicle | 1,437 (39.8%) | 1,714 (45.8%) |
| 2 Vehicles | 1,373 (38.1%) | 909 (24.3%) |
| 3 or more Vehicles | 611 (16.9%) | 110 (2.9%) |
| Total | 3,607 (100.0%) | 3,746 (100.0%) |
Real Estate & Mortgages in Oswego
Real Estate and Mortgage Overview in Oswego
| Characteristic | Without Mortgage | With Mortgage |
| Housing Units | 1,480 | 2,127 |
| Median Property Value | $96,300 | $117,900 |
| Median Household Income | $59,781 | $548 |
| Monthly Housing Costs | $548 | $62 |
| Real Estate Taxes | $2,491 | $43 |
Property Value by Mortgage Status in Oswego
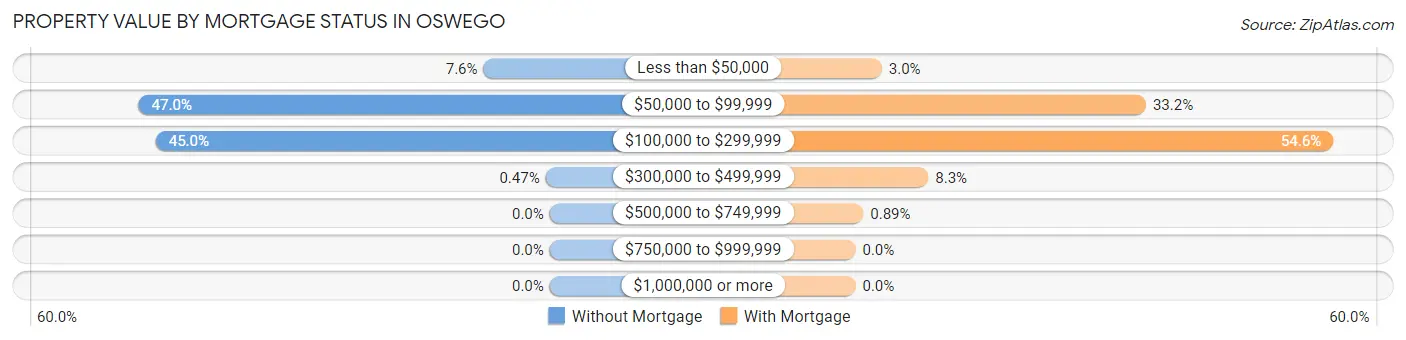
| Property Value | Without Mortgage | With Mortgage |
| Less than $50,000 | 112 (7.6%) | 64 (3.0%) |
| $50,000 to $99,999 | 695 (47.0%) | 706 (33.2%) |
| $100,000 to $299,999 | 666 (45.0%) | 1,161 (54.6%) |
| $300,000 to $499,999 | 7 (0.5%) | 177 (8.3%) |
| $500,000 to $749,999 | 0 (0.0%) | 19 (0.9%) |
| $750,000 to $999,999 | 0 (0.0%) | 0 (0.0%) |
| $1,000,000 or more | 0 (0.0%) | 0 (0.0%) |
| Total | 1,480 (100.0%) | 2,127 (100.0%) |
Household Income by Mortgage Status in Oswego
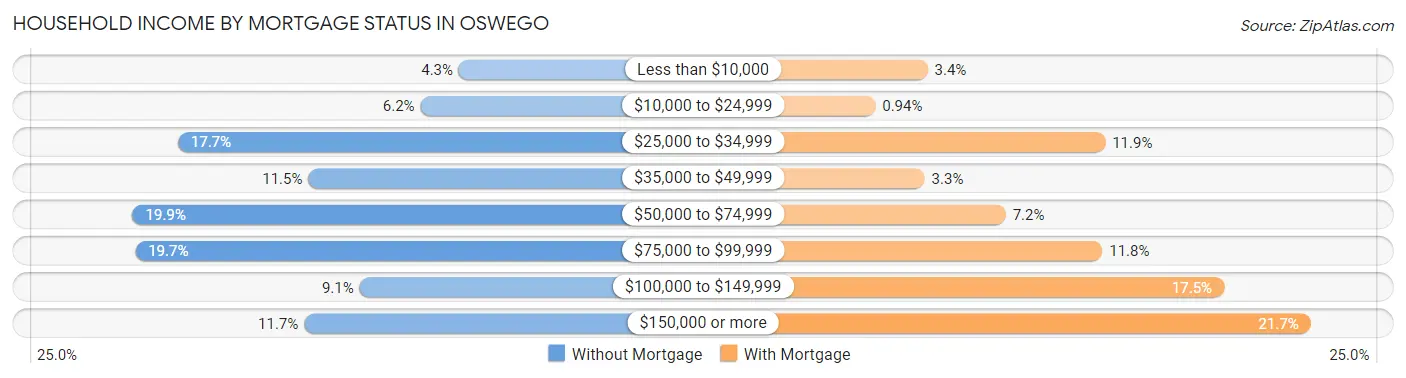
| Household Income | Without Mortgage | With Mortgage |
| Less than $10,000 | 64 (4.3%) | 73 (3.4%) |
| $10,000 to $24,999 | 91 (6.1%) | 20 (0.9%) |
| $25,000 to $34,999 | 262 (17.7%) | 253 (11.9%) |
| $35,000 to $49,999 | 170 (11.5%) | 70 (3.3%) |
| $50,000 to $74,999 | 294 (19.9%) | 152 (7.1%) |
| $75,000 to $99,999 | 292 (19.7%) | 250 (11.7%) |
| $100,000 to $149,999 | 134 (9.0%) | 373 (17.5%) |
| $150,000 or more | 173 (11.7%) | 461 (21.7%) |
| Total | 1,480 (100.0%) | 2,127 (100.0%) |
Property Value to Household Income Ratio in Oswego
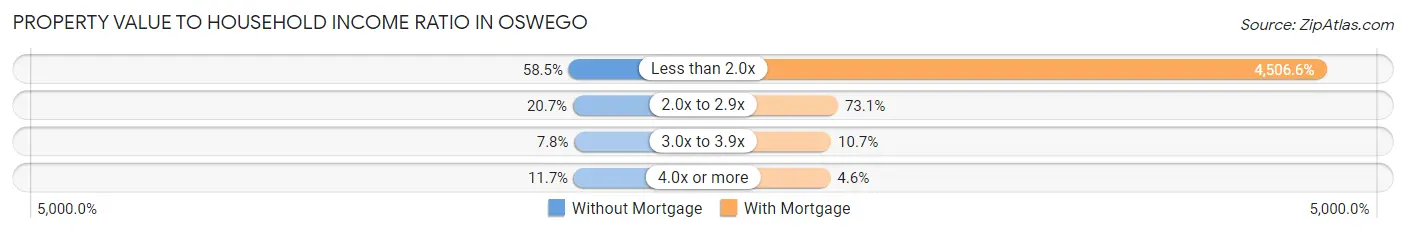
| Value-to-Income Ratio | Without Mortgage | With Mortgage |
| Less than 2.0x | 865 (58.5%) | 95,856 (4,506.6%) |
| 2.0x to 2.9x | 307 (20.7%) | 1,555 (73.1%) |
| 3.0x to 3.9x | 116 (7.8%) | 227 (10.7%) |
| 4.0x or more | 173 (11.7%) | 97 (4.6%) |
| Total | 1,480 (100.0%) | 2,127 (100.0%) |
Real Estate Taxes by Mortgage Status in Oswego
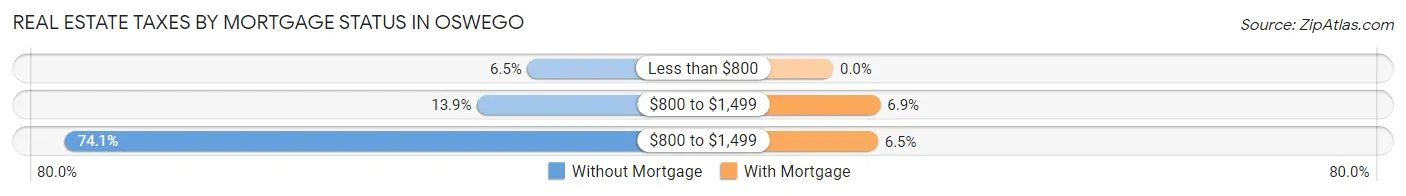
| Property Taxes | Without Mortgage | With Mortgage |
| Less than $800 | 96 (6.5%) | 0 (0.0%) |
| $800 to $1,499 | 205 (13.9%) | 147 (6.9%) |
| $800 to $1,499 | 1,097 (74.1%) | 139 (6.5%) |
| Total | 1,480 (100.0%) | 2,127 (100.0%) |
Health & Disability in Oswego
Health Insurance Coverage by Age in Oswego
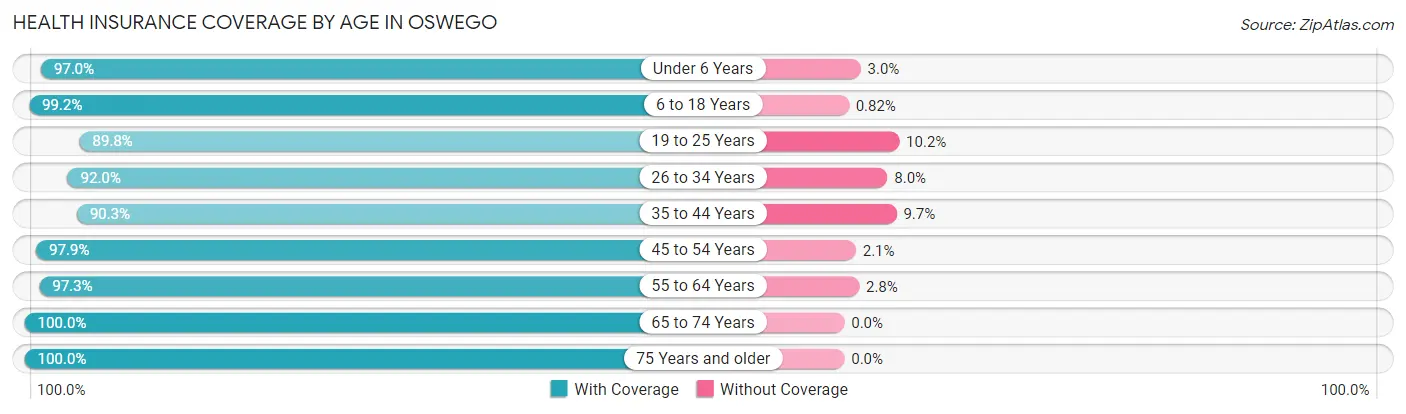
| Age Bracket | With Coverage | Without Coverage |
| Under 6 Years | 988 (97.0%) | 31 (3.0%) |
| 6 to 18 Years | 3,015 (99.2%) | 25 (0.8%) |
| 19 to 25 Years | 2,124 (89.8%) | 242 (10.2%) |
| 26 to 34 Years | 1,694 (92.0%) | 148 (8.0%) |
| 35 to 44 Years | 1,661 (90.3%) | 179 (9.7%) |
| 45 to 54 Years | 1,734 (97.9%) | 38 (2.1%) |
| 55 to 64 Years | 1,948 (97.3%) | 55 (2.8%) |
| 65 to 74 Years | 1,485 (100.0%) | 0 (0.0%) |
| 75 Years and older | 1,248 (100.0%) | 0 (0.0%) |
| Total | 15,897 (95.7%) | 718 (4.3%) |
Health Insurance Coverage by Citizenship Status in Oswego
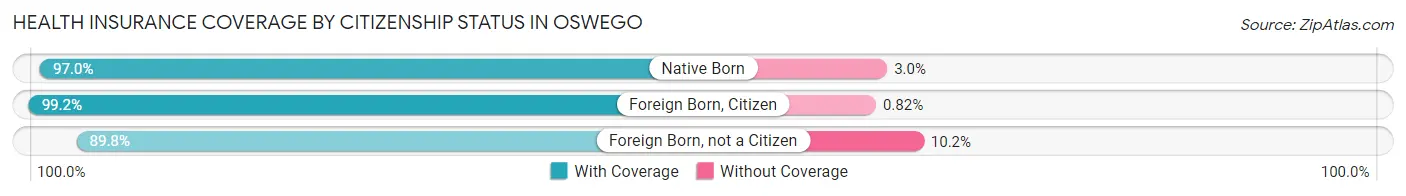
| Citizenship Status | With Coverage | Without Coverage |
| Native Born | 988 (97.0%) | 31 (3.0%) |
| Foreign Born, Citizen | 3,015 (99.2%) | 25 (0.8%) |
| Foreign Born, not a Citizen | 2,124 (89.8%) | 242 (10.2%) |
Health Insurance Coverage by Household Income in Oswego
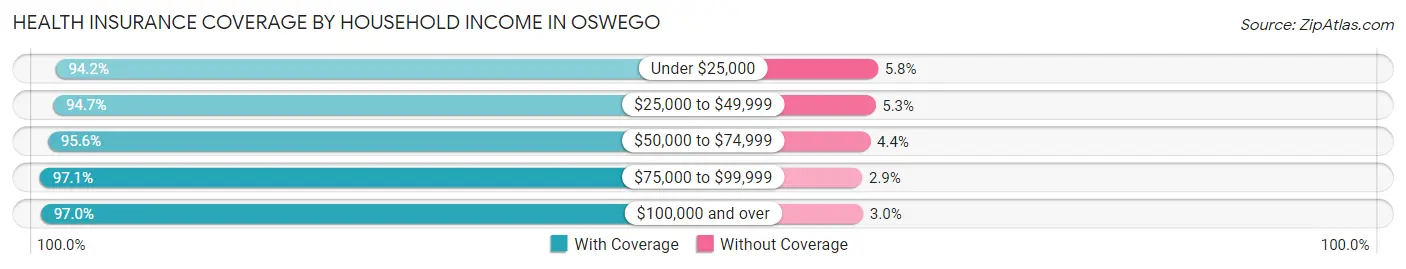
| Household Income | With Coverage | Without Coverage |
| Under $25,000 | 3,419 (94.2%) | 211 (5.8%) |
| $25,000 to $49,999 | 3,299 (94.7%) | 186 (5.3%) |
| $50,000 to $74,999 | 2,480 (95.6%) | 113 (4.4%) |
| $75,000 to $99,999 | 2,245 (97.1%) | 66 (2.9%) |
| $100,000 and over | 4,169 (97.0%) | 130 (3.0%) |
Public vs Private Health Insurance Coverage by Age in Oswego
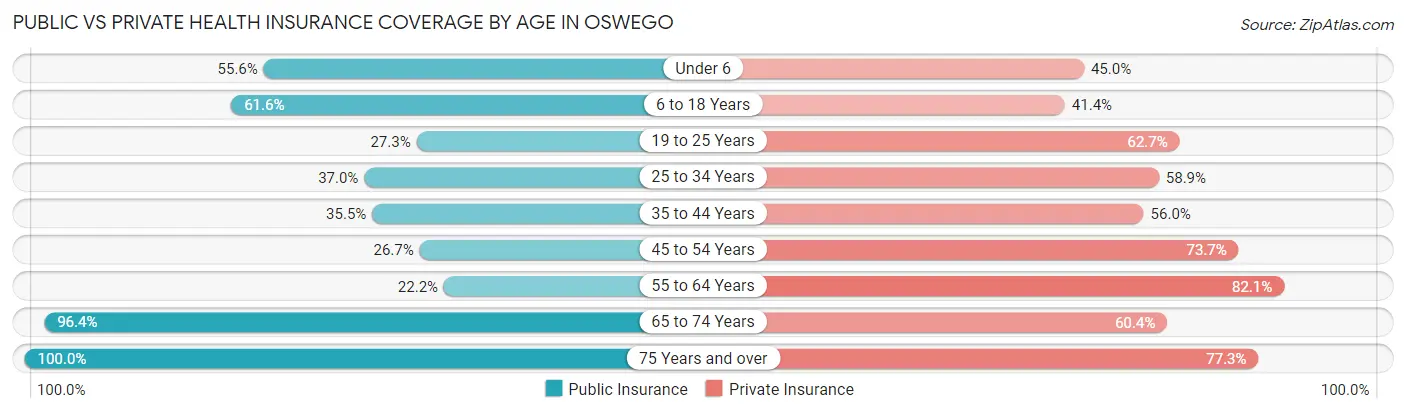
| Age Bracket | Public Insurance | Private Insurance |
| Under 6 | 567 (55.6%) | 458 (45.0%) |
| 6 to 18 Years | 1,874 (61.6%) | 1,259 (41.4%) |
| 19 to 25 Years | 645 (27.3%) | 1,483 (62.7%) |
| 25 to 34 Years | 681 (37.0%) | 1,084 (58.9%) |
| 35 to 44 Years | 653 (35.5%) | 1,031 (56.0%) |
| 45 to 54 Years | 473 (26.7%) | 1,305 (73.7%) |
| 55 to 64 Years | 444 (22.2%) | 1,644 (82.1%) |
| 65 to 74 Years | 1,431 (96.4%) | 897 (60.4%) |
| 75 Years and over | 1,248 (100.0%) | 965 (77.3%) |
| Total | 8,016 (48.2%) | 10,126 (60.9%) |
Disability Status by Sex by Age in Oswego
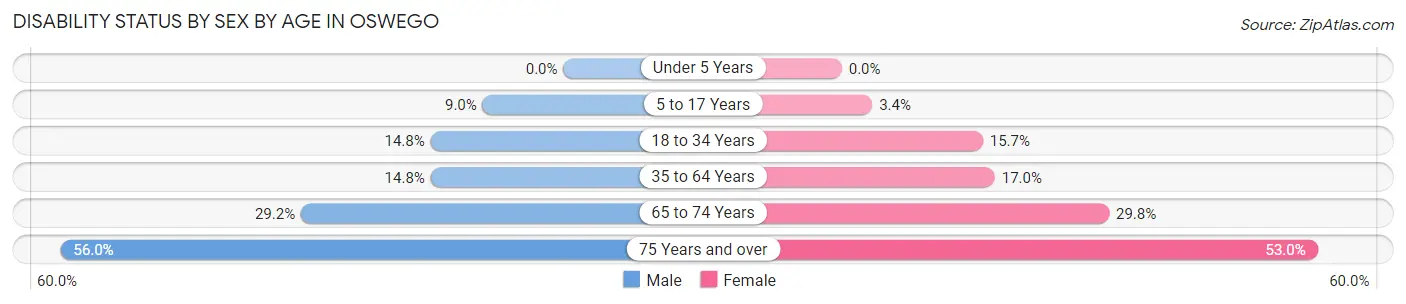
| Age Bracket | Male | Female |
| Under 5 Years | 0 (0.0%) | 0 (0.0%) |
| 5 to 17 Years | 143 (9.0%) | 49 (3.4%) |
| 18 to 34 Years | 359 (14.8%) | 313 (15.7%) |
| 35 to 64 Years | 417 (14.8%) | 476 (17.0%) |
| 65 to 74 Years | 213 (29.2%) | 225 (29.8%) |
| 75 Years and over | 219 (56.0%) | 454 (53.0%) |
Disability Class by Sex by Age in Oswego
Disability Class: Hearing Difficulty
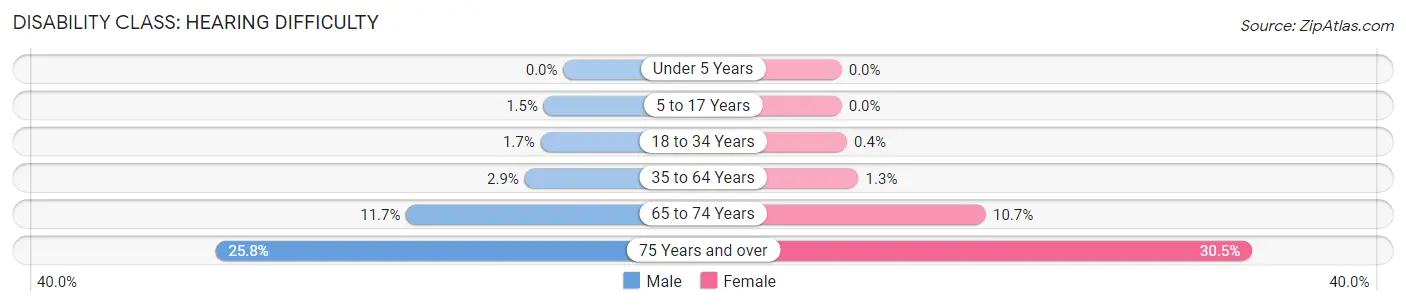
| Age Bracket | Male | Female |
| Under 5 Years | 0 (0.0%) | 0 (0.0%) |
| 5 to 17 Years | 23 (1.5%) | 0 (0.0%) |
| 18 to 34 Years | 41 (1.7%) | 8 (0.4%) |
| 35 to 64 Years | 81 (2.9%) | 35 (1.3%) |
| 65 to 74 Years | 85 (11.7%) | 81 (10.7%) |
| 75 Years and over | 101 (25.8%) | 261 (30.5%) |
Disability Class: Vision Difficulty
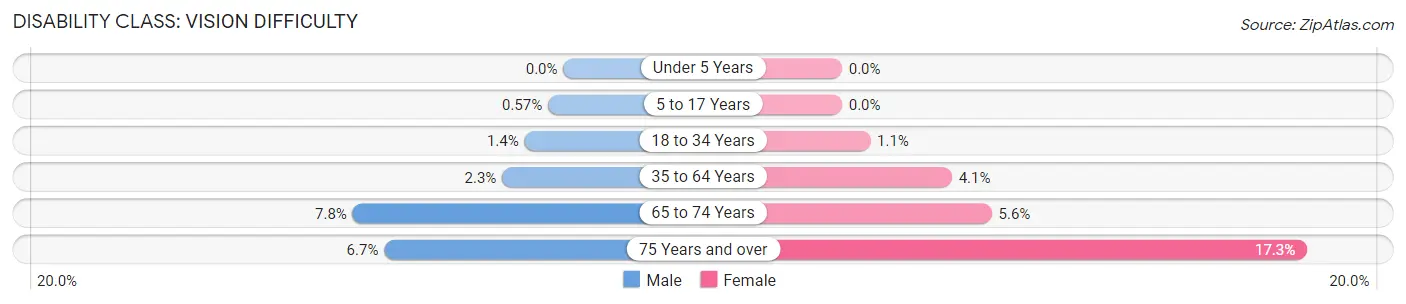
| Age Bracket | Male | Female |
| Under 5 Years | 0 (0.0%) | 0 (0.0%) |
| 5 to 17 Years | 9 (0.6%) | 0 (0.0%) |
| 18 to 34 Years | 35 (1.4%) | 21 (1.1%) |
| 35 to 64 Years | 64 (2.3%) | 114 (4.1%) |
| 65 to 74 Years | 57 (7.8%) | 42 (5.6%) |
| 75 Years and over | 26 (6.7%) | 148 (17.3%) |
Disability Class: Cognitive Difficulty
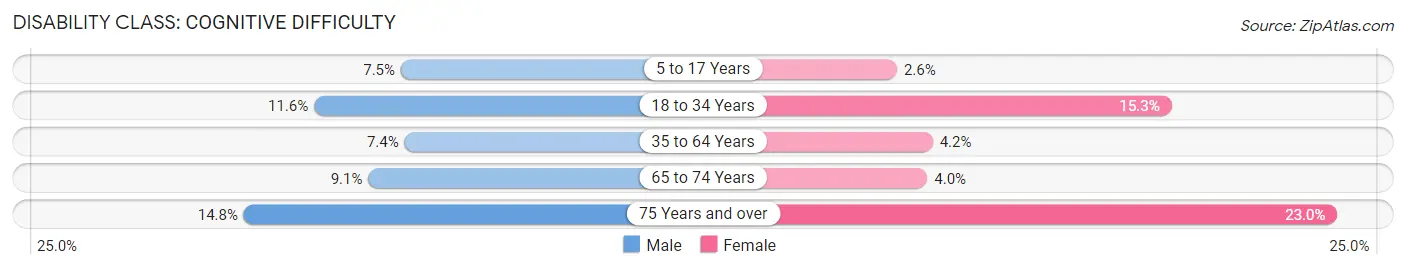
| Age Bracket | Male | Female |
| 5 to 17 Years | 120 (7.5%) | 37 (2.6%) |
| 18 to 34 Years | 281 (11.6%) | 305 (15.3%) |
| 35 to 64 Years | 208 (7.4%) | 118 (4.2%) |
| 65 to 74 Years | 66 (9.0%) | 30 (4.0%) |
| 75 Years and over | 58 (14.8%) | 197 (23.0%) |
Disability Class: Ambulatory Difficulty
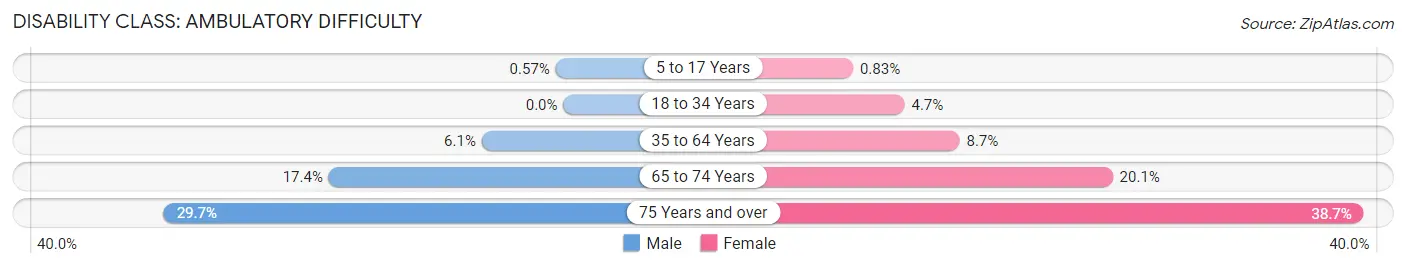
| Age Bracket | Male | Female |
| 5 to 17 Years | 9 (0.6%) | 12 (0.8%) |
| 18 to 34 Years | 0 (0.0%) | 93 (4.7%) |
| 35 to 64 Years | 171 (6.1%) | 244 (8.7%) |
| 65 to 74 Years | 127 (17.4%) | 152 (20.1%) |
| 75 Years and over | 116 (29.7%) | 332 (38.7%) |
Disability Class: Self-Care Difficulty
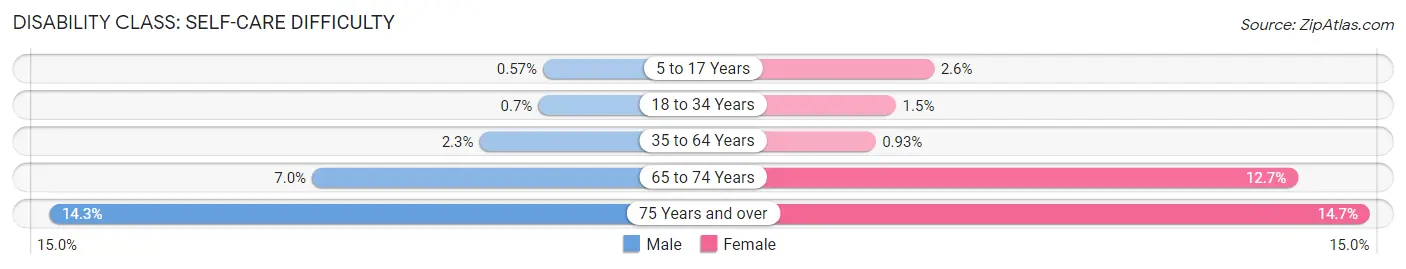
| Age Bracket | Male | Female |
| 5 to 17 Years | 9 (0.6%) | 37 (2.6%) |
| 18 to 34 Years | 17 (0.7%) | 30 (1.5%) |
| 35 to 64 Years | 66 (2.3%) | 26 (0.9%) |
| 65 to 74 Years | 51 (7.0%) | 96 (12.7%) |
| 75 Years and over | 56 (14.3%) | 126 (14.7%) |
Technology Access in Oswego
Computing Device Access in Oswego
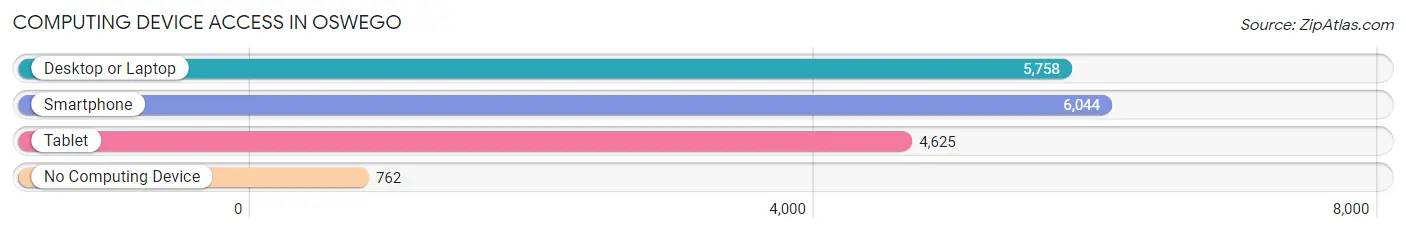
| Device Type | # Households | % Households |
| Desktop or Laptop | 5,758 | 78.3% |
| Smartphone | 6,044 | 82.2% |
| Tablet | 4,625 | 62.9% |
| No Computing Device | 762 | 10.4% |
| Total | 7,353 | 100.0% |
Internet Access in Oswego
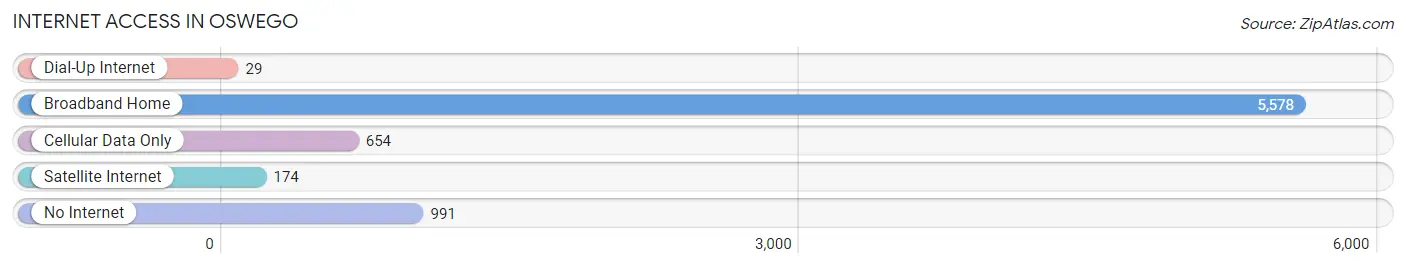
| Internet Type | # Households | % Households |
| Dial-Up Internet | 29 | 0.4% |
| Broadband Home | 5,578 | 75.9% |
| Cellular Data Only | 654 | 8.9% |
| Satellite Internet | 174 | 2.4% |
| No Internet | 991 | 13.5% |
| Total | 7,353 | 100.0% |
Oswego Summary
Oswego, NY is a city located in Oswego County, New York, United States. It is situated on the eastern shore of Lake Ontario, at the mouth of the Oswego River. The city has a population of 18,142 as of the 2010 census.
History
The area around Oswego was first settled by Europeans in the late 17th century. The first settlers were French fur traders who established trading posts in the area. The area was later settled by British colonists in the late 18th century. The city of Oswego was founded in 1798 and incorporated in 1848.
Oswego was an important port city during the 19th century. It was a major center for shipping and transportation, and was home to several shipbuilding companies. The city was also an important center for the iron and steel industry.
During the American Civil War, Oswego was a major supply center for the Union Army. The city was also the site of several battles during the war, including the Battle of Oswego in 1863.
Geography
Oswego is located in Oswego County, New York, at the mouth of the Oswego River. The city is situated on the eastern shore of Lake Ontario, about 40 miles north of Syracuse. The city has a total area of 8.2 square miles, of which 7.9 square miles is land and 0.3 square miles is water.
Oswego has a humid continental climate, with cold, snowy winters and warm, humid summers. The average annual temperature is 43.2°F, and the average annual precipitation is 37.2 inches.
Economy
Oswego’s economy is largely based on manufacturing and tourism. The city is home to several manufacturing companies, including Novelis, a global aluminum producer, and Oswego Industries, a manufacturer of industrial and commercial products.
Oswego is also a popular tourist destination. The city is home to several attractions, including Fort Ontario State Historic Site, the H. Lee White Maritime Museum, and the Oswego Harborfest.
Demographics
As of the 2010 census, the population of Oswego was 18,142. The racial makeup of the city was 92.3% White, 3.3% African American, 0.7% Native American, 0.9% Asian, 0.1% Pacific Islander, and 2.7% from other races. The median household income was $37,945, and the median family income was $45,945.
Oswego is home to several educational institutions, including the State University of New York at Oswego, Oswego City School District, and Oswego County BOCES. The city is also home to several churches, including the First United Methodist Church, St. Paul’s Episcopal Church, and the Church of the Nazarene.
Common Questions
What is the Total Population of Oswego?
Total Population of Oswego is 17,092.
What is the Total Male Population of Oswego?
Total Male Population of Oswego is 8,627.
What is the Total Female Population of Oswego?
Total Female Population of Oswego is 8,465.
What is the Ratio of Males per 100 Females in Oswego?
There are 101.91 Males per 100 Females in Oswego.
What is the Ratio of Females per 100 Males in Oswego?
There are 98.12 Females per 100 Males in Oswego.
What is the Median Population Age in Oswego?
Median Population Age in Oswego is 35.7 Years.
What is the Average Family Size in Oswego
Average Family Size in Oswego is 3.0 People.
What is the Average Household Size in Oswego
Average Household Size in Oswego is 2.2 People.
What is Per Capita Income in Oswego?
Per Capita income in Oswego is $30,310.
What is the Median Family Income in Oswego?
Median Family Income in Oswego is $70,833.
What is the Median Household income in Oswego?
Median Household Income in Oswego is $50,266.
What is Income or Wage Gap in Oswego?
Income or Wage Gap in Oswego is 19.4%.
Women in Oswego earn 80.6 cents for every dollar earned by a man.
What is Family Income Deficit in Oswego?
Family Income Deficit in Oswego is $14,266.
Families that are below poverty line in Oswego earn $14,266 less on average than the poverty threshold level.
What is Inequality or Gini Index in Oswego?
Inequality or Gini Index in Oswego is 0.47.
How Large is the Labor Force in Oswego?
There are 8,297 People in the Labor Forcein in Oswego.
What is the Percentage of People in the Labor Force in Oswego?
60.0% of People are in the Labor Force in Oswego.
What is the Unemployment Rate in Oswego?
Unemployment Rate in Oswego is 10.7%.