Woodstock, NY
Woodstock Map
Woodstock Overview
2,873
TOTAL POPULATION
1,545
MALE POPULATION
1,328
FEMALE POPULATION
116.34
MALES / 100 FEMALES
85.95
FEMALES / 100 MALES
61.3
MEDIAN AGE
2.6
AVG FAMILY SIZE
1.9
AVG HOUSEHOLD SIZE
$61,386
PER CAPITA INCOME
$96,131
AVG FAMILY INCOME
$50,938
AVG HOUSEHOLD INCOME
41.6%
WAGE / INCOME GAP [ % ]
58.4¢/ $1
WAGE / INCOME GAP [ $ ]
0.61
INEQUALITY / GINI INDEX
1,219
LABOR FORCE [ PEOPLE ]
48.2%
PERCENT IN LABOR FORCE
8.0%
UNEMPLOYMENT RATE
Woodstock Zip Codes
Woodstock Area Codes
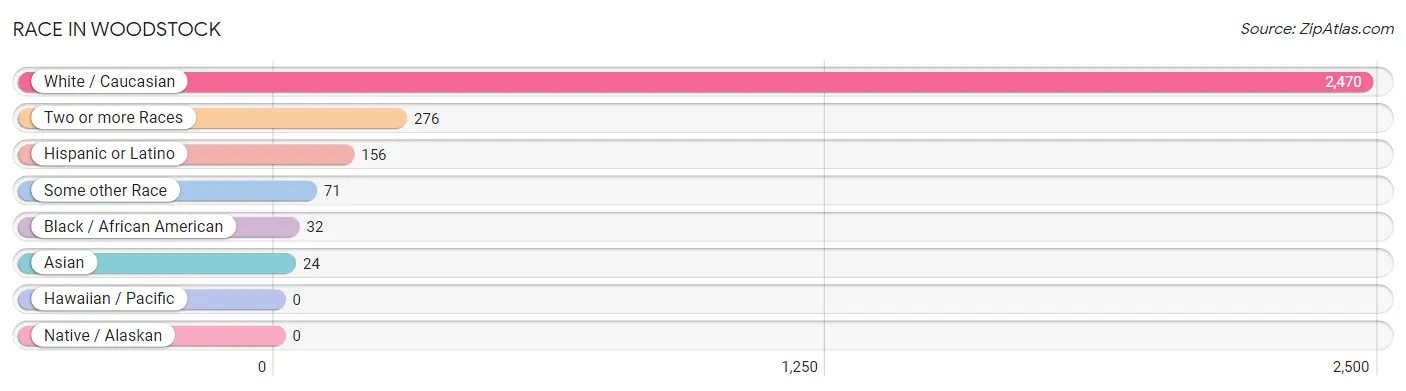
Race in Woodstock
The most populous races in Woodstock are White / Caucasian (2,470 | 86.0%), Two or more Races (276 | 9.6%), and Hispanic or Latino (156 | 5.4%).
| Race | # Population | % Population |
| Asian | 24 | 0.8% |
| Black / African American | 32 | 1.1% |
| Hawaiian / Pacific | 0 | 0.0% |
| Hispanic or Latino | 156 | 5.4% |
| Native / Alaskan | 0 | 0.0% |
| White / Caucasian | 2,470 | 86.0% |
| Two or more Races | 276 | 9.6% |
| Some other Race | 71 | 2.5% |
| Total | 2,873 | 100.0% |
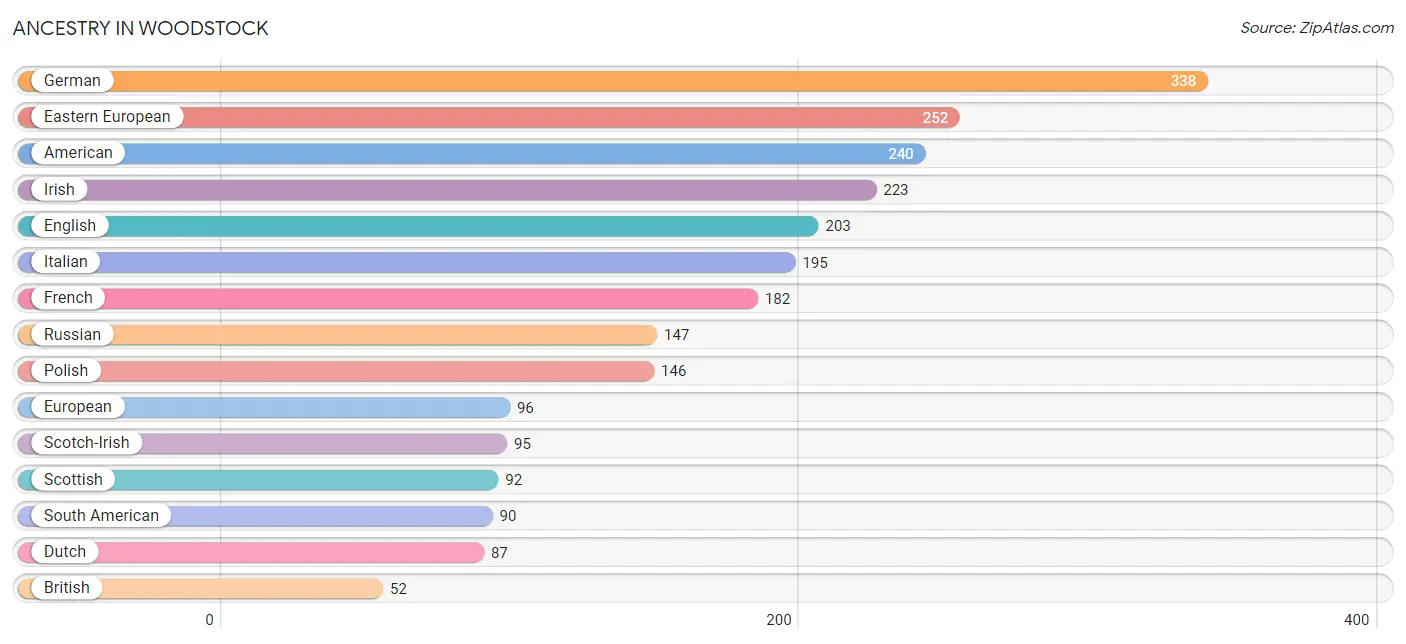
Ancestry in Woodstock
The most populous ancestries reported in Woodstock are German (338 | 11.8%), Eastern European (252 | 8.8%), American (240 | 8.4%), Irish (223 | 7.8%), and English (203 | 7.1%), together accounting for 43.7% of all Woodstock residents.
| Ancestry | # Population | % Population |
| American | 240 | 8.4% |
| Arab | 34 | 1.2% |
| Austrian | 10 | 0.4% |
| British | 52 | 1.8% |
| Burmese | 6 | 0.2% |
| Cambodian | 6 | 0.2% |
| Central American Indian | 8 | 0.3% |
| Colombian | 23 | 0.8% |
| Croatian | 30 | 1.0% |
| Cuban | 21 | 0.7% |
| Czech | 9 | 0.3% |
| Danish | 7 | 0.2% |
| Dutch | 87 | 3.0% |
| Eastern European | 252 | 8.8% |
| English | 203 | 7.1% |
| European | 96 | 3.3% |
| French | 182 | 6.3% |
| French American Indian | 5 | 0.2% |
| French Canadian | 17 | 0.6% |
| German | 338 | 11.8% |
| Greek | 5 | 0.2% |
| Hungarian | 27 | 0.9% |
| Indian (Asian) | 1 | 0.0% |
| Irish | 223 | 7.8% |
| Italian | 195 | 6.8% |
| Kenyan | 11 | 0.4% |
| Latvian | 26 | 0.9% |
| Lebanese | 34 | 1.2% |
| Lithuanian | 30 | 1.0% |
| Macedonian | 18 | 0.6% |
| Maltese | 6 | 0.2% |
| Peruvian | 42 | 1.5% |
| Polish | 146 | 5.1% |
| Portuguese | 19 | 0.7% |
| Puerto Rican | 25 | 0.9% |
| Russian | 147 | 5.1% |
| Scandinavian | 29 | 1.0% |
| Scotch-Irish | 95 | 3.3% |
| Scottish | 92 | 3.2% |
| Serbian | 30 | 1.0% |
| South American | 90 | 3.1% |
| Spaniard | 7 | 0.2% |
| Sri Lankan | 9 | 0.3% |
| Subsaharan African | 11 | 0.4% |
| Swedish | 7 | 0.2% |
| Swiss | 27 | 0.9% |
| Ukrainian | 18 | 0.6% |
| Venezuelan | 25 | 0.9% |
| Welsh | 22 | 0.8% | View All 49 Rows |
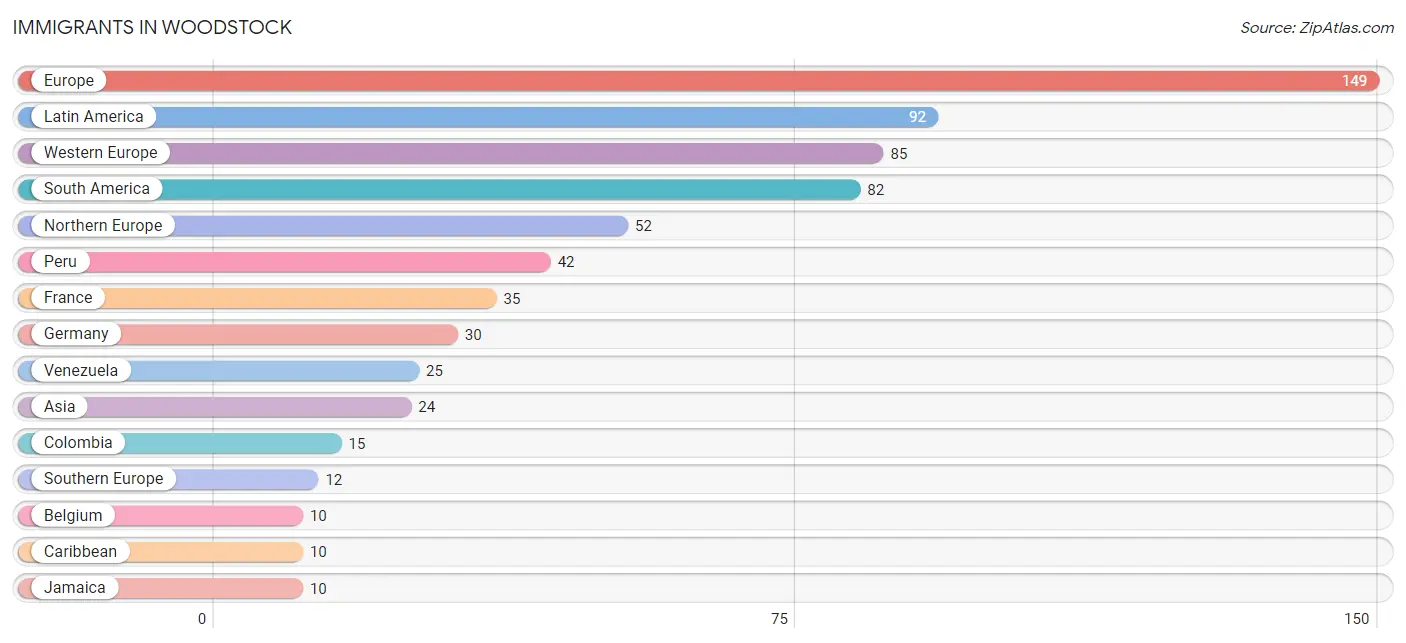
Immigrants in Woodstock
The most numerous immigrant groups reported in Woodstock came from Europe (149 | 5.2%), Latin America (92 | 3.2%), Western Europe (85 | 3.0%), South America (82 | 2.9%), and Northern Europe (52 | 1.8%), together accounting for 16.0% of all Woodstock residents.
| Immigration Origin | # Population | % Population |
| Africa | 9 | 0.3% |
| Asia | 24 | 0.8% |
| Belgium | 10 | 0.4% |
| Caribbean | 10 | 0.4% |
| China | 1 | 0.0% |
| Colombia | 15 | 0.5% |
| Eastern Africa | 9 | 0.3% |
| Eastern Asia | 7 | 0.2% |
| Eritrea | 9 | 0.3% |
| Europe | 149 | 5.2% |
| France | 35 | 1.2% |
| Germany | 30 | 1.0% |
| Greece | 5 | 0.2% |
| Ireland | 9 | 0.3% |
| Jamaica | 10 | 0.4% |
| Korea | 6 | 0.2% |
| Latin America | 92 | 3.2% |
| Nepal | 8 | 0.3% |
| Northern Europe | 52 | 1.8% |
| Oceania | 10 | 0.4% |
| Peru | 42 | 1.5% |
| Philippines | 9 | 0.3% |
| Scotland | 6 | 0.2% |
| South America | 82 | 2.9% |
| South Central Asia | 8 | 0.3% |
| South Eastern Asia | 9 | 0.3% |
| Southern Europe | 12 | 0.4% |
| Spain | 7 | 0.2% |
| Switzerland | 10 | 0.4% |
| Taiwan | 1 | 0.0% |
| Venezuela | 25 | 0.9% |
| Western Europe | 85 | 3.0% | View All 32 Rows |
Sex and Age in Woodstock
Sex and Age in Woodstock
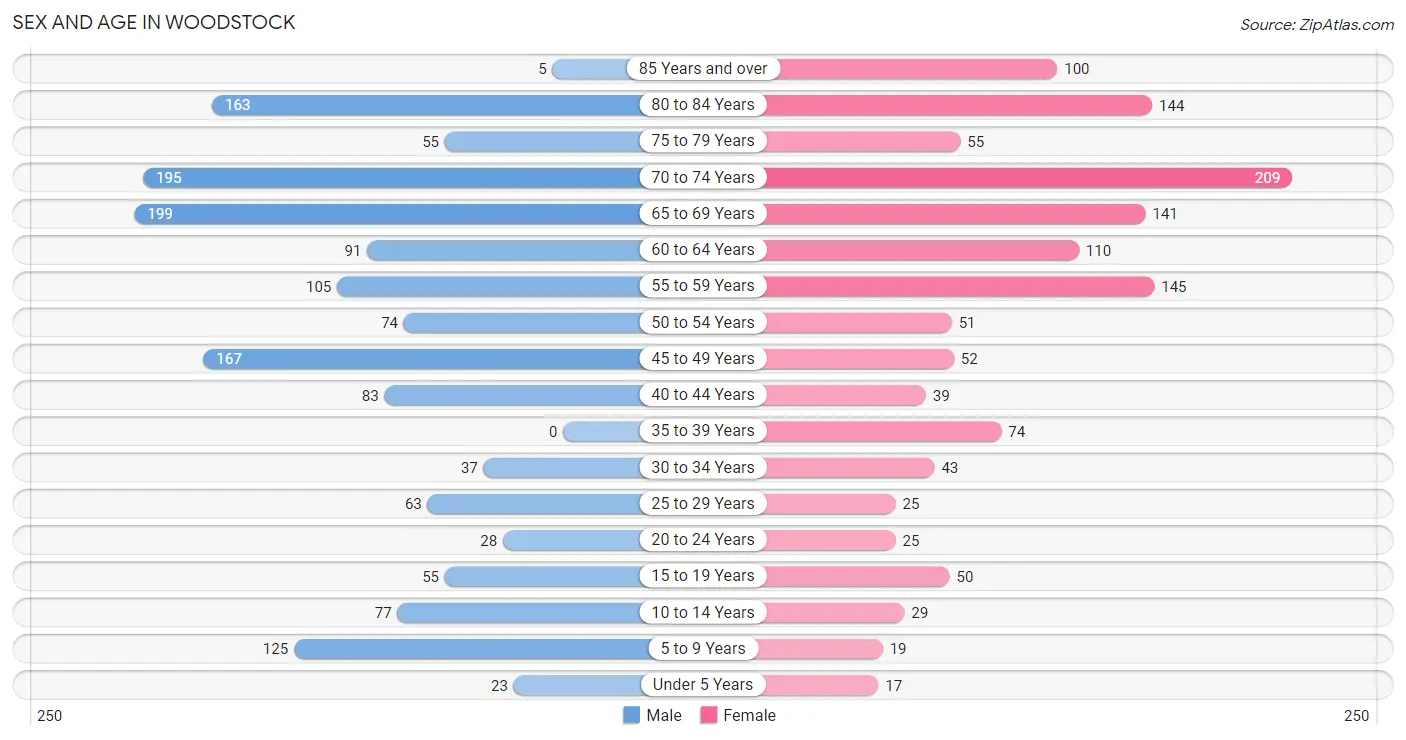
The most populous age groups in Woodstock are 65 to 69 Years (199 | 12.9%) for men and 70 to 74 Years (209 | 15.7%) for women.
| Age Bracket | Male | Female |
| Under 5 Years | 23 (1.5%) | 17 (1.3%) |
| 5 to 9 Years | 125 (8.1%) | 19 (1.4%) |
| 10 to 14 Years | 77 (5.0%) | 29 (2.2%) |
| 15 to 19 Years | 55 (3.6%) | 50 (3.8%) |
| 20 to 24 Years | 28 (1.8%) | 25 (1.9%) |
| 25 to 29 Years | 63 (4.1%) | 25 (1.9%) |
| 30 to 34 Years | 37 (2.4%) | 43 (3.2%) |
| 35 to 39 Years | 0 (0.0%) | 74 (5.6%) |
| 40 to 44 Years | 83 (5.4%) | 39 (2.9%) |
| 45 to 49 Years | 167 (10.8%) | 52 (3.9%) |
| 50 to 54 Years | 74 (4.8%) | 51 (3.8%) |
| 55 to 59 Years | 105 (6.8%) | 145 (10.9%) |
| 60 to 64 Years | 91 (5.9%) | 110 (8.3%) |
| 65 to 69 Years | 199 (12.9%) | 141 (10.6%) |
| 70 to 74 Years | 195 (12.6%) | 209 (15.7%) |
| 75 to 79 Years | 55 (3.6%) | 55 (4.1%) |
| 80 to 84 Years | 163 (10.5%) | 144 (10.8%) |
| 85 Years and over | 5 (0.3%) | 100 (7.5%) |
| Total | 1,545 (100.0%) | 1,328 (100.0%) |
Families and Households in Woodstock
Median Family Size in Woodstock
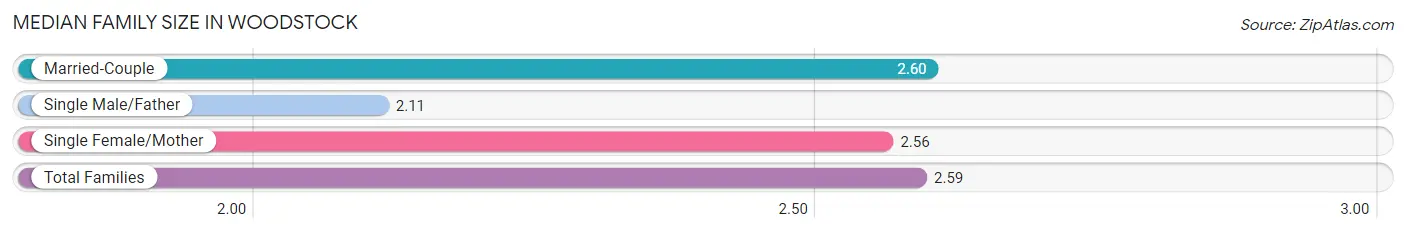
The median family size in Woodstock is 2.59 persons per family, with married-couple families (486 | 80.7%) accounting for the largest median family size of 2.6 persons per family. On the other hand, single male/father families (9 | 1.5%) represent the smallest median family size with 2.11 persons per family.
| Family Type | # Families | Family Size |
| Married-Couple | 486 (80.7%) | 2.60 |
| Single Male/Father | 9 (1.5%) | 2.11 |
| Single Female/Mother | 107 (17.8%) | 2.56 |
| Total Families | 602 (100.0%) | 2.59 |
Median Household Size in Woodstock
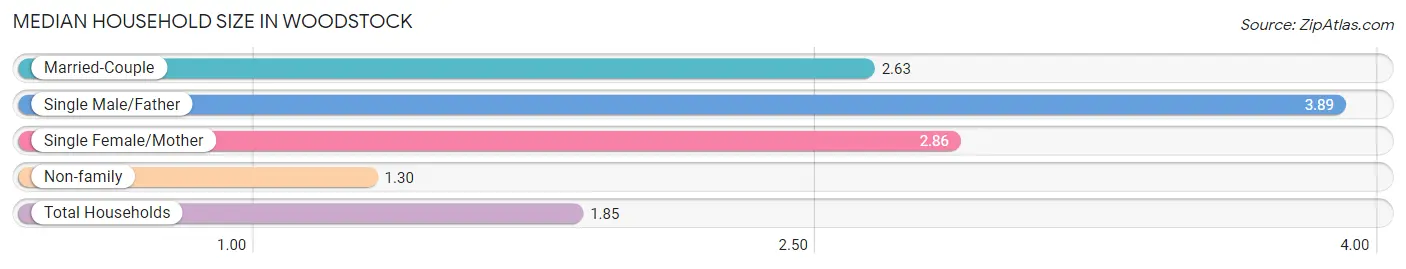
The median household size in Woodstock is 1.85 persons per household, with single male/father households (9 | 0.6%) accounting for the largest median household size of 3.89 persons per household. non-family households (910 | 60.2%) represent the smallest median household size with 1.30 persons per household.
| Household Type | # Households | Household Size |
| Married-Couple | 486 (32.1%) | 2.63 |
| Single Male/Father | 9 (0.6%) | 3.89 |
| Single Female/Mother | 107 (7.1%) | 2.86 |
| Non-family | 910 (60.2%) | 1.30 |
| Total Households | 1,512 (100.0%) | 1.85 |
Household Size by Marriage Status in Woodstock
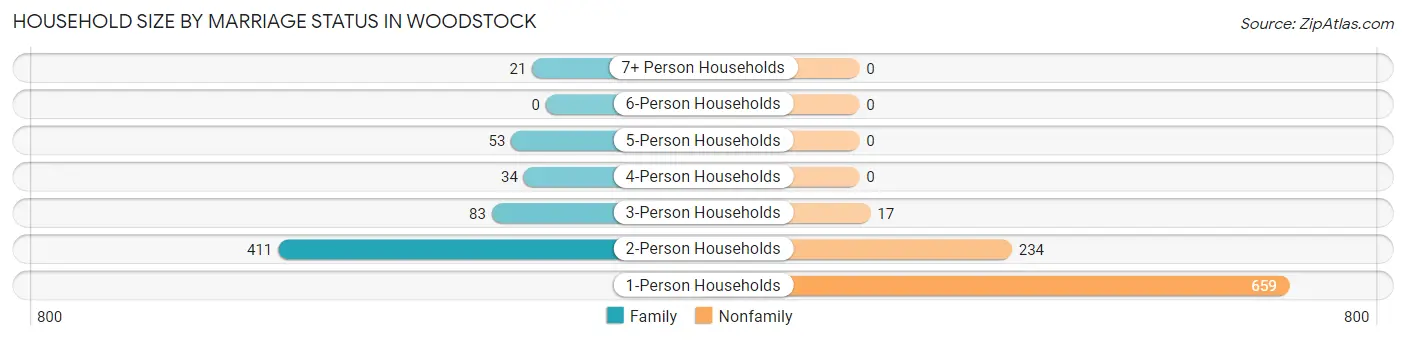
Out of a total of 1,512 households in Woodstock, 602 (39.8%) are family households, while 910 (60.2%) are nonfamily households. The most numerous type of family households are 2-person households, comprising 411, and the most common type of nonfamily households are 1-person households, comprising 659.
| Household Size | Family Households | Nonfamily Households |
| 1-Person Households | - | 659 (43.6%) |
| 2-Person Households | 411 (27.2%) | 234 (15.5%) |
| 3-Person Households | 83 (5.5%) | 17 (1.1%) |
| 4-Person Households | 34 (2.2%) | 0 (0.0%) |
| 5-Person Households | 53 (3.5%) | 0 (0.0%) |
| 6-Person Households | 0 (0.0%) | 0 (0.0%) |
| 7+ Person Households | 21 (1.4%) | 0 (0.0%) |
| Total | 602 (39.8%) | 910 (60.2%) |
Female Fertility in Woodstock
Fertility by Age in Woodstock
Average fertility rate in Woodstock is 75.0 births per 1,000 women. Women in the age bracket of 20 to 34 years have the highest fertility rate with 247.0 births per 1,000 women. Women in the age bracket of 20 to 34 years acount for 100.0% of all women with births.
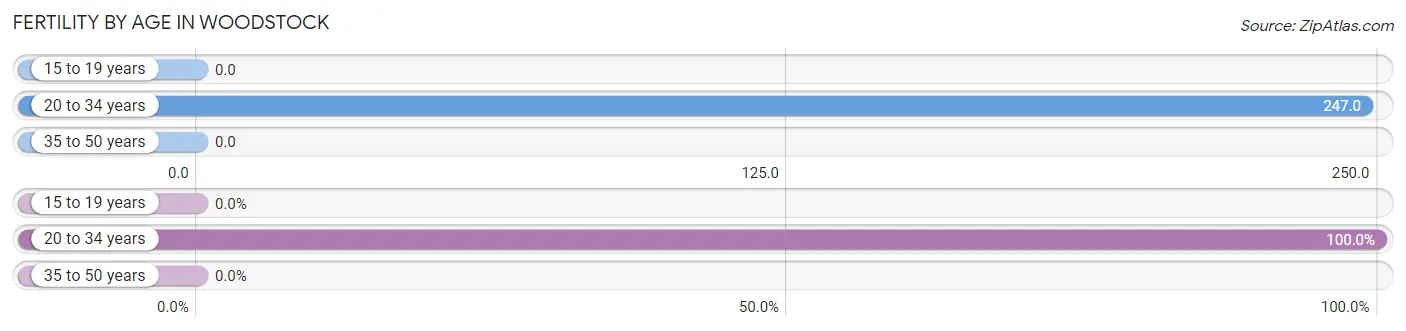
| Age Bracket | Women with Births | Births / 1,000 Women |
| 15 to 19 years | 0 (0.0%) | 0.0 |
| 20 to 34 years | 23 (100.0%) | 247.0 |
| 35 to 50 years | 0 (0.0%) | 0.0 |
| Total | 23 (100.0%) | 75.0 |
Fertility by Age by Marriage Status in Woodstock
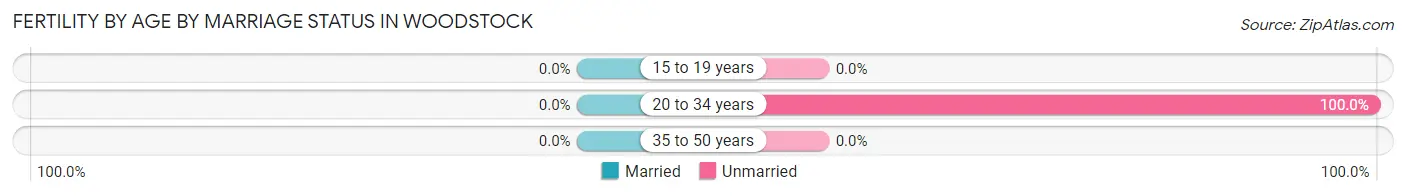
| Age Bracket | Married | Unmarried |
| 15 to 19 years | 0 (0.0%) | 0 (0.0%) |
| 20 to 34 years | 0 (0.0%) | 23 (100.0%) |
| 35 to 50 years | 0 (0.0%) | 0 (0.0%) |
| Total | 0 (0.0%) | 23 (100.0%) |
Fertility by Education in Woodstock
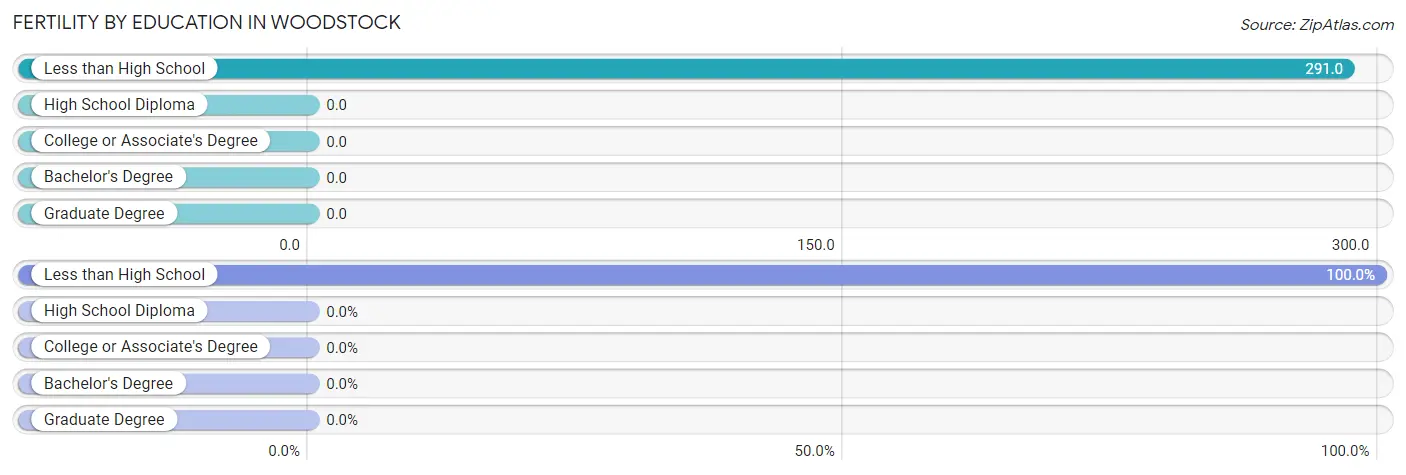
| Educational Attainment | Women with Births | Births / 1,000 Women |
| Less than High School | 23 (100.0%) | 291.0 |
| High School Diploma | 0 (0.0%) | 0.0 |
| College or Associate's Degree | 0 (0.0%) | 0.0 |
| Bachelor's Degree | 0 (0.0%) | 0.0 |
| Graduate Degree | 0 (0.0%) | 0.0 |
| Total | 23 (100.0%) | 75.0 |
Fertility by Education by Marriage Status in Woodstock
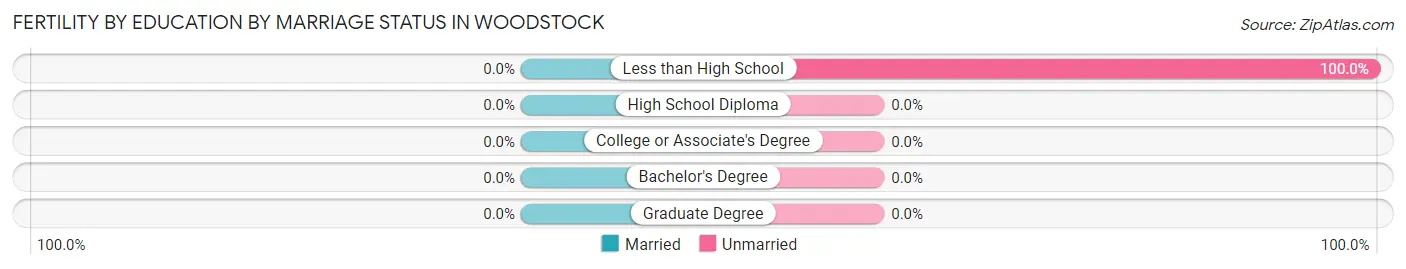
| Educational Attainment | Married | Unmarried |
| Less than High School | 0 (0.0%) | 23 (100.0%) |
| High School Diploma | 0 (0.0%) | 0 (0.0%) |
| College or Associate's Degree | 0 (0.0%) | 0 (0.0%) |
| Bachelor's Degree | 0 (0.0%) | 0 (0.0%) |
| Graduate Degree | 0 (0.0%) | 0 (0.0%) |
| Total | 0 (0.0%) | 23 (100.0%) |
Income in Woodstock
Income Overview in Woodstock
Per Capita Income in Woodstock is $61,386, while median incomes of families and households are $96,131 and $50,938 respectively.
| Characteristic | Number | Measure |
| Per Capita Income | 2,873 | $61,386 |
| Median Family Income | 602 | $96,131 |
| Mean Family Income | 602 | $165,837 |
| Median Household Income | 1,512 | $50,938 |
| Mean Household Income | 1,512 | $115,061 |
| Income Deficit | 602 | $0 |
| Wage / Income Gap (%) | 2,873 | 41.61% |
| Wage / Income Gap ($) | 2,873 | 58.39¢ per $1 |
| Gini / Inequality Index | 2,873 | 0.61 |
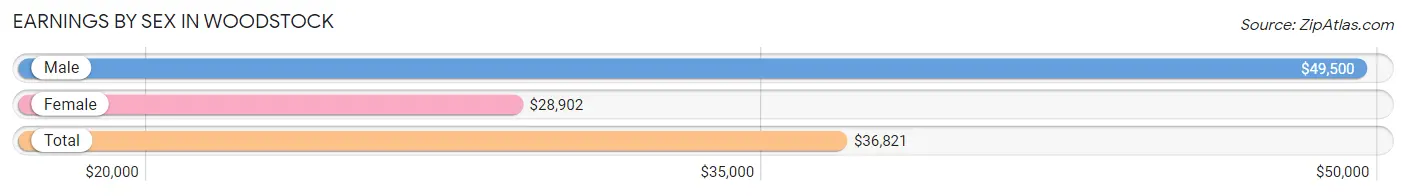
Earnings by Sex in Woodstock
Average Earnings in Woodstock are $36,821, $49,500 for men and $28,902 for women, a difference of 41.6%.
| Sex | Number | Average Earnings |
| Male | 594 (43.9%) | $49,500 |
| Female | 759 (56.1%) | $28,902 |
| Total | 1,353 (100.0%) | $36,821 |
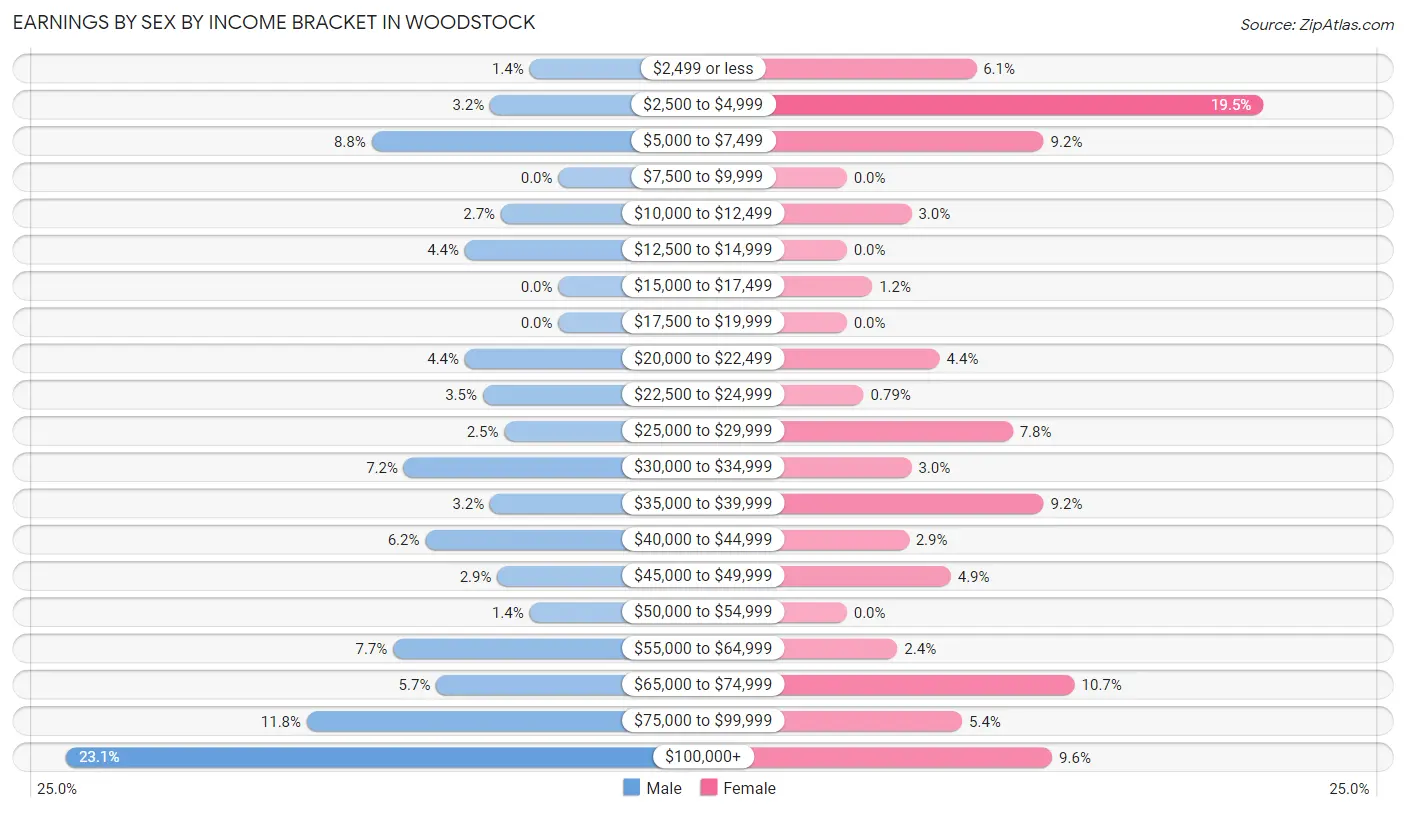
Earnings by Sex by Income Bracket in Woodstock
The most common earnings brackets in Woodstock are $100,000+ for men (137 | 23.1%) and $2,500 to $4,999 for women (148 | 19.5%).
| Income | Male | Female |
| $2,499 or less | 8 (1.3%) | 46 (6.1%) |
| $2,500 to $4,999 | 19 (3.2%) | 148 (19.5%) |
| $5,000 to $7,499 | 52 (8.7%) | 70 (9.2%) |
| $7,500 to $9,999 | 0 (0.0%) | 0 (0.0%) |
| $10,000 to $12,499 | 16 (2.7%) | 23 (3.0%) |
| $12,500 to $14,999 | 26 (4.4%) | 0 (0.0%) |
| $15,000 to $17,499 | 0 (0.0%) | 9 (1.2%) |
| $17,500 to $19,999 | 0 (0.0%) | 0 (0.0%) |
| $20,000 to $22,499 | 26 (4.4%) | 33 (4.3%) |
| $22,500 to $24,999 | 21 (3.5%) | 6 (0.8%) |
| $25,000 to $29,999 | 15 (2.5%) | 59 (7.8%) |
| $30,000 to $34,999 | 43 (7.2%) | 23 (3.0%) |
| $35,000 to $39,999 | 19 (3.2%) | 70 (9.2%) |
| $40,000 to $44,999 | 37 (6.2%) | 22 (2.9%) |
| $45,000 to $49,999 | 17 (2.9%) | 37 (4.9%) |
| $50,000 to $54,999 | 8 (1.3%) | 0 (0.0%) |
| $55,000 to $64,999 | 46 (7.7%) | 18 (2.4%) |
| $65,000 to $74,999 | 34 (5.7%) | 81 (10.7%) |
| $75,000 to $99,999 | 70 (11.8%) | 41 (5.4%) |
| $100,000+ | 137 (23.1%) | 73 (9.6%) |
| Total | 594 (100.0%) | 759 (100.0%) |
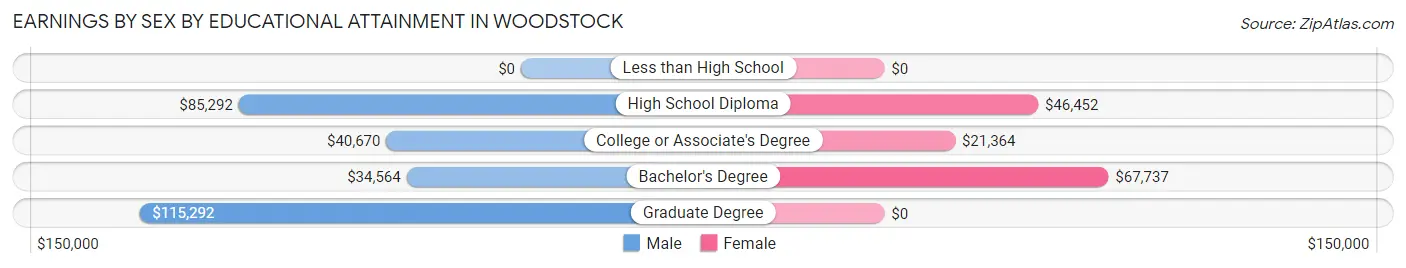
Earnings by Sex by Educational Attainment in Woodstock
Average earnings in Woodstock are $58,558 for men and $31,406 for women, a difference of 46.4%. Men with an educational attainment of graduate degree enjoy the highest average annual earnings of $115,292, while those with bachelor's degree education earn the least with $34,564. Women with an educational attainment of bachelor's degree earn the most with the average annual earnings of $67,737, while those with college or associate's degree education have the smallest earnings of $21,364.
| Educational Attainment | Male Income | Female Income |
| Less than High School | - | - |
| High School Diploma | $85,292 | $46,452 |
| College or Associate's Degree | $40,670 | $21,364 |
| Bachelor's Degree | $34,564 | $67,737 |
| Graduate Degree | $115,292 | $0 |
| Total | $58,558 | $31,406 |
Family Income in Woodstock
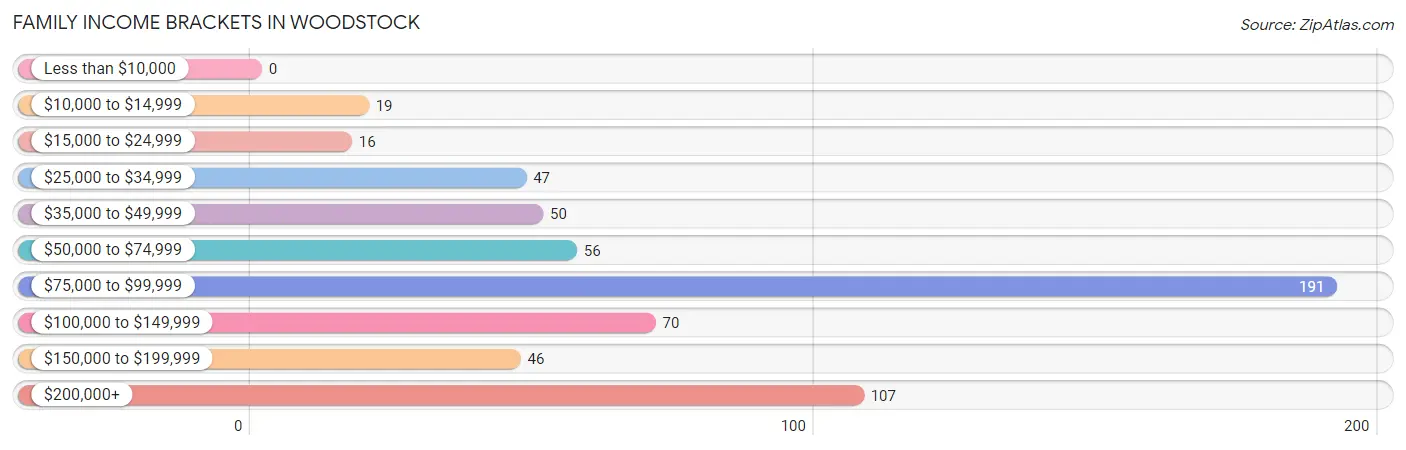
Family Income Brackets in Woodstock
According to the Woodstock family income data, there are 191 families falling into the $75,000 to $99,999 income range, which is the most common income bracket and makes up 31.7% of all families.
| Income Bracket | # Families | % Families |
| Less than $10,000 | 0 | 0.0% |
| $10,000 to $14,999 | 19 | 3.2% |
| $15,000 to $24,999 | 16 | 2.7% |
| $25,000 to $34,999 | 47 | 7.8% |
| $35,000 to $49,999 | 50 | 8.3% |
| $50,000 to $74,999 | 56 | 9.3% |
| $75,000 to $99,999 | 191 | 31.7% |
| $100,000 to $149,999 | 70 | 11.6% |
| $150,000 to $199,999 | 46 | 7.6% |
| $200,000+ | 107 | 17.8% |
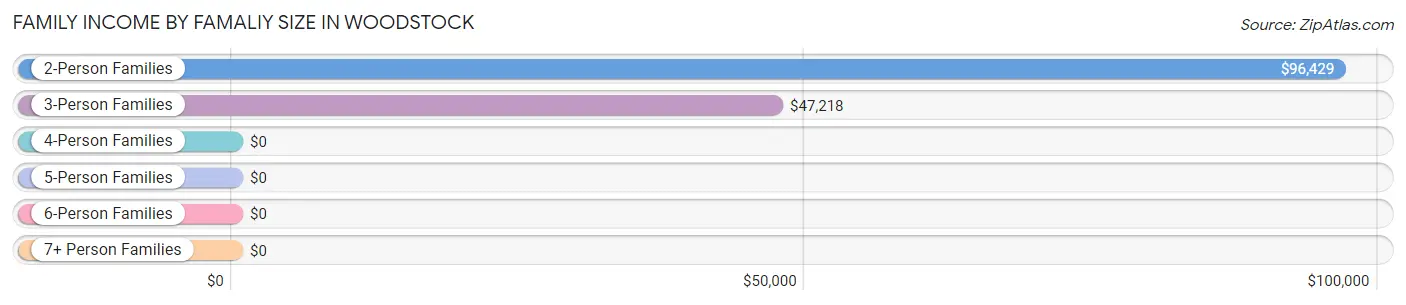
Family Income by Famaliy Size in Woodstock
2-person families (430 | 71.4%) account for the highest median family income in Woodstock with $96,429 per family, while 2-person families (430 | 71.4%) have the highest median income of $48,214 per family member.
| Income Bracket | # Families | Median Income |
| 2-Person Families | 430 (71.4%) | $96,429 |
| 3-Person Families | 73 (12.1%) | $47,218 |
| 4-Person Families | 50 (8.3%) | $0 |
| 5-Person Families | 28 (4.6%) | $0 |
| 6-Person Families | 0 (0.0%) | $0 |
| 7+ Person Families | 21 (3.5%) | $0 |
| Total | 602 (100.0%) | $96,131 |
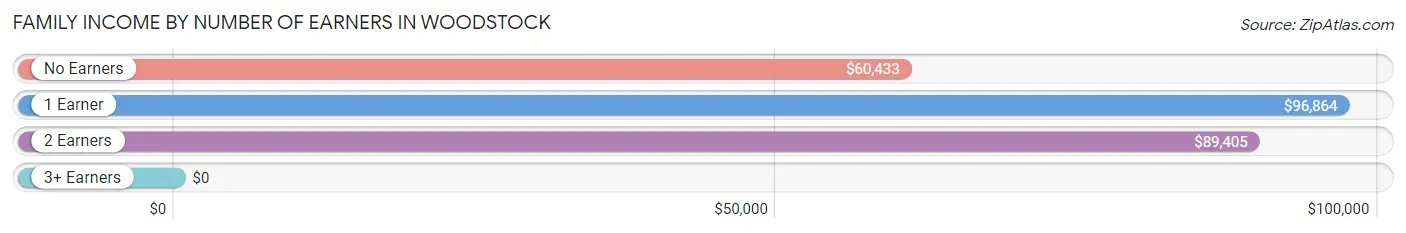
Family Income by Number of Earners in Woodstock
| Number of Earners | # Families | Median Income |
| No Earners | 107 (17.8%) | $60,433 |
| 1 Earner | 272 (45.2%) | $96,864 |
| 2 Earners | 212 (35.2%) | $89,405 |
| 3+ Earners | 11 (1.8%) | $0 |
| Total | 602 (100.0%) | $96,131 |
Household Income in Woodstock
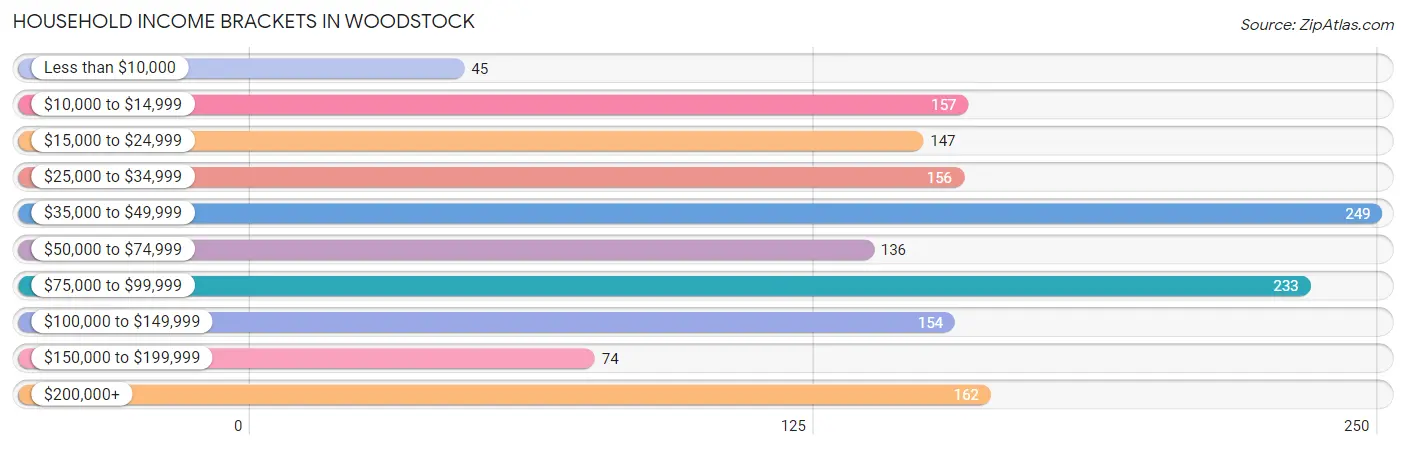
Household Income Brackets in Woodstock
With 249 households falling in the category, the $35,000 to $49,999 income range is the most frequent in Woodstock, accounting for 16.5% of all households. In contrast, only 45 households (3.0%) fall into the less than $10,000 income bracket, making it the least populous group.
| Income Bracket | # Households | % Households |
| Less than $10,000 | 45 | 3.0% |
| $10,000 to $14,999 | 157 | 10.4% |
| $15,000 to $24,999 | 147 | 9.7% |
| $25,000 to $34,999 | 156 | 10.3% |
| $35,000 to $49,999 | 249 | 16.5% |
| $50,000 to $74,999 | 136 | 9.0% |
| $75,000 to $99,999 | 233 | 15.4% |
| $100,000 to $149,999 | 154 | 10.2% |
| $150,000 to $199,999 | 74 | 4.9% |
| $200,000+ | 162 | 10.7% |
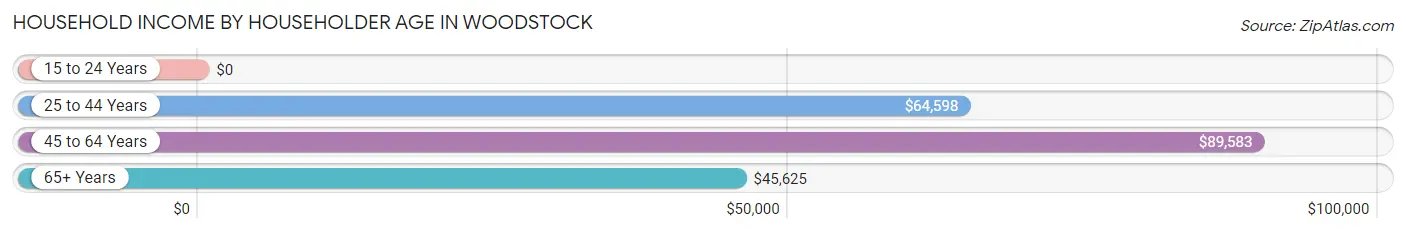
Household Income by Householder Age in Woodstock
The median household income in Woodstock is $50,938, with the highest median household income of $89,583 found in the 45 to 64 years age bracket for the primary householder. A total of 349 households (23.1%) fall into this category. Meanwhile, the 15 to 24 years age bracket for the primary householder has the lowest median household income of $0, with 25 households (1.7%) in this group.
| Income Bracket | # Households | Median Income |
| 15 to 24 Years | 25 (1.7%) | $0 |
| 25 to 44 Years | 219 (14.5%) | $64,598 |
| 45 to 64 Years | 349 (23.1%) | $89,583 |
| 65+ Years | 919 (60.8%) | $45,625 |
| Total | 1,512 (100.0%) | $50,938 |
Poverty in Woodstock
Income Below Poverty by Sex and Age in Woodstock
With 14.0% poverty level for males and 12.7% for females among the residents of Woodstock, under 5 year old males and 16 and 17 year old females are the most vulnerable to poverty, with 15 males (65.2%) and 11 females (100.0%) in their respective age groups living below the poverty level.
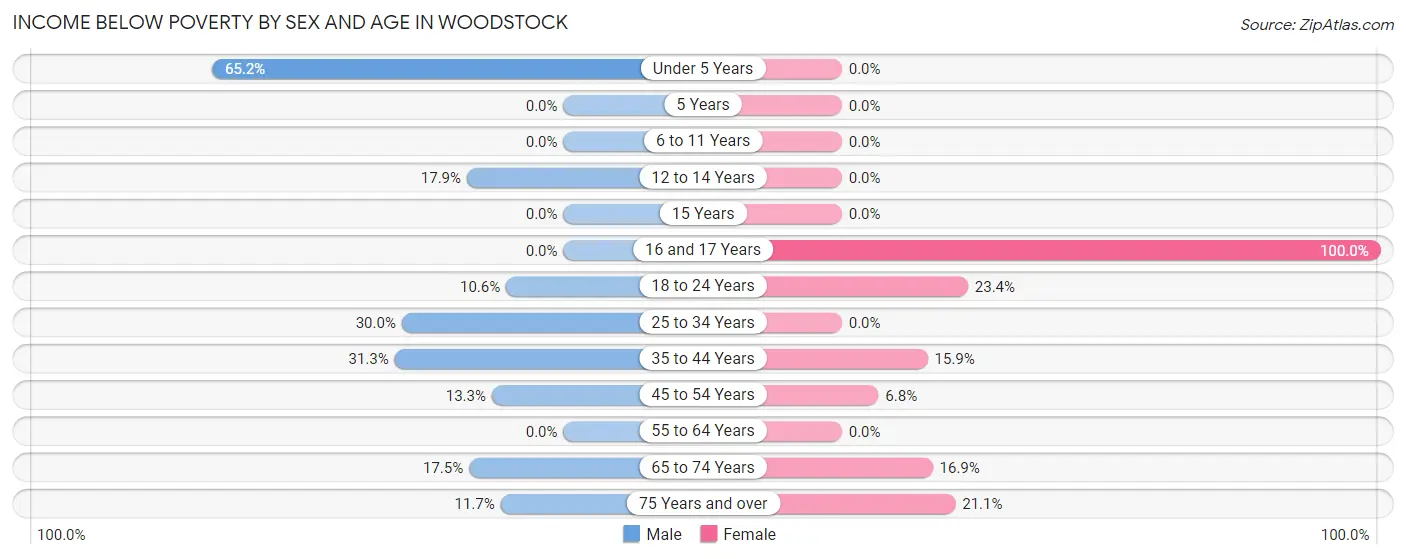
| Age Bracket | Male | Female |
| Under 5 Years | 15 (65.2%) | 0 (0.0%) |
| 5 Years | 0 (0.0%) | 0 (0.0%) |
| 6 to 11 Years | 0 (0.0%) | 0 (0.0%) |
| 12 to 14 Years | 12 (17.9%) | 0 (0.0%) |
| 15 Years | 0 (0.0%) | 0 (0.0%) |
| 16 and 17 Years | 0 (0.0%) | 11 (100.0%) |
| 18 to 24 Years | 5 (10.6%) | 11 (23.4%) |
| 25 to 34 Years | 30 (30.0%) | 0 (0.0%) |
| 35 to 44 Years | 26 (31.3%) | 18 (15.9%) |
| 45 to 54 Years | 32 (13.3%) | 7 (6.8%) |
| 55 to 64 Years | 0 (0.0%) | 0 (0.0%) |
| 65 to 74 Years | 69 (17.5%) | 59 (16.9%) |
| 75 Years and over | 26 (11.7%) | 63 (21.1%) |
| Total | 215 (14.0%) | 169 (12.7%) |
Income Above Poverty by Sex and Age in Woodstock
According to the poverty statistics in Woodstock, males aged 5 years and females aged under 5 years are the age groups that are most secure financially, with 100.0% of males and 100.0% of females in these age groups living above the poverty line.
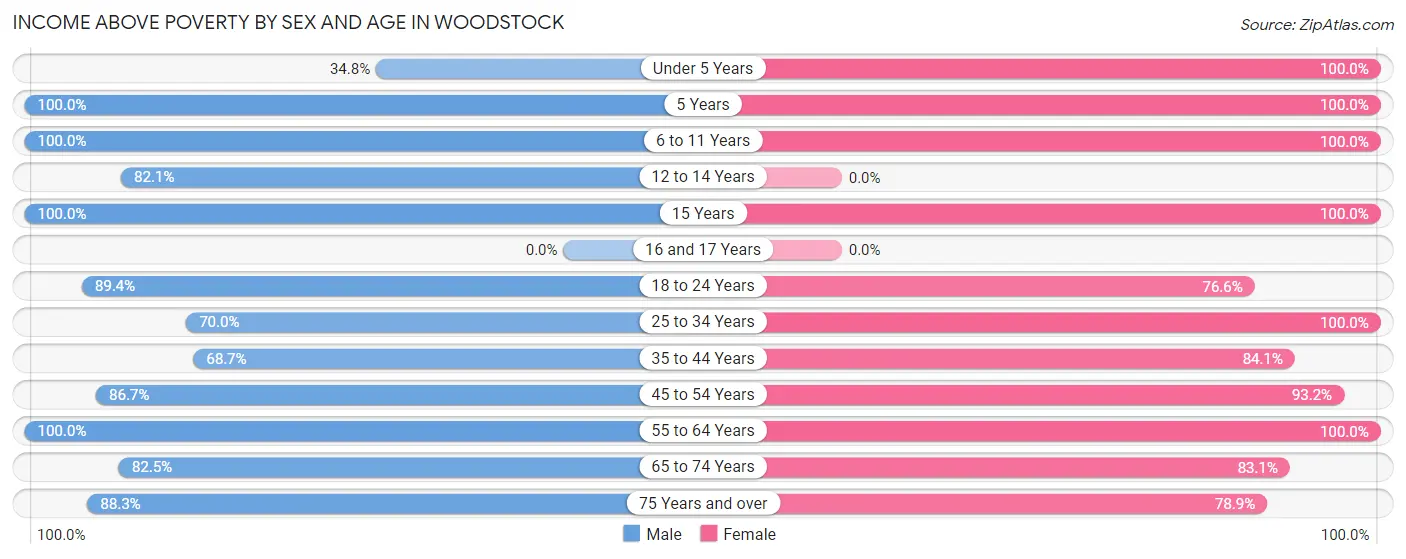
| Age Bracket | Male | Female |
| Under 5 Years | 8 (34.8%) | 17 (100.0%) |
| 5 Years | 10 (100.0%) | 8 (100.0%) |
| 6 to 11 Years | 115 (100.0%) | 40 (100.0%) |
| 12 to 14 Years | 55 (82.1%) | 0 (0.0%) |
| 15 Years | 36 (100.0%) | 17 (100.0%) |
| 16 and 17 Years | 0 (0.0%) | 0 (0.0%) |
| 18 to 24 Years | 42 (89.4%) | 36 (76.6%) |
| 25 to 34 Years | 70 (70.0%) | 68 (100.0%) |
| 35 to 44 Years | 57 (68.7%) | 95 (84.1%) |
| 45 to 54 Years | 209 (86.7%) | 96 (93.2%) |
| 55 to 64 Years | 196 (100.0%) | 255 (100.0%) |
| 65 to 74 Years | 325 (82.5%) | 291 (83.1%) |
| 75 Years and over | 197 (88.3%) | 236 (78.9%) |
| Total | 1,320 (86.0%) | 1,159 (87.3%) |
Income Below Poverty Among Married-Couple Families in Woodstock
The poverty statistics for married-couple families in Woodstock show that 3.9% or 19 of the total 486 families live below the poverty line. Families with no children have the highest poverty rate of 4.8%, comprising of 19 families. On the other hand, families with 1 or 2 children have the lowest poverty rate of 0.0%, which includes 0 families.
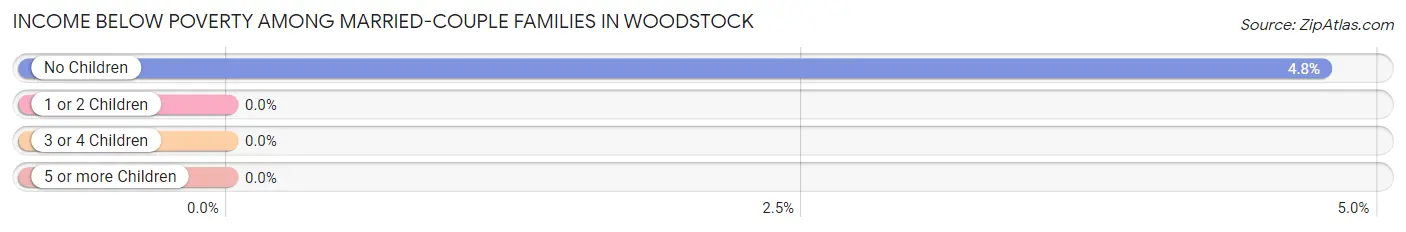
| Children | Above Poverty | Below Poverty |
| No Children | 380 (95.2%) | 19 (4.8%) |
| 1 or 2 Children | 38 (100.0%) | 0 (0.0%) |
| 3 or 4 Children | 28 (100.0%) | 0 (0.0%) |
| 5 or more Children | 21 (100.0%) | 0 (0.0%) |
| Total | 467 (96.1%) | 19 (3.9%) |
Income Below Poverty Among Single-Parent Households in Woodstock
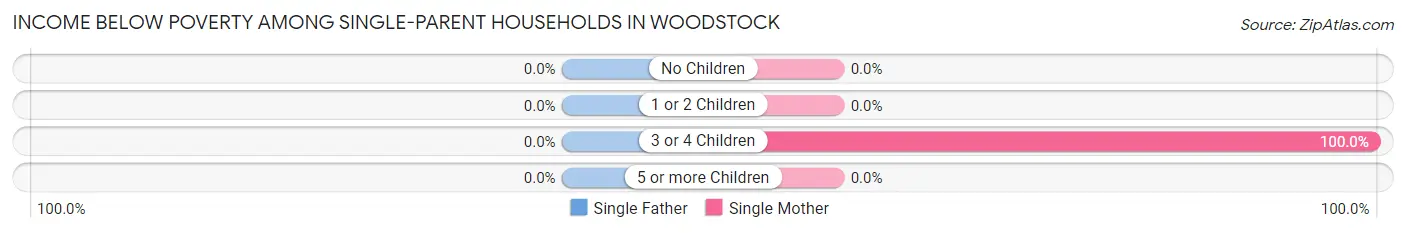
| Children | Single Father | Single Mother |
| No Children | 0 (0.0%) | 0 (0.0%) |
| 1 or 2 Children | 0 (0.0%) | 0 (0.0%) |
| 3 or 4 Children | 0 (0.0%) | 18 (100.0%) |
| 5 or more Children | 0 (0.0%) | 0 (0.0%) |
| Total | 0 (0.0%) | 18 (16.8%) |
Income Below Poverty Among Married-Couple vs Single-Parent Households in Woodstock
The poverty data for Woodstock shows that 19 of the married-couple family households (3.9%) and 18 of the single-parent households (15.5%) are living below the poverty level. Within the married-couple family households, those with no children have the highest poverty rate, with 19 households (4.8%) falling below the poverty line. Among the single-parent households, those with 3 or 4 children have the highest poverty rate, with 18 household (100.0%) living below poverty.
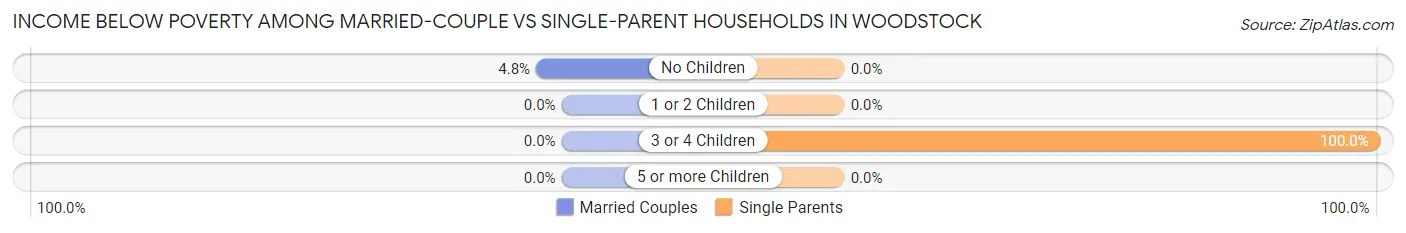
| Children | Married-Couple Families | Single-Parent Households |
| No Children | 19 (4.8%) | 0 (0.0%) |
| 1 or 2 Children | 0 (0.0%) | 0 (0.0%) |
| 3 or 4 Children | 0 (0.0%) | 18 (100.0%) |
| 5 or more Children | 0 (0.0%) | 0 (0.0%) |
| Total | 19 (3.9%) | 18 (15.5%) |
Employment Characteristics in Woodstock
Employment by Class of Employer in Woodstock
Among the 1,103 employed individuals in Woodstock, private company employees (390 | 35.4%), self-employed (not incorporated) (365 | 33.1%), and not-for-profit organizations (155 | 14.1%) make up the most common classes of employment.
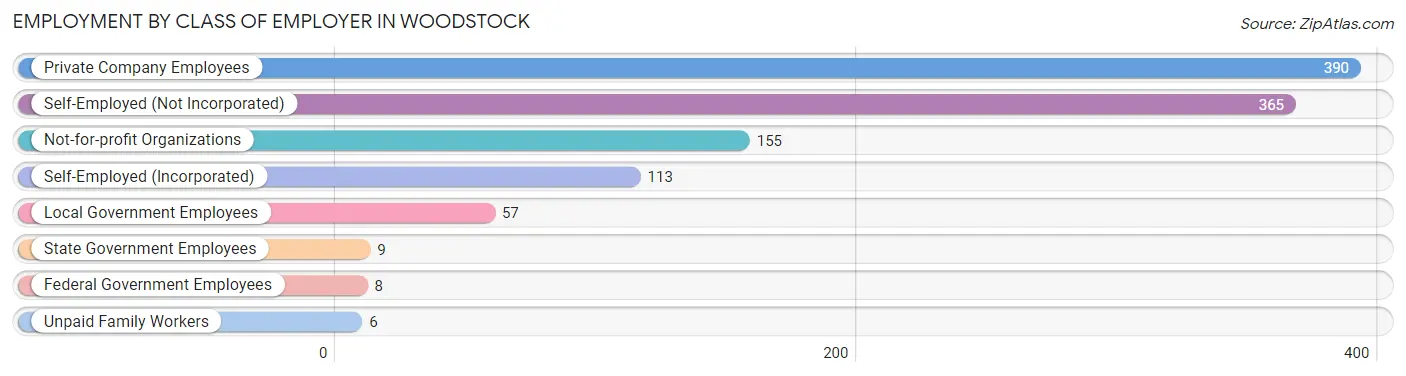
| Employer Class | # Employees | % Employees |
| Private Company Employees | 390 | 35.4% |
| Self-Employed (Incorporated) | 113 | 10.2% |
| Self-Employed (Not Incorporated) | 365 | 33.1% |
| Not-for-profit Organizations | 155 | 14.1% |
| Local Government Employees | 57 | 5.2% |
| State Government Employees | 9 | 0.8% |
| Federal Government Employees | 8 | 0.7% |
| Unpaid Family Workers | 6 | 0.5% |
| Total | 1,103 | 100.0% |
Employment Status by Age in Woodstock
According to the labor force statistics for Woodstock, out of the total population over 16 years of age (2,530), 48.2% or 1,219 individuals are in the labor force, with 8.0% or 98 of them unemployed. The age group with the highest labor force participation rate is 30 to 34 years, with 100.0% or 80 individuals in the labor force. Within the labor force, the 16 to 19 years age range has the highest percentage of unemployed individuals, with 73.2% or 30 of them being unemployed.
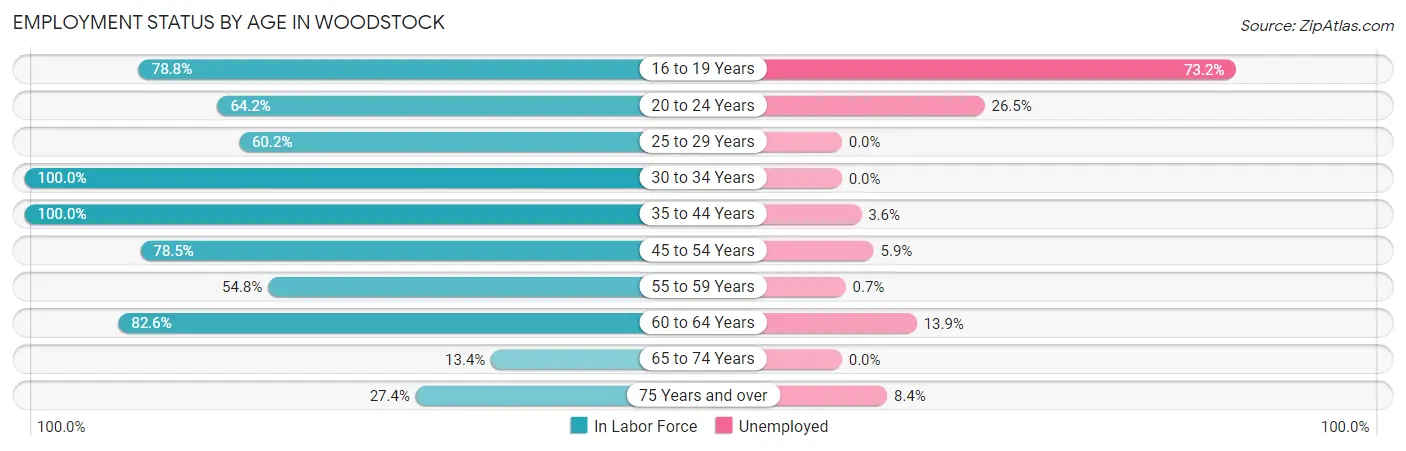
| Age Bracket | In Labor Force | Unemployed |
| 16 to 19 Years | 41 (78.8%) | 30 (73.2%) |
| 20 to 24 Years | 34 (64.2%) | 9 (26.5%) |
| 25 to 29 Years | 53 (60.2%) | 0 (0.0%) |
| 30 to 34 Years | 80 (100.0%) | 0 (0.0%) |
| 35 to 44 Years | 196 (100.0%) | 7 (3.6%) |
| 45 to 54 Years | 270 (78.5%) | 16 (5.9%) |
| 55 to 59 Years | 137 (54.8%) | 1 (0.7%) |
| 60 to 64 Years | 166 (82.6%) | 23 (13.9%) |
| 65 to 74 Years | 100 (13.4%) | 0 (0.0%) |
| 75 Years and over | 143 (27.4%) | 12 (8.4%) |
| Total | 1,219 (48.2%) | 98 (8.0%) |
Employment Status by Educational Attainment in Woodstock
According to labor force statistics for Woodstock, 77.8% of individuals (902) out of the total population between 25 and 64 years of age (1,159) are in the labor force, with 5.2% or 47 of them being unemployed. The group with the highest labor force participation rate are those with the educational attainment of college / associate degree, with 93.5% or 215 individuals in the labor force. Within the labor force, individuals with high school diploma education have the highest percentage of unemployment, with 14.7% or 23 of them being unemployed.
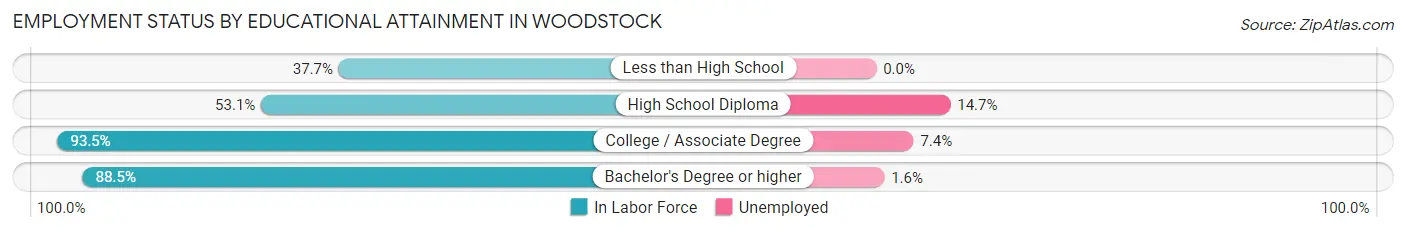
| Educational Attainment | In Labor Force | Unemployed |
| Less than High School | 23 (37.7%) | 0 (0.0%) |
| High School Diploma | 156 (53.1%) | 43 (14.7%) |
| College / Associate Degree | 215 (93.5%) | 17 (7.4%) |
| Bachelor's Degree or higher | 508 (88.5%) | 9 (1.6%) |
| Total | 902 (77.8%) | 60 (5.2%) |
Employment Occupations by Sex in Woodstock
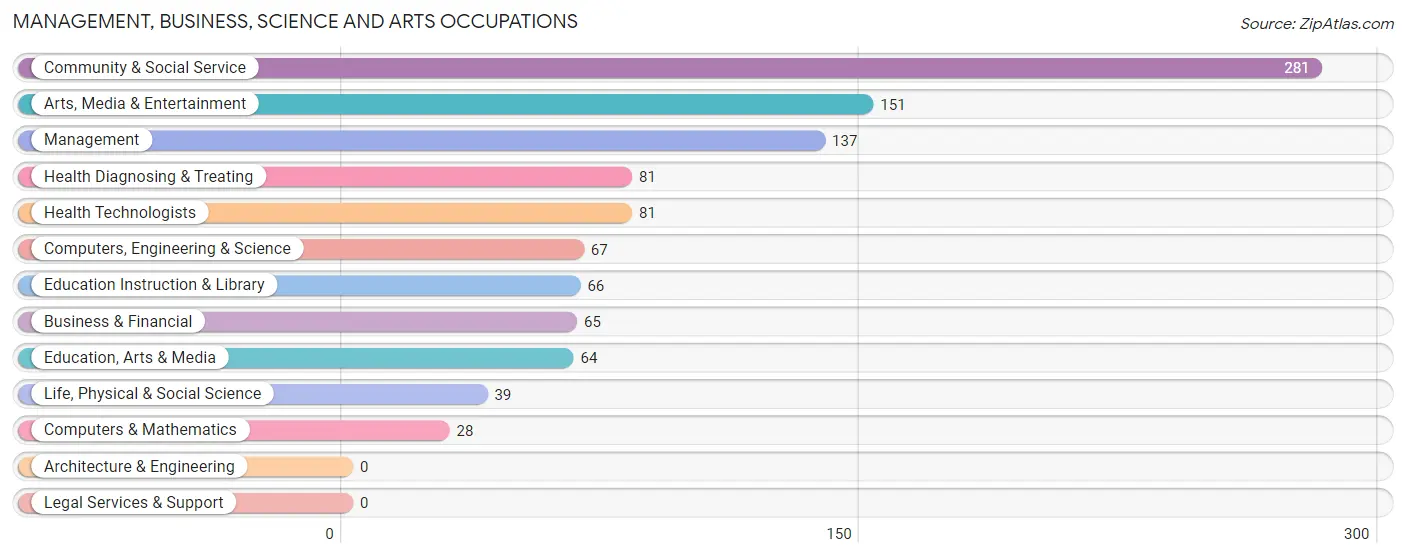
Management, Business, Science and Arts Occupations
The most common Management, Business, Science and Arts occupations in Woodstock are Community & Social Service (281 | 25.0%), Arts, Media & Entertainment (151 | 13.5%), Management (137 | 12.2%), Health Diagnosing & Treating (81 | 7.2%), and Health Technologists (81 | 7.2%).
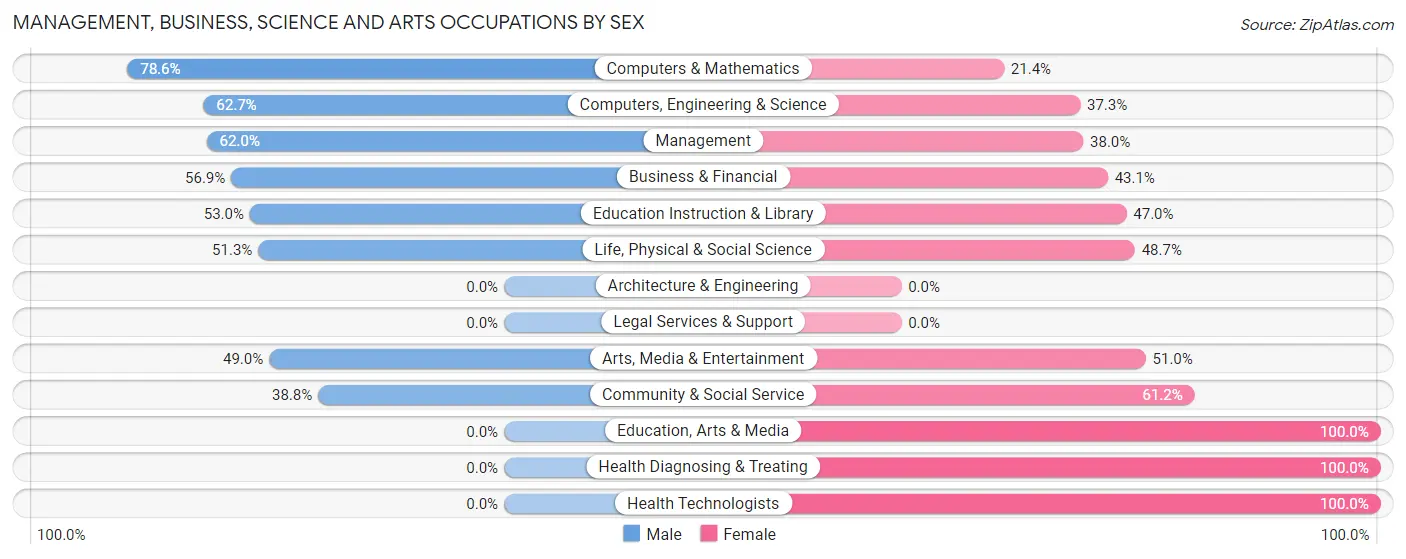
Management, Business, Science and Arts Occupations by Sex
Within the Management, Business, Science and Arts occupations in Woodstock, the most male-oriented occupations are Computers & Mathematics (78.6%), Computers, Engineering & Science (62.7%), and Management (62.0%), while the most female-oriented occupations are Education, Arts & Media (100.0%), Health Diagnosing & Treating (100.0%), and Health Technologists (100.0%).
| Occupation | Male | Female |
| Management | 85 (62.0%) | 52 (38.0%) |
| Business & Financial | 37 (56.9%) | 28 (43.1%) |
| Computers, Engineering & Science | 42 (62.7%) | 25 (37.3%) |
| Computers & Mathematics | 22 (78.6%) | 6 (21.4%) |
| Architecture & Engineering | 0 (0.0%) | 0 (0.0%) |
| Life, Physical & Social Science | 20 (51.3%) | 19 (48.7%) |
| Community & Social Service | 109 (38.8%) | 172 (61.2%) |
| Education, Arts & Media | 0 (0.0%) | 64 (100.0%) |
| Legal Services & Support | 0 (0.0%) | 0 (0.0%) |
| Education Instruction & Library | 35 (53.0%) | 31 (47.0%) |
| Arts, Media & Entertainment | 74 (49.0%) | 77 (51.0%) |
| Health Diagnosing & Treating | 0 (0.0%) | 81 (100.0%) |
| Health Technologists | 0 (0.0%) | 81 (100.0%) |
| Total (Category) | 273 (43.3%) | 358 (56.7%) |
| Total (Overall) | 534 (47.6%) | 588 (52.4%) |
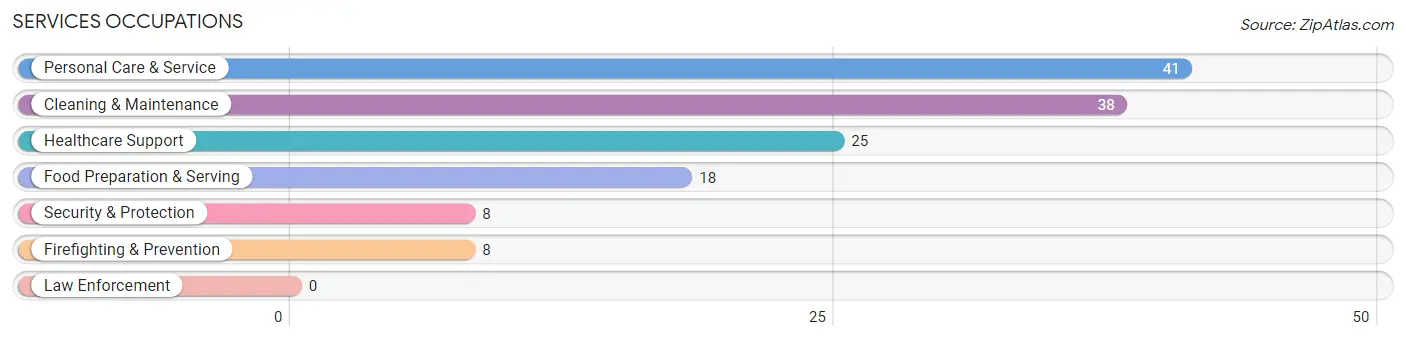
Services Occupations
The most common Services occupations in Woodstock are Personal Care & Service (41 | 3.6%), Cleaning & Maintenance (38 | 3.4%), Healthcare Support (25 | 2.2%), Food Preparation & Serving (18 | 1.6%), and Security & Protection (8 | 0.7%).
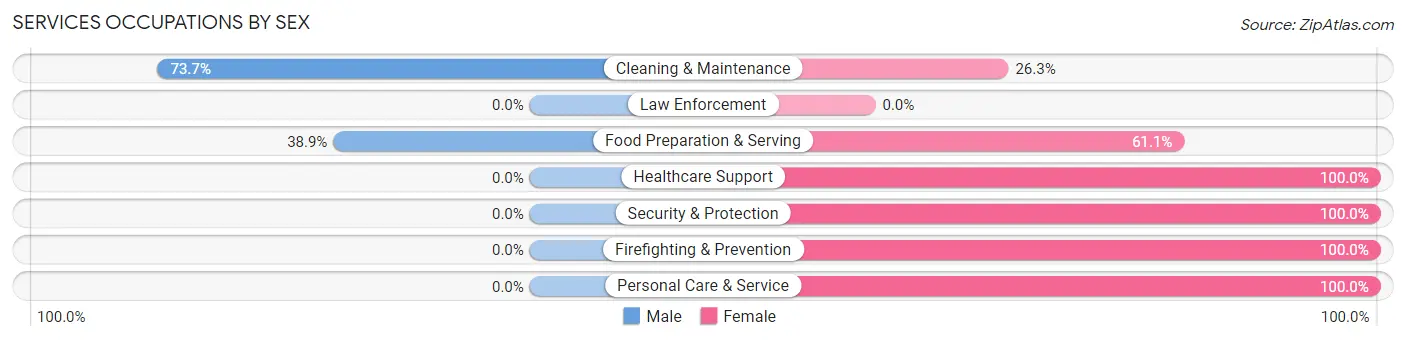
Services Occupations by Sex
Within the Services occupations in Woodstock, the most male-oriented occupations are Cleaning & Maintenance (73.7%), and Food Preparation & Serving (38.9%), while the most female-oriented occupations are Healthcare Support (100.0%), Security & Protection (100.0%), and Firefighting & Prevention (100.0%).
| Occupation | Male | Female |
| Healthcare Support | 0 (0.0%) | 25 (100.0%) |
| Security & Protection | 0 (0.0%) | 8 (100.0%) |
| Firefighting & Prevention | 0 (0.0%) | 8 (100.0%) |
| Law Enforcement | 0 (0.0%) | 0 (0.0%) |
| Food Preparation & Serving | 7 (38.9%) | 11 (61.1%) |
| Cleaning & Maintenance | 28 (73.7%) | 10 (26.3%) |
| Personal Care & Service | 0 (0.0%) | 41 (100.0%) |
| Total (Category) | 35 (26.9%) | 95 (73.1%) |
| Total (Overall) | 534 (47.6%) | 588 (52.4%) |
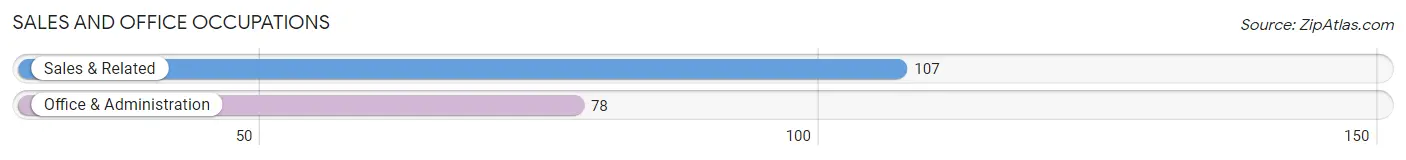
Sales and Office Occupations
The most common Sales and Office occupations in Woodstock are Sales & Related (107 | 9.5%), and Office & Administration (78 | 7.0%).
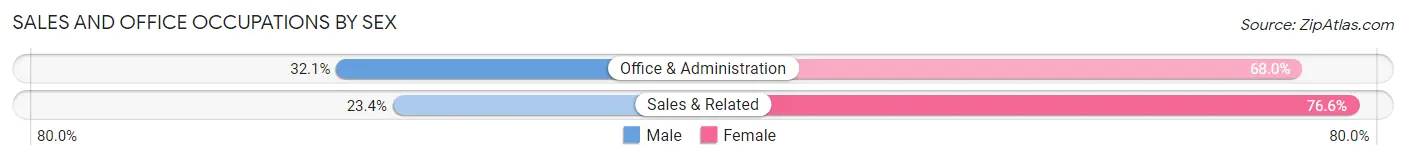
Sales and Office Occupations by Sex
| Occupation | Male | Female |
| Sales & Related | 25 (23.4%) | 82 (76.6%) |
| Office & Administration | 25 (32.1%) | 53 (67.9%) |
| Total (Category) | 50 (27.0%) | 135 (73.0%) |
| Total (Overall) | 534 (47.6%) | 588 (52.4%) |
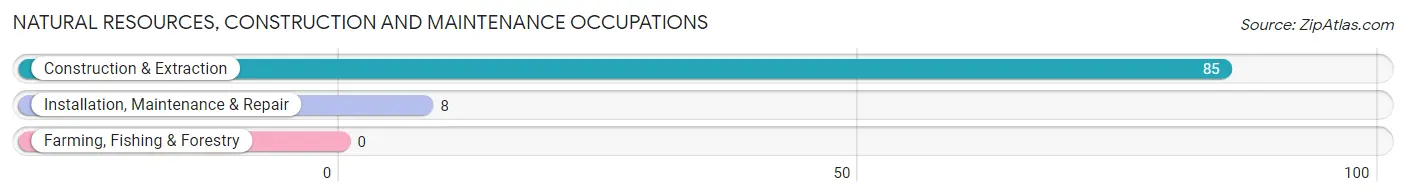
Natural Resources, Construction and Maintenance Occupations
The most common Natural Resources, Construction and Maintenance occupations in Woodstock are Construction & Extraction (85 | 7.6%), and Installation, Maintenance & Repair (8 | 0.7%).
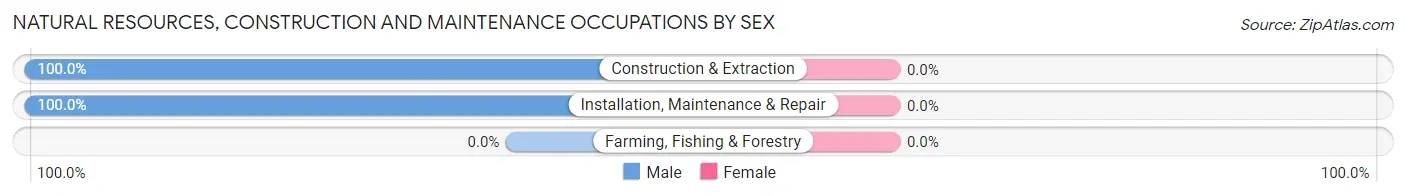
Natural Resources, Construction and Maintenance Occupations by Sex
| Occupation | Male | Female |
| Farming, Fishing & Forestry | 0 (0.0%) | 0 (0.0%) |
| Construction & Extraction | 85 (100.0%) | 0 (0.0%) |
| Installation, Maintenance & Repair | 8 (100.0%) | 0 (0.0%) |
| Total (Category) | 93 (100.0%) | 0 (0.0%) |
| Total (Overall) | 534 (47.6%) | 588 (52.4%) |
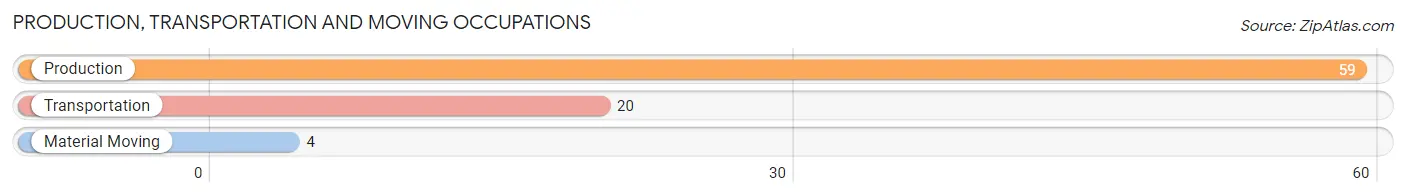
Production, Transportation and Moving Occupations
The most common Production, Transportation and Moving occupations in Woodstock are Production (59 | 5.3%), Transportation (20 | 1.8%), and Material Moving (4 | 0.4%).
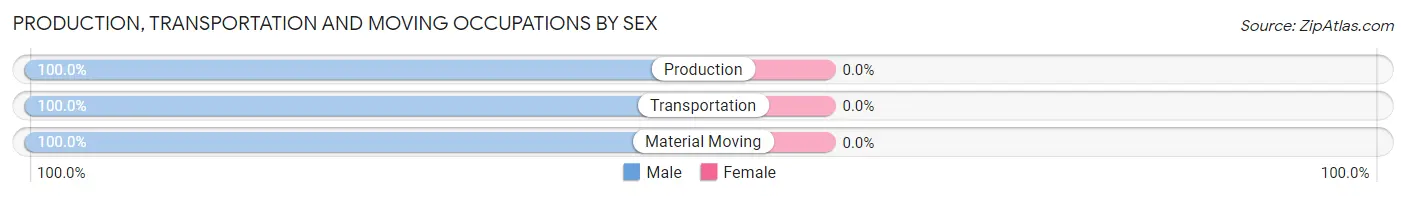
Production, Transportation and Moving Occupations by Sex
| Occupation | Male | Female |
| Production | 59 (100.0%) | 0 (0.0%) |
| Transportation | 20 (100.0%) | 0 (0.0%) |
| Material Moving | 4 (100.0%) | 0 (0.0%) |
| Total (Category) | 83 (100.0%) | 0 (0.0%) |
| Total (Overall) | 534 (47.6%) | 588 (52.4%) |
Employment Industries by Sex in Woodstock
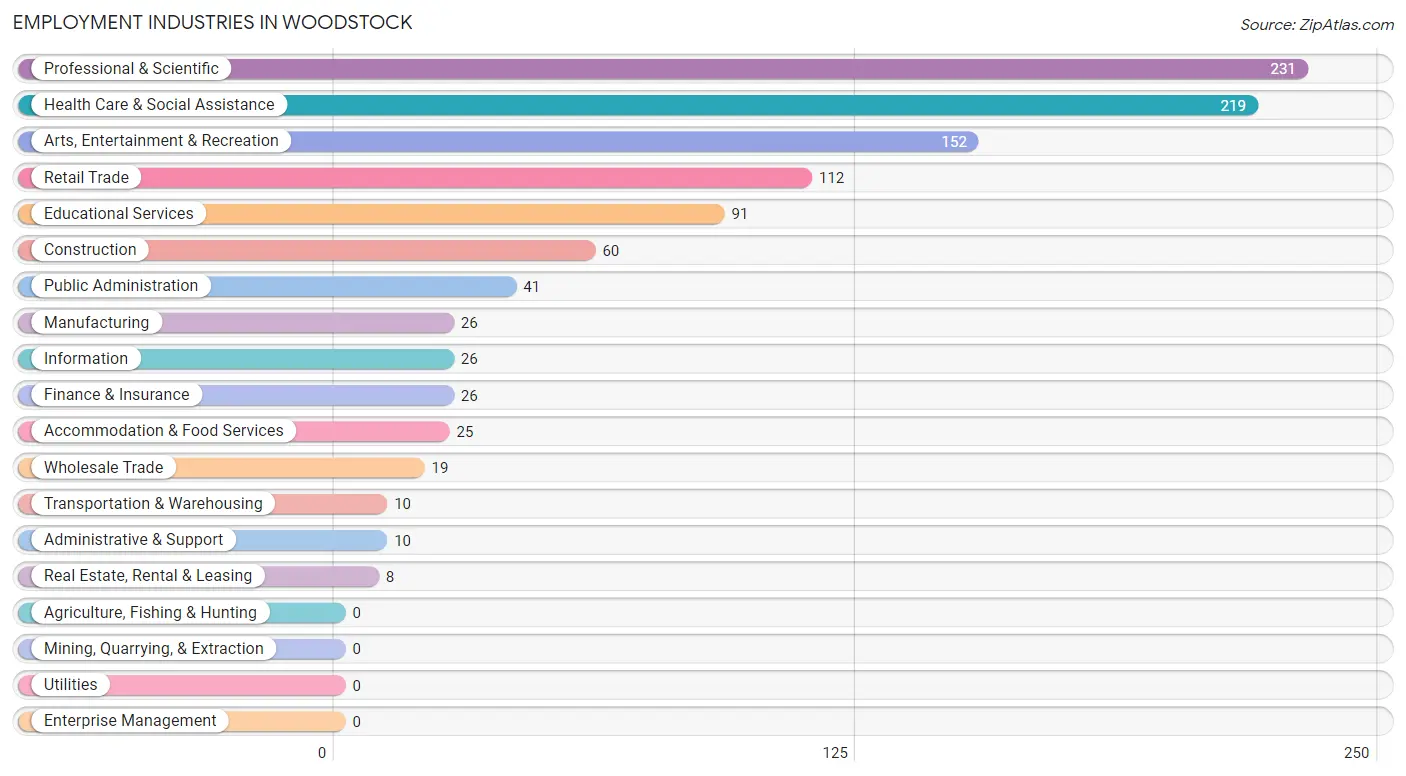
Employment Industries in Woodstock
The major employment industries in Woodstock include Professional & Scientific (231 | 20.6%), Health Care & Social Assistance (219 | 19.5%), Arts, Entertainment & Recreation (152 | 13.6%), Retail Trade (112 | 10.0%), and Educational Services (91 | 8.1%).
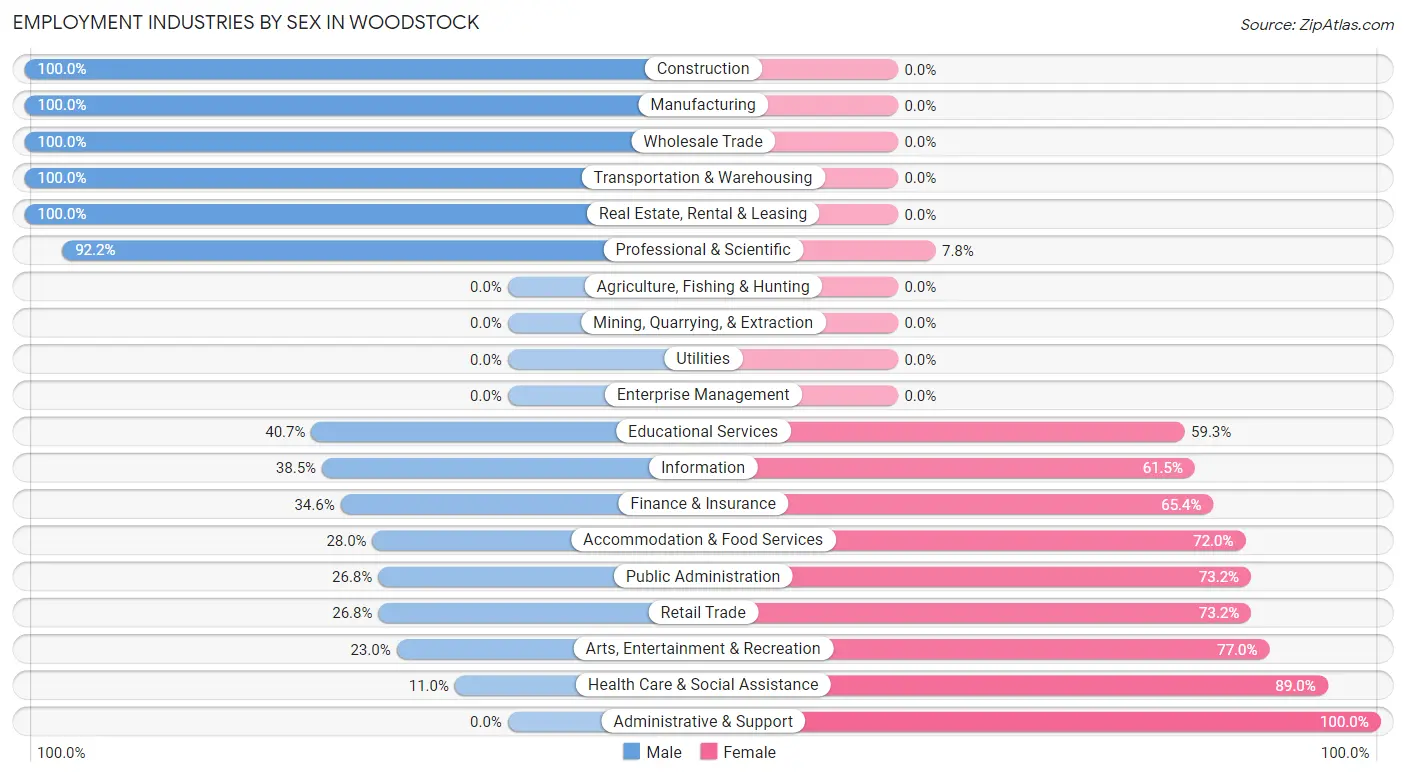
Employment Industries by Sex in Woodstock
The Woodstock industries that see more men than women are Construction (100.0%), Manufacturing (100.0%), and Wholesale Trade (100.0%), whereas the industries that tend to have a higher number of women are Administrative & Support (100.0%), Health Care & Social Assistance (89.0%), and Arts, Entertainment & Recreation (77.0%).
| Industry | Male | Female |
| Agriculture, Fishing & Hunting | 0 (0.0%) | 0 (0.0%) |
| Mining, Quarrying, & Extraction | 0 (0.0%) | 0 (0.0%) |
| Construction | 60 (100.0%) | 0 (0.0%) |
| Manufacturing | 26 (100.0%) | 0 (0.0%) |
| Wholesale Trade | 19 (100.0%) | 0 (0.0%) |
| Retail Trade | 30 (26.8%) | 82 (73.2%) |
| Transportation & Warehousing | 10 (100.0%) | 0 (0.0%) |
| Utilities | 0 (0.0%) | 0 (0.0%) |
| Information | 10 (38.5%) | 16 (61.5%) |
| Finance & Insurance | 9 (34.6%) | 17 (65.4%) |
| Real Estate, Rental & Leasing | 8 (100.0%) | 0 (0.0%) |
| Professional & Scientific | 213 (92.2%) | 18 (7.8%) |
| Enterprise Management | 0 (0.0%) | 0 (0.0%) |
| Administrative & Support | 0 (0.0%) | 10 (100.0%) |
| Educational Services | 37 (40.7%) | 54 (59.3%) |
| Health Care & Social Assistance | 24 (11.0%) | 195 (89.0%) |
| Arts, Entertainment & Recreation | 35 (23.0%) | 117 (77.0%) |
| Accommodation & Food Services | 7 (28.0%) | 18 (72.0%) |
| Public Administration | 11 (26.8%) | 30 (73.2%) |
| Total | 534 (47.6%) | 588 (52.4%) |
Education in Woodstock
School Enrollment in Woodstock
The most common levels of schooling among the 391 students in Woodstock are elementary school (155 | 39.6%), middle school (77 | 19.7%), and college / undergraduate (69 | 17.6%).
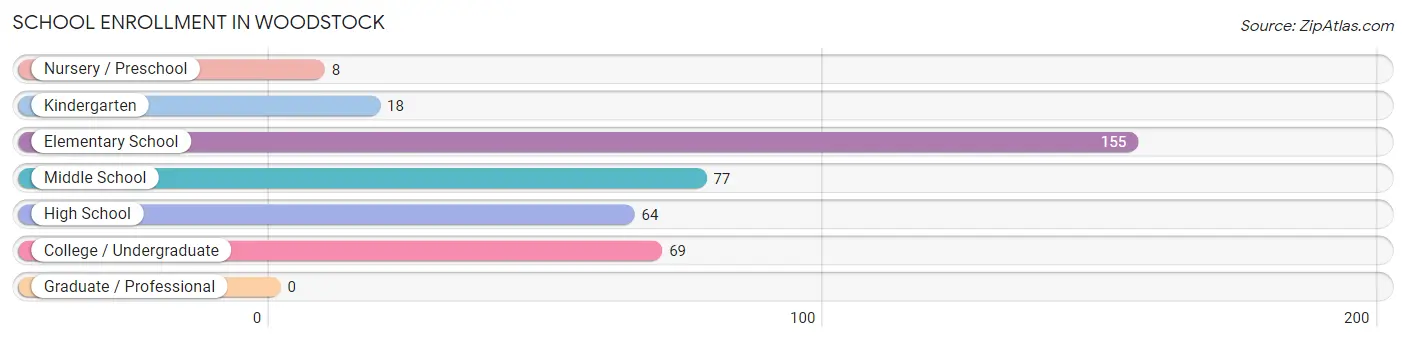
| School Level | # Students | % Students |
| Nursery / Preschool | 8 | 2.1% |
| Kindergarten | 18 | 4.6% |
| Elementary School | 155 | 39.6% |
| Middle School | 77 | 19.7% |
| High School | 64 | 16.4% |
| College / Undergraduate | 69 | 17.6% |
| Graduate / Professional | 0 | 0.0% |
| Total | 391 | 100.0% |
School Enrollment by Age by Funding Source in Woodstock
Out of a total of 391 students who are enrolled in schools in Woodstock, 96 (24.6%) attend a private institution, while the remaining 295 (75.4%) are enrolled in public schools. The age group of 3 to 4 year olds has the highest likelihood of being enrolled in private schools, with 8 (100.0% in the age bracket) enrolled. Conversely, the age group of 18 to 19 year olds has the lowest likelihood of being enrolled in a private school, with 11 (100.0% in the age bracket) attending a public institution.
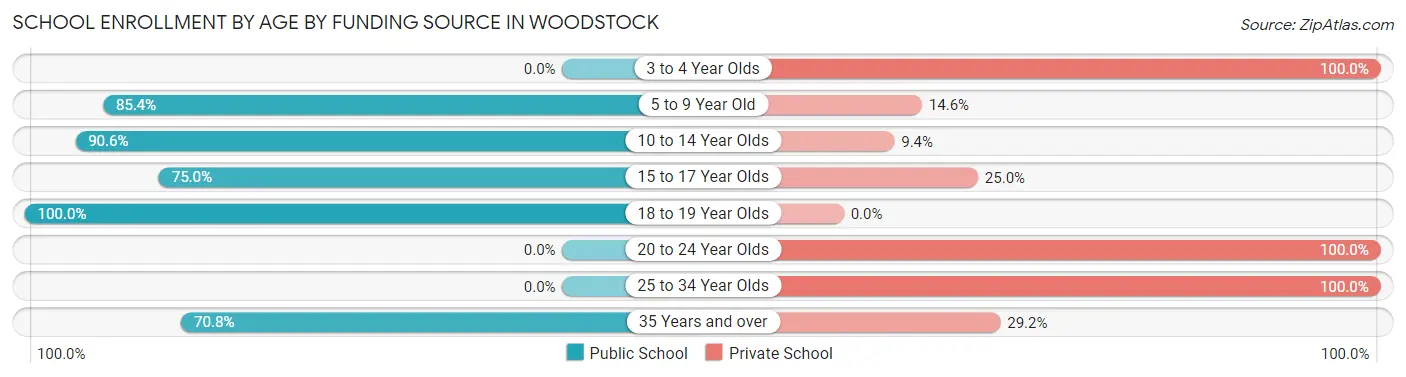
| Age Bracket | Public School | Private School |
| 3 to 4 Year Olds | 0 (0.0%) | 8 (100.0%) |
| 5 to 9 Year Old | 123 (85.4%) | 21 (14.6%) |
| 10 to 14 Year Olds | 96 (90.6%) | 10 (9.4%) |
| 15 to 17 Year Olds | 48 (75.0%) | 16 (25.0%) |
| 18 to 19 Year Olds | 11 (100.0%) | 0 (0.0%) |
| 20 to 24 Year Olds | 0 (0.0%) | 14 (100.0%) |
| 25 to 34 Year Olds | 0 (0.0%) | 20 (100.0%) |
| 35 Years and over | 17 (70.8%) | 7 (29.2%) |
| Total | 295 (75.4%) | 96 (24.6%) |
Educational Attainment by Field of Study in Woodstock
Visual & performing arts (366 | 23.0%), liberal arts & history (188 | 11.8%), literature & languages (183 | 11.5%), education (161 | 10.1%), and communications (140 | 8.8%) are the most common fields of study among 1,594 individuals in Woodstock who have obtained a bachelor's degree or higher.
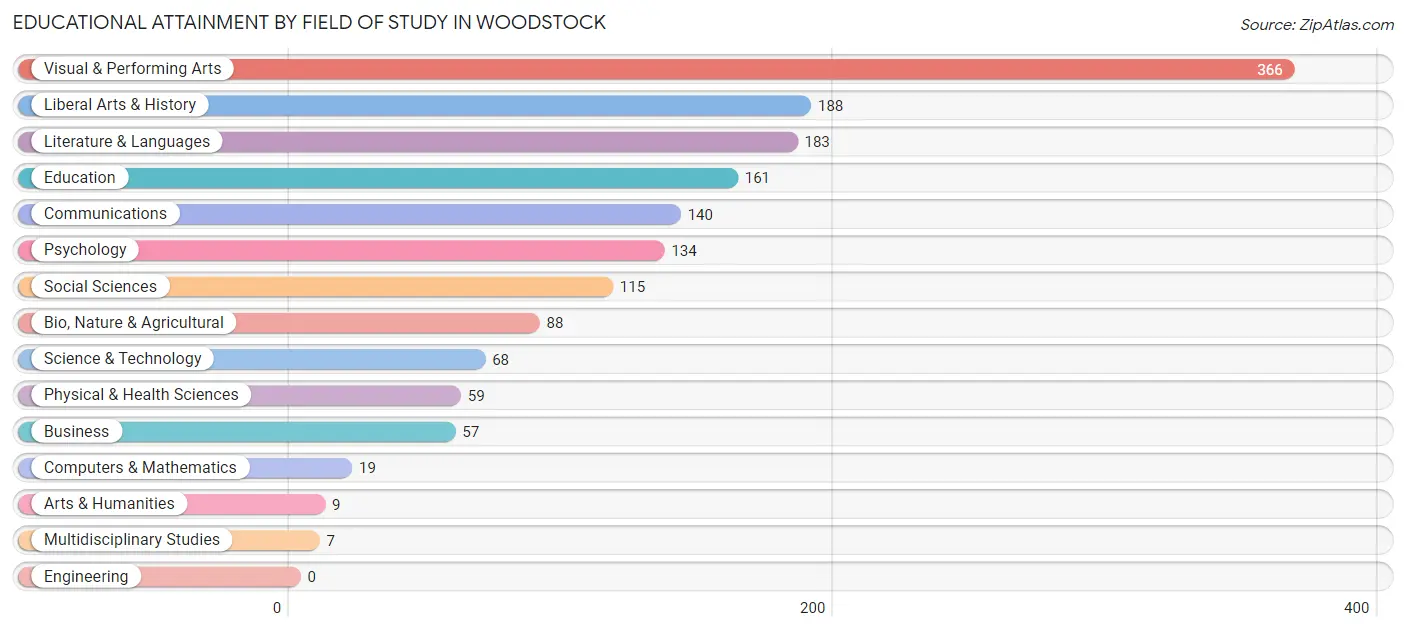
| Field of Study | # Graduates | % Graduates |
| Computers & Mathematics | 19 | 1.2% |
| Bio, Nature & Agricultural | 88 | 5.5% |
| Physical & Health Sciences | 59 | 3.7% |
| Psychology | 134 | 8.4% |
| Social Sciences | 115 | 7.2% |
| Engineering | 0 | 0.0% |
| Multidisciplinary Studies | 7 | 0.4% |
| Science & Technology | 68 | 4.3% |
| Business | 57 | 3.6% |
| Education | 161 | 10.1% |
| Literature & Languages | 183 | 11.5% |
| Liberal Arts & History | 188 | 11.8% |
| Visual & Performing Arts | 366 | 23.0% |
| Communications | 140 | 8.8% |
| Arts & Humanities | 9 | 0.6% |
| Total | 1,594 | 100.0% |
Transportation & Commute in Woodstock
Vehicle Availability by Sex in Woodstock
The most prevalent vehicle ownership categories in Woodstock are males with 2 vehicles (264, accounting for 49.8%) and females with 2 vehicles (183, making up 46.4%).
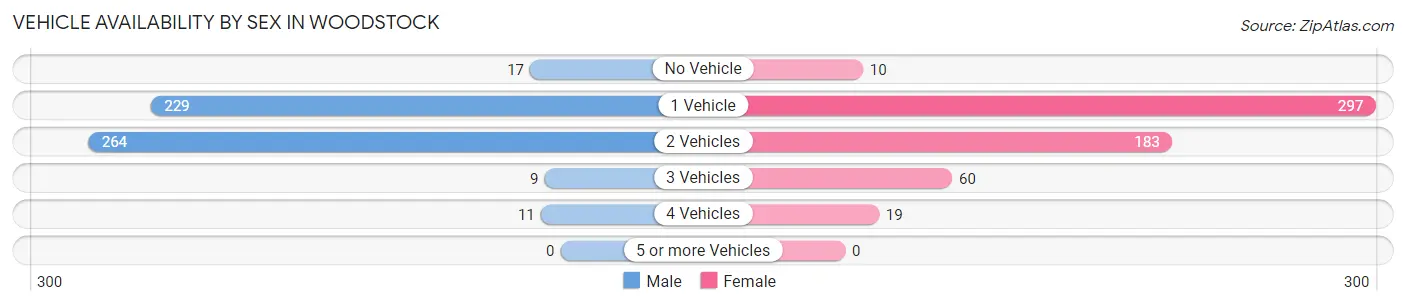
| Vehicles Available | Male | Female |
| No Vehicle | 17 (3.2%) | 10 (1.8%) |
| 1 Vehicle | 229 (43.2%) | 297 (52.2%) |
| 2 Vehicles | 264 (49.8%) | 183 (32.2%) |
| 3 Vehicles | 9 (1.7%) | 60 (10.5%) |
| 4 Vehicles | 11 (2.1%) | 19 (3.3%) |
| 5 or more Vehicles | 0 (0.0%) | 0 (0.0%) |
| Total | 530 (100.0%) | 569 (100.0%) |
Commute Time in Woodstock
The most frequently occuring commute durations in Woodstock are 10 to 14 minutes (147 commuters, 21.1%), 5 to 9 minutes (108 commuters, 15.5%), and 15 to 19 minutes (81 commuters, 11.6%).
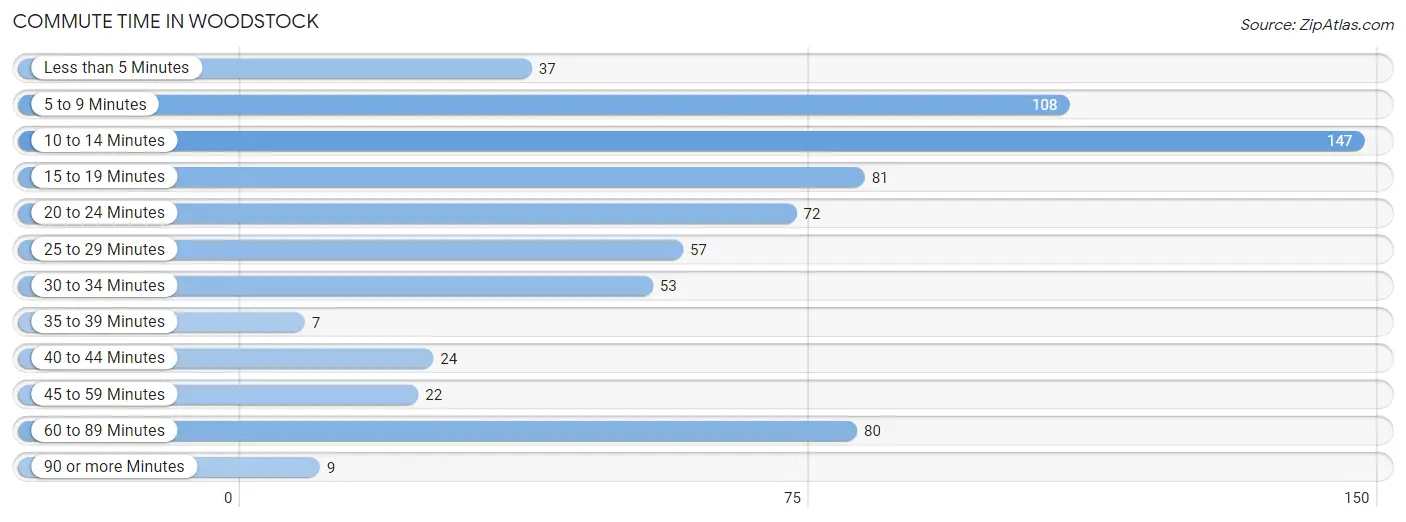
| Commute Time | # Commuters | % Commuters |
| Less than 5 Minutes | 37 | 5.3% |
| 5 to 9 Minutes | 108 | 15.5% |
| 10 to 14 Minutes | 147 | 21.1% |
| 15 to 19 Minutes | 81 | 11.6% |
| 20 to 24 Minutes | 72 | 10.3% |
| 25 to 29 Minutes | 57 | 8.2% |
| 30 to 34 Minutes | 53 | 7.6% |
| 35 to 39 Minutes | 7 | 1.0% |
| 40 to 44 Minutes | 24 | 3.4% |
| 45 to 59 Minutes | 22 | 3.2% |
| 60 to 89 Minutes | 80 | 11.5% |
| 90 or more Minutes | 9 | 1.3% |
Commute Time by Sex in Woodstock
The most common commute times in Woodstock are 5 to 9 minutes (74 commuters, 26.1%) for males and 10 to 14 minutes (117 commuters, 28.3%) for females.
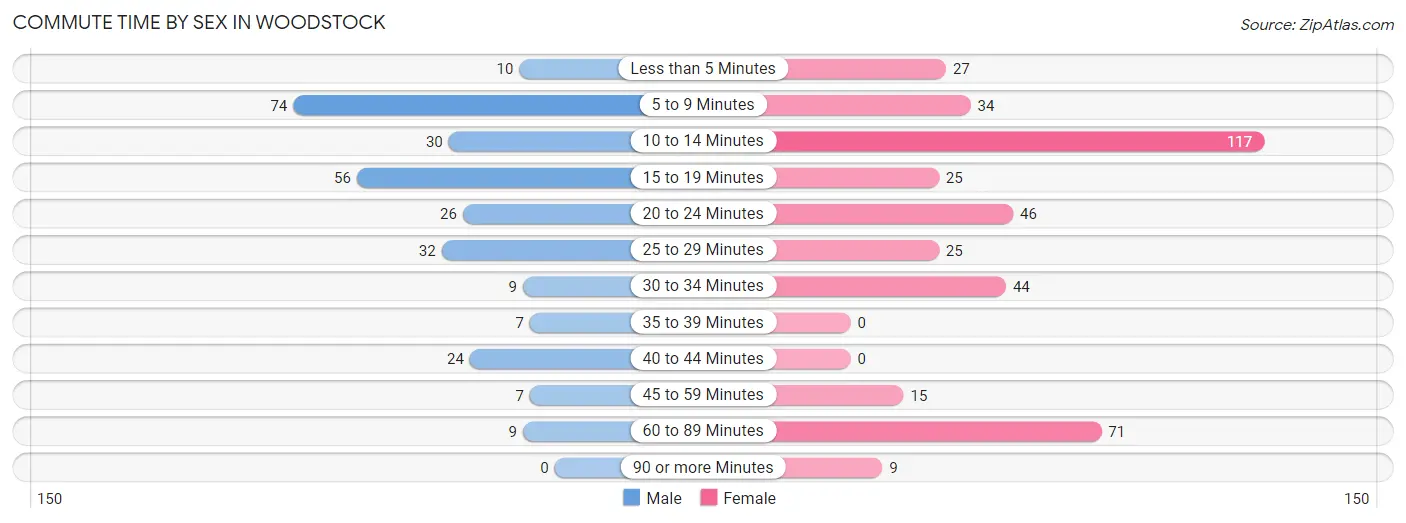
| Commute Time | Male | Female |
| Less than 5 Minutes | 10 (3.5%) | 27 (6.5%) |
| 5 to 9 Minutes | 74 (26.1%) | 34 (8.2%) |
| 10 to 14 Minutes | 30 (10.6%) | 117 (28.3%) |
| 15 to 19 Minutes | 56 (19.7%) | 25 (6.0%) |
| 20 to 24 Minutes | 26 (9.1%) | 46 (11.1%) |
| 25 to 29 Minutes | 32 (11.3%) | 25 (6.0%) |
| 30 to 34 Minutes | 9 (3.2%) | 44 (10.6%) |
| 35 to 39 Minutes | 7 (2.5%) | 0 (0.0%) |
| 40 to 44 Minutes | 24 (8.5%) | 0 (0.0%) |
| 45 to 59 Minutes | 7 (2.5%) | 15 (3.6%) |
| 60 to 89 Minutes | 9 (3.2%) | 71 (17.2%) |
| 90 or more Minutes | 0 (0.0%) | 9 (2.2%) |
Time of Departure to Work by Sex in Woodstock
The most frequent times of departure to work in Woodstock are 8:00 AM to 8:29 AM (66, 23.2%) for males and 8:30 AM to 8:59 AM (80, 19.4%) for females.
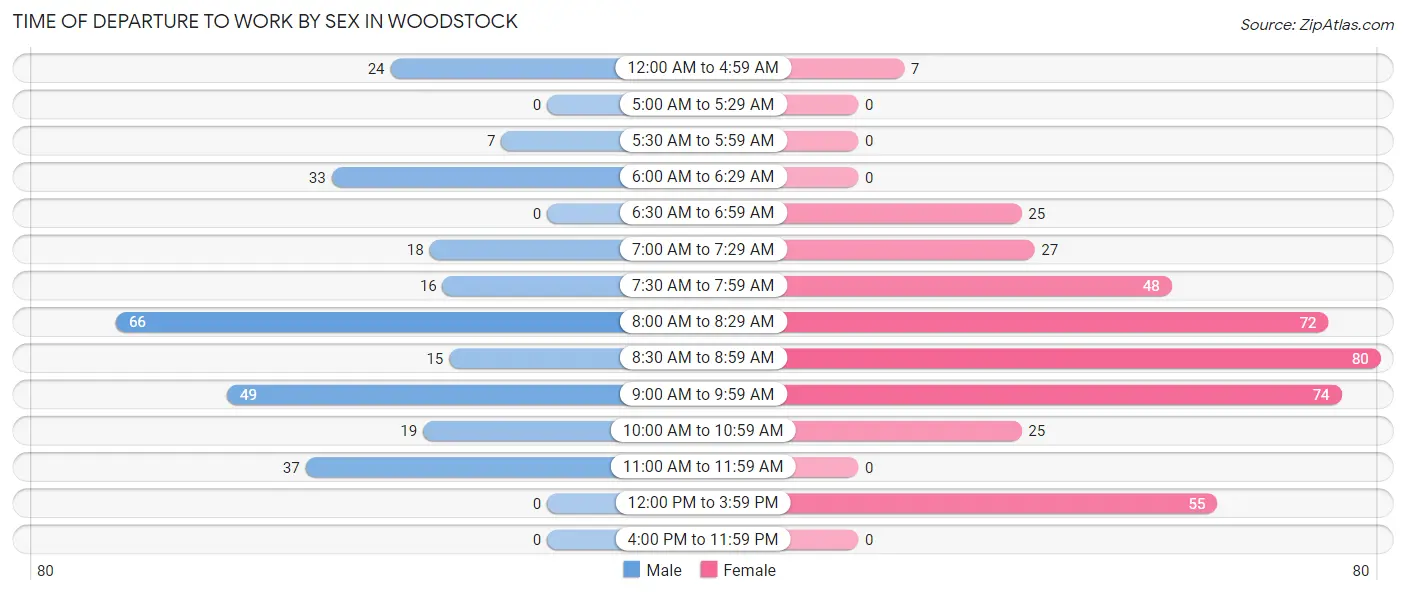
| Time of Departure | Male | Female |
| 12:00 AM to 4:59 AM | 24 (8.5%) | 7 (1.7%) |
| 5:00 AM to 5:29 AM | 0 (0.0%) | 0 (0.0%) |
| 5:30 AM to 5:59 AM | 7 (2.5%) | 0 (0.0%) |
| 6:00 AM to 6:29 AM | 33 (11.6%) | 0 (0.0%) |
| 6:30 AM to 6:59 AM | 0 (0.0%) | 25 (6.0%) |
| 7:00 AM to 7:29 AM | 18 (6.3%) | 27 (6.5%) |
| 7:30 AM to 7:59 AM | 16 (5.6%) | 48 (11.6%) |
| 8:00 AM to 8:29 AM | 66 (23.2%) | 72 (17.4%) |
| 8:30 AM to 8:59 AM | 15 (5.3%) | 80 (19.4%) |
| 9:00 AM to 9:59 AM | 49 (17.2%) | 74 (17.9%) |
| 10:00 AM to 10:59 AM | 19 (6.7%) | 25 (6.0%) |
| 11:00 AM to 11:59 AM | 37 (13.0%) | 0 (0.0%) |
| 12:00 PM to 3:59 PM | 0 (0.0%) | 55 (13.3%) |
| 4:00 PM to 11:59 PM | 0 (0.0%) | 0 (0.0%) |
| Total | 284 (100.0%) | 413 (100.0%) |
Housing Occupancy in Woodstock
Occupancy by Ownership in Woodstock
Of the total 1,512 dwellings in Woodstock, owner-occupied units account for 927 (61.3%), while renter-occupied units make up 585 (38.7%).
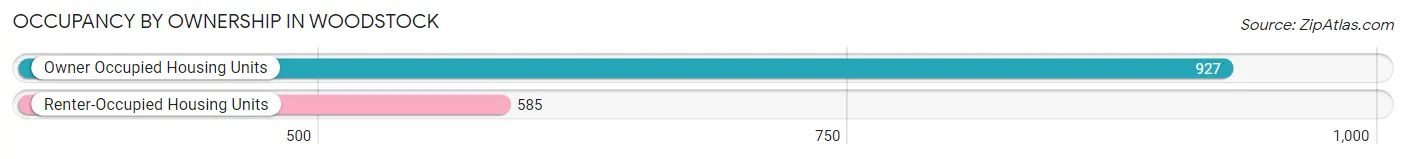
| Occupancy | # Housing Units | % Housing Units |
| Owner Occupied Housing Units | 927 | 61.3% |
| Renter-Occupied Housing Units | 585 | 38.7% |
| Total Occupied Housing Units | 1,512 | 100.0% |
Occupancy by Household Size in Woodstock
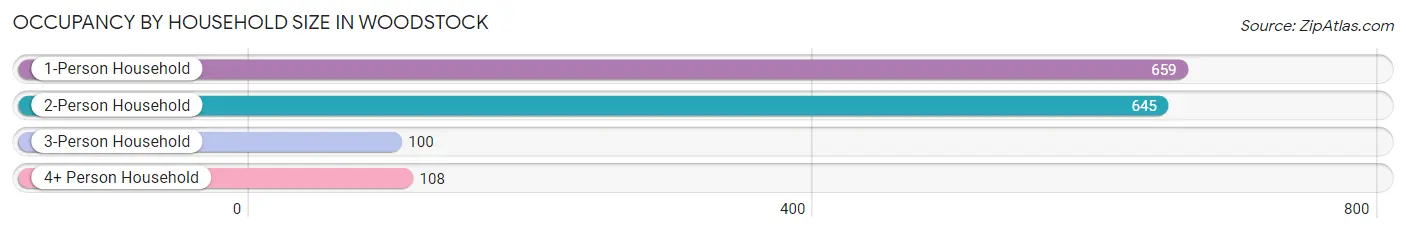
| Household Size | # Housing Units | % Housing Units |
| 1-Person Household | 659 | 43.6% |
| 2-Person Household | 645 | 42.7% |
| 3-Person Household | 100 | 6.6% |
| 4+ Person Household | 108 | 7.1% |
| Total Housing Units | 1,512 | 100.0% |
Occupancy by Ownership by Household Size in Woodstock
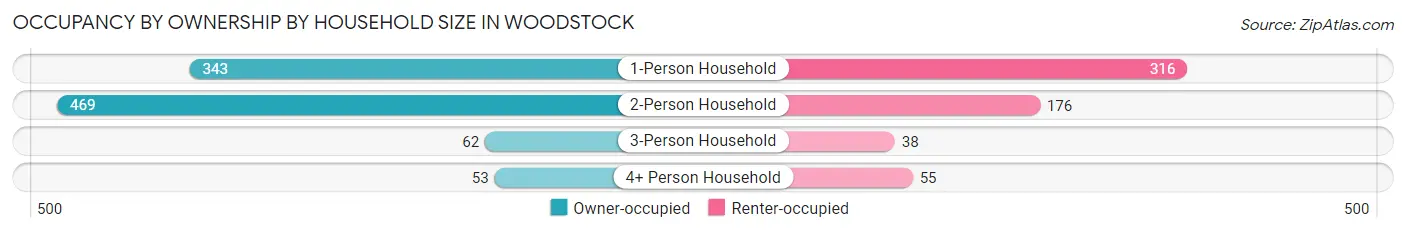
| Household Size | Owner-occupied | Renter-occupied |
| 1-Person Household | 343 (52.0%) | 316 (47.9%) |
| 2-Person Household | 469 (72.7%) | 176 (27.3%) |
| 3-Person Household | 62 (62.0%) | 38 (38.0%) |
| 4+ Person Household | 53 (49.1%) | 55 (50.9%) |
| Total Housing Units | 927 (61.3%) | 585 (38.7%) |
Occupancy by Educational Attainment in Woodstock
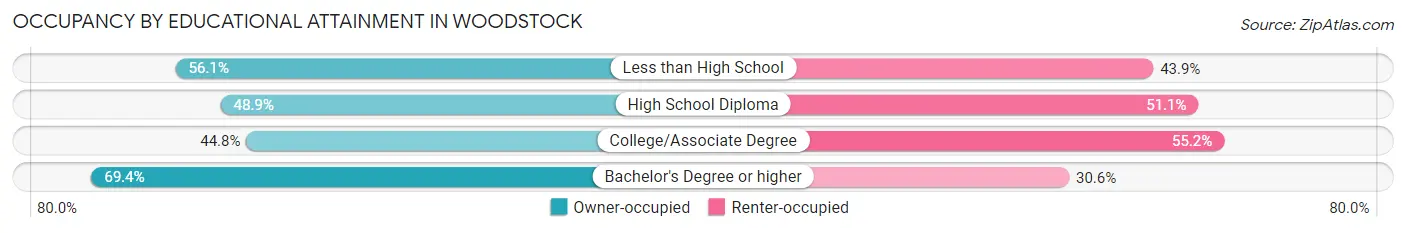
| Household Size | Owner-occupied | Renter-occupied |
| Less than High School | 37 (56.1%) | 29 (43.9%) |
| High School Diploma | 67 (48.9%) | 70 (51.1%) |
| College/Associate Degree | 156 (44.8%) | 192 (55.2%) |
| Bachelor's Degree or higher | 667 (69.4%) | 294 (30.6%) |
Occupancy by Age of Householder in Woodstock
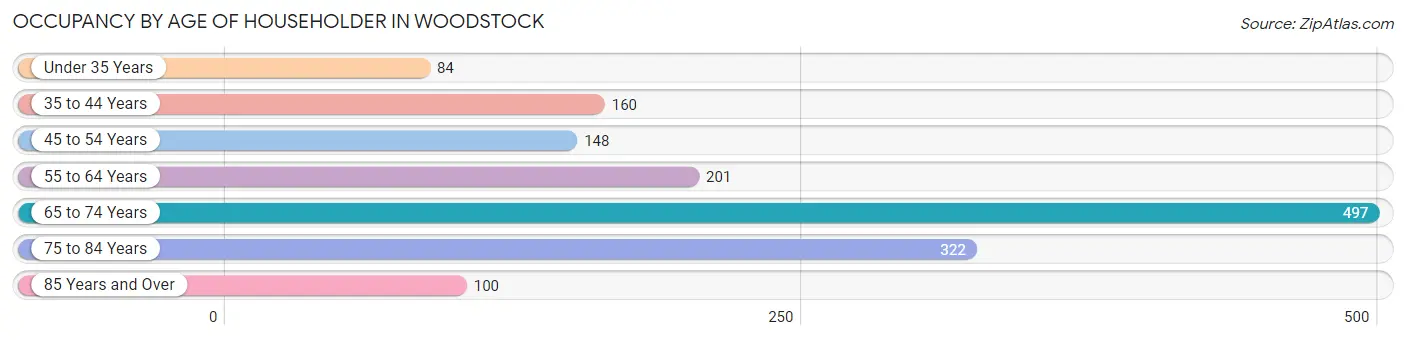
| Age Bracket | # Households | % Households |
| Under 35 Years | 84 | 5.6% |
| 35 to 44 Years | 160 | 10.6% |
| 45 to 54 Years | 148 | 9.8% |
| 55 to 64 Years | 201 | 13.3% |
| 65 to 74 Years | 497 | 32.9% |
| 75 to 84 Years | 322 | 21.3% |
| 85 Years and Over | 100 | 6.6% |
| Total | 1,512 | 100.0% |
Housing Finances in Woodstock
Median Income by Occupancy in Woodstock
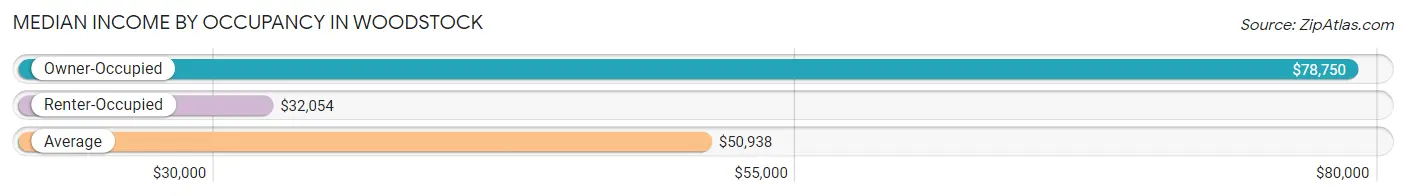
| Occupancy Type | # Households | Median Income |
| Owner-Occupied | 927 (61.3%) | $78,750 |
| Renter-Occupied | 585 (38.7%) | $32,054 |
| Average | 1,512 (100.0%) | $50,938 |
Occupancy by Householder Income Bracket in Woodstock
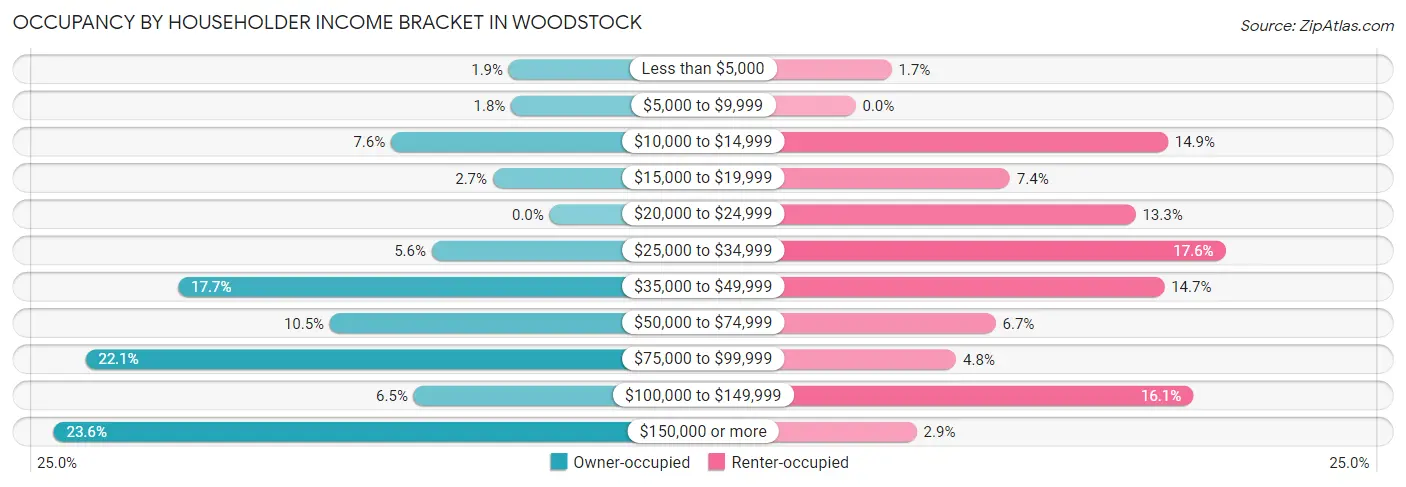
| Income Bracket | Owner-occupied | Renter-occupied |
| Less than $5,000 | 18 (1.9%) | 10 (1.7%) |
| $5,000 to $9,999 | 17 (1.8%) | 0 (0.0%) |
| $10,000 to $14,999 | 70 (7.5%) | 87 (14.9%) |
| $15,000 to $19,999 | 25 (2.7%) | 43 (7.3%) |
| $20,000 to $24,999 | 0 (0.0%) | 78 (13.3%) |
| $25,000 to $34,999 | 52 (5.6%) | 103 (17.6%) |
| $35,000 to $49,999 | 164 (17.7%) | 86 (14.7%) |
| $50,000 to $74,999 | 97 (10.5%) | 39 (6.7%) |
| $75,000 to $99,999 | 205 (22.1%) | 28 (4.8%) |
| $100,000 to $149,999 | 60 (6.5%) | 94 (16.1%) |
| $150,000 or more | 219 (23.6%) | 17 (2.9%) |
| Total | 927 (100.0%) | 585 (100.0%) |
Monthly Housing Cost Tiers in Woodstock
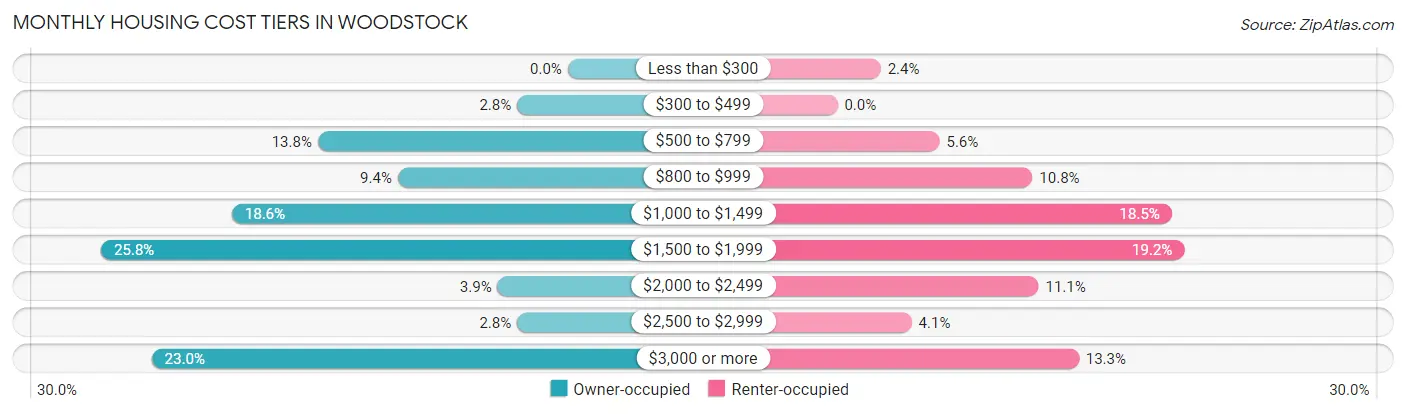
| Monthly Cost | Owner-occupied | Renter-occupied |
| Less than $300 | 0 (0.0%) | 14 (2.4%) |
| $300 to $499 | 26 (2.8%) | 0 (0.0%) |
| $500 to $799 | 128 (13.8%) | 33 (5.6%) |
| $800 to $999 | 87 (9.4%) | 63 (10.8%) |
| $1,000 to $1,499 | 172 (18.5%) | 108 (18.5%) |
| $1,500 to $1,999 | 239 (25.8%) | 112 (19.2%) |
| $2,000 to $2,499 | 36 (3.9%) | 65 (11.1%) |
| $2,500 to $2,999 | 26 (2.8%) | 24 (4.1%) |
| $3,000 or more | 213 (23.0%) | 78 (13.3%) |
| Total | 927 (100.0%) | 585 (100.0%) |
Physical Housing Characteristics in Woodstock
Housing Structures in Woodstock
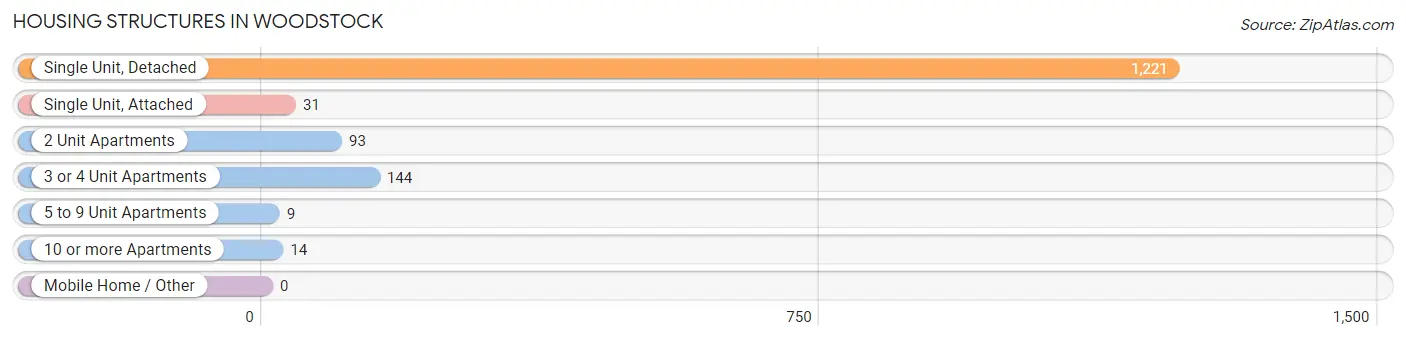
| Structure Type | # Housing Units | % Housing Units |
| Single Unit, Detached | 1,221 | 80.7% |
| Single Unit, Attached | 31 | 2.1% |
| 2 Unit Apartments | 93 | 6.1% |
| 3 or 4 Unit Apartments | 144 | 9.5% |
| 5 to 9 Unit Apartments | 9 | 0.6% |
| 10 or more Apartments | 14 | 0.9% |
| Mobile Home / Other | 0 | 0.0% |
| Total | 1,512 | 100.0% |
Housing Structures by Occupancy in Woodstock

| Structure Type | Owner-occupied | Renter-occupied |
| Single Unit, Detached | 917 (75.1%) | 304 (24.9%) |
| Single Unit, Attached | 0 (0.0%) | 31 (100.0%) |
| 2 Unit Apartments | 0 (0.0%) | 93 (100.0%) |
| 3 or 4 Unit Apartments | 10 (6.9%) | 134 (93.1%) |
| 5 to 9 Unit Apartments | 0 (0.0%) | 9 (100.0%) |
| 10 or more Apartments | 0 (0.0%) | 14 (100.0%) |
| Mobile Home / Other | 0 (0.0%) | 0 (0.0%) |
| Total | 927 (61.3%) | 585 (38.7%) |
Housing Structures by Number of Rooms in Woodstock
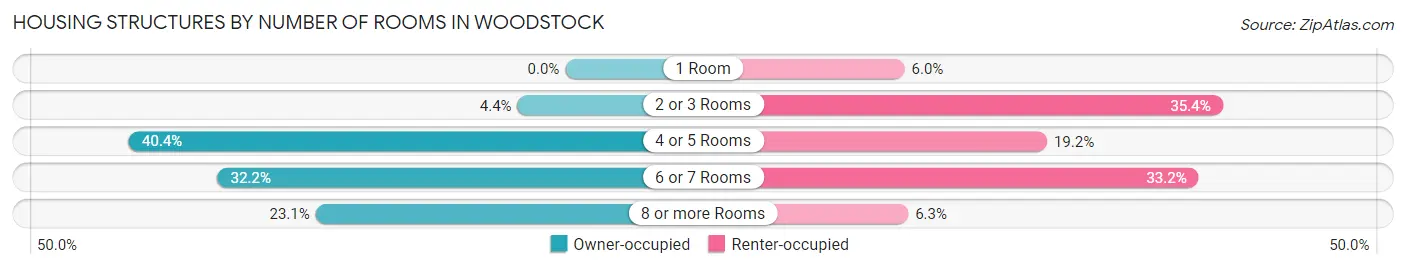
| Number of Rooms | Owner-occupied | Renter-occupied |
| 1 Room | 0 (0.0%) | 35 (6.0%) |
| 2 or 3 Rooms | 41 (4.4%) | 207 (35.4%) |
| 4 or 5 Rooms | 374 (40.4%) | 112 (19.2%) |
| 6 or 7 Rooms | 298 (32.2%) | 194 (33.2%) |
| 8 or more Rooms | 214 (23.1%) | 37 (6.3%) |
| Total | 927 (100.0%) | 585 (100.0%) |
Housing Structure by Heating Type in Woodstock
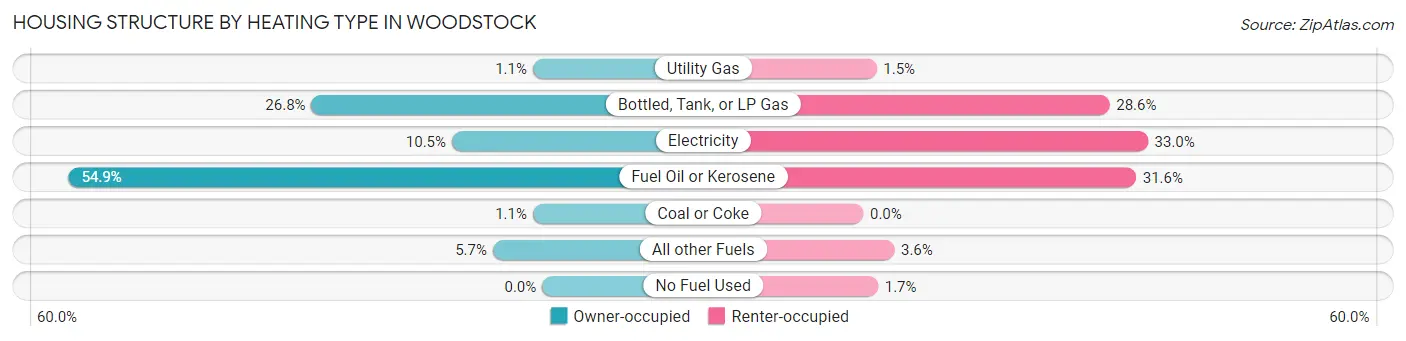
| Heating Type | Owner-occupied | Renter-occupied |
| Utility Gas | 10 (1.1%) | 9 (1.5%) |
| Bottled, Tank, or LP Gas | 248 (26.8%) | 167 (28.5%) |
| Electricity | 97 (10.5%) | 193 (33.0%) |
| Fuel Oil or Kerosene | 509 (54.9%) | 185 (31.6%) |
| Coal or Coke | 10 (1.1%) | 0 (0.0%) |
| All other Fuels | 53 (5.7%) | 21 (3.6%) |
| No Fuel Used | 0 (0.0%) | 10 (1.7%) |
| Total | 927 (100.0%) | 585 (100.0%) |
Household Vehicle Usage in Woodstock
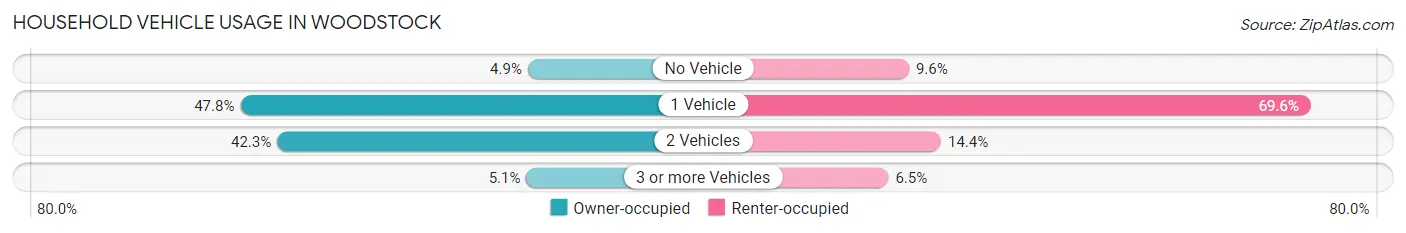
| Vehicles per Household | Owner-occupied | Renter-occupied |
| No Vehicle | 45 (4.9%) | 56 (9.6%) |
| 1 Vehicle | 443 (47.8%) | 407 (69.6%) |
| 2 Vehicles | 392 (42.3%) | 84 (14.4%) |
| 3 or more Vehicles | 47 (5.1%) | 38 (6.5%) |
| Total | 927 (100.0%) | 585 (100.0%) |
Real Estate & Mortgages in Woodstock
Real Estate and Mortgage Overview in Woodstock
| Characteristic | Without Mortgage | With Mortgage |
| Housing Units | 507 | 420 |
| Median Property Value | $518,200 | $623,800 |
| Median Household Income | $83,375 | $162 |
| Monthly Housing Costs | $1,284 | $206 |
| Real Estate Taxes | $8,682 | $0 |
Property Value by Mortgage Status in Woodstock
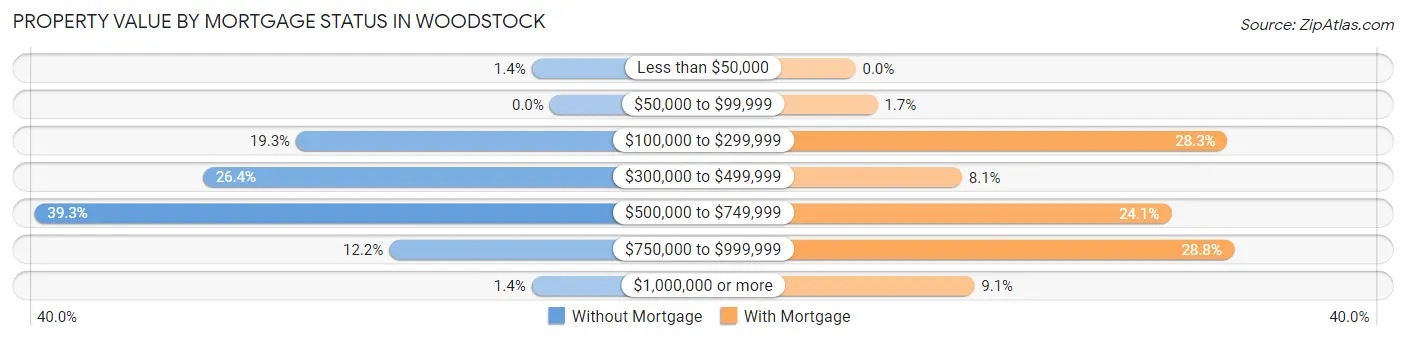
| Property Value | Without Mortgage | With Mortgage |
| Less than $50,000 | 7 (1.4%) | 0 (0.0%) |
| $50,000 to $99,999 | 0 (0.0%) | 7 (1.7%) |
| $100,000 to $299,999 | 98 (19.3%) | 119 (28.3%) |
| $300,000 to $499,999 | 134 (26.4%) | 34 (8.1%) |
| $500,000 to $749,999 | 199 (39.3%) | 101 (24.0%) |
| $750,000 to $999,999 | 62 (12.2%) | 121 (28.8%) |
| $1,000,000 or more | 7 (1.4%) | 38 (9.0%) |
| Total | 507 (100.0%) | 420 (100.0%) |
Household Income by Mortgage Status in Woodstock
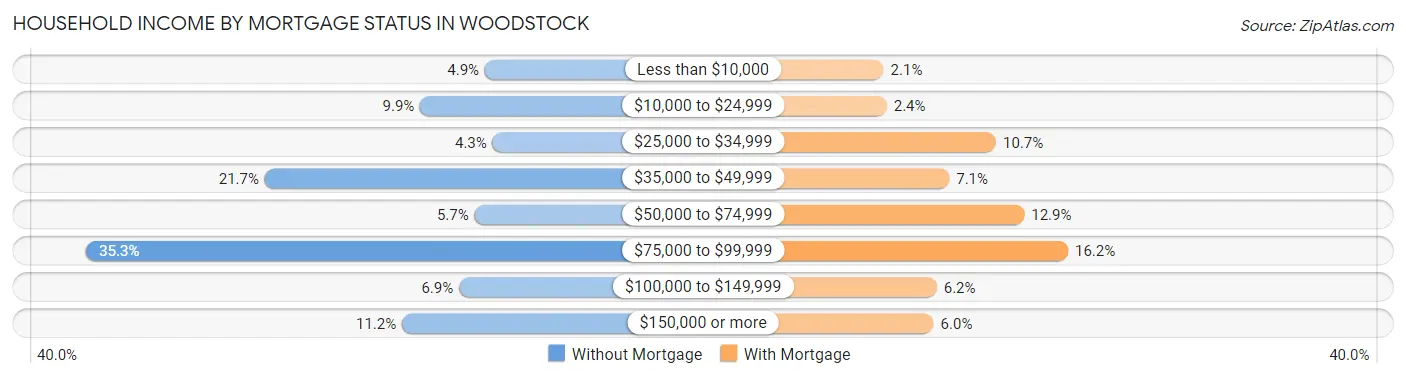
| Household Income | Without Mortgage | With Mortgage |
| Less than $10,000 | 25 (4.9%) | 9 (2.1%) |
| $10,000 to $24,999 | 50 (9.9%) | 10 (2.4%) |
| $25,000 to $34,999 | 22 (4.3%) | 45 (10.7%) |
| $35,000 to $49,999 | 110 (21.7%) | 30 (7.1%) |
| $50,000 to $74,999 | 29 (5.7%) | 54 (12.9%) |
| $75,000 to $99,999 | 179 (35.3%) | 68 (16.2%) |
| $100,000 to $149,999 | 35 (6.9%) | 26 (6.2%) |
| $150,000 or more | 57 (11.2%) | 25 (5.9%) |
| Total | 507 (100.0%) | 420 (100.0%) |
Property Value to Household Income Ratio in Woodstock
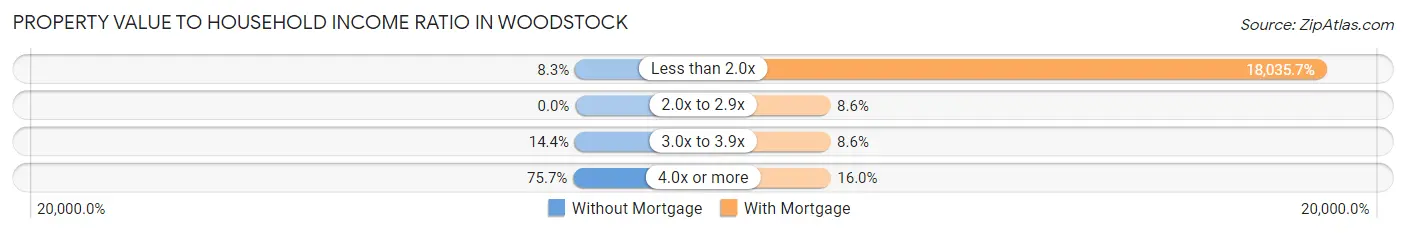
| Value-to-Income Ratio | Without Mortgage | With Mortgage |
| Less than 2.0x | 42 (8.3%) | 75,750 (18,035.7%) |
| 2.0x to 2.9x | 0 (0.0%) | 36 (8.6%) |
| 3.0x to 3.9x | 73 (14.4%) | 36 (8.6%) |
| 4.0x or more | 384 (75.7%) | 67 (16.0%) |
| Total | 507 (100.0%) | 420 (100.0%) |
Real Estate Taxes by Mortgage Status in Woodstock
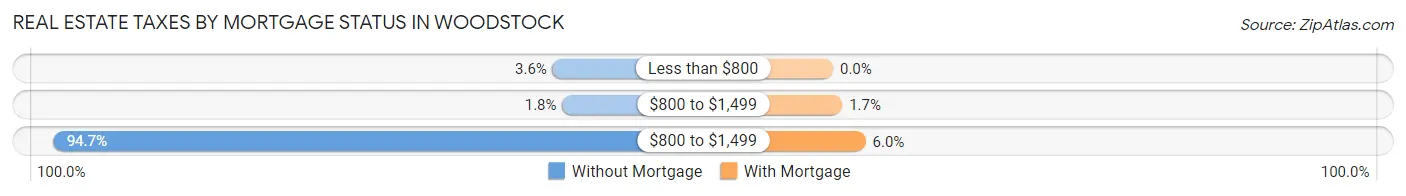
| Property Taxes | Without Mortgage | With Mortgage |
| Less than $800 | 18 (3.5%) | 0 (0.0%) |
| $800 to $1,499 | 9 (1.8%) | 7 (1.7%) |
| $800 to $1,499 | 480 (94.7%) | 25 (5.9%) |
| Total | 507 (100.0%) | 420 (100.0%) |
Health & Disability in Woodstock
Health Insurance Coverage by Age in Woodstock
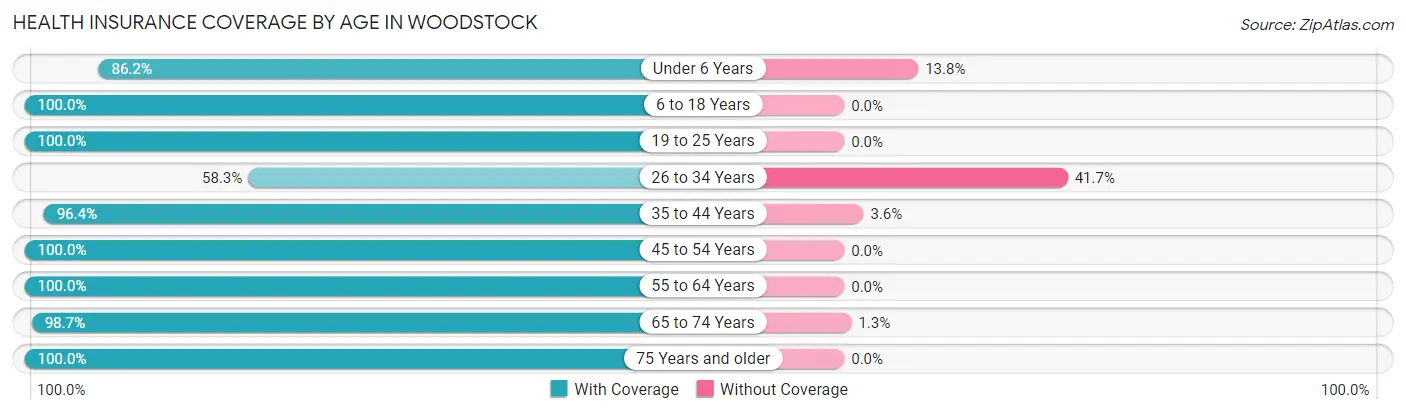
| Age Bracket | With Coverage | Without Coverage |
| Under 6 Years | 50 (86.2%) | 8 (13.8%) |
| 6 to 18 Years | 307 (100.0%) | 0 (0.0%) |
| 19 to 25 Years | 83 (100.0%) | 0 (0.0%) |
| 26 to 34 Years | 98 (58.3%) | 70 (41.7%) |
| 35 to 44 Years | 189 (96.4%) | 7 (3.6%) |
| 45 to 54 Years | 344 (100.0%) | 0 (0.0%) |
| 55 to 64 Years | 451 (100.0%) | 0 (0.0%) |
| 65 to 74 Years | 734 (98.7%) | 10 (1.3%) |
| 75 Years and older | 522 (100.0%) | 0 (0.0%) |
| Total | 2,778 (96.7%) | 95 (3.3%) |
Health Insurance Coverage by Citizenship Status in Woodstock
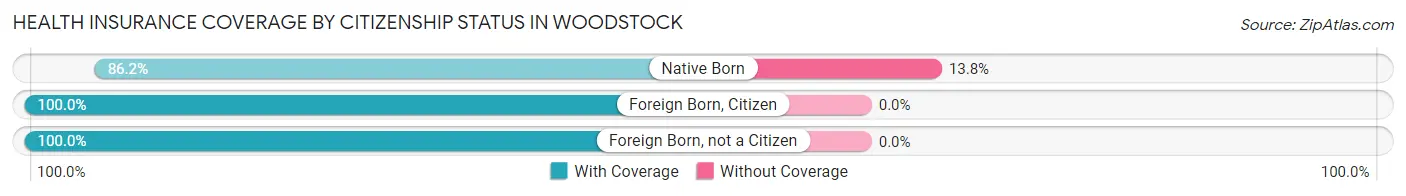
| Citizenship Status | With Coverage | Without Coverage |
| Native Born | 50 (86.2%) | 8 (13.8%) |
| Foreign Born, Citizen | 307 (100.0%) | 0 (0.0%) |
| Foreign Born, not a Citizen | 83 (100.0%) | 0 (0.0%) |
Health Insurance Coverage by Household Income in Woodstock
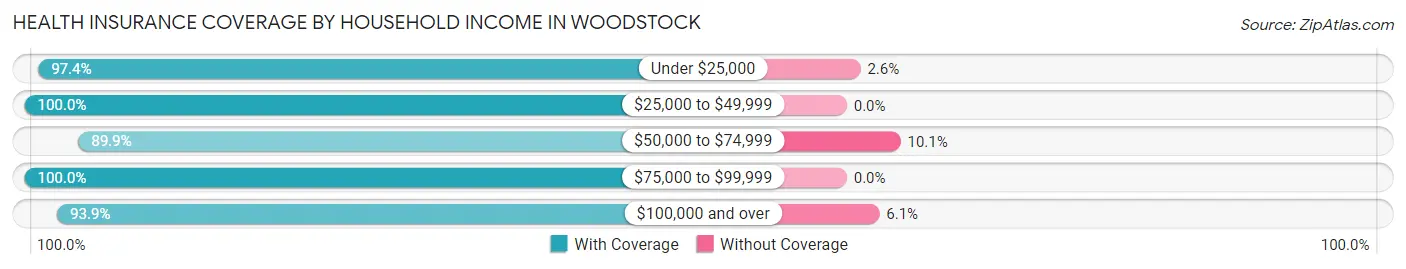
| Household Income | With Coverage | Without Coverage |
| Under $25,000 | 380 (97.4%) | 10 (2.6%) |
| $25,000 to $49,999 | 628 (100.0%) | 0 (0.0%) |
| $50,000 to $74,999 | 250 (89.9%) | 28 (10.1%) |
| $75,000 to $99,999 | 570 (100.0%) | 0 (0.0%) |
| $100,000 and over | 877 (93.9%) | 57 (6.1%) |
Public vs Private Health Insurance Coverage by Age in Woodstock
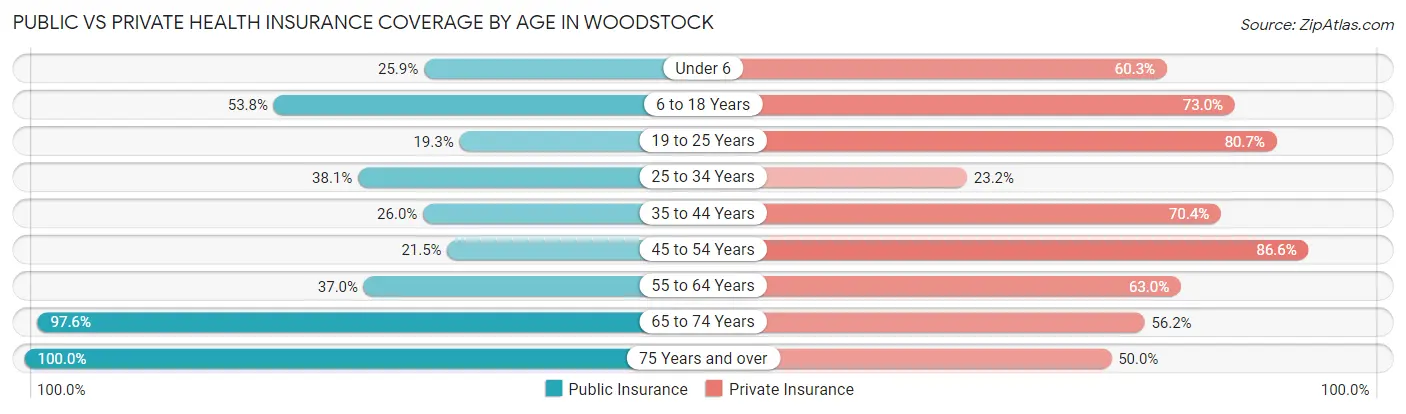
| Age Bracket | Public Insurance | Private Insurance |
| Under 6 | 15 (25.9%) | 35 (60.3%) |
| 6 to 18 Years | 165 (53.7%) | 224 (73.0%) |
| 19 to 25 Years | 16 (19.3%) | 67 (80.7%) |
| 25 to 34 Years | 64 (38.1%) | 39 (23.2%) |
| 35 to 44 Years | 51 (26.0%) | 138 (70.4%) |
| 45 to 54 Years | 74 (21.5%) | 298 (86.6%) |
| 55 to 64 Years | 167 (37.0%) | 284 (63.0%) |
| 65 to 74 Years | 726 (97.6%) | 418 (56.2%) |
| 75 Years and over | 522 (100.0%) | 261 (50.0%) |
| Total | 1,800 (62.6%) | 1,764 (61.4%) |
Disability Status by Sex by Age in Woodstock
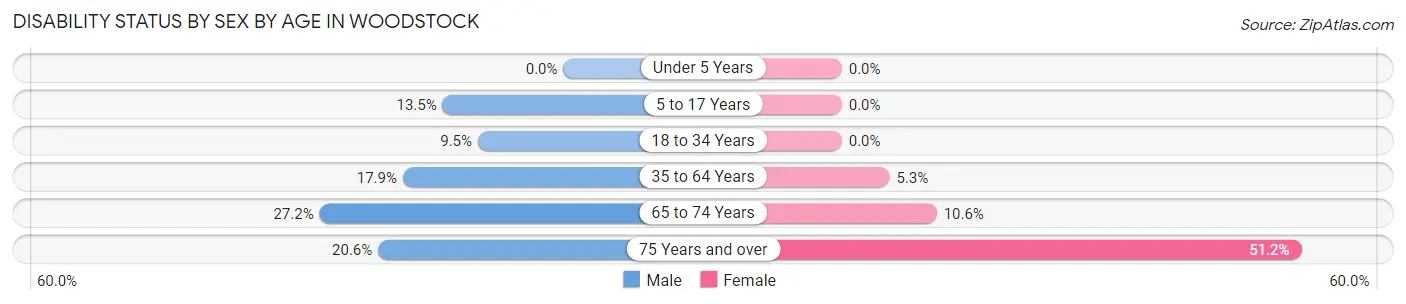
| Age Bracket | Male | Female |
| Under 5 Years | 0 (0.0%) | 0 (0.0%) |
| 5 to 17 Years | 32 (13.5%) | 0 (0.0%) |
| 18 to 34 Years | 14 (9.5%) | 0 (0.0%) |
| 35 to 64 Years | 93 (17.9%) | 25 (5.3%) |
| 65 to 74 Years | 107 (27.2%) | 37 (10.6%) |
| 75 Years and over | 46 (20.6%) | 153 (51.2%) |
Disability Class by Sex by Age in Woodstock
Disability Class: Hearing Difficulty
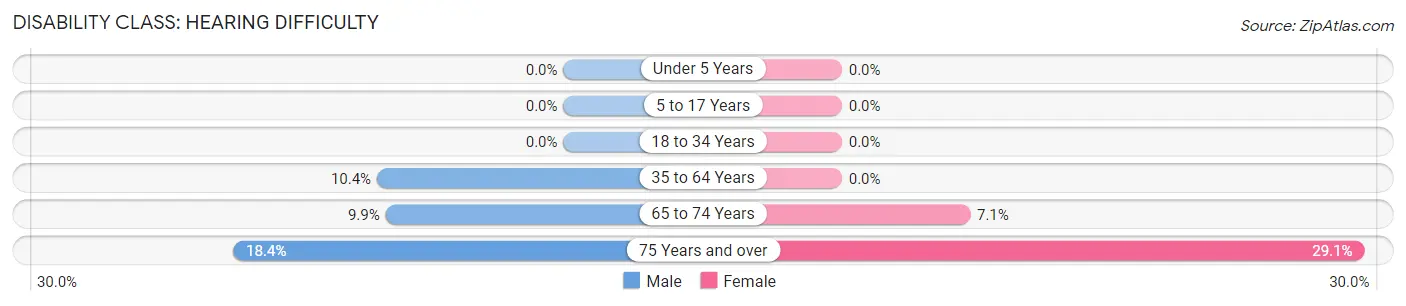
| Age Bracket | Male | Female |
| Under 5 Years | 0 (0.0%) | 0 (0.0%) |
| 5 to 17 Years | 0 (0.0%) | 0 (0.0%) |
| 18 to 34 Years | 0 (0.0%) | 0 (0.0%) |
| 35 to 64 Years | 54 (10.4%) | 0 (0.0%) |
| 65 to 74 Years | 39 (9.9%) | 25 (7.1%) |
| 75 Years and over | 41 (18.4%) | 87 (29.1%) |
Disability Class: Vision Difficulty
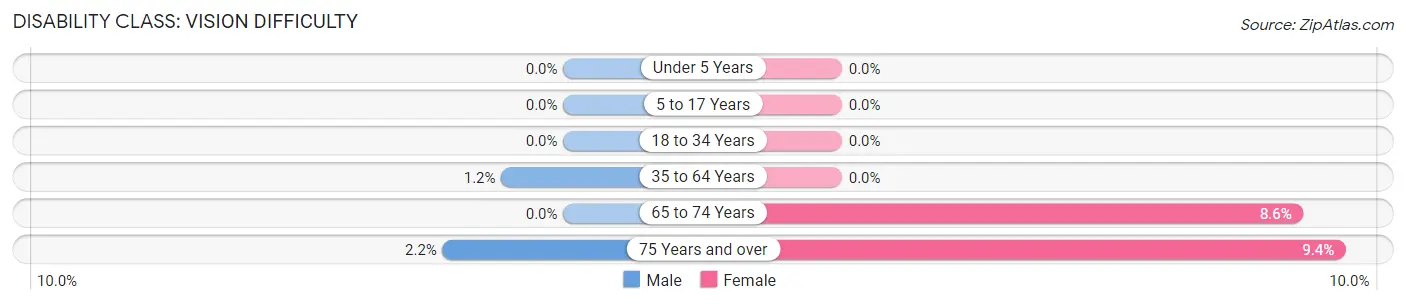
| Age Bracket | Male | Female |
| Under 5 Years | 0 (0.0%) | 0 (0.0%) |
| 5 to 17 Years | 0 (0.0%) | 0 (0.0%) |
| 18 to 34 Years | 0 (0.0%) | 0 (0.0%) |
| 35 to 64 Years | 6 (1.1%) | 0 (0.0%) |
| 65 to 74 Years | 0 (0.0%) | 30 (8.6%) |
| 75 Years and over | 5 (2.2%) | 28 (9.4%) |
Disability Class: Cognitive Difficulty
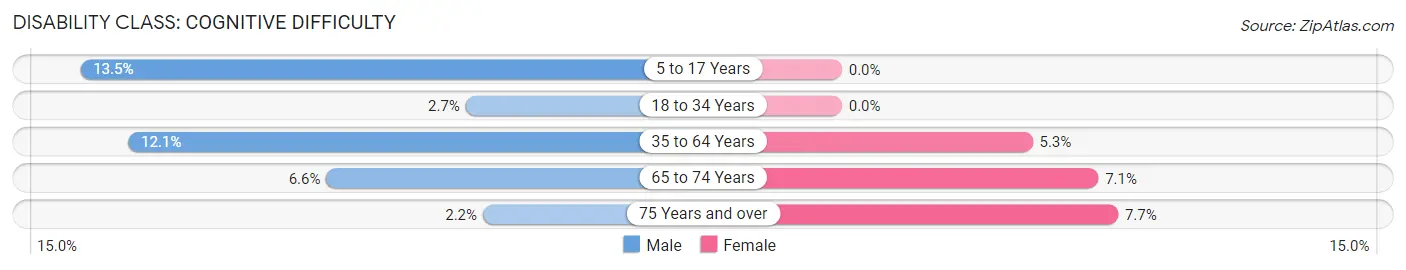
| Age Bracket | Male | Female |
| 5 to 17 Years | 32 (13.5%) | 0 (0.0%) |
| 18 to 34 Years | 4 (2.7%) | 0 (0.0%) |
| 35 to 64 Years | 63 (12.1%) | 25 (5.3%) |
| 65 to 74 Years | 26 (6.6%) | 25 (7.1%) |
| 75 Years and over | 5 (2.2%) | 23 (7.7%) |
Disability Class: Ambulatory Difficulty
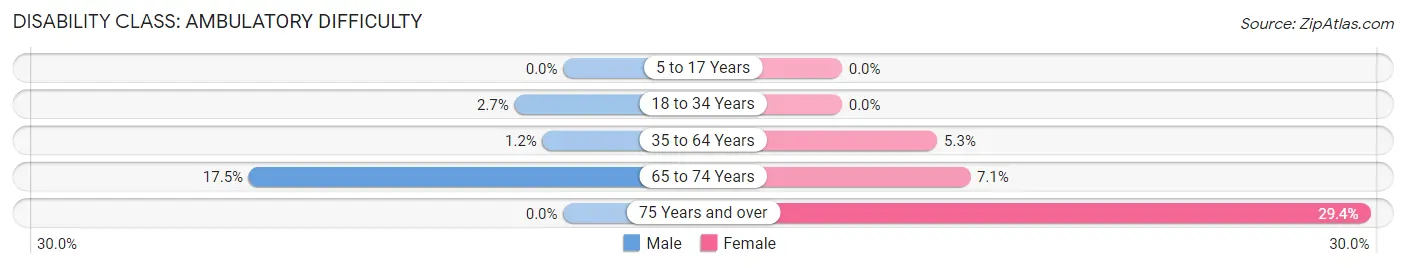
| Age Bracket | Male | Female |
| 5 to 17 Years | 0 (0.0%) | 0 (0.0%) |
| 18 to 34 Years | 4 (2.7%) | 0 (0.0%) |
| 35 to 64 Years | 6 (1.1%) | 25 (5.3%) |
| 65 to 74 Years | 69 (17.5%) | 25 (7.1%) |
| 75 Years and over | 0 (0.0%) | 88 (29.4%) |
Disability Class: Self-Care Difficulty
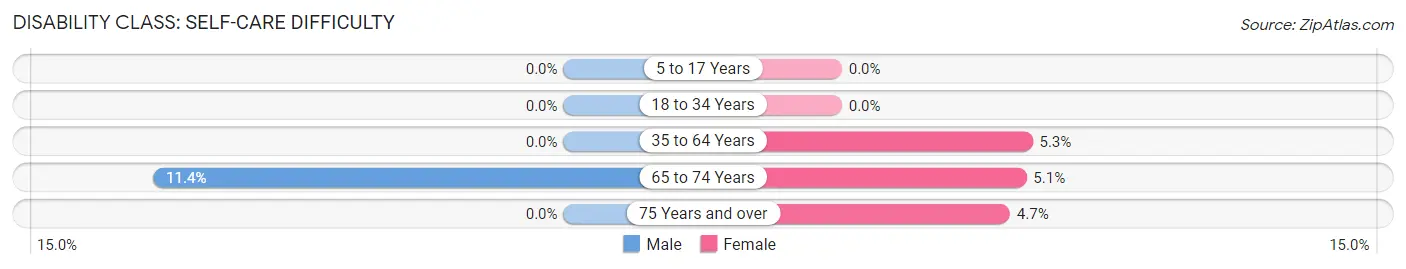
| Age Bracket | Male | Female |
| 5 to 17 Years | 0 (0.0%) | 0 (0.0%) |
| 18 to 34 Years | 0 (0.0%) | 0 (0.0%) |
| 35 to 64 Years | 0 (0.0%) | 25 (5.3%) |
| 65 to 74 Years | 45 (11.4%) | 18 (5.1%) |
| 75 Years and over | 0 (0.0%) | 14 (4.7%) |
Technology Access in Woodstock
Computing Device Access in Woodstock
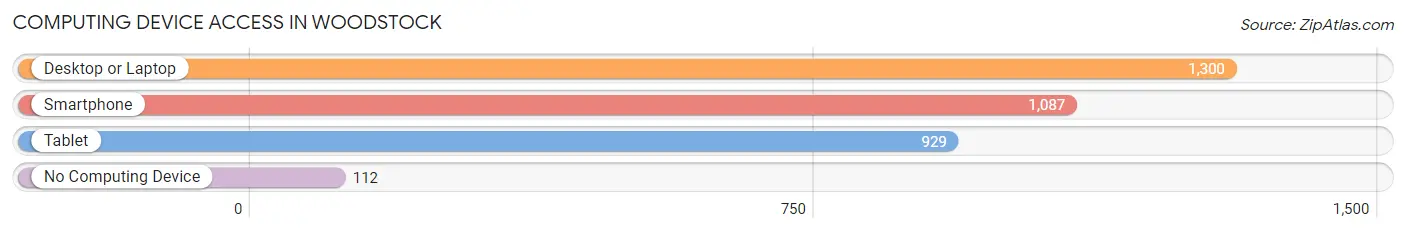
| Device Type | # Households | % Households |
| Desktop or Laptop | 1,300 | 86.0% |
| Smartphone | 1,087 | 71.9% |
| Tablet | 929 | 61.4% |
| No Computing Device | 112 | 7.4% |
| Total | 1,512 | 100.0% |
Internet Access in Woodstock
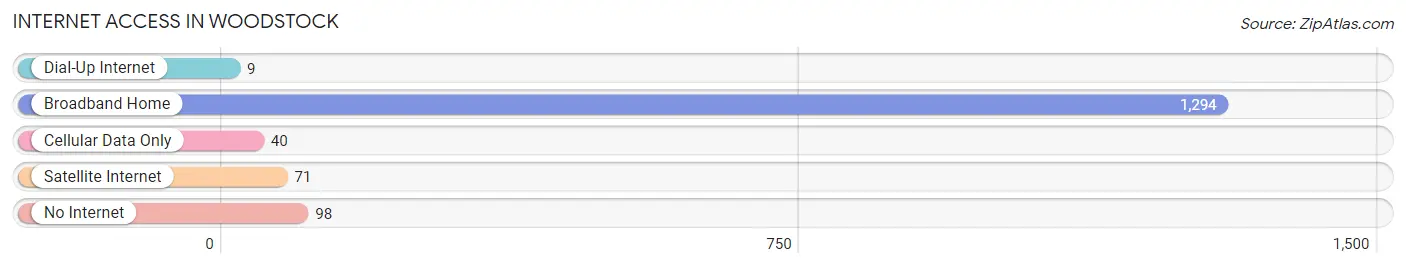
| Internet Type | # Households | % Households |
| Dial-Up Internet | 9 | 0.6% |
| Broadband Home | 1,294 | 85.6% |
| Cellular Data Only | 40 | 2.6% |
| Satellite Internet | 71 | 4.7% |
| No Internet | 98 | 6.5% |
| Total | 1,512 | 100.0% |
Woodstock Summary
Woodstock, NY is a small town located in the Catskill Mountains of New York State. It is situated in Ulster County, approximately 90 miles north of New York City. The town is known for its vibrant artistic and musical culture, and is home to a variety of unique shops, restaurants, and galleries.
History
The area that is now Woodstock was originally inhabited by the Esopus tribe of the Lenape Native Americans. The first European settlers arrived in the area in the late 17th century, and the town was officially established in 1787. The town was named after a nearby settlement called Woodstock, which was founded by a group of Quakers in 1785.
In the 19th century, Woodstock became a popular destination for artists and writers, who were drawn to the area’s natural beauty and peaceful atmosphere. The town was also home to a number of utopian communities, including the Byrdcliffe Colony and the Maverick Colony.
In 1969, Woodstock became the site of the legendary Woodstock Music and Art Fair, which was attended by over 400,000 people. The event was a major milestone in the history of the counterculture movement, and is widely considered to be one of the most important music festivals of all time.
Geography
Woodstock is located in the Catskill Mountains of New York State, approximately 90 miles north of New York City. The town is situated in Ulster County, and is bordered by the towns of Saugerties, Olive, and Hurley.
The town has a total area of 8.2 square miles, of which 8.1 square miles is land and 0.1 square miles is water. The terrain is mostly hilly, with elevations ranging from 500 to 1,500 feet above sea level.
Economy
Woodstock’s economy is largely based on tourism, with many visitors coming to the town to experience its unique culture and natural beauty. The town is also home to a number of small businesses, including restaurants, galleries, and shops.
The town is also home to a number of artists and musicians, who often perform at local venues and festivals. The town is also home to a number of music festivals, including the Woodstock Music and Art Fair, which is held annually in August.
Demographics
As of the 2010 census, Woodstock had a population of 5,884. The racial makeup of the town was 94.3% White, 1.2% African American, 0.3% Native American, 0.7% Asian, 0.1% Pacific Islander, 1.2% from other races, and 2.3% from two or more races. Hispanic or Latino of any race were 4.2% of the population.
The median household income in Woodstock was $50,977, and the median family income was $62,813. The per capita income for the town was $30,945. About 8.3% of families and 11.7% of the population were below the poverty line, including 16.2% of those under age 18 and 5.2% of those age 65 or over.
Common Questions
What is the Total Population of Woodstock?
Total Population of Woodstock is 2,873.
What is the Total Male Population of Woodstock?
Total Male Population of Woodstock is 1,545.
What is the Total Female Population of Woodstock?
Total Female Population of Woodstock is 1,328.
What is the Ratio of Males per 100 Females in Woodstock?
There are 116.34 Males per 100 Females in Woodstock.
What is the Ratio of Females per 100 Males in Woodstock?
There are 85.95 Females per 100 Males in Woodstock.
What is the Median Population Age in Woodstock?
Median Population Age in Woodstock is 61.3 Years.
What is the Average Family Size in Woodstock
Average Family Size in Woodstock is 2.6 People.
What is the Average Household Size in Woodstock
Average Household Size in Woodstock is 1.9 People.
What is Per Capita Income in Woodstock?
Per Capita income in Woodstock is $61,386.
What is the Median Family Income in Woodstock?
Median Family Income in Woodstock is $96,131.
What is the Median Household income in Woodstock?
Median Household Income in Woodstock is $50,938.
What is Income or Wage Gap in Woodstock?
Income or Wage Gap in Woodstock is 41.6%.
Women in Woodstock earn 58.4 cents for every dollar earned by a man.
What is Inequality or Gini Index in Woodstock?
Inequality or Gini Index in Woodstock is 0.61.
How Large is the Labor Force in Woodstock?
There are 1,219 People in the Labor Forcein in Woodstock.
What is the Percentage of People in the Labor Force in Woodstock?
48.2% of People are in the Labor Force in Woodstock.
What is the Unemployment Rate in Woodstock?
Unemployment Rate in Woodstock is 8.0%.