Youngstown, NY
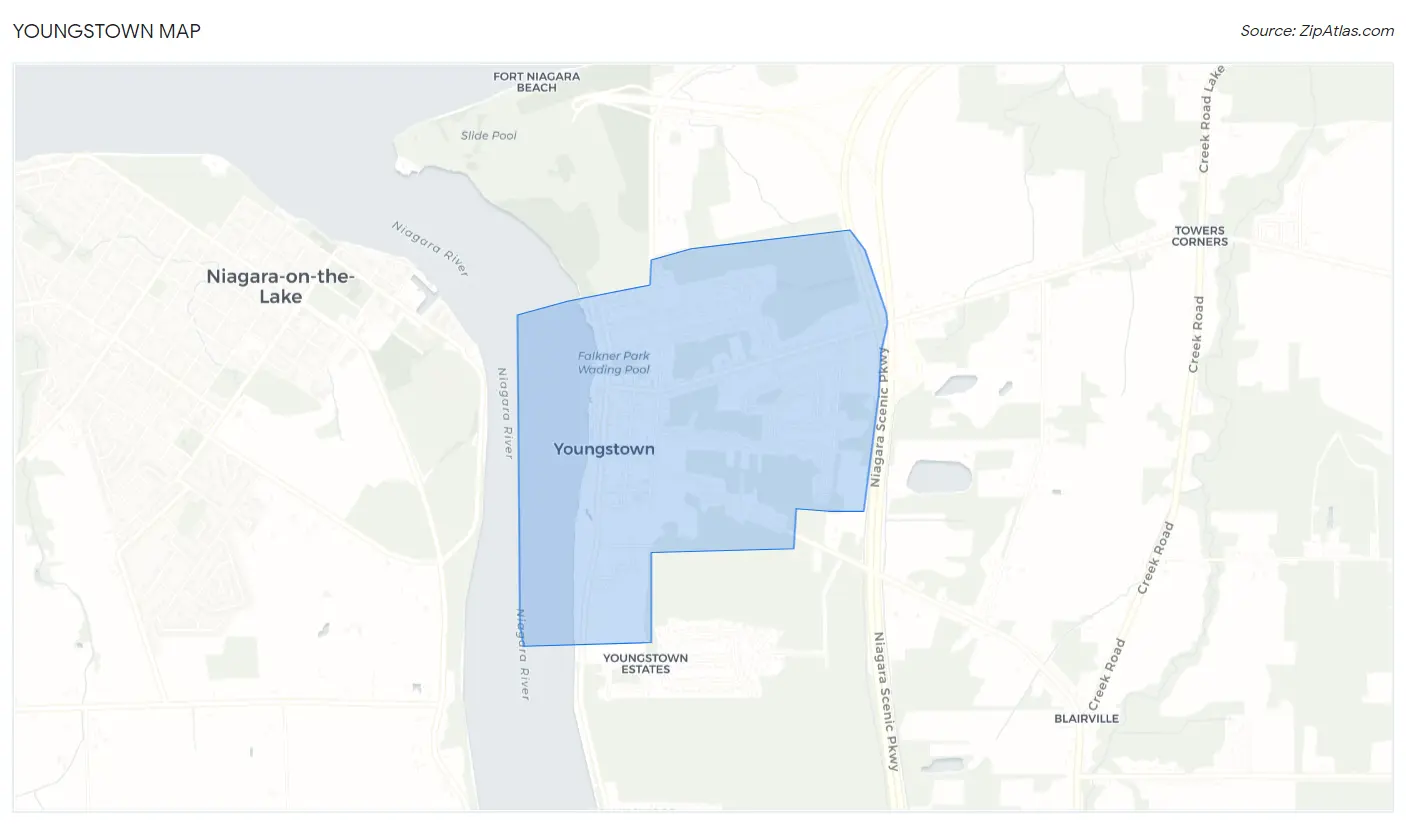
Youngstown Map
Youngstown Overview
1,965
TOTAL POPULATION
893
MALE POPULATION
1,072
FEMALE POPULATION
83.30
MALES / 100 FEMALES
120.04
FEMALES / 100 MALES
47.5
MEDIAN AGE
2.9
AVG FAMILY SIZE
2.4
AVG HOUSEHOLD SIZE
$39,356
PER CAPITA INCOME
$94,271
AVG FAMILY INCOME
$76,467
AVG HOUSEHOLD INCOME
30.5%
WAGE / INCOME GAP [ % ]
69.5¢/ $1
WAGE / INCOME GAP [ $ ]
0.41
INEQUALITY / GINI INDEX
905
LABOR FORCE [ PEOPLE ]
57.5%
PERCENT IN LABOR FORCE
7.0%
UNEMPLOYMENT RATE
Youngstown Zip Codes
Youngstown Area Codes
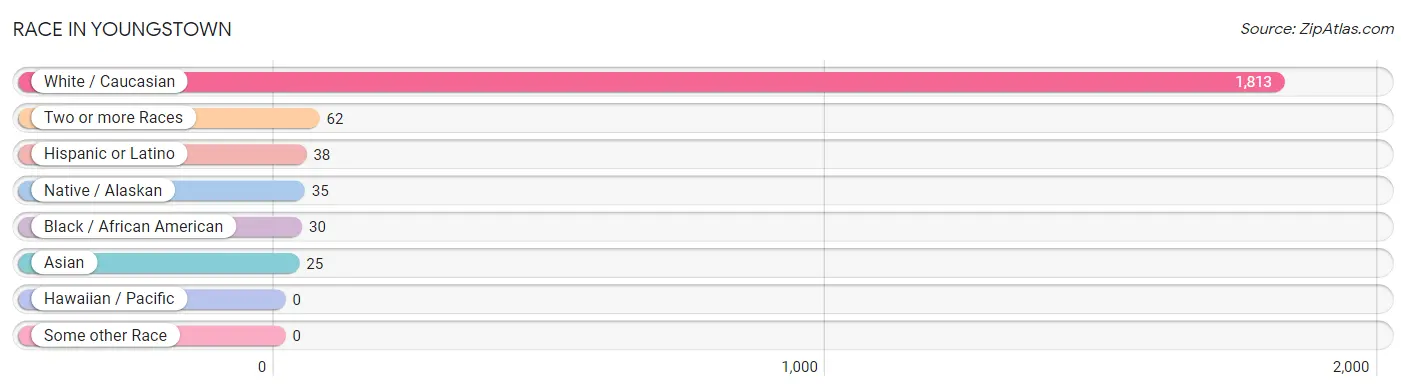
Race in Youngstown
The most populous races in Youngstown are White / Caucasian (1,813 | 92.3%), Two or more Races (62 | 3.2%), and Hispanic or Latino (38 | 1.9%).
| Race | # Population | % Population |
| Asian | 25 | 1.3% |
| Black / African American | 30 | 1.5% |
| Hawaiian / Pacific | 0 | 0.0% |
| Hispanic or Latino | 38 | 1.9% |
| Native / Alaskan | 35 | 1.8% |
| White / Caucasian | 1,813 | 92.3% |
| Two or more Races | 62 | 3.2% |
| Some other Race | 0 | 0.0% |
| Total | 1,965 | 100.0% |
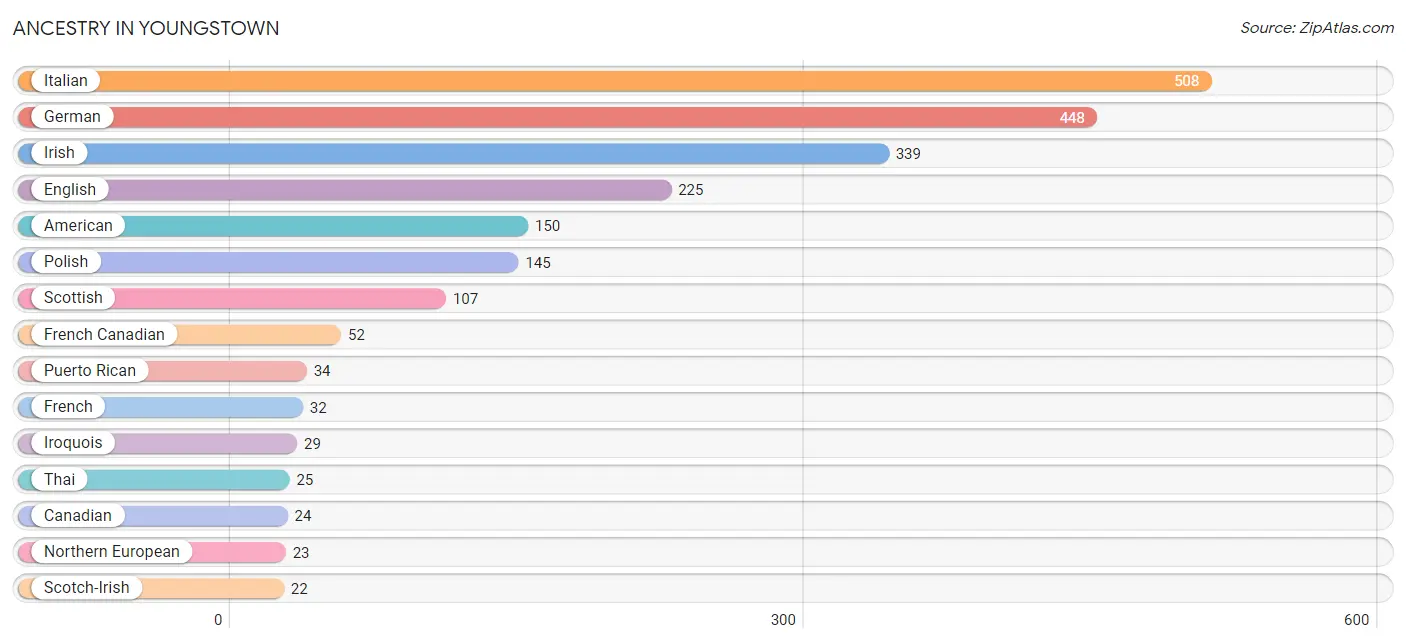
Ancestry in Youngstown
The most populous ancestries reported in Youngstown are Italian (508 | 25.9%), German (448 | 22.8%), Irish (339 | 17.2%), English (225 | 11.5%), and American (150 | 7.6%), together accounting for 85.0% of all Youngstown residents.
| Ancestry | # Population | % Population |
| American | 150 | 7.6% |
| Bhutanese | 15 | 0.8% |
| British | 14 | 0.7% |
| Canadian | 24 | 1.2% |
| Croatian | 4 | 0.2% |
| Dutch | 12 | 0.6% |
| English | 225 | 11.5% |
| European | 5 | 0.3% |
| French | 32 | 1.6% |
| French Canadian | 52 | 2.6% |
| German | 448 | 22.8% |
| Greek | 6 | 0.3% |
| Hungarian | 20 | 1.0% |
| Irish | 339 | 17.2% |
| Iroquois | 29 | 1.5% |
| Italian | 508 | 25.9% |
| Lithuanian | 4 | 0.2% |
| Northern European | 23 | 1.2% |
| Norwegian | 5 | 0.3% |
| Polish | 145 | 7.4% |
| Puerto Rican | 34 | 1.7% |
| Scotch-Irish | 22 | 1.1% |
| Scottish | 107 | 5.4% |
| Slovene | 5 | 0.3% |
| Spaniard | 4 | 0.2% |
| Swedish | 17 | 0.9% |
| Swiss | 16 | 0.8% |
| Thai | 25 | 1.3% | View All 28 Rows |
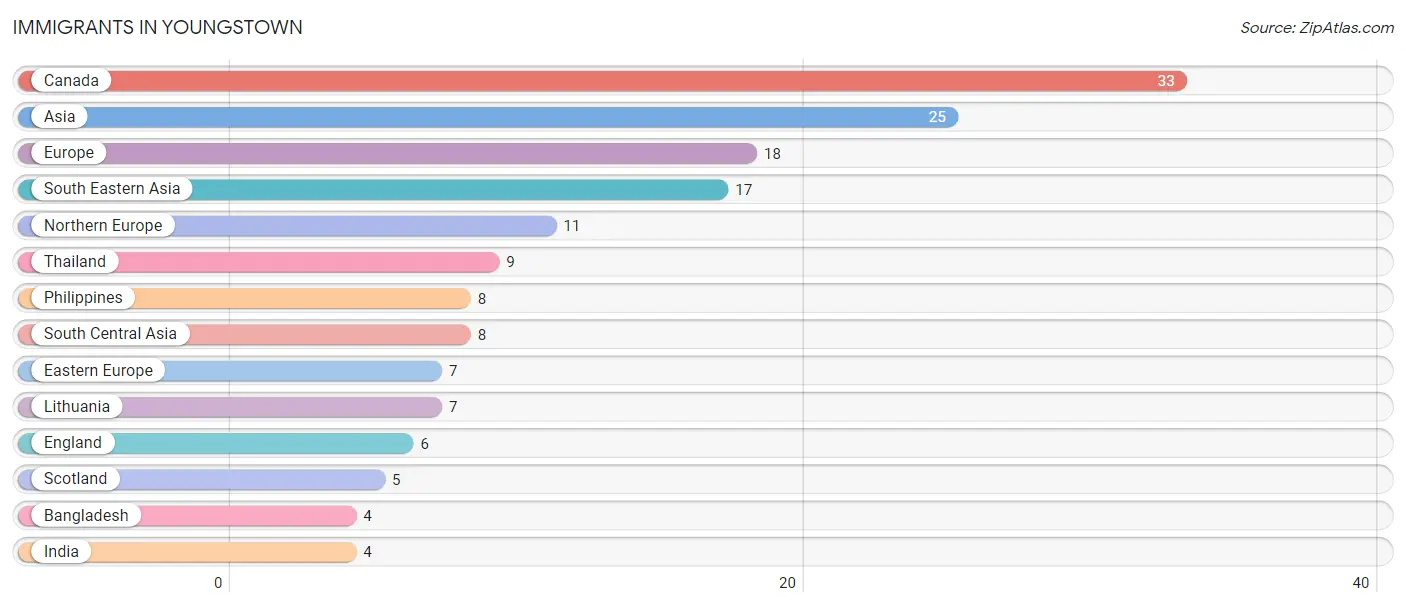
Immigrants in Youngstown
The most numerous immigrant groups reported in Youngstown came from Canada (33 | 1.7%), Asia (25 | 1.3%), Europe (18 | 0.9%), South Eastern Asia (17 | 0.9%), and Northern Europe (11 | 0.6%), together accounting for 5.3% of all Youngstown residents.
| Immigration Origin | # Population | % Population |
| Asia | 25 | 1.3% |
| Bangladesh | 4 | 0.2% |
| Canada | 33 | 1.7% |
| Eastern Europe | 7 | 0.4% |
| England | 6 | 0.3% |
| Europe | 18 | 0.9% |
| India | 4 | 0.2% |
| Lithuania | 7 | 0.4% |
| Northern Europe | 11 | 0.6% |
| Philippines | 8 | 0.4% |
| Scotland | 5 | 0.3% |
| South Central Asia | 8 | 0.4% |
| South Eastern Asia | 17 | 0.9% |
| Thailand | 9 | 0.5% | View All 14 Rows |
Sex and Age in Youngstown
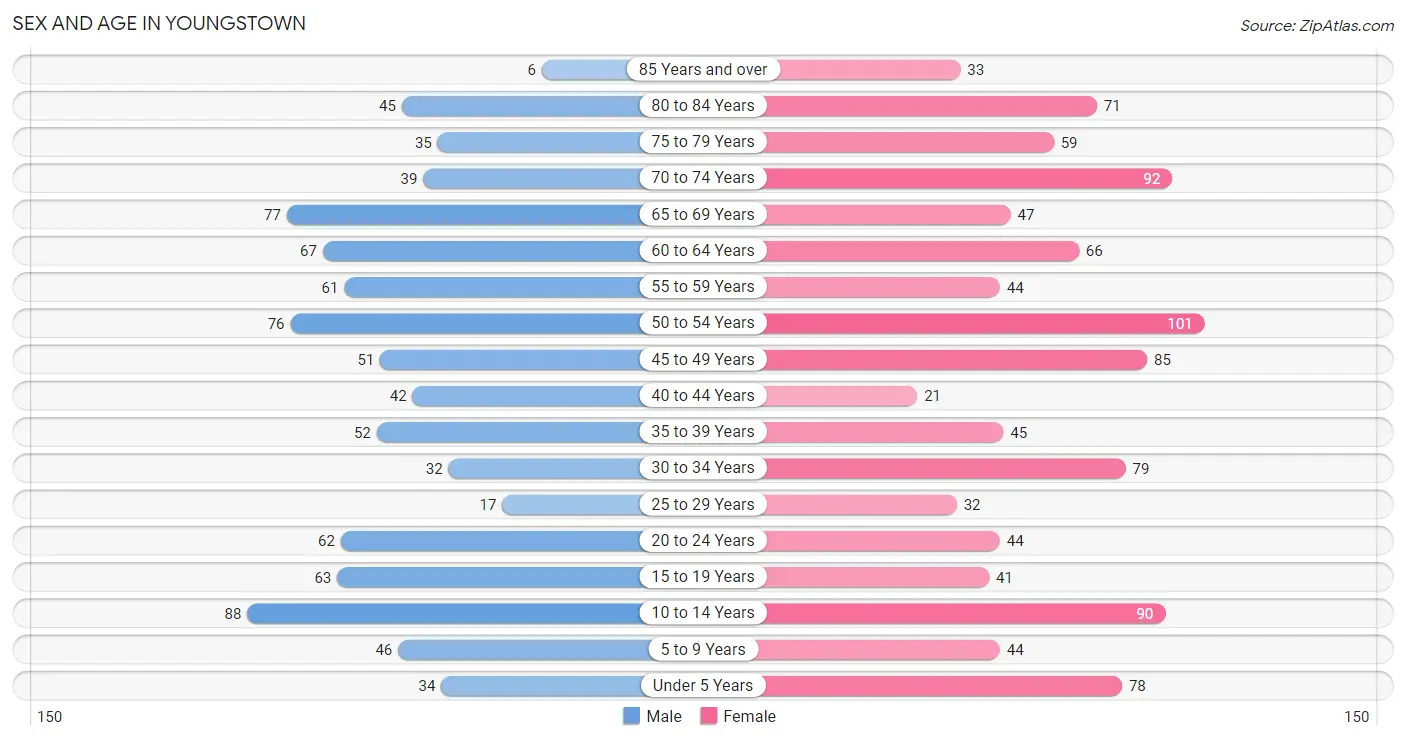
Sex and Age in Youngstown
The most populous age groups in Youngstown are 10 to 14 Years (88 | 9.9%) for men and 50 to 54 Years (101 | 9.4%) for women.
| Age Bracket | Male | Female |
| Under 5 Years | 34 (3.8%) | 78 (7.3%) |
| 5 to 9 Years | 46 (5.1%) | 44 (4.1%) |
| 10 to 14 Years | 88 (9.9%) | 90 (8.4%) |
| 15 to 19 Years | 63 (7.0%) | 41 (3.8%) |
| 20 to 24 Years | 62 (6.9%) | 44 (4.1%) |
| 25 to 29 Years | 17 (1.9%) | 32 (3.0%) |
| 30 to 34 Years | 32 (3.6%) | 79 (7.4%) |
| 35 to 39 Years | 52 (5.8%) | 45 (4.2%) |
| 40 to 44 Years | 42 (4.7%) | 21 (2.0%) |
| 45 to 49 Years | 51 (5.7%) | 85 (7.9%) |
| 50 to 54 Years | 76 (8.5%) | 101 (9.4%) |
| 55 to 59 Years | 61 (6.8%) | 44 (4.1%) |
| 60 to 64 Years | 67 (7.5%) | 66 (6.2%) |
| 65 to 69 Years | 77 (8.6%) | 47 (4.4%) |
| 70 to 74 Years | 39 (4.4%) | 92 (8.6%) |
| 75 to 79 Years | 35 (3.9%) | 59 (5.5%) |
| 80 to 84 Years | 45 (5.0%) | 71 (6.6%) |
| 85 Years and over | 6 (0.7%) | 33 (3.1%) |
| Total | 893 (100.0%) | 1,072 (100.0%) |
Families and Households in Youngstown
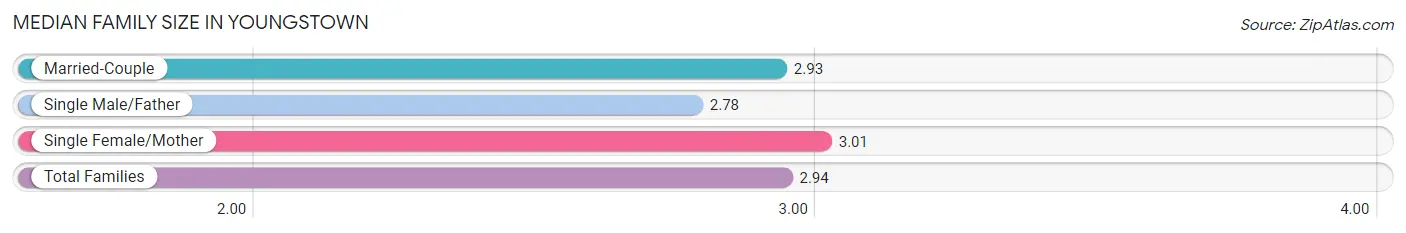
Median Family Size in Youngstown
The median family size in Youngstown is 2.94 persons per family, with single female/mother families (95 | 16.4%) accounting for the largest median family size of 3.01 persons per family. On the other hand, single male/father families (18 | 3.1%) represent the smallest median family size with 2.78 persons per family.
| Family Type | # Families | Family Size |
| Married-Couple | 466 (80.5%) | 2.93 |
| Single Male/Father | 18 (3.1%) | 2.78 |
| Single Female/Mother | 95 (16.4%) | 3.01 |
| Total Families | 579 (100.0%) | 2.94 |
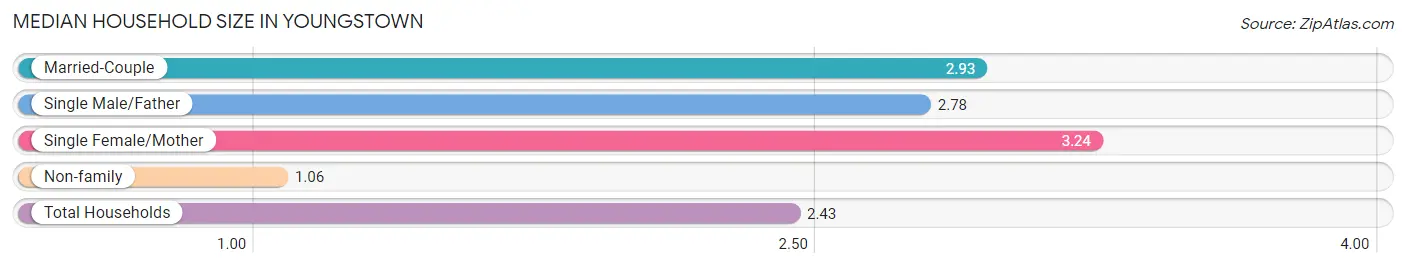
Median Household Size in Youngstown
The median household size in Youngstown is 2.43 persons per household, with single female/mother households (95 | 11.8%) accounting for the largest median household size of 3.24 persons per household. non-family households (228 | 28.2%) represent the smallest median household size with 1.06 persons per household.
| Household Type | # Households | Household Size |
| Married-Couple | 466 (57.7%) | 2.93 |
| Single Male/Father | 18 (2.2%) | 2.78 |
| Single Female/Mother | 95 (11.8%) | 3.24 |
| Non-family | 228 (28.2%) | 1.06 |
| Total Households | 807 (100.0%) | 2.43 |
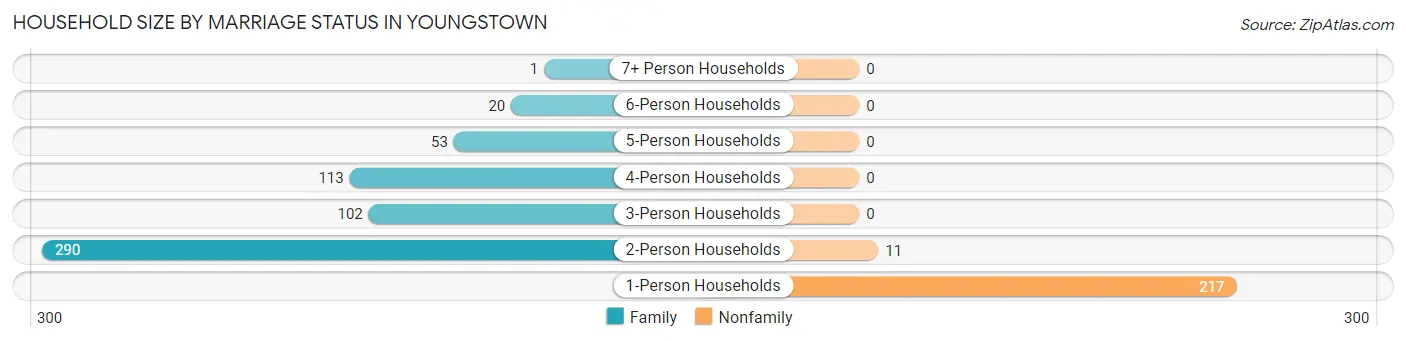
Household Size by Marriage Status in Youngstown
Out of a total of 807 households in Youngstown, 579 (71.8%) are family households, while 228 (28.2%) are nonfamily households. The most numerous type of family households are 2-person households, comprising 290, and the most common type of nonfamily households are 1-person households, comprising 217.
| Household Size | Family Households | Nonfamily Households |
| 1-Person Households | - | 217 (26.9%) |
| 2-Person Households | 290 (35.9%) | 11 (1.4%) |
| 3-Person Households | 102 (12.6%) | 0 (0.0%) |
| 4-Person Households | 113 (14.0%) | 0 (0.0%) |
| 5-Person Households | 53 (6.6%) | 0 (0.0%) |
| 6-Person Households | 20 (2.5%) | 0 (0.0%) |
| 7+ Person Households | 1 (0.1%) | 0 (0.0%) |
| Total | 579 (71.8%) | 228 (28.2%) |
Female Fertility in Youngstown
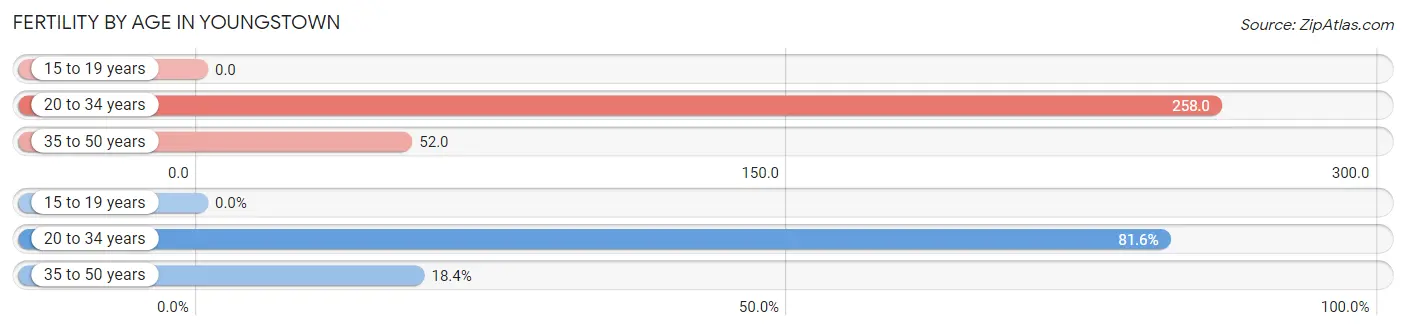
Fertility by Age in Youngstown
Average fertility rate in Youngstown is 133.0 births per 1,000 women. Women in the age bracket of 20 to 34 years have the highest fertility rate with 258.0 births per 1,000 women. Women in the age bracket of 20 to 34 years acount for 81.6% of all women with births.
| Age Bracket | Women with Births | Births / 1,000 Women |
| 15 to 19 years | 0 (0.0%) | 0.0 |
| 20 to 34 years | 40 (81.6%) | 258.0 |
| 35 to 50 years | 9 (18.4%) | 52.0 |
| Total | 49 (100.0%) | 133.0 |
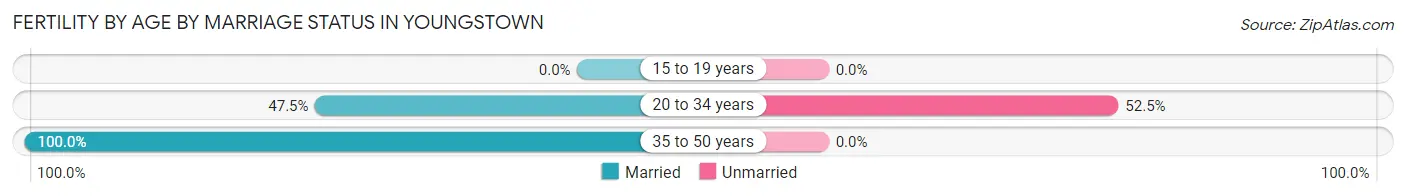
Fertility by Age by Marriage Status in Youngstown
57.1% of women with births (49) in Youngstown are married. The highest percentage of unmarried women with births falls into 20 to 34 years age bracket with 52.5% of them unmarried at the time of birth, while the lowest percentage of unmarried women with births belong to 35 to 50 years age bracket with 0.0% of them unmarried.
| Age Bracket | Married | Unmarried |
| 15 to 19 years | 0 (0.0%) | 0 (0.0%) |
| 20 to 34 years | 19 (47.5%) | 21 (52.5%) |
| 35 to 50 years | 9 (100.0%) | 0 (0.0%) |
| Total | 28 (57.1%) | 21 (42.9%) |
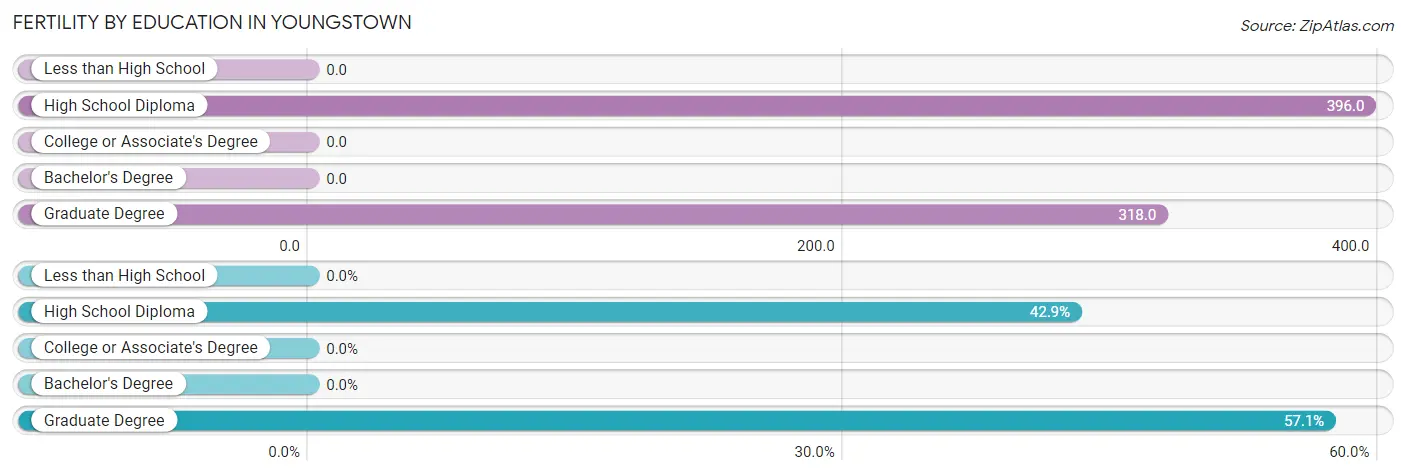
Fertility by Education in Youngstown
| Educational Attainment | Women with Births | Births / 1,000 Women |
| Less than High School | 0 (0.0%) | 0.0 |
| High School Diploma | 21 (42.9%) | 396.0 |
| College or Associate's Degree | 0 (0.0%) | 0.0 |
| Bachelor's Degree | 0 (0.0%) | 0.0 |
| Graduate Degree | 28 (57.1%) | 318.0 |
| Total | 49 (100.0%) | 133.0 |
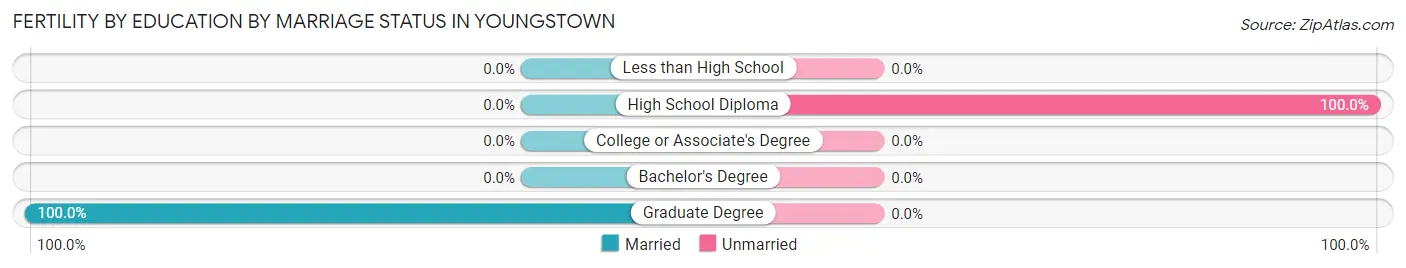
Fertility by Education by Marriage Status in Youngstown
42.9% of women with births in Youngstown are unmarried. Women with the educational attainment of graduate degree are most likely to be married with 100.0% of them married at childbirth, while women with the educational attainment of high school diploma are least likely to be married with 100.0% of them unmarried at childbirth.
| Educational Attainment | Married | Unmarried |
| Less than High School | 0 (0.0%) | 0 (0.0%) |
| High School Diploma | 0 (0.0%) | 21 (100.0%) |
| College or Associate's Degree | 0 (0.0%) | 0 (0.0%) |
| Bachelor's Degree | 0 (0.0%) | 0 (0.0%) |
| Graduate Degree | 28 (100.0%) | 0 (0.0%) |
| Total | 28 (57.1%) | 21 (42.9%) |
Income in Youngstown
Income Overview in Youngstown
Per Capita Income in Youngstown is $39,356, while median incomes of families and households are $94,271 and $76,467 respectively.
| Characteristic | Number | Measure |
| Per Capita Income | 1,965 | $39,356 |
| Median Family Income | 579 | $94,271 |
| Mean Family Income | 579 | $109,412 |
| Median Household Income | 807 | $76,467 |
| Mean Household Income | 807 | $95,492 |
| Income Deficit | 579 | $0 |
| Wage / Income Gap (%) | 1,965 | 30.53% |
| Wage / Income Gap ($) | 1,965 | 69.47¢ per $1 |
| Gini / Inequality Index | 1,965 | 0.41 |
Earnings by Sex in Youngstown
Average Earnings in Youngstown are $50,982, $64,028 for men and $44,479 for women, a difference of 30.5%.
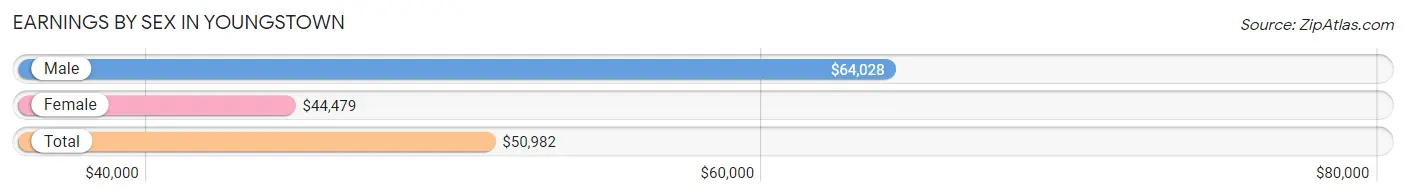
| Sex | Number | Average Earnings |
| Male | 491 (52.0%) | $64,028 |
| Female | 453 (48.0%) | $44,479 |
| Total | 944 (100.0%) | $50,982 |
Earnings by Sex by Income Bracket in Youngstown
The most common earnings brackets in Youngstown are $100,000+ for men (135 | 27.5%) and $75,000 to $99,999 for women (61 | 13.5%).
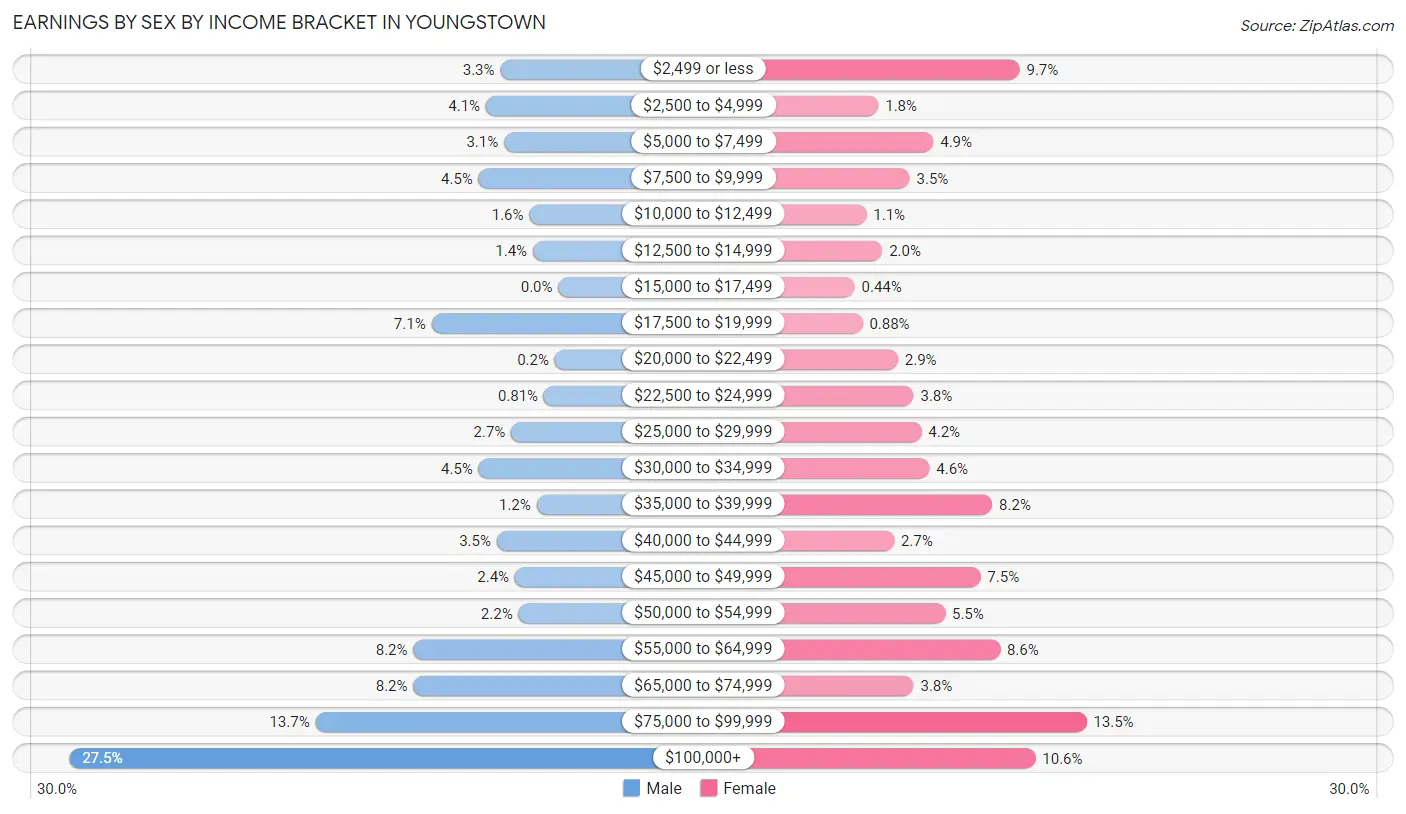
| Income | Male | Female |
| $2,499 or less | 16 (3.3%) | 44 (9.7%) |
| $2,500 to $4,999 | 20 (4.1%) | 8 (1.8%) |
| $5,000 to $7,499 | 15 (3.0%) | 22 (4.9%) |
| $7,500 to $9,999 | 22 (4.5%) | 16 (3.5%) |
| $10,000 to $12,499 | 8 (1.6%) | 5 (1.1%) |
| $12,500 to $14,999 | 7 (1.4%) | 9 (2.0%) |
| $15,000 to $17,499 | 0 (0.0%) | 2 (0.4%) |
| $17,500 to $19,999 | 35 (7.1%) | 4 (0.9%) |
| $20,000 to $22,499 | 1 (0.2%) | 13 (2.9%) |
| $22,500 to $24,999 | 4 (0.8%) | 17 (3.7%) |
| $25,000 to $29,999 | 13 (2.6%) | 19 (4.2%) |
| $30,000 to $34,999 | 22 (4.5%) | 21 (4.6%) |
| $35,000 to $39,999 | 6 (1.2%) | 37 (8.2%) |
| $40,000 to $44,999 | 17 (3.5%) | 12 (2.6%) |
| $45,000 to $49,999 | 12 (2.4%) | 34 (7.5%) |
| $50,000 to $54,999 | 11 (2.2%) | 25 (5.5%) |
| $55,000 to $64,999 | 40 (8.2%) | 39 (8.6%) |
| $65,000 to $74,999 | 40 (8.2%) | 17 (3.7%) |
| $75,000 to $99,999 | 67 (13.7%) | 61 (13.5%) |
| $100,000+ | 135 (27.5%) | 48 (10.6%) |
| Total | 491 (100.0%) | 453 (100.0%) |
Earnings by Sex by Educational Attainment in Youngstown
Average earnings in Youngstown are $72,024 for men and $49,286 for women, a difference of 31.6%. Men with an educational attainment of bachelor's degree enjoy the highest average annual earnings of $94,722, while those with high school diploma education earn the least with $58,355. Women with an educational attainment of graduate degree earn the most with the average annual earnings of $68,250, while those with high school diploma education have the smallest earnings of $35,625.
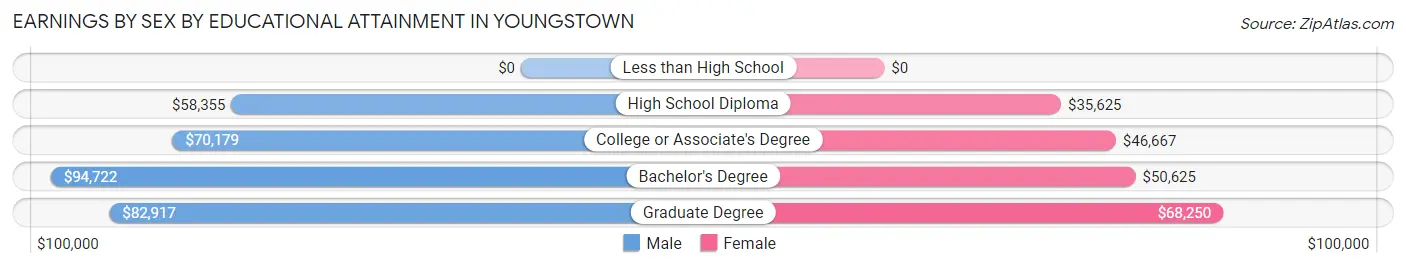
| Educational Attainment | Male Income | Female Income |
| Less than High School | - | - |
| High School Diploma | $58,355 | $35,625 |
| College or Associate's Degree | $70,179 | $46,667 |
| Bachelor's Degree | $94,722 | $50,625 |
| Graduate Degree | $82,917 | $68,250 |
| Total | $72,024 | $49,286 |
Family Income in Youngstown
Family Income Brackets in Youngstown
According to the Youngstown family income data, there are 129 families falling into the $100,000 to $149,999 income range, which is the most common income bracket and makes up 22.3% of all families.
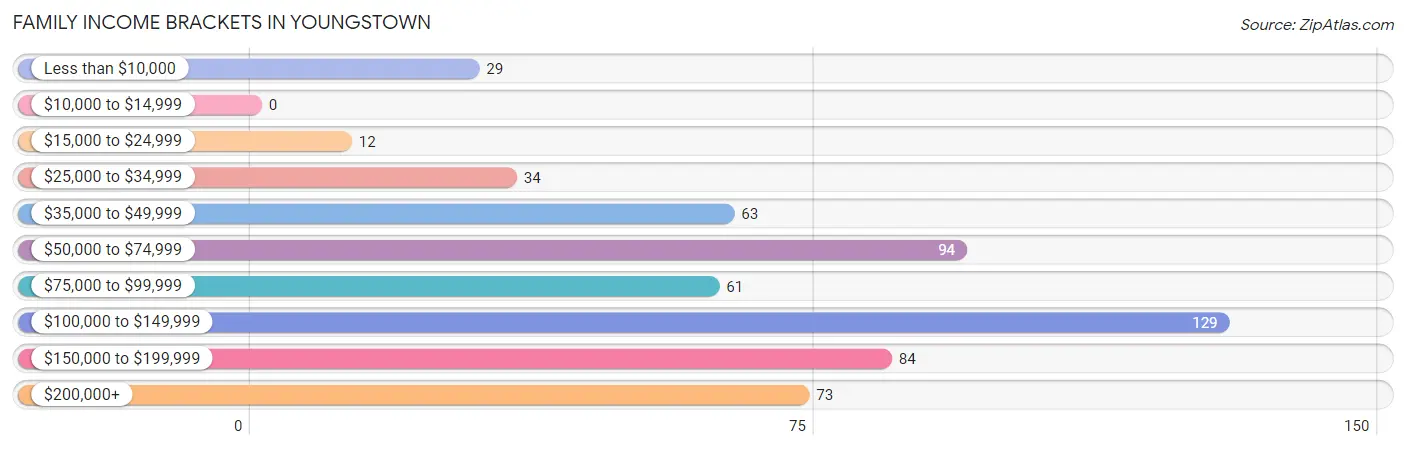
| Income Bracket | # Families | % Families |
| Less than $10,000 | 29 | 5.0% |
| $10,000 to $14,999 | 0 | 0.0% |
| $15,000 to $24,999 | 12 | 2.1% |
| $25,000 to $34,999 | 34 | 5.9% |
| $35,000 to $49,999 | 63 | 10.9% |
| $50,000 to $74,999 | 94 | 16.2% |
| $75,000 to $99,999 | 61 | 10.5% |
| $100,000 to $149,999 | 129 | 22.3% |
| $150,000 to $199,999 | 84 | 14.5% |
| $200,000+ | 73 | 12.6% |
Family Income by Famaliy Size in Youngstown
5-person families (53 | 9.1%) account for the highest median family income in Youngstown with $148,631 per family, while 3-person families (101 | 17.4%) have the highest median income of $46,083 per family member.

| Income Bracket | # Families | Median Income |
| 2-Person Families | 298 (51.5%) | $69,783 |
| 3-Person Families | 101 (17.4%) | $138,250 |
| 4-Person Families | 108 (18.6%) | $130,469 |
| 5-Person Families | 53 (9.1%) | $148,631 |
| 6-Person Families | 18 (3.1%) | $0 |
| 7+ Person Families | 1 (0.2%) | $0 |
| Total | 579 (100.0%) | $94,271 |
Family Income by Number of Earners in Youngstown
The median family income in Youngstown is $94,271, with families comprising 2 earners (159) having the highest median family income of $151,339, while families with no earners (135) have the lowest median family income of $41,438, accounting for 27.5% and 23.3% of families, respectively.
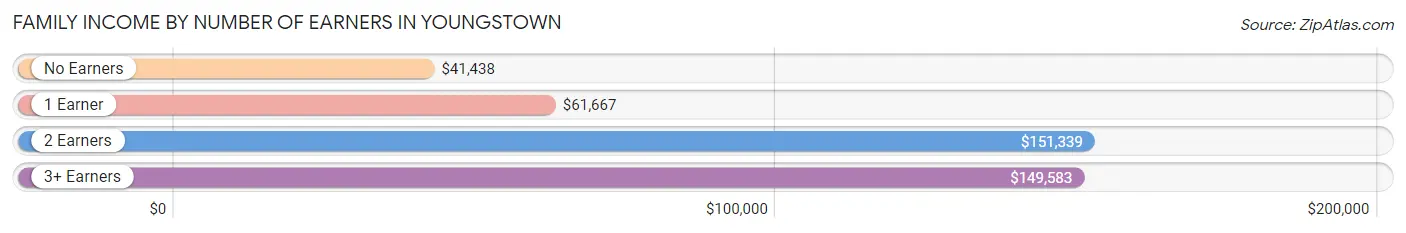
| Number of Earners | # Families | Median Income |
| No Earners | 135 (23.3%) | $41,438 |
| 1 Earner | 206 (35.6%) | $61,667 |
| 2 Earners | 159 (27.5%) | $151,339 |
| 3+ Earners | 79 (13.6%) | $149,583 |
| Total | 579 (100.0%) | $94,271 |
Household Income in Youngstown
Household Income Brackets in Youngstown
With 157 households falling in the category, the $100,000 to $149,999 income range is the most frequent in Youngstown, accounting for 19.5% of all households. In contrast, only 5 households (0.6%) fall into the $10,000 to $14,999 income bracket, making it the least populous group.
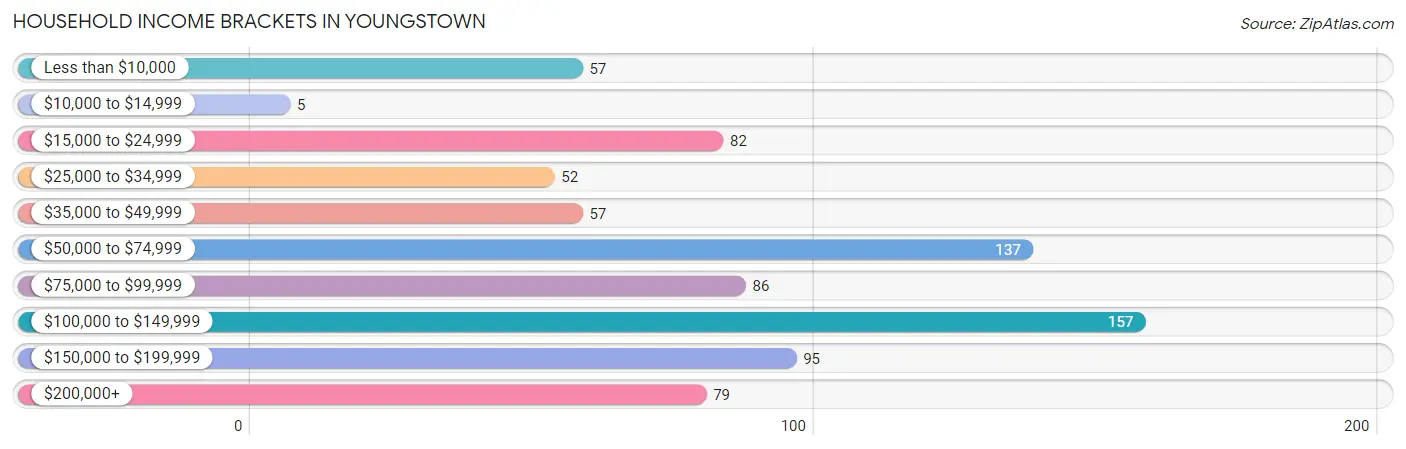
| Income Bracket | # Households | % Households |
| Less than $10,000 | 57 | 7.1% |
| $10,000 to $14,999 | 5 | 0.6% |
| $15,000 to $24,999 | 82 | 10.2% |
| $25,000 to $34,999 | 52 | 6.4% |
| $35,000 to $49,999 | 57 | 7.1% |
| $50,000 to $74,999 | 137 | 17.0% |
| $75,000 to $99,999 | 86 | 10.7% |
| $100,000 to $149,999 | 157 | 19.5% |
| $150,000 to $199,999 | 95 | 11.8% |
| $200,000+ | 79 | 9.8% |
Household Income by Householder Age in Youngstown
The median household income in Youngstown is $76,467, with the highest median household income of $120,469 found in the 25 to 44 years age bracket for the primary householder. A total of 143 households (17.7%) fall into this category.
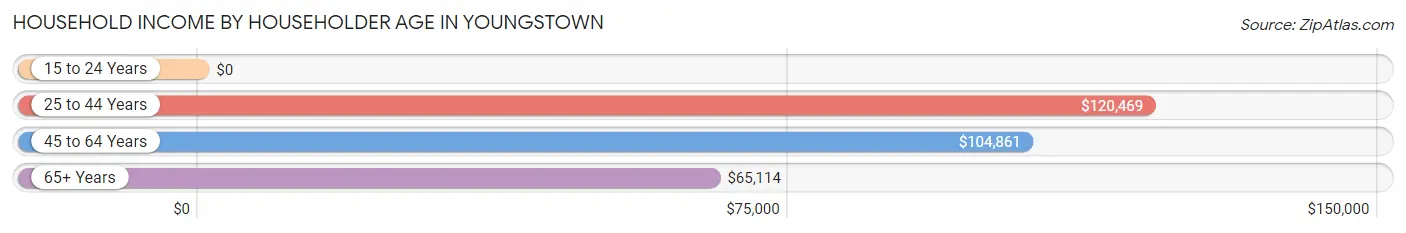
| Income Bracket | # Households | Median Income |
| 15 to 24 Years | 0 (0.0%) | $0 |
| 25 to 44 Years | 143 (17.7%) | $120,469 |
| 45 to 64 Years | 333 (41.3%) | $104,861 |
| 65+ Years | 331 (41.0%) | $65,114 |
| Total | 807 (100.0%) | $76,467 |
Poverty in Youngstown
Income Below Poverty by Sex and Age in Youngstown
With 10.1% poverty level for males and 9.4% for females among the residents of Youngstown, under 5 year old males and under 5 year old females are the most vulnerable to poverty, with 17 males (50.0%) and 20 females (25.6%) in their respective age groups living below the poverty level.
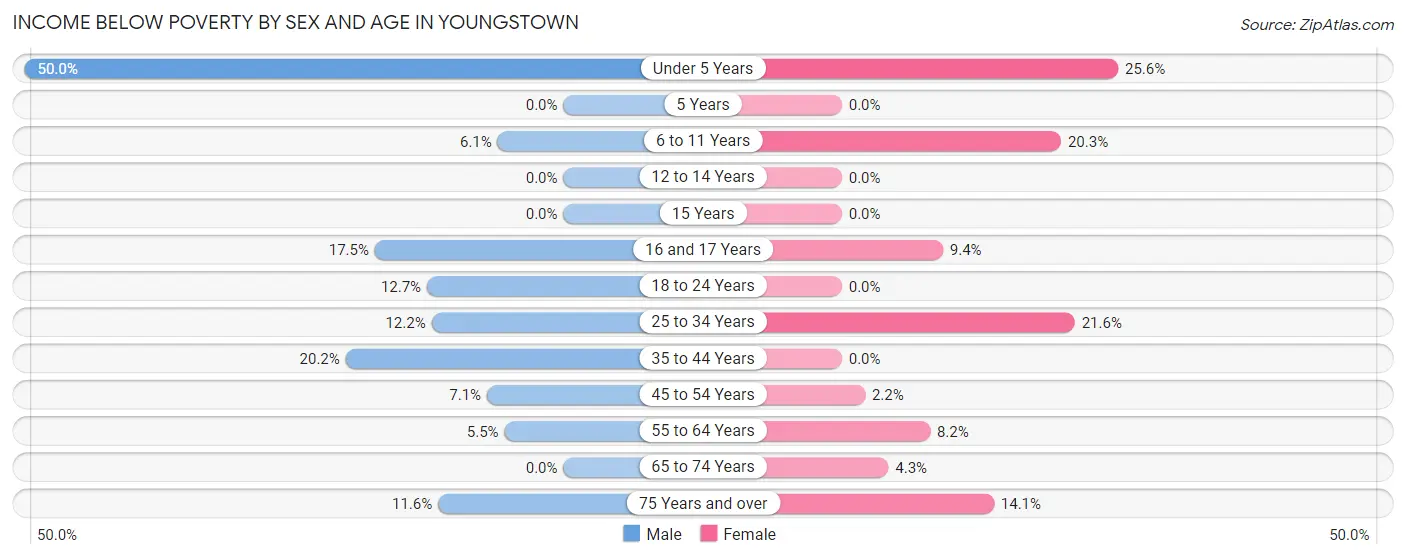
| Age Bracket | Male | Female |
| Under 5 Years | 17 (50.0%) | 20 (25.6%) |
| 5 Years | 0 (0.0%) | 0 (0.0%) |
| 6 to 11 Years | 5 (6.1%) | 12 (20.3%) |
| 12 to 14 Years | 0 (0.0%) | 0 (0.0%) |
| 15 Years | 0 (0.0%) | 0 (0.0%) |
| 16 and 17 Years | 7 (17.5%) | 3 (9.4%) |
| 18 to 24 Years | 10 (12.7%) | 0 (0.0%) |
| 25 to 34 Years | 6 (12.2%) | 24 (21.6%) |
| 35 to 44 Years | 19 (20.2%) | 0 (0.0%) |
| 45 to 54 Years | 9 (7.1%) | 4 (2.1%) |
| 55 to 64 Years | 7 (5.5%) | 9 (8.2%) |
| 65 to 74 Years | 0 (0.0%) | 6 (4.3%) |
| 75 Years and over | 10 (11.6%) | 23 (14.1%) |
| Total | 90 (10.1%) | 101 (9.4%) |
Income Above Poverty by Sex and Age in Youngstown
According to the poverty statistics in Youngstown, males aged 5 years and females aged 5 years are the age groups that are most secure financially, with 100.0% of males and 100.0% of females in these age groups living above the poverty line.
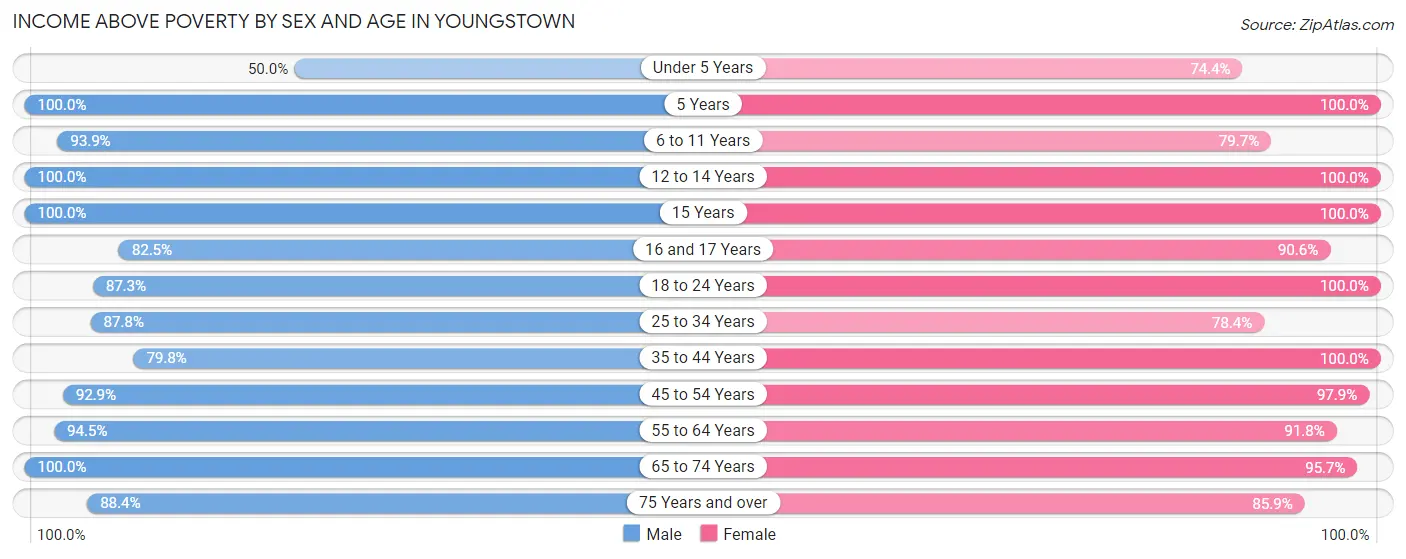
| Age Bracket | Male | Female |
| Under 5 Years | 17 (50.0%) | 58 (74.4%) |
| 5 Years | 1 (100.0%) | 11 (100.0%) |
| 6 to 11 Years | 77 (93.9%) | 47 (79.7%) |
| 12 to 14 Years | 51 (100.0%) | 64 (100.0%) |
| 15 Years | 6 (100.0%) | 5 (100.0%) |
| 16 and 17 Years | 33 (82.5%) | 29 (90.6%) |
| 18 to 24 Years | 69 (87.3%) | 48 (100.0%) |
| 25 to 34 Years | 43 (87.8%) | 87 (78.4%) |
| 35 to 44 Years | 75 (79.8%) | 66 (100.0%) |
| 45 to 54 Years | 118 (92.9%) | 182 (97.9%) |
| 55 to 64 Years | 121 (94.5%) | 101 (91.8%) |
| 65 to 74 Years | 116 (100.0%) | 133 (95.7%) |
| 75 Years and over | 76 (88.4%) | 140 (85.9%) |
| Total | 803 (89.9%) | 971 (90.6%) |
Income Below Poverty Among Married-Couple Families in Youngstown
The poverty statistics for married-couple families in Youngstown show that 7.3% or 34 of the total 466 families live below the poverty line. Families with 1 or 2 children have the highest poverty rate of 14.9%, comprising of 24 families. On the other hand, families with 3 or 4 children have the lowest poverty rate of 0.0%, which includes 0 families.
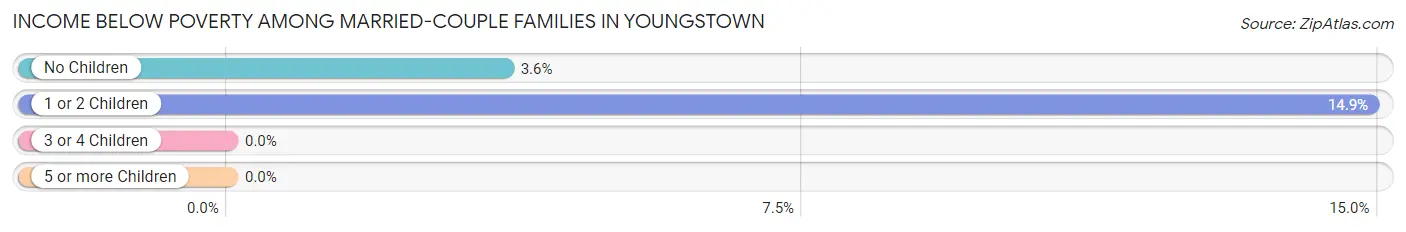
| Children | Above Poverty | Below Poverty |
| No Children | 268 (96.4%) | 10 (3.6%) |
| 1 or 2 Children | 137 (85.1%) | 24 (14.9%) |
| 3 or 4 Children | 27 (100.0%) | 0 (0.0%) |
| 5 or more Children | 0 (0.0%) | 0 (0.0%) |
| Total | 432 (92.7%) | 34 (7.3%) |
Income Below Poverty Among Single-Parent Households in Youngstown
According to the poverty data in Youngstown, 22.2% or 4 single-father households and 6.3% or 6 single-mother households are living below the poverty line. Among single-father households, those with no children have the highest poverty rate, with 4 households (22.2%) experiencing poverty. Likewise, among single-mother households, those with 1 or 2 children have the highest poverty rate, with 6 households (10.2%) falling below the poverty line.
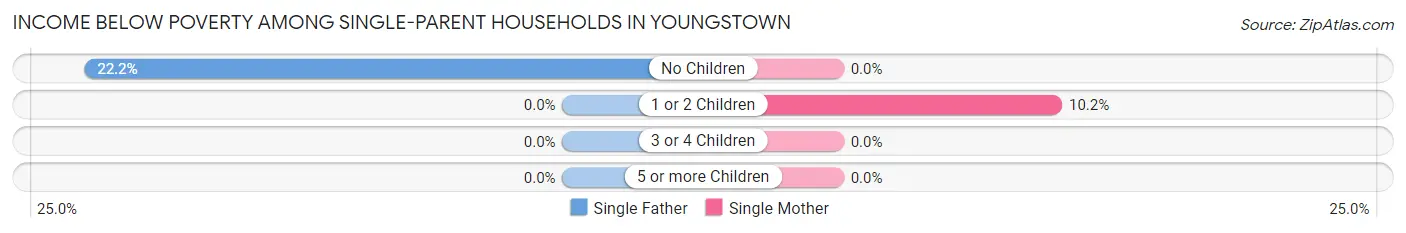
| Children | Single Father | Single Mother |
| No Children | 4 (22.2%) | 0 (0.0%) |
| 1 or 2 Children | 0 (0.0%) | 6 (10.2%) |
| 3 or 4 Children | 0 (0.0%) | 0 (0.0%) |
| 5 or more Children | 0 (0.0%) | 0 (0.0%) |
| Total | 4 (22.2%) | 6 (6.3%) |
Income Below Poverty Among Married-Couple vs Single-Parent Households in Youngstown
The poverty data for Youngstown shows that 34 of the married-couple family households (7.3%) and 10 of the single-parent households (8.8%) are living below the poverty level. Within the married-couple family households, those with 1 or 2 children have the highest poverty rate, with 24 households (14.9%) falling below the poverty line. Among the single-parent households, those with 1 or 2 children have the highest poverty rate, with 6 household (10.2%) living below poverty.
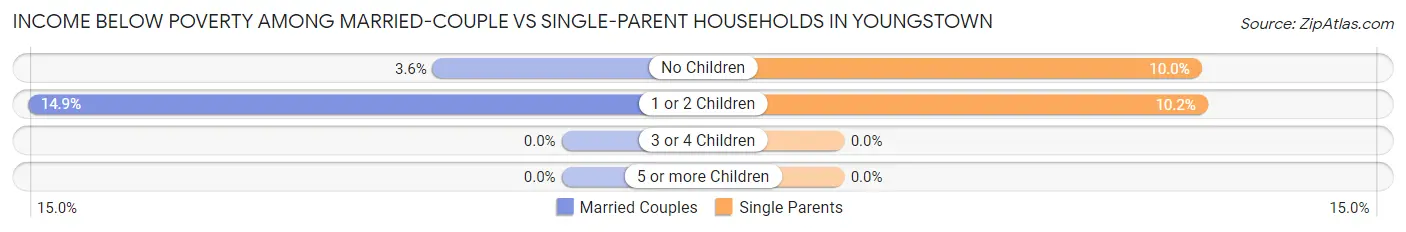
| Children | Married-Couple Families | Single-Parent Households |
| No Children | 10 (3.6%) | 4 (10.0%) |
| 1 or 2 Children | 24 (14.9%) | 6 (10.2%) |
| 3 or 4 Children | 0 (0.0%) | 0 (0.0%) |
| 5 or more Children | 0 (0.0%) | 0 (0.0%) |
| Total | 34 (7.3%) | 10 (8.8%) |
Employment Characteristics in Youngstown
Employment by Class of Employer in Youngstown
Among the 829 employed individuals in Youngstown, private company employees (517 | 62.4%), not-for-profit organizations (93 | 11.2%), and local government employees (60 | 7.2%) make up the most common classes of employment.
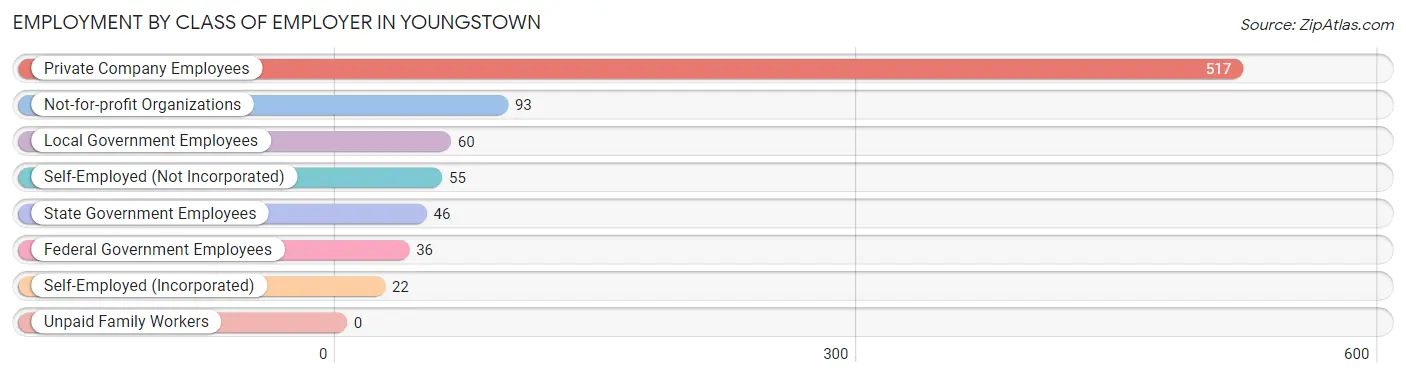
| Employer Class | # Employees | % Employees |
| Private Company Employees | 517 | 62.4% |
| Self-Employed (Incorporated) | 22 | 2.6% |
| Self-Employed (Not Incorporated) | 55 | 6.6% |
| Not-for-profit Organizations | 93 | 11.2% |
| Local Government Employees | 60 | 7.2% |
| State Government Employees | 46 | 5.6% |
| Federal Government Employees | 36 | 4.3% |
| Unpaid Family Workers | 0 | 0.0% |
| Total | 829 | 100.0% |
Employment Status by Age in Youngstown
According to the labor force statistics for Youngstown, out of the total population over 16 years of age (1,574), 57.5% or 905 individuals are in the labor force, with 7.0% or 63 of them unemployed. The age group with the highest labor force participation rate is 25 to 29 years, with 100.0% or 49 individuals in the labor force. Within the labor force, the 30 to 34 years age range has the highest percentage of unemployed individuals, with 21.0% or 17 of them being unemployed.
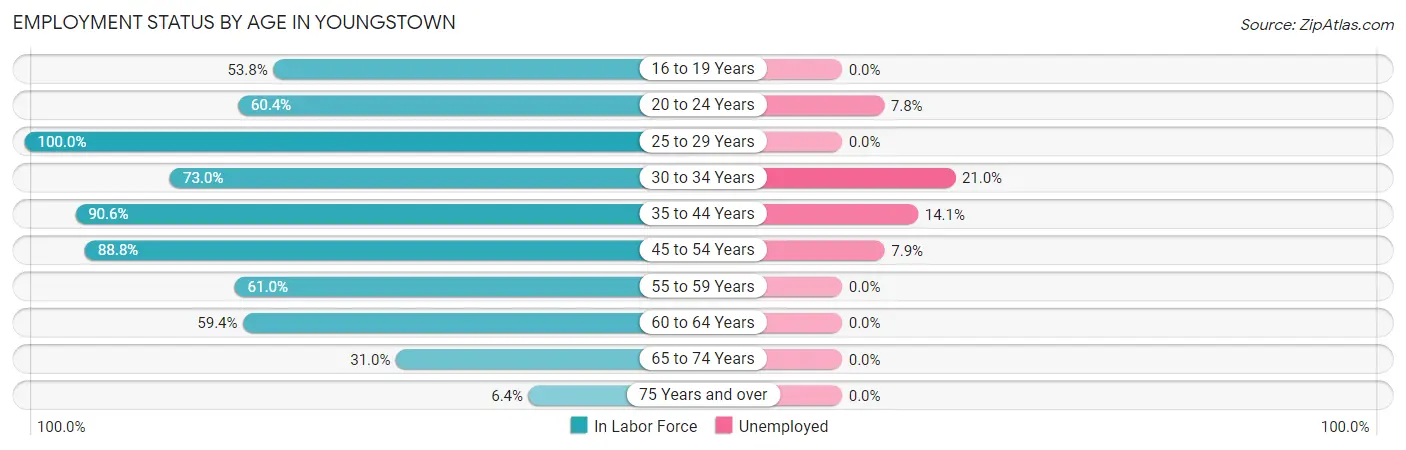
| Age Bracket | In Labor Force | Unemployed |
| 16 to 19 Years | 50 (53.8%) | 0 (0.0%) |
| 20 to 24 Years | 64 (60.4%) | 5 (7.8%) |
| 25 to 29 Years | 49 (100.0%) | 0 (0.0%) |
| 30 to 34 Years | 81 (73.0%) | 17 (21.0%) |
| 35 to 44 Years | 145 (90.6%) | 20 (14.1%) |
| 45 to 54 Years | 278 (88.8%) | 22 (7.9%) |
| 55 to 59 Years | 64 (61.0%) | 0 (0.0%) |
| 60 to 64 Years | 79 (59.4%) | 0 (0.0%) |
| 65 to 74 Years | 79 (31.0%) | 0 (0.0%) |
| 75 Years and over | 16 (6.4%) | 0 (0.0%) |
| Total | 905 (57.5%) | 63 (7.0%) |
Employment Status by Educational Attainment in Youngstown
According to labor force statistics for Youngstown, 79.9% of individuals (696) out of the total population between 25 and 64 years of age (871) are in the labor force, with 8.5% or 59 of them being unemployed. The group with the highest labor force participation rate are those with the educational attainment of less than high school, with 100.0% or 17 individuals in the labor force. Within the labor force, individuals with high school diploma education have the highest percentage of unemployment, with 13.2% or 17 of them being unemployed.
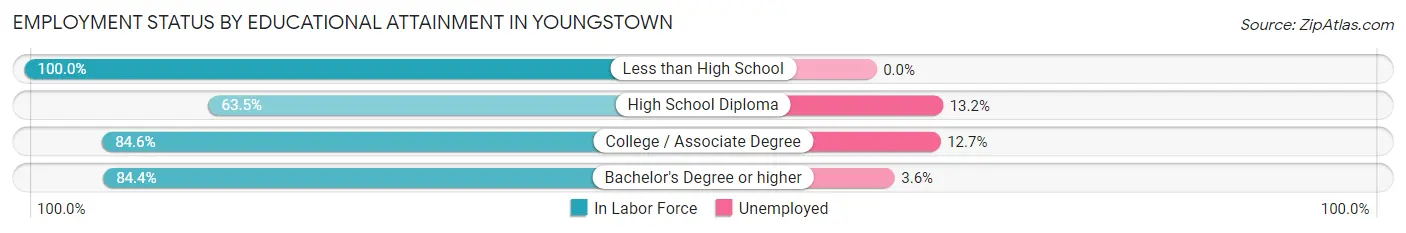
| Educational Attainment | In Labor Force | Unemployed |
| Less than High School | 17 (100.0%) | 0 (0.0%) |
| High School Diploma | 129 (63.5%) | 27 (13.2%) |
| College / Associate Degree | 236 (84.6%) | 35 (12.7%) |
| Bachelor's Degree or higher | 314 (84.4%) | 13 (3.6%) |
| Total | 696 (79.9%) | 74 (8.5%) |
Employment Occupations by Sex in Youngstown
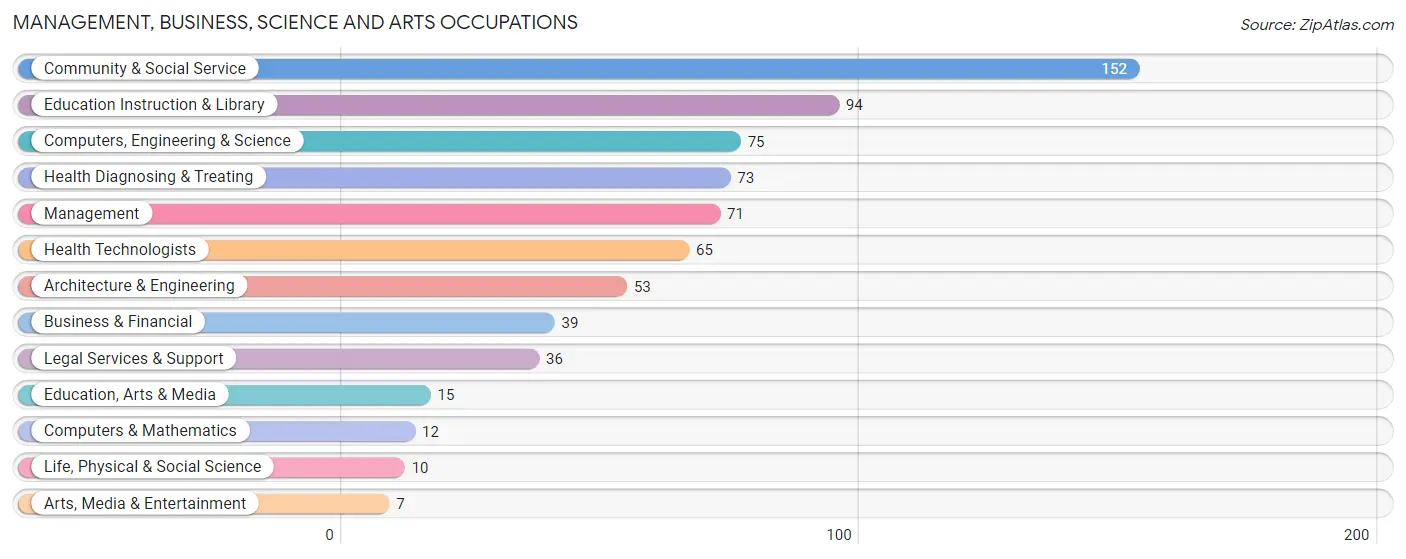
Management, Business, Science and Arts Occupations
The most common Management, Business, Science and Arts occupations in Youngstown are Community & Social Service (152 | 18.3%), Education Instruction & Library (94 | 11.3%), Computers, Engineering & Science (75 | 9.0%), Health Diagnosing & Treating (73 | 8.8%), and Management (71 | 8.5%).
Management, Business, Science and Arts Occupations by Sex
Within the Management, Business, Science and Arts occupations in Youngstown, the most male-oriented occupations are Computers & Mathematics (100.0%), Management (76.1%), and Architecture & Engineering (64.1%), while the most female-oriented occupations are Life, Physical & Social Science (100.0%), Arts, Media & Entertainment (100.0%), and Health Diagnosing & Treating (94.5%).
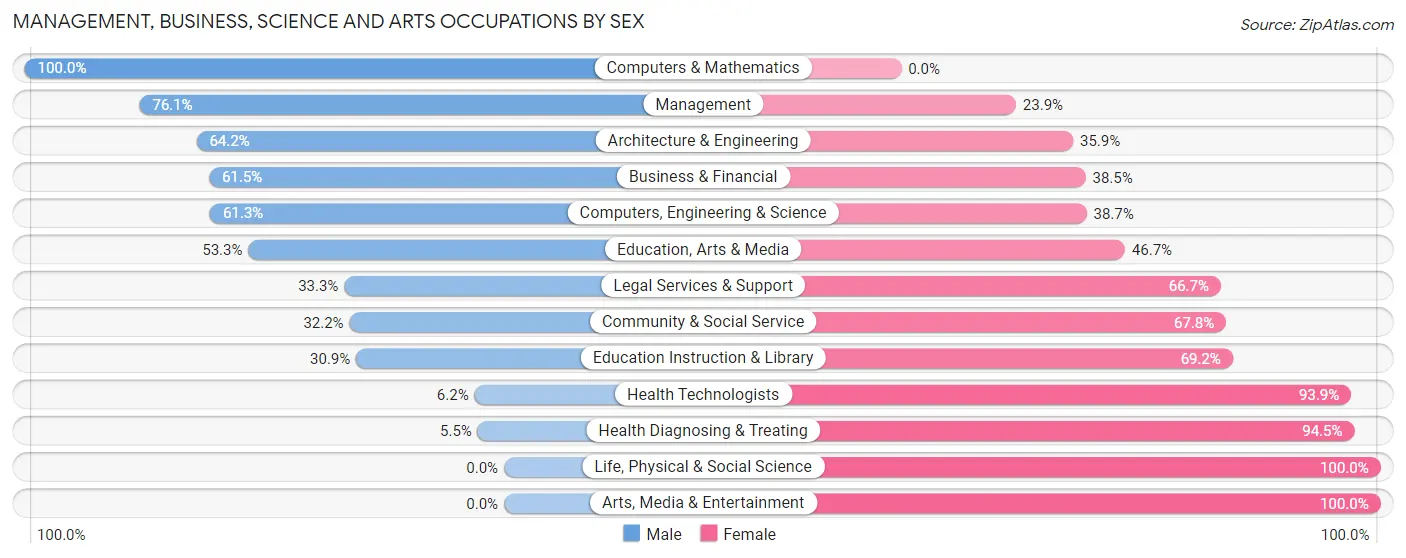
| Occupation | Male | Female |
| Management | 54 (76.1%) | 17 (23.9%) |
| Business & Financial | 24 (61.5%) | 15 (38.5%) |
| Computers, Engineering & Science | 46 (61.3%) | 29 (38.7%) |
| Computers & Mathematics | 12 (100.0%) | 0 (0.0%) |
| Architecture & Engineering | 34 (64.1%) | 19 (35.8%) |
| Life, Physical & Social Science | 0 (0.0%) | 10 (100.0%) |
| Community & Social Service | 49 (32.2%) | 103 (67.8%) |
| Education, Arts & Media | 8 (53.3%) | 7 (46.7%) |
| Legal Services & Support | 12 (33.3%) | 24 (66.7%) |
| Education Instruction & Library | 29 (30.8%) | 65 (69.2%) |
| Arts, Media & Entertainment | 0 (0.0%) | 7 (100.0%) |
| Health Diagnosing & Treating | 4 (5.5%) | 69 (94.5%) |
| Health Technologists | 4 (6.1%) | 61 (93.9%) |
| Total (Category) | 177 (43.2%) | 233 (56.8%) |
| Total (Overall) | 424 (51.0%) | 408 (49.0%) |
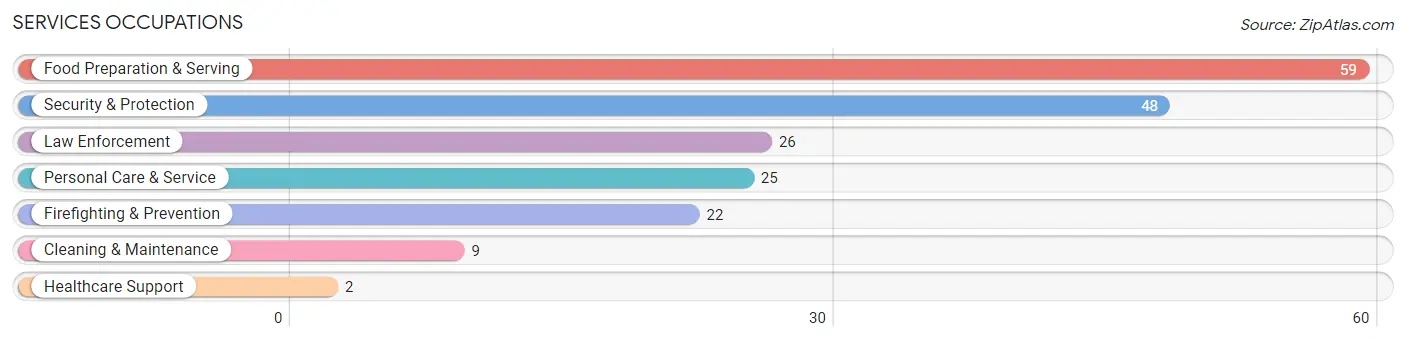
Services Occupations
The most common Services occupations in Youngstown are Food Preparation & Serving (59 | 7.1%), Security & Protection (48 | 5.8%), Law Enforcement (26 | 3.1%), Personal Care & Service (25 | 3.0%), and Firefighting & Prevention (22 | 2.6%).
Services Occupations by Sex
Within the Services occupations in Youngstown, the most male-oriented occupations are Firefighting & Prevention (100.0%), Cleaning & Maintenance (100.0%), and Security & Protection (95.8%), while the most female-oriented occupations are Healthcare Support (100.0%), Personal Care & Service (56.0%), and Food Preparation & Serving (17.0%).
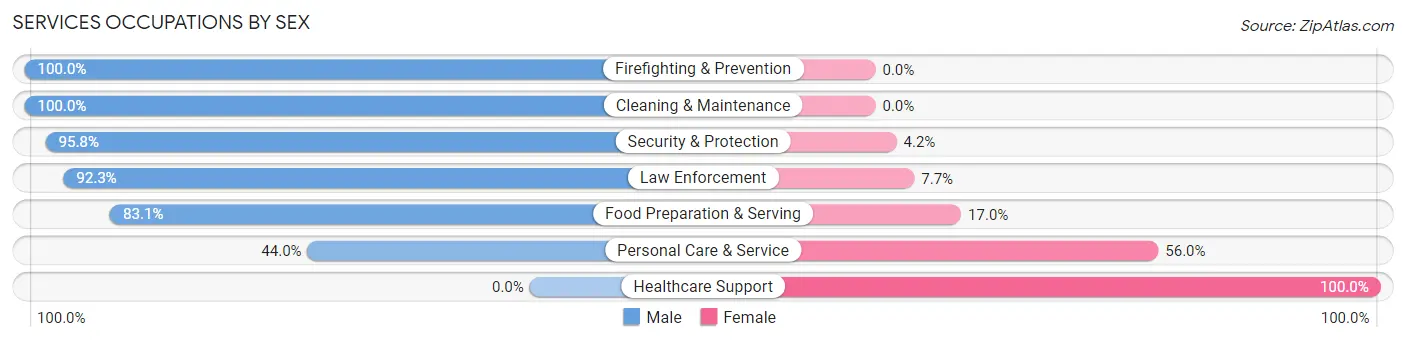
| Occupation | Male | Female |
| Healthcare Support | 0 (0.0%) | 2 (100.0%) |
| Security & Protection | 46 (95.8%) | 2 (4.2%) |
| Firefighting & Prevention | 22 (100.0%) | 0 (0.0%) |
| Law Enforcement | 24 (92.3%) | 2 (7.7%) |
| Food Preparation & Serving | 49 (83.1%) | 10 (17.0%) |
| Cleaning & Maintenance | 9 (100.0%) | 0 (0.0%) |
| Personal Care & Service | 11 (44.0%) | 14 (56.0%) |
| Total (Category) | 115 (80.4%) | 28 (19.6%) |
| Total (Overall) | 424 (51.0%) | 408 (49.0%) |
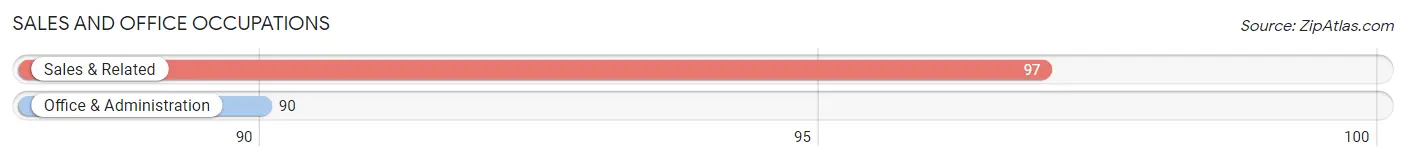
Sales and Office Occupations
The most common Sales and Office occupations in Youngstown are Sales & Related (97 | 11.7%), and Office & Administration (90 | 10.8%).
Sales and Office Occupations by Sex

| Occupation | Male | Female |
| Sales & Related | 47 (48.4%) | 50 (51.5%) |
| Office & Administration | 6 (6.7%) | 84 (93.3%) |
| Total (Category) | 53 (28.3%) | 134 (71.7%) |
| Total (Overall) | 424 (51.0%) | 408 (49.0%) |
Natural Resources, Construction and Maintenance Occupations
The most common Natural Resources, Construction and Maintenance occupations in Youngstown are Construction & Extraction (14 | 1.7%), and Installation, Maintenance & Repair (10 | 1.2%).
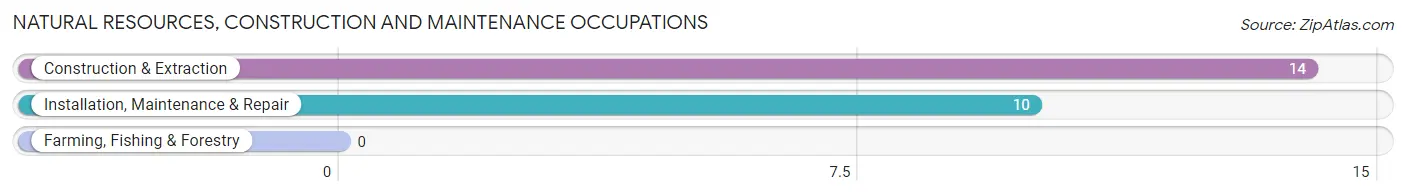
Natural Resources, Construction and Maintenance Occupations by Sex
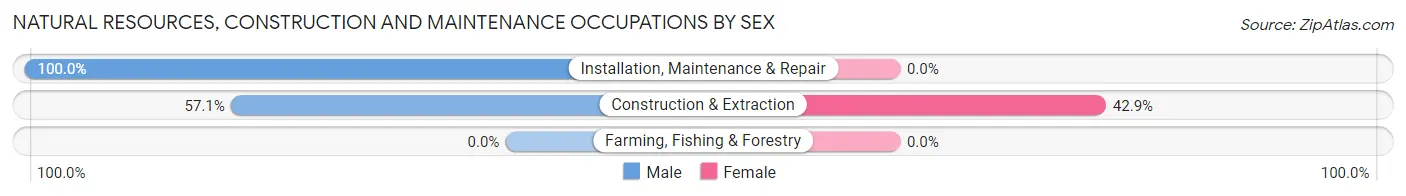
| Occupation | Male | Female |
| Farming, Fishing & Forestry | 0 (0.0%) | 0 (0.0%) |
| Construction & Extraction | 8 (57.1%) | 6 (42.9%) |
| Installation, Maintenance & Repair | 10 (100.0%) | 0 (0.0%) |
| Total (Category) | 18 (75.0%) | 6 (25.0%) |
| Total (Overall) | 424 (51.0%) | 408 (49.0%) |
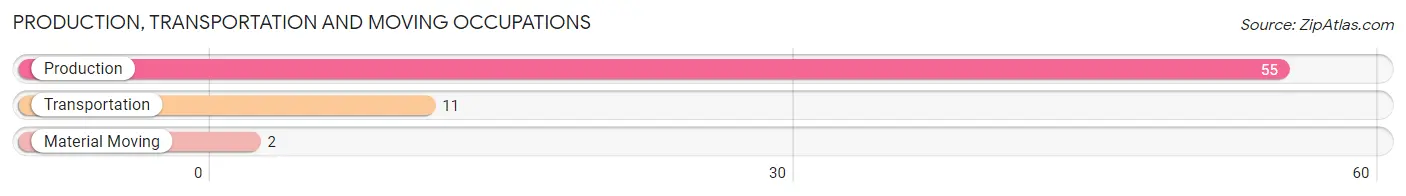
Production, Transportation and Moving Occupations
The most common Production, Transportation and Moving occupations in Youngstown are Production (55 | 6.6%), Transportation (11 | 1.3%), and Material Moving (2 | 0.2%).
Production, Transportation and Moving Occupations by Sex
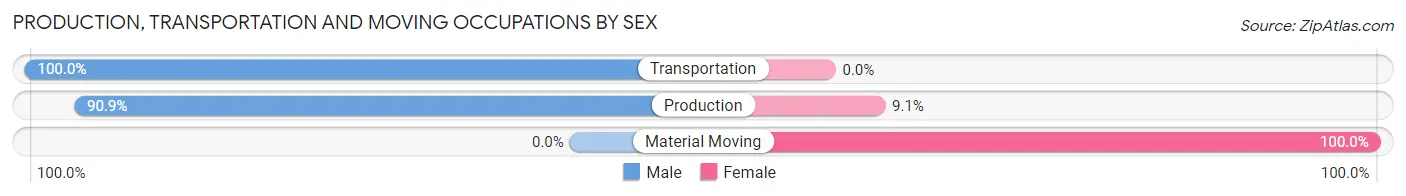
| Occupation | Male | Female |
| Production | 50 (90.9%) | 5 (9.1%) |
| Transportation | 11 (100.0%) | 0 (0.0%) |
| Material Moving | 0 (0.0%) | 2 (100.0%) |
| Total (Category) | 61 (89.7%) | 7 (10.3%) |
| Total (Overall) | 424 (51.0%) | 408 (49.0%) |
Employment Industries by Sex in Youngstown
Employment Industries in Youngstown
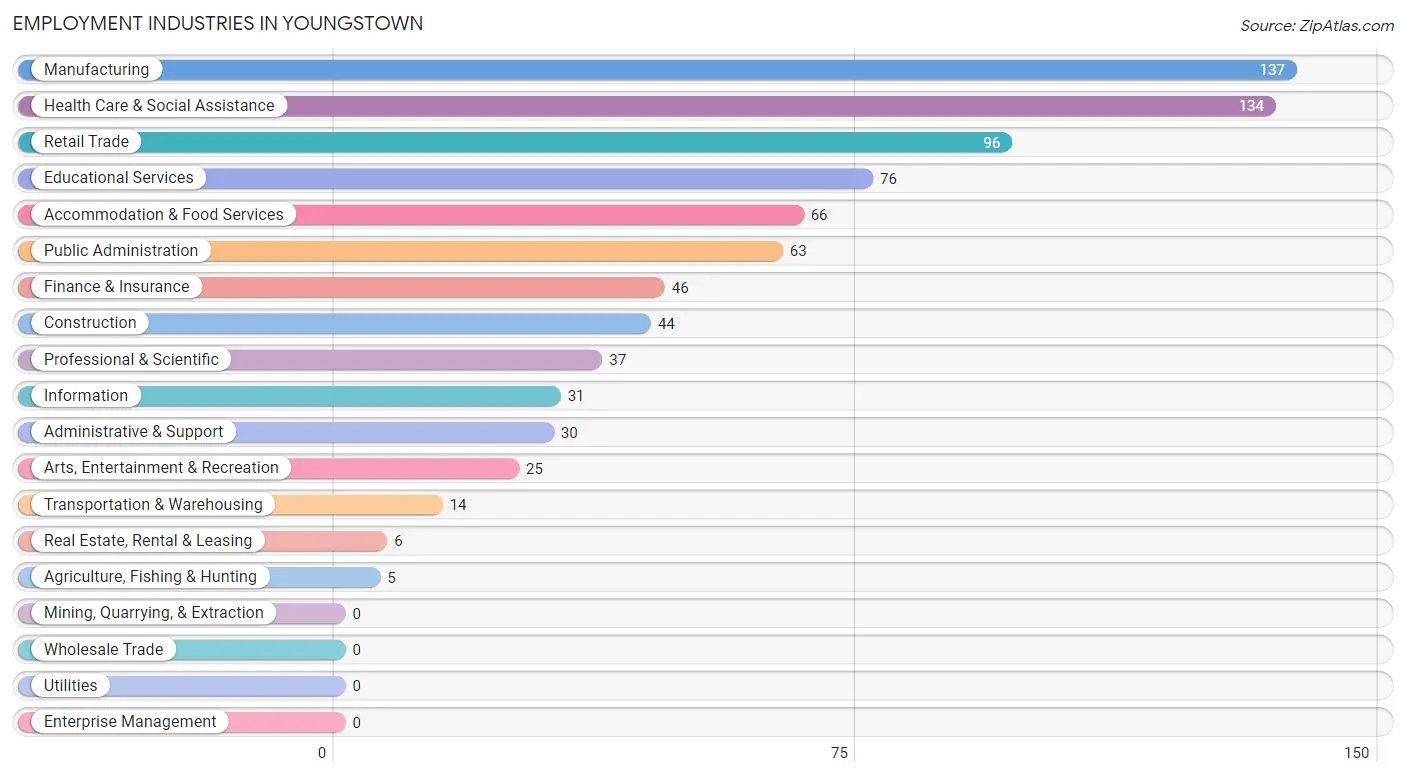
The major employment industries in Youngstown include Manufacturing (137 | 16.5%), Health Care & Social Assistance (134 | 16.1%), Retail Trade (96 | 11.5%), Educational Services (76 | 9.1%), and Accommodation & Food Services (66 | 7.9%).
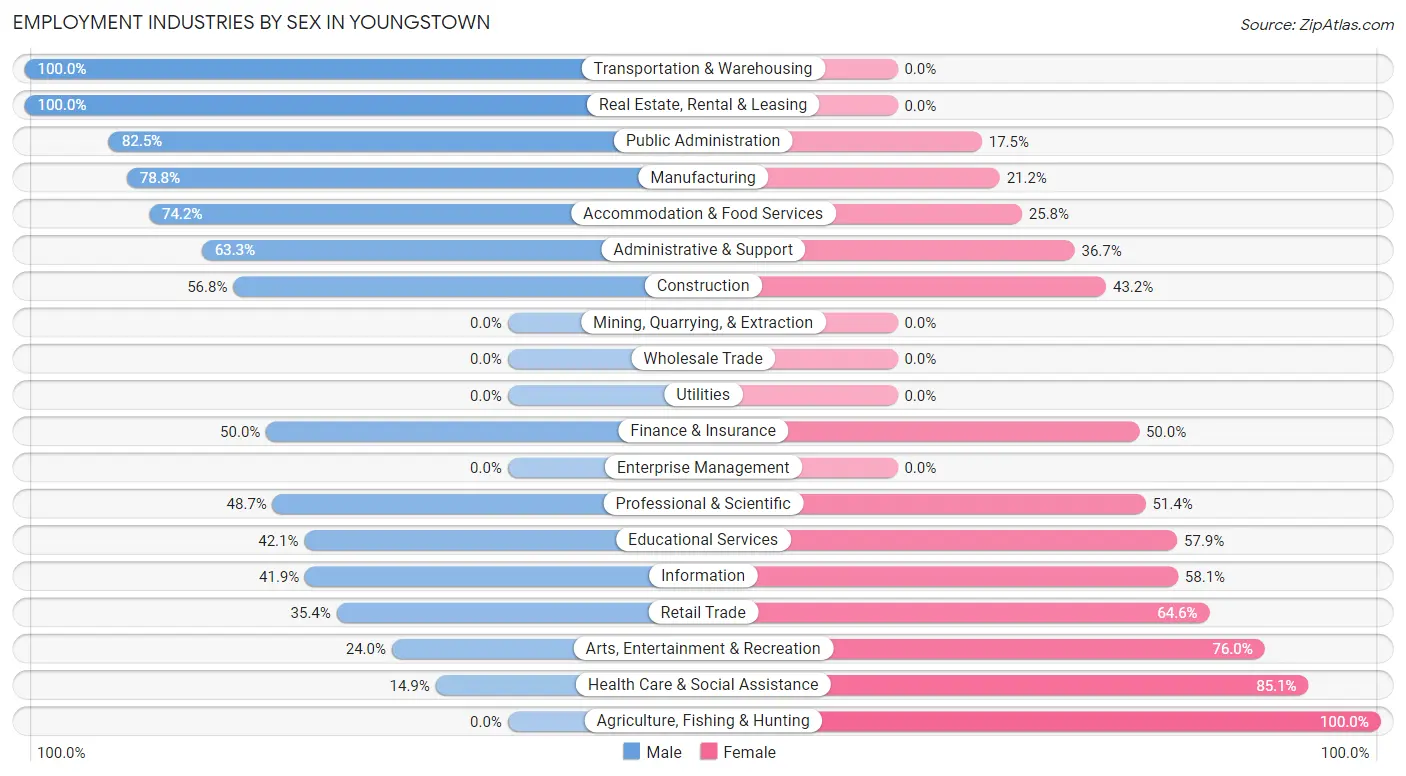
Employment Industries by Sex in Youngstown
The Youngstown industries that see more men than women are Transportation & Warehousing (100.0%), Real Estate, Rental & Leasing (100.0%), and Public Administration (82.5%), whereas the industries that tend to have a higher number of women are Agriculture, Fishing & Hunting (100.0%), Health Care & Social Assistance (85.1%), and Arts, Entertainment & Recreation (76.0%).
| Industry | Male | Female |
| Agriculture, Fishing & Hunting | 0 (0.0%) | 5 (100.0%) |
| Mining, Quarrying, & Extraction | 0 (0.0%) | 0 (0.0%) |
| Construction | 25 (56.8%) | 19 (43.2%) |
| Manufacturing | 108 (78.8%) | 29 (21.2%) |
| Wholesale Trade | 0 (0.0%) | 0 (0.0%) |
| Retail Trade | 34 (35.4%) | 62 (64.6%) |
| Transportation & Warehousing | 14 (100.0%) | 0 (0.0%) |
| Utilities | 0 (0.0%) | 0 (0.0%) |
| Information | 13 (41.9%) | 18 (58.1%) |
| Finance & Insurance | 23 (50.0%) | 23 (50.0%) |
| Real Estate, Rental & Leasing | 6 (100.0%) | 0 (0.0%) |
| Professional & Scientific | 18 (48.6%) | 19 (51.3%) |
| Enterprise Management | 0 (0.0%) | 0 (0.0%) |
| Administrative & Support | 19 (63.3%) | 11 (36.7%) |
| Educational Services | 32 (42.1%) | 44 (57.9%) |
| Health Care & Social Assistance | 20 (14.9%) | 114 (85.1%) |
| Arts, Entertainment & Recreation | 6 (24.0%) | 19 (76.0%) |
| Accommodation & Food Services | 49 (74.2%) | 17 (25.8%) |
| Public Administration | 52 (82.5%) | 11 (17.5%) |
| Total | 424 (51.0%) | 408 (49.0%) |
Education in Youngstown
School Enrollment in Youngstown
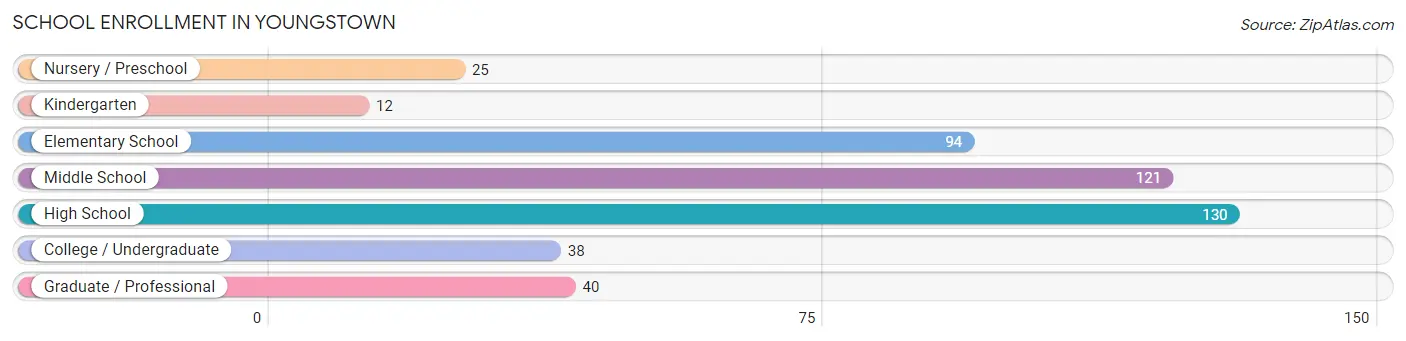
The most common levels of schooling among the 460 students in Youngstown are high school (130 | 28.3%), middle school (121 | 26.3%), and elementary school (94 | 20.4%).
| School Level | # Students | % Students |
| Nursery / Preschool | 25 | 5.4% |
| Kindergarten | 12 | 2.6% |
| Elementary School | 94 | 20.4% |
| Middle School | 121 | 26.3% |
| High School | 130 | 28.3% |
| College / Undergraduate | 38 | 8.3% |
| Graduate / Professional | 40 | 8.7% |
| Total | 460 | 100.0% |
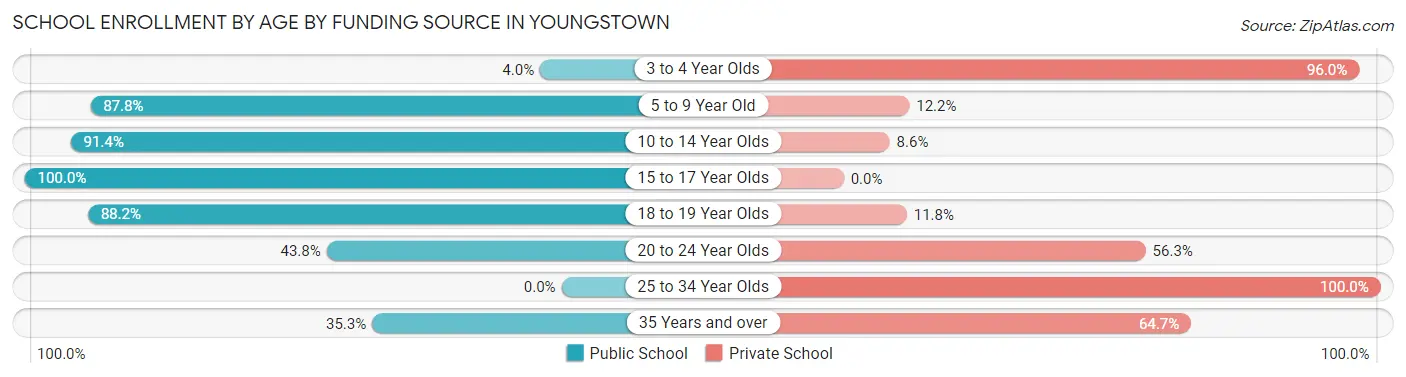
School Enrollment by Age by Funding Source in Youngstown
Out of a total of 460 students who are enrolled in schools in Youngstown, 98 (21.3%) attend a private institution, while the remaining 362 (78.7%) are enrolled in public schools. The age group of 25 to 34 year olds has the highest likelihood of being enrolled in private schools, with 8 (100.0% in the age bracket) enrolled. Conversely, the age group of 15 to 17 year olds has the lowest likelihood of being enrolled in a private school, with 80 (100.0% in the age bracket) attending a public institution.
| Age Bracket | Public School | Private School |
| 3 to 4 Year Olds | 1 (4.0%) | 24 (96.0%) |
| 5 to 9 Year Old | 79 (87.8%) | 11 (12.2%) |
| 10 to 14 Year Olds | 160 (91.4%) | 15 (8.6%) |
| 15 to 17 Year Olds | 80 (100.0%) | 0 (0.0%) |
| 18 to 19 Year Olds | 15 (88.2%) | 2 (11.8%) |
| 20 to 24 Year Olds | 21 (43.8%) | 27 (56.2%) |
| 25 to 34 Year Olds | 0 (0.0%) | 8 (100.0%) |
| 35 Years and over | 6 (35.3%) | 11 (64.7%) |
| Total | 362 (78.7%) | 98 (21.3%) |
Educational Attainment by Field of Study in Youngstown
Business (127 | 21.1%), education (91 | 15.1%), social sciences (70 | 11.6%), engineering (54 | 9.0%), and science & technology (54 | 9.0%) are the most common fields of study among 603 individuals in Youngstown who have obtained a bachelor's degree or higher.
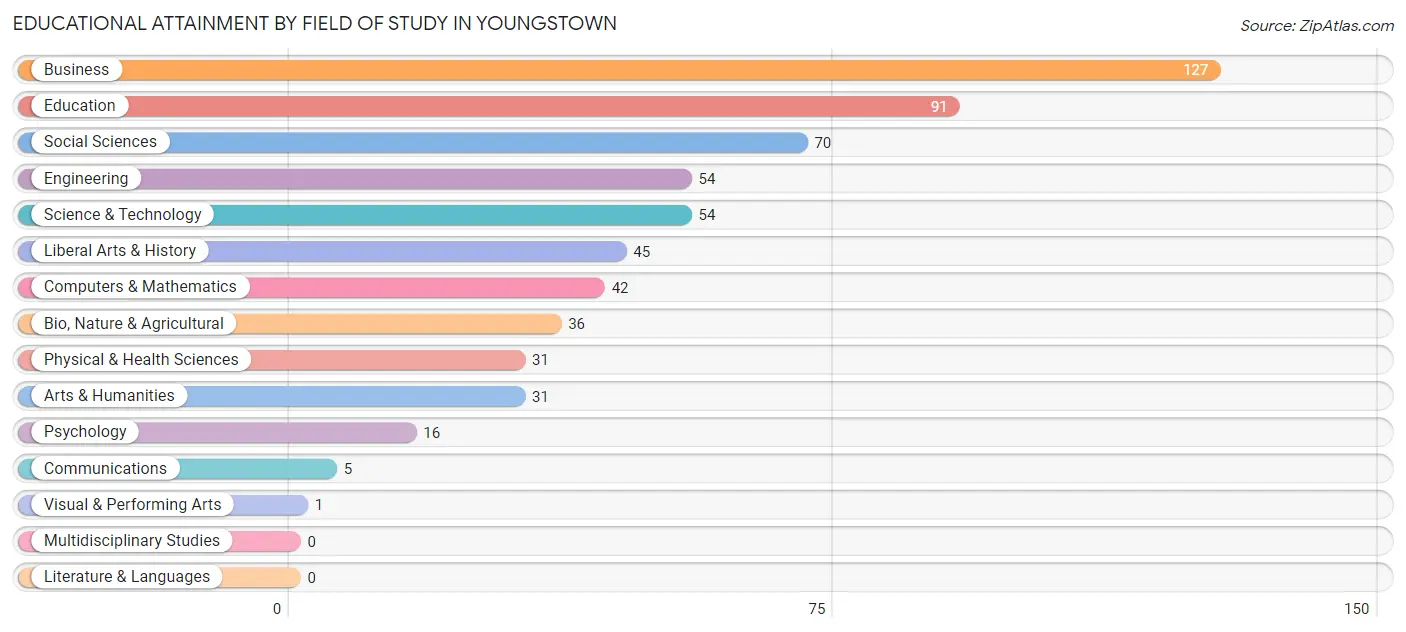
| Field of Study | # Graduates | % Graduates |
| Computers & Mathematics | 42 | 7.0% |
| Bio, Nature & Agricultural | 36 | 6.0% |
| Physical & Health Sciences | 31 | 5.1% |
| Psychology | 16 | 2.6% |
| Social Sciences | 70 | 11.6% |
| Engineering | 54 | 9.0% |
| Multidisciplinary Studies | 0 | 0.0% |
| Science & Technology | 54 | 9.0% |
| Business | 127 | 21.1% |
| Education | 91 | 15.1% |
| Literature & Languages | 0 | 0.0% |
| Liberal Arts & History | 45 | 7.5% |
| Visual & Performing Arts | 1 | 0.2% |
| Communications | 5 | 0.8% |
| Arts & Humanities | 31 | 5.1% |
| Total | 603 | 100.0% |
Transportation & Commute in Youngstown
Vehicle Availability by Sex in Youngstown
The most prevalent vehicle ownership categories in Youngstown are males with 2 vehicles (142, accounting for 32.7%) and females with 2 vehicles (153, making up 35.9%).
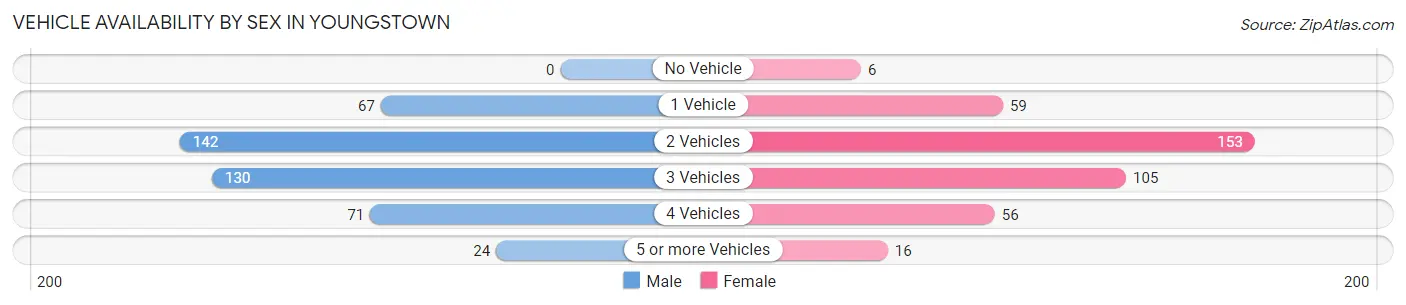
| Vehicles Available | Male | Female |
| No Vehicle | 0 (0.0%) | 6 (1.5%) |
| 1 Vehicle | 67 (15.4%) | 59 (14.9%) |
| 2 Vehicles | 142 (32.7%) | 153 (38.7%) |
| 3 Vehicles | 130 (29.9%) | 105 (26.6%) |
| 4 Vehicles | 71 (16.4%) | 56 (14.2%) |
| 5 or more Vehicles | 24 (5.5%) | 16 (4.1%) |
| Total | 434 (100.0%) | 395 (100.0%) |
Commute Time in Youngstown
The most frequently occuring commute durations in Youngstown are 15 to 19 minutes (156 commuters, 19.5%), 30 to 34 minutes (122 commuters, 15.3%), and 45 to 59 minutes (92 commuters, 11.5%).
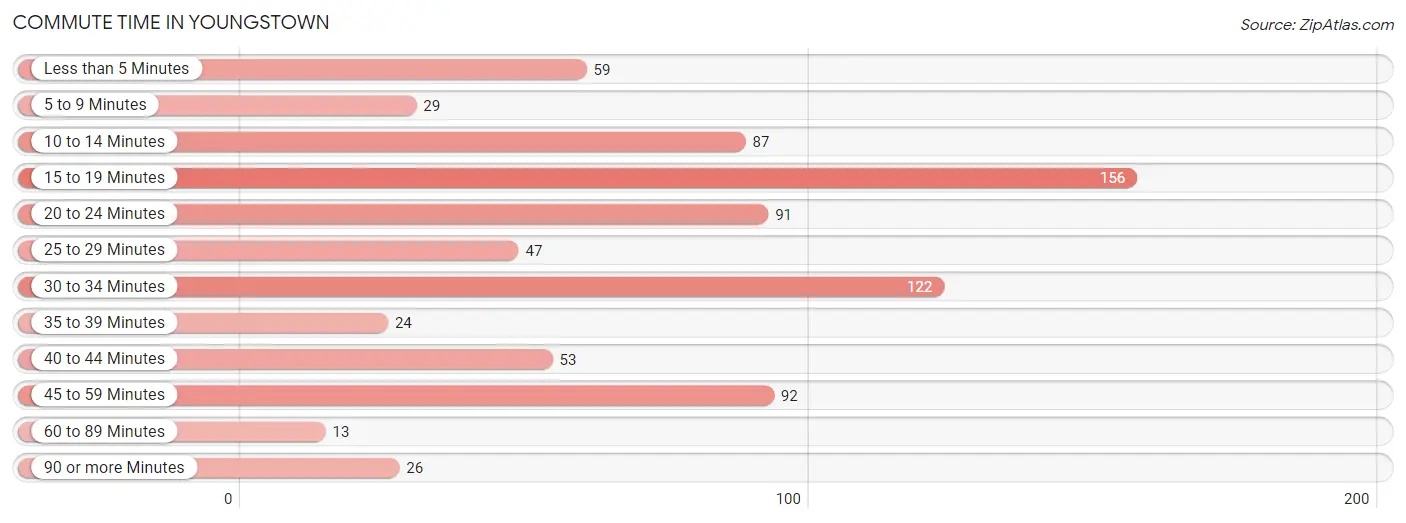
| Commute Time | # Commuters | % Commuters |
| Less than 5 Minutes | 59 | 7.4% |
| 5 to 9 Minutes | 29 | 3.6% |
| 10 to 14 Minutes | 87 | 10.9% |
| 15 to 19 Minutes | 156 | 19.5% |
| 20 to 24 Minutes | 91 | 11.4% |
| 25 to 29 Minutes | 47 | 5.9% |
| 30 to 34 Minutes | 122 | 15.3% |
| 35 to 39 Minutes | 24 | 3.0% |
| 40 to 44 Minutes | 53 | 6.6% |
| 45 to 59 Minutes | 92 | 11.5% |
| 60 to 89 Minutes | 13 | 1.6% |
| 90 or more Minutes | 26 | 3.3% |
Commute Time by Sex in Youngstown
The most common commute times in Youngstown are 15 to 19 minutes (123 commuters, 29.8%) for males and 30 to 34 minutes (75 commuters, 19.4%) for females.
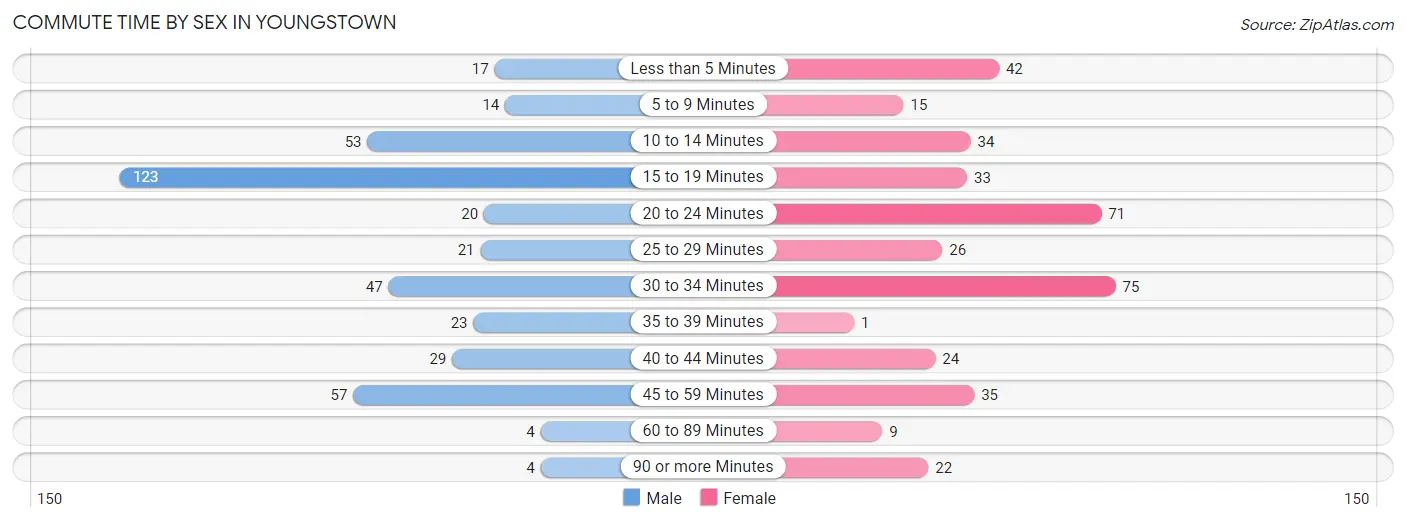
| Commute Time | Male | Female |
| Less than 5 Minutes | 17 (4.1%) | 42 (10.8%) |
| 5 to 9 Minutes | 14 (3.4%) | 15 (3.9%) |
| 10 to 14 Minutes | 53 (12.9%) | 34 (8.8%) |
| 15 to 19 Minutes | 123 (29.8%) | 33 (8.5%) |
| 20 to 24 Minutes | 20 (4.9%) | 71 (18.3%) |
| 25 to 29 Minutes | 21 (5.1%) | 26 (6.7%) |
| 30 to 34 Minutes | 47 (11.4%) | 75 (19.4%) |
| 35 to 39 Minutes | 23 (5.6%) | 1 (0.3%) |
| 40 to 44 Minutes | 29 (7.0%) | 24 (6.2%) |
| 45 to 59 Minutes | 57 (13.8%) | 35 (9.0%) |
| 60 to 89 Minutes | 4 (1.0%) | 9 (2.3%) |
| 90 or more Minutes | 4 (1.0%) | 22 (5.7%) |
Time of Departure to Work by Sex in Youngstown
The most frequent times of departure to work in Youngstown are 8:00 AM to 8:29 AM (75, 18.2%) for males and 7:00 AM to 7:29 AM (73, 18.9%) for females.
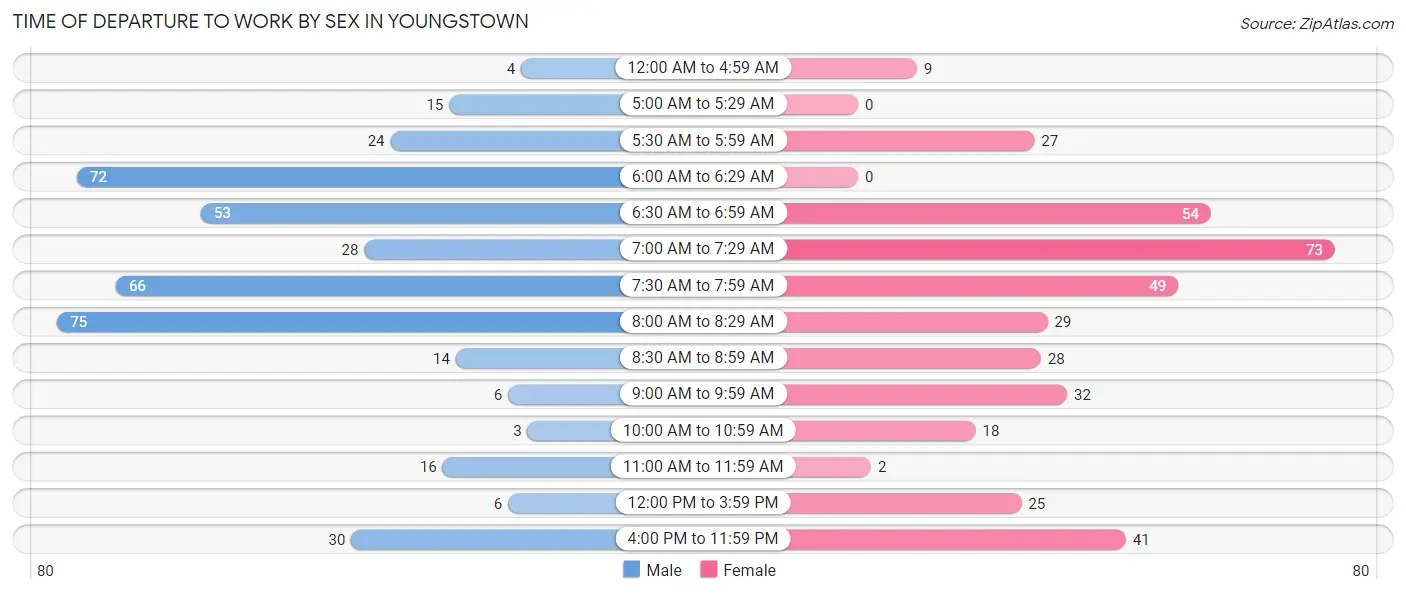
| Time of Departure | Male | Female |
| 12:00 AM to 4:59 AM | 4 (1.0%) | 9 (2.3%) |
| 5:00 AM to 5:29 AM | 15 (3.6%) | 0 (0.0%) |
| 5:30 AM to 5:59 AM | 24 (5.8%) | 27 (7.0%) |
| 6:00 AM to 6:29 AM | 72 (17.5%) | 0 (0.0%) |
| 6:30 AM to 6:59 AM | 53 (12.9%) | 54 (14.0%) |
| 7:00 AM to 7:29 AM | 28 (6.8%) | 73 (18.9%) |
| 7:30 AM to 7:59 AM | 66 (16.0%) | 49 (12.7%) |
| 8:00 AM to 8:29 AM | 75 (18.2%) | 29 (7.5%) |
| 8:30 AM to 8:59 AM | 14 (3.4%) | 28 (7.2%) |
| 9:00 AM to 9:59 AM | 6 (1.5%) | 32 (8.3%) |
| 10:00 AM to 10:59 AM | 3 (0.7%) | 18 (4.6%) |
| 11:00 AM to 11:59 AM | 16 (3.9%) | 2 (0.5%) |
| 12:00 PM to 3:59 PM | 6 (1.5%) | 25 (6.5%) |
| 4:00 PM to 11:59 PM | 30 (7.3%) | 41 (10.6%) |
| Total | 412 (100.0%) | 387 (100.0%) |
Housing Occupancy in Youngstown
Occupancy by Ownership in Youngstown
Of the total 807 dwellings in Youngstown, owner-occupied units account for 645 (79.9%), while renter-occupied units make up 162 (20.1%).
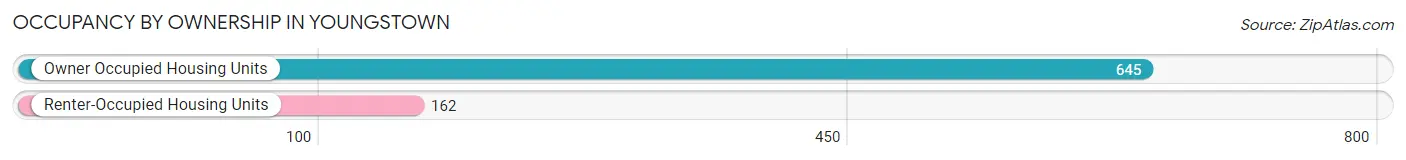
| Occupancy | # Housing Units | % Housing Units |
| Owner Occupied Housing Units | 645 | 79.9% |
| Renter-Occupied Housing Units | 162 | 20.1% |
| Total Occupied Housing Units | 807 | 100.0% |
Occupancy by Household Size in Youngstown
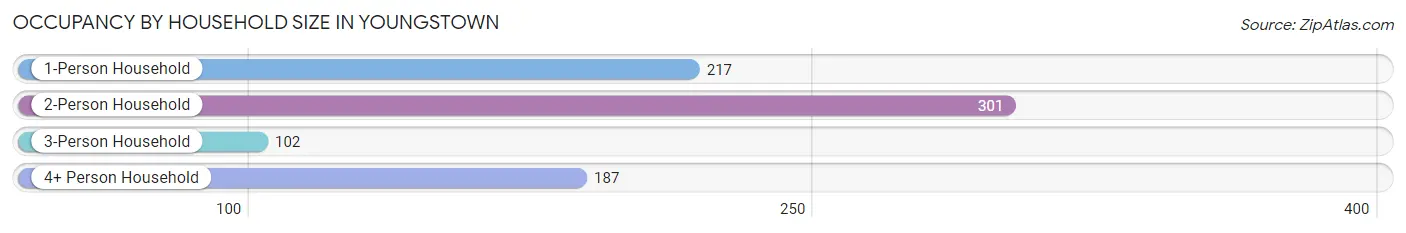
| Household Size | # Housing Units | % Housing Units |
| 1-Person Household | 217 | 26.9% |
| 2-Person Household | 301 | 37.3% |
| 3-Person Household | 102 | 12.6% |
| 4+ Person Household | 187 | 23.2% |
| Total Housing Units | 807 | 100.0% |
Occupancy by Ownership by Household Size in Youngstown
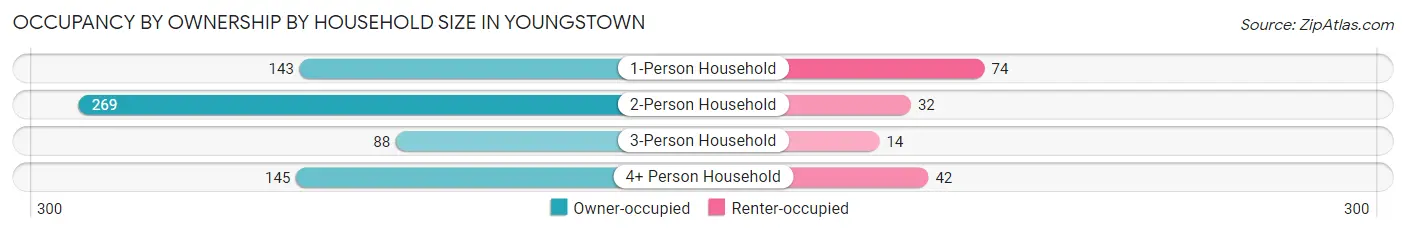
| Household Size | Owner-occupied | Renter-occupied |
| 1-Person Household | 143 (65.9%) | 74 (34.1%) |
| 2-Person Household | 269 (89.4%) | 32 (10.6%) |
| 3-Person Household | 88 (86.3%) | 14 (13.7%) |
| 4+ Person Household | 145 (77.5%) | 42 (22.5%) |
| Total Housing Units | 645 (79.9%) | 162 (20.1%) |
Occupancy by Educational Attainment in Youngstown
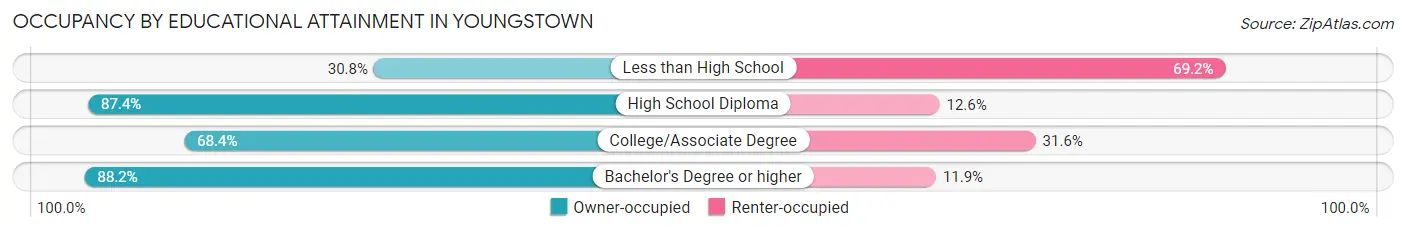
| Household Size | Owner-occupied | Renter-occupied |
| Less than High School | 8 (30.8%) | 18 (69.2%) |
| High School Diploma | 174 (87.4%) | 25 (12.6%) |
| College/Associate Degree | 173 (68.4%) | 80 (31.6%) |
| Bachelor's Degree or higher | 290 (88.1%) | 39 (11.8%) |
Occupancy by Age of Householder in Youngstown
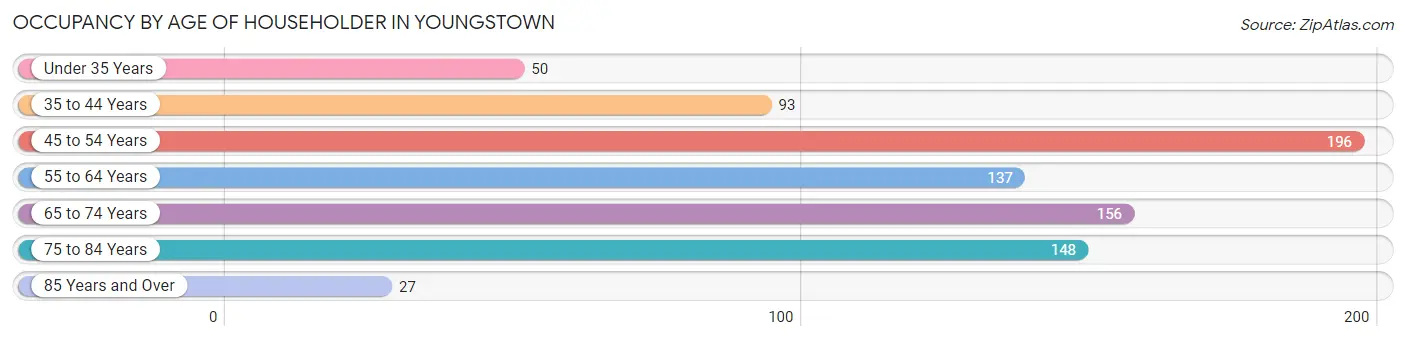
| Age Bracket | # Households | % Households |
| Under 35 Years | 50 | 6.2% |
| 35 to 44 Years | 93 | 11.5% |
| 45 to 54 Years | 196 | 24.3% |
| 55 to 64 Years | 137 | 17.0% |
| 65 to 74 Years | 156 | 19.3% |
| 75 to 84 Years | 148 | 18.3% |
| 85 Years and Over | 27 | 3.4% |
| Total | 807 | 100.0% |
Housing Finances in Youngstown
Median Income by Occupancy in Youngstown
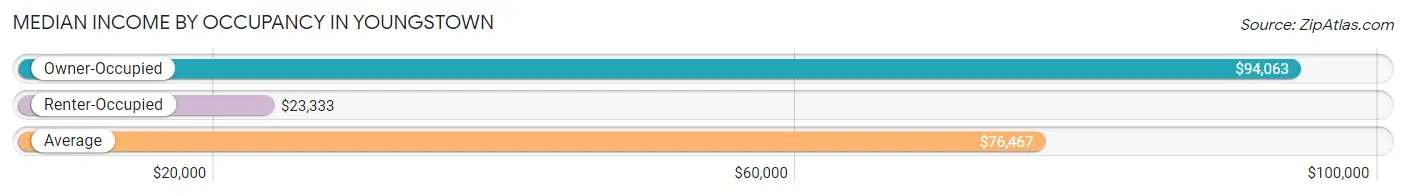
| Occupancy Type | # Households | Median Income |
| Owner-Occupied | 645 (79.9%) | $94,063 |
| Renter-Occupied | 162 (20.1%) | $23,333 |
| Average | 807 (100.0%) | $76,467 |
Occupancy by Householder Income Bracket in Youngstown
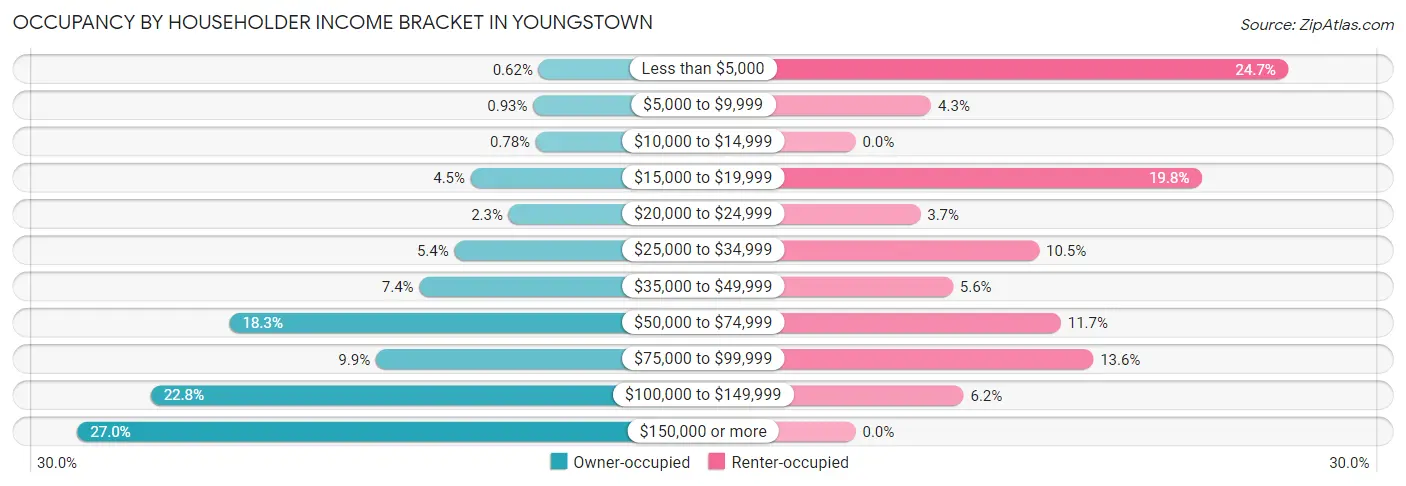
| Income Bracket | Owner-occupied | Renter-occupied |
| Less than $5,000 | 4 (0.6%) | 40 (24.7%) |
| $5,000 to $9,999 | 6 (0.9%) | 7 (4.3%) |
| $10,000 to $14,999 | 5 (0.8%) | 0 (0.0%) |
| $15,000 to $19,999 | 29 (4.5%) | 32 (19.8%) |
| $20,000 to $24,999 | 15 (2.3%) | 6 (3.7%) |
| $25,000 to $34,999 | 35 (5.4%) | 17 (10.5%) |
| $35,000 to $49,999 | 48 (7.4%) | 9 (5.6%) |
| $50,000 to $74,999 | 118 (18.3%) | 19 (11.7%) |
| $75,000 to $99,999 | 64 (9.9%) | 22 (13.6%) |
| $100,000 to $149,999 | 147 (22.8%) | 10 (6.2%) |
| $150,000 or more | 174 (27.0%) | 0 (0.0%) |
| Total | 645 (100.0%) | 162 (100.0%) |
Monthly Housing Cost Tiers in Youngstown
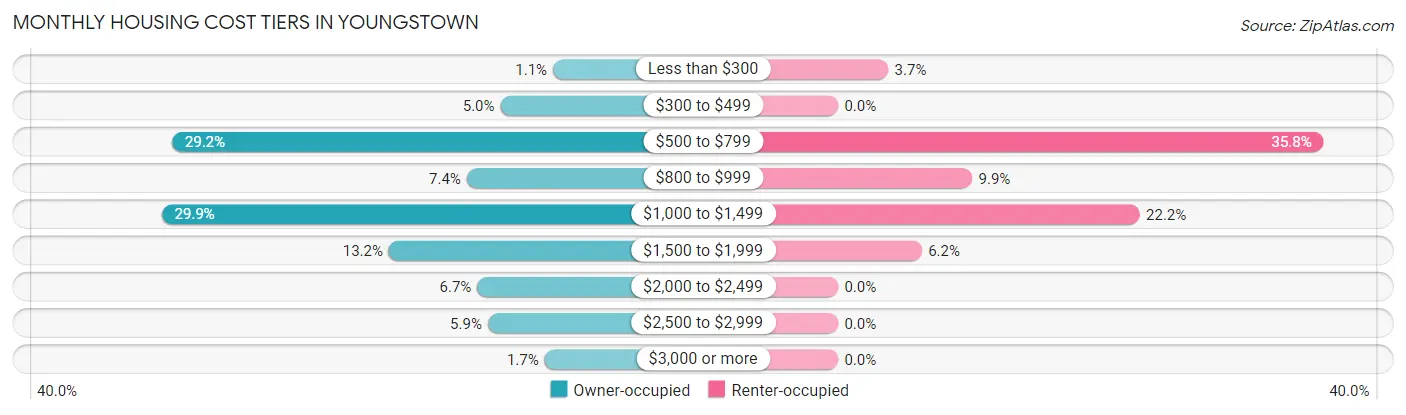
| Monthly Cost | Owner-occupied | Renter-occupied |
| Less than $300 | 7 (1.1%) | 6 (3.7%) |
| $300 to $499 | 32 (5.0%) | 0 (0.0%) |
| $500 to $799 | 188 (29.1%) | 58 (35.8%) |
| $800 to $999 | 48 (7.4%) | 16 (9.9%) |
| $1,000 to $1,499 | 193 (29.9%) | 36 (22.2%) |
| $1,500 to $1,999 | 85 (13.2%) | 10 (6.2%) |
| $2,000 to $2,499 | 43 (6.7%) | 0 (0.0%) |
| $2,500 to $2,999 | 38 (5.9%) | 0 (0.0%) |
| $3,000 or more | 11 (1.7%) | 0 (0.0%) |
| Total | 645 (100.0%) | 162 (100.0%) |
Physical Housing Characteristics in Youngstown
Housing Structures in Youngstown
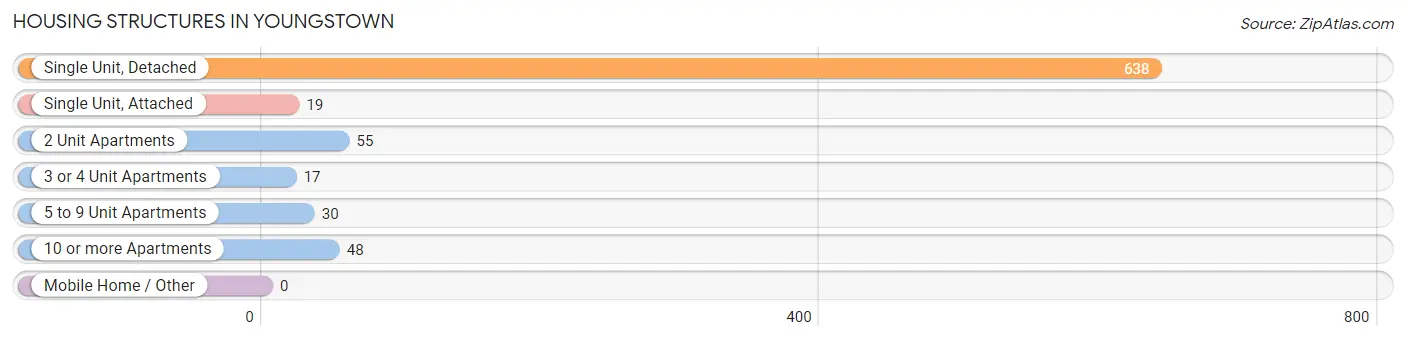
| Structure Type | # Housing Units | % Housing Units |
| Single Unit, Detached | 638 | 79.1% |
| Single Unit, Attached | 19 | 2.4% |
| 2 Unit Apartments | 55 | 6.8% |
| 3 or 4 Unit Apartments | 17 | 2.1% |
| 5 to 9 Unit Apartments | 30 | 3.7% |
| 10 or more Apartments | 48 | 5.9% |
| Mobile Home / Other | 0 | 0.0% |
| Total | 807 | 100.0% |
Housing Structures by Occupancy in Youngstown
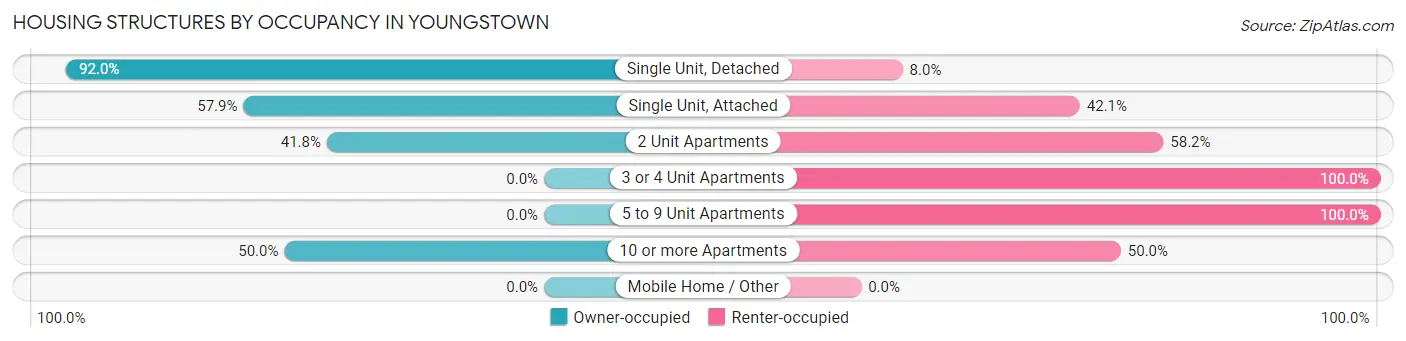
| Structure Type | Owner-occupied | Renter-occupied |
| Single Unit, Detached | 587 (92.0%) | 51 (8.0%) |
| Single Unit, Attached | 11 (57.9%) | 8 (42.1%) |
| 2 Unit Apartments | 23 (41.8%) | 32 (58.2%) |
| 3 or 4 Unit Apartments | 0 (0.0%) | 17 (100.0%) |
| 5 to 9 Unit Apartments | 0 (0.0%) | 30 (100.0%) |
| 10 or more Apartments | 24 (50.0%) | 24 (50.0%) |
| Mobile Home / Other | 0 (0.0%) | 0 (0.0%) |
| Total | 645 (79.9%) | 162 (20.1%) |
Housing Structures by Number of Rooms in Youngstown
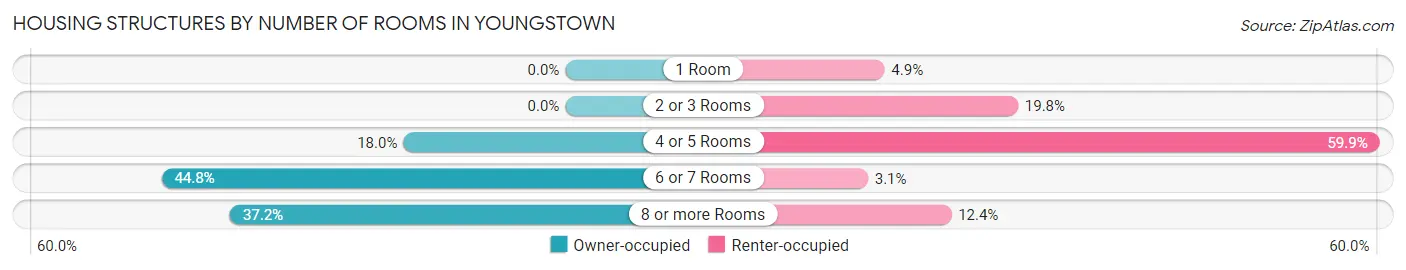
| Number of Rooms | Owner-occupied | Renter-occupied |
| 1 Room | 0 (0.0%) | 8 (4.9%) |
| 2 or 3 Rooms | 0 (0.0%) | 32 (19.8%) |
| 4 or 5 Rooms | 116 (18.0%) | 97 (59.9%) |
| 6 or 7 Rooms | 289 (44.8%) | 5 (3.1%) |
| 8 or more Rooms | 240 (37.2%) | 20 (12.3%) |
| Total | 645 (100.0%) | 162 (100.0%) |
Housing Structure by Heating Type in Youngstown
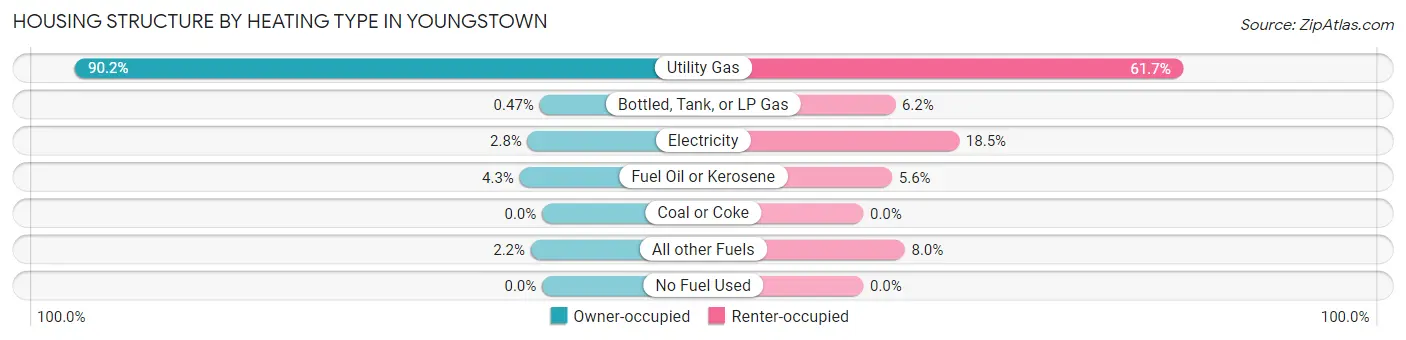
| Heating Type | Owner-occupied | Renter-occupied |
| Utility Gas | 582 (90.2%) | 100 (61.7%) |
| Bottled, Tank, or LP Gas | 3 (0.5%) | 10 (6.2%) |
| Electricity | 18 (2.8%) | 30 (18.5%) |
| Fuel Oil or Kerosene | 28 (4.3%) | 9 (5.6%) |
| Coal or Coke | 0 (0.0%) | 0 (0.0%) |
| All other Fuels | 14 (2.2%) | 13 (8.0%) |
| No Fuel Used | 0 (0.0%) | 0 (0.0%) |
| Total | 645 (100.0%) | 162 (100.0%) |
Household Vehicle Usage in Youngstown
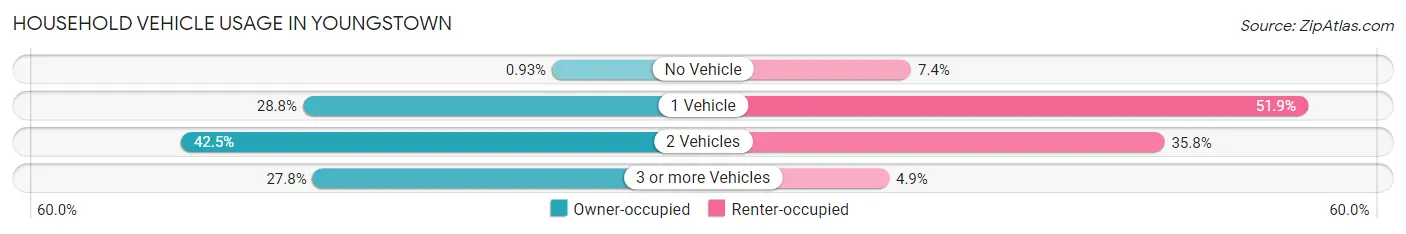
| Vehicles per Household | Owner-occupied | Renter-occupied |
| No Vehicle | 6 (0.9%) | 12 (7.4%) |
| 1 Vehicle | 186 (28.8%) | 84 (51.8%) |
| 2 Vehicles | 274 (42.5%) | 58 (35.8%) |
| 3 or more Vehicles | 179 (27.8%) | 8 (4.9%) |
| Total | 645 (100.0%) | 162 (100.0%) |
Real Estate & Mortgages in Youngstown
Real Estate and Mortgage Overview in Youngstown
| Characteristic | Without Mortgage | With Mortgage |
| Housing Units | 298 | 347 |
| Median Property Value | $191,300 | $193,500 |
| Median Household Income | $73,214 | $124 |
| Monthly Housing Costs | $611 | $11 |
| Real Estate Taxes | $4,101 | $5 |
Property Value by Mortgage Status in Youngstown
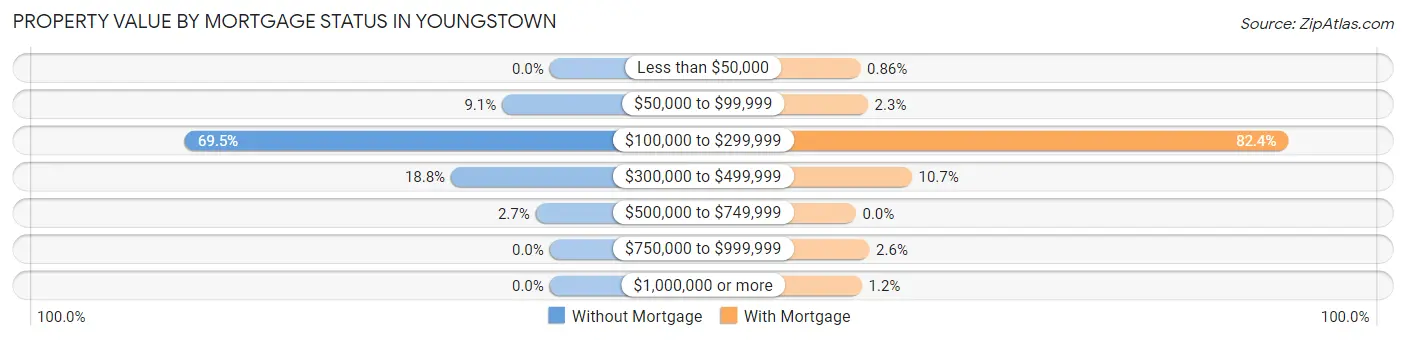
| Property Value | Without Mortgage | With Mortgage |
| Less than $50,000 | 0 (0.0%) | 3 (0.9%) |
| $50,000 to $99,999 | 27 (9.1%) | 8 (2.3%) |
| $100,000 to $299,999 | 207 (69.5%) | 286 (82.4%) |
| $300,000 to $499,999 | 56 (18.8%) | 37 (10.7%) |
| $500,000 to $749,999 | 8 (2.7%) | 0 (0.0%) |
| $750,000 to $999,999 | 0 (0.0%) | 9 (2.6%) |
| $1,000,000 or more | 0 (0.0%) | 4 (1.1%) |
| Total | 298 (100.0%) | 347 (100.0%) |
Household Income by Mortgage Status in Youngstown
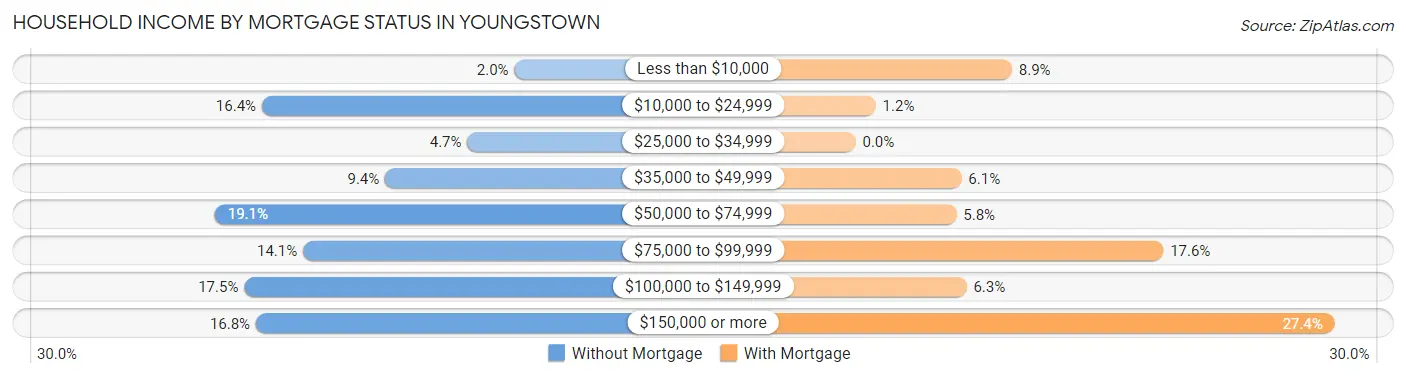
| Household Income | Without Mortgage | With Mortgage |
| Less than $10,000 | 6 (2.0%) | 31 (8.9%) |
| $10,000 to $24,999 | 49 (16.4%) | 4 (1.1%) |
| $25,000 to $34,999 | 14 (4.7%) | 0 (0.0%) |
| $35,000 to $49,999 | 28 (9.4%) | 21 (6.0%) |
| $50,000 to $74,999 | 57 (19.1%) | 20 (5.8%) |
| $75,000 to $99,999 | 42 (14.1%) | 61 (17.6%) |
| $100,000 to $149,999 | 52 (17.4%) | 22 (6.3%) |
| $150,000 or more | 50 (16.8%) | 95 (27.4%) |
| Total | 298 (100.0%) | 347 (100.0%) |
Property Value to Household Income Ratio in Youngstown
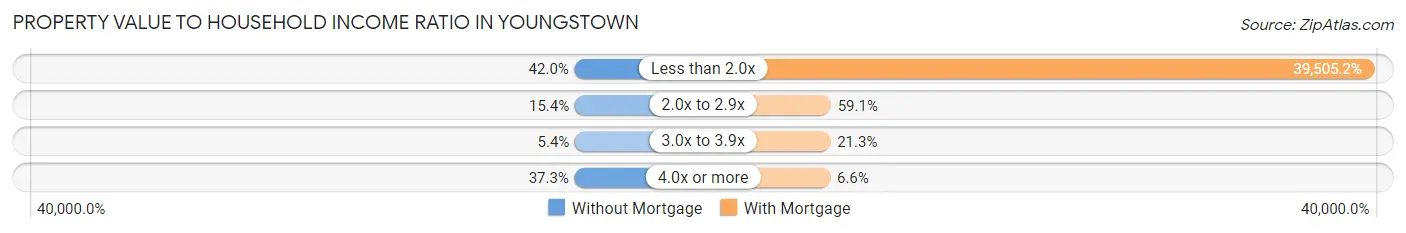
| Value-to-Income Ratio | Without Mortgage | With Mortgage |
| Less than 2.0x | 125 (41.9%) | 137,083 (39,505.2%) |
| 2.0x to 2.9x | 46 (15.4%) | 205 (59.1%) |
| 3.0x to 3.9x | 16 (5.4%) | 74 (21.3%) |
| 4.0x or more | 111 (37.2%) | 23 (6.6%) |
| Total | 298 (100.0%) | 347 (100.0%) |
Real Estate Taxes by Mortgage Status in Youngstown
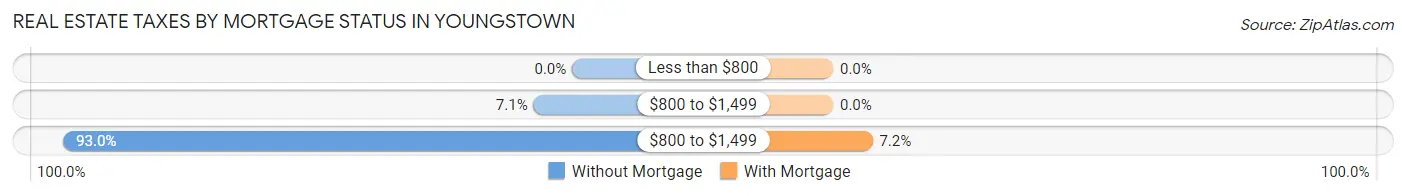
| Property Taxes | Without Mortgage | With Mortgage |
| Less than $800 | 0 (0.0%) | 0 (0.0%) |
| $800 to $1,499 | 21 (7.0%) | 0 (0.0%) |
| $800 to $1,499 | 277 (92.9%) | 25 (7.2%) |
| Total | 298 (100.0%) | 347 (100.0%) |
Health & Disability in Youngstown
Health Insurance Coverage by Age in Youngstown
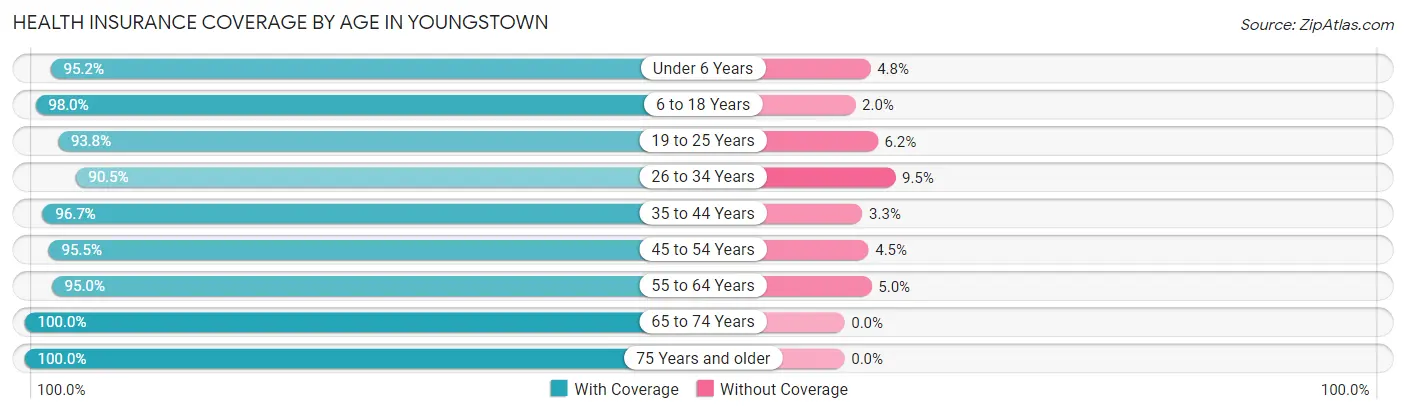
| Age Bracket | With Coverage | Without Coverage |
| Under 6 Years | 118 (95.2%) | 6 (4.8%) |
| 6 to 18 Years | 342 (98.0%) | 7 (2.0%) |
| 19 to 25 Years | 121 (93.8%) | 8 (6.2%) |
| 26 to 34 Years | 134 (90.5%) | 14 (9.5%) |
| 35 to 44 Years | 145 (96.7%) | 5 (3.3%) |
| 45 to 54 Years | 299 (95.5%) | 14 (4.5%) |
| 55 to 64 Years | 226 (95.0%) | 12 (5.0%) |
| 65 to 74 Years | 255 (100.0%) | 0 (0.0%) |
| 75 Years and older | 249 (100.0%) | 0 (0.0%) |
| Total | 1,889 (96.6%) | 66 (3.4%) |
Health Insurance Coverage by Citizenship Status in Youngstown
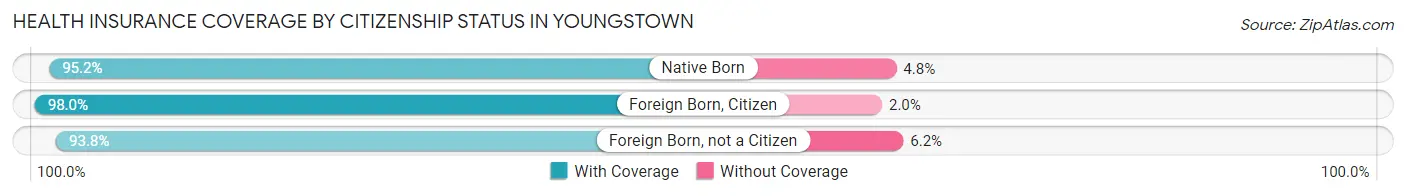
| Citizenship Status | With Coverage | Without Coverage |
| Native Born | 118 (95.2%) | 6 (4.8%) |
| Foreign Born, Citizen | 342 (98.0%) | 7 (2.0%) |
| Foreign Born, not a Citizen | 121 (93.8%) | 8 (6.2%) |
Health Insurance Coverage by Household Income in Youngstown
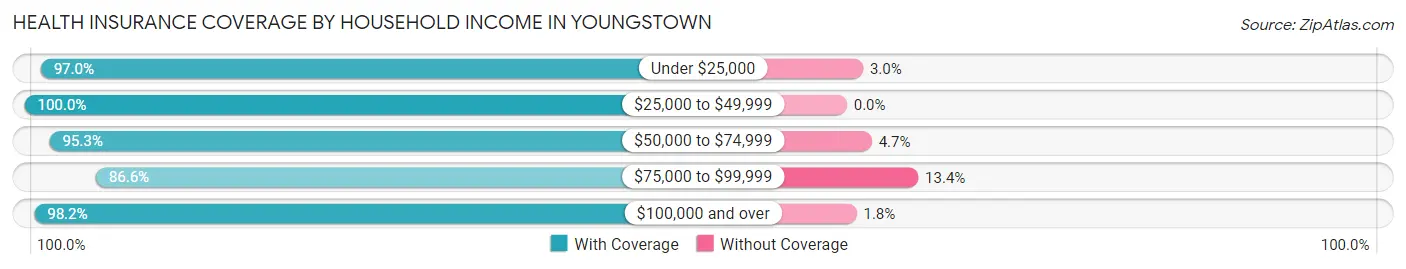
| Household Income | With Coverage | Without Coverage |
| Under $25,000 | 224 (97.0%) | 7 (3.0%) |
| $25,000 to $49,999 | 231 (100.0%) | 0 (0.0%) |
| $50,000 to $74,999 | 286 (95.3%) | 14 (4.7%) |
| $75,000 to $99,999 | 175 (86.6%) | 27 (13.4%) |
| $100,000 and over | 973 (98.2%) | 18 (1.8%) |
Public vs Private Health Insurance Coverage by Age in Youngstown
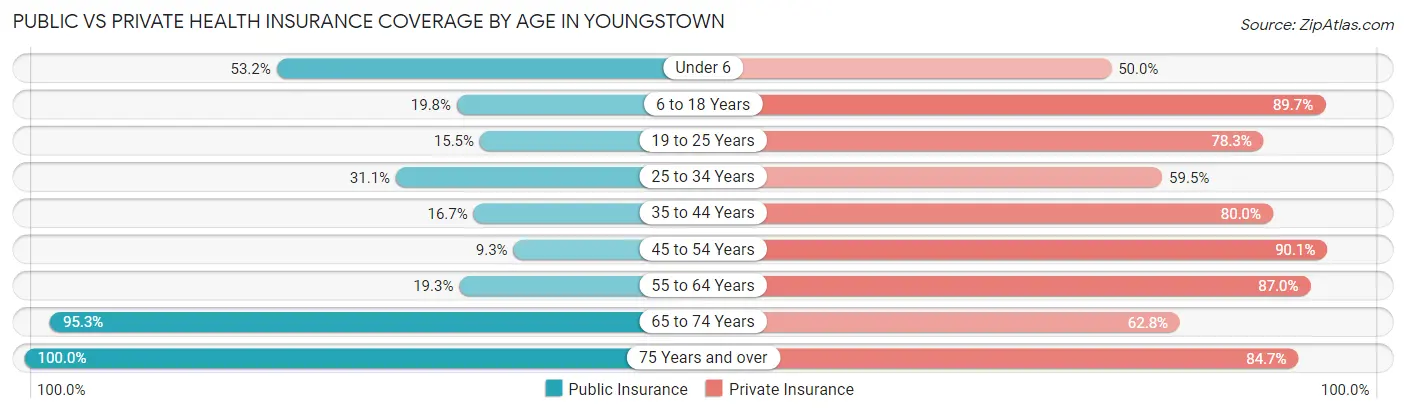
| Age Bracket | Public Insurance | Private Insurance |
| Under 6 | 66 (53.2%) | 62 (50.0%) |
| 6 to 18 Years | 69 (19.8%) | 313 (89.7%) |
| 19 to 25 Years | 20 (15.5%) | 101 (78.3%) |
| 25 to 34 Years | 46 (31.1%) | 88 (59.5%) |
| 35 to 44 Years | 25 (16.7%) | 120 (80.0%) |
| 45 to 54 Years | 29 (9.3%) | 282 (90.1%) |
| 55 to 64 Years | 46 (19.3%) | 207 (87.0%) |
| 65 to 74 Years | 243 (95.3%) | 160 (62.7%) |
| 75 Years and over | 249 (100.0%) | 211 (84.7%) |
| Total | 793 (40.6%) | 1,544 (79.0%) |
Disability Status by Sex by Age in Youngstown
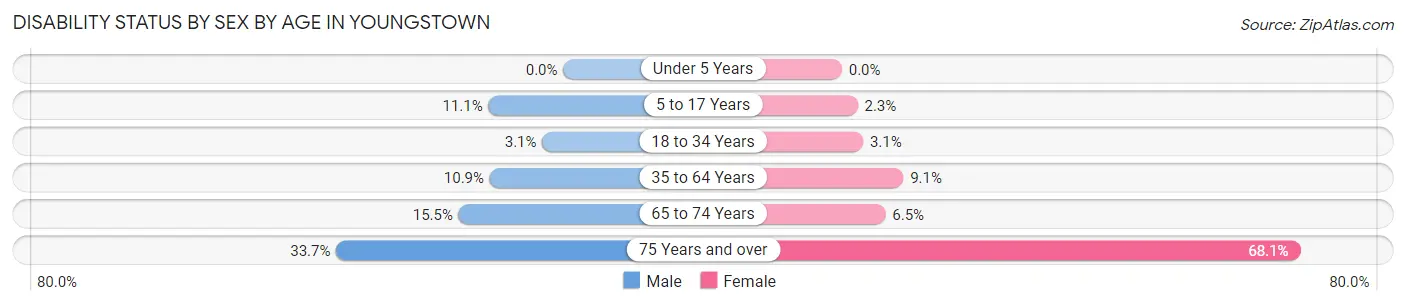
| Age Bracket | Male | Female |
| Under 5 Years | 0 (0.0%) | 0 (0.0%) |
| 5 to 17 Years | 20 (11.1%) | 4 (2.3%) |
| 18 to 34 Years | 4 (3.1%) | 5 (3.1%) |
| 35 to 64 Years | 37 (10.9%) | 33 (9.1%) |
| 65 to 74 Years | 18 (15.5%) | 9 (6.5%) |
| 75 Years and over | 29 (33.7%) | 111 (68.1%) |
Disability Class by Sex by Age in Youngstown
Disability Class: Hearing Difficulty
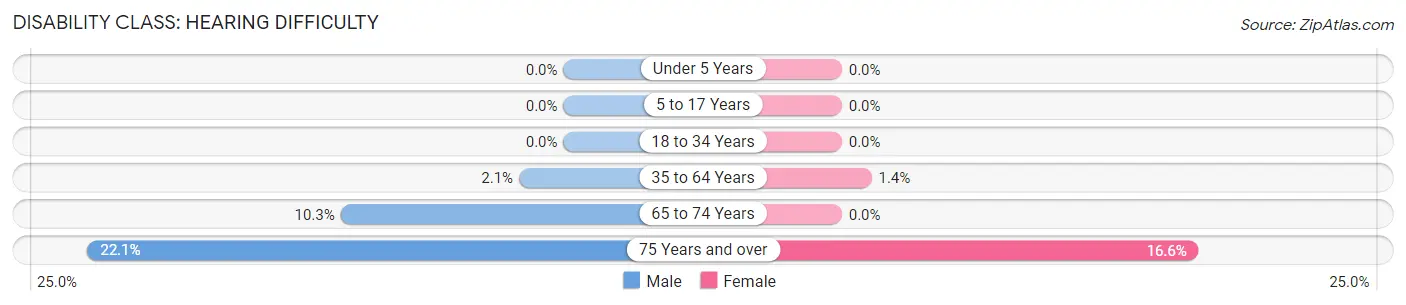
| Age Bracket | Male | Female |
| Under 5 Years | 0 (0.0%) | 0 (0.0%) |
| 5 to 17 Years | 0 (0.0%) | 0 (0.0%) |
| 18 to 34 Years | 0 (0.0%) | 0 (0.0%) |
| 35 to 64 Years | 7 (2.1%) | 5 (1.4%) |
| 65 to 74 Years | 12 (10.3%) | 0 (0.0%) |
| 75 Years and over | 19 (22.1%) | 27 (16.6%) |
Disability Class: Vision Difficulty
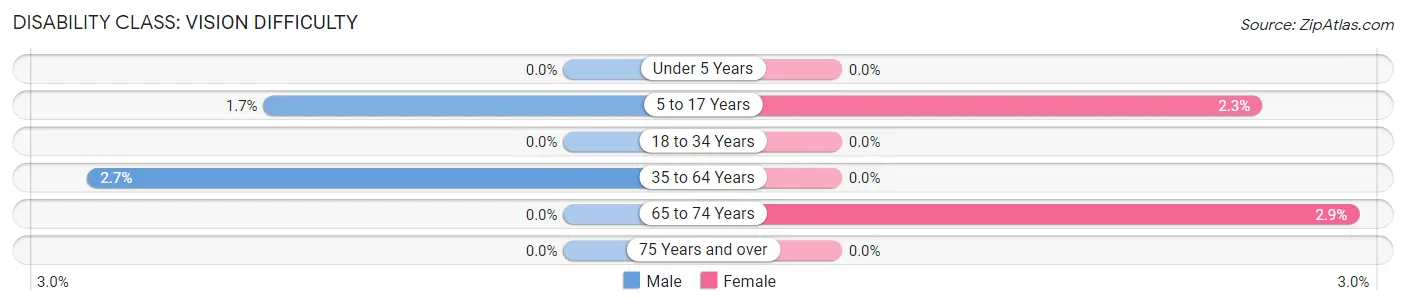
| Age Bracket | Male | Female |
| Under 5 Years | 0 (0.0%) | 0 (0.0%) |
| 5 to 17 Years | 3 (1.7%) | 4 (2.3%) |
| 18 to 34 Years | 0 (0.0%) | 0 (0.0%) |
| 35 to 64 Years | 9 (2.6%) | 0 (0.0%) |
| 65 to 74 Years | 0 (0.0%) | 4 (2.9%) |
| 75 Years and over | 0 (0.0%) | 0 (0.0%) |
Disability Class: Cognitive Difficulty
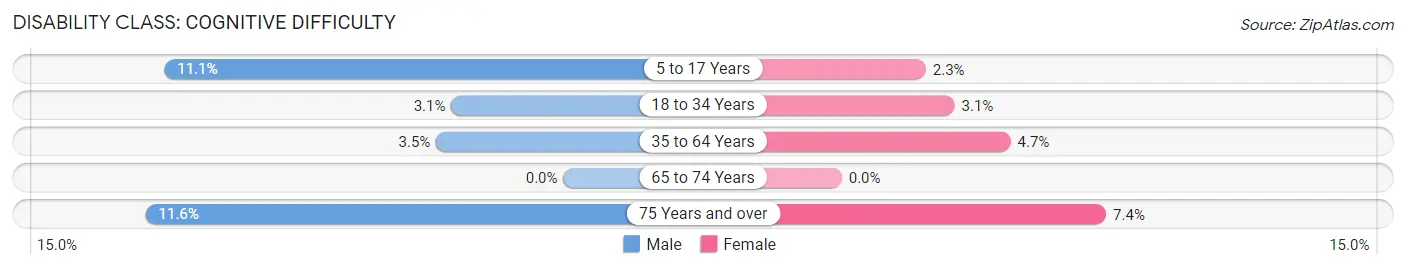
| Age Bracket | Male | Female |
| 5 to 17 Years | 20 (11.1%) | 4 (2.3%) |
| 18 to 34 Years | 4 (3.1%) | 5 (3.1%) |
| 35 to 64 Years | 12 (3.5%) | 17 (4.7%) |
| 65 to 74 Years | 0 (0.0%) | 0 (0.0%) |
| 75 Years and over | 10 (11.6%) | 12 (7.4%) |
Disability Class: Ambulatory Difficulty
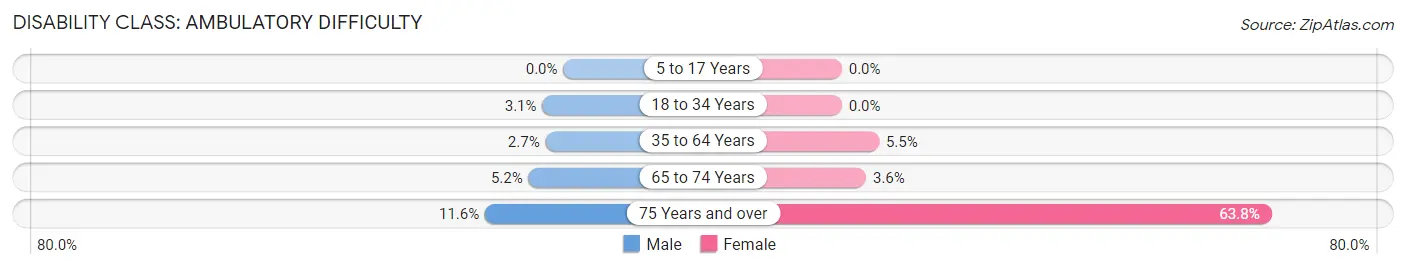
| Age Bracket | Male | Female |
| 5 to 17 Years | 0 (0.0%) | 0 (0.0%) |
| 18 to 34 Years | 4 (3.1%) | 0 (0.0%) |
| 35 to 64 Years | 9 (2.6%) | 20 (5.5%) |
| 65 to 74 Years | 6 (5.2%) | 5 (3.6%) |
| 75 Years and over | 10 (11.6%) | 104 (63.8%) |
Disability Class: Self-Care Difficulty
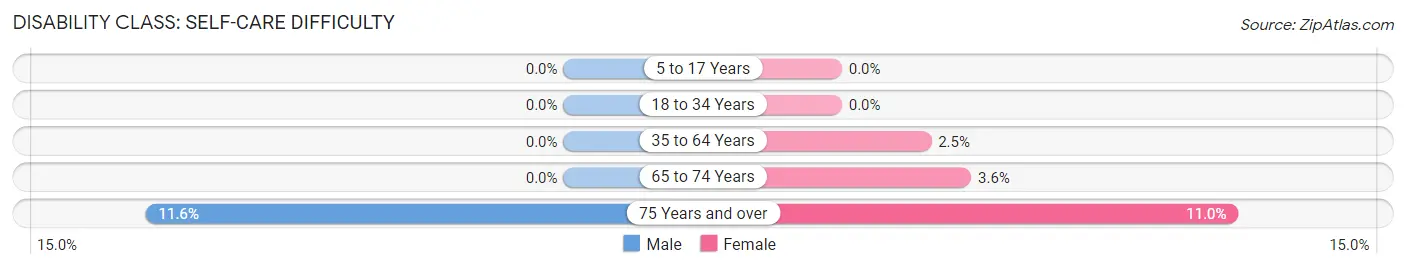
| Age Bracket | Male | Female |
| 5 to 17 Years | 0 (0.0%) | 0 (0.0%) |
| 18 to 34 Years | 0 (0.0%) | 0 (0.0%) |
| 35 to 64 Years | 0 (0.0%) | 9 (2.5%) |
| 65 to 74 Years | 0 (0.0%) | 5 (3.6%) |
| 75 Years and over | 10 (11.6%) | 18 (11.0%) |
Technology Access in Youngstown
Computing Device Access in Youngstown
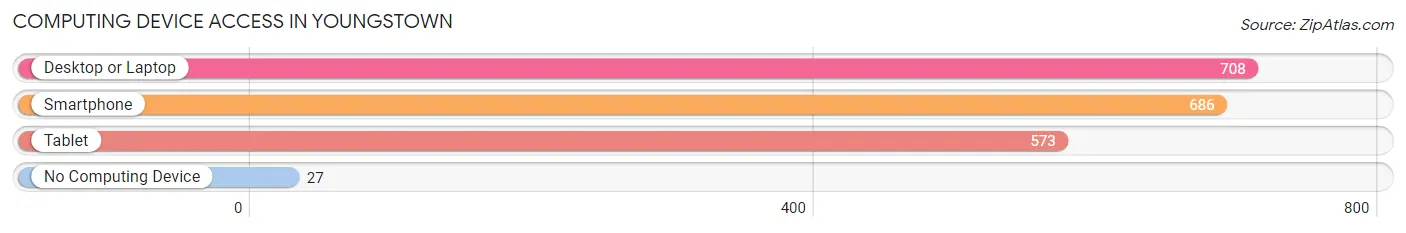
| Device Type | # Households | % Households |
| Desktop or Laptop | 708 | 87.7% |
| Smartphone | 686 | 85.0% |
| Tablet | 573 | 71.0% |
| No Computing Device | 27 | 3.4% |
| Total | 807 | 100.0% |
Internet Access in Youngstown
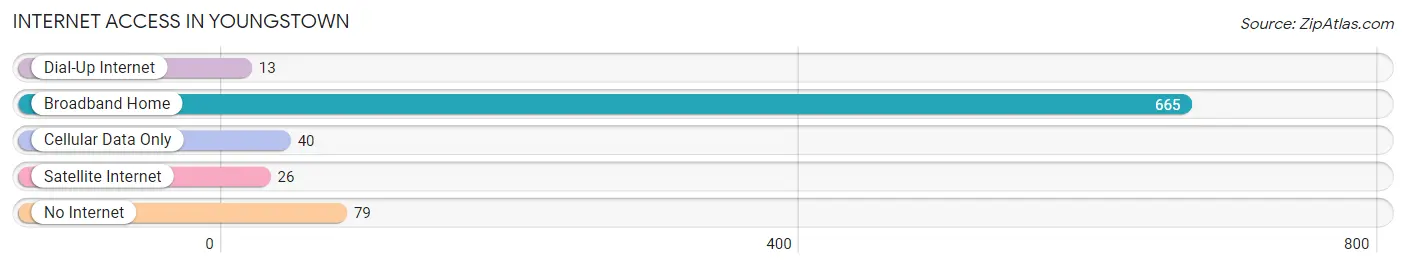
| Internet Type | # Households | % Households |
| Dial-Up Internet | 13 | 1.6% |
| Broadband Home | 665 | 82.4% |
| Cellular Data Only | 40 | 5.0% |
| Satellite Internet | 26 | 3.2% |
| No Internet | 79 | 9.8% |
| Total | 807 | 100.0% |
Youngstown Summary
Youngstown, NY is a small village located in Niagara County, New York. It is situated on the Niagara River, just south of the city of Niagara Falls. The village has a population of approximately 1,500 people and is part of the larger Niagara Falls metropolitan area.
Geography
Youngstown is located in the Niagara River Valley, which is part of the Great Lakes region. The village is situated on the west bank of the Niagara River, just south of the city of Niagara Falls. The village is bordered by the towns of Porter and Lewiston to the north, and the towns of Cambria and Hartland to the south. The village is located approximately 20 miles north of Buffalo, New York, and approximately 50 miles south of Toronto, Canada.
The village is situated on a flat plain, with the Niagara River to the east and the Niagara Escarpment to the west. The Niagara Escarpment is a ridge of land that runs along the western edge of the Niagara River, and is part of the Niagara Gorge. The Niagara Gorge is a deep ravine that was carved out by the Niagara River over thousands of years.
The village is located in a temperate climate zone, with warm summers and cold winters. The average annual temperature is around 50 degrees Fahrenheit, with average highs in the summer months reaching into the mid-80s and average lows in the winter months reaching into the low-20s.
History
Youngstown was first settled in 1811 by a group of settlers from Connecticut. The village was originally known as “Young’s Town”, after the first settler, John Young. The village was incorporated in 1854, and the name was changed to Youngstown.
The village was an important port on the Niagara River, and was a major stop for steamboats and other vessels traveling between Buffalo and Toronto. The village was also an important stop for the Underground Railroad, and was a safe haven for escaped slaves.
The village was also an important center for the lumber industry, and was home to several sawmills and lumber yards. The village was also home to several gristmills, which were used to grind grain into flour.
The village was also an important center for the fruit industry, and was home to several orchards and canneries. The village was also home to several wineries, which produced wine from the local grapes.
The village was also an important center for the fishing industry, and was home to several fish canneries. The village was also home to several boatyards, which built and repaired boats for the local fishermen.
Economy
The economy of Youngstown is largely based on tourism and agriculture. The village is home to several wineries, which produce wine from the local grapes. The village is also home to several orchards, which produce apples, peaches, and other fruits. The village is also home to several fish canneries, which process and can the local fish.
The village is also home to several boatyards, which build and repair boats for the local fishermen. The village is also home to several marinas, which provide docking and storage for boats.
The village is also home to several restaurants, which serve local and regional cuisine. The village is also home to several shops, which sell local crafts and souvenirs.
Demographics
As of the 2010 census, the population of Youngstown was 1,521. The racial makeup of the village was 97.3% White, 0.7% African American, 0.3% Native American, 0.3% Asian, 0.2% from other races, and 1.2% from two or more races. Hispanic or Latino of any race were 1.2% of the population.
The median household income in Youngstown was $45,938, and the median family income was $51,938. The per capita income in Youngstown was $20,938. About 8.3% of families and 10.3% of the population were below the poverty line, including 14.3% of those under age 18 and 5.3% of those age 65 or over.
Conclusion
Youngstown, NY is a small village located in Niagara County, New York. It is situated on the Niagara River, just south of the city of Niagara Falls. The village has a population of approximately 1,500 people and is part of the larger Niagara Falls metropolitan area. The village is situated on a flat plain, with the Niagara River to the east and the Niagara Escarpment to the west. The village was first settled in 1811 and was an important port on the Niagara River. The economy of Youngstown is largely based on tourism and agriculture. As of the 2010 census, the population of Youngstown was 1,521. The median household income in Youngstown was $45,938, and the median family income was $51,938.
Common Questions
What is the Total Population of Youngstown?
Total Population of Youngstown is 1,965.
What is the Total Male Population of Youngstown?
Total Male Population of Youngstown is 893.
What is the Total Female Population of Youngstown?
Total Female Population of Youngstown is 1,072.
What is the Ratio of Males per 100 Females in Youngstown?
There are 83.30 Males per 100 Females in Youngstown.
What is the Ratio of Females per 100 Males in Youngstown?
There are 120.04 Females per 100 Males in Youngstown.
What is the Median Population Age in Youngstown?
Median Population Age in Youngstown is 47.5 Years.
What is the Average Family Size in Youngstown
Average Family Size in Youngstown is 2.9 People.
What is the Average Household Size in Youngstown
Average Household Size in Youngstown is 2.4 People.
What is Per Capita Income in Youngstown?
Per Capita income in Youngstown is $39,356.
What is the Median Family Income in Youngstown?
Median Family Income in Youngstown is $94,271.
What is the Median Household income in Youngstown?
Median Household Income in Youngstown is $76,467.
What is Income or Wage Gap in Youngstown?
Income or Wage Gap in Youngstown is 30.5%.
Women in Youngstown earn 69.5 cents for every dollar earned by a man.
What is Inequality or Gini Index in Youngstown?
Inequality or Gini Index in Youngstown is 0.41.
How Large is the Labor Force in Youngstown?
There are 905 People in the Labor Forcein in Youngstown.
What is the Percentage of People in the Labor Force in Youngstown?
57.5% of People are in the Labor Force in Youngstown.
What is the Unemployment Rate in Youngstown?
Unemployment Rate in Youngstown is 7.0%.