Islip, NY
Islip Map
Islip Overview
17,284
TOTAL POPULATION
8,468
MALE POPULATION
8,816
FEMALE POPULATION
96.05
MALES / 100 FEMALES
104.11
FEMALES / 100 MALES
43.7
MEDIAN AGE
3.4
AVG FAMILY SIZE
2.8
AVG HOUSEHOLD SIZE
$49,570
PER CAPITA INCOME
$147,640
AVG FAMILY INCOME
$121,259
AVG HOUSEHOLD INCOME
38.4%
WAGE / INCOME GAP [ % ]
61.6¢/ $1
WAGE / INCOME GAP [ $ ]
0.39
INEQUALITY / GINI INDEX
9,746
LABOR FORCE [ PEOPLE ]
67.5%
PERCENT IN LABOR FORCE
5.4%
UNEMPLOYMENT RATE
Islip Zip Codes
Islip Area Codes
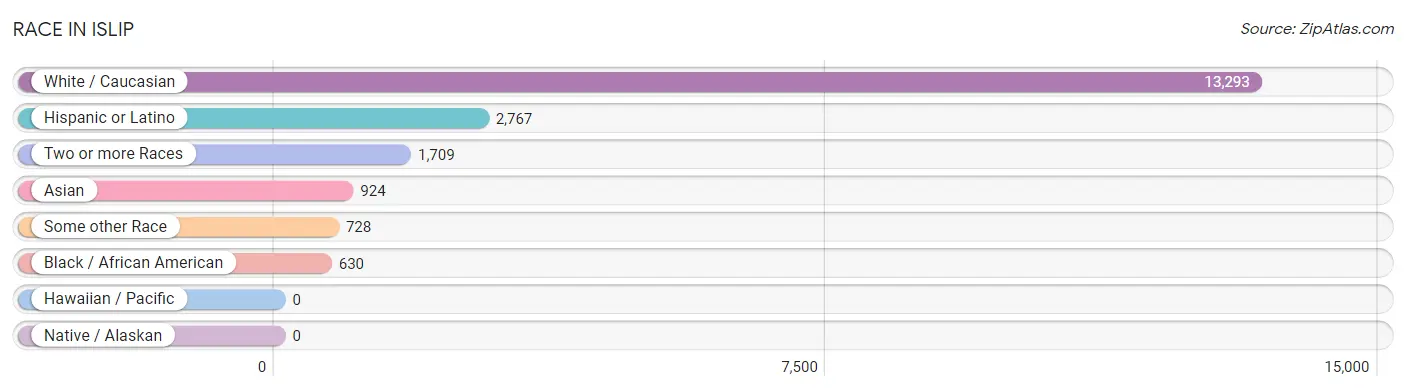
Race in Islip
The most populous races in Islip are White / Caucasian (13,293 | 76.9%), Hispanic or Latino (2,767 | 16.0%), and Two or more Races (1,709 | 9.9%).
| Race | # Population | % Population |
| Asian | 924 | 5.3% |
| Black / African American | 630 | 3.6% |
| Hawaiian / Pacific | 0 | 0.0% |
| Hispanic or Latino | 2,767 | 16.0% |
| Native / Alaskan | 0 | 0.0% |
| White / Caucasian | 13,293 | 76.9% |
| Two or more Races | 1,709 | 9.9% |
| Some other Race | 728 | 4.2% |
| Total | 17,284 | 100.0% |
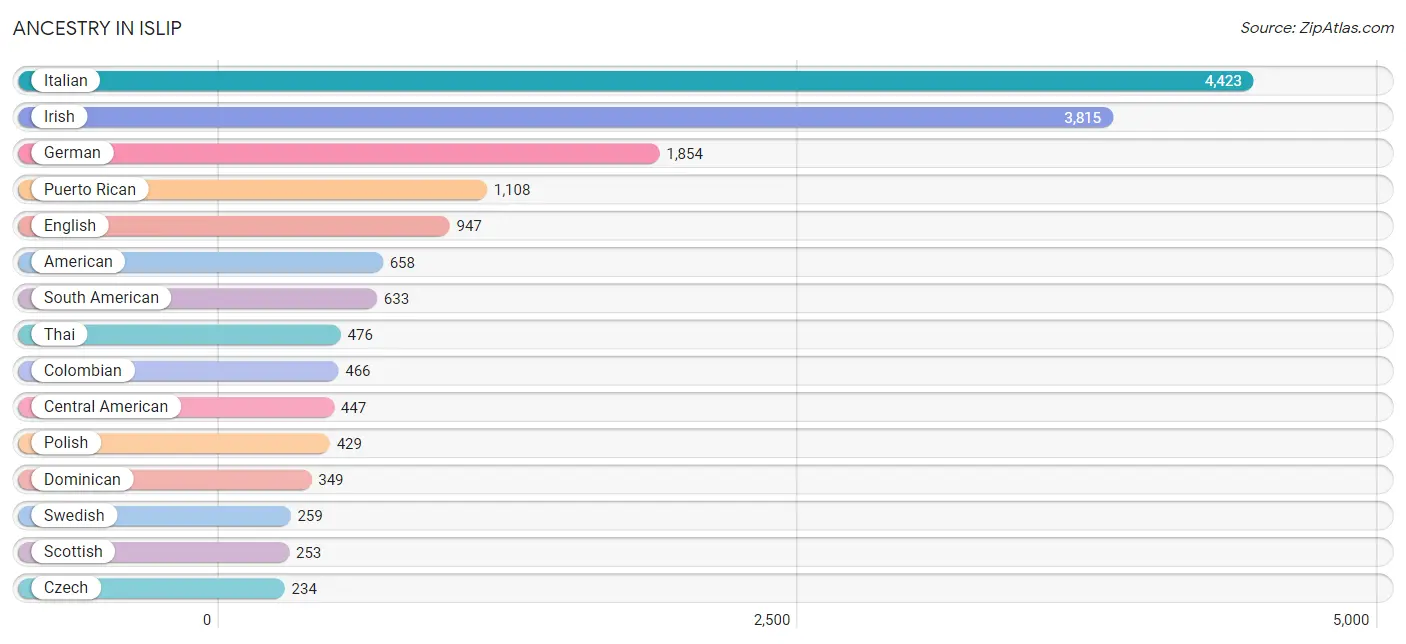
Ancestry in Islip
The most populous ancestries reported in Islip are Italian (4,423 | 25.6%), Irish (3,815 | 22.1%), German (1,854 | 10.7%), Puerto Rican (1,108 | 6.4%), and English (947 | 5.5%), together accounting for 70.3% of all Islip residents.
| Ancestry | # Population | % Population |
| African | 22 | 0.1% |
| Albanian | 8 | 0.1% |
| Alsatian | 18 | 0.1% |
| American | 658 | 3.8% |
| Arab | 88 | 0.5% |
| Austrian | 10 | 0.1% |
| Bhutanese | 26 | 0.2% |
| Brazilian | 28 | 0.2% |
| British | 38 | 0.2% |
| Burmese | 55 | 0.3% |
| Celtic | 161 | 0.9% |
| Central American | 447 | 2.6% |
| Chilean | 28 | 0.2% |
| Colombian | 466 | 2.7% |
| Croatian | 8 | 0.1% |
| Cuban | 11 | 0.1% |
| Cypriot | 9 | 0.1% |
| Czech | 234 | 1.3% |
| Dominican | 349 | 2.0% |
| Dutch | 44 | 0.3% |
| Dutch West Indian | 16 | 0.1% |
| Eastern European | 65 | 0.4% |
| Ecuadorian | 72 | 0.4% |
| Egyptian | 36 | 0.2% |
| English | 947 | 5.5% |
| Estonian | 14 | 0.1% |
| European | 107 | 0.6% |
| French | 168 | 1.0% |
| French Canadian | 56 | 0.3% |
| German | 1,854 | 10.7% |
| Greek | 137 | 0.8% |
| Guatemalan | 215 | 1.2% |
| Haitian | 116 | 0.7% |
| Hungarian | 124 | 0.7% |
| Indian (Asian) | 232 | 1.3% |
| Irish | 3,815 | 22.1% |
| Italian | 4,423 | 25.6% |
| Jamaican | 99 | 0.6% |
| Korean | 228 | 1.3% |
| Latvian | 34 | 0.2% |
| Lithuanian | 147 | 0.9% |
| Maltese | 18 | 0.1% |
| Mexican | 107 | 0.6% |
| Moroccan | 43 | 0.3% |
| Nicaraguan | 37 | 0.2% |
| Nigerian | 19 | 0.1% |
| Northern European | 6 | 0.0% |
| Norwegian | 112 | 0.6% |
| Panamanian | 22 | 0.1% |
| Peruvian | 67 | 0.4% |
| Polish | 429 | 2.5% |
| Portuguese | 14 | 0.1% |
| Puerto Rican | 1,108 | 6.4% |
| Romanian | 65 | 0.4% |
| Russian | 111 | 0.6% |
| Salvadoran | 173 | 1.0% |
| Scotch-Irish | 4 | 0.0% |
| Scottish | 253 | 1.5% |
| South American | 633 | 3.7% |
| Spaniard | 14 | 0.1% |
| Spanish | 46 | 0.3% |
| Sri Lankan | 14 | 0.1% |
| Subsaharan African | 43 | 0.3% |
| Swedish | 259 | 1.5% |
| Syrian | 9 | 0.1% |
| Thai | 476 | 2.8% |
| Trinidadian and Tobagonian | 10 | 0.1% |
| Turkish | 53 | 0.3% |
| Ukrainian | 7 | 0.0% |
| Vietnamese | 116 | 0.7% |
| Welsh | 55 | 0.3% |
| West Indian | 27 | 0.2% | View All 72 Rows |
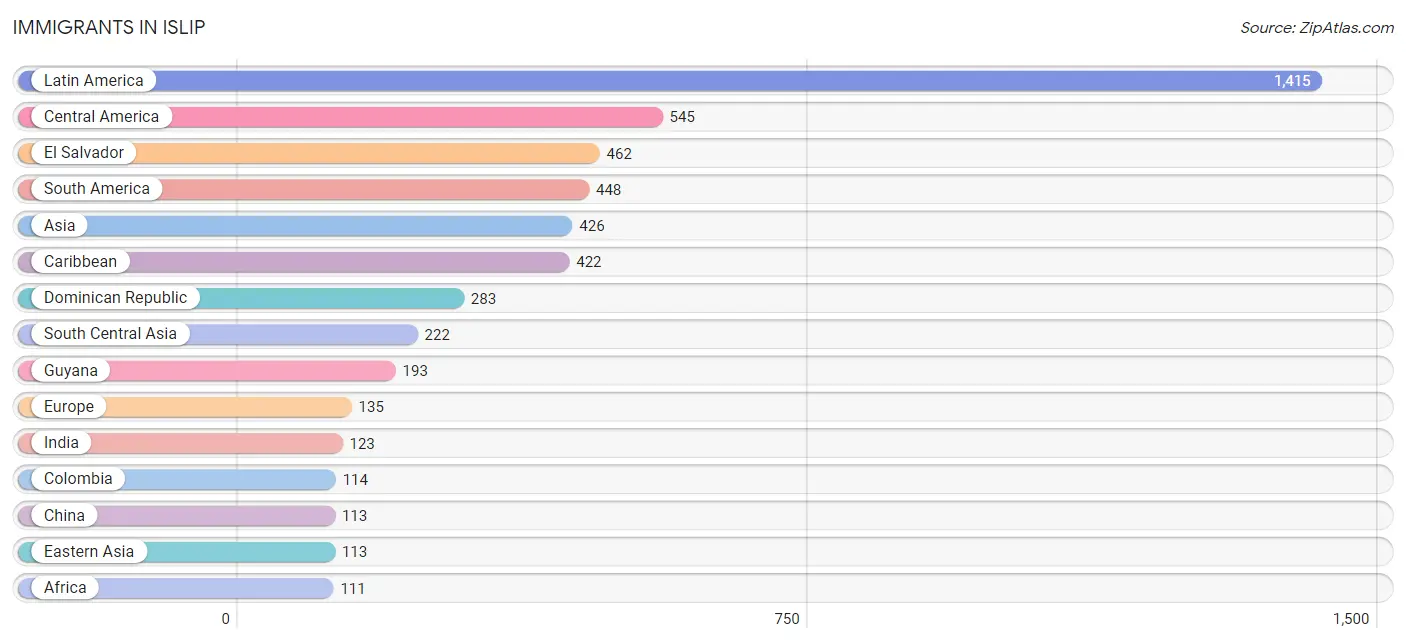
Immigrants in Islip
The most numerous immigrant groups reported in Islip came from Latin America (1,415 | 8.2%), Central America (545 | 3.2%), El Salvador (462 | 2.7%), South America (448 | 2.6%), and Asia (426 | 2.5%), together accounting for 19.1% of all Islip residents.
| Immigration Origin | # Population | % Population |
| Africa | 111 | 0.6% |
| Asia | 426 | 2.5% |
| Bangladesh | 82 | 0.5% |
| Brazil | 28 | 0.2% |
| Caribbean | 422 | 2.4% |
| Central America | 545 | 3.2% |
| Chile | 28 | 0.2% |
| China | 113 | 0.6% |
| Colombia | 114 | 0.7% |
| Cuba | 7 | 0.0% |
| Dominican Republic | 283 | 1.6% |
| Eastern Asia | 113 | 0.6% |
| Eastern Europe | 36 | 0.2% |
| Ecuador | 24 | 0.1% |
| Egypt | 62 | 0.4% |
| El Salvador | 462 | 2.7% |
| England | 5 | 0.0% |
| Europe | 135 | 0.8% |
| Germany | 5 | 0.0% |
| Guatemala | 45 | 0.3% |
| Guyana | 193 | 1.1% |
| Haiti | 62 | 0.4% |
| Hong Kong | 29 | 0.2% |
| India | 123 | 0.7% |
| Ireland | 7 | 0.0% |
| Italy | 32 | 0.2% |
| Jamaica | 44 | 0.3% |
| Latin America | 1,415 | 8.2% |
| Mexico | 38 | 0.2% |
| Middle Africa | 2 | 0.0% |
| Moldova | 19 | 0.1% |
| Morocco | 43 | 0.3% |
| Nigeria | 4 | 0.0% |
| Northern Africa | 105 | 0.6% |
| Northern Europe | 56 | 0.3% |
| Pakistan | 17 | 0.1% |
| Peru | 61 | 0.4% |
| Philippines | 53 | 0.3% |
| Poland | 17 | 0.1% |
| Portugal | 6 | 0.0% |
| Scotland | 17 | 0.1% |
| South America | 448 | 2.6% |
| South Central Asia | 222 | 1.3% |
| South Eastern Asia | 53 | 0.3% |
| Southern Europe | 38 | 0.2% |
| Sweden | 14 | 0.1% |
| Taiwan | 26 | 0.2% |
| Trinidad and Tobago | 10 | 0.1% |
| Turkey | 20 | 0.1% |
| Western Africa | 4 | 0.0% |
| Western Asia | 38 | 0.2% |
| Western Europe | 5 | 0.0% |
| Zaire | 2 | 0.0% | View All 53 Rows |
Sex and Age in Islip
Sex and Age in Islip
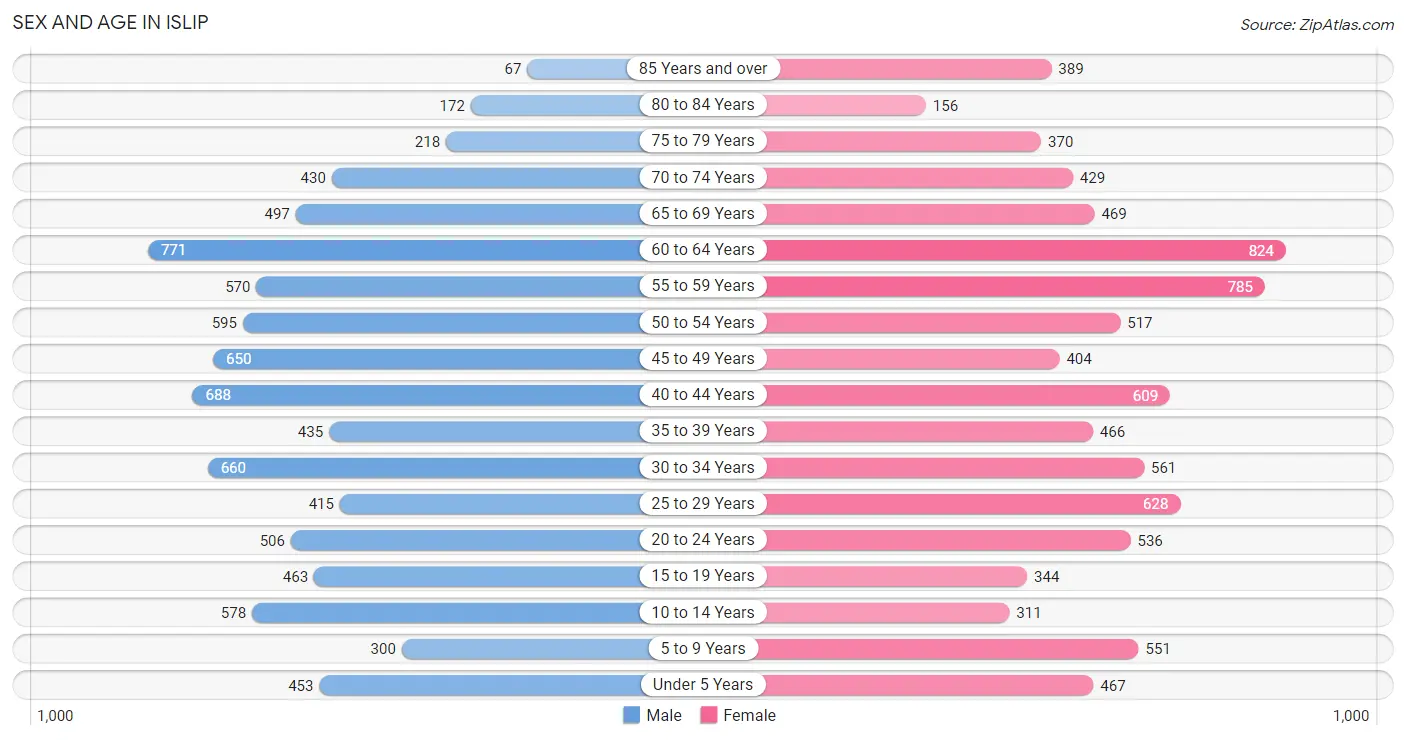
The most populous age groups in Islip are 60 to 64 Years (771 | 9.1%) for men and 60 to 64 Years (824 | 9.3%) for women.
| Age Bracket | Male | Female |
| Under 5 Years | 453 (5.3%) | 467 (5.3%) |
| 5 to 9 Years | 300 (3.5%) | 551 (6.2%) |
| 10 to 14 Years | 578 (6.8%) | 311 (3.5%) |
| 15 to 19 Years | 463 (5.5%) | 344 (3.9%) |
| 20 to 24 Years | 506 (6.0%) | 536 (6.1%) |
| 25 to 29 Years | 415 (4.9%) | 628 (7.1%) |
| 30 to 34 Years | 660 (7.8%) | 561 (6.4%) |
| 35 to 39 Years | 435 (5.1%) | 466 (5.3%) |
| 40 to 44 Years | 688 (8.1%) | 609 (6.9%) |
| 45 to 49 Years | 650 (7.7%) | 404 (4.6%) |
| 50 to 54 Years | 595 (7.0%) | 517 (5.9%) |
| 55 to 59 Years | 570 (6.7%) | 785 (8.9%) |
| 60 to 64 Years | 771 (9.1%) | 824 (9.3%) |
| 65 to 69 Years | 497 (5.9%) | 469 (5.3%) |
| 70 to 74 Years | 430 (5.1%) | 429 (4.9%) |
| 75 to 79 Years | 218 (2.6%) | 370 (4.2%) |
| 80 to 84 Years | 172 (2.0%) | 156 (1.8%) |
| 85 Years and over | 67 (0.8%) | 389 (4.4%) |
| Total | 8,468 (100.0%) | 8,816 (100.0%) |
Families and Households in Islip
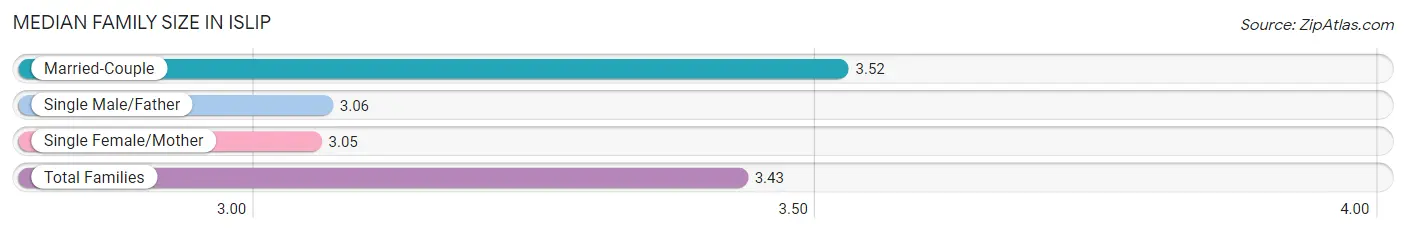
Median Family Size in Islip
The median family size in Islip is 3.43 persons per family, with married-couple families (3,415 | 79.4%) accounting for the largest median family size of 3.52 persons per family. On the other hand, single female/mother families (567 | 13.2%) represent the smallest median family size with 3.05 persons per family.
| Family Type | # Families | Family Size |
| Married-Couple | 3,415 (79.4%) | 3.52 |
| Single Male/Father | 318 (7.4%) | 3.06 |
| Single Female/Mother | 567 (13.2%) | 3.05 |
| Total Families | 4,300 (100.0%) | 3.43 |
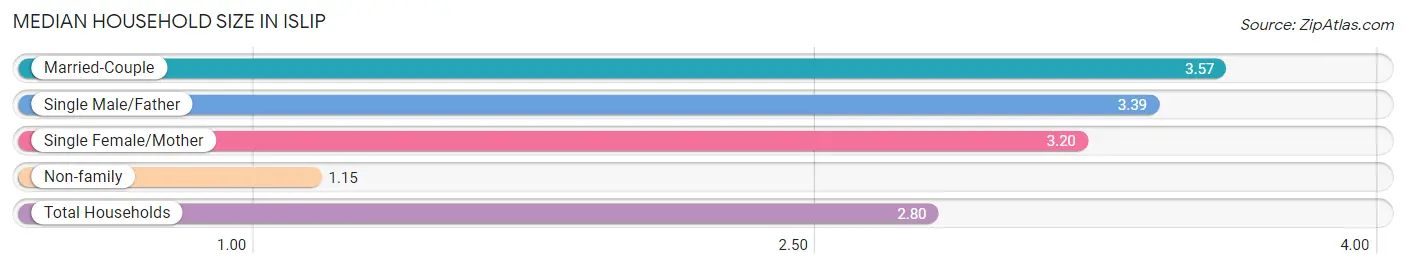
Median Household Size in Islip
The median household size in Islip is 2.80 persons per household, with married-couple households (3,415 | 55.6%) accounting for the largest median household size of 3.57 persons per household. non-family households (1,837 | 29.9%) represent the smallest median household size with 1.15 persons per household.
| Household Type | # Households | Household Size |
| Married-Couple | 3,415 (55.6%) | 3.57 |
| Single Male/Father | 318 (5.2%) | 3.39 |
| Single Female/Mother | 567 (9.2%) | 3.20 |
| Non-family | 1,837 (29.9%) | 1.15 |
| Total Households | 6,137 (100.0%) | 2.80 |
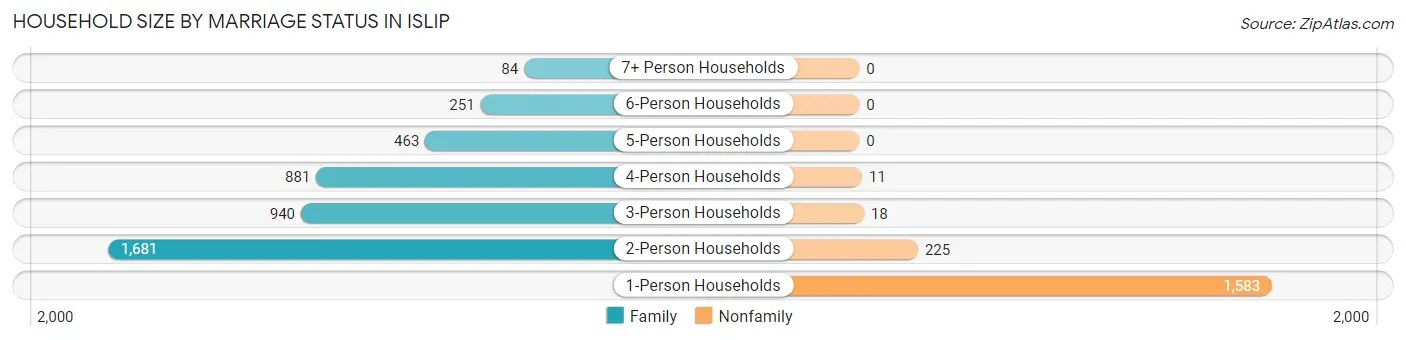
Household Size by Marriage Status in Islip
Out of a total of 6,137 households in Islip, 4,300 (70.1%) are family households, while 1,837 (29.9%) are nonfamily households. The most numerous type of family households are 2-person households, comprising 1,681, and the most common type of nonfamily households are 1-person households, comprising 1,583.
| Household Size | Family Households | Nonfamily Households |
| 1-Person Households | - | 1,583 (25.8%) |
| 2-Person Households | 1,681 (27.4%) | 225 (3.7%) |
| 3-Person Households | 940 (15.3%) | 18 (0.3%) |
| 4-Person Households | 881 (14.4%) | 11 (0.2%) |
| 5-Person Households | 463 (7.5%) | 0 (0.0%) |
| 6-Person Households | 251 (4.1%) | 0 (0.0%) |
| 7+ Person Households | 84 (1.4%) | 0 (0.0%) |
| Total | 4,300 (70.1%) | 1,837 (29.9%) |
Female Fertility in Islip
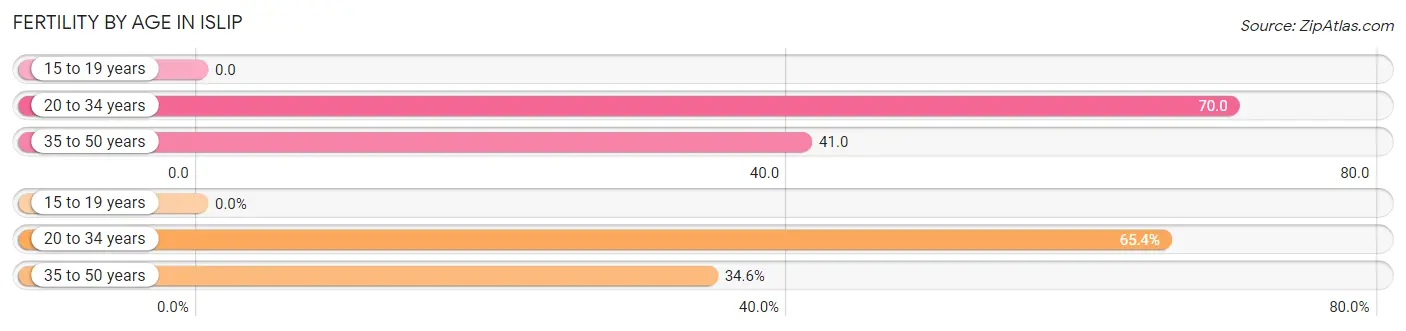
Fertility by Age in Islip
Average fertility rate in Islip is 51.0 births per 1,000 women. Women in the age bracket of 20 to 34 years have the highest fertility rate with 70.0 births per 1,000 women. Women in the age bracket of 20 to 34 years acount for 65.4% of all women with births.
| Age Bracket | Women with Births | Births / 1,000 Women |
| 15 to 19 years | 0 (0.0%) | 0.0 |
| 20 to 34 years | 121 (65.4%) | 70.0 |
| 35 to 50 years | 64 (34.6%) | 41.0 |
| Total | 185 (100.0%) | 51.0 |
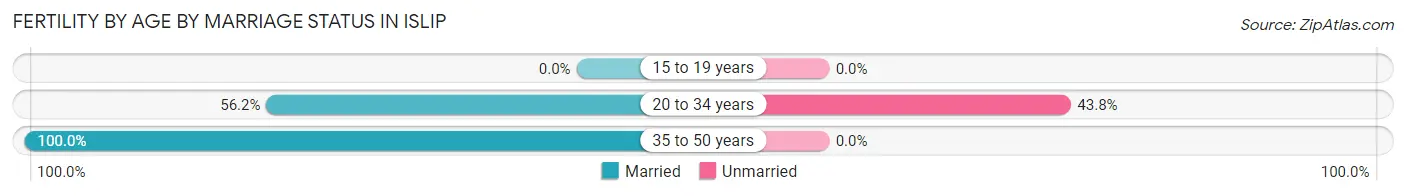
Fertility by Age by Marriage Status in Islip
71.4% of women with births (185) in Islip are married. The highest percentage of unmarried women with births falls into 20 to 34 years age bracket with 43.8% of them unmarried at the time of birth, while the lowest percentage of unmarried women with births belong to 35 to 50 years age bracket with 0.0% of them unmarried.
| Age Bracket | Married | Unmarried |
| 15 to 19 years | 0 (0.0%) | 0 (0.0%) |
| 20 to 34 years | 68 (56.2%) | 53 (43.8%) |
| 35 to 50 years | 64 (100.0%) | 0 (0.0%) |
| Total | 132 (71.4%) | 53 (28.6%) |
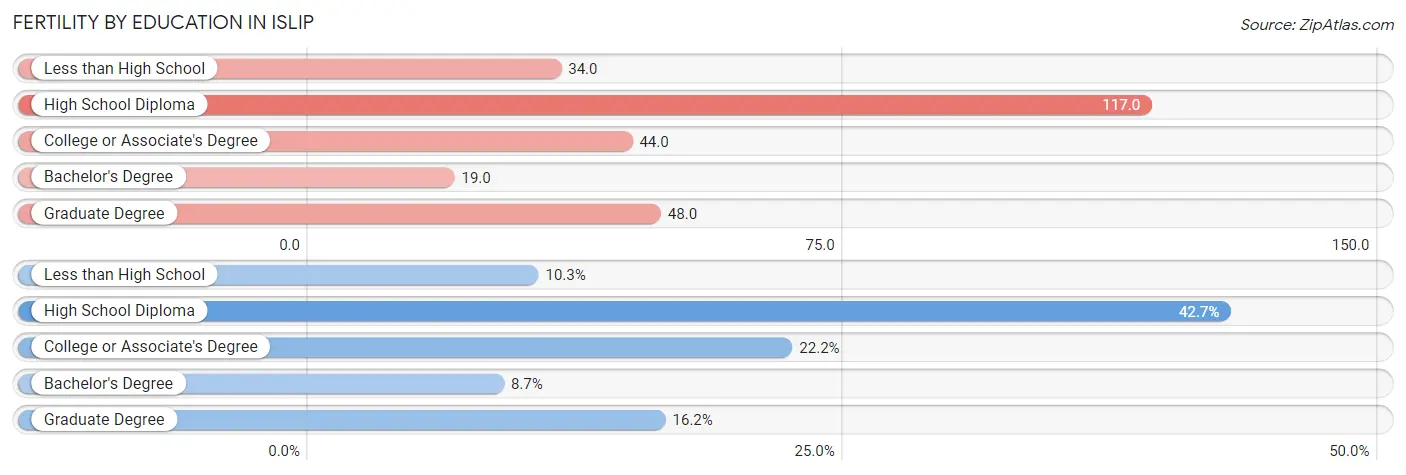
Fertility by Education in Islip
Average fertility rate in Islip is 51.0 births per 1,000 women. Women with the education attainment of high school diploma have the highest fertility rate of 117.0 births per 1,000 women, while women with the education attainment of bachelor's degree have the lowest fertility at 19.0 births per 1,000 women. Women with the education attainment of high school diploma represent 42.7% of all women with births.
| Educational Attainment | Women with Births | Births / 1,000 Women |
| Less than High School | 19 (10.3%) | 34.0 |
| High School Diploma | 79 (42.7%) | 117.0 |
| College or Associate's Degree | 41 (22.2%) | 44.0 |
| Bachelor's Degree | 16 (8.6%) | 19.0 |
| Graduate Degree | 30 (16.2%) | 48.0 |
| Total | 185 (100.0%) | 51.0 |
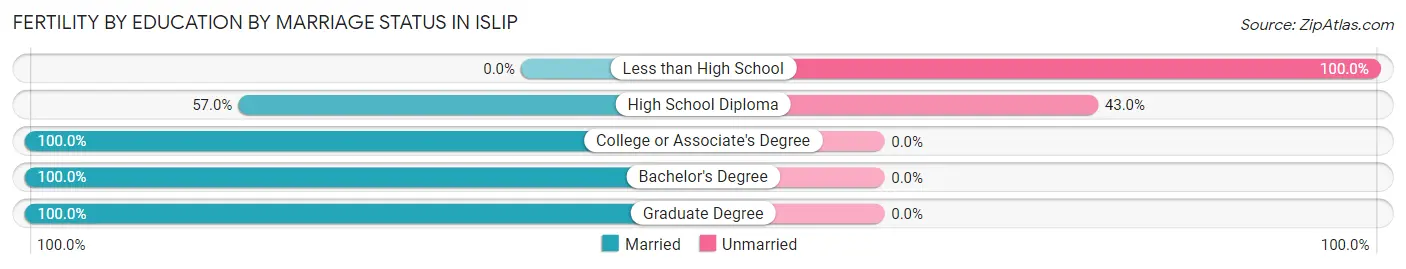
Fertility by Education by Marriage Status in Islip
28.6% of women with births in Islip are unmarried. Women with the educational attainment of college or associate's degree are most likely to be married with 100.0% of them married at childbirth, while women with the educational attainment of less than high school are least likely to be married with 100.0% of them unmarried at childbirth.
| Educational Attainment | Married | Unmarried |
| Less than High School | 0 (0.0%) | 19 (100.0%) |
| High School Diploma | 45 (57.0%) | 34 (43.0%) |
| College or Associate's Degree | 41 (100.0%) | 0 (0.0%) |
| Bachelor's Degree | 16 (100.0%) | 0 (0.0%) |
| Graduate Degree | 30 (100.0%) | 0 (0.0%) |
| Total | 132 (71.4%) | 53 (28.6%) |
Income in Islip
Income Overview in Islip
Per Capita Income in Islip is $49,570, while median incomes of families and households are $147,640 and $121,259 respectively.
| Characteristic | Number | Measure |
| Per Capita Income | 17,284 | $49,570 |
| Median Family Income | 4,300 | $147,640 |
| Mean Family Income | 4,300 | $158,122 |
| Median Household Income | 6,137 | $121,259 |
| Mean Household Income | 6,137 | $135,261 |
| Income Deficit | 4,300 | $0 |
| Wage / Income Gap (%) | 17,284 | 38.44% |
| Wage / Income Gap ($) | 17,284 | 61.56¢ per $1 |
| Gini / Inequality Index | 17,284 | 0.39 |
Earnings by Sex in Islip
Average Earnings in Islip are $58,825, $72,518 for men and $44,643 for women, a difference of 38.4%.
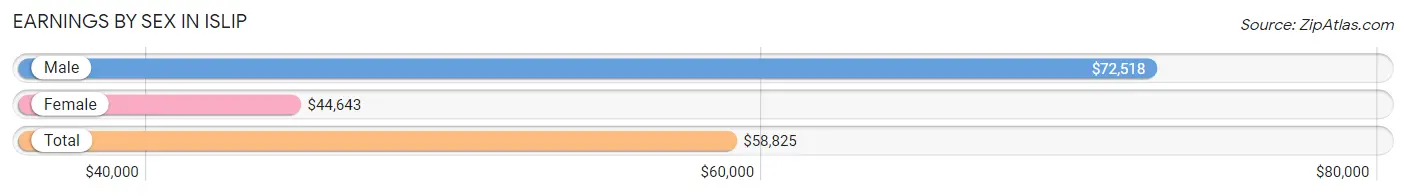
| Sex | Number | Average Earnings |
| Male | 5,193 (52.8%) | $72,518 |
| Female | 4,646 (47.2%) | $44,643 |
| Total | 9,839 (100.0%) | $58,825 |
Earnings by Sex by Income Bracket in Islip
The most common earnings brackets in Islip are $100,000+ for men (1,682 | 32.4%) and $75,000 to $99,999 for women (732 | 15.8%).
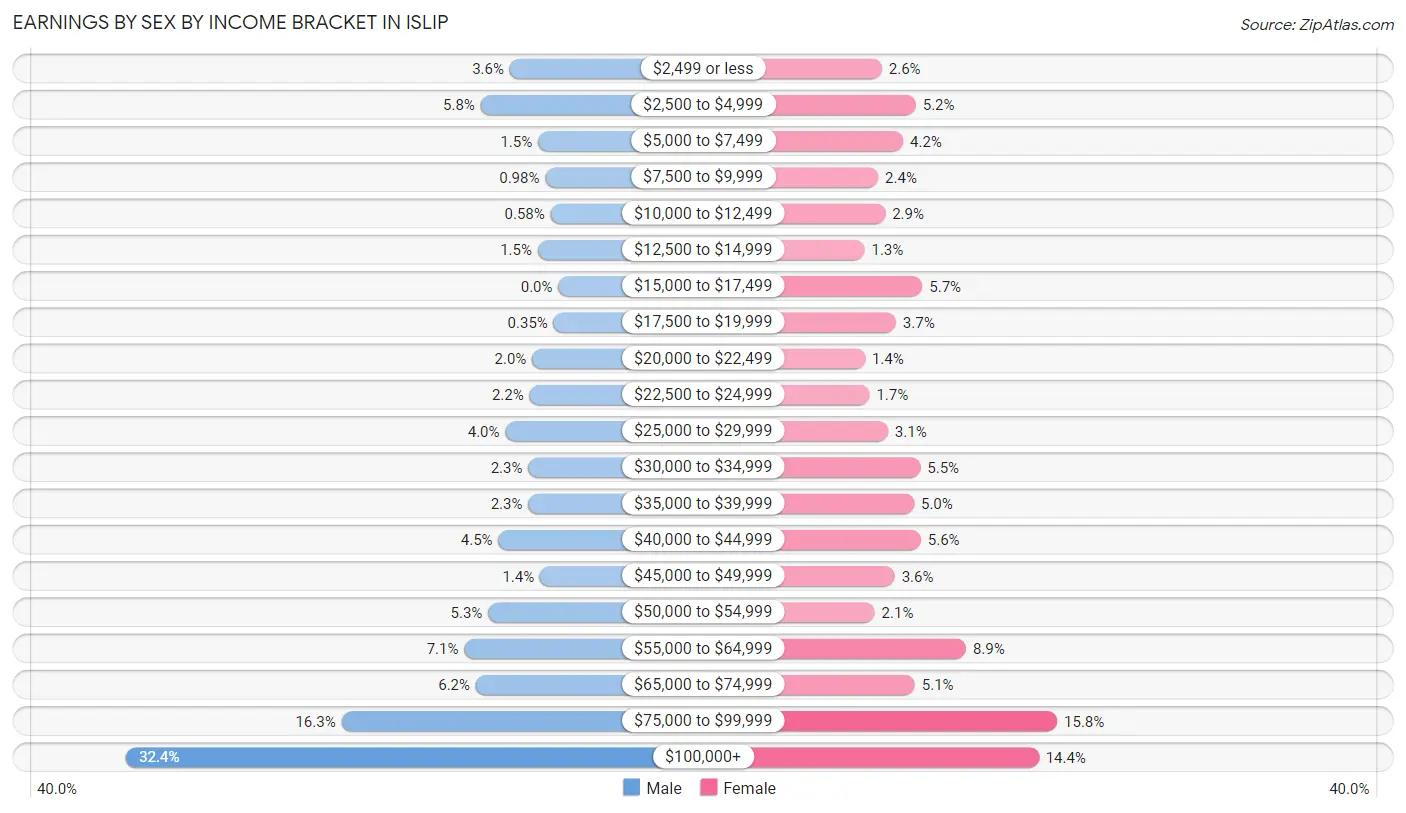
| Income | Male | Female |
| $2,499 or less | 189 (3.6%) | 122 (2.6%) |
| $2,500 to $4,999 | 302 (5.8%) | 240 (5.2%) |
| $5,000 to $7,499 | 79 (1.5%) | 196 (4.2%) |
| $7,500 to $9,999 | 51 (1.0%) | 109 (2.4%) |
| $10,000 to $12,499 | 30 (0.6%) | 134 (2.9%) |
| $12,500 to $14,999 | 80 (1.5%) | 62 (1.3%) |
| $15,000 to $17,499 | 0 (0.0%) | 263 (5.7%) |
| $17,500 to $19,999 | 18 (0.4%) | 171 (3.7%) |
| $20,000 to $22,499 | 102 (2.0%) | 63 (1.4%) |
| $22,500 to $24,999 | 112 (2.2%) | 79 (1.7%) |
| $25,000 to $29,999 | 206 (4.0%) | 143 (3.1%) |
| $30,000 to $34,999 | 117 (2.2%) | 256 (5.5%) |
| $35,000 to $39,999 | 117 (2.2%) | 234 (5.0%) |
| $40,000 to $44,999 | 233 (4.5%) | 258 (5.6%) |
| $45,000 to $49,999 | 71 (1.4%) | 167 (3.6%) |
| $50,000 to $54,999 | 273 (5.3%) | 97 (2.1%) |
| $55,000 to $64,999 | 366 (7.0%) | 415 (8.9%) |
| $65,000 to $74,999 | 321 (6.2%) | 237 (5.1%) |
| $75,000 to $99,999 | 844 (16.3%) | 732 (15.8%) |
| $100,000+ | 1,682 (32.4%) | 668 (14.4%) |
| Total | 5,193 (100.0%) | 4,646 (100.0%) |
Earnings by Sex by Educational Attainment in Islip
Average earnings in Islip are $79,619 for men and $55,304 for women, a difference of 30.5%. Men with an educational attainment of graduate degree enjoy the highest average annual earnings of $133,542, while those with high school diploma education earn the least with $54,529. Women with an educational attainment of graduate degree earn the most with the average annual earnings of $90,375, while those with high school diploma education have the smallest earnings of $38,659.
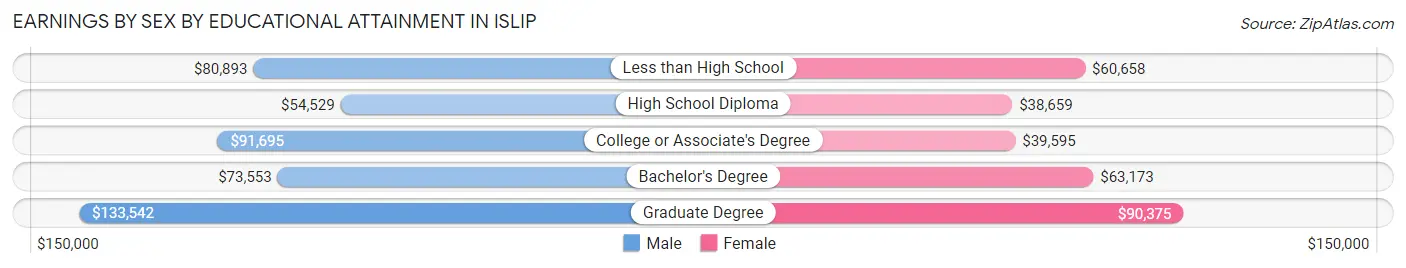
| Educational Attainment | Male Income | Female Income |
| Less than High School | $80,893 | $60,658 |
| High School Diploma | $54,529 | $38,659 |
| College or Associate's Degree | $91,695 | $39,595 |
| Bachelor's Degree | $73,553 | $63,173 |
| Graduate Degree | $133,542 | $90,375 |
| Total | $79,619 | $55,304 |
Family Income in Islip
Family Income Brackets in Islip
According to the Islip family income data, there are 1,200 families falling into the $100,000 to $149,999 income range, which is the most common income bracket and makes up 27.9% of all families. Conversely, the $10,000 to $14,999 income bracket is the least frequent group with only 17 families (0.4%) belonging to this category.
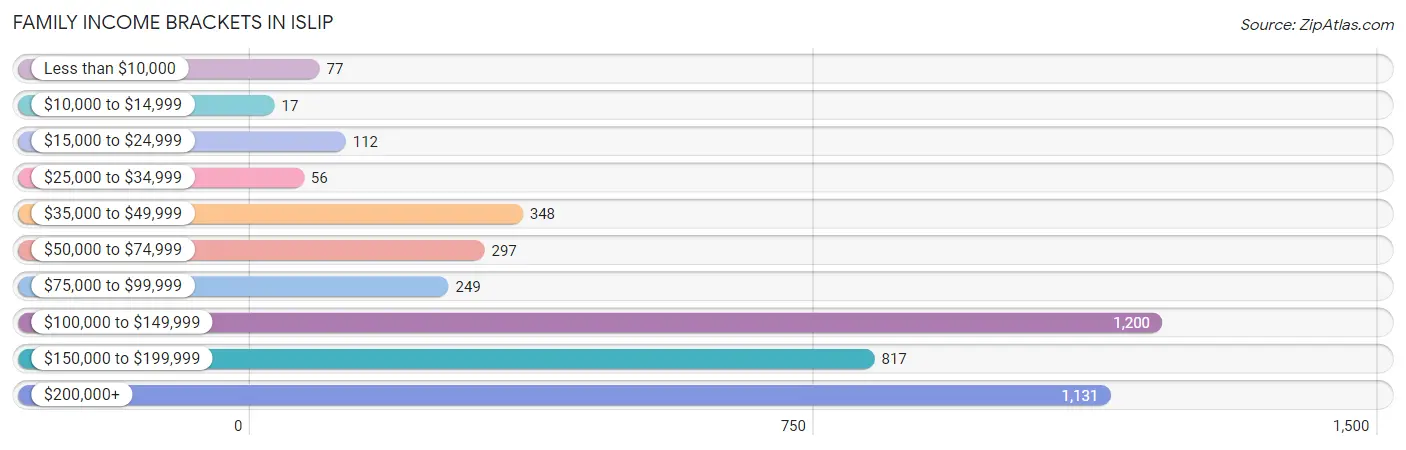
| Income Bracket | # Families | % Families |
| Less than $10,000 | 77 | 1.8% |
| $10,000 to $14,999 | 17 | 0.4% |
| $15,000 to $24,999 | 112 | 2.6% |
| $25,000 to $34,999 | 56 | 1.3% |
| $35,000 to $49,999 | 348 | 8.1% |
| $50,000 to $74,999 | 297 | 6.9% |
| $75,000 to $99,999 | 249 | 5.8% |
| $100,000 to $149,999 | 1,200 | 27.9% |
| $150,000 to $199,999 | 817 | 19.0% |
| $200,000+ | 1,131 | 26.3% |
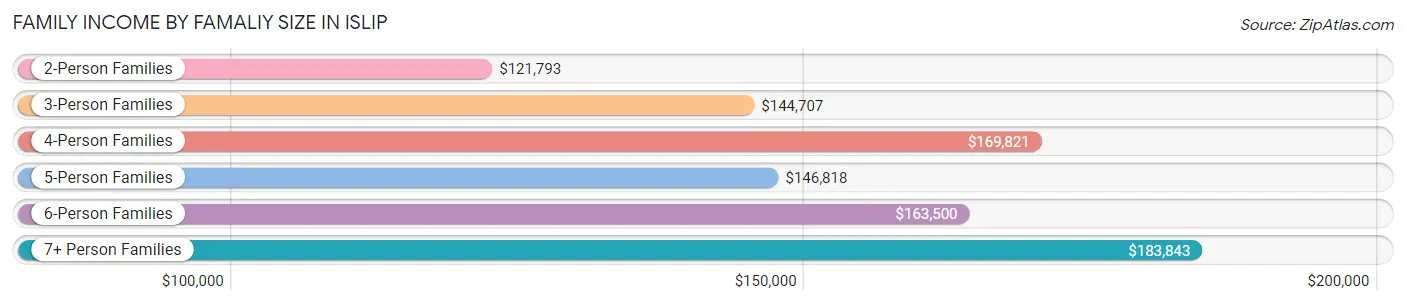
Family Income by Famaliy Size in Islip
7+ person families (67 | 1.6%) account for the highest median family income in Islip with $183,843 per family, while 2-person families (1,765 | 41.0%) have the highest median income of $60,896 per family member.
| Income Bracket | # Families | Median Income |
| 2-Person Families | 1,765 (41.0%) | $121,793 |
| 3-Person Families | 971 (22.6%) | $144,707 |
| 4-Person Families | 835 (19.4%) | $169,821 |
| 5-Person Families | 422 (9.8%) | $146,818 |
| 6-Person Families | 240 (5.6%) | $163,500 |
| 7+ Person Families | 67 (1.6%) | $183,843 |
| Total | 4,300 (100.0%) | $147,640 |
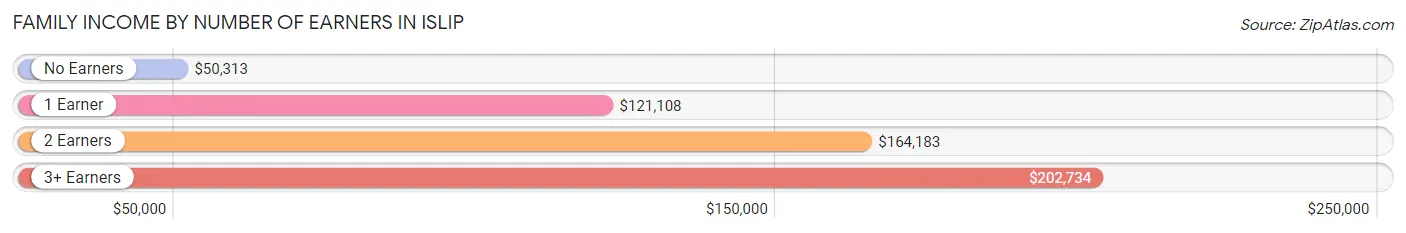
Family Income by Number of Earners in Islip
The median family income in Islip is $147,640, with families comprising 3+ earners (959) having the highest median family income of $202,734, while families with no earners (412) have the lowest median family income of $50,313, accounting for 22.3% and 9.6% of families, respectively.
| Number of Earners | # Families | Median Income |
| No Earners | 412 (9.6%) | $50,313 |
| 1 Earner | 1,235 (28.7%) | $121,108 |
| 2 Earners | 1,694 (39.4%) | $164,183 |
| 3+ Earners | 959 (22.3%) | $202,734 |
| Total | 4,300 (100.0%) | $147,640 |
Household Income in Islip
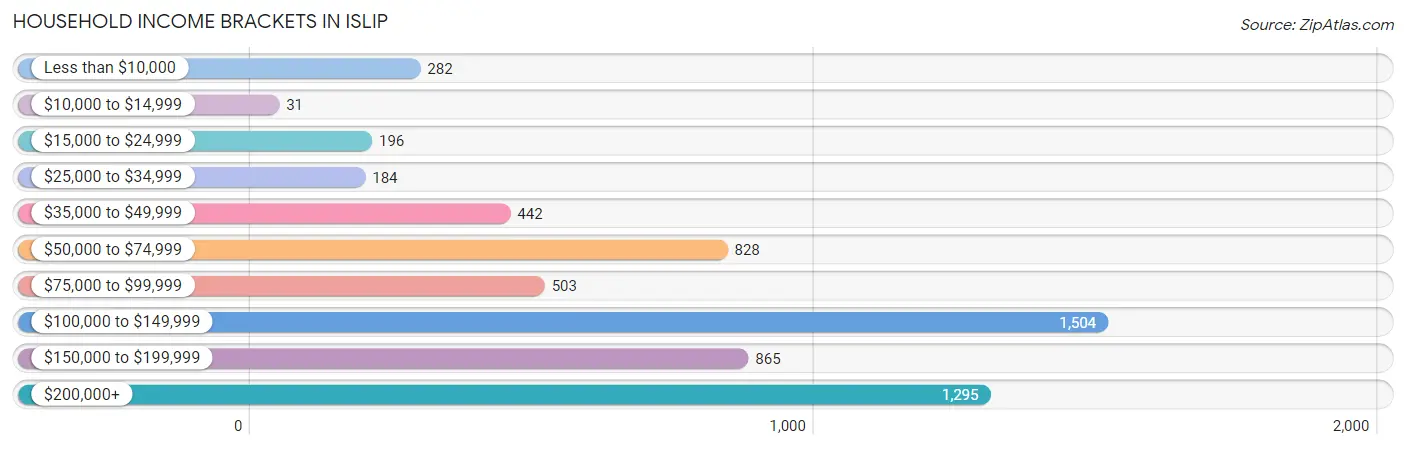
Household Income Brackets in Islip
With 1,504 households falling in the category, the $100,000 to $149,999 income range is the most frequent in Islip, accounting for 24.5% of all households. In contrast, only 31 households (0.5%) fall into the $10,000 to $14,999 income bracket, making it the least populous group.
| Income Bracket | # Households | % Households |
| Less than $10,000 | 282 | 4.6% |
| $10,000 to $14,999 | 31 | 0.5% |
| $15,000 to $24,999 | 196 | 3.2% |
| $25,000 to $34,999 | 184 | 3.0% |
| $35,000 to $49,999 | 442 | 7.2% |
| $50,000 to $74,999 | 828 | 13.5% |
| $75,000 to $99,999 | 503 | 8.2% |
| $100,000 to $149,999 | 1,504 | 24.5% |
| $150,000 to $199,999 | 865 | 14.1% |
| $200,000+ | 1,295 | 21.1% |
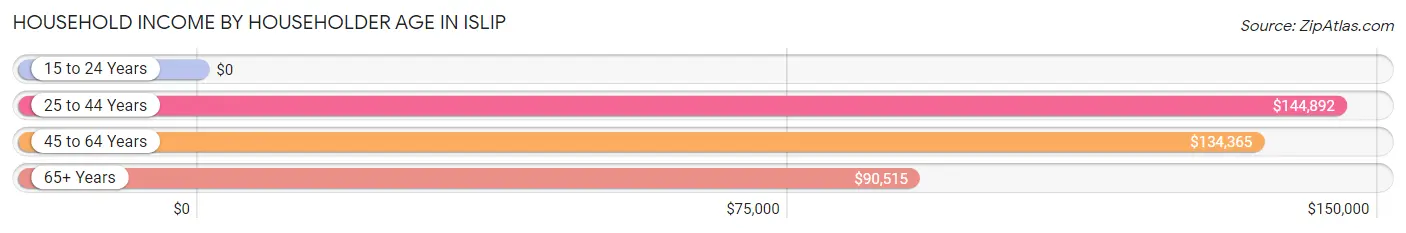
Household Income by Householder Age in Islip
The median household income in Islip is $121,259, with the highest median household income of $144,892 found in the 25 to 44 years age bracket for the primary householder. A total of 1,383 households (22.5%) fall into this category. Meanwhile, the 15 to 24 years age bracket for the primary householder has the lowest median household income of $0, with 58 households (0.9%) in this group.
| Income Bracket | # Households | Median Income |
| 15 to 24 Years | 58 (0.9%) | $0 |
| 25 to 44 Years | 1,383 (22.5%) | $144,892 |
| 45 to 64 Years | 2,795 (45.5%) | $134,365 |
| 65+ Years | 1,901 (31.0%) | $90,515 |
| Total | 6,137 (100.0%) | $121,259 |
Poverty in Islip
Income Below Poverty by Sex and Age in Islip
With 4.8% poverty level for males and 5.2% for females among the residents of Islip, 15 year old males and under 5 year old females are the most vulnerable to poverty, with 20 males (16.4%) and 68 females (14.6%) in their respective age groups living below the poverty level.
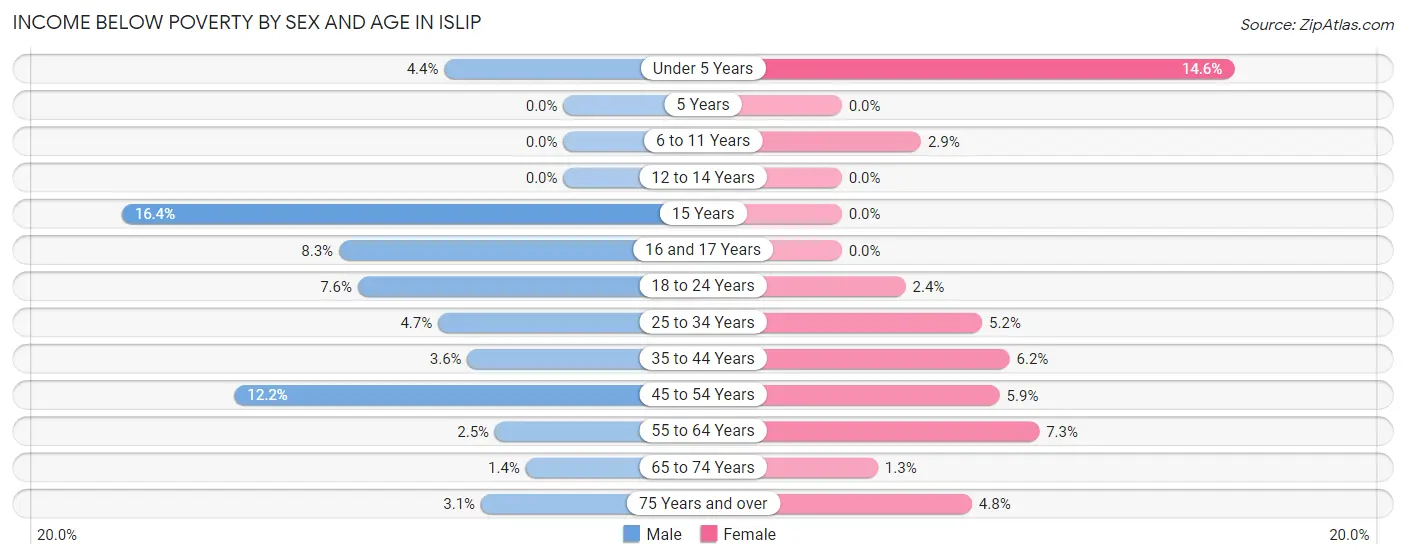
| Age Bracket | Male | Female |
| Under 5 Years | 20 (4.4%) | 68 (14.6%) |
| 5 Years | 0 (0.0%) | 0 (0.0%) |
| 6 to 11 Years | 0 (0.0%) | 16 (2.9%) |
| 12 to 14 Years | 0 (0.0%) | 0 (0.0%) |
| 15 Years | 20 (16.4%) | 0 (0.0%) |
| 16 and 17 Years | 16 (8.3%) | 0 (0.0%) |
| 18 to 24 Years | 50 (7.6%) | 16 (2.4%) |
| 25 to 34 Years | 50 (4.6%) | 62 (5.2%) |
| 35 to 44 Years | 40 (3.6%) | 67 (6.2%) |
| 45 to 54 Years | 152 (12.2%) | 54 (5.9%) |
| 55 to 64 Years | 34 (2.5%) | 118 (7.3%) |
| 65 to 74 Years | 13 (1.4%) | 12 (1.3%) |
| 75 Years and over | 14 (3.1%) | 44 (4.8%) |
| Total | 409 (4.8%) | 457 (5.2%) |
Income Above Poverty by Sex and Age in Islip
According to the poverty statistics in Islip, males aged 5 years and females aged 5 years are the age groups that are most secure financially, with 100.0% of males and 100.0% of females in these age groups living above the poverty line.
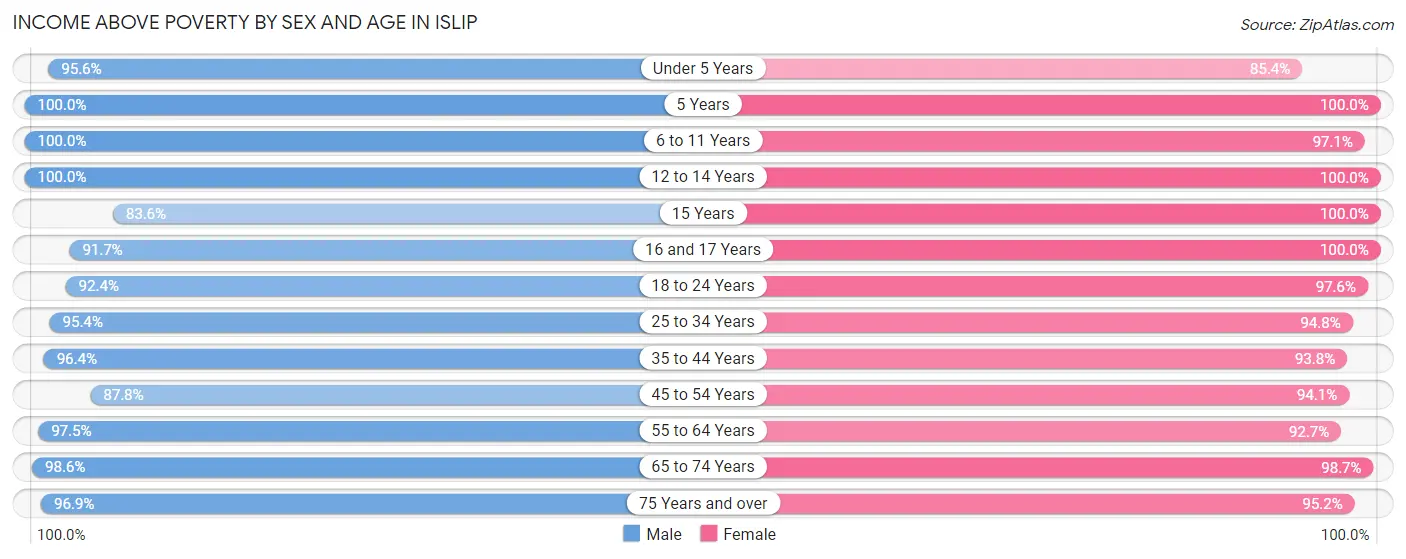
| Age Bracket | Male | Female |
| Under 5 Years | 433 (95.6%) | 399 (85.4%) |
| 5 Years | 29 (100.0%) | 78 (100.0%) |
| 6 to 11 Years | 635 (100.0%) | 529 (97.1%) |
| 12 to 14 Years | 204 (100.0%) | 224 (100.0%) |
| 15 Years | 102 (83.6%) | 64 (100.0%) |
| 16 and 17 Years | 176 (91.7%) | 141 (100.0%) |
| 18 to 24 Years | 605 (92.4%) | 659 (97.6%) |
| 25 to 34 Years | 1,025 (95.4%) | 1,127 (94.8%) |
| 35 to 44 Years | 1,083 (96.4%) | 1,008 (93.8%) |
| 45 to 54 Years | 1,093 (87.8%) | 867 (94.1%) |
| 55 to 64 Years | 1,307 (97.5%) | 1,491 (92.7%) |
| 65 to 74 Years | 914 (98.6%) | 886 (98.7%) |
| 75 Years and over | 443 (96.9%) | 867 (95.2%) |
| Total | 8,049 (95.2%) | 8,340 (94.8%) |
Income Below Poverty Among Married-Couple Families in Islip
The poverty statistics for married-couple families in Islip show that 1.0% or 35 of the total 3,415 families live below the poverty line. Families with 3 or 4 children have the highest poverty rate of 5.7%, comprising of 14 families. On the other hand, families with 5 or more children have the lowest poverty rate of 0.0%, which includes 0 families.
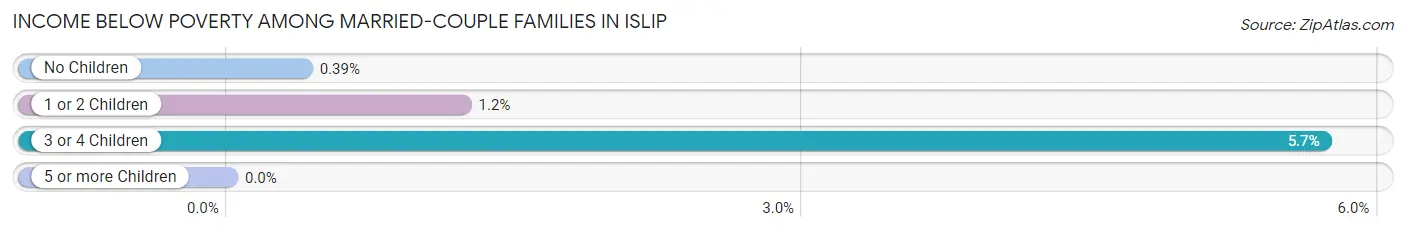
| Children | Above Poverty | Below Poverty |
| No Children | 2,063 (99.6%) | 8 (0.4%) |
| 1 or 2 Children | 1,051 (98.8%) | 13 (1.2%) |
| 3 or 4 Children | 231 (94.3%) | 14 (5.7%) |
| 5 or more Children | 35 (100.0%) | 0 (0.0%) |
| Total | 3,380 (99.0%) | 35 (1.0%) |
Income Below Poverty Among Single-Parent Households in Islip
According to the poverty data in Islip, 8.2% or 26 single-father households and 15.0% or 85 single-mother households are living below the poverty line. Among single-father households, those with 1 or 2 children have the highest poverty rate, with 16 households (18.2%) experiencing poverty. Likewise, among single-mother households, those with 1 or 2 children have the highest poverty rate, with 47 households (20.1%) falling below the poverty line.
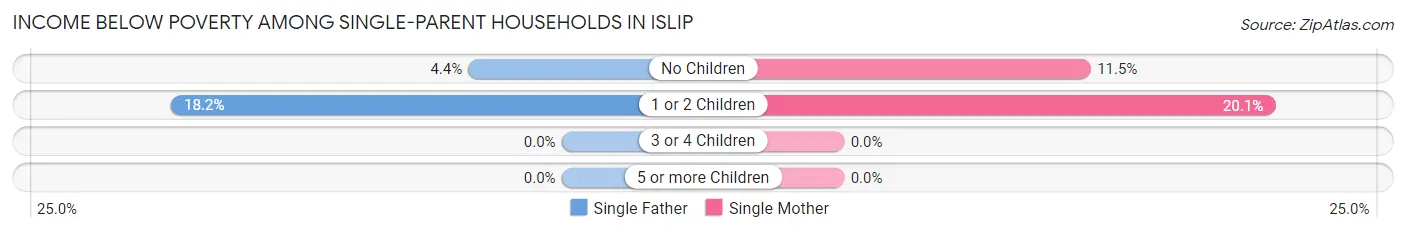
| Children | Single Father | Single Mother |
| No Children | 10 (4.3%) | 38 (11.5%) |
| 1 or 2 Children | 16 (18.2%) | 47 (20.1%) |
| 3 or 4 Children | 0 (0.0%) | 0 (0.0%) |
| 5 or more Children | 0 (0.0%) | 0 (0.0%) |
| Total | 26 (8.2%) | 85 (15.0%) |
Income Below Poverty Among Married-Couple vs Single-Parent Households in Islip
The poverty data for Islip shows that 35 of the married-couple family households (1.0%) and 111 of the single-parent households (12.5%) are living below the poverty level. Within the married-couple family households, those with 3 or 4 children have the highest poverty rate, with 14 households (5.7%) falling below the poverty line. Among the single-parent households, those with 1 or 2 children have the highest poverty rate, with 63 household (19.6%) living below poverty.
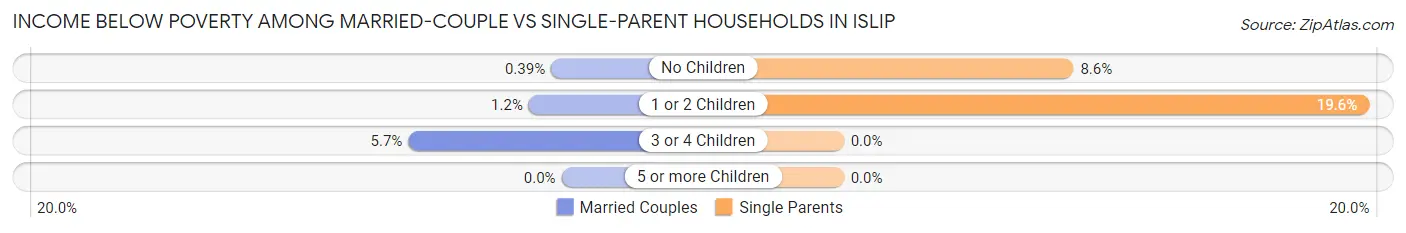
| Children | Married-Couple Families | Single-Parent Households |
| No Children | 8 (0.4%) | 48 (8.6%) |
| 1 or 2 Children | 13 (1.2%) | 63 (19.6%) |
| 3 or 4 Children | 14 (5.7%) | 0 (0.0%) |
| 5 or more Children | 0 (0.0%) | 0 (0.0%) |
| Total | 35 (1.0%) | 111 (12.5%) |
Employment Characteristics in Islip
Employment by Class of Employer in Islip
Among the 9,092 employed individuals in Islip, private company employees (5,879 | 64.7%), not-for-profit organizations (1,002 | 11.0%), and local government employees (923 | 10.2%) make up the most common classes of employment.
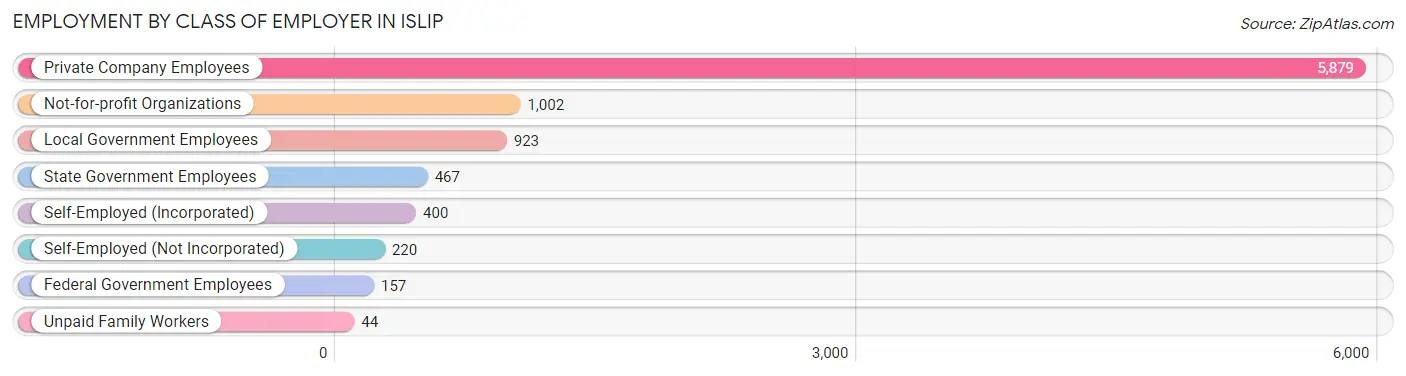
| Employer Class | # Employees | % Employees |
| Private Company Employees | 5,879 | 64.7% |
| Self-Employed (Incorporated) | 400 | 4.4% |
| Self-Employed (Not Incorporated) | 220 | 2.4% |
| Not-for-profit Organizations | 1,002 | 11.0% |
| Local Government Employees | 923 | 10.2% |
| State Government Employees | 467 | 5.1% |
| Federal Government Employees | 157 | 1.7% |
| Unpaid Family Workers | 44 | 0.5% |
| Total | 9,092 | 100.0% |
Employment Status by Age in Islip
According to the labor force statistics for Islip, out of the total population over 16 years of age (14,438), 67.5% or 9,746 individuals are in the labor force, with 5.4% or 526 of them unemployed. The age group with the highest labor force participation rate is 30 to 34 years, with 91.9% or 1,122 individuals in the labor force. Within the labor force, the 16 to 19 years age range has the highest percentage of unemployed individuals, with 25.1% or 54 of them being unemployed.
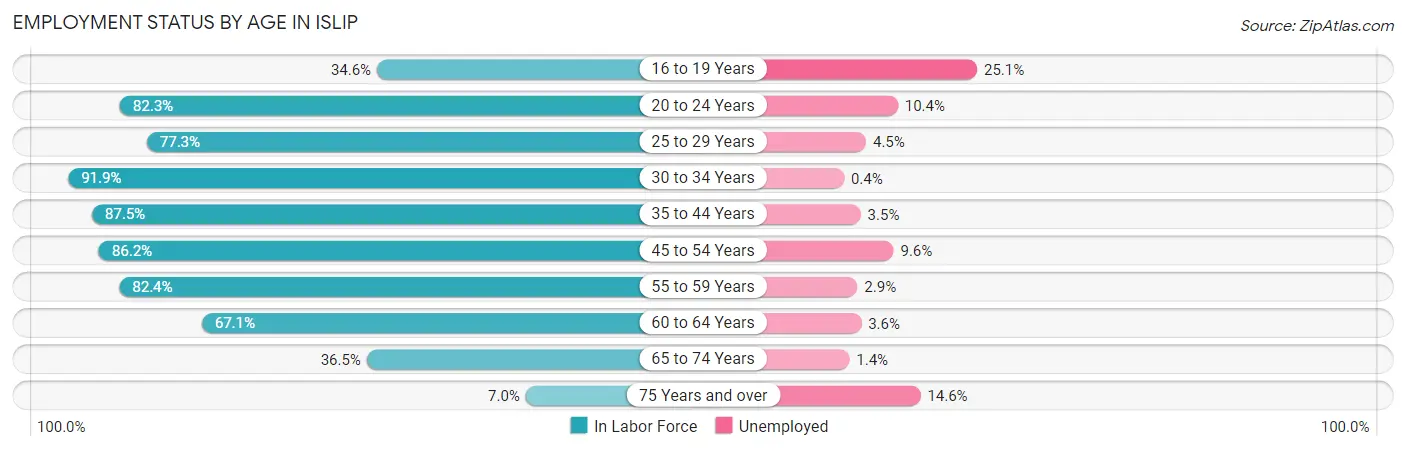
| Age Bracket | In Labor Force | Unemployed |
| 16 to 19 Years | 215 (34.6%) | 54 (25.1%) |
| 20 to 24 Years | 858 (82.3%) | 89 (10.4%) |
| 25 to 29 Years | 806 (77.3%) | 36 (4.5%) |
| 30 to 34 Years | 1,122 (91.9%) | 4 (0.4%) |
| 35 to 44 Years | 1,923 (87.5%) | 67 (3.5%) |
| 45 to 54 Years | 1,867 (86.2%) | 179 (9.6%) |
| 55 to 59 Years | 1,117 (82.4%) | 32 (2.9%) |
| 60 to 64 Years | 1,070 (67.1%) | 39 (3.6%) |
| 65 to 74 Years | 666 (36.5%) | 9 (1.4%) |
| 75 Years and over | 96 (7.0%) | 14 (14.6%) |
| Total | 9,746 (67.5%) | 526 (5.4%) |
Employment Status by Educational Attainment in Islip
According to labor force statistics for Islip, 82.5% of individuals (7,902) out of the total population between 25 and 64 years of age (9,578) are in the labor force, with 4.5% or 356 of them being unemployed. The group with the highest labor force participation rate are those with the educational attainment of bachelor's degree or higher, with 87.7% or 3,206 individuals in the labor force. Within the labor force, individuals with high school diploma education have the highest percentage of unemployment, with 9.8% or 194 of them being unemployed.
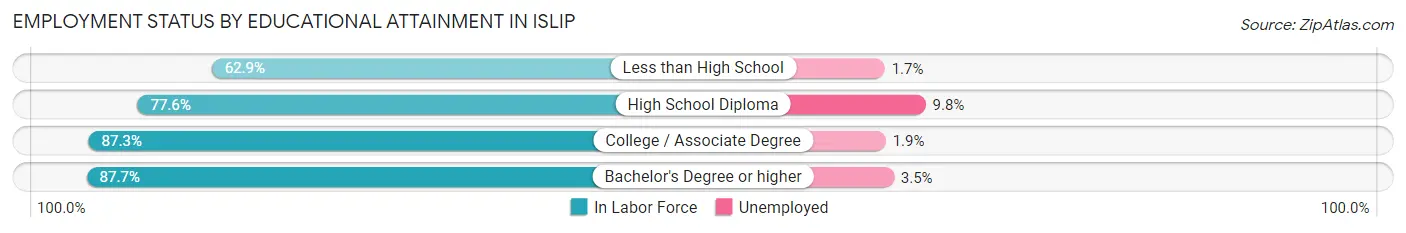
| Educational Attainment | In Labor Force | Unemployed |
| Less than High School | 577 (62.9%) | 16 (1.7%) |
| High School Diploma | 1,981 (77.6%) | 250 (9.8%) |
| College / Associate Degree | 2,141 (87.3%) | 47 (1.9%) |
| Bachelor's Degree or higher | 3,206 (87.7%) | 128 (3.5%) |
| Total | 7,902 (82.5%) | 431 (4.5%) |
Employment Occupations by Sex in Islip
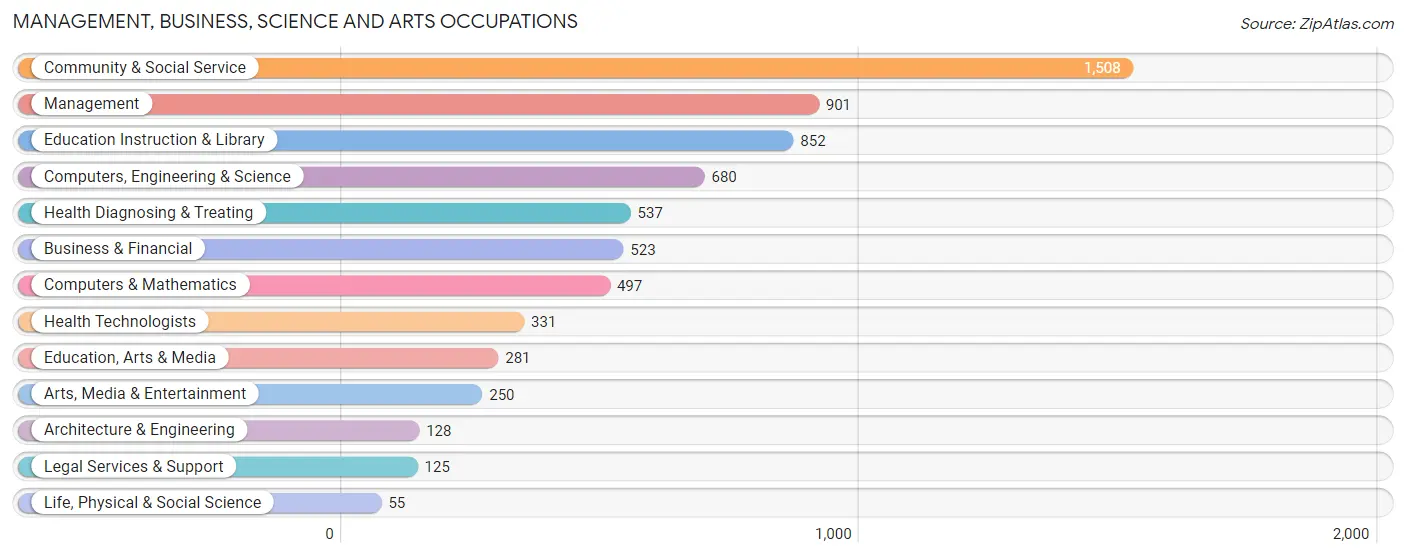
Management, Business, Science and Arts Occupations
The most common Management, Business, Science and Arts occupations in Islip are Community & Social Service (1,508 | 16.4%), Management (901 | 9.8%), Education Instruction & Library (852 | 9.2%), Computers, Engineering & Science (680 | 7.4%), and Health Diagnosing & Treating (537 | 5.8%).
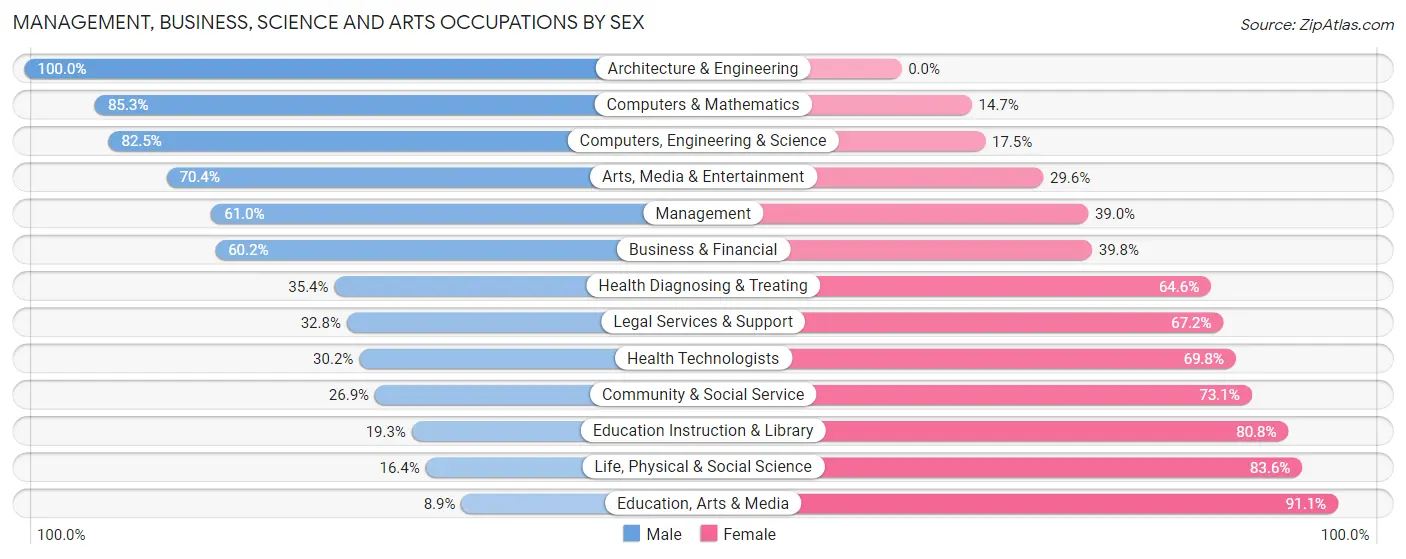
Management, Business, Science and Arts Occupations by Sex
Within the Management, Business, Science and Arts occupations in Islip, the most male-oriented occupations are Architecture & Engineering (100.0%), Computers & Mathematics (85.3%), and Computers, Engineering & Science (82.5%), while the most female-oriented occupations are Education, Arts & Media (91.1%), Life, Physical & Social Science (83.6%), and Education Instruction & Library (80.7%).
| Occupation | Male | Female |
| Management | 550 (61.0%) | 351 (39.0%) |
| Business & Financial | 315 (60.2%) | 208 (39.8%) |
| Computers, Engineering & Science | 561 (82.5%) | 119 (17.5%) |
| Computers & Mathematics | 424 (85.3%) | 73 (14.7%) |
| Architecture & Engineering | 128 (100.0%) | 0 (0.0%) |
| Life, Physical & Social Science | 9 (16.4%) | 46 (83.6%) |
| Community & Social Service | 406 (26.9%) | 1,102 (73.1%) |
| Education, Arts & Media | 25 (8.9%) | 256 (91.1%) |
| Legal Services & Support | 41 (32.8%) | 84 (67.2%) |
| Education Instruction & Library | 164 (19.3%) | 688 (80.7%) |
| Arts, Media & Entertainment | 176 (70.4%) | 74 (29.6%) |
| Health Diagnosing & Treating | 190 (35.4%) | 347 (64.6%) |
| Health Technologists | 100 (30.2%) | 231 (69.8%) |
| Total (Category) | 2,022 (48.7%) | 2,127 (51.3%) |
| Total (Overall) | 4,802 (52.1%) | 4,414 (47.9%) |
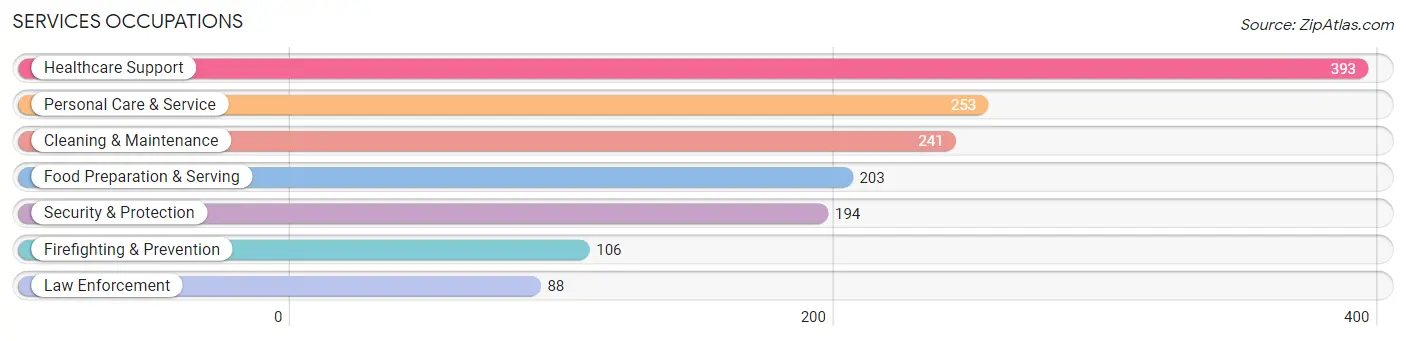
Services Occupations
The most common Services occupations in Islip are Healthcare Support (393 | 4.3%), Personal Care & Service (253 | 2.8%), Cleaning & Maintenance (241 | 2.6%), Food Preparation & Serving (203 | 2.2%), and Security & Protection (194 | 2.1%).
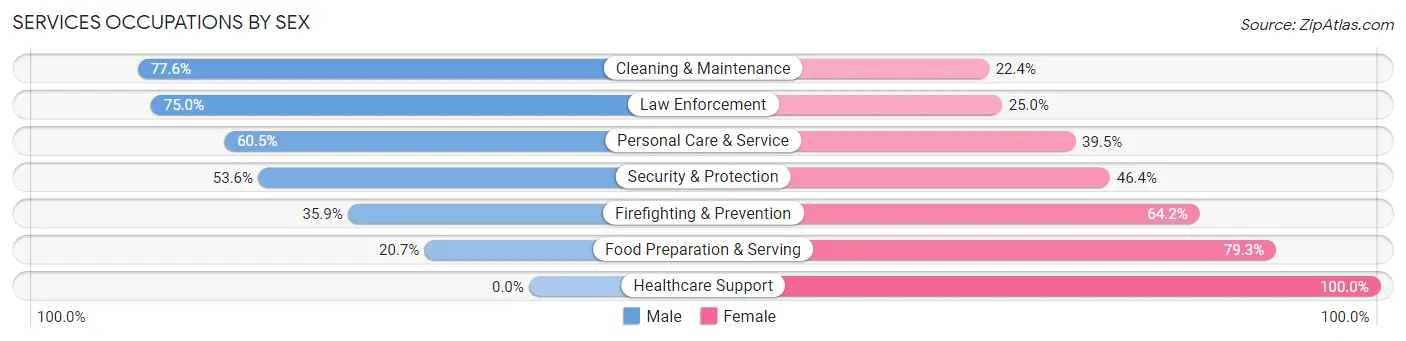
Services Occupations by Sex
Within the Services occupations in Islip, the most male-oriented occupations are Cleaning & Maintenance (77.6%), Law Enforcement (75.0%), and Personal Care & Service (60.5%), while the most female-oriented occupations are Healthcare Support (100.0%), Food Preparation & Serving (79.3%), and Firefighting & Prevention (64.1%).
| Occupation | Male | Female |
| Healthcare Support | 0 (0.0%) | 393 (100.0%) |
| Security & Protection | 104 (53.6%) | 90 (46.4%) |
| Firefighting & Prevention | 38 (35.8%) | 68 (64.1%) |
| Law Enforcement | 66 (75.0%) | 22 (25.0%) |
| Food Preparation & Serving | 42 (20.7%) | 161 (79.3%) |
| Cleaning & Maintenance | 187 (77.6%) | 54 (22.4%) |
| Personal Care & Service | 153 (60.5%) | 100 (39.5%) |
| Total (Category) | 486 (37.9%) | 798 (62.2%) |
| Total (Overall) | 4,802 (52.1%) | 4,414 (47.9%) |
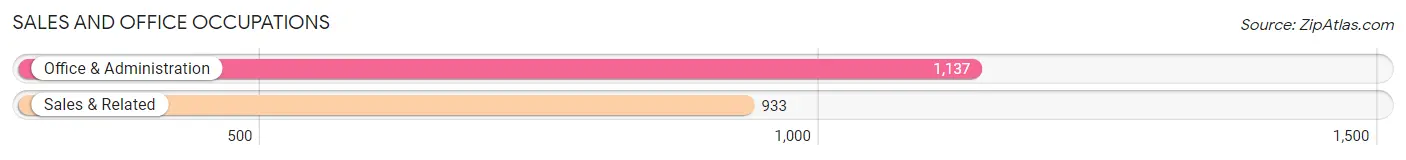
Sales and Office Occupations
The most common Sales and Office occupations in Islip are Office & Administration (1,137 | 12.3%), and Sales & Related (933 | 10.1%).
Sales and Office Occupations by Sex
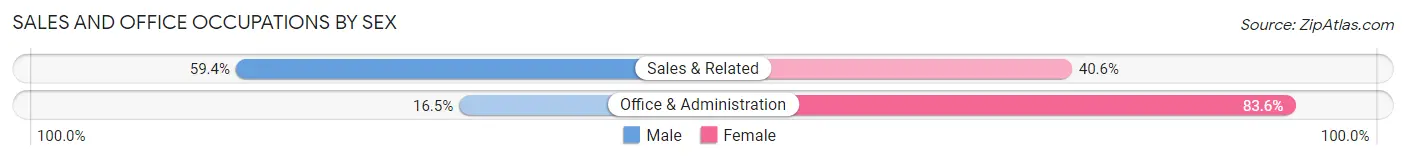
| Occupation | Male | Female |
| Sales & Related | 554 (59.4%) | 379 (40.6%) |
| Office & Administration | 187 (16.5%) | 950 (83.6%) |
| Total (Category) | 741 (35.8%) | 1,329 (64.2%) |
| Total (Overall) | 4,802 (52.1%) | 4,414 (47.9%) |
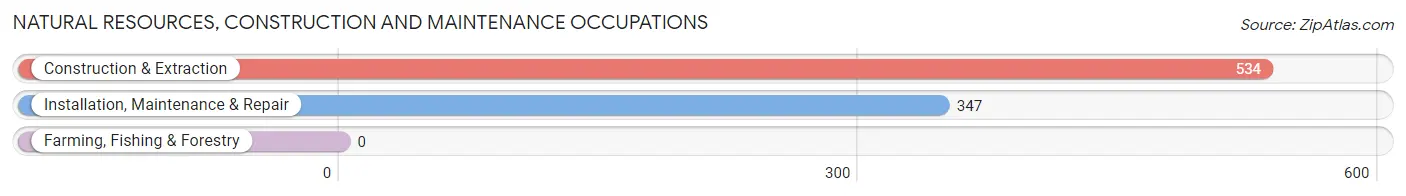
Natural Resources, Construction and Maintenance Occupations
The most common Natural Resources, Construction and Maintenance occupations in Islip are Construction & Extraction (534 | 5.8%), and Installation, Maintenance & Repair (347 | 3.8%).
Natural Resources, Construction and Maintenance Occupations by Sex
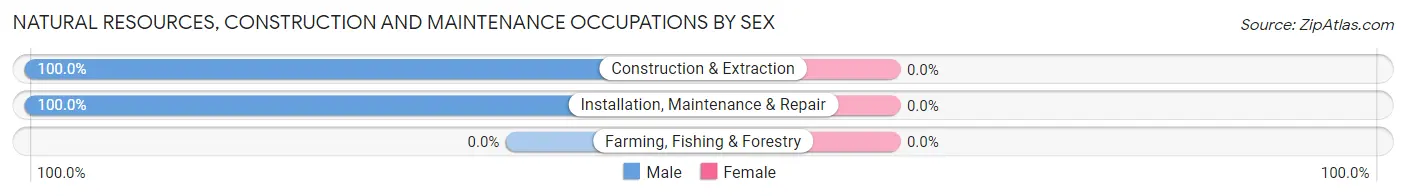
| Occupation | Male | Female |
| Farming, Fishing & Forestry | 0 (0.0%) | 0 (0.0%) |
| Construction & Extraction | 534 (100.0%) | 0 (0.0%) |
| Installation, Maintenance & Repair | 347 (100.0%) | 0 (0.0%) |
| Total (Category) | 881 (100.0%) | 0 (0.0%) |
| Total (Overall) | 4,802 (52.1%) | 4,414 (47.9%) |
Production, Transportation and Moving Occupations
The most common Production, Transportation and Moving occupations in Islip are Transportation (326 | 3.5%), Production (300 | 3.3%), and Material Moving (206 | 2.2%).
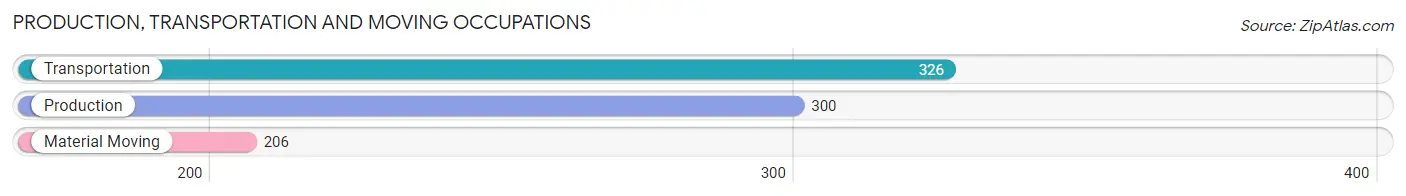
Production, Transportation and Moving Occupations by Sex
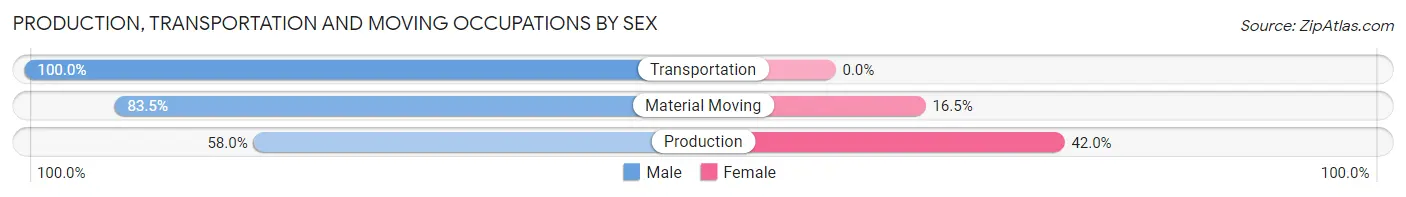
| Occupation | Male | Female |
| Production | 174 (58.0%) | 126 (42.0%) |
| Transportation | 326 (100.0%) | 0 (0.0%) |
| Material Moving | 172 (83.5%) | 34 (16.5%) |
| Total (Category) | 672 (80.8%) | 160 (19.2%) |
| Total (Overall) | 4,802 (52.1%) | 4,414 (47.9%) |
Employment Industries by Sex in Islip
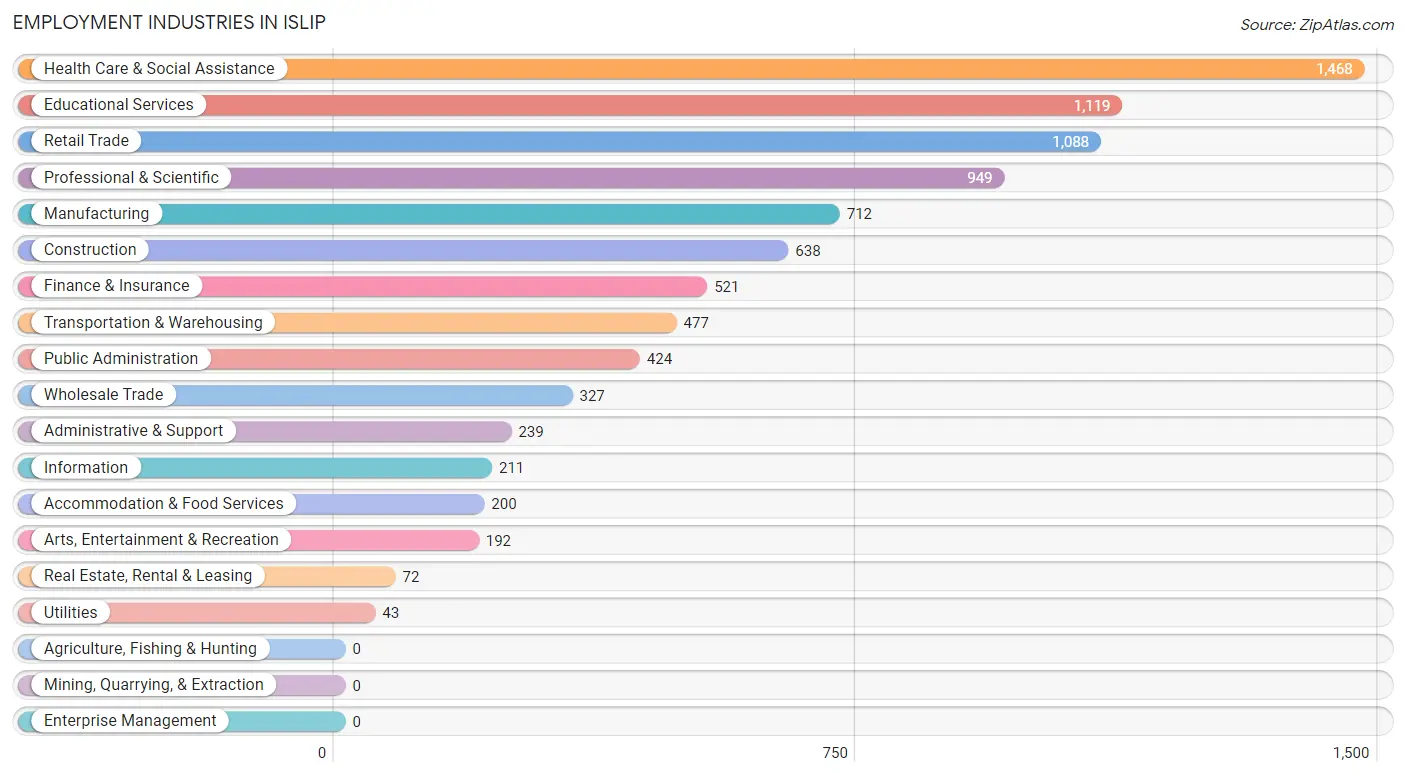
Employment Industries in Islip
The major employment industries in Islip include Health Care & Social Assistance (1,468 | 15.9%), Educational Services (1,119 | 12.1%), Retail Trade (1,088 | 11.8%), Professional & Scientific (949 | 10.3%), and Manufacturing (712 | 7.7%).
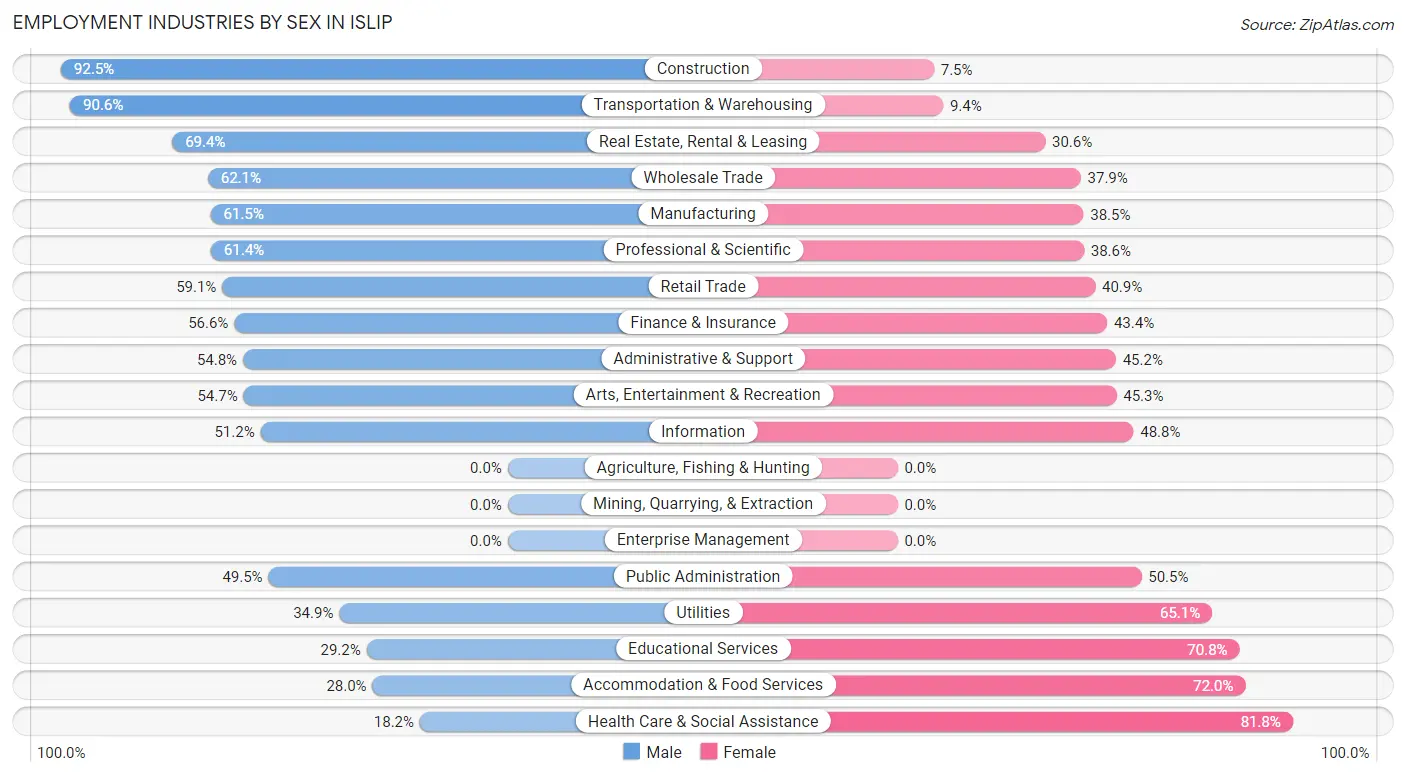
Employment Industries by Sex in Islip
The Islip industries that see more men than women are Construction (92.5%), Transportation & Warehousing (90.6%), and Real Estate, Rental & Leasing (69.4%), whereas the industries that tend to have a higher number of women are Health Care & Social Assistance (81.8%), Accommodation & Food Services (72.0%), and Educational Services (70.8%).
| Industry | Male | Female |
| Agriculture, Fishing & Hunting | 0 (0.0%) | 0 (0.0%) |
| Mining, Quarrying, & Extraction | 0 (0.0%) | 0 (0.0%) |
| Construction | 590 (92.5%) | 48 (7.5%) |
| Manufacturing | 438 (61.5%) | 274 (38.5%) |
| Wholesale Trade | 203 (62.1%) | 124 (37.9%) |
| Retail Trade | 643 (59.1%) | 445 (40.9%) |
| Transportation & Warehousing | 432 (90.6%) | 45 (9.4%) |
| Utilities | 15 (34.9%) | 28 (65.1%) |
| Information | 108 (51.2%) | 103 (48.8%) |
| Finance & Insurance | 295 (56.6%) | 226 (43.4%) |
| Real Estate, Rental & Leasing | 50 (69.4%) | 22 (30.6%) |
| Professional & Scientific | 583 (61.4%) | 366 (38.6%) |
| Enterprise Management | 0 (0.0%) | 0 (0.0%) |
| Administrative & Support | 131 (54.8%) | 108 (45.2%) |
| Educational Services | 327 (29.2%) | 792 (70.8%) |
| Health Care & Social Assistance | 267 (18.2%) | 1,201 (81.8%) |
| Arts, Entertainment & Recreation | 105 (54.7%) | 87 (45.3%) |
| Accommodation & Food Services | 56 (28.0%) | 144 (72.0%) |
| Public Administration | 210 (49.5%) | 214 (50.5%) |
| Total | 4,802 (52.1%) | 4,414 (47.9%) |
Education in Islip
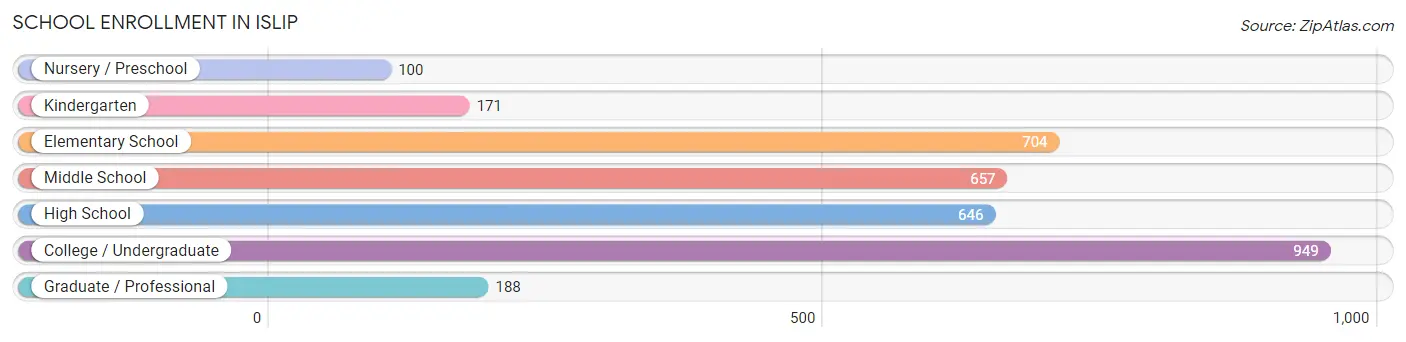
School Enrollment in Islip
The most common levels of schooling among the 3,415 students in Islip are college / undergraduate (949 | 27.8%), elementary school (704 | 20.6%), and middle school (657 | 19.2%).
| School Level | # Students | % Students |
| Nursery / Preschool | 100 | 2.9% |
| Kindergarten | 171 | 5.0% |
| Elementary School | 704 | 20.6% |
| Middle School | 657 | 19.2% |
| High School | 646 | 18.9% |
| College / Undergraduate | 949 | 27.8% |
| Graduate / Professional | 188 | 5.5% |
| Total | 3,415 | 100.0% |
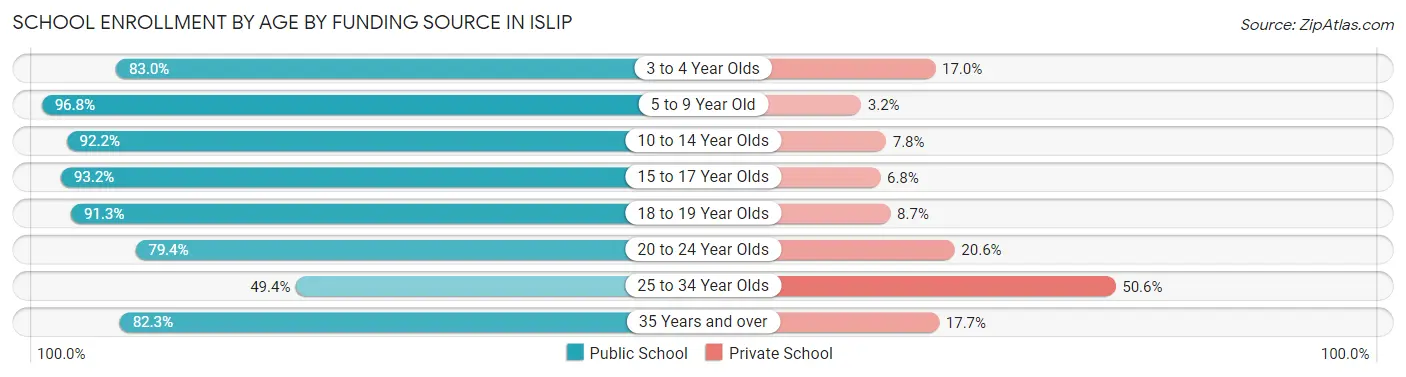
School Enrollment by Age by Funding Source in Islip
Out of a total of 3,415 students who are enrolled in schools in Islip, 393 (11.5%) attend a private institution, while the remaining 3,022 (88.5%) are enrolled in public schools. The age group of 25 to 34 year olds has the highest likelihood of being enrolled in private schools, with 84 (50.6% in the age bracket) enrolled. Conversely, the age group of 5 to 9 year old has the lowest likelihood of being enrolled in a private school, with 786 (96.8% in the age bracket) attending a public institution.
| Age Bracket | Public School | Private School |
| 3 to 4 Year Olds | 78 (83.0%) | 16 (17.0%) |
| 5 to 9 Year Old | 786 (96.8%) | 26 (3.2%) |
| 10 to 14 Year Olds | 776 (92.2%) | 66 (7.8%) |
| 15 to 17 Year Olds | 468 (93.2%) | 34 (6.8%) |
| 18 to 19 Year Olds | 232 (91.3%) | 22 (8.7%) |
| 20 to 24 Year Olds | 354 (79.4%) | 92 (20.6%) |
| 25 to 34 Year Olds | 82 (49.4%) | 84 (50.6%) |
| 35 Years and over | 246 (82.3%) | 53 (17.7%) |
| Total | 3,022 (88.5%) | 393 (11.5%) |
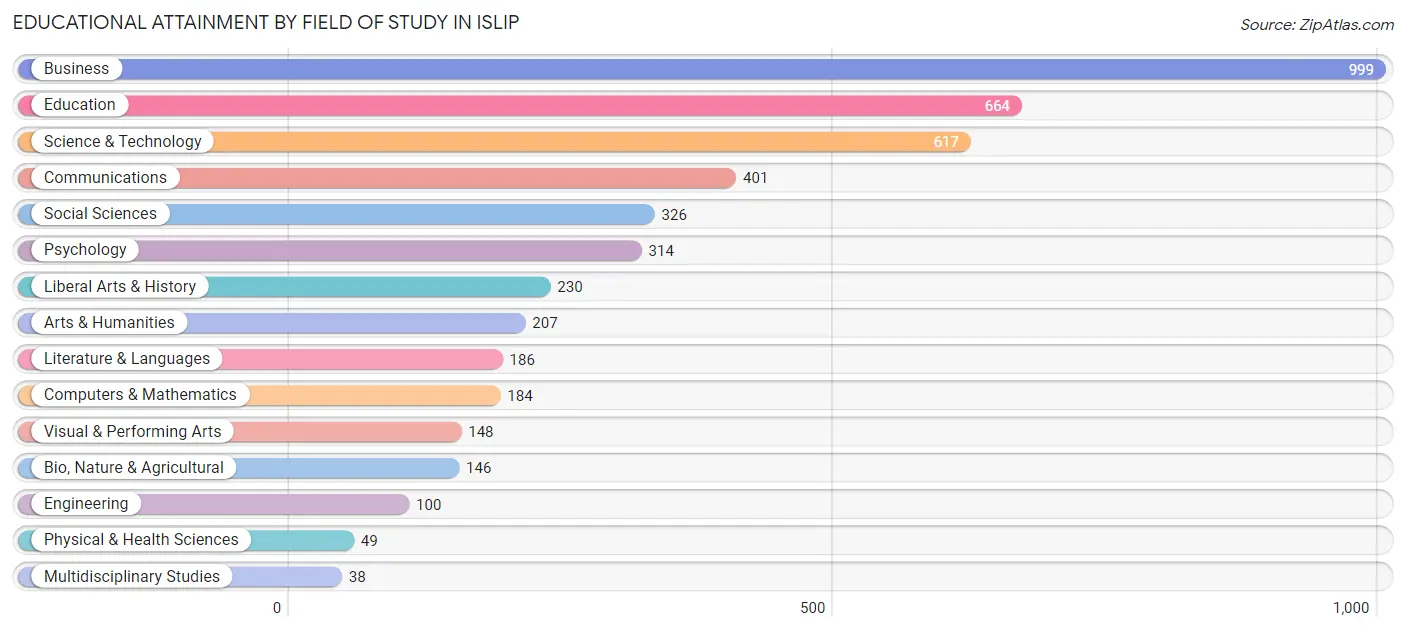
Educational Attainment by Field of Study in Islip
Business (999 | 21.7%), education (664 | 14.4%), science & technology (617 | 13.4%), communications (401 | 8.7%), and social sciences (326 | 7.1%) are the most common fields of study among 4,609 individuals in Islip who have obtained a bachelor's degree or higher.
| Field of Study | # Graduates | % Graduates |
| Computers & Mathematics | 184 | 4.0% |
| Bio, Nature & Agricultural | 146 | 3.2% |
| Physical & Health Sciences | 49 | 1.1% |
| Psychology | 314 | 6.8% |
| Social Sciences | 326 | 7.1% |
| Engineering | 100 | 2.2% |
| Multidisciplinary Studies | 38 | 0.8% |
| Science & Technology | 617 | 13.4% |
| Business | 999 | 21.7% |
| Education | 664 | 14.4% |
| Literature & Languages | 186 | 4.0% |
| Liberal Arts & History | 230 | 5.0% |
| Visual & Performing Arts | 148 | 3.2% |
| Communications | 401 | 8.7% |
| Arts & Humanities | 207 | 4.5% |
| Total | 4,609 | 100.0% |
Transportation & Commute in Islip
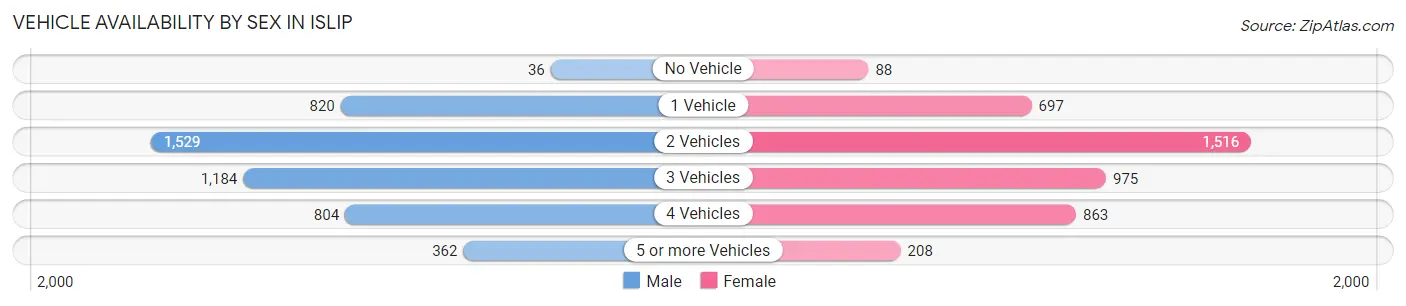
Vehicle Availability by Sex in Islip
The most prevalent vehicle ownership categories in Islip are males with 2 vehicles (1,529, accounting for 32.3%) and females with 2 vehicles (1,516, making up 35.2%).
| Vehicles Available | Male | Female |
| No Vehicle | 36 (0.8%) | 88 (2.0%) |
| 1 Vehicle | 820 (17.3%) | 697 (16.0%) |
| 2 Vehicles | 1,529 (32.3%) | 1,516 (34.9%) |
| 3 Vehicles | 1,184 (25.0%) | 975 (22.4%) |
| 4 Vehicles | 804 (17.0%) | 863 (19.9%) |
| 5 or more Vehicles | 362 (7.6%) | 208 (4.8%) |
| Total | 4,735 (100.0%) | 4,347 (100.0%) |
Commute Time in Islip
The most frequently occuring commute durations in Islip are 30 to 34 minutes (1,499 commuters, 17.9%), 20 to 24 minutes (1,268 commuters, 15.2%), and 15 to 19 minutes (1,075 commuters, 12.9%).
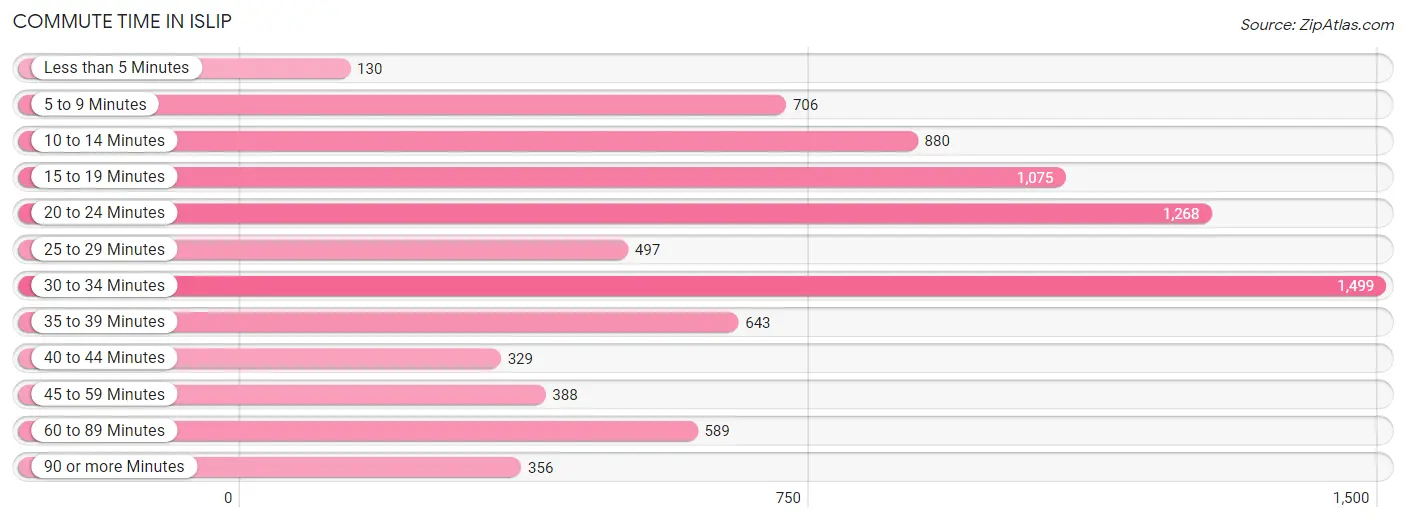
| Commute Time | # Commuters | % Commuters |
| Less than 5 Minutes | 130 | 1.6% |
| 5 to 9 Minutes | 706 | 8.4% |
| 10 to 14 Minutes | 880 | 10.5% |
| 15 to 19 Minutes | 1,075 | 12.9% |
| 20 to 24 Minutes | 1,268 | 15.2% |
| 25 to 29 Minutes | 497 | 5.9% |
| 30 to 34 Minutes | 1,499 | 17.9% |
| 35 to 39 Minutes | 643 | 7.7% |
| 40 to 44 Minutes | 329 | 3.9% |
| 45 to 59 Minutes | 388 | 4.6% |
| 60 to 89 Minutes | 589 | 7.0% |
| 90 or more Minutes | 356 | 4.3% |
Commute Time by Sex in Islip
The most common commute times in Islip are 30 to 34 minutes (898 commuters, 20.4%) for males and 20 to 24 minutes (646 commuters, 16.4%) for females.
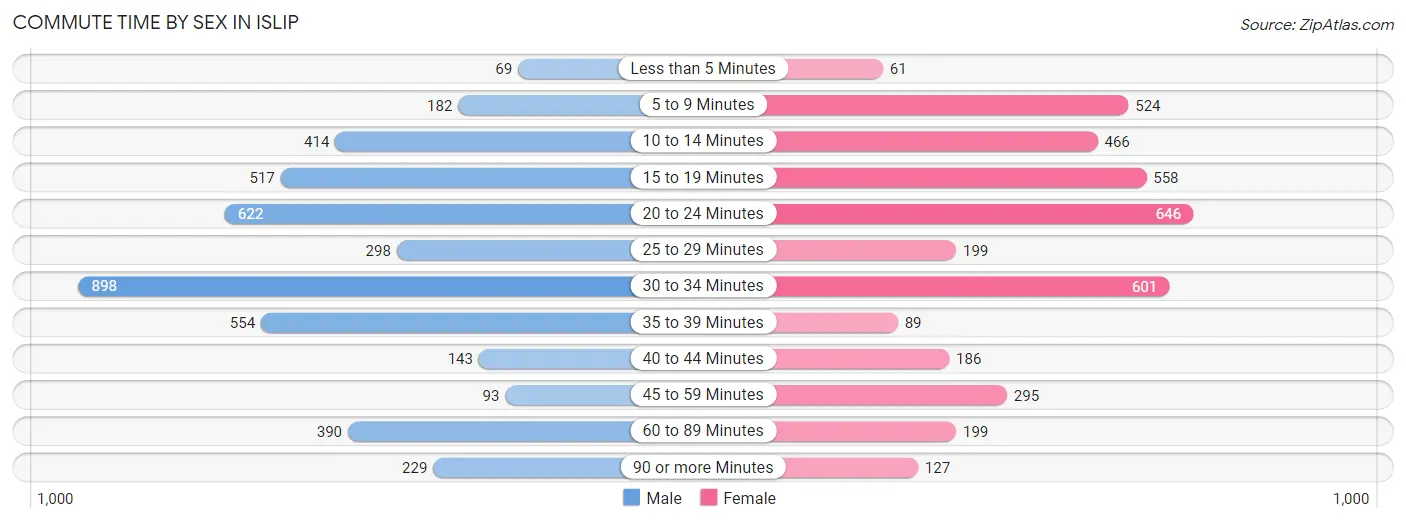
| Commute Time | Male | Female |
| Less than 5 Minutes | 69 (1.6%) | 61 (1.5%) |
| 5 to 9 Minutes | 182 (4.1%) | 524 (13.3%) |
| 10 to 14 Minutes | 414 (9.4%) | 466 (11.8%) |
| 15 to 19 Minutes | 517 (11.7%) | 558 (14.1%) |
| 20 to 24 Minutes | 622 (14.1%) | 646 (16.4%) |
| 25 to 29 Minutes | 298 (6.8%) | 199 (5.0%) |
| 30 to 34 Minutes | 898 (20.4%) | 601 (15.2%) |
| 35 to 39 Minutes | 554 (12.6%) | 89 (2.2%) |
| 40 to 44 Minutes | 143 (3.2%) | 186 (4.7%) |
| 45 to 59 Minutes | 93 (2.1%) | 295 (7.5%) |
| 60 to 89 Minutes | 390 (8.8%) | 199 (5.0%) |
| 90 or more Minutes | 229 (5.2%) | 127 (3.2%) |
Time of Departure to Work by Sex in Islip
The most frequent times of departure to work in Islip are 8:00 AM to 8:29 AM (696, 15.8%) for males and 7:00 AM to 7:29 AM (707, 17.9%) for females.
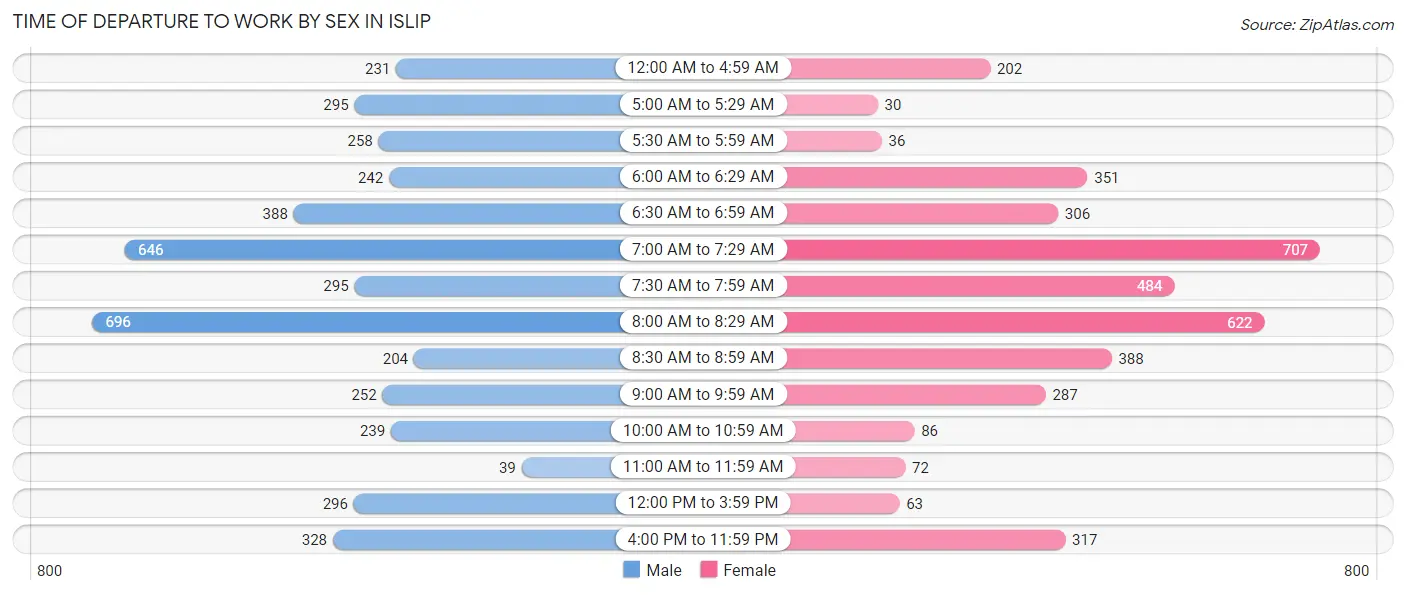
| Time of Departure | Male | Female |
| 12:00 AM to 4:59 AM | 231 (5.2%) | 202 (5.1%) |
| 5:00 AM to 5:29 AM | 295 (6.7%) | 30 (0.8%) |
| 5:30 AM to 5:59 AM | 258 (5.9%) | 36 (0.9%) |
| 6:00 AM to 6:29 AM | 242 (5.5%) | 351 (8.9%) |
| 6:30 AM to 6:59 AM | 388 (8.8%) | 306 (7.7%) |
| 7:00 AM to 7:29 AM | 646 (14.6%) | 707 (17.9%) |
| 7:30 AM to 7:59 AM | 295 (6.7%) | 484 (12.2%) |
| 8:00 AM to 8:29 AM | 696 (15.8%) | 622 (15.7%) |
| 8:30 AM to 8:59 AM | 204 (4.6%) | 388 (9.8%) |
| 9:00 AM to 9:59 AM | 252 (5.7%) | 287 (7.3%) |
| 10:00 AM to 10:59 AM | 239 (5.4%) | 86 (2.2%) |
| 11:00 AM to 11:59 AM | 39 (0.9%) | 72 (1.8%) |
| 12:00 PM to 3:59 PM | 296 (6.7%) | 63 (1.6%) |
| 4:00 PM to 11:59 PM | 328 (7.4%) | 317 (8.0%) |
| Total | 4,409 (100.0%) | 3,951 (100.0%) |
Housing Occupancy in Islip
Occupancy by Ownership in Islip
Of the total 6,137 dwellings in Islip, owner-occupied units account for 5,228 (85.2%), while renter-occupied units make up 909 (14.8%).
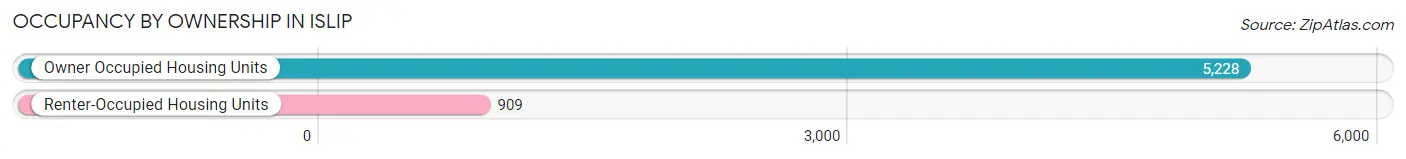
| Occupancy | # Housing Units | % Housing Units |
| Owner Occupied Housing Units | 5,228 | 85.2% |
| Renter-Occupied Housing Units | 909 | 14.8% |
| Total Occupied Housing Units | 6,137 | 100.0% |
Occupancy by Household Size in Islip
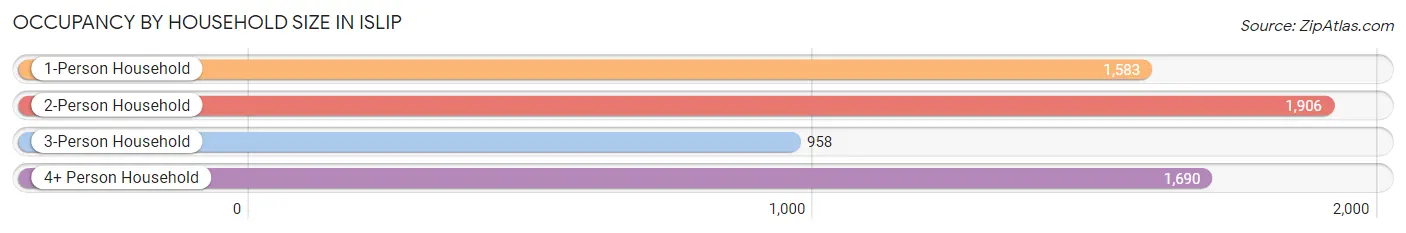
| Household Size | # Housing Units | % Housing Units |
| 1-Person Household | 1,583 | 25.8% |
| 2-Person Household | 1,906 | 31.1% |
| 3-Person Household | 958 | 15.6% |
| 4+ Person Household | 1,690 | 27.5% |
| Total Housing Units | 6,137 | 100.0% |
Occupancy by Ownership by Household Size in Islip
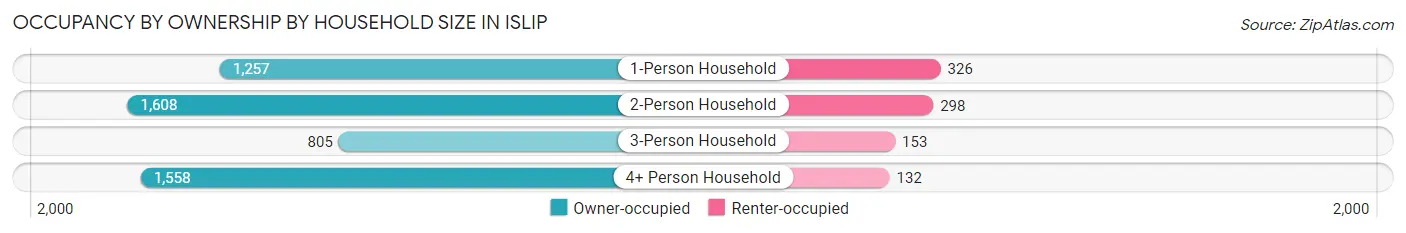
| Household Size | Owner-occupied | Renter-occupied |
| 1-Person Household | 1,257 (79.4%) | 326 (20.6%) |
| 2-Person Household | 1,608 (84.4%) | 298 (15.6%) |
| 3-Person Household | 805 (84.0%) | 153 (16.0%) |
| 4+ Person Household | 1,558 (92.2%) | 132 (7.8%) |
| Total Housing Units | 5,228 (85.2%) | 909 (14.8%) |
Occupancy by Educational Attainment in Islip
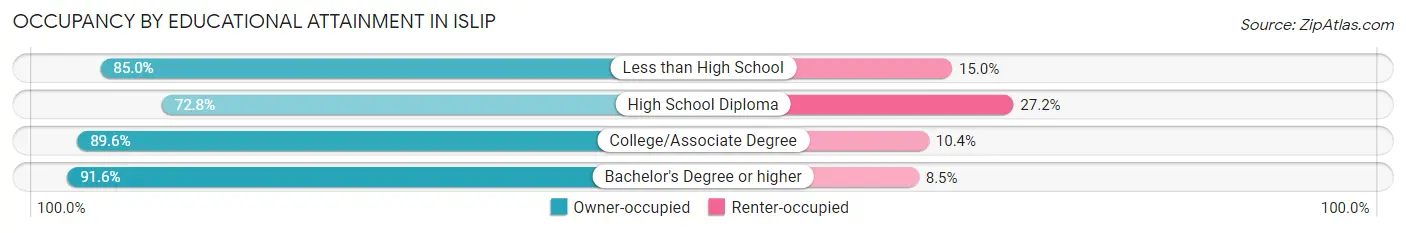
| Household Size | Owner-occupied | Renter-occupied |
| Less than High School | 565 (85.0%) | 100 (15.0%) |
| High School Diploma | 1,225 (72.8%) | 458 (27.2%) |
| College/Associate Degree | 1,390 (89.6%) | 162 (10.4%) |
| Bachelor's Degree or higher | 2,048 (91.5%) | 189 (8.5%) |
Occupancy by Age of Householder in Islip
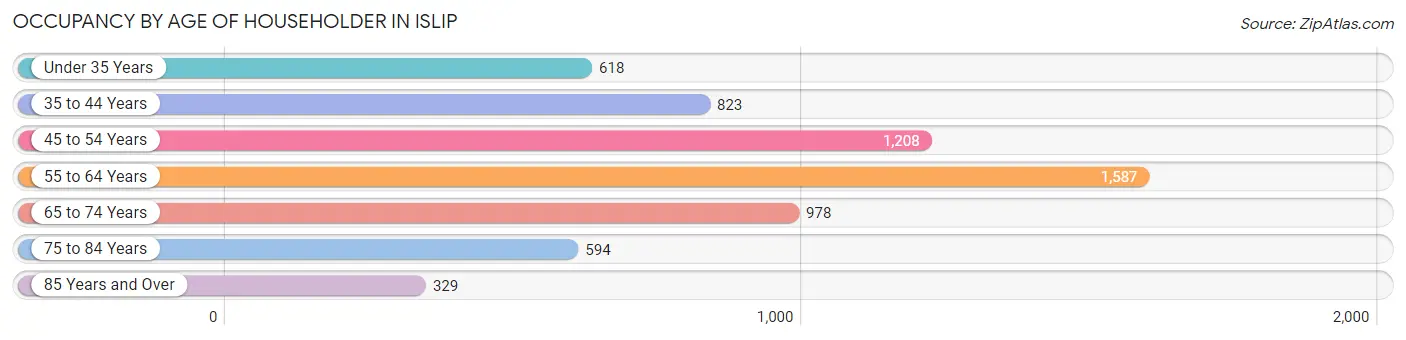
| Age Bracket | # Households | % Households |
| Under 35 Years | 618 | 10.1% |
| 35 to 44 Years | 823 | 13.4% |
| 45 to 54 Years | 1,208 | 19.7% |
| 55 to 64 Years | 1,587 | 25.9% |
| 65 to 74 Years | 978 | 15.9% |
| 75 to 84 Years | 594 | 9.7% |
| 85 Years and Over | 329 | 5.4% |
| Total | 6,137 | 100.0% |
Housing Finances in Islip
Median Income by Occupancy in Islip
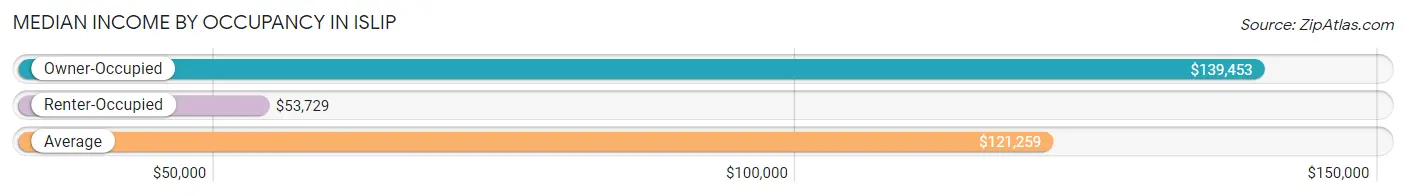
| Occupancy Type | # Households | Median Income |
| Owner-Occupied | 5,228 (85.2%) | $139,453 |
| Renter-Occupied | 909 (14.8%) | $53,729 |
| Average | 6,137 (100.0%) | $121,259 |
Occupancy by Householder Income Bracket in Islip
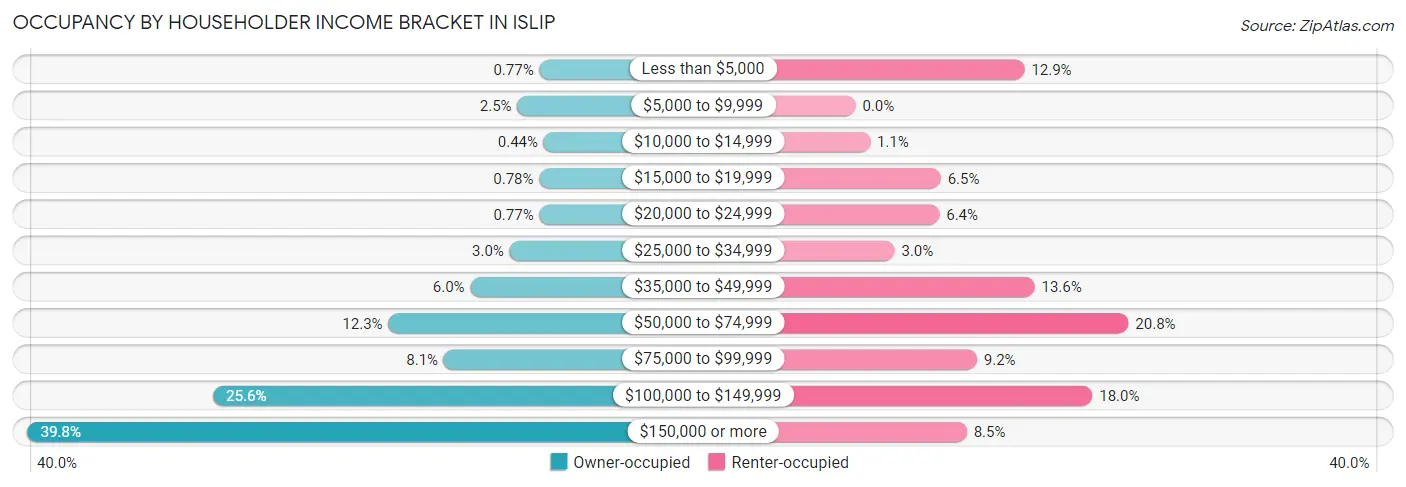
| Income Bracket | Owner-occupied | Renter-occupied |
| Less than $5,000 | 40 (0.8%) | 117 (12.9%) |
| $5,000 to $9,999 | 128 (2.5%) | 0 (0.0%) |
| $10,000 to $14,999 | 23 (0.4%) | 10 (1.1%) |
| $15,000 to $19,999 | 41 (0.8%) | 59 (6.5%) |
| $20,000 to $24,999 | 40 (0.8%) | 58 (6.4%) |
| $25,000 to $34,999 | 159 (3.0%) | 27 (3.0%) |
| $35,000 to $49,999 | 315 (6.0%) | 124 (13.6%) |
| $50,000 to $74,999 | 642 (12.3%) | 189 (20.8%) |
| $75,000 to $99,999 | 421 (8.1%) | 84 (9.2%) |
| $100,000 to $149,999 | 1,340 (25.6%) | 164 (18.0%) |
| $150,000 or more | 2,079 (39.8%) | 77 (8.5%) |
| Total | 5,228 (100.0%) | 909 (100.0%) |
Monthly Housing Cost Tiers in Islip
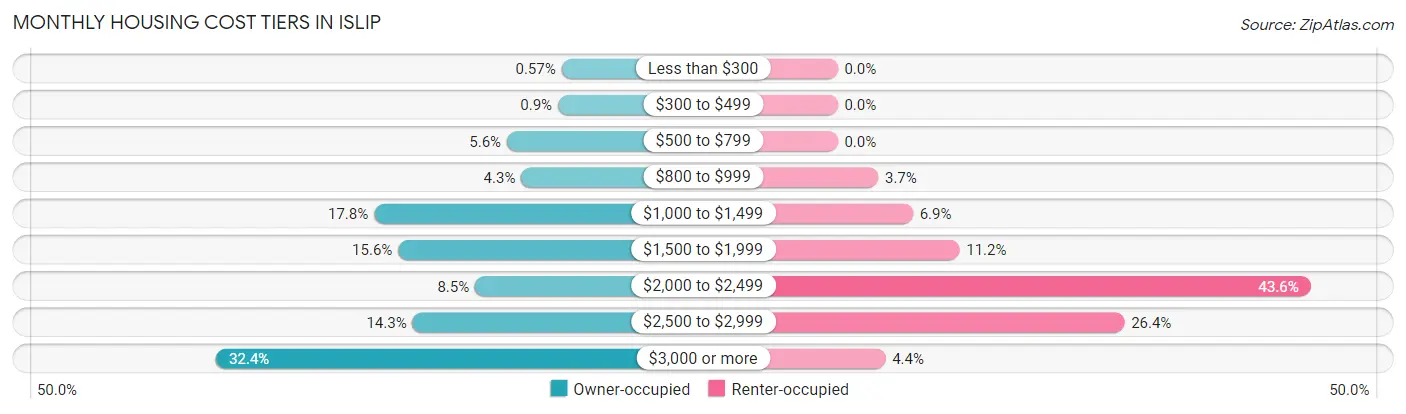
| Monthly Cost | Owner-occupied | Renter-occupied |
| Less than $300 | 30 (0.6%) | 0 (0.0%) |
| $300 to $499 | 47 (0.9%) | 0 (0.0%) |
| $500 to $799 | 293 (5.6%) | 0 (0.0%) |
| $800 to $999 | 224 (4.3%) | 34 (3.7%) |
| $1,000 to $1,499 | 932 (17.8%) | 63 (6.9%) |
| $1,500 to $1,999 | 816 (15.6%) | 102 (11.2%) |
| $2,000 to $2,499 | 446 (8.5%) | 396 (43.6%) |
| $2,500 to $2,999 | 747 (14.3%) | 240 (26.4%) |
| $3,000 or more | 1,693 (32.4%) | 40 (4.4%) |
| Total | 5,228 (100.0%) | 909 (100.0%) |
Physical Housing Characteristics in Islip
Housing Structures in Islip
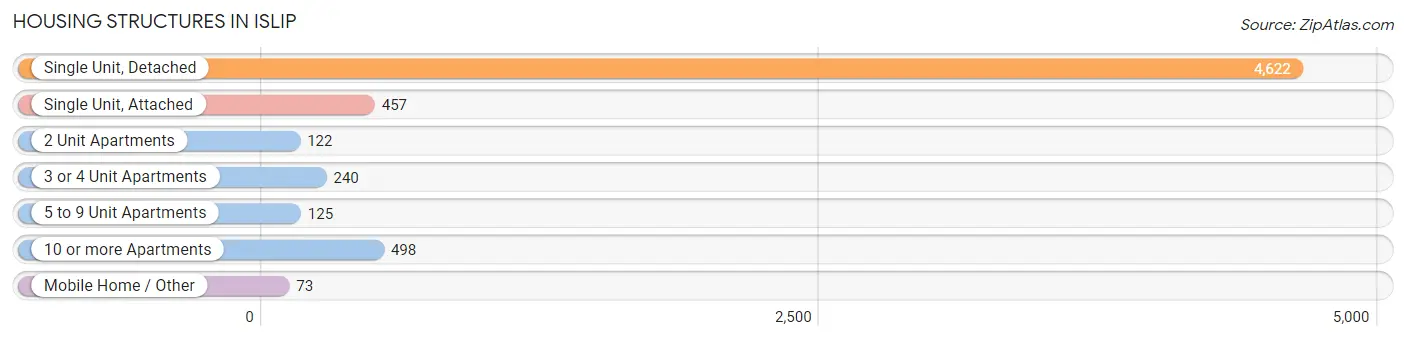
| Structure Type | # Housing Units | % Housing Units |
| Single Unit, Detached | 4,622 | 75.3% |
| Single Unit, Attached | 457 | 7.4% |
| 2 Unit Apartments | 122 | 2.0% |
| 3 or 4 Unit Apartments | 240 | 3.9% |
| 5 to 9 Unit Apartments | 125 | 2.0% |
| 10 or more Apartments | 498 | 8.1% |
| Mobile Home / Other | 73 | 1.2% |
| Total | 6,137 | 100.0% |
Housing Structures by Occupancy in Islip
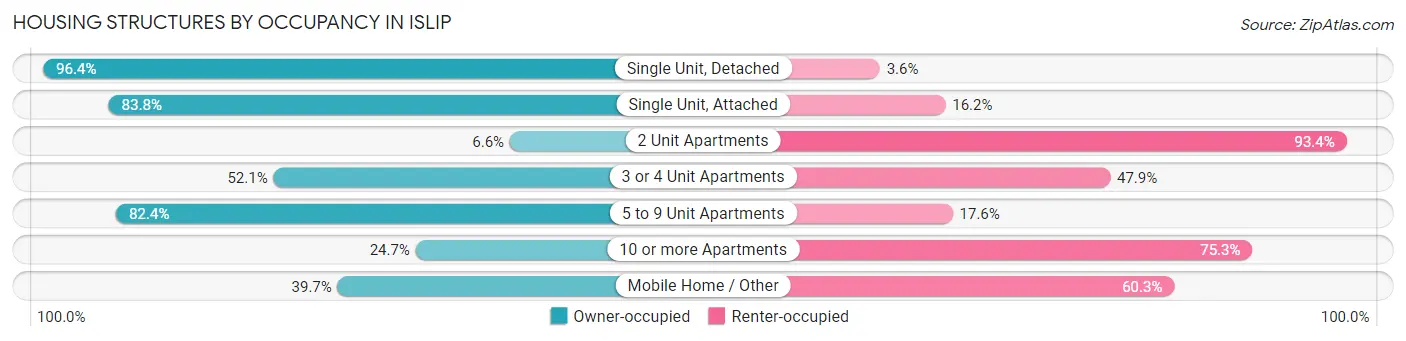
| Structure Type | Owner-occupied | Renter-occupied |
| Single Unit, Detached | 4,457 (96.4%) | 165 (3.6%) |
| Single Unit, Attached | 383 (83.8%) | 74 (16.2%) |
| 2 Unit Apartments | 8 (6.6%) | 114 (93.4%) |
| 3 or 4 Unit Apartments | 125 (52.1%) | 115 (47.9%) |
| 5 to 9 Unit Apartments | 103 (82.4%) | 22 (17.6%) |
| 10 or more Apartments | 123 (24.7%) | 375 (75.3%) |
| Mobile Home / Other | 29 (39.7%) | 44 (60.3%) |
| Total | 5,228 (85.2%) | 909 (14.8%) |
Housing Structures by Number of Rooms in Islip
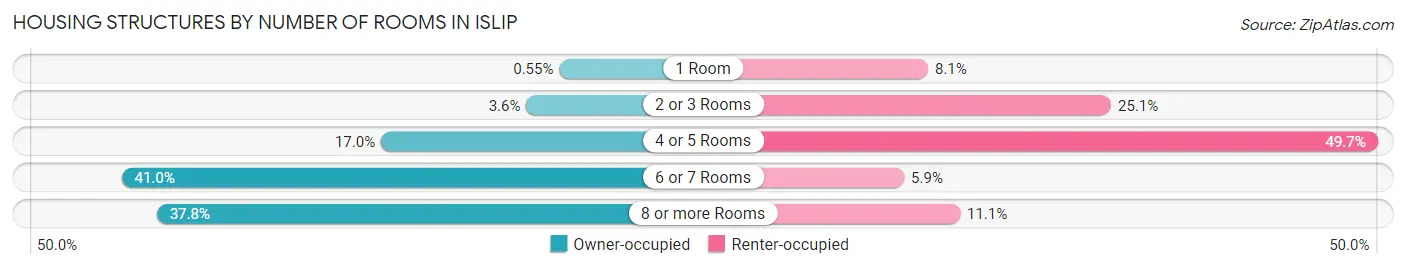
| Number of Rooms | Owner-occupied | Renter-occupied |
| 1 Room | 29 (0.5%) | 74 (8.1%) |
| 2 or 3 Rooms | 188 (3.6%) | 228 (25.1%) |
| 4 or 5 Rooms | 891 (17.0%) | 452 (49.7%) |
| 6 or 7 Rooms | 2,145 (41.0%) | 54 (5.9%) |
| 8 or more Rooms | 1,975 (37.8%) | 101 (11.1%) |
| Total | 5,228 (100.0%) | 909 (100.0%) |
Housing Structure by Heating Type in Islip
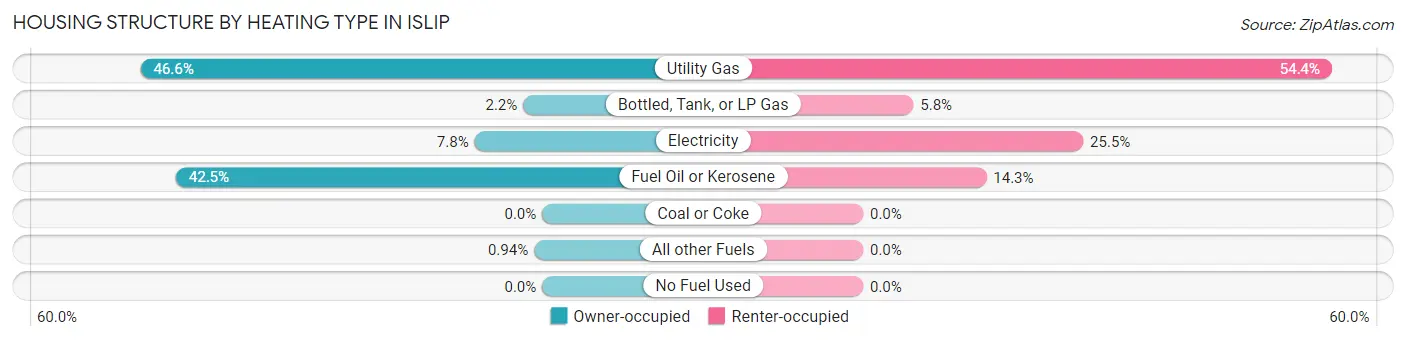
| Heating Type | Owner-occupied | Renter-occupied |
| Utility Gas | 2,434 (46.6%) | 494 (54.3%) |
| Bottled, Tank, or LP Gas | 115 (2.2%) | 53 (5.8%) |
| Electricity | 410 (7.8%) | 232 (25.5%) |
| Fuel Oil or Kerosene | 2,220 (42.5%) | 130 (14.3%) |
| Coal or Coke | 0 (0.0%) | 0 (0.0%) |
| All other Fuels | 49 (0.9%) | 0 (0.0%) |
| No Fuel Used | 0 (0.0%) | 0 (0.0%) |
| Total | 5,228 (100.0%) | 909 (100.0%) |
Household Vehicle Usage in Islip
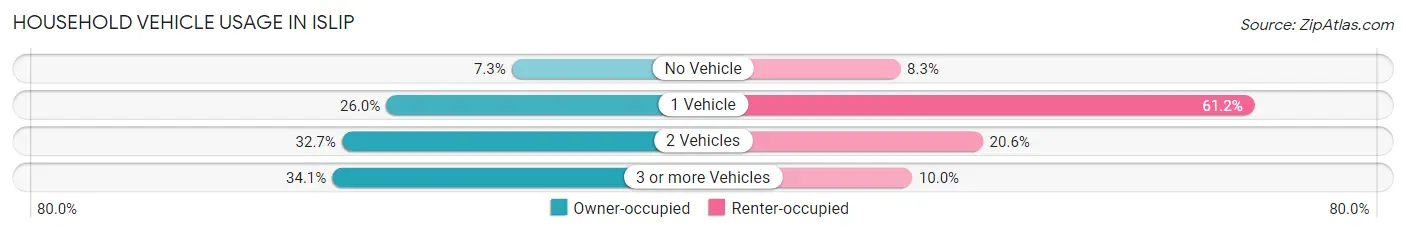
| Vehicles per Household | Owner-occupied | Renter-occupied |
| No Vehicle | 380 (7.3%) | 75 (8.3%) |
| 1 Vehicle | 1,360 (26.0%) | 556 (61.2%) |
| 2 Vehicles | 1,707 (32.7%) | 187 (20.6%) |
| 3 or more Vehicles | 1,781 (34.1%) | 91 (10.0%) |
| Total | 5,228 (100.0%) | 909 (100.0%) |
Real Estate & Mortgages in Islip
Real Estate and Mortgage Overview in Islip
| Characteristic | Without Mortgage | With Mortgage |
| Housing Units | 2,060 | 3,168 |
| Median Property Value | $437,900 | $466,300 |
| Median Household Income | $100,573 | $1,572 |
| Monthly Housing Costs | $1,455 | $1,693 |
| Real Estate Taxes | $10,001 | $145 |
Property Value by Mortgage Status in Islip
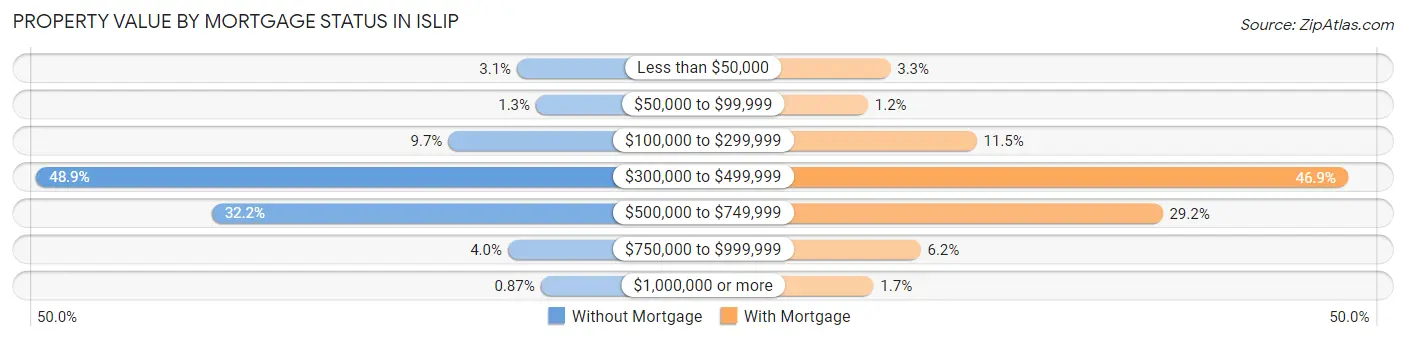
| Property Value | Without Mortgage | With Mortgage |
| Less than $50,000 | 64 (3.1%) | 105 (3.3%) |
| $50,000 to $99,999 | 27 (1.3%) | 37 (1.2%) |
| $100,000 to $299,999 | 199 (9.7%) | 365 (11.5%) |
| $300,000 to $499,999 | 1,007 (48.9%) | 1,485 (46.9%) |
| $500,000 to $749,999 | 663 (32.2%) | 926 (29.2%) |
| $750,000 to $999,999 | 82 (4.0%) | 196 (6.2%) |
| $1,000,000 or more | 18 (0.9%) | 54 (1.7%) |
| Total | 2,060 (100.0%) | 3,168 (100.0%) |
Household Income by Mortgage Status in Islip
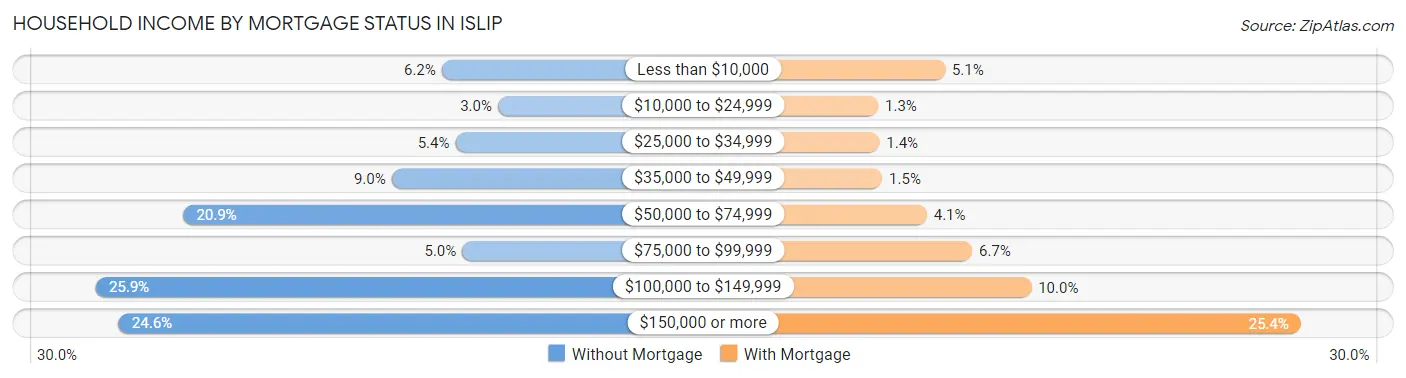
| Household Income | Without Mortgage | With Mortgage |
| Less than $10,000 | 127 (6.2%) | 162 (5.1%) |
| $10,000 to $24,999 | 61 (3.0%) | 41 (1.3%) |
| $25,000 to $34,999 | 111 (5.4%) | 43 (1.4%) |
| $35,000 to $49,999 | 186 (9.0%) | 48 (1.5%) |
| $50,000 to $74,999 | 431 (20.9%) | 129 (4.1%) |
| $75,000 to $99,999 | 103 (5.0%) | 211 (6.7%) |
| $100,000 to $149,999 | 534 (25.9%) | 318 (10.0%) |
| $150,000 or more | 507 (24.6%) | 806 (25.4%) |
| Total | 2,060 (100.0%) | 3,168 (100.0%) |
Property Value to Household Income Ratio in Islip
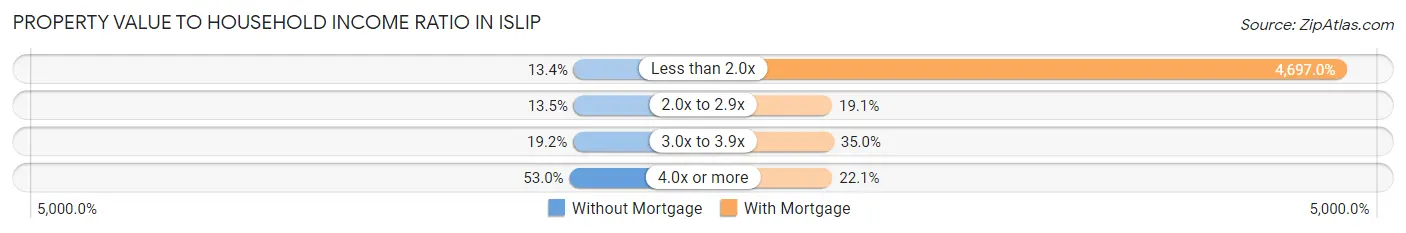
| Value-to-Income Ratio | Without Mortgage | With Mortgage |
| Less than 2.0x | 275 (13.4%) | 148,800 (4,697.0%) |
| 2.0x to 2.9x | 277 (13.5%) | 606 (19.1%) |
| 3.0x to 3.9x | 396 (19.2%) | 1,108 (35.0%) |
| 4.0x or more | 1,091 (53.0%) | 701 (22.1%) |
| Total | 2,060 (100.0%) | 3,168 (100.0%) |
Real Estate Taxes by Mortgage Status in Islip
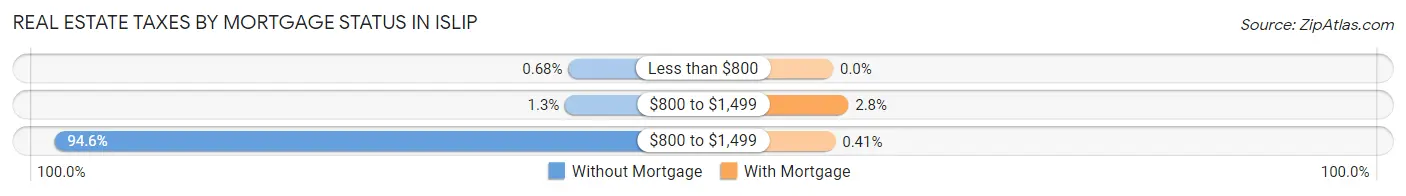
| Property Taxes | Without Mortgage | With Mortgage |
| Less than $800 | 14 (0.7%) | 0 (0.0%) |
| $800 to $1,499 | 26 (1.3%) | 88 (2.8%) |
| $800 to $1,499 | 1,948 (94.6%) | 13 (0.4%) |
| Total | 2,060 (100.0%) | 3,168 (100.0%) |
Health & Disability in Islip
Health Insurance Coverage by Age in Islip
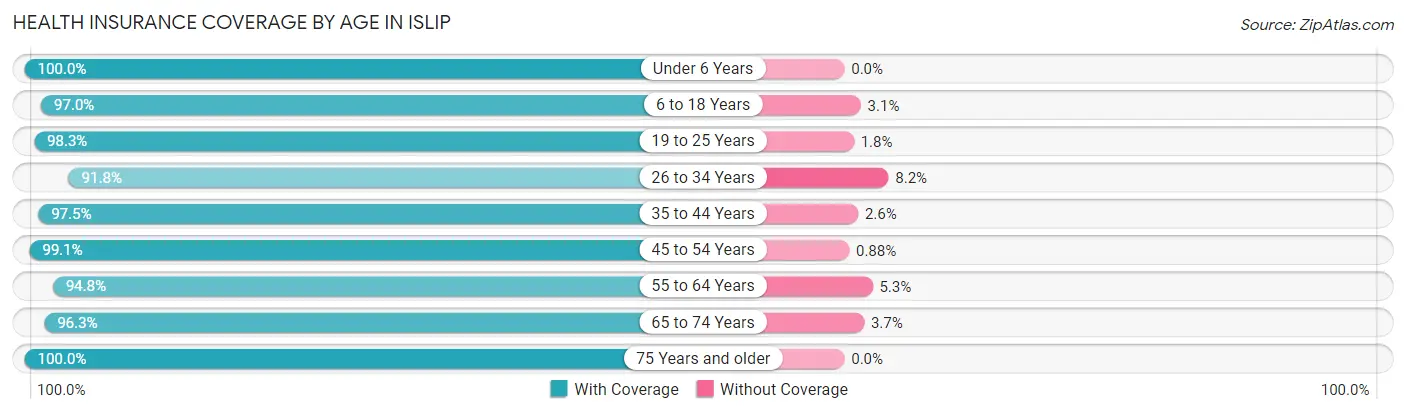
| Age Bracket | With Coverage | Without Coverage |
| Under 6 Years | 1,042 (100.0%) | 0 (0.0%) |
| 6 to 18 Years | 2,223 (97.0%) | 70 (3.0%) |
| 19 to 25 Years | 1,347 (98.3%) | 24 (1.8%) |
| 26 to 34 Years | 1,897 (91.8%) | 170 (8.2%) |
| 35 to 44 Years | 2,142 (97.5%) | 56 (2.5%) |
| 45 to 54 Years | 2,147 (99.1%) | 19 (0.9%) |
| 55 to 64 Years | 2,795 (94.8%) | 155 (5.2%) |
| 65 to 74 Years | 1,758 (96.3%) | 67 (3.7%) |
| 75 Years and older | 1,368 (100.0%) | 0 (0.0%) |
| Total | 16,719 (96.8%) | 561 (3.3%) |
Health Insurance Coverage by Citizenship Status in Islip
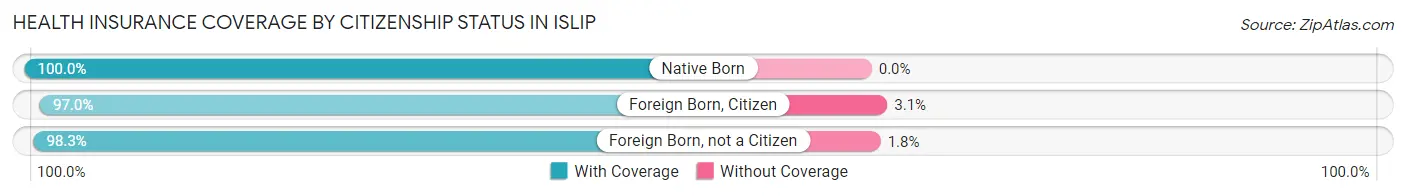
| Citizenship Status | With Coverage | Without Coverage |
| Native Born | 1,042 (100.0%) | 0 (0.0%) |
| Foreign Born, Citizen | 2,223 (97.0%) | 70 (3.0%) |
| Foreign Born, not a Citizen | 1,347 (98.3%) | 24 (1.8%) |
Health Insurance Coverage by Household Income in Islip
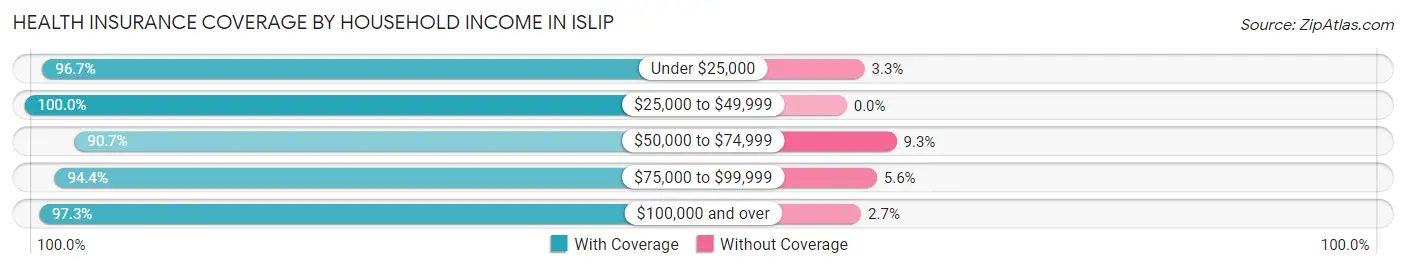
| Household Income | With Coverage | Without Coverage |
| Under $25,000 | 842 (96.7%) | 29 (3.3%) |
| $25,000 to $49,999 | 1,329 (100.0%) | 0 (0.0%) |
| $50,000 to $74,999 | 1,224 (90.7%) | 126 (9.3%) |
| $75,000 to $99,999 | 1,140 (94.4%) | 68 (5.6%) |
| $100,000 and over | 12,118 (97.3%) | 335 (2.7%) |
Public vs Private Health Insurance Coverage by Age in Islip
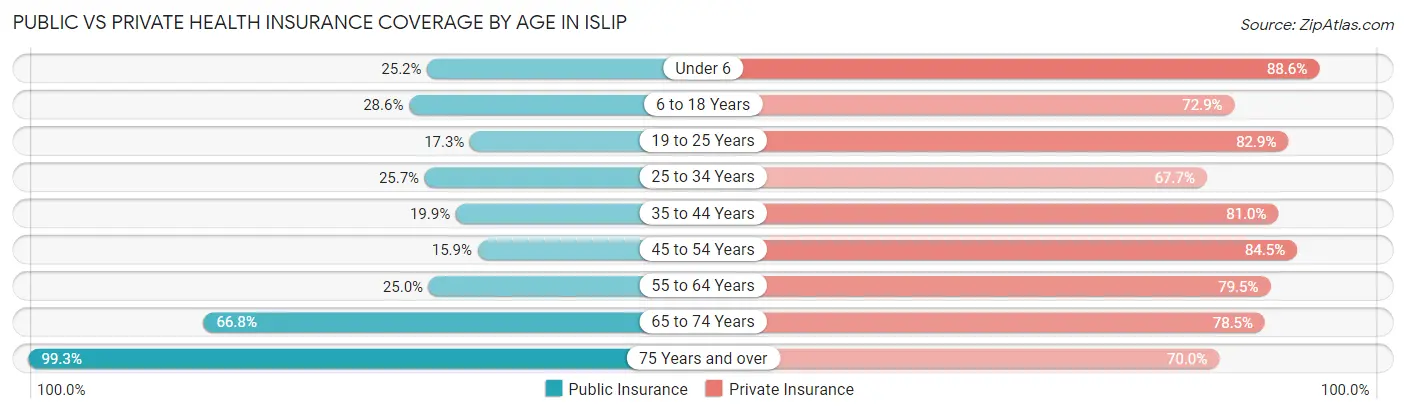
| Age Bracket | Public Insurance | Private Insurance |
| Under 6 | 263 (25.2%) | 923 (88.6%) |
| 6 to 18 Years | 656 (28.6%) | 1,671 (72.9%) |
| 19 to 25 Years | 237 (17.3%) | 1,136 (82.9%) |
| 25 to 34 Years | 531 (25.7%) | 1,400 (67.7%) |
| 35 to 44 Years | 438 (19.9%) | 1,781 (81.0%) |
| 45 to 54 Years | 344 (15.9%) | 1,830 (84.5%) |
| 55 to 64 Years | 736 (24.9%) | 2,346 (79.5%) |
| 65 to 74 Years | 1,219 (66.8%) | 1,433 (78.5%) |
| 75 Years and over | 1,358 (99.3%) | 958 (70.0%) |
| Total | 5,782 (33.5%) | 13,478 (78.0%) |
Disability Status by Sex by Age in Islip
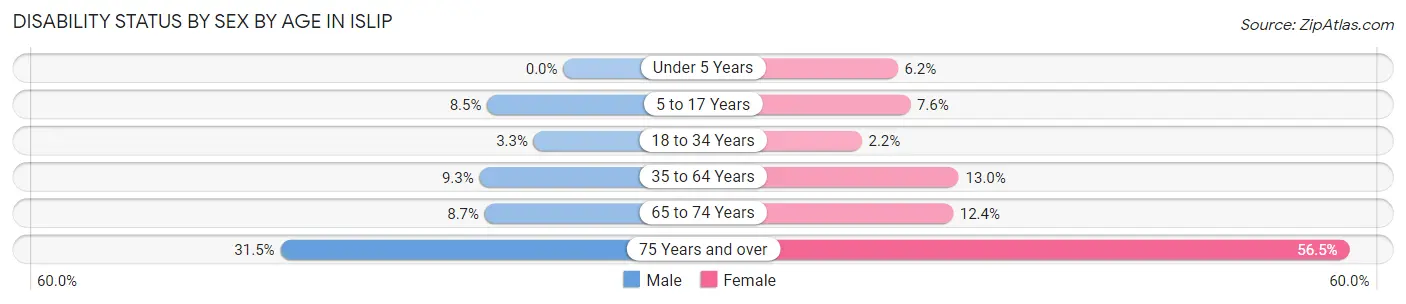
| Age Bracket | Male | Female |
| Under 5 Years | 0 (0.0%) | 29 (6.2%) |
| 5 to 17 Years | 101 (8.5%) | 81 (7.6%) |
| 18 to 34 Years | 57 (3.3%) | 41 (2.2%) |
| 35 to 64 Years | 346 (9.3%) | 469 (13.0%) |
| 65 to 74 Years | 81 (8.7%) | 111 (12.4%) |
| 75 Years and over | 144 (31.5%) | 515 (56.5%) |
Disability Class by Sex by Age in Islip
Disability Class: Hearing Difficulty
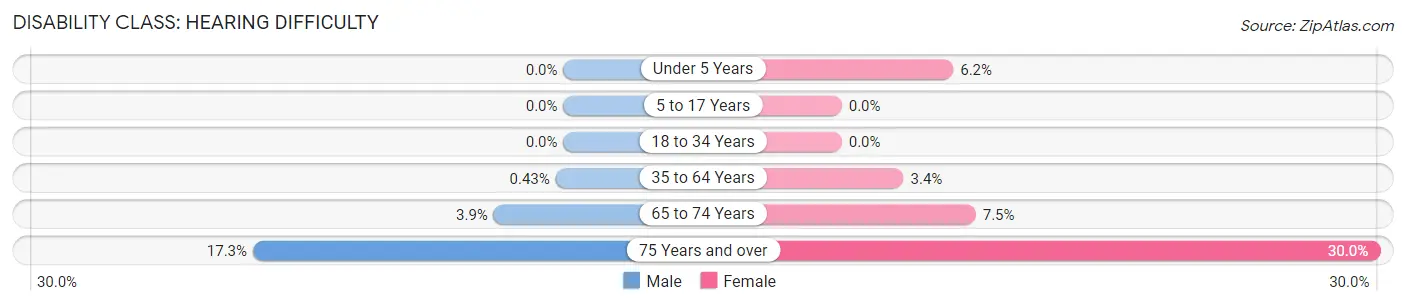
| Age Bracket | Male | Female |
| Under 5 Years | 0 (0.0%) | 29 (6.2%) |
| 5 to 17 Years | 0 (0.0%) | 0 (0.0%) |
| 18 to 34 Years | 0 (0.0%) | 0 (0.0%) |
| 35 to 64 Years | 16 (0.4%) | 124 (3.4%) |
| 65 to 74 Years | 36 (3.9%) | 67 (7.5%) |
| 75 Years and over | 79 (17.3%) | 273 (30.0%) |
Disability Class: Vision Difficulty
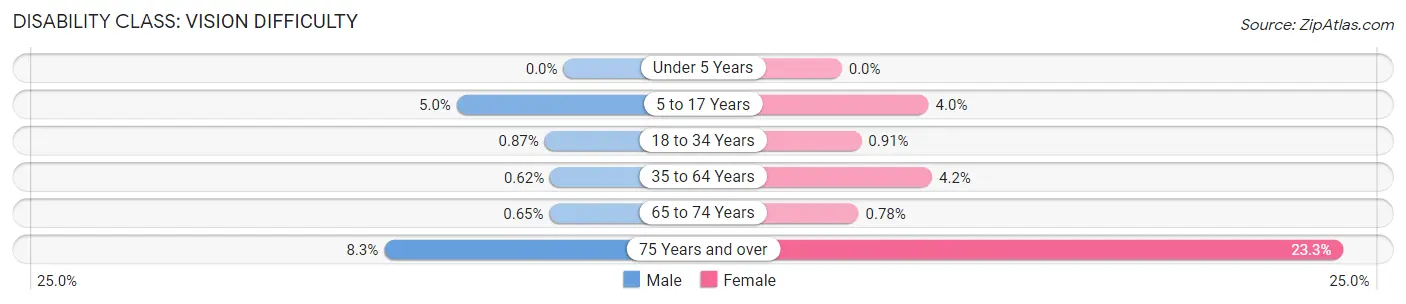
| Age Bracket | Male | Female |
| Under 5 Years | 0 (0.0%) | 0 (0.0%) |
| 5 to 17 Years | 59 (5.0%) | 43 (4.0%) |
| 18 to 34 Years | 15 (0.9%) | 17 (0.9%) |
| 35 to 64 Years | 23 (0.6%) | 151 (4.2%) |
| 65 to 74 Years | 6 (0.6%) | 7 (0.8%) |
| 75 Years and over | 38 (8.3%) | 212 (23.3%) |
Disability Class: Cognitive Difficulty
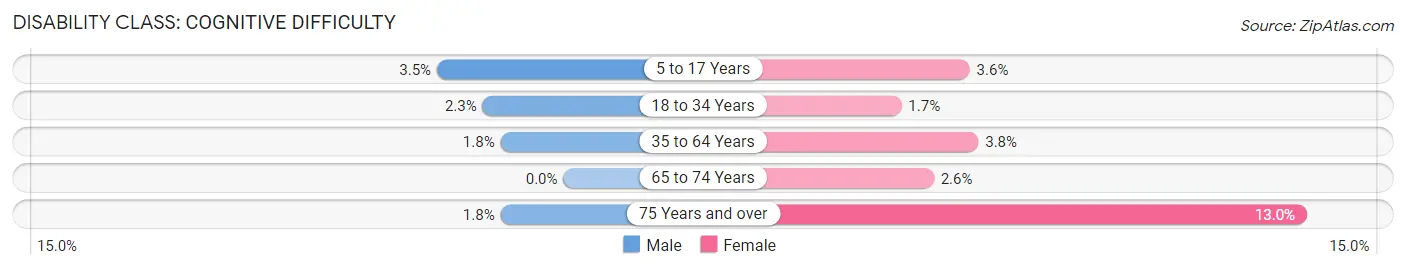
| Age Bracket | Male | Female |
| 5 to 17 Years | 42 (3.5%) | 38 (3.6%) |
| 18 to 34 Years | 39 (2.2%) | 31 (1.7%) |
| 35 to 64 Years | 65 (1.8%) | 137 (3.8%) |
| 65 to 74 Years | 0 (0.0%) | 23 (2.6%) |
| 75 Years and over | 8 (1.8%) | 118 (13.0%) |
Disability Class: Ambulatory Difficulty
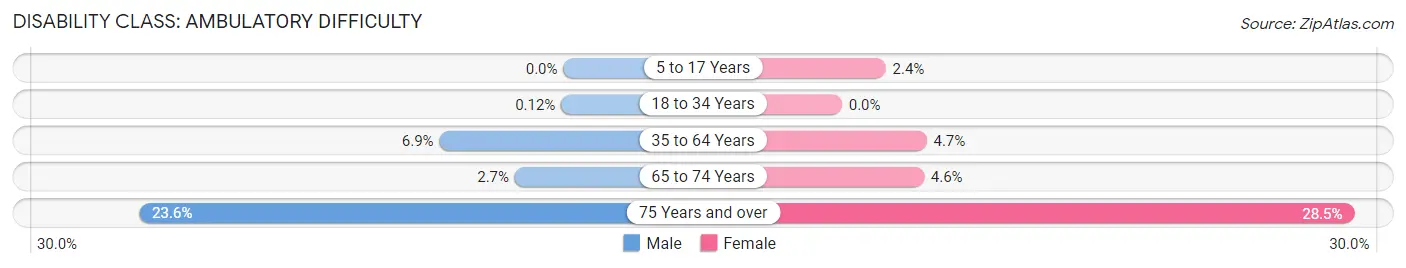
| Age Bracket | Male | Female |
| 5 to 17 Years | 0 (0.0%) | 26 (2.4%) |
| 18 to 34 Years | 2 (0.1%) | 0 (0.0%) |
| 35 to 64 Years | 256 (6.9%) | 170 (4.7%) |
| 65 to 74 Years | 25 (2.7%) | 41 (4.6%) |
| 75 Years and over | 108 (23.6%) | 260 (28.5%) |
Disability Class: Self-Care Difficulty
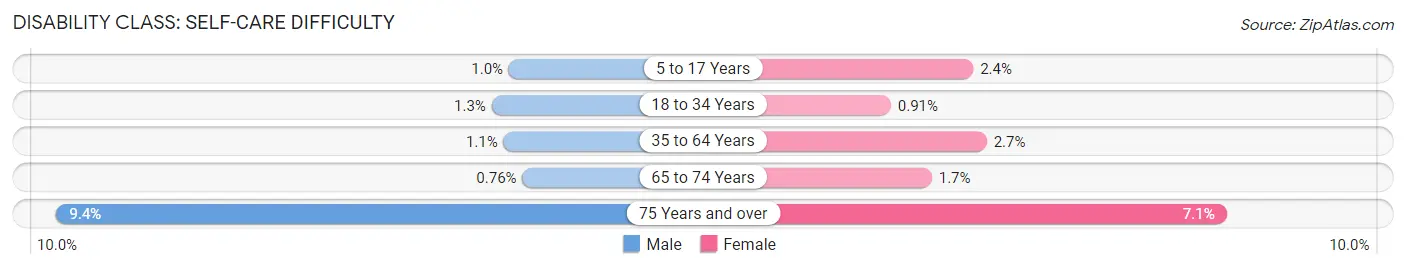
| Age Bracket | Male | Female |
| 5 to 17 Years | 12 (1.0%) | 26 (2.4%) |
| 18 to 34 Years | 23 (1.3%) | 17 (0.9%) |
| 35 to 64 Years | 41 (1.1%) | 97 (2.7%) |
| 65 to 74 Years | 7 (0.8%) | 15 (1.7%) |
| 75 Years and over | 43 (9.4%) | 65 (7.1%) |
Technology Access in Islip
Computing Device Access in Islip
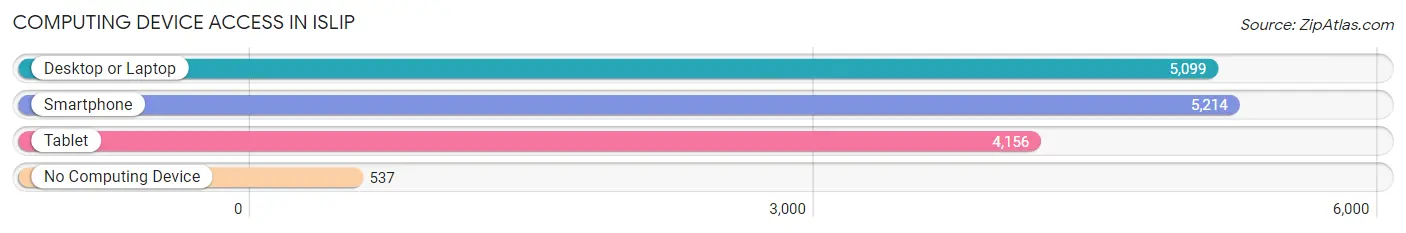
| Device Type | # Households | % Households |
| Desktop or Laptop | 5,099 | 83.1% |
| Smartphone | 5,214 | 85.0% |
| Tablet | 4,156 | 67.7% |
| No Computing Device | 537 | 8.7% |
| Total | 6,137 | 100.0% |
Internet Access in Islip
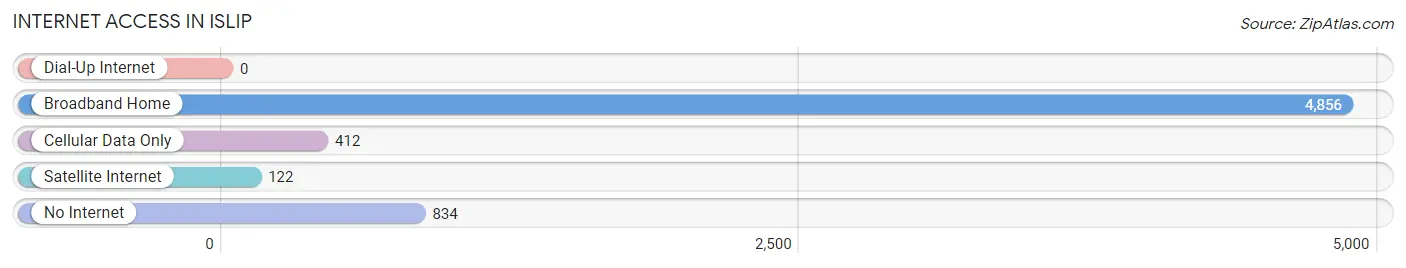
| Internet Type | # Households | % Households |
| Dial-Up Internet | 0 | 0.0% |
| Broadband Home | 4,856 | 79.1% |
| Cellular Data Only | 412 | 6.7% |
| Satellite Internet | 122 | 2.0% |
| No Internet | 834 | 13.6% |
| Total | 6,137 | 100.0% |
Islip Summary
Islip is a town located in Suffolk County, New York, United States. It is situated on the south shore of Long Island, and is part of the New York metropolitan area. As of the 2010 census, the town had a total population of 335,543.
History
The area that is now Islip was originally inhabited by the Secatogue Indians, a sub-tribe of the Algonquin Nation. The first European settlers arrived in the area in 1683, and the town was officially established in 1710. The town was named after the Islip family, who were among the first settlers.
In the late 19th century, Islip became a popular summer resort destination for wealthy New Yorkers. The town was home to several large estates, including the estate of William K. Vanderbilt.
Geography
Islip is located in the southeastern part of Suffolk County, on the south shore of Long Island. It is bordered by the towns of Babylon, Brookhaven, Huntington, and Smithtown. The town covers an area of 57.2 square miles, and has a total population of 335,543.
The town is divided into two distinct regions: the mainland and the barrier islands. The mainland is located on the mainland of Long Island, and is home to the majority of the town's population. The barrier islands are located off the coast of Long Island, and are home to several popular beaches and resorts.
Climate
Islip has a humid subtropical climate, with hot, humid summers and mild winters. The average temperature in the summer is around 75°F, and the average temperature in the winter is around 40°F. The town receives an average of 44 inches of precipitation per year.
Economy
Islip is home to a diverse economy, with a variety of industries represented. The town is home to several large corporations, including Canon USA, Northrop Grumman, and Siemens. The town is also home to several smaller businesses, including restaurants, retail stores, and professional services.
The town is also home to several popular tourist attractions, including the Fire Island National Seashore, the Long Island Aquarium, and the Islip Art Museum.
Demographics
As of the 2010 census, Islip had a population of 335,543. The racial makeup of the town was 79.3% White, 11.2% African American, 0.3% Native American, 3.2% Asian, 0.1% Pacific Islander, 3.2% from other races, and 3.0% from two or more races. Hispanic or Latino of any race were 11.7% of the population.
The median household income in Islip was $87,845, and the median family income was $103,945. The per capita income was $37,945. About 4.3% of families and 6.2% of the population were below the poverty line.
Common Questions
What is the Total Population of Islip?
Total Population of Islip is 17,284.
What is the Total Male Population of Islip?
Total Male Population of Islip is 8,468.
What is the Total Female Population of Islip?
Total Female Population of Islip is 8,816.
What is the Ratio of Males per 100 Females in Islip?
There are 96.05 Males per 100 Females in Islip.
What is the Ratio of Females per 100 Males in Islip?
There are 104.11 Females per 100 Males in Islip.
What is the Median Population Age in Islip?
Median Population Age in Islip is 43.7 Years.
What is the Average Family Size in Islip
Average Family Size in Islip is 3.4 People.
What is the Average Household Size in Islip
Average Household Size in Islip is 2.8 People.
What is Per Capita Income in Islip?
Per Capita income in Islip is $49,570.
What is the Median Family Income in Islip?
Median Family Income in Islip is $147,640.
What is the Median Household income in Islip?
Median Household Income in Islip is $121,259.
What is Income or Wage Gap in Islip?
Income or Wage Gap in Islip is 38.4%.
Women in Islip earn 61.6 cents for every dollar earned by a man.
What is Inequality or Gini Index in Islip?
Inequality or Gini Index in Islip is 0.39.
How Large is the Labor Force in Islip?
There are 9,746 People in the Labor Forcein in Islip.
What is the Percentage of People in the Labor Force in Islip?
67.5% of People are in the Labor Force in Islip.
What is the Unemployment Rate in Islip?
Unemployment Rate in Islip is 5.4%.