Le Roy, NY
Le Roy Map
Le Roy Overview
4,332
TOTAL POPULATION
2,048
MALE POPULATION
2,284
FEMALE POPULATION
89.67
MALES / 100 FEMALES
111.52
FEMALES / 100 MALES
38.2
MEDIAN AGE
2.7
AVG FAMILY SIZE
2.1
AVG HOUSEHOLD SIZE
$37,971
PER CAPITA INCOME
$80,928
AVG FAMILY INCOME
$62,833
AVG HOUSEHOLD INCOME
32.4%
WAGE / INCOME GAP [ % ]
67.6¢/ $1
WAGE / INCOME GAP [ $ ]
0.48
INEQUALITY / GINI INDEX
2,161
LABOR FORCE [ PEOPLE ]
60.2%
PERCENT IN LABOR FORCE
1.9%
UNEMPLOYMENT RATE
Le Roy Zip Codes
Le Roy Area Codes
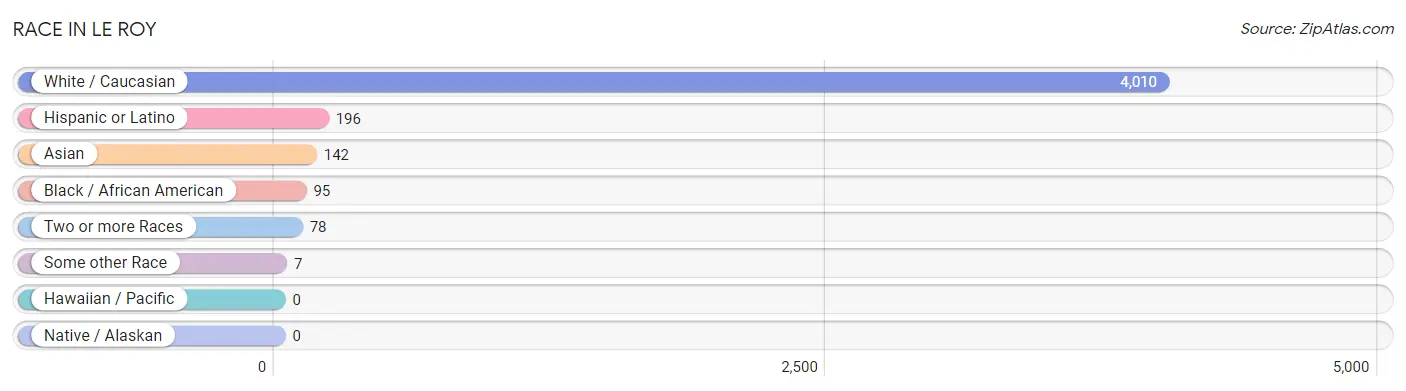
Race in Le Roy
The most populous races in Le Roy are White / Caucasian (4,010 | 92.6%), Hispanic or Latino (196 | 4.5%), and Asian (142 | 3.3%).
| Race | # Population | % Population |
| Asian | 142 | 3.3% |
| Black / African American | 95 | 2.2% |
| Hawaiian / Pacific | 0 | 0.0% |
| Hispanic or Latino | 196 | 4.5% |
| Native / Alaskan | 0 | 0.0% |
| White / Caucasian | 4,010 | 92.6% |
| Two or more Races | 78 | 1.8% |
| Some other Race | 7 | 0.2% |
| Total | 4,332 | 100.0% |
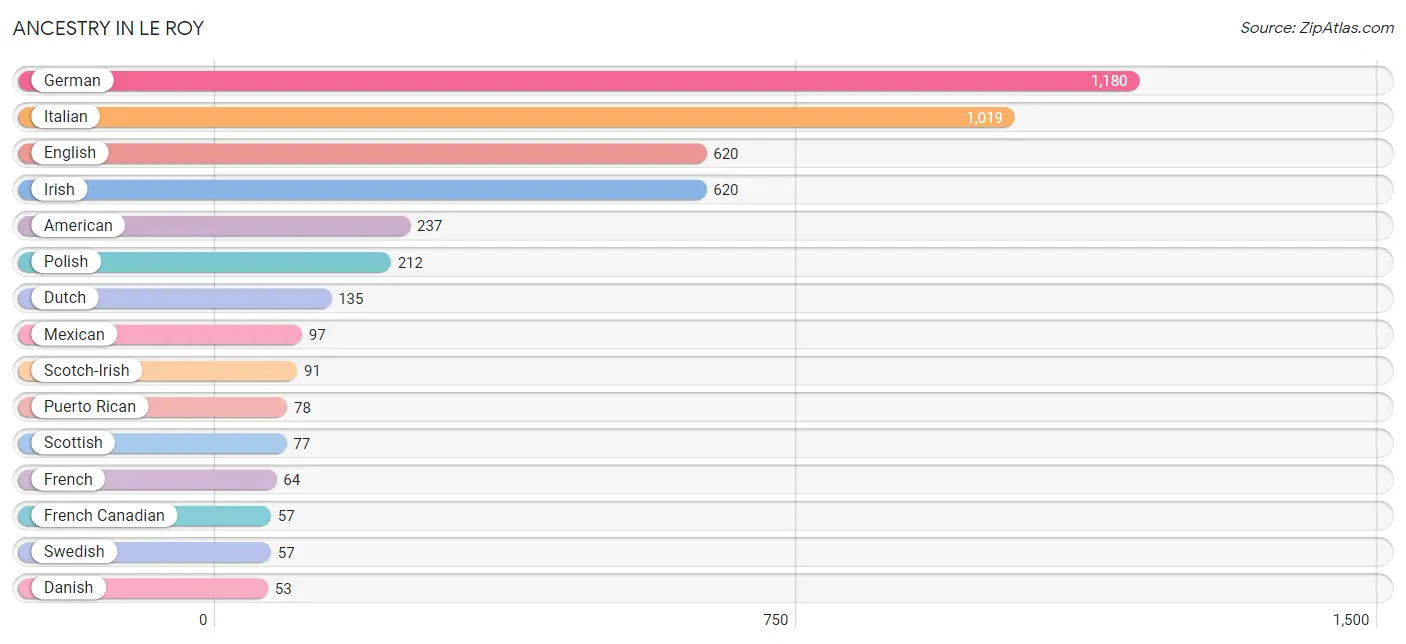
Ancestry in Le Roy
The most populous ancestries reported in Le Roy are German (1,180 | 27.2%), Italian (1,019 | 23.5%), English (620 | 14.3%), Irish (620 | 14.3%), and American (237 | 5.5%), together accounting for 84.8% of all Le Roy residents.
| Ancestry | # Population | % Population |
| American | 237 | 5.5% |
| Austrian | 11 | 0.3% |
| Blackfeet | 19 | 0.4% |
| British | 17 | 0.4% |
| Canadian | 11 | 0.3% |
| Croatian | 49 | 1.1% |
| Danish | 53 | 1.2% |
| Dutch | 135 | 3.1% |
| English | 620 | 14.3% |
| European | 41 | 0.9% |
| French | 64 | 1.5% |
| French Canadian | 57 | 1.3% |
| German | 1,180 | 27.2% |
| Haitian | 5 | 0.1% |
| Hungarian | 10 | 0.2% |
| Indian (Asian) | 34 | 0.8% |
| Irish | 620 | 14.3% |
| Iroquois | 17 | 0.4% |
| Israeli | 53 | 1.2% |
| Italian | 1,019 | 23.5% |
| Mexican | 97 | 2.2% |
| Northern European | 21 | 0.5% |
| Norwegian | 38 | 0.9% |
| Polish | 212 | 4.9% |
| Puerto Rican | 78 | 1.8% |
| Scotch-Irish | 91 | 2.1% |
| Scottish | 77 | 1.8% |
| Swedish | 57 | 1.3% |
| Ukrainian | 11 | 0.3% |
| Welsh | 23 | 0.5% |
| Yugoslavian | 5 | 0.1% | View All 31 Rows |
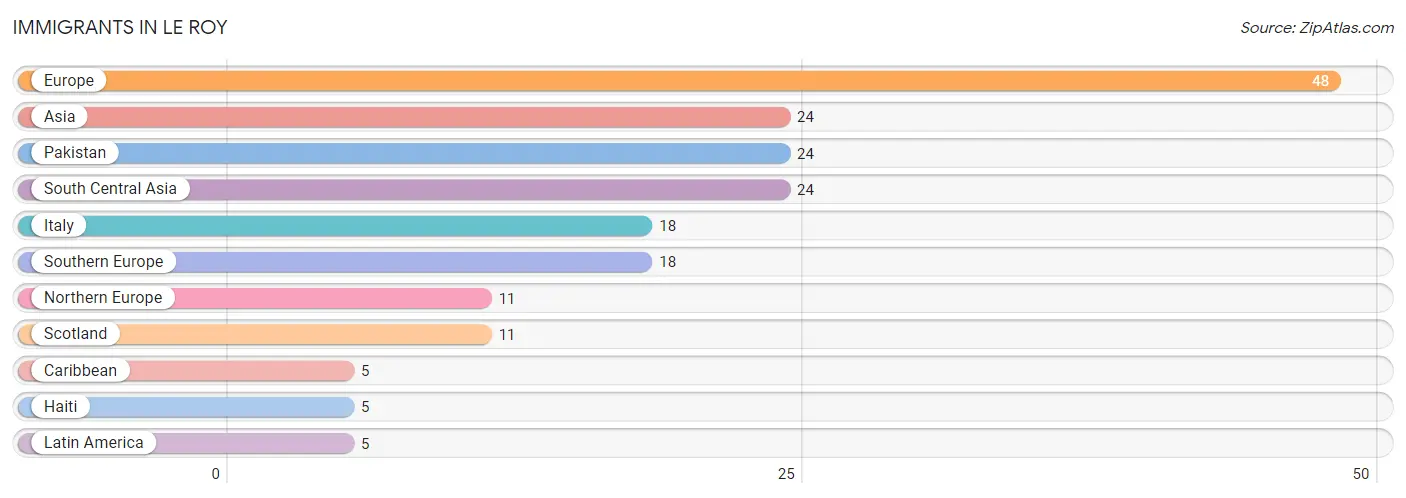
Immigrants in Le Roy
The most numerous immigrant groups reported in Le Roy came from Europe (48 | 1.1%), Asia (24 | 0.5%), Pakistan (24 | 0.5%), South Central Asia (24 | 0.5%), and Italy (18 | 0.4%), together accounting for 3.2% of all Le Roy residents.
| Immigration Origin | # Population | % Population |
| Asia | 24 | 0.5% |
| Caribbean | 5 | 0.1% |
| Europe | 48 | 1.1% |
| Haiti | 5 | 0.1% |
| Italy | 18 | 0.4% |
| Latin America | 5 | 0.1% |
| Northern Europe | 11 | 0.3% |
| Pakistan | 24 | 0.5% |
| Scotland | 11 | 0.3% |
| South Central Asia | 24 | 0.5% |
| Southern Europe | 18 | 0.4% | View All 11 Rows |
Sex and Age in Le Roy
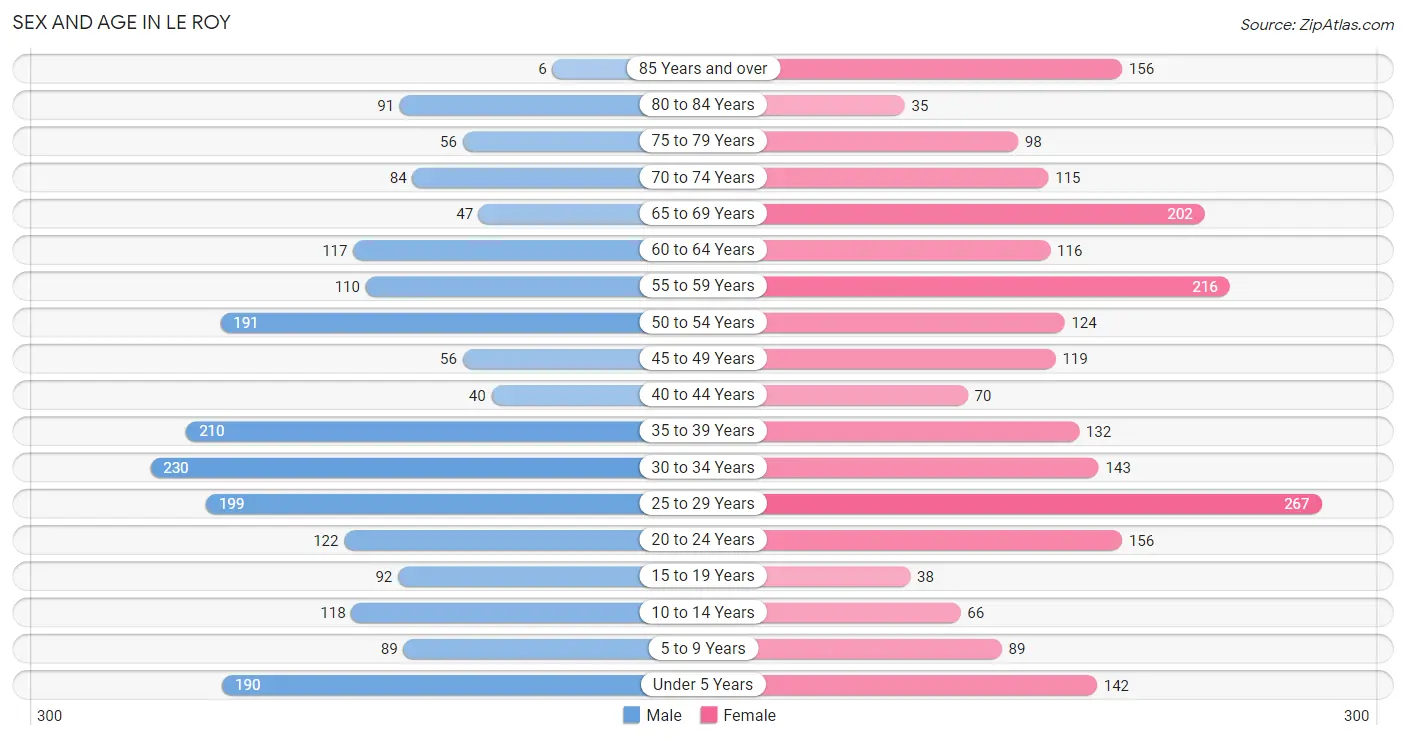
Sex and Age in Le Roy
The most populous age groups in Le Roy are 30 to 34 Years (230 | 11.2%) for men and 25 to 29 Years (267 | 11.7%) for women.
| Age Bracket | Male | Female |
| Under 5 Years | 190 (9.3%) | 142 (6.2%) |
| 5 to 9 Years | 89 (4.3%) | 89 (3.9%) |
| 10 to 14 Years | 118 (5.8%) | 66 (2.9%) |
| 15 to 19 Years | 92 (4.5%) | 38 (1.7%) |
| 20 to 24 Years | 122 (6.0%) | 156 (6.8%) |
| 25 to 29 Years | 199 (9.7%) | 267 (11.7%) |
| 30 to 34 Years | 230 (11.2%) | 143 (6.3%) |
| 35 to 39 Years | 210 (10.2%) | 132 (5.8%) |
| 40 to 44 Years | 40 (1.9%) | 70 (3.1%) |
| 45 to 49 Years | 56 (2.7%) | 119 (5.2%) |
| 50 to 54 Years | 191 (9.3%) | 124 (5.4%) |
| 55 to 59 Years | 110 (5.4%) | 216 (9.5%) |
| 60 to 64 Years | 117 (5.7%) | 116 (5.1%) |
| 65 to 69 Years | 47 (2.3%) | 202 (8.8%) |
| 70 to 74 Years | 84 (4.1%) | 115 (5.0%) |
| 75 to 79 Years | 56 (2.7%) | 98 (4.3%) |
| 80 to 84 Years | 91 (4.4%) | 35 (1.5%) |
| 85 Years and over | 6 (0.3%) | 156 (6.8%) |
| Total | 2,048 (100.0%) | 2,284 (100.0%) |
Families and Households in Le Roy
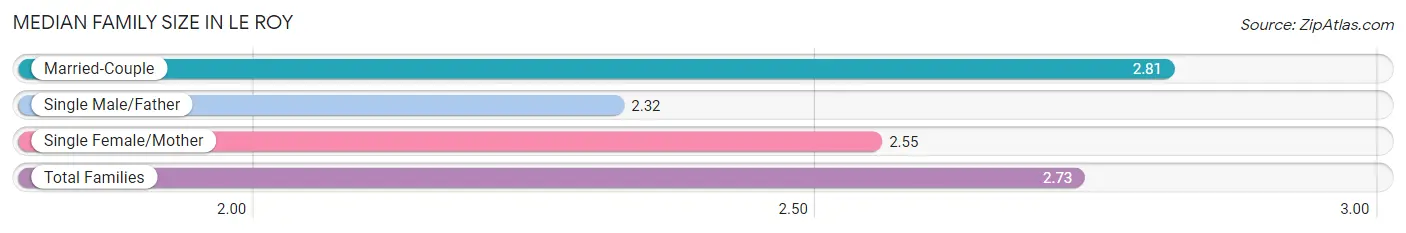
Median Family Size in Le Roy
The median family size in Le Roy is 2.73 persons per family, with married-couple families (780 | 72.6%) accounting for the largest median family size of 2.81 persons per family. On the other hand, single male/father families (22 | 2.1%) represent the smallest median family size with 2.32 persons per family.
| Family Type | # Families | Family Size |
| Married-Couple | 780 (72.6%) | 2.81 |
| Single Male/Father | 22 (2.1%) | 2.32 |
| Single Female/Mother | 273 (25.4%) | 2.55 |
| Total Families | 1,075 (100.0%) | 2.73 |
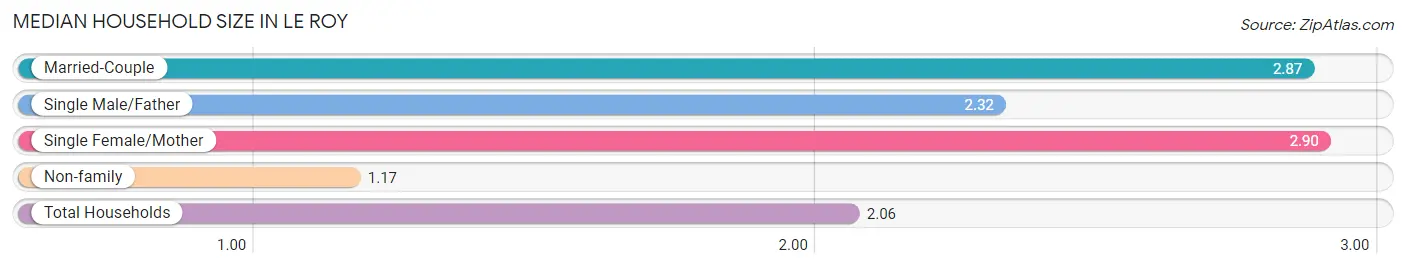
Median Household Size in Le Roy
The median household size in Le Roy is 2.06 persons per household, with single female/mother households (273 | 13.3%) accounting for the largest median household size of 2.9 persons per household. non-family households (980 | 47.7%) represent the smallest median household size with 1.17 persons per household.
| Household Type | # Households | Household Size |
| Married-Couple | 780 (38.0%) | 2.87 |
| Single Male/Father | 22 (1.1%) | 2.32 |
| Single Female/Mother | 273 (13.3%) | 2.90 |
| Non-family | 980 (47.7%) | 1.17 |
| Total Households | 2,055 (100.0%) | 2.06 |
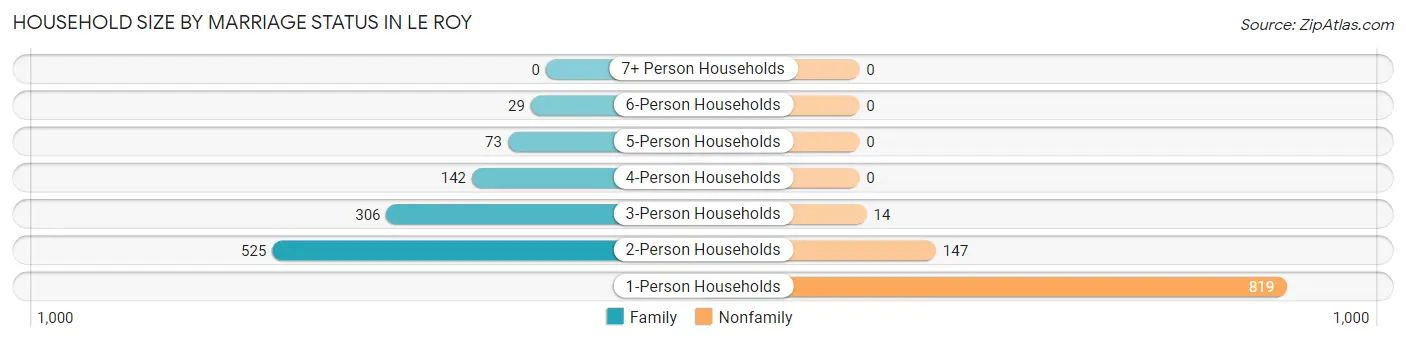
Household Size by Marriage Status in Le Roy
Out of a total of 2,055 households in Le Roy, 1,075 (52.3%) are family households, while 980 (47.7%) are nonfamily households. The most numerous type of family households are 2-person households, comprising 525, and the most common type of nonfamily households are 1-person households, comprising 819.
| Household Size | Family Households | Nonfamily Households |
| 1-Person Households | - | 819 (39.9%) |
| 2-Person Households | 525 (25.6%) | 147 (7.1%) |
| 3-Person Households | 306 (14.9%) | 14 (0.7%) |
| 4-Person Households | 142 (6.9%) | 0 (0.0%) |
| 5-Person Households | 73 (3.5%) | 0 (0.0%) |
| 6-Person Households | 29 (1.4%) | 0 (0.0%) |
| 7+ Person Households | 0 (0.0%) | 0 (0.0%) |
| Total | 1,075 (52.3%) | 980 (47.7%) |
Female Fertility in Le Roy
Fertility by Age in Le Roy
Average fertility rate in Le Roy is 29.0 births per 1,000 women. Women in the age bracket of 20 to 34 years have the highest fertility rate with 49.0 births per 1,000 women. Women in the age bracket of 20 to 34 years acount for 100.0% of all women with births.
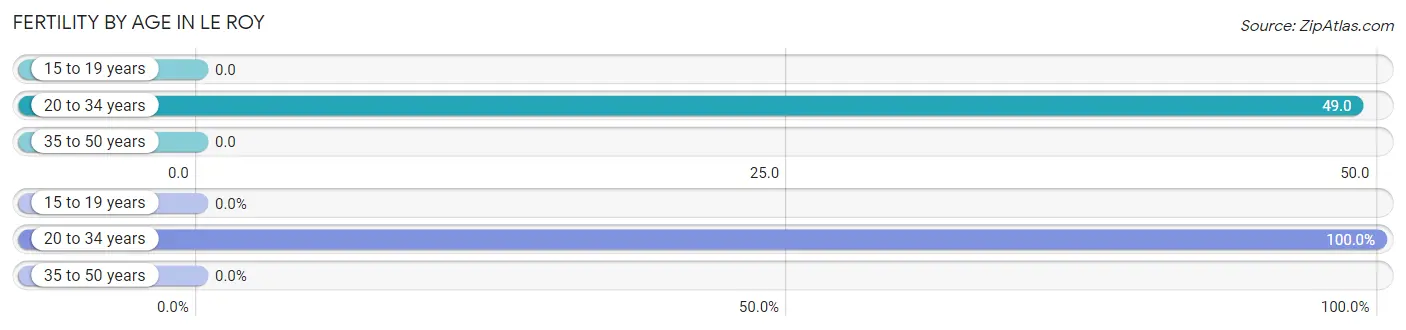
| Age Bracket | Women with Births | Births / 1,000 Women |
| 15 to 19 years | 0 (0.0%) | 0.0 |
| 20 to 34 years | 28 (100.0%) | 49.0 |
| 35 to 50 years | 0 (0.0%) | 0.0 |
| Total | 28 (100.0%) | 29.0 |
Fertility by Age by Marriage Status in Le Roy
67.9% of women with births (28) in Le Roy are married. The highest percentage of unmarried women with births falls into 20 to 34 years age bracket with 32.1% of them unmarried at the time of birth, while the lowest percentage of unmarried women with births belong to 20 to 34 years age bracket with 32.1% of them unmarried.
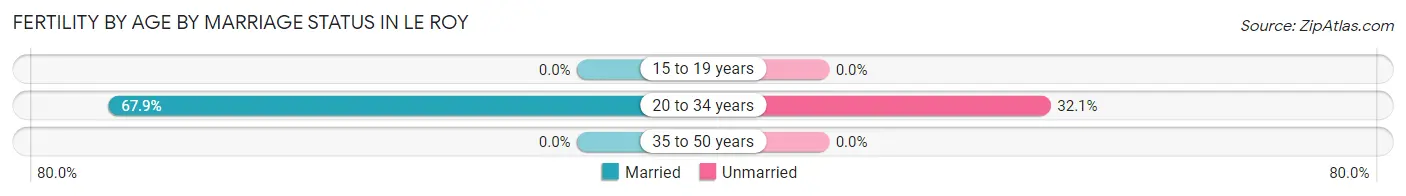
| Age Bracket | Married | Unmarried |
| 15 to 19 years | 0 (0.0%) | 0 (0.0%) |
| 20 to 34 years | 19 (67.9%) | 9 (32.1%) |
| 35 to 50 years | 0 (0.0%) | 0 (0.0%) |
| Total | 19 (67.9%) | 9 (32.1%) |
Fertility by Education in Le Roy
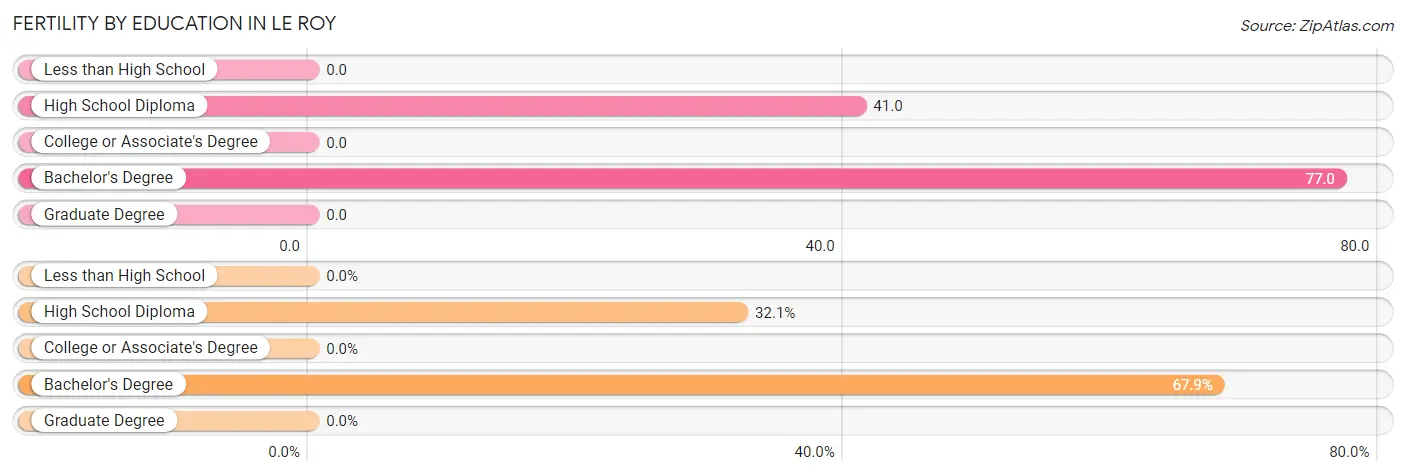
| Educational Attainment | Women with Births | Births / 1,000 Women |
| Less than High School | 0 (0.0%) | 0.0 |
| High School Diploma | 9 (32.1%) | 41.0 |
| College or Associate's Degree | 0 (0.0%) | 0.0 |
| Bachelor's Degree | 19 (67.9%) | 77.0 |
| Graduate Degree | 0 (0.0%) | 0.0 |
| Total | 28 (100.0%) | 29.0 |
Fertility by Education by Marriage Status in Le Roy
32.1% of women with births in Le Roy are unmarried. Women with the educational attainment of bachelor's degree are most likely to be married with 100.0% of them married at childbirth, while women with the educational attainment of high school diploma are least likely to be married with 100.0% of them unmarried at childbirth.
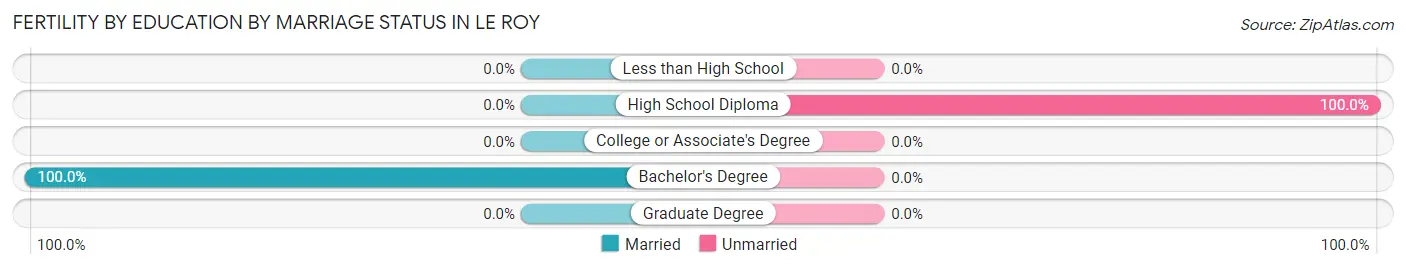
| Educational Attainment | Married | Unmarried |
| Less than High School | 0 (0.0%) | 0 (0.0%) |
| High School Diploma | 0 (0.0%) | 9 (100.0%) |
| College or Associate's Degree | 0 (0.0%) | 0 (0.0%) |
| Bachelor's Degree | 19 (100.0%) | 0 (0.0%) |
| Graduate Degree | 0 (0.0%) | 0 (0.0%) |
| Total | 19 (67.9%) | 9 (32.1%) |
Income in Le Roy
Income Overview in Le Roy
Per Capita Income in Le Roy is $37,971, while median incomes of families and households are $80,928 and $62,833 respectively.
| Characteristic | Number | Measure |
| Per Capita Income | 4,332 | $37,971 |
| Median Family Income | 1,075 | $80,928 |
| Mean Family Income | 1,075 | $108,311 |
| Median Household Income | 2,055 | $62,833 |
| Mean Household Income | 2,055 | $80,207 |
| Income Deficit | 1,075 | $0 |
| Wage / Income Gap (%) | 4,332 | 32.42% |
| Wage / Income Gap ($) | 4,332 | 67.58¢ per $1 |
| Gini / Inequality Index | 4,332 | 0.48 |
Earnings by Sex in Le Roy
Average Earnings in Le Roy are $42,204, $54,107 for men and $36,568 for women, a difference of 32.4%.
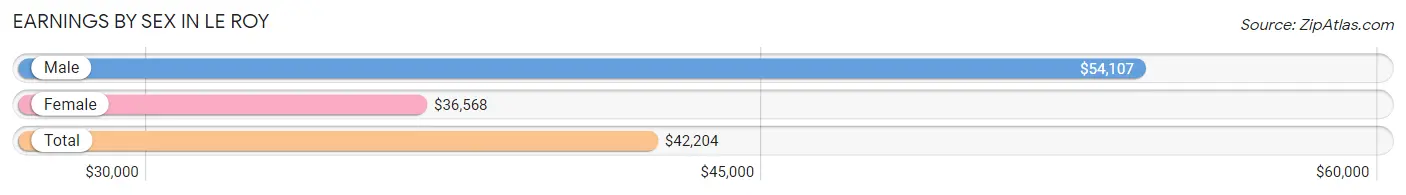
| Sex | Number | Average Earnings |
| Male | 1,161 (52.0%) | $54,107 |
| Female | 1,073 (48.0%) | $36,568 |
| Total | 2,234 (100.0%) | $42,204 |
Earnings by Sex by Income Bracket in Le Roy
The most common earnings brackets in Le Roy are $75,000 to $99,999 for men (197 | 17.0%) and $55,000 to $64,999 for women (153 | 14.3%).
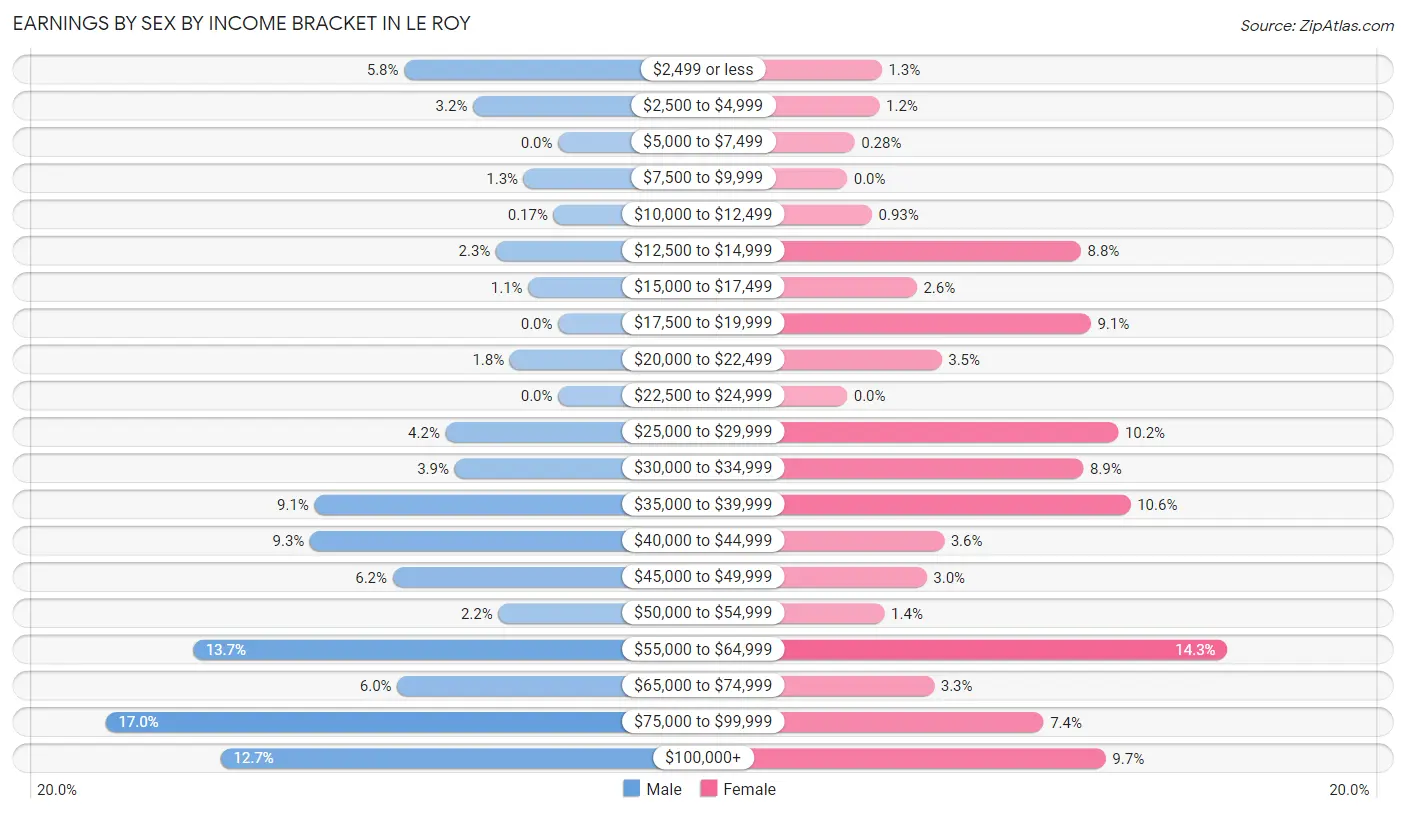
| Income | Male | Female |
| $2,499 or less | 67 (5.8%) | 14 (1.3%) |
| $2,500 to $4,999 | 37 (3.2%) | 13 (1.2%) |
| $5,000 to $7,499 | 0 (0.0%) | 3 (0.3%) |
| $7,500 to $9,999 | 15 (1.3%) | 0 (0.0%) |
| $10,000 to $12,499 | 2 (0.2%) | 10 (0.9%) |
| $12,500 to $14,999 | 27 (2.3%) | 94 (8.8%) |
| $15,000 to $17,499 | 13 (1.1%) | 28 (2.6%) |
| $17,500 to $19,999 | 0 (0.0%) | 98 (9.1%) |
| $20,000 to $22,499 | 21 (1.8%) | 38 (3.5%) |
| $22,500 to $24,999 | 0 (0.0%) | 0 (0.0%) |
| $25,000 to $29,999 | 49 (4.2%) | 109 (10.2%) |
| $30,000 to $34,999 | 45 (3.9%) | 95 (8.8%) |
| $35,000 to $39,999 | 106 (9.1%) | 114 (10.6%) |
| $40,000 to $44,999 | 108 (9.3%) | 39 (3.6%) |
| $45,000 to $49,999 | 72 (6.2%) | 32 (3.0%) |
| $50,000 to $54,999 | 26 (2.2%) | 15 (1.4%) |
| $55,000 to $64,999 | 159 (13.7%) | 153 (14.3%) |
| $65,000 to $74,999 | 70 (6.0%) | 35 (3.3%) |
| $75,000 to $99,999 | 197 (17.0%) | 79 (7.4%) |
| $100,000+ | 147 (12.7%) | 104 (9.7%) |
| Total | 1,161 (100.0%) | 1,073 (100.0%) |
Earnings by Sex by Educational Attainment in Le Roy
Average earnings in Le Roy are $62,425 for men and $39,936 for women, a difference of 36.0%. Men with an educational attainment of bachelor's degree enjoy the highest average annual earnings of $77,351, while those with college or associate's degree education earn the least with $41,968. Women with an educational attainment of graduate degree earn the most with the average annual earnings of $69,712, while those with high school diploma education have the smallest earnings of $31,518.
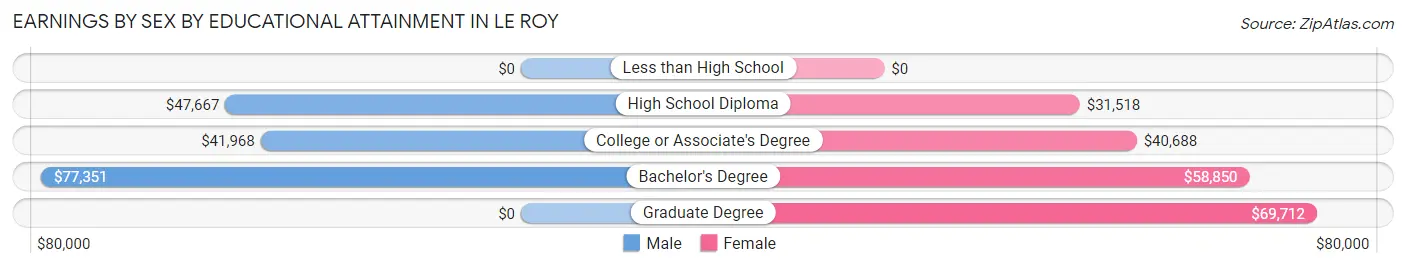
| Educational Attainment | Male Income | Female Income |
| Less than High School | - | - |
| High School Diploma | $47,667 | $31,518 |
| College or Associate's Degree | $41,968 | $40,688 |
| Bachelor's Degree | $77,351 | $58,850 |
| Graduate Degree | - | - |
| Total | $62,425 | $39,936 |
Family Income in Le Roy
Family Income Brackets in Le Roy
According to the Le Roy family income data, there are 245 families falling into the $75,000 to $99,999 income range, which is the most common income bracket and makes up 22.8% of all families. Conversely, the $15,000 to $24,999 income bracket is the least frequent group with only 17 families (1.6%) belonging to this category.
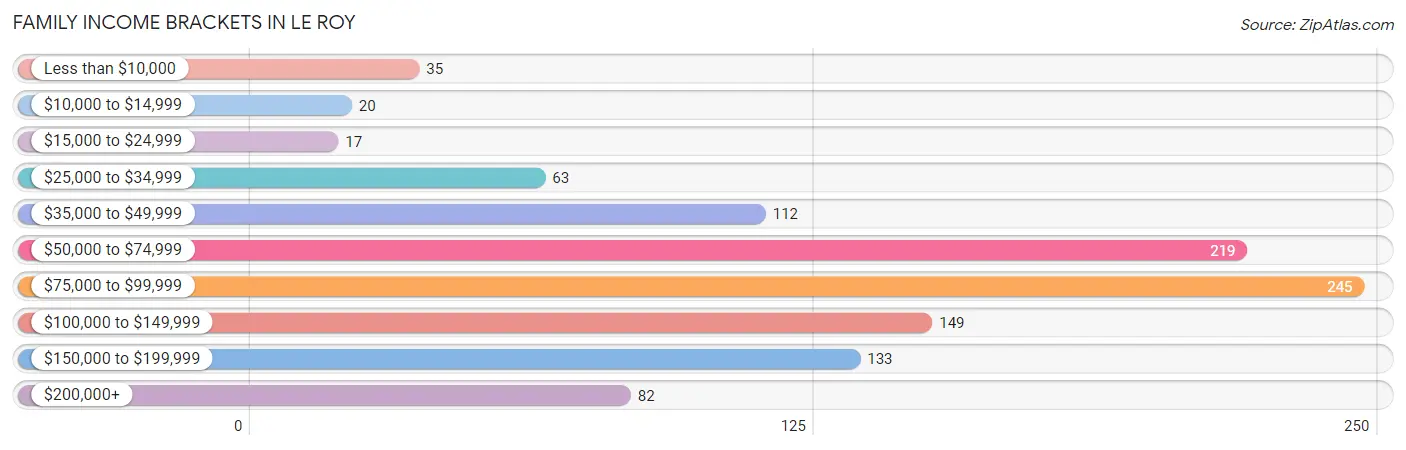
| Income Bracket | # Families | % Families |
| Less than $10,000 | 35 | 3.3% |
| $10,000 to $14,999 | 20 | 1.9% |
| $15,000 to $24,999 | 17 | 1.6% |
| $25,000 to $34,999 | 63 | 5.9% |
| $35,000 to $49,999 | 112 | 10.4% |
| $50,000 to $74,999 | 219 | 20.4% |
| $75,000 to $99,999 | 245 | 22.8% |
| $100,000 to $149,999 | 149 | 13.9% |
| $150,000 to $199,999 | 133 | 12.4% |
| $200,000+ | 82 | 7.6% |
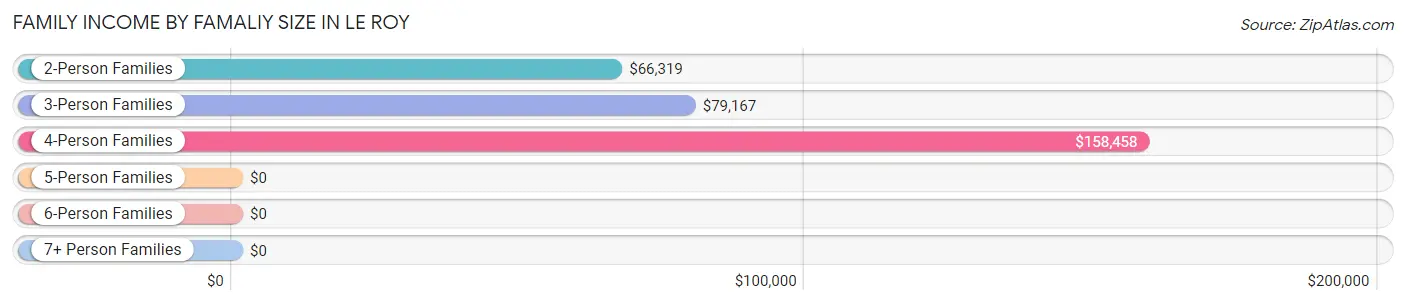
Family Income by Famaliy Size in Le Roy
4-person families (119 | 11.1%) account for the highest median family income in Le Roy with $158,458 per family, while 4-person families (119 | 11.1%) have the highest median income of $39,614 per family member.
| Income Bracket | # Families | Median Income |
| 2-Person Families | 594 (55.3%) | $66,319 |
| 3-Person Families | 276 (25.7%) | $79,167 |
| 4-Person Families | 119 (11.1%) | $158,458 |
| 5-Person Families | 71 (6.6%) | $0 |
| 6-Person Families | 15 (1.4%) | $0 |
| 7+ Person Families | 0 (0.0%) | $0 |
| Total | 1,075 (100.0%) | $80,928 |
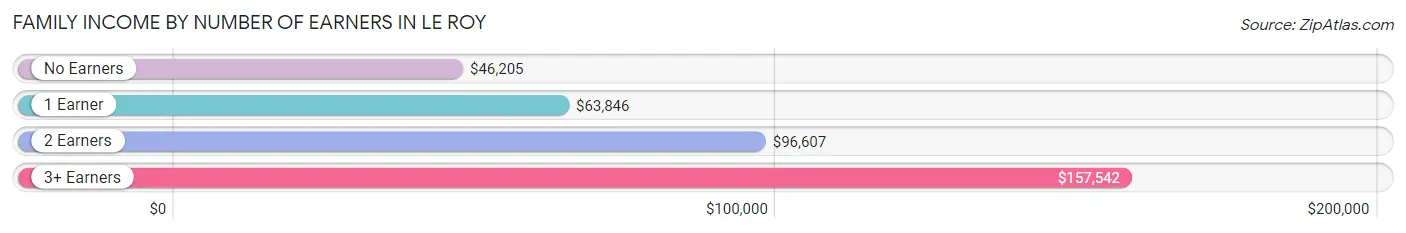
Family Income by Number of Earners in Le Roy
The median family income in Le Roy is $80,928, with families comprising 3+ earners (121) having the highest median family income of $157,542, while families with no earners (167) have the lowest median family income of $46,205, accounting for 11.3% and 15.5% of families, respectively.
| Number of Earners | # Families | Median Income |
| No Earners | 167 (15.5%) | $46,205 |
| 1 Earner | 394 (36.6%) | $63,846 |
| 2 Earners | 393 (36.6%) | $96,607 |
| 3+ Earners | 121 (11.3%) | $157,542 |
| Total | 1,075 (100.0%) | $80,928 |
Household Income in Le Roy
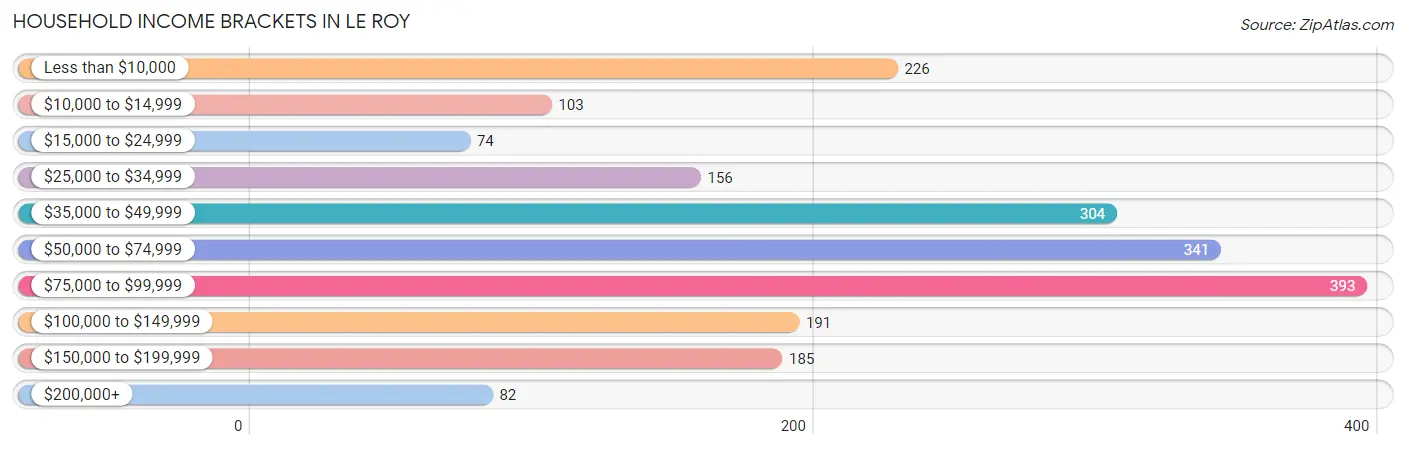
Household Income Brackets in Le Roy
With 393 households falling in the category, the $75,000 to $99,999 income range is the most frequent in Le Roy, accounting for 19.1% of all households. In contrast, only 74 households (3.6%) fall into the $15,000 to $24,999 income bracket, making it the least populous group.
| Income Bracket | # Households | % Households |
| Less than $10,000 | 226 | 11.0% |
| $10,000 to $14,999 | 103 | 5.0% |
| $15,000 to $24,999 | 74 | 3.6% |
| $25,000 to $34,999 | 156 | 7.6% |
| $35,000 to $49,999 | 304 | 14.8% |
| $50,000 to $74,999 | 341 | 16.6% |
| $75,000 to $99,999 | 393 | 19.1% |
| $100,000 to $149,999 | 191 | 9.3% |
| $150,000 to $199,999 | 185 | 9.0% |
| $200,000+ | 82 | 4.0% |
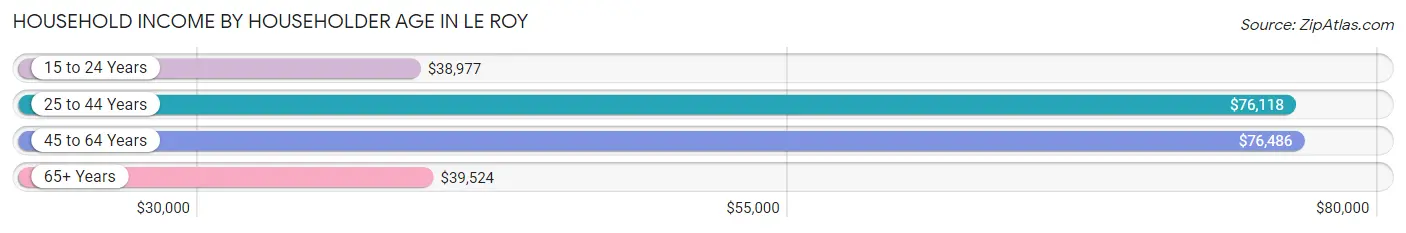
Household Income by Householder Age in Le Roy
The median household income in Le Roy is $62,833, with the highest median household income of $76,486 found in the 45 to 64 years age bracket for the primary householder. A total of 719 households (35.0%) fall into this category. Meanwhile, the 15 to 24 years age bracket for the primary householder has the lowest median household income of $38,977, with 69 households (3.4%) in this group.
| Income Bracket | # Households | Median Income |
| 15 to 24 Years | 69 (3.4%) | $38,977 |
| 25 to 44 Years | 619 (30.1%) | $76,118 |
| 45 to 64 Years | 719 (35.0%) | $76,486 |
| 65+ Years | 648 (31.5%) | $39,524 |
| Total | 2,055 (100.0%) | $62,833 |
Poverty in Le Roy
Income Below Poverty by Sex and Age in Le Roy
With 14.1% poverty level for males and 13.7% for females among the residents of Le Roy, 45 to 54 year old males and 65 to 74 year old females are the most vulnerable to poverty, with 98 males (39.7%) and 115 females (38.2%) in their respective age groups living below the poverty level.
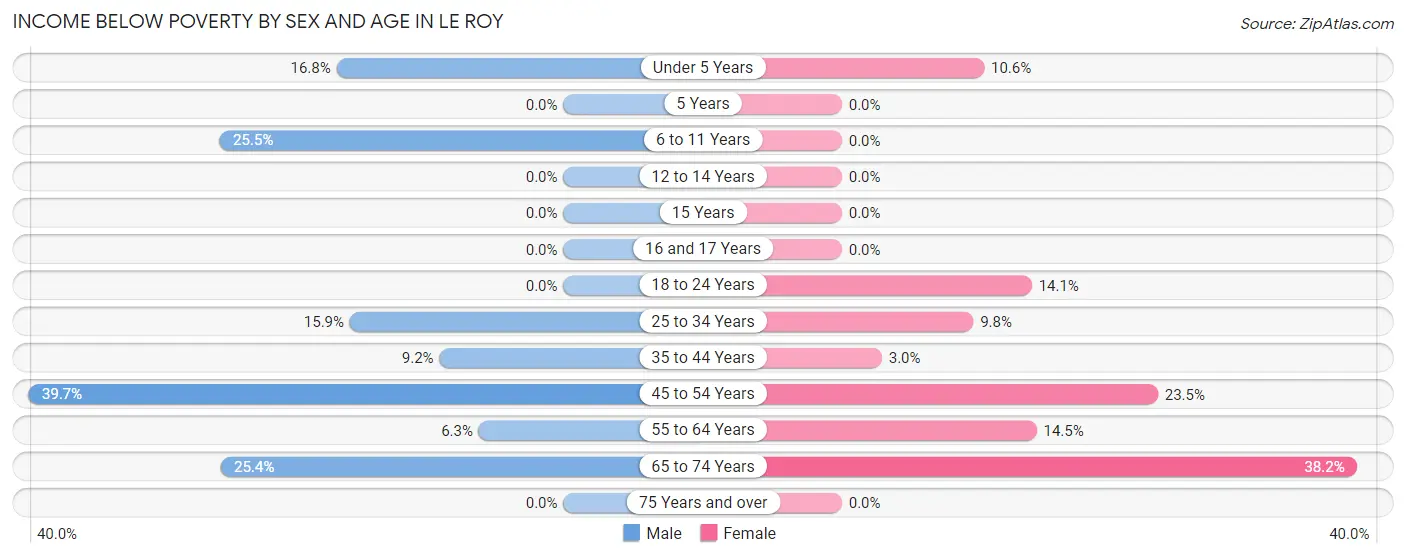
| Age Bracket | Male | Female |
| Under 5 Years | 32 (16.8%) | 15 (10.6%) |
| 5 Years | 0 (0.0%) | 0 (0.0%) |
| 6 to 11 Years | 13 (25.5%) | 0 (0.0%) |
| 12 to 14 Years | 0 (0.0%) | 0 (0.0%) |
| 15 Years | 0 (0.0%) | 0 (0.0%) |
| 16 and 17 Years | 0 (0.0%) | 0 (0.0%) |
| 18 to 24 Years | 0 (0.0%) | 22 (14.1%) |
| 25 to 34 Years | 68 (15.9%) | 40 (9.8%) |
| 35 to 44 Years | 23 (9.2%) | 6 (3.0%) |
| 45 to 54 Years | 98 (39.7%) | 57 (23.5%) |
| 55 to 64 Years | 14 (6.3%) | 48 (14.5%) |
| 65 to 74 Years | 31 (25.4%) | 115 (38.2%) |
| 75 Years and over | 0 (0.0%) | 0 (0.0%) |
| Total | 279 (14.1%) | 303 (13.7%) |
Income Above Poverty by Sex and Age in Le Roy
According to the poverty statistics in Le Roy, males aged 12 to 14 years and females aged 5 years are the age groups that are most secure financially, with 100.0% of males and 100.0% of females in these age groups living above the poverty line.
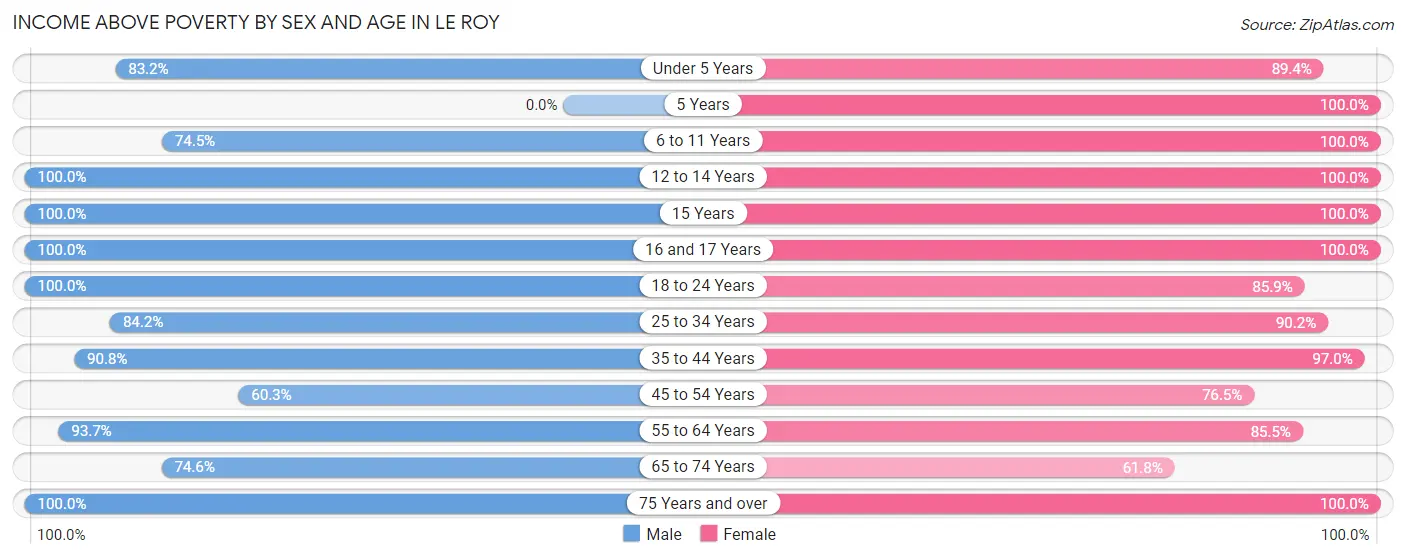
| Age Bracket | Male | Female |
| Under 5 Years | 158 (83.2%) | 127 (89.4%) |
| 5 Years | 0 (0.0%) | 62 (100.0%) |
| 6 to 11 Years | 38 (74.5%) | 57 (100.0%) |
| 12 to 14 Years | 118 (100.0%) | 18 (100.0%) |
| 15 Years | 24 (100.0%) | 25 (100.0%) |
| 16 and 17 Years | 51 (100.0%) | 13 (100.0%) |
| 18 to 24 Years | 139 (100.0%) | 134 (85.9%) |
| 25 to 34 Years | 361 (84.2%) | 370 (90.2%) |
| 35 to 44 Years | 227 (90.8%) | 196 (97.0%) |
| 45 to 54 Years | 149 (60.3%) | 186 (76.5%) |
| 55 to 64 Years | 209 (93.7%) | 284 (85.5%) |
| 65 to 74 Years | 91 (74.6%) | 186 (61.8%) |
| 75 Years and over | 129 (100.0%) | 258 (100.0%) |
| Total | 1,694 (85.9%) | 1,916 (86.4%) |
Income Below Poverty Among Married-Couple Families in Le Roy
The poverty statistics for married-couple families in Le Roy show that 1.8% or 14 of the total 780 families live below the poverty line. Families with 1 or 2 children have the highest poverty rate of 4.9%, comprising of 14 families. On the other hand, families with no children have the lowest poverty rate of 0.0%, which includes 0 families.
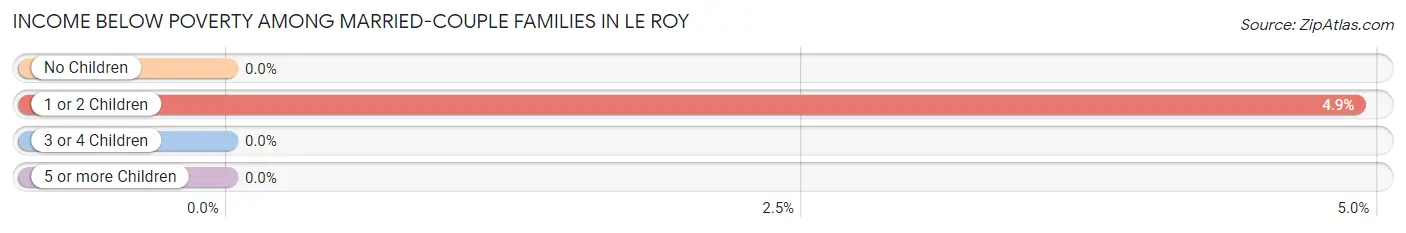
| Children | Above Poverty | Below Poverty |
| No Children | 437 (100.0%) | 0 (0.0%) |
| 1 or 2 Children | 271 (95.1%) | 14 (4.9%) |
| 3 or 4 Children | 58 (100.0%) | 0 (0.0%) |
| 5 or more Children | 0 (0.0%) | 0 (0.0%) |
| Total | 766 (98.2%) | 14 (1.8%) |
Income Below Poverty Among Single-Parent Households in Le Roy
According to the poverty data in Le Roy, 63.6% or 14 single-father households and 15.0% or 41 single-mother households are living below the poverty line. Among single-father households, those with no children have the highest poverty rate, with 14 households (66.7%) experiencing poverty. Likewise, among single-mother households, those with 1 or 2 children have the highest poverty rate, with 21 households (16.5%) falling below the poverty line.
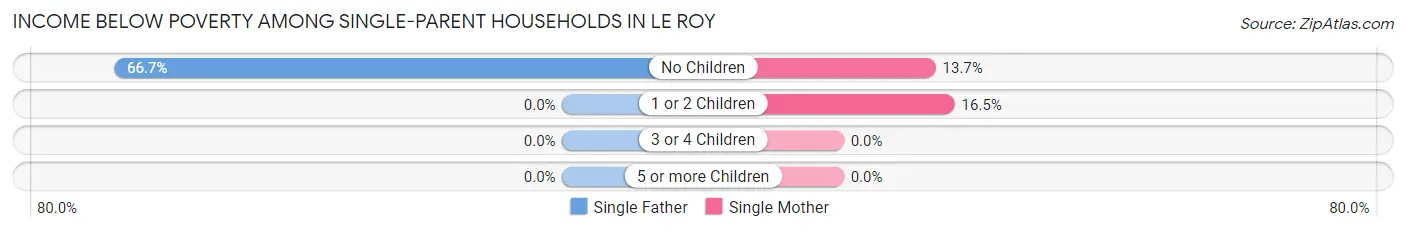
| Children | Single Father | Single Mother |
| No Children | 14 (66.7%) | 20 (13.7%) |
| 1 or 2 Children | 0 (0.0%) | 21 (16.5%) |
| 3 or 4 Children | 0 (0.0%) | 0 (0.0%) |
| 5 or more Children | 0 (0.0%) | 0 (0.0%) |
| Total | 14 (63.6%) | 41 (15.0%) |
Income Below Poverty Among Married-Couple vs Single-Parent Households in Le Roy
The poverty data for Le Roy shows that 14 of the married-couple family households (1.8%) and 55 of the single-parent households (18.6%) are living below the poverty level. Within the married-couple family households, those with 1 or 2 children have the highest poverty rate, with 14 households (4.9%) falling below the poverty line. Among the single-parent households, those with no children have the highest poverty rate, with 34 household (20.4%) living below poverty.
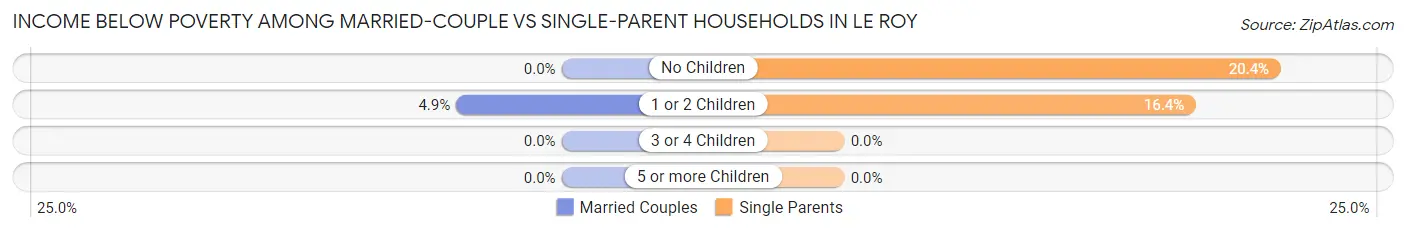
| Children | Married-Couple Families | Single-Parent Households |
| No Children | 0 (0.0%) | 34 (20.4%) |
| 1 or 2 Children | 14 (4.9%) | 21 (16.4%) |
| 3 or 4 Children | 0 (0.0%) | 0 (0.0%) |
| 5 or more Children | 0 (0.0%) | 0 (0.0%) |
| Total | 14 (1.8%) | 55 (18.6%) |
Employment Characteristics in Le Roy
Employment by Class of Employer in Le Roy
Among the 2,105 employed individuals in Le Roy, private company employees (1,439 | 68.4%), not-for-profit organizations (222 | 10.5%), and local government employees (184 | 8.7%) make up the most common classes of employment.
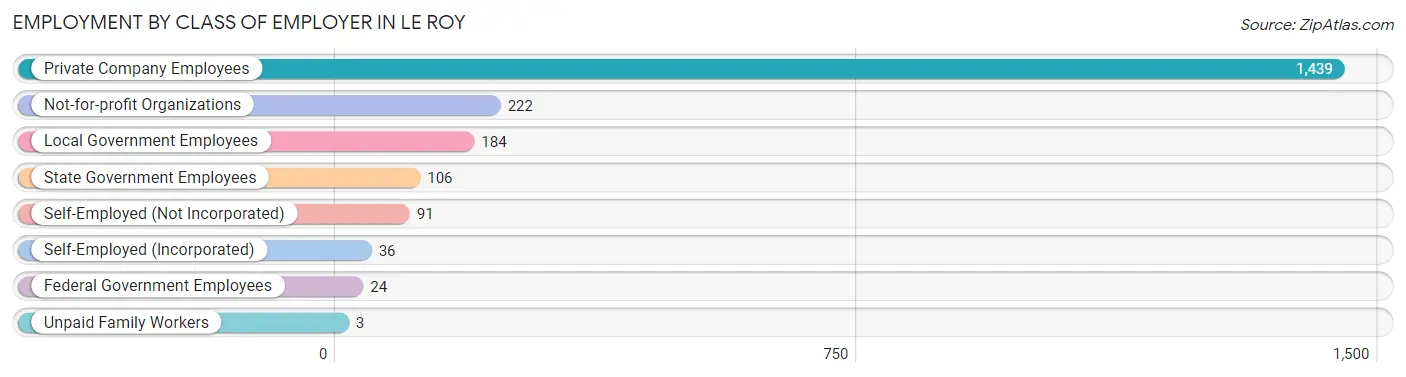
| Employer Class | # Employees | % Employees |
| Private Company Employees | 1,439 | 68.4% |
| Self-Employed (Incorporated) | 36 | 1.7% |
| Self-Employed (Not Incorporated) | 91 | 4.3% |
| Not-for-profit Organizations | 222 | 10.5% |
| Local Government Employees | 184 | 8.7% |
| State Government Employees | 106 | 5.0% |
| Federal Government Employees | 24 | 1.1% |
| Unpaid Family Workers | 3 | 0.1% |
| Total | 2,105 | 100.0% |
Employment Status by Age in Le Roy
According to the labor force statistics for Le Roy, out of the total population over 16 years of age (3,589), 60.2% or 2,161 individuals are in the labor force, with 1.9% or 41 of them unemployed. The age group with the highest labor force participation rate is 20 to 24 years, with 100.0% or 278 individuals in the labor force. Within the labor force, the 35 to 44 years age range has the highest percentage of unemployed individuals, with 6.9% or 25 of them being unemployed.
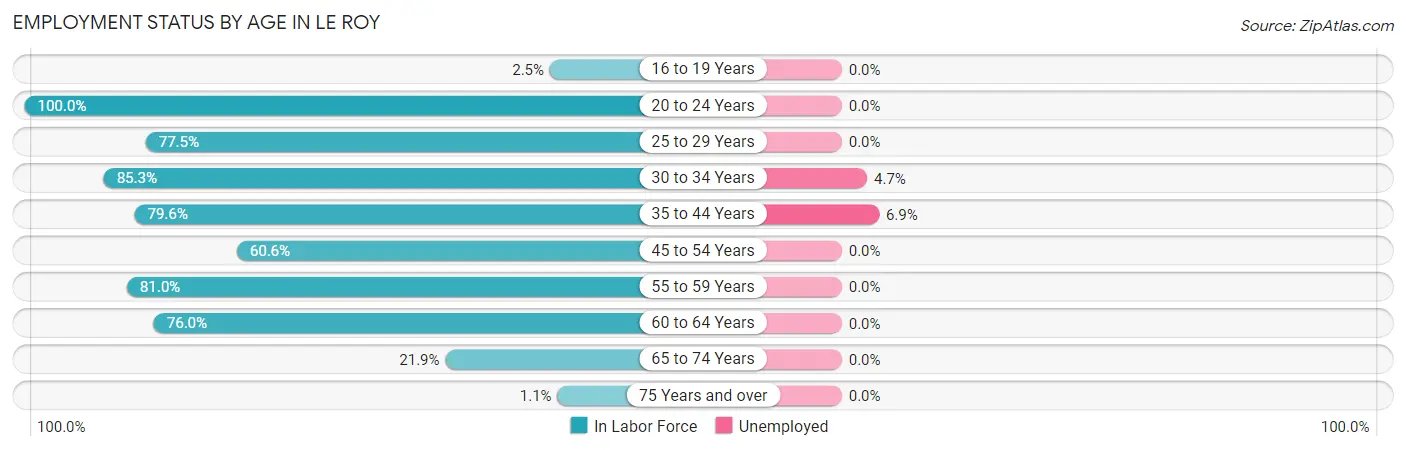
| Age Bracket | In Labor Force | Unemployed |
| 16 to 19 Years | 2 (2.5%) | 0 (0.0%) |
| 20 to 24 Years | 278 (100.0%) | 0 (0.0%) |
| 25 to 29 Years | 361 (77.5%) | 0 (0.0%) |
| 30 to 34 Years | 318 (85.3%) | 15 (4.7%) |
| 35 to 44 Years | 360 (79.6%) | 25 (6.9%) |
| 45 to 54 Years | 297 (60.6%) | 0 (0.0%) |
| 55 to 59 Years | 264 (81.0%) | 0 (0.0%) |
| 60 to 64 Years | 177 (76.0%) | 0 (0.0%) |
| 65 to 74 Years | 98 (21.9%) | 0 (0.0%) |
| 75 Years and over | 5 (1.1%) | 0 (0.0%) |
| Total | 2,161 (60.2%) | 41 (1.9%) |
Employment Status by Educational Attainment in Le Roy
According to labor force statistics for Le Roy, 75.9% of individuals (1,776) out of the total population between 25 and 64 years of age (2,340) are in the labor force, with 2.3% or 41 of them being unemployed. The group with the highest labor force participation rate are those with the educational attainment of bachelor's degree or higher, with 87.6% or 739 individuals in the labor force. Within the labor force, individuals with bachelor's degree or higher education have the highest percentage of unemployment, with 4.2% or 31 of them being unemployed.
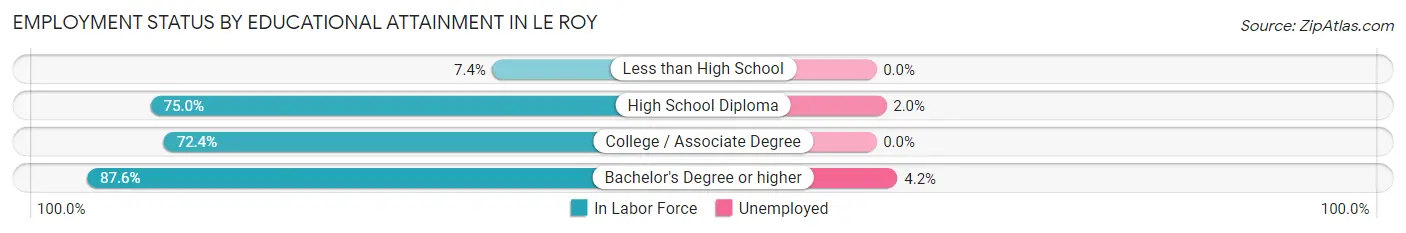
| Educational Attainment | In Labor Force | Unemployed |
| Less than High School | 7 (7.4%) | 0 (0.0%) |
| High School Diploma | 459 (75.0%) | 12 (2.0%) |
| College / Associate Degree | 572 (72.4%) | 0 (0.0%) |
| Bachelor's Degree or higher | 739 (87.6%) | 35 (4.2%) |
| Total | 1,776 (75.9%) | 54 (2.3%) |
Employment Occupations by Sex in Le Roy
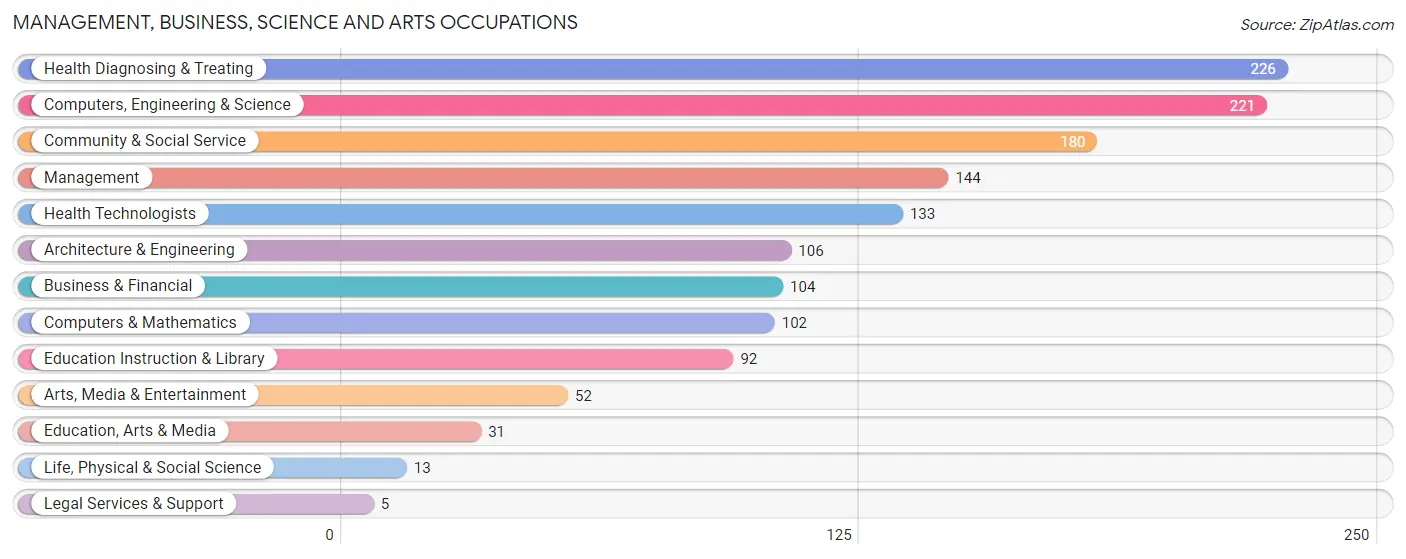
Management, Business, Science and Arts Occupations
The most common Management, Business, Science and Arts occupations in Le Roy are Health Diagnosing & Treating (226 | 10.7%), Computers, Engineering & Science (221 | 10.4%), Community & Social Service (180 | 8.5%), Management (144 | 6.8%), and Health Technologists (133 | 6.3%).
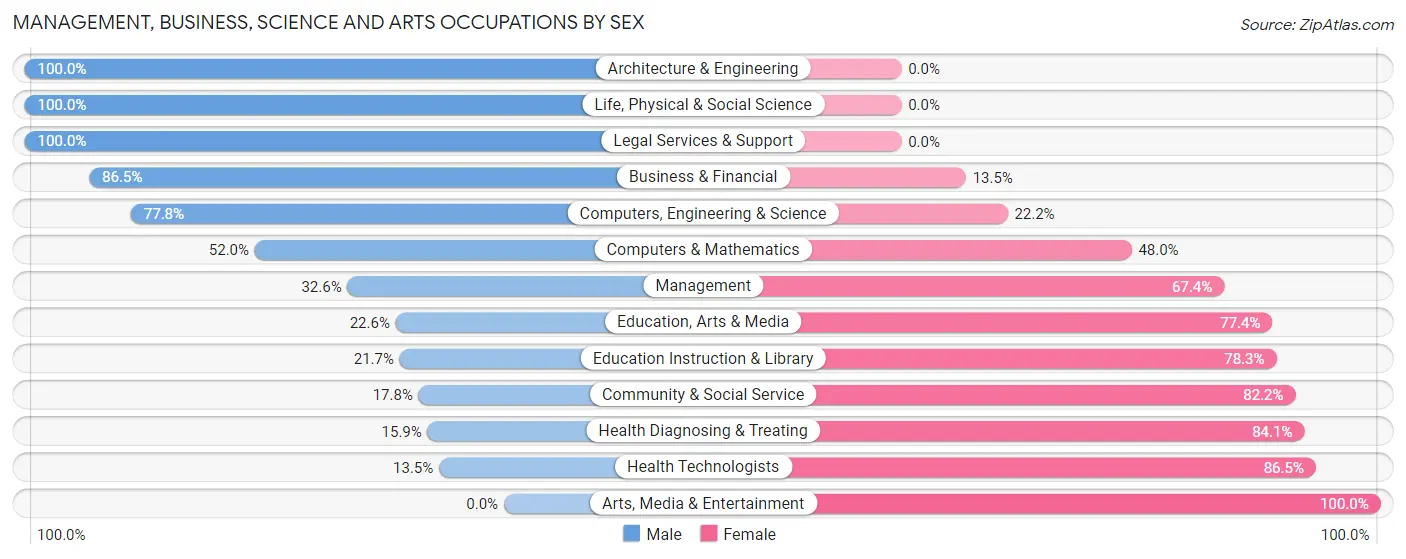
Management, Business, Science and Arts Occupations by Sex
Within the Management, Business, Science and Arts occupations in Le Roy, the most male-oriented occupations are Architecture & Engineering (100.0%), Life, Physical & Social Science (100.0%), and Legal Services & Support (100.0%), while the most female-oriented occupations are Arts, Media & Entertainment (100.0%), Health Technologists (86.5%), and Health Diagnosing & Treating (84.1%).
| Occupation | Male | Female |
| Management | 47 (32.6%) | 97 (67.4%) |
| Business & Financial | 90 (86.5%) | 14 (13.5%) |
| Computers, Engineering & Science | 172 (77.8%) | 49 (22.2%) |
| Computers & Mathematics | 53 (52.0%) | 49 (48.0%) |
| Architecture & Engineering | 106 (100.0%) | 0 (0.0%) |
| Life, Physical & Social Science | 13 (100.0%) | 0 (0.0%) |
| Community & Social Service | 32 (17.8%) | 148 (82.2%) |
| Education, Arts & Media | 7 (22.6%) | 24 (77.4%) |
| Legal Services & Support | 5 (100.0%) | 0 (0.0%) |
| Education Instruction & Library | 20 (21.7%) | 72 (78.3%) |
| Arts, Media & Entertainment | 0 (0.0%) | 52 (100.0%) |
| Health Diagnosing & Treating | 36 (15.9%) | 190 (84.1%) |
| Health Technologists | 18 (13.5%) | 115 (86.5%) |
| Total (Category) | 377 (43.1%) | 498 (56.9%) |
| Total (Overall) | 1,070 (50.5%) | 1,050 (49.5%) |
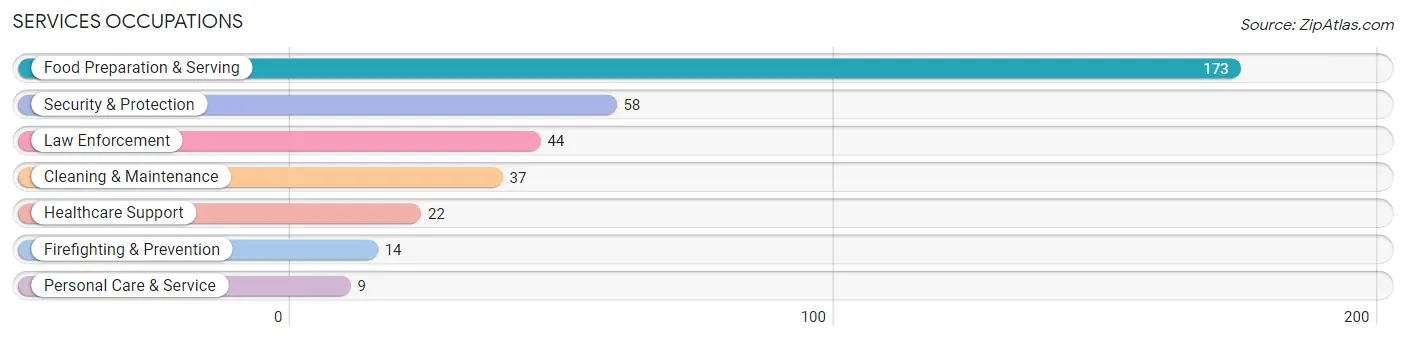
Services Occupations
The most common Services occupations in Le Roy are Food Preparation & Serving (173 | 8.2%), Security & Protection (58 | 2.7%), Law Enforcement (44 | 2.1%), Cleaning & Maintenance (37 | 1.8%), and Healthcare Support (22 | 1.0%).
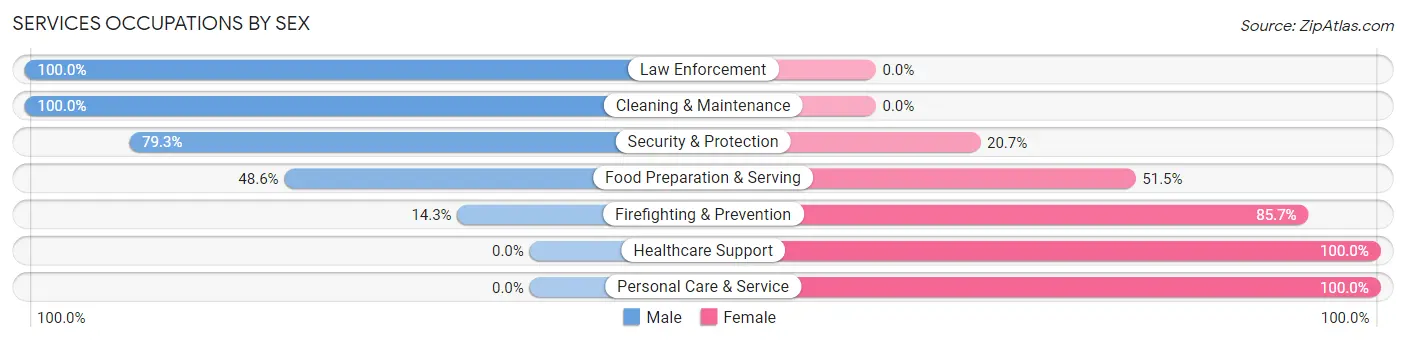
Services Occupations by Sex
Within the Services occupations in Le Roy, the most male-oriented occupations are Law Enforcement (100.0%), Cleaning & Maintenance (100.0%), and Security & Protection (79.3%), while the most female-oriented occupations are Healthcare Support (100.0%), Personal Care & Service (100.0%), and Firefighting & Prevention (85.7%).
| Occupation | Male | Female |
| Healthcare Support | 0 (0.0%) | 22 (100.0%) |
| Security & Protection | 46 (79.3%) | 12 (20.7%) |
| Firefighting & Prevention | 2 (14.3%) | 12 (85.7%) |
| Law Enforcement | 44 (100.0%) | 0 (0.0%) |
| Food Preparation & Serving | 84 (48.5%) | 89 (51.4%) |
| Cleaning & Maintenance | 37 (100.0%) | 0 (0.0%) |
| Personal Care & Service | 0 (0.0%) | 9 (100.0%) |
| Total (Category) | 167 (55.8%) | 132 (44.2%) |
| Total (Overall) | 1,070 (50.5%) | 1,050 (49.5%) |
Sales and Office Occupations
The most common Sales and Office occupations in Le Roy are Sales & Related (282 | 13.3%), and Office & Administration (201 | 9.5%).

Sales and Office Occupations by Sex
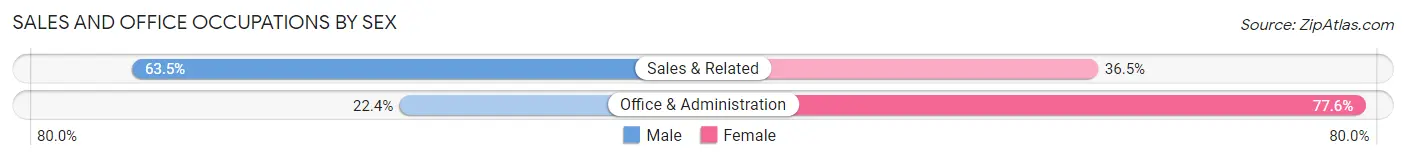
| Occupation | Male | Female |
| Sales & Related | 179 (63.5%) | 103 (36.5%) |
| Office & Administration | 45 (22.4%) | 156 (77.6%) |
| Total (Category) | 224 (46.4%) | 259 (53.6%) |
| Total (Overall) | 1,070 (50.5%) | 1,050 (49.5%) |
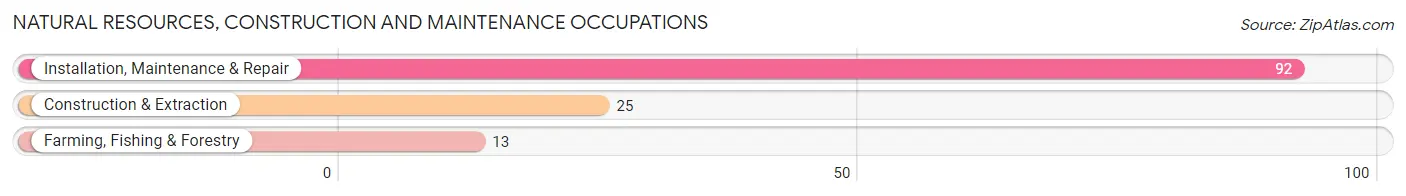
Natural Resources, Construction and Maintenance Occupations
The most common Natural Resources, Construction and Maintenance occupations in Le Roy are Installation, Maintenance & Repair (92 | 4.3%), Construction & Extraction (25 | 1.2%), and Farming, Fishing & Forestry (13 | 0.6%).
Natural Resources, Construction and Maintenance Occupations by Sex
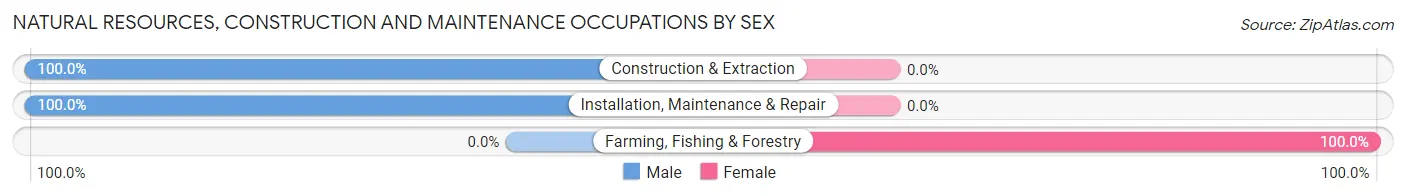
| Occupation | Male | Female |
| Farming, Fishing & Forestry | 0 (0.0%) | 13 (100.0%) |
| Construction & Extraction | 25 (100.0%) | 0 (0.0%) |
| Installation, Maintenance & Repair | 92 (100.0%) | 0 (0.0%) |
| Total (Category) | 117 (90.0%) | 13 (10.0%) |
| Total (Overall) | 1,070 (50.5%) | 1,050 (49.5%) |
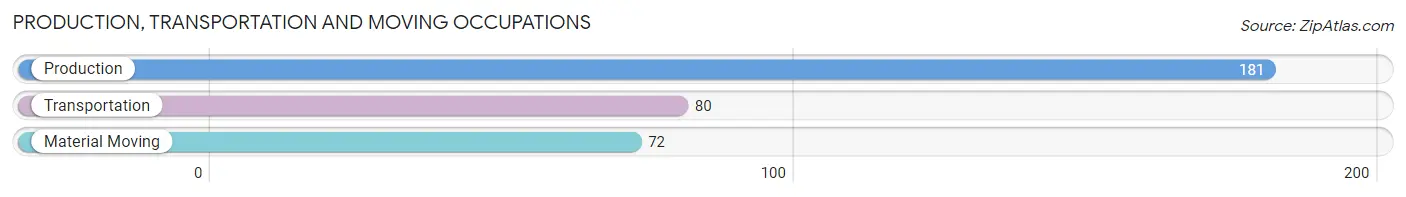
Production, Transportation and Moving Occupations
The most common Production, Transportation and Moving occupations in Le Roy are Production (181 | 8.5%), Transportation (80 | 3.8%), and Material Moving (72 | 3.4%).
Production, Transportation and Moving Occupations by Sex
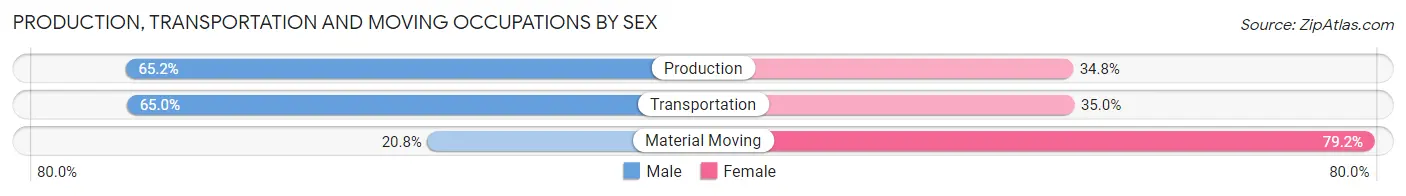
| Occupation | Male | Female |
| Production | 118 (65.2%) | 63 (34.8%) |
| Transportation | 52 (65.0%) | 28 (35.0%) |
| Material Moving | 15 (20.8%) | 57 (79.2%) |
| Total (Category) | 185 (55.6%) | 148 (44.4%) |
| Total (Overall) | 1,070 (50.5%) | 1,050 (49.5%) |
Employment Industries by Sex in Le Roy
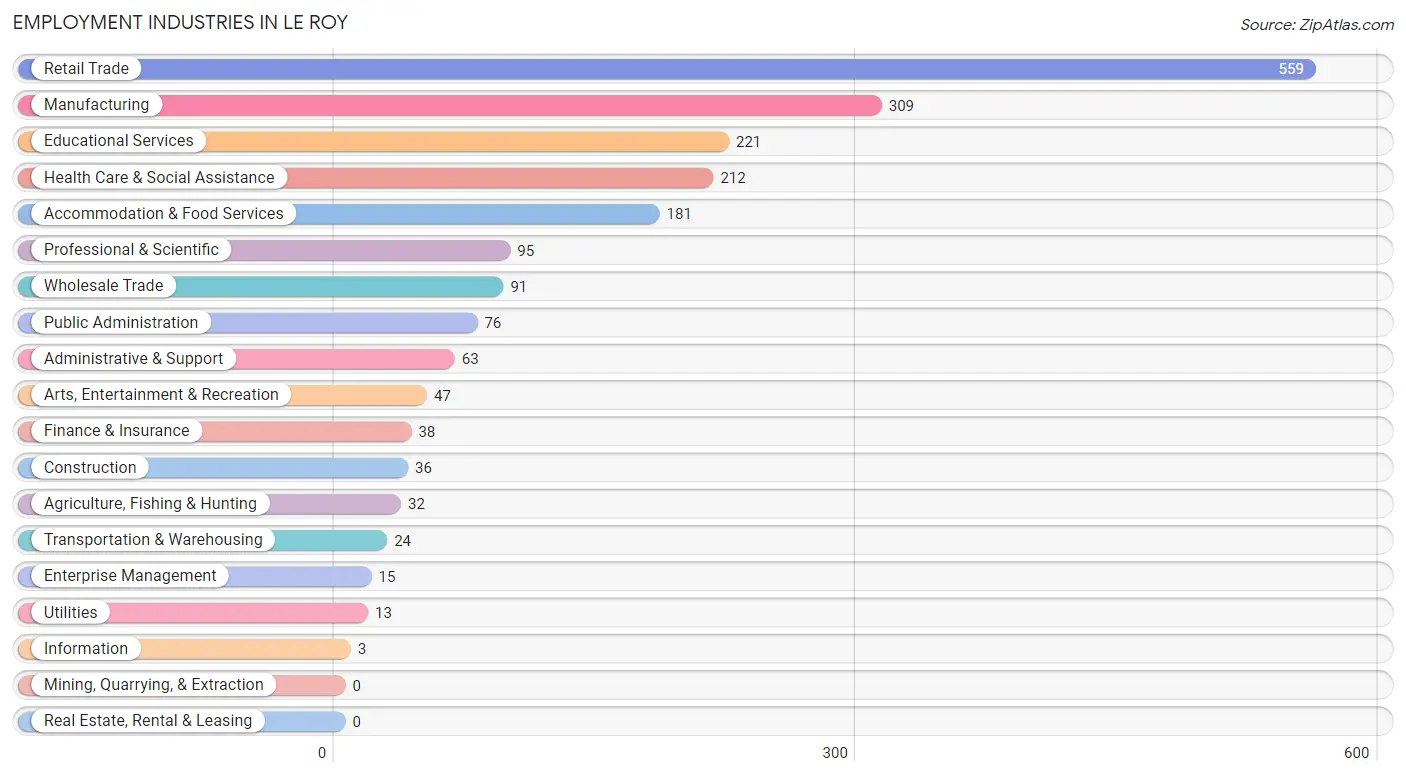
Employment Industries in Le Roy
The major employment industries in Le Roy include Retail Trade (559 | 26.4%), Manufacturing (309 | 14.6%), Educational Services (221 | 10.4%), Health Care & Social Assistance (212 | 10.0%), and Accommodation & Food Services (181 | 8.5%).
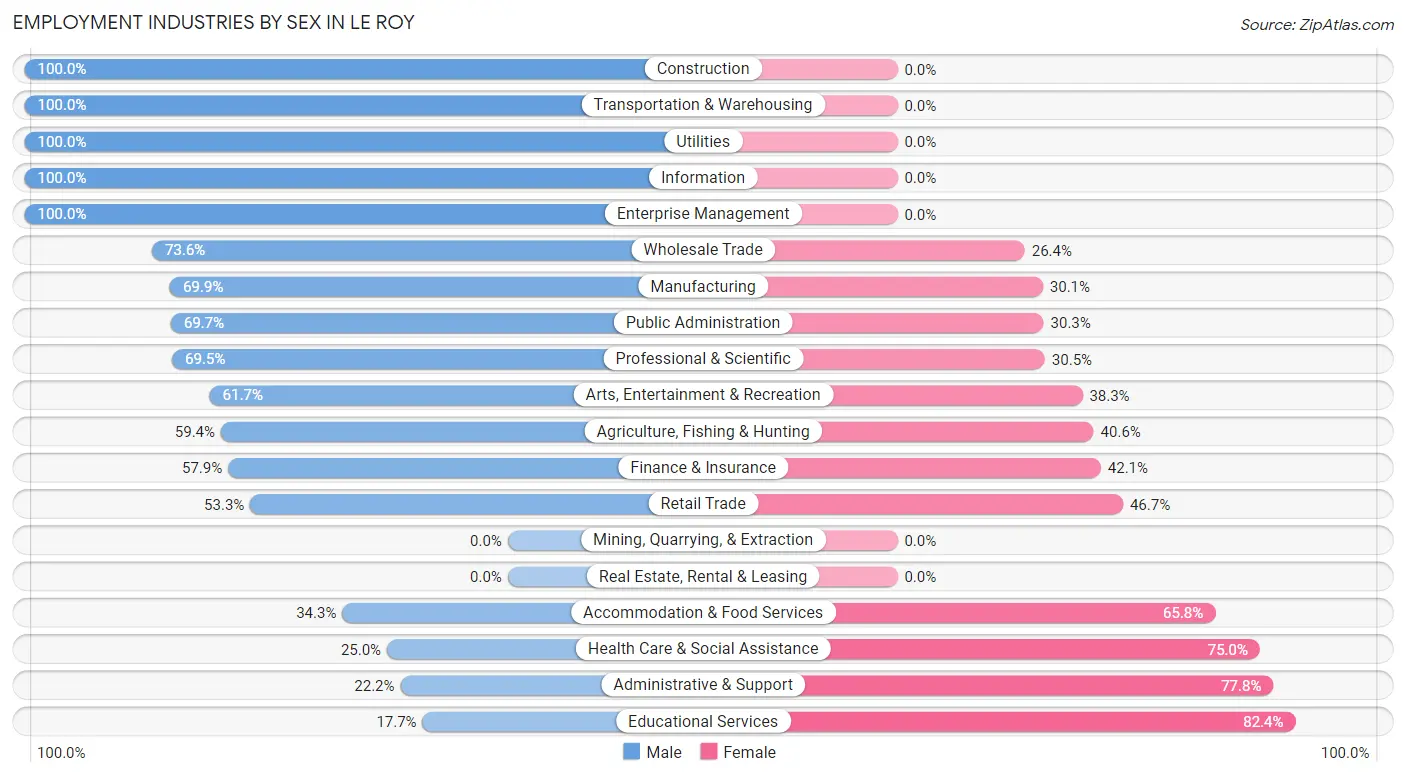
Employment Industries by Sex in Le Roy
The Le Roy industries that see more men than women are Construction (100.0%), Transportation & Warehousing (100.0%), and Utilities (100.0%), whereas the industries that tend to have a higher number of women are Educational Services (82.4%), Administrative & Support (77.8%), and Health Care & Social Assistance (75.0%).
| Industry | Male | Female |
| Agriculture, Fishing & Hunting | 19 (59.4%) | 13 (40.6%) |
| Mining, Quarrying, & Extraction | 0 (0.0%) | 0 (0.0%) |
| Construction | 36 (100.0%) | 0 (0.0%) |
| Manufacturing | 216 (69.9%) | 93 (30.1%) |
| Wholesale Trade | 67 (73.6%) | 24 (26.4%) |
| Retail Trade | 298 (53.3%) | 261 (46.7%) |
| Transportation & Warehousing | 24 (100.0%) | 0 (0.0%) |
| Utilities | 13 (100.0%) | 0 (0.0%) |
| Information | 3 (100.0%) | 0 (0.0%) |
| Finance & Insurance | 22 (57.9%) | 16 (42.1%) |
| Real Estate, Rental & Leasing | 0 (0.0%) | 0 (0.0%) |
| Professional & Scientific | 66 (69.5%) | 29 (30.5%) |
| Enterprise Management | 15 (100.0%) | 0 (0.0%) |
| Administrative & Support | 14 (22.2%) | 49 (77.8%) |
| Educational Services | 39 (17.6%) | 182 (82.4%) |
| Health Care & Social Assistance | 53 (25.0%) | 159 (75.0%) |
| Arts, Entertainment & Recreation | 29 (61.7%) | 18 (38.3%) |
| Accommodation & Food Services | 62 (34.3%) | 119 (65.7%) |
| Public Administration | 53 (69.7%) | 23 (30.3%) |
| Total | 1,070 (50.5%) | 1,050 (49.5%) |
Education in Le Roy
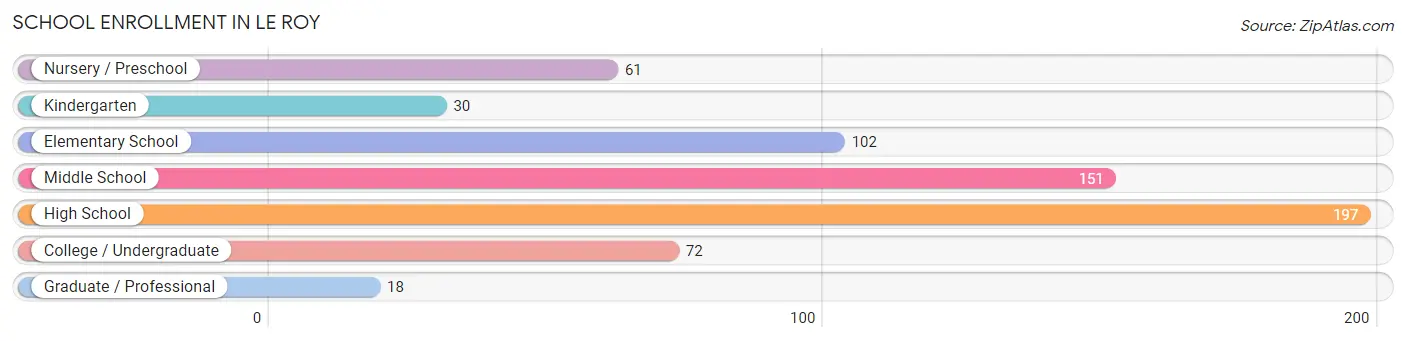
School Enrollment in Le Roy
The most common levels of schooling among the 631 students in Le Roy are high school (197 | 31.2%), middle school (151 | 23.9%), and elementary school (102 | 16.2%).
| School Level | # Students | % Students |
| Nursery / Preschool | 61 | 9.7% |
| Kindergarten | 30 | 4.8% |
| Elementary School | 102 | 16.2% |
| Middle School | 151 | 23.9% |
| High School | 197 | 31.2% |
| College / Undergraduate | 72 | 11.4% |
| Graduate / Professional | 18 | 2.9% |
| Total | 631 | 100.0% |
School Enrollment by Age by Funding Source in Le Roy
Out of a total of 631 students who are enrolled in schools in Le Roy, 99 (15.7%) attend a private institution, while the remaining 532 (84.3%) are enrolled in public schools. The age group of 3 to 4 year olds has the highest likelihood of being enrolled in private schools, with 27 (64.3% in the age bracket) enrolled. Conversely, the age group of 10 to 14 year olds has the lowest likelihood of being enrolled in a private school, with 184 (100.0% in the age bracket) attending a public institution.
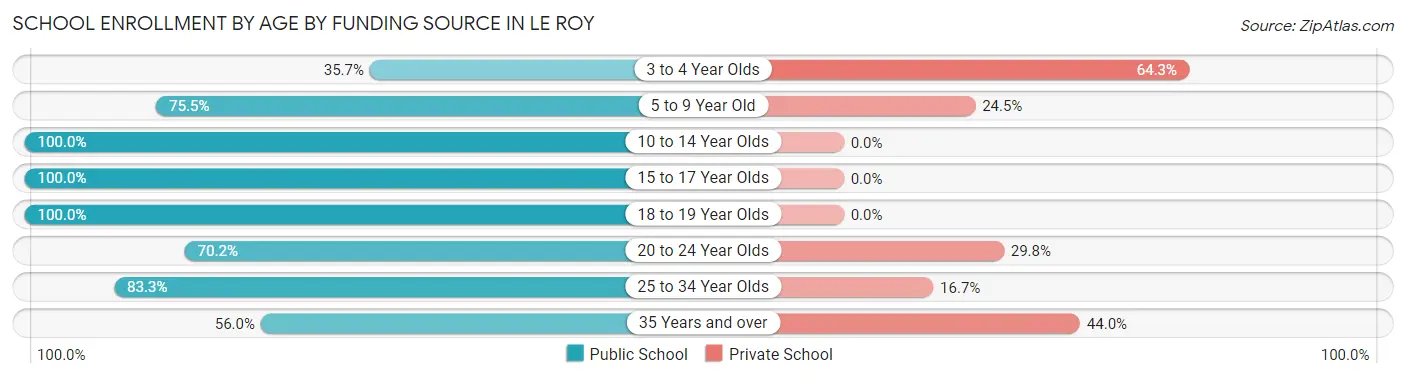
| Age Bracket | Public School | Private School |
| 3 to 4 Year Olds | 15 (35.7%) | 27 (64.3%) |
| 5 to 9 Year Old | 114 (75.5%) | 37 (24.5%) |
| 10 to 14 Year Olds | 184 (100.0%) | 0 (0.0%) |
| 15 to 17 Year Olds | 113 (100.0%) | 0 (0.0%) |
| 18 to 19 Year Olds | 17 (100.0%) | 0 (0.0%) |
| 20 to 24 Year Olds | 40 (70.2%) | 17 (29.8%) |
| 25 to 34 Year Olds | 35 (83.3%) | 7 (16.7%) |
| 35 Years and over | 14 (56.0%) | 11 (44.0%) |
| Total | 532 (84.3%) | 99 (15.7%) |
Educational Attainment by Field of Study in Le Roy
Education (178 | 17.4%), computers & mathematics (130 | 12.7%), science & technology (125 | 12.2%), business (121 | 11.8%), and bio, nature & agricultural (89 | 8.7%) are the most common fields of study among 1,021 individuals in Le Roy who have obtained a bachelor's degree or higher.
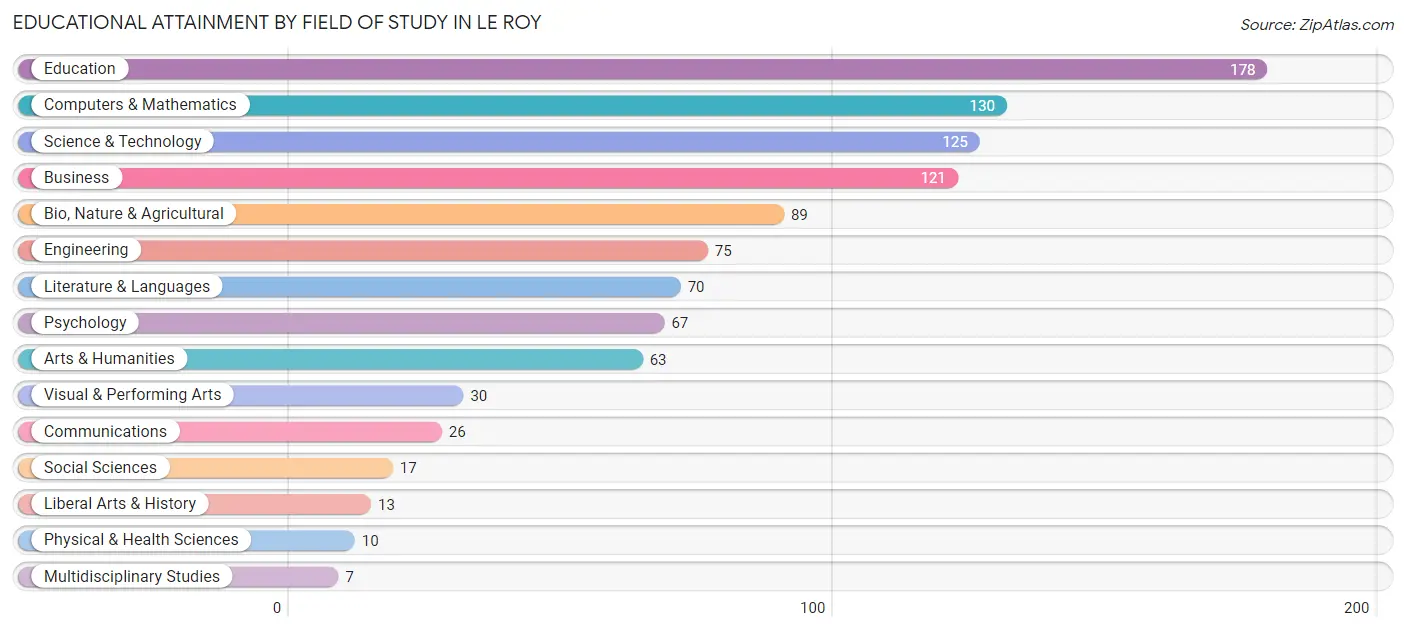
| Field of Study | # Graduates | % Graduates |
| Computers & Mathematics | 130 | 12.7% |
| Bio, Nature & Agricultural | 89 | 8.7% |
| Physical & Health Sciences | 10 | 1.0% |
| Psychology | 67 | 6.6% |
| Social Sciences | 17 | 1.7% |
| Engineering | 75 | 7.3% |
| Multidisciplinary Studies | 7 | 0.7% |
| Science & Technology | 125 | 12.2% |
| Business | 121 | 11.8% |
| Education | 178 | 17.4% |
| Literature & Languages | 70 | 6.9% |
| Liberal Arts & History | 13 | 1.3% |
| Visual & Performing Arts | 30 | 2.9% |
| Communications | 26 | 2.5% |
| Arts & Humanities | 63 | 6.2% |
| Total | 1,021 | 100.0% |
Transportation & Commute in Le Roy
Vehicle Availability by Sex in Le Roy
The most prevalent vehicle ownership categories in Le Roy are males with 2 vehicles (506, accounting for 47.4%) and females with 2 vehicles (336, making up 49.2%).
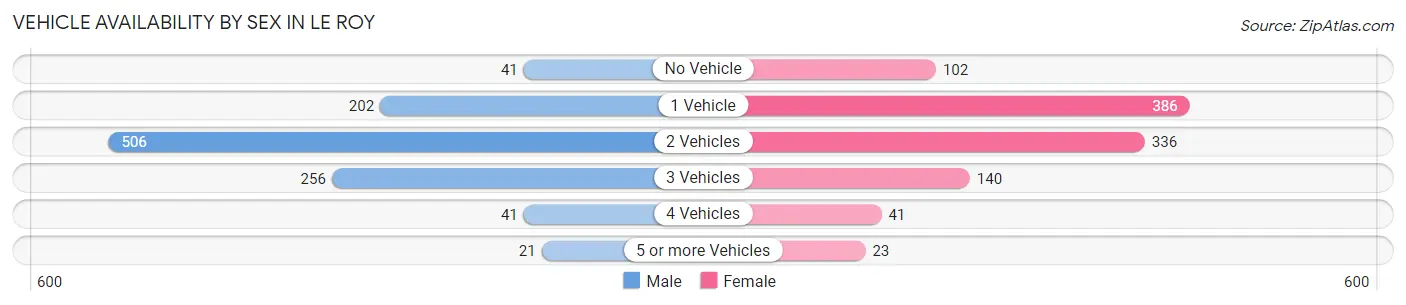
| Vehicles Available | Male | Female |
| No Vehicle | 41 (3.8%) | 102 (9.9%) |
| 1 Vehicle | 202 (18.9%) | 386 (37.6%) |
| 2 Vehicles | 506 (47.4%) | 336 (32.7%) |
| 3 Vehicles | 256 (24.0%) | 140 (13.6%) |
| 4 Vehicles | 41 (3.8%) | 41 (4.0%) |
| 5 or more Vehicles | 21 (2.0%) | 23 (2.2%) |
| Total | 1,067 (100.0%) | 1,028 (100.0%) |
Commute Time in Le Roy
The most frequently occuring commute durations in Le Roy are 20 to 24 minutes (350 commuters, 17.8%), 15 to 19 minutes (325 commuters, 16.6%), and 5 to 9 minutes (265 commuters, 13.5%).
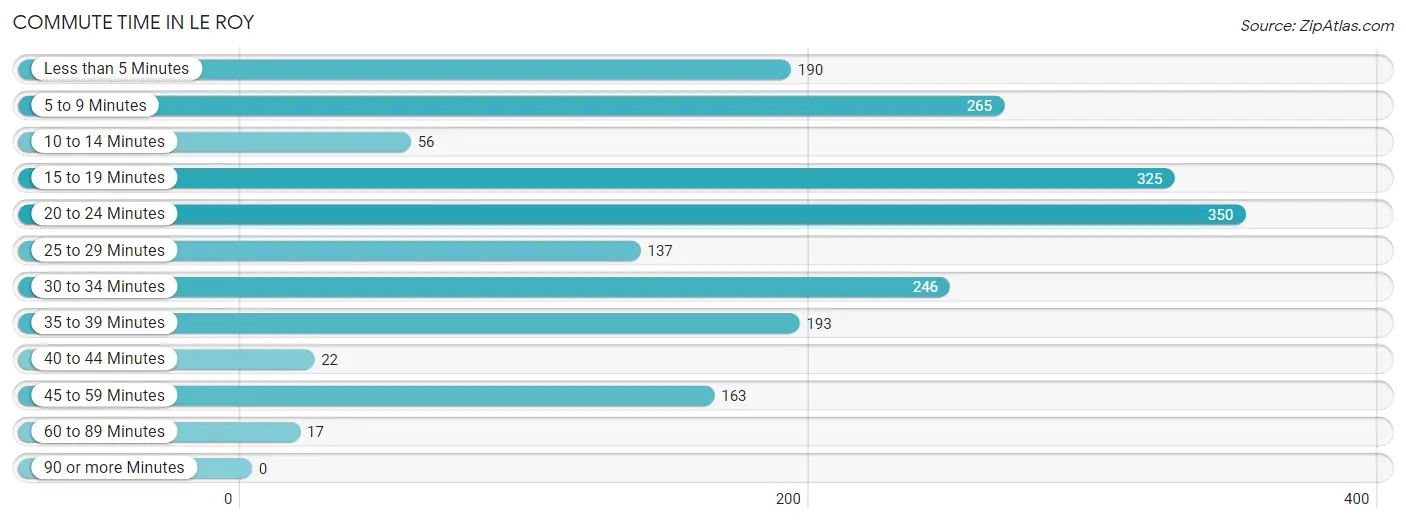
| Commute Time | # Commuters | % Commuters |
| Less than 5 Minutes | 190 | 9.7% |
| 5 to 9 Minutes | 265 | 13.5% |
| 10 to 14 Minutes | 56 | 2.9% |
| 15 to 19 Minutes | 325 | 16.6% |
| 20 to 24 Minutes | 350 | 17.8% |
| 25 to 29 Minutes | 137 | 7.0% |
| 30 to 34 Minutes | 246 | 12.5% |
| 35 to 39 Minutes | 193 | 9.8% |
| 40 to 44 Minutes | 22 | 1.1% |
| 45 to 59 Minutes | 163 | 8.3% |
| 60 to 89 Minutes | 17 | 0.9% |
| 90 or more Minutes | 0 | 0.0% |
Commute Time by Sex in Le Roy
The most common commute times in Le Roy are 20 to 24 minutes (203 commuters, 20.0%) for males and 15 to 19 minutes (217 commuters, 22.9%) for females.
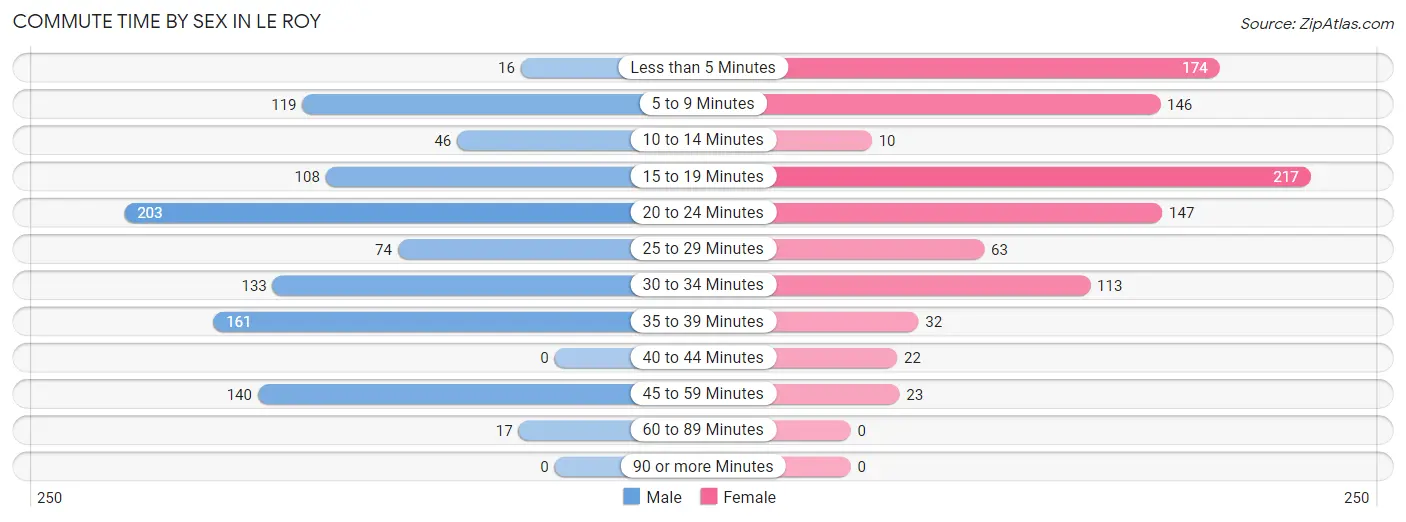
| Commute Time | Male | Female |
| Less than 5 Minutes | 16 (1.6%) | 174 (18.4%) |
| 5 to 9 Minutes | 119 (11.7%) | 146 (15.4%) |
| 10 to 14 Minutes | 46 (4.5%) | 10 (1.1%) |
| 15 to 19 Minutes | 108 (10.6%) | 217 (22.9%) |
| 20 to 24 Minutes | 203 (20.0%) | 147 (15.5%) |
| 25 to 29 Minutes | 74 (7.3%) | 63 (6.7%) |
| 30 to 34 Minutes | 133 (13.1%) | 113 (11.9%) |
| 35 to 39 Minutes | 161 (15.8%) | 32 (3.4%) |
| 40 to 44 Minutes | 0 (0.0%) | 22 (2.3%) |
| 45 to 59 Minutes | 140 (13.8%) | 23 (2.4%) |
| 60 to 89 Minutes | 17 (1.7%) | 0 (0.0%) |
| 90 or more Minutes | 0 (0.0%) | 0 (0.0%) |
Time of Departure to Work by Sex in Le Roy
The most frequent times of departure to work in Le Roy are 6:30 AM to 6:59 AM (173, 17.0%) for males and 7:30 AM to 7:59 AM (157, 16.6%) for females.
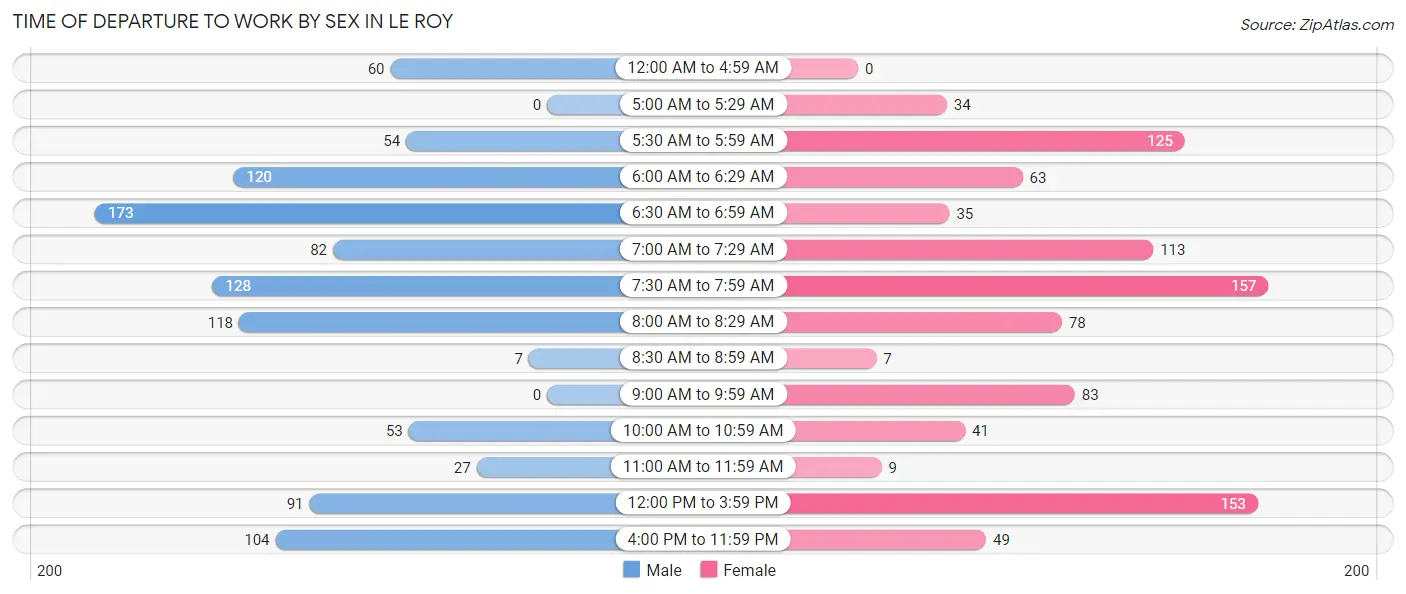
| Time of Departure | Male | Female |
| 12:00 AM to 4:59 AM | 60 (5.9%) | 0 (0.0%) |
| 5:00 AM to 5:29 AM | 0 (0.0%) | 34 (3.6%) |
| 5:30 AM to 5:59 AM | 54 (5.3%) | 125 (13.2%) |
| 6:00 AM to 6:29 AM | 120 (11.8%) | 63 (6.7%) |
| 6:30 AM to 6:59 AM | 173 (17.0%) | 35 (3.7%) |
| 7:00 AM to 7:29 AM | 82 (8.1%) | 113 (11.9%) |
| 7:30 AM to 7:59 AM | 128 (12.6%) | 157 (16.6%) |
| 8:00 AM to 8:29 AM | 118 (11.6%) | 78 (8.2%) |
| 8:30 AM to 8:59 AM | 7 (0.7%) | 7 (0.7%) |
| 9:00 AM to 9:59 AM | 0 (0.0%) | 83 (8.8%) |
| 10:00 AM to 10:59 AM | 53 (5.2%) | 41 (4.3%) |
| 11:00 AM to 11:59 AM | 27 (2.6%) | 9 (0.9%) |
| 12:00 PM to 3:59 PM | 91 (8.9%) | 153 (16.2%) |
| 4:00 PM to 11:59 PM | 104 (10.2%) | 49 (5.2%) |
| Total | 1,017 (100.0%) | 947 (100.0%) |
Housing Occupancy in Le Roy
Occupancy by Ownership in Le Roy
Of the total 2,055 dwellings in Le Roy, owner-occupied units account for 1,348 (65.6%), while renter-occupied units make up 707 (34.4%).
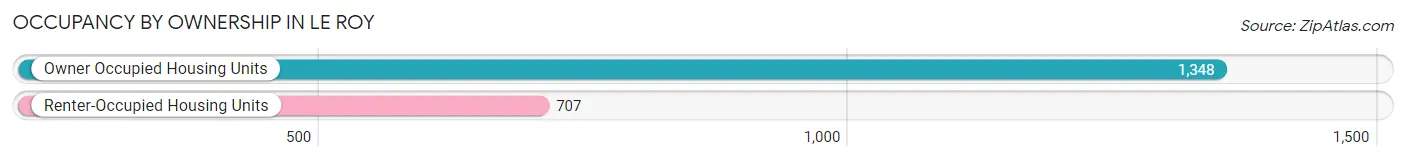
| Occupancy | # Housing Units | % Housing Units |
| Owner Occupied Housing Units | 1,348 | 65.6% |
| Renter-Occupied Housing Units | 707 | 34.4% |
| Total Occupied Housing Units | 2,055 | 100.0% |
Occupancy by Household Size in Le Roy
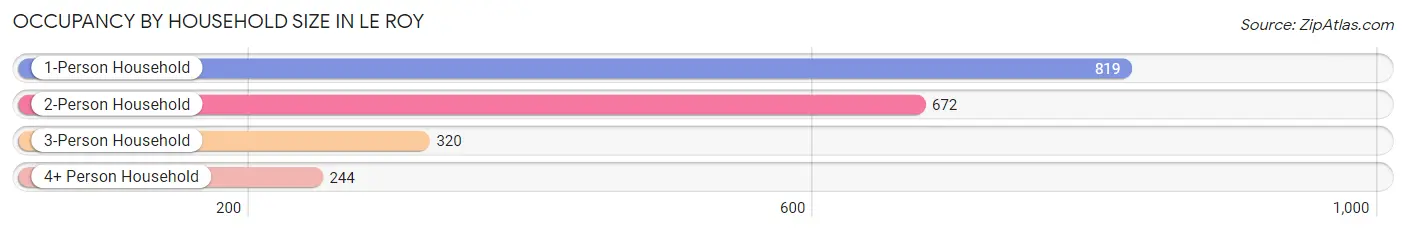
| Household Size | # Housing Units | % Housing Units |
| 1-Person Household | 819 | 39.9% |
| 2-Person Household | 672 | 32.7% |
| 3-Person Household | 320 | 15.6% |
| 4+ Person Household | 244 | 11.9% |
| Total Housing Units | 2,055 | 100.0% |
Occupancy by Ownership by Household Size in Le Roy
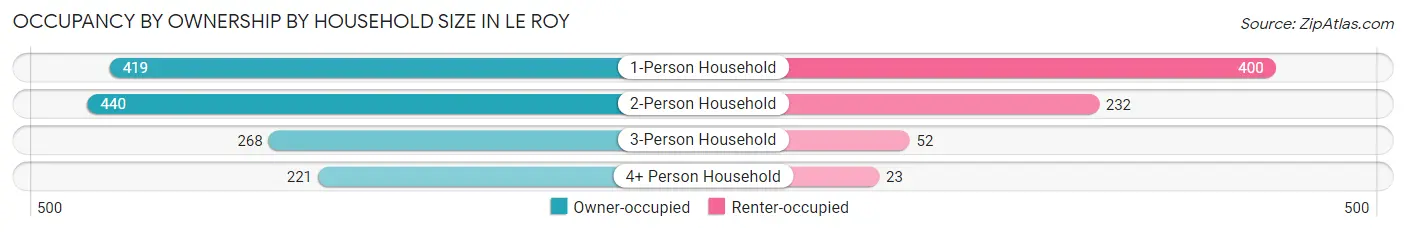
| Household Size | Owner-occupied | Renter-occupied |
| 1-Person Household | 419 (51.2%) | 400 (48.8%) |
| 2-Person Household | 440 (65.5%) | 232 (34.5%) |
| 3-Person Household | 268 (83.8%) | 52 (16.3%) |
| 4+ Person Household | 221 (90.6%) | 23 (9.4%) |
| Total Housing Units | 1,348 (65.6%) | 707 (34.4%) |
Occupancy by Educational Attainment in Le Roy
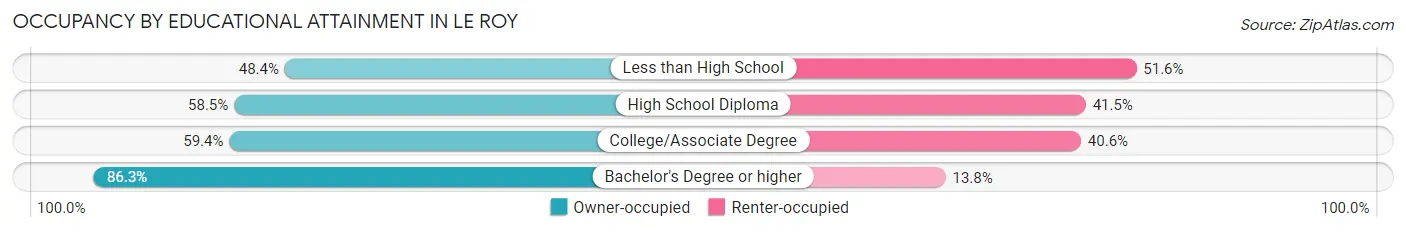
| Household Size | Owner-occupied | Renter-occupied |
| Less than High School | 46 (48.4%) | 49 (51.6%) |
| High School Diploma | 418 (58.5%) | 297 (41.5%) |
| College/Associate Degree | 420 (59.4%) | 287 (40.6%) |
| Bachelor's Degree or higher | 464 (86.3%) | 74 (13.8%) |
Occupancy by Age of Householder in Le Roy
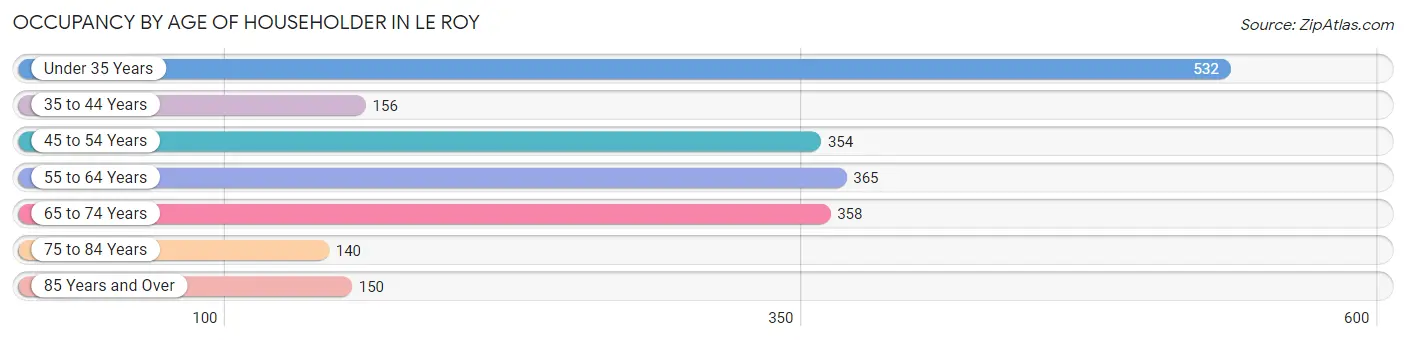
| Age Bracket | # Households | % Households |
| Under 35 Years | 532 | 25.9% |
| 35 to 44 Years | 156 | 7.6% |
| 45 to 54 Years | 354 | 17.2% |
| 55 to 64 Years | 365 | 17.8% |
| 65 to 74 Years | 358 | 17.4% |
| 75 to 84 Years | 140 | 6.8% |
| 85 Years and Over | 150 | 7.3% |
| Total | 2,055 | 100.0% |
Housing Finances in Le Roy
Median Income by Occupancy in Le Roy
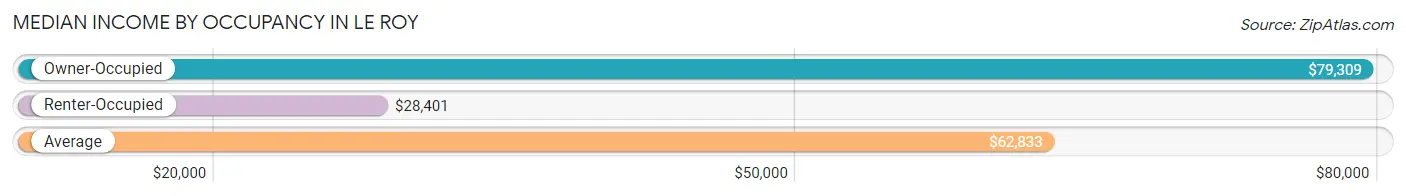
| Occupancy Type | # Households | Median Income |
| Owner-Occupied | 1,348 (65.6%) | $79,309 |
| Renter-Occupied | 707 (34.4%) | $28,401 |
| Average | 2,055 (100.0%) | $62,833 |
Occupancy by Householder Income Bracket in Le Roy
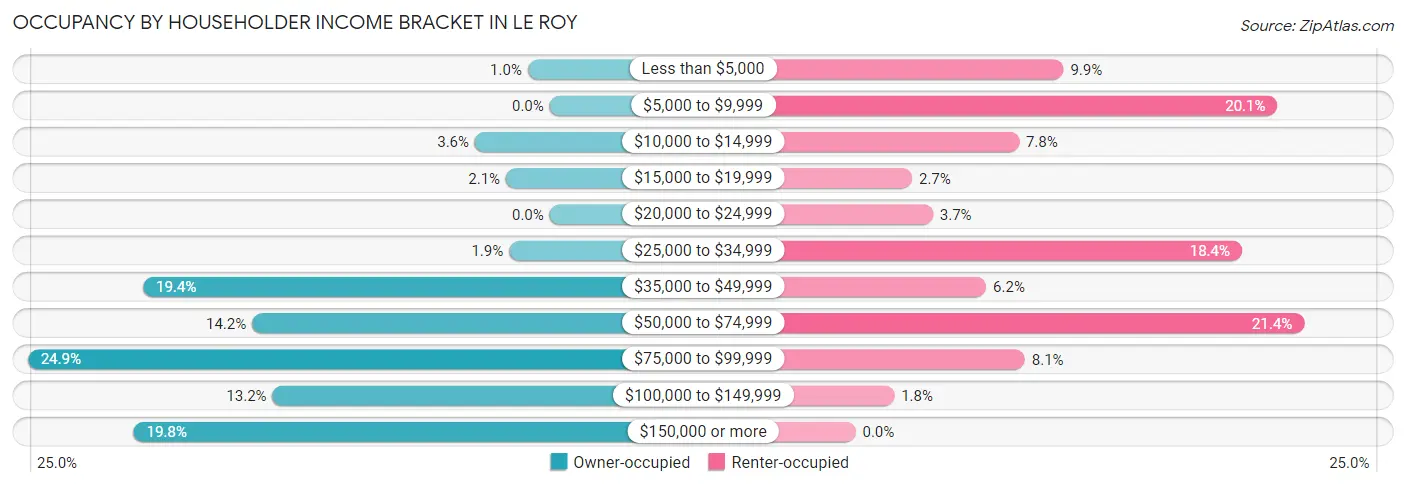
| Income Bracket | Owner-occupied | Renter-occupied |
| Less than $5,000 | 14 (1.0%) | 70 (9.9%) |
| $5,000 to $9,999 | 0 (0.0%) | 142 (20.1%) |
| $10,000 to $14,999 | 48 (3.6%) | 55 (7.8%) |
| $15,000 to $19,999 | 28 (2.1%) | 19 (2.7%) |
| $20,000 to $24,999 | 0 (0.0%) | 26 (3.7%) |
| $25,000 to $34,999 | 26 (1.9%) | 130 (18.4%) |
| $35,000 to $49,999 | 261 (19.4%) | 44 (6.2%) |
| $50,000 to $74,999 | 191 (14.2%) | 151 (21.4%) |
| $75,000 to $99,999 | 335 (24.8%) | 57 (8.1%) |
| $100,000 to $149,999 | 178 (13.2%) | 13 (1.8%) |
| $150,000 or more | 267 (19.8%) | 0 (0.0%) |
| Total | 1,348 (100.0%) | 707 (100.0%) |
Monthly Housing Cost Tiers in Le Roy
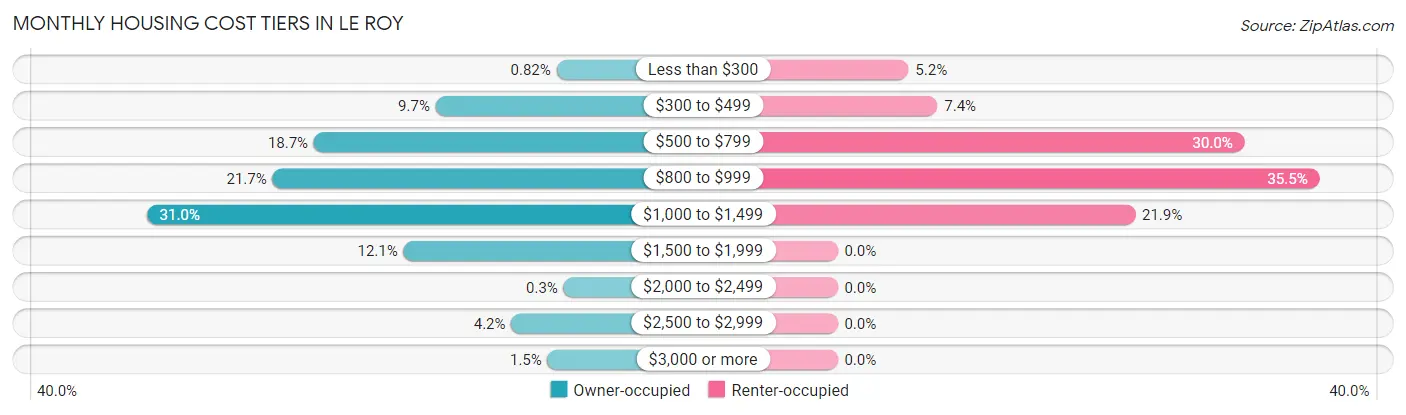
| Monthly Cost | Owner-occupied | Renter-occupied |
| Less than $300 | 11 (0.8%) | 37 (5.2%) |
| $300 to $499 | 131 (9.7%) | 52 (7.4%) |
| $500 to $799 | 252 (18.7%) | 212 (30.0%) |
| $800 to $999 | 293 (21.7%) | 251 (35.5%) |
| $1,000 to $1,499 | 418 (31.0%) | 155 (21.9%) |
| $1,500 to $1,999 | 163 (12.1%) | 0 (0.0%) |
| $2,000 to $2,499 | 4 (0.3%) | 0 (0.0%) |
| $2,500 to $2,999 | 56 (4.2%) | 0 (0.0%) |
| $3,000 or more | 20 (1.5%) | 0 (0.0%) |
| Total | 1,348 (100.0%) | 707 (100.0%) |
Physical Housing Characteristics in Le Roy
Housing Structures in Le Roy
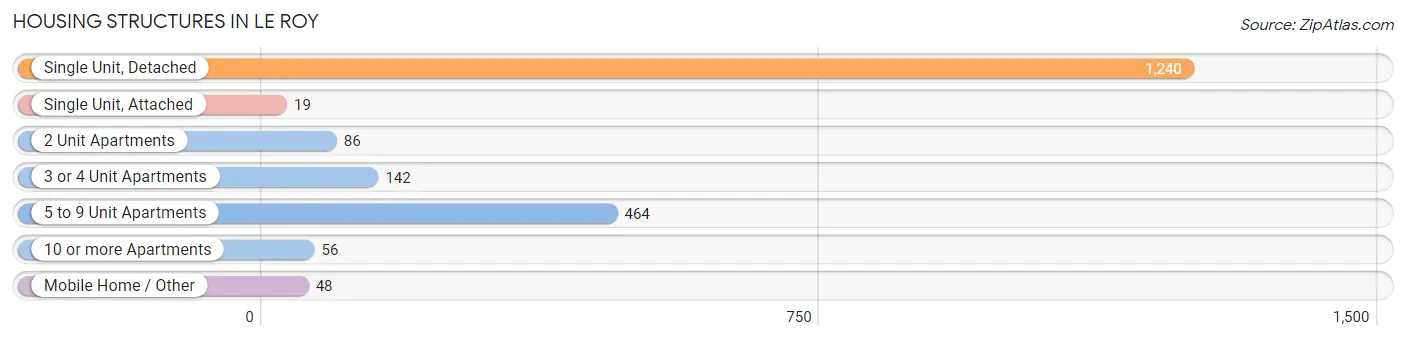
| Structure Type | # Housing Units | % Housing Units |
| Single Unit, Detached | 1,240 | 60.3% |
| Single Unit, Attached | 19 | 0.9% |
| 2 Unit Apartments | 86 | 4.2% |
| 3 or 4 Unit Apartments | 142 | 6.9% |
| 5 to 9 Unit Apartments | 464 | 22.6% |
| 10 or more Apartments | 56 | 2.7% |
| Mobile Home / Other | 48 | 2.3% |
| Total | 2,055 | 100.0% |
Housing Structures by Occupancy in Le Roy
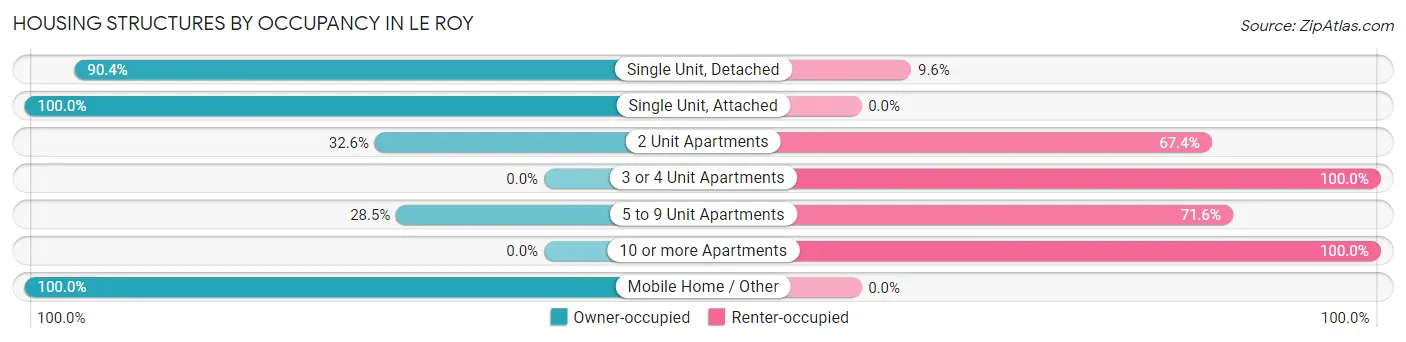
| Structure Type | Owner-occupied | Renter-occupied |
| Single Unit, Detached | 1,121 (90.4%) | 119 (9.6%) |
| Single Unit, Attached | 19 (100.0%) | 0 (0.0%) |
| 2 Unit Apartments | 28 (32.6%) | 58 (67.4%) |
| 3 or 4 Unit Apartments | 0 (0.0%) | 142 (100.0%) |
| 5 to 9 Unit Apartments | 132 (28.4%) | 332 (71.6%) |
| 10 or more Apartments | 0 (0.0%) | 56 (100.0%) |
| Mobile Home / Other | 48 (100.0%) | 0 (0.0%) |
| Total | 1,348 (65.6%) | 707 (34.4%) |
Housing Structures by Number of Rooms in Le Roy
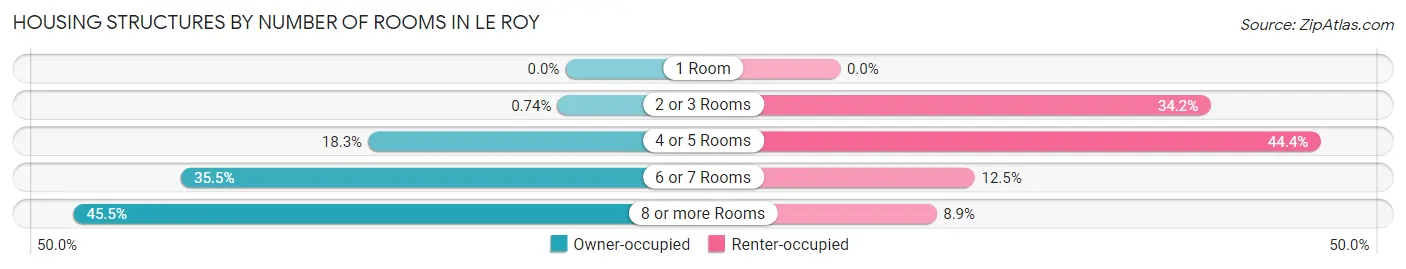
| Number of Rooms | Owner-occupied | Renter-occupied |
| 1 Room | 0 (0.0%) | 0 (0.0%) |
| 2 or 3 Rooms | 10 (0.7%) | 242 (34.2%) |
| 4 or 5 Rooms | 246 (18.2%) | 314 (44.4%) |
| 6 or 7 Rooms | 479 (35.5%) | 88 (12.4%) |
| 8 or more Rooms | 613 (45.5%) | 63 (8.9%) |
| Total | 1,348 (100.0%) | 707 (100.0%) |
Housing Structure by Heating Type in Le Roy
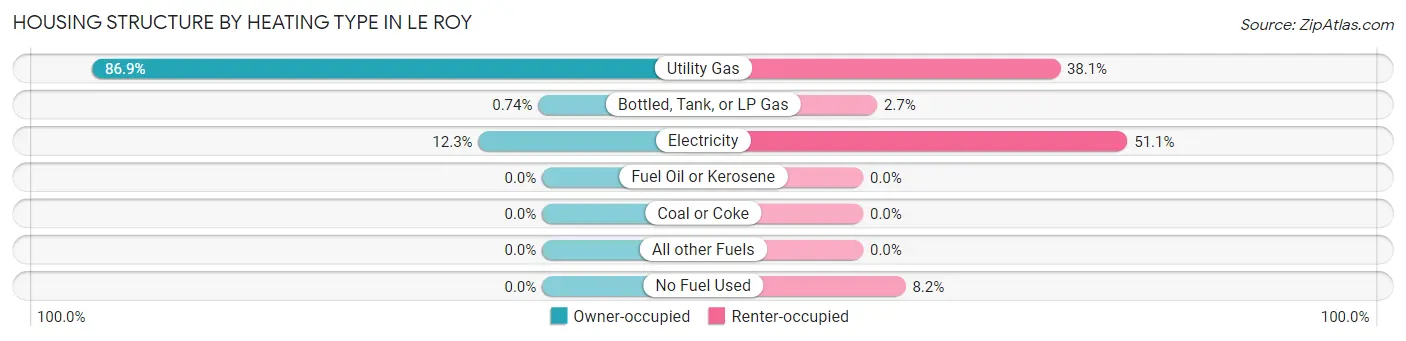
| Heating Type | Owner-occupied | Renter-occupied |
| Utility Gas | 1,172 (86.9%) | 269 (38.1%) |
| Bottled, Tank, or LP Gas | 10 (0.7%) | 19 (2.7%) |
| Electricity | 166 (12.3%) | 361 (51.1%) |
| Fuel Oil or Kerosene | 0 (0.0%) | 0 (0.0%) |
| Coal or Coke | 0 (0.0%) | 0 (0.0%) |
| All other Fuels | 0 (0.0%) | 0 (0.0%) |
| No Fuel Used | 0 (0.0%) | 58 (8.2%) |
| Total | 1,348 (100.0%) | 707 (100.0%) |
Household Vehicle Usage in Le Roy
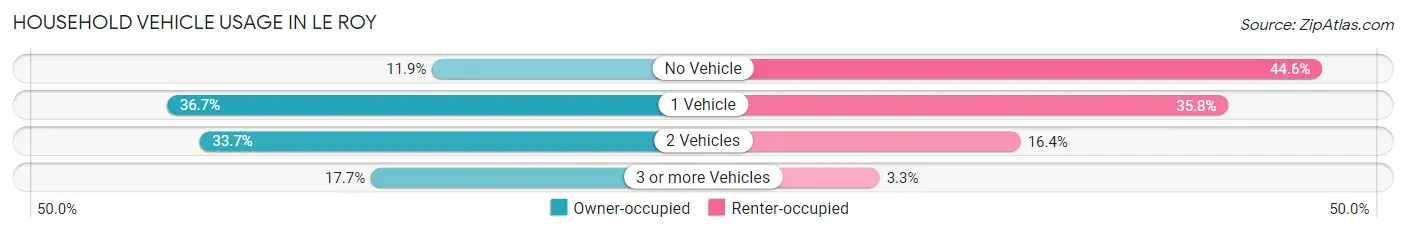
| Vehicles per Household | Owner-occupied | Renter-occupied |
| No Vehicle | 161 (11.9%) | 315 (44.6%) |
| 1 Vehicle | 495 (36.7%) | 253 (35.8%) |
| 2 Vehicles | 454 (33.7%) | 116 (16.4%) |
| 3 or more Vehicles | 238 (17.7%) | 23 (3.3%) |
| Total | 1,348 (100.0%) | 707 (100.0%) |
Real Estate & Mortgages in Le Roy
Real Estate and Mortgage Overview in Le Roy
| Characteristic | Without Mortgage | With Mortgage |
| Housing Units | 559 | 789 |
| Median Property Value | $152,300 | $139,400 |
| Median Household Income | $46,523 | $165 |
| Monthly Housing Costs | $748 | $20 |
| Real Estate Taxes | $4,362 | $39 |
Property Value by Mortgage Status in Le Roy
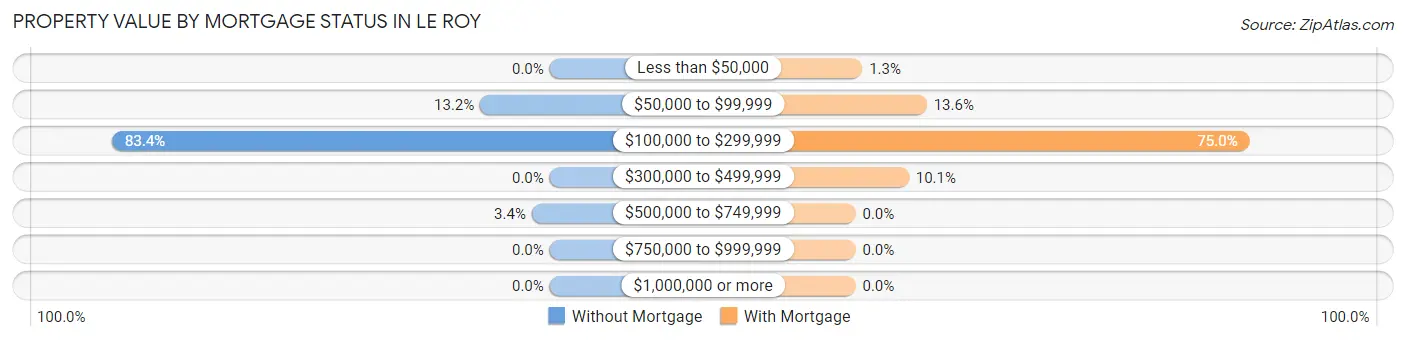
| Property Value | Without Mortgage | With Mortgage |
| Less than $50,000 | 0 (0.0%) | 10 (1.3%) |
| $50,000 to $99,999 | 74 (13.2%) | 107 (13.6%) |
| $100,000 to $299,999 | 466 (83.4%) | 592 (75.0%) |
| $300,000 to $499,999 | 0 (0.0%) | 80 (10.1%) |
| $500,000 to $749,999 | 19 (3.4%) | 0 (0.0%) |
| $750,000 to $999,999 | 0 (0.0%) | 0 (0.0%) |
| $1,000,000 or more | 0 (0.0%) | 0 (0.0%) |
| Total | 559 (100.0%) | 789 (100.0%) |
Household Income by Mortgage Status in Le Roy
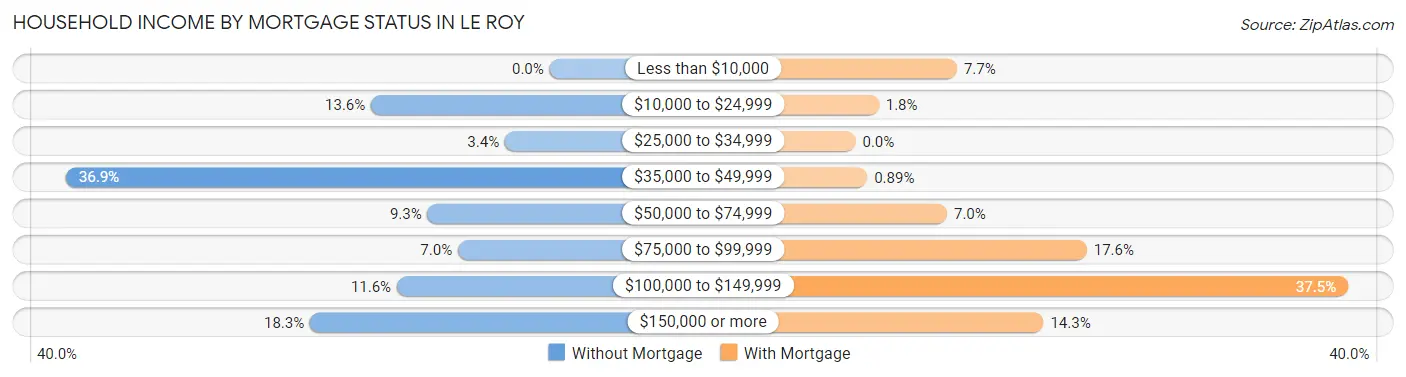
| Household Income | Without Mortgage | With Mortgage |
| Less than $10,000 | 0 (0.0%) | 61 (7.7%) |
| $10,000 to $24,999 | 76 (13.6%) | 14 (1.8%) |
| $25,000 to $34,999 | 19 (3.4%) | 0 (0.0%) |
| $35,000 to $49,999 | 206 (36.8%) | 7 (0.9%) |
| $50,000 to $74,999 | 52 (9.3%) | 55 (7.0%) |
| $75,000 to $99,999 | 39 (7.0%) | 139 (17.6%) |
| $100,000 to $149,999 | 65 (11.6%) | 296 (37.5%) |
| $150,000 or more | 102 (18.2%) | 113 (14.3%) |
| Total | 559 (100.0%) | 789 (100.0%) |
Property Value to Household Income Ratio in Le Roy
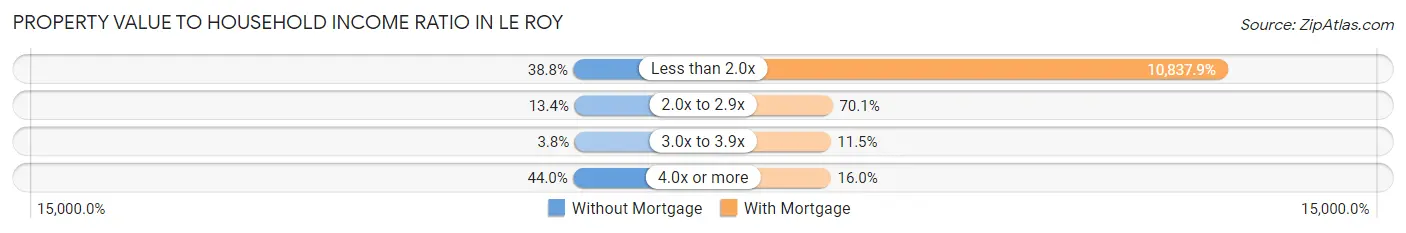
| Value-to-Income Ratio | Without Mortgage | With Mortgage |
| Less than 2.0x | 217 (38.8%) | 85,511 (10,837.9%) |
| 2.0x to 2.9x | 75 (13.4%) | 553 (70.1%) |
| 3.0x to 3.9x | 21 (3.8%) | 91 (11.5%) |
| 4.0x or more | 246 (44.0%) | 126 (16.0%) |
| Total | 559 (100.0%) | 789 (100.0%) |
Real Estate Taxes by Mortgage Status in Le Roy
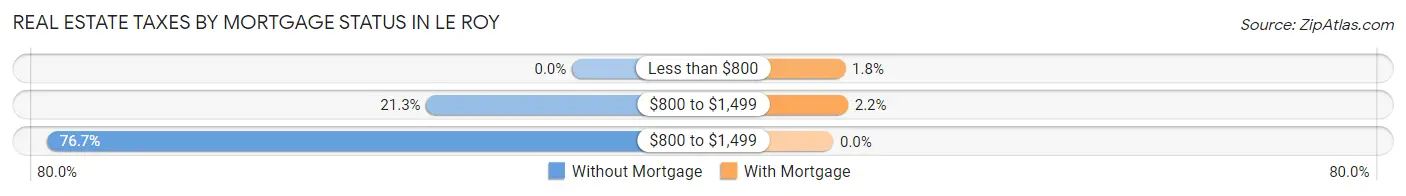
| Property Taxes | Without Mortgage | With Mortgage |
| Less than $800 | 0 (0.0%) | 14 (1.8%) |
| $800 to $1,499 | 119 (21.3%) | 17 (2.1%) |
| $800 to $1,499 | 429 (76.7%) | 0 (0.0%) |
| Total | 559 (100.0%) | 789 (100.0%) |
Health & Disability in Le Roy
Health Insurance Coverage by Age in Le Roy
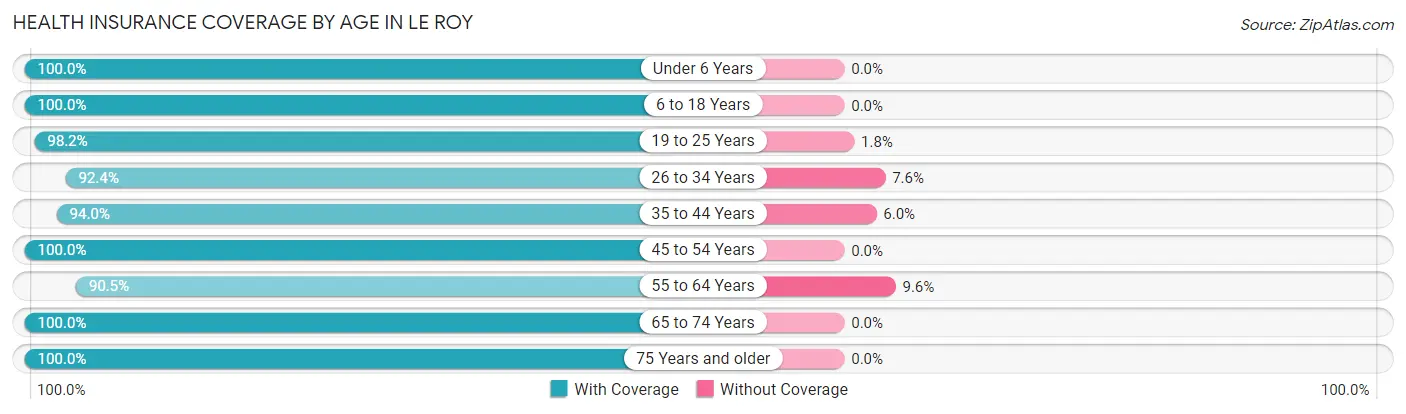
| Age Bracket | With Coverage | Without Coverage |
| Under 6 Years | 394 (100.0%) | 0 (0.0%) |
| 6 to 18 Years | 430 (100.0%) | 0 (0.0%) |
| 19 to 25 Years | 376 (98.2%) | 7 (1.8%) |
| 26 to 34 Years | 678 (92.4%) | 56 (7.6%) |
| 35 to 44 Years | 425 (94.0%) | 27 (6.0%) |
| 45 to 54 Years | 490 (100.0%) | 0 (0.0%) |
| 55 to 64 Years | 502 (90.4%) | 53 (9.6%) |
| 65 to 74 Years | 423 (100.0%) | 0 (0.0%) |
| 75 Years and older | 387 (100.0%) | 0 (0.0%) |
| Total | 4,105 (96.6%) | 143 (3.4%) |
Health Insurance Coverage by Citizenship Status in Le Roy
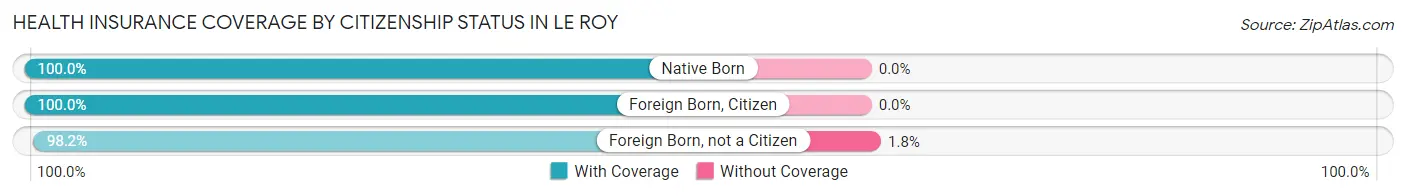
| Citizenship Status | With Coverage | Without Coverage |
| Native Born | 394 (100.0%) | 0 (0.0%) |
| Foreign Born, Citizen | 430 (100.0%) | 0 (0.0%) |
| Foreign Born, not a Citizen | 376 (98.2%) | 7 (1.8%) |
Health Insurance Coverage by Household Income in Le Roy
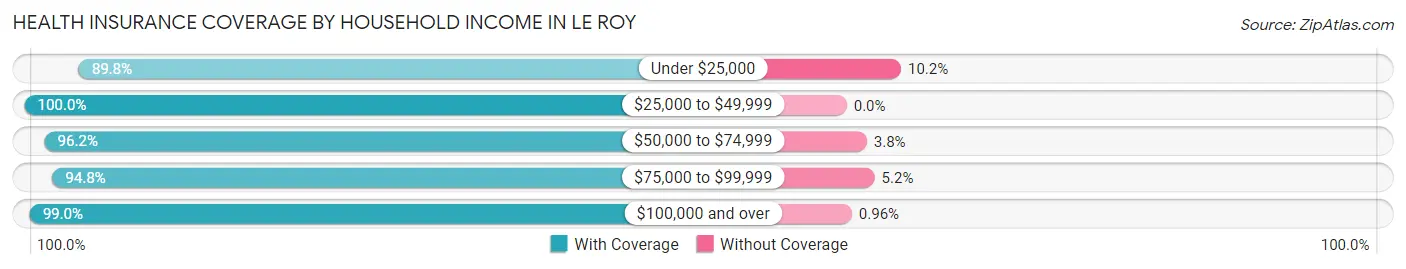
| Household Income | With Coverage | Without Coverage |
| Under $25,000 | 460 (89.8%) | 52 (10.2%) |
| $25,000 to $49,999 | 832 (100.0%) | 0 (0.0%) |
| $50,000 to $74,999 | 692 (96.2%) | 27 (3.8%) |
| $75,000 to $99,999 | 963 (94.8%) | 53 (5.2%) |
| $100,000 and over | 1,137 (99.0%) | 11 (1.0%) |
Public vs Private Health Insurance Coverage by Age in Le Roy
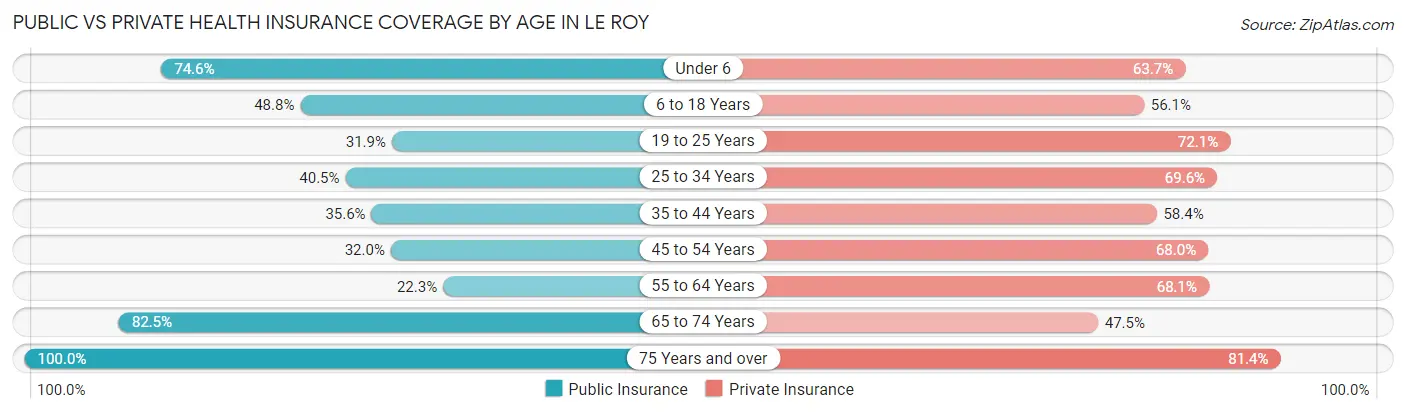
| Age Bracket | Public Insurance | Private Insurance |
| Under 6 | 294 (74.6%) | 251 (63.7%) |
| 6 to 18 Years | 210 (48.8%) | 241 (56.0%) |
| 19 to 25 Years | 122 (31.9%) | 276 (72.1%) |
| 25 to 34 Years | 297 (40.5%) | 511 (69.6%) |
| 35 to 44 Years | 161 (35.6%) | 264 (58.4%) |
| 45 to 54 Years | 157 (32.0%) | 333 (68.0%) |
| 55 to 64 Years | 124 (22.3%) | 378 (68.1%) |
| 65 to 74 Years | 349 (82.5%) | 201 (47.5%) |
| 75 Years and over | 387 (100.0%) | 315 (81.4%) |
| Total | 2,101 (49.5%) | 2,770 (65.2%) |
Disability Status by Sex by Age in Le Roy
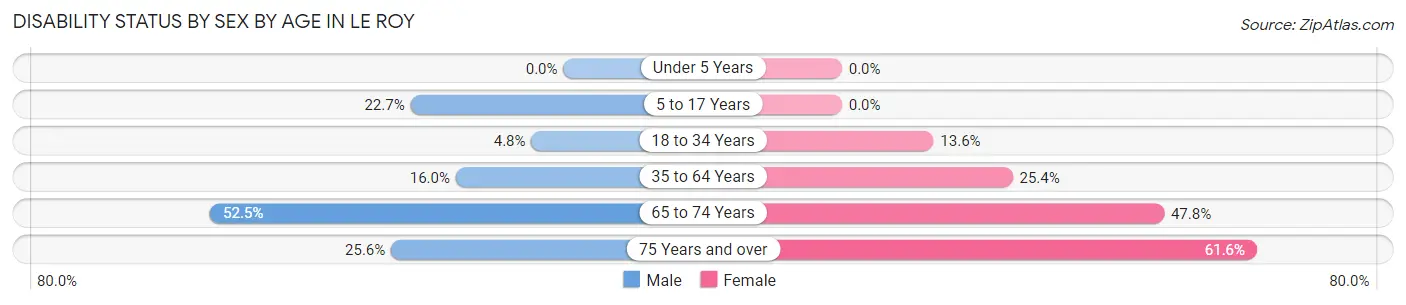
| Age Bracket | Male | Female |
| Under 5 Years | 0 (0.0%) | 0 (0.0%) |
| 5 to 17 Years | 64 (22.7%) | 0 (0.0%) |
| 18 to 34 Years | 27 (4.8%) | 77 (13.6%) |
| 35 to 64 Years | 115 (16.0%) | 197 (25.4%) |
| 65 to 74 Years | 64 (52.5%) | 144 (47.8%) |
| 75 Years and over | 33 (25.6%) | 159 (61.6%) |
Disability Class by Sex by Age in Le Roy
Disability Class: Hearing Difficulty
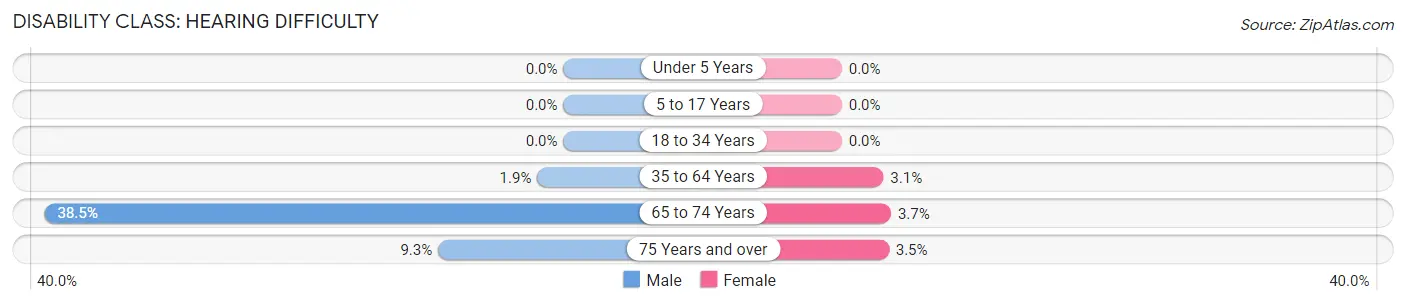
| Age Bracket | Male | Female |
| Under 5 Years | 0 (0.0%) | 0 (0.0%) |
| 5 to 17 Years | 0 (0.0%) | 0 (0.0%) |
| 18 to 34 Years | 0 (0.0%) | 0 (0.0%) |
| 35 to 64 Years | 14 (1.9%) | 24 (3.1%) |
| 65 to 74 Years | 47 (38.5%) | 11 (3.6%) |
| 75 Years and over | 12 (9.3%) | 9 (3.5%) |
Disability Class: Vision Difficulty
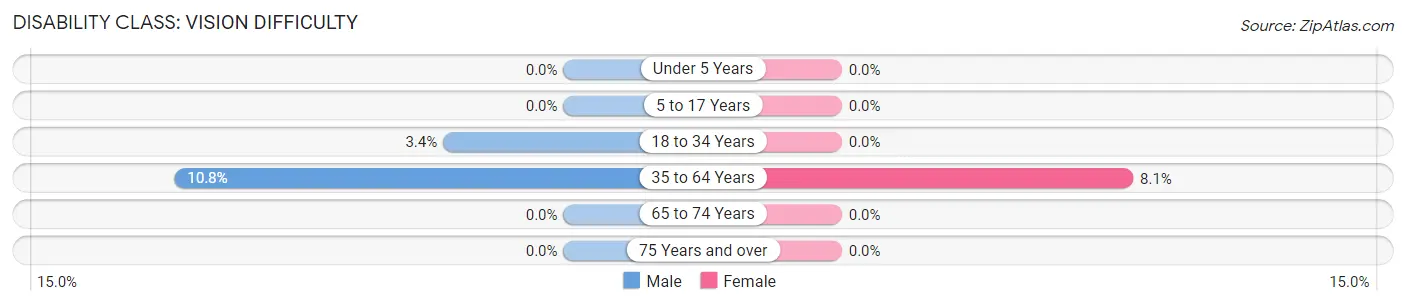
| Age Bracket | Male | Female |
| Under 5 Years | 0 (0.0%) | 0 (0.0%) |
| 5 to 17 Years | 0 (0.0%) | 0 (0.0%) |
| 18 to 34 Years | 19 (3.4%) | 0 (0.0%) |
| 35 to 64 Years | 78 (10.8%) | 63 (8.1%) |
| 65 to 74 Years | 0 (0.0%) | 0 (0.0%) |
| 75 Years and over | 0 (0.0%) | 0 (0.0%) |
Disability Class: Cognitive Difficulty
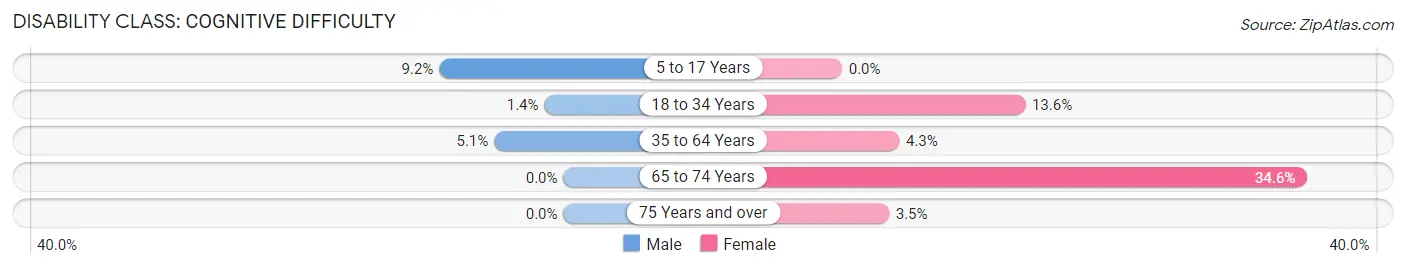
| Age Bracket | Male | Female |
| 5 to 17 Years | 26 (9.2%) | 0 (0.0%) |
| 18 to 34 Years | 8 (1.4%) | 77 (13.6%) |
| 35 to 64 Years | 37 (5.1%) | 33 (4.3%) |
| 65 to 74 Years | 0 (0.0%) | 104 (34.5%) |
| 75 Years and over | 0 (0.0%) | 9 (3.5%) |
Disability Class: Ambulatory Difficulty
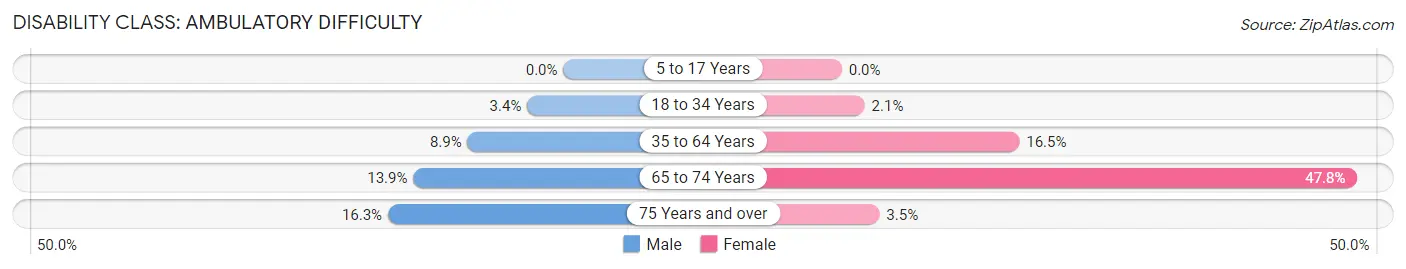
| Age Bracket | Male | Female |
| 5 to 17 Years | 0 (0.0%) | 0 (0.0%) |
| 18 to 34 Years | 19 (3.4%) | 12 (2.1%) |
| 35 to 64 Years | 64 (8.9%) | 128 (16.5%) |
| 65 to 74 Years | 17 (13.9%) | 144 (47.8%) |
| 75 Years and over | 21 (16.3%) | 9 (3.5%) |
Disability Class: Self-Care Difficulty
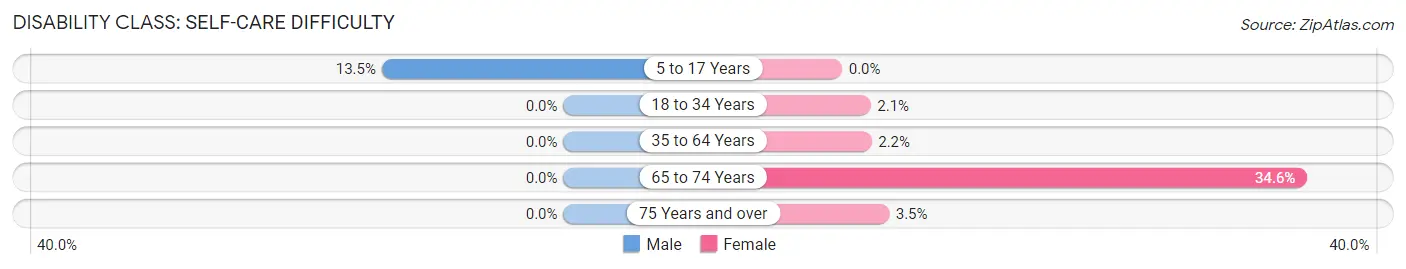
| Age Bracket | Male | Female |
| 5 to 17 Years | 38 (13.5%) | 0 (0.0%) |
| 18 to 34 Years | 0 (0.0%) | 12 (2.1%) |
| 35 to 64 Years | 0 (0.0%) | 17 (2.2%) |
| 65 to 74 Years | 0 (0.0%) | 104 (34.5%) |
| 75 Years and over | 0 (0.0%) | 9 (3.5%) |
Technology Access in Le Roy
Computing Device Access in Le Roy
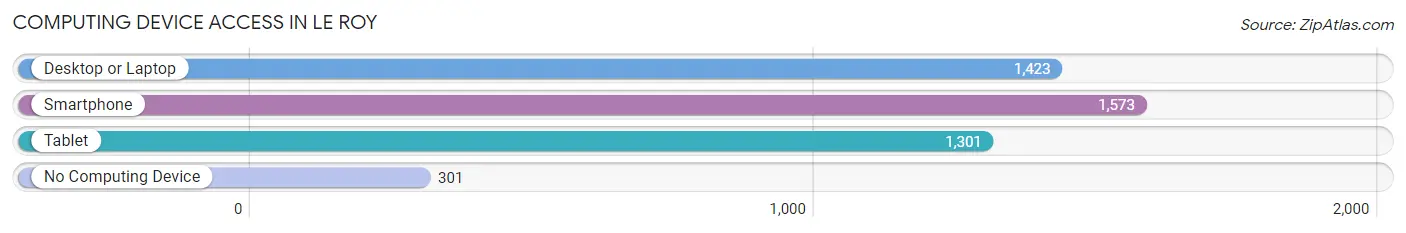
| Device Type | # Households | % Households |
| Desktop or Laptop | 1,423 | 69.3% |
| Smartphone | 1,573 | 76.5% |
| Tablet | 1,301 | 63.3% |
| No Computing Device | 301 | 14.6% |
| Total | 2,055 | 100.0% |
Internet Access in Le Roy
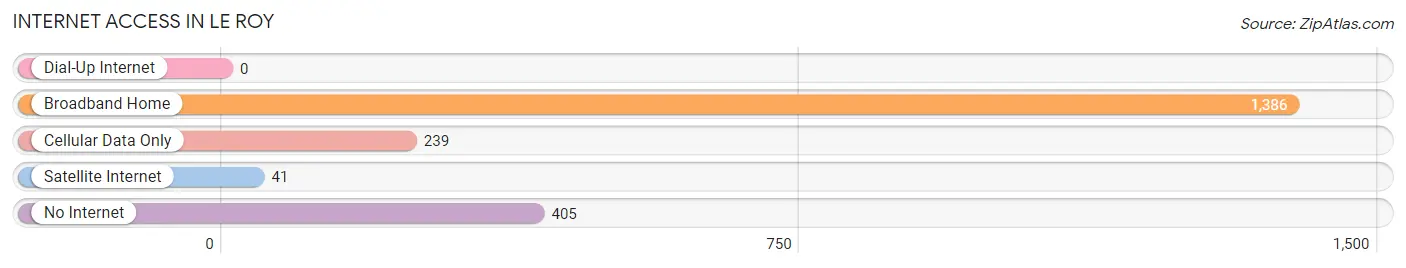
| Internet Type | # Households | % Households |
| Dial-Up Internet | 0 | 0.0% |
| Broadband Home | 1,386 | 67.4% |
| Cellular Data Only | 239 | 11.6% |
| Satellite Internet | 41 | 2.0% |
| No Internet | 405 | 19.7% |
| Total | 2,055 | 100.0% |
Le Roy Summary
Le Roy is a small town located in Genesee County, New York, United States. It is situated in the Finger Lakes region of the state, about 25 miles southwest of Rochester. The town was founded in 1812 and is named after the French explorer, Jean-Baptiste Le Roy. As of the 2010 census, the town had a population of 7,641.
Geography
Le Roy is located in the Finger Lakes region of New York, about 25 miles southwest of Rochester. The town is situated on the Genesee River, which flows through the town from east to west. The town is bordered by the towns of Stafford to the north, Pavilion to the east, Caledonia to the south, and Pembroke to the west.
The town has a total area of 33.2 square miles, of which 33.1 square miles is land and 0.1 square miles is water. The terrain is generally flat, with some rolling hills in the northern part of the town.
Demographics
As of the 2010 census, there were 7,641 people, 2,945 households, and 2,039 families residing in the town. The population density was 231.2 people per square mile. There were 3,093 housing units at an average density of 93.4 per square mile. The racial makeup of the town was 97.2% White, 0.7% African American, 0.2% Native American, 0.5% Asian, 0.1% Pacific Islander, 0.3% from other races, and 1.0% from two or more races. Hispanic or Latino of any race were 1.3% of the population.
There were 2,945 households, out of which 33.2% had children under the age of 18 living with them, 54.2% were married couples living together, 11.2% had a female householder with no husband present, and 30.2% were non-families. 25.2% of all households were made up of individuals, and 11.2% had someone living alone who was 65 years of age or older. The average household size was 2.56 and the average family size was 3.06.
The median age in the town was 39.7 years. 24.7% of residents were under the age of 18; 7.2% were between the ages of 18 and 24; 25.2% were from 25 to 44; 28.2% were from 45 to 64; and 14.7% were 65 years of age or older. The gender makeup of the town was 48.3% male and 51.7% female.
Economy
Le Roy is home to several businesses, including manufacturing, retail, and service industries. The town is home to several large employers, including Le Roy Plastics, Inc., a plastics manufacturer; Le Roy Tool & Die, a tool and die manufacturer; and Le Roy Printing, a printing company.
The town is also home to several small businesses, including restaurants, retail stores, and professional services. The town is also home to several small farms, which produce a variety of fruits and vegetables.
The median household income in the town was $50,945, and the median family income was $60,945. About 8.2% of families and 10.2% of the population were below the poverty line, including 14.2% of those under age 18 and 6.2% of those age 65 or over.
Le Roy is served by the Genesee County Public Library System, which operates the Le Roy Public Library. The library offers a variety of services, including books, magazines, newspapers, audio books, DVDs, and online resources. The library also offers programs for children and adults, including story times, book clubs, and computer classes.
Common Questions
What is the Total Population of Le Roy?
Total Population of Le Roy is 4,332.
What is the Total Male Population of Le Roy?
Total Male Population of Le Roy is 2,048.
What is the Total Female Population of Le Roy?
Total Female Population of Le Roy is 2,284.
What is the Ratio of Males per 100 Females in Le Roy?
There are 89.67 Males per 100 Females in Le Roy.
What is the Ratio of Females per 100 Males in Le Roy?
There are 111.52 Females per 100 Males in Le Roy.
What is the Median Population Age in Le Roy?
Median Population Age in Le Roy is 38.2 Years.
What is the Average Family Size in Le Roy
Average Family Size in Le Roy is 2.7 People.
What is the Average Household Size in Le Roy
Average Household Size in Le Roy is 2.1 People.
What is Per Capita Income in Le Roy?
Per Capita income in Le Roy is $37,971.
What is the Median Family Income in Le Roy?
Median Family Income in Le Roy is $80,928.
What is the Median Household income in Le Roy?
Median Household Income in Le Roy is $62,833.
What is Income or Wage Gap in Le Roy?
Income or Wage Gap in Le Roy is 32.4%.
Women in Le Roy earn 67.6 cents for every dollar earned by a man.
What is Inequality or Gini Index in Le Roy?
Inequality or Gini Index in Le Roy is 0.48.
How Large is the Labor Force in Le Roy?
There are 2,161 People in the Labor Forcein in Le Roy.
What is the Percentage of People in the Labor Force in Le Roy?
60.2% of People are in the Labor Force in Le Roy.
What is the Unemployment Rate in Le Roy?
Unemployment Rate in Le Roy is 1.9%.