Cities with the Highest Percentage of Population with a Degree in Bio, Nature & Agricultural in North Carolina
RELATED REPORTS & OPTIONS
Bio, Nature & Agricultural
North Carolina
Compare Cities
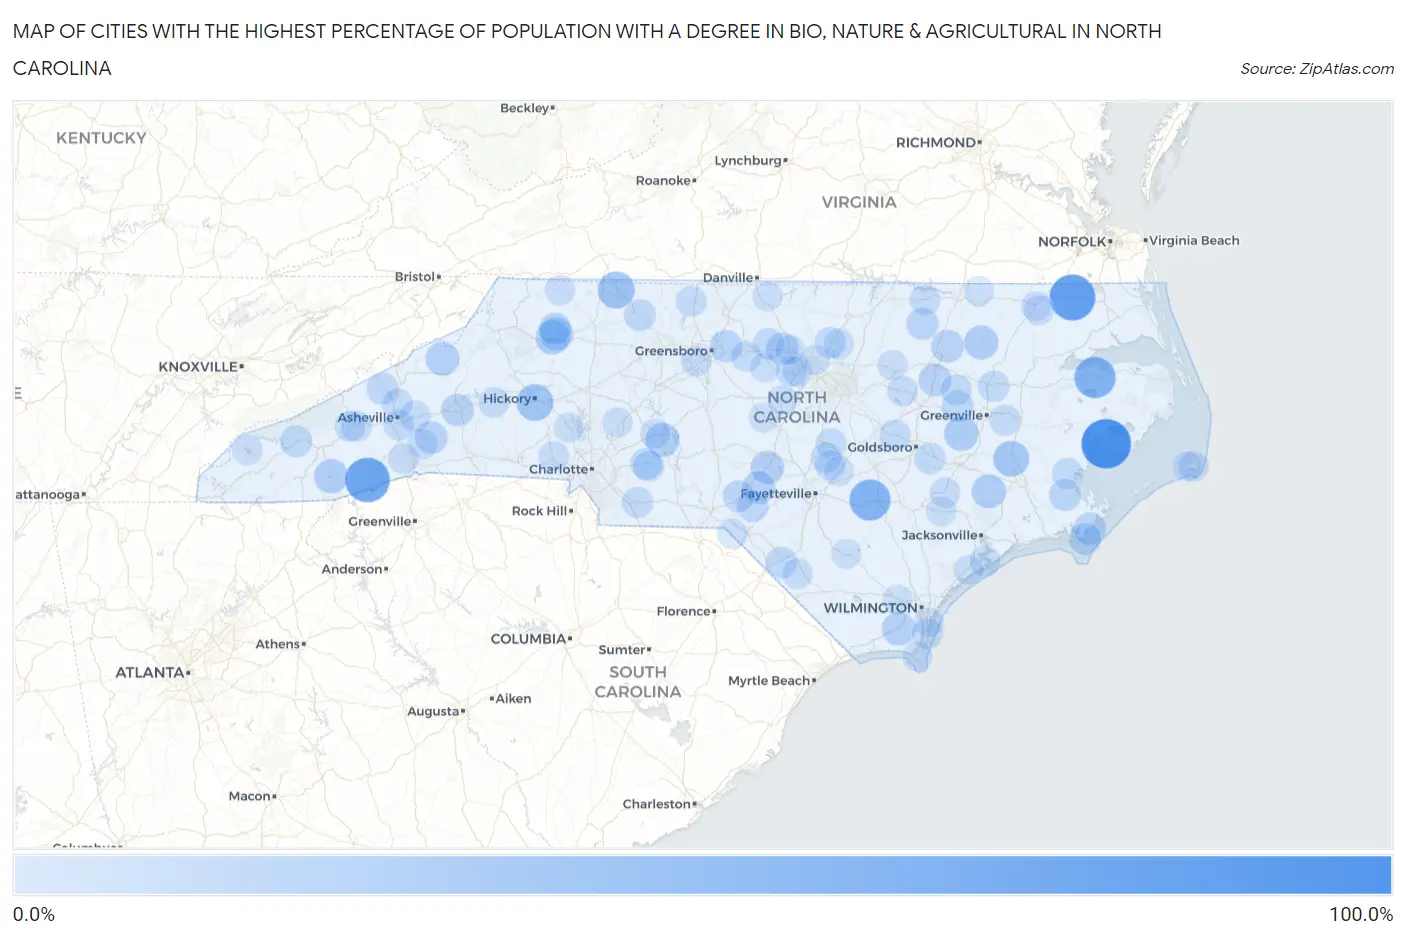
Map of Cities with the Highest Percentage of Population with a Degree in Bio, Nature & Agricultural in North Carolina
0.0%
100.0%
Cities with the Highest Percentage of Population with a Degree in Bio, Nature & Agricultural in North Carolina
| City | % Graduates | vs State | vs National | |
| 1. | Swan Quarter | 100.0% | 6.5%(+93.5)#1 | 6.4%(+93.6)#22 |
| 2. | Sunbury | 82.4% | 6.5%(+75.9)#2 | 6.4%(+76.0)#128 |
| 3. | Rosman | 76.2% | 6.5%(+69.7)#3 | 6.4%(+69.8)#156 |
| 4. | Creswell | 60.9% | 6.5%(+54.4)#4 | 6.4%(+54.5)#237 |
| 5. | Bonnetsville | 60.0% | 6.5%(+53.5)#5 | 6.4%(+53.6)#240 |
| 6. | Crouse | 50.0% | 6.5%(+43.5)#6 | 6.4%(+43.6)#335 |
| 7. | Emma | 44.7% | 6.5%(+38.2)#7 | 6.4%(+38.4)#440 |
| 8. | Toast | 41.7% | 6.5%(+35.2)#8 | 6.4%(+35.3)#496 |
| 9. | Brookford | 40.0% | 6.5%(+33.5)#9 | 6.4%(+33.6)#536 |
| 10. | Vanceboro | 35.7% | 6.5%(+29.2)#10 | 6.4%(+29.4)#683 |
| 11. | Maury | 29.6% | 6.5%(+23.1)#11 | 6.4%(+23.3)#1,007 |
| 12. | Cricket | 29.0% | 6.5%(+22.5)#12 | 6.4%(+22.7)#1,041 |
| 13. | New London | 28.9% | 6.5%(+22.4)#13 | 6.4%(+22.5)#1,043 |
| 14. | Glenville | 28.6% | 6.5%(+22.1)#14 | 6.4%(+22.2)#1,068 |
| 15. | Scotland Neck | 28.5% | 6.5%(+22.0)#15 | 6.4%(+22.1)#1,085 |
| 16. | Trenton | 28.2% | 6.5%(+21.7)#16 | 6.4%(+21.9)#1,095 |
| 17. | Fairplains | 27.0% | 6.5%(+20.5)#17 | 6.4%(+20.7)#1,168 |
| 18. | Bakersville | 26.7% | 6.5%(+20.2)#18 | 6.4%(+20.3)#1,199 |
| 19. | Bolivia | 26.2% | 6.5%(+19.7)#19 | 6.4%(+19.8)#1,261 |
| 20. | Vass | 24.9% | 6.5%(+18.4)#20 | 6.4%(+18.5)#1,440 |
| 21. | Ashley Heights | 23.7% | 6.5%(+17.2)#21 | 6.4%(+17.3)#1,538 |
| 22. | Whitakers | 23.2% | 6.5%(+16.7)#22 | 6.4%(+16.9)#1,587 |
| 23. | Sharpsburg | 22.8% | 6.5%(+16.3)#23 | 6.4%(+16.4)#1,639 |
| 24. | West Marion | 22.5% | 6.5%(+16.1)#24 | 6.4%(+16.2)#1,667 |
| 25. | Chimney Rock Village | 22.4% | 6.5%(+15.9)#25 | 6.4%(+16.0)#1,687 |
| 26. | Efland | 21.5% | 6.5%(+15.0)#26 | 6.4%(+15.2)#1,806 |
| 27. | Davis | 21.1% | 6.5%(+14.6)#27 | 6.4%(+14.8)#1,864 |
| 28. | Marshallberg | 20.5% | 6.5%(+14.1)#28 | 6.4%(+14.2)#1,944 |
| 29. | Mcleansville | 20.4% | 6.5%(+13.9)#29 | 6.4%(+14.1)#1,954 |
| 30. | Hollister | 20.4% | 6.5%(+13.9)#30 | 6.4%(+14.1)#1,959 |
| 31. | Oriental | 19.1% | 6.5%(+12.7)#31 | 6.4%(+12.8)#2,220 |
| 32. | Mulberry | 19.0% | 6.5%(+12.6)#32 | 6.4%(+12.7)#2,250 |
| 33. | Fountain | 18.8% | 6.5%(+12.3)#33 | 6.4%(+12.4)#2,308 |
| 34. | Deercroft | 18.6% | 6.5%(+12.1)#34 | 6.4%(+12.2)#2,336 |
| 35. | Marshall | 18.3% | 6.5%(+11.9)#35 | 6.4%(+12.0)#2,375 |
| 36. | Bryson City | 18.3% | 6.5%(+11.8)#36 | 6.4%(+11.9)#2,383 |
| 37. | Pinnacle | 18.3% | 6.5%(+11.8)#37 | 6.4%(+11.9)#2,385 |
| 38. | Hoffman | 18.2% | 6.5%(+11.7)#38 | 6.4%(+11.8)#2,397 |
| 39. | Red Cross | 18.2% | 6.5%(+11.7)#39 | 6.4%(+11.8)#2,398 |
| 40. | Mcdonald | 17.6% | 6.5%(+11.2)#40 | 6.4%(+11.3)#2,525 |
| 41. | Spout Springs | 17.0% | 6.5%(+10.5)#41 | 6.4%(+10.6)#2,644 |
| 42. | Walnut Creek | 17.0% | 6.5%(+10.5)#42 | 6.4%(+10.6)#2,649 |
| 43. | Woodlawn | 16.9% | 6.5%(+10.4)#43 | 6.4%(+10.5)#2,672 |
| 44. | Parmele | 16.7% | 6.5%(+10.2)#44 | 6.4%(+10.3)#2,759 |
| 45. | Vandemere | 16.0% | 6.5%(+9.52)#45 | 6.4%(+9.65)#2,954 |
| 46. | Oakboro | 15.9% | 6.5%(+9.43)#46 | 6.4%(+9.56)#2,974 |
| 47. | Pinetops | 15.8% | 6.5%(+9.31)#47 | 6.4%(+9.44)#2,998 |
| 48. | Butner | 15.7% | 6.5%(+9.24)#48 | 6.4%(+9.37)#3,030 |
| 49. | Princeton | 15.7% | 6.5%(+9.22)#49 | 6.4%(+9.35)#3,034 |
| 50. | Grimesland | 15.6% | 6.5%(+9.14)#50 | 6.4%(+9.27)#3,055 |
| 51. | Wingate | 15.2% | 6.5%(+8.71)#51 | 6.4%(+8.83)#3,191 |
| 52. | Swannanoa | 15.1% | 6.5%(+8.62)#52 | 6.4%(+8.75)#3,214 |
| 53. | Clyde | 14.9% | 6.5%(+8.40)#53 | 6.4%(+8.52)#3,272 |
| 54. | Biltmore Forest | 14.7% | 6.5%(+8.25)#54 | 6.4%(+8.38)#3,314 |
| 55. | Mayodan | 14.6% | 6.5%(+8.13)#55 | 6.4%(+8.25)#3,353 |
| 56. | Buies Creek | 14.5% | 6.5%(+7.99)#56 | 6.4%(+8.12)#3,411 |
| 57. | Carolina Beach | 14.5% | 6.5%(+7.98)#57 | 6.4%(+8.11)#3,419 |
| 58. | Alamance | 14.4% | 6.5%(+7.93)#58 | 6.4%(+8.06)#3,436 |
| 59. | Sneads Ferry | 14.3% | 6.5%(+7.81)#59 | 6.4%(+7.93)#3,472 |
| 60. | Carrboro | 14.0% | 6.5%(+7.56)#60 | 6.4%(+7.69)#3,631 |
| 61. | Littleton | 14.0% | 6.5%(+7.49)#61 | 6.4%(+7.62)#3,659 |
| 62. | Valley Hill | 13.8% | 6.5%(+7.32)#62 | 6.4%(+7.45)#3,723 |
| 63. | Lake Junaluska | 13.8% | 6.5%(+7.27)#63 | 6.4%(+7.40)#3,753 |
| 64. | Chapel Hill | 13.6% | 6.5%(+7.12)#64 | 6.4%(+7.24)#3,809 |
| 65. | Jamestown | 13.5% | 6.5%(+7.01)#65 | 6.4%(+7.14)#3,848 |
| 66. | Salem | 13.5% | 6.5%(+6.99)#66 | 6.4%(+7.12)#3,858 |
| 67. | Bunnlevel | 13.4% | 6.5%(+6.95)#67 | 6.4%(+7.08)#3,878 |
| 68. | Weaverville | 13.4% | 6.5%(+6.92)#68 | 6.4%(+7.04)#3,890 |
| 69. | Proctorville | 13.3% | 6.5%(+6.85)#69 | 6.4%(+6.98)#3,938 |
| 70. | Pink Hill | 13.0% | 6.5%(+6.48)#70 | 6.4%(+6.61)#4,092 |
| 71. | Bailey | 13.0% | 6.5%(+6.48)#71 | 6.4%(+6.61)#4,093 |
| 72. | Creedmoor | 12.8% | 6.5%(+6.29)#72 | 6.4%(+6.41)#4,184 |
| 73. | Buxton | 12.7% | 6.5%(+6.26)#73 | 6.4%(+6.39)#4,198 |
| 74. | Edneyville | 12.5% | 6.5%(+6.02)#74 | 6.4%(+6.15)#4,305 |
| 75. | Gibson | 12.2% | 6.5%(+5.76)#75 | 6.4%(+5.89)#4,484 |
| 76. | Cofield | 12.2% | 6.5%(+5.76)#76 | 6.4%(+5.89)#4,487 |
| 77. | Lake Santeetlah | 12.2% | 6.5%(+5.76)#77 | 6.4%(+5.89)#4,489 |
| 78. | Dallas | 12.2% | 6.5%(+5.72)#78 | 6.4%(+5.85)#4,506 |
| 79. | Lake Royale | 11.9% | 6.5%(+5.44)#79 | 6.4%(+5.57)#4,654 |
| 80. | Linden | 11.8% | 6.5%(+5.28)#80 | 6.4%(+5.41)#4,761 |
| 81. | Misenheimer | 11.6% | 6.5%(+5.15)#81 | 6.4%(+5.27)#4,825 |
| 82. | Beulaville | 11.6% | 6.5%(+5.12)#82 | 6.4%(+5.25)#4,837 |
| 83. | Sparta | 11.6% | 6.5%(+5.11)#83 | 6.4%(+5.24)#4,840 |
| 84. | Landis | 11.5% | 6.5%(+5.02)#84 | 6.4%(+5.15)#4,901 |
| 85. | Goldston | 11.4% | 6.5%(+4.88)#85 | 6.4%(+5.01)#4,980 |
| 86. | Bald Head Island | 11.4% | 6.5%(+4.88)#86 | 6.4%(+5.01)#4,982 |
| 87. | Yanceyville | 11.2% | 6.5%(+4.76)#87 | 6.4%(+4.88)#5,053 |
| 88. | Denver | 11.2% | 6.5%(+4.71)#88 | 6.4%(+4.84)#5,077 |
| 89. | Sandy Creek | 11.1% | 6.5%(+4.63)#89 | 6.4%(+4.76)#5,150 |
| 90. | Holly Ridge | 10.9% | 6.5%(+4.44)#90 | 6.4%(+4.57)#5,275 |
| 91. | Elizabethtown | 10.9% | 6.5%(+4.43)#91 | 6.4%(+4.56)#5,284 |
| 92. | Pittsboro | 10.9% | 6.5%(+4.43)#92 | 6.4%(+4.55)#5,297 |
| 93. | Saxapahaw | 10.9% | 6.5%(+4.42)#93 | 6.4%(+4.55)#5,300 |
| 94. | Godwin | 10.9% | 6.5%(+4.39)#94 | 6.4%(+4.52)#5,322 |
| 95. | Myrtle Grove | 10.9% | 6.5%(+4.38)#95 | 6.4%(+4.51)#5,326 |
| 96. | Frisco | 10.8% | 6.5%(+4.36)#96 | 6.4%(+4.49)#5,340 |
| 97. | Winton | 10.8% | 6.5%(+4.33)#97 | 6.4%(+4.46)#5,360 |
| 98. | Durham | 10.8% | 6.5%(+4.30)#98 | 6.4%(+4.42)#5,391 |
| 99. | Hillsborough | 10.7% | 6.5%(+4.26)#99 | 6.4%(+4.39)#5,410 |
| 100. | Seaboard | 10.7% | 6.5%(+4.23)#100 | 6.4%(+4.36)#5,439 |
Common Questions
What are the Top 10 Cities with the Highest Percentage of Population with a Degree in Bio, Nature & Agricultural in North Carolina?
Top 10 Cities with the Highest Percentage of Population with a Degree in Bio, Nature & Agricultural in North Carolina are:
#1
100.0%
#2
82.4%
#3
76.2%
#4
60.9%
#5
60.0%
#6
41.7%
#7
40.0%
#8
35.7%
#9
29.6%
#10
29.0%
What city has the Highest Percentage of Population with a Degree in Bio, Nature & Agricultural in North Carolina?
Swan Quarter has the Highest Percentage of Population with a Degree in Bio, Nature & Agricultural in North Carolina with 100.0%.
What is the Percentage of Population with a Degree in Bio, Nature & Agricultural in the State of North Carolina?
Percentage of Population with a Degree in Bio, Nature & Agricultural in North Carolina is 6.5%.
What is the Percentage of Population with a Degree in Bio, Nature & Agricultural in the United States?
Percentage of Population with a Degree in Bio, Nature & Agricultural in the United States is 6.4%.