Cities with the Highest Percentage of Population with a Degree in Bio, Nature & Agricultural in Montana
RELATED REPORTS & OPTIONS
Bio, Nature & Agricultural
Montana
Compare Cities
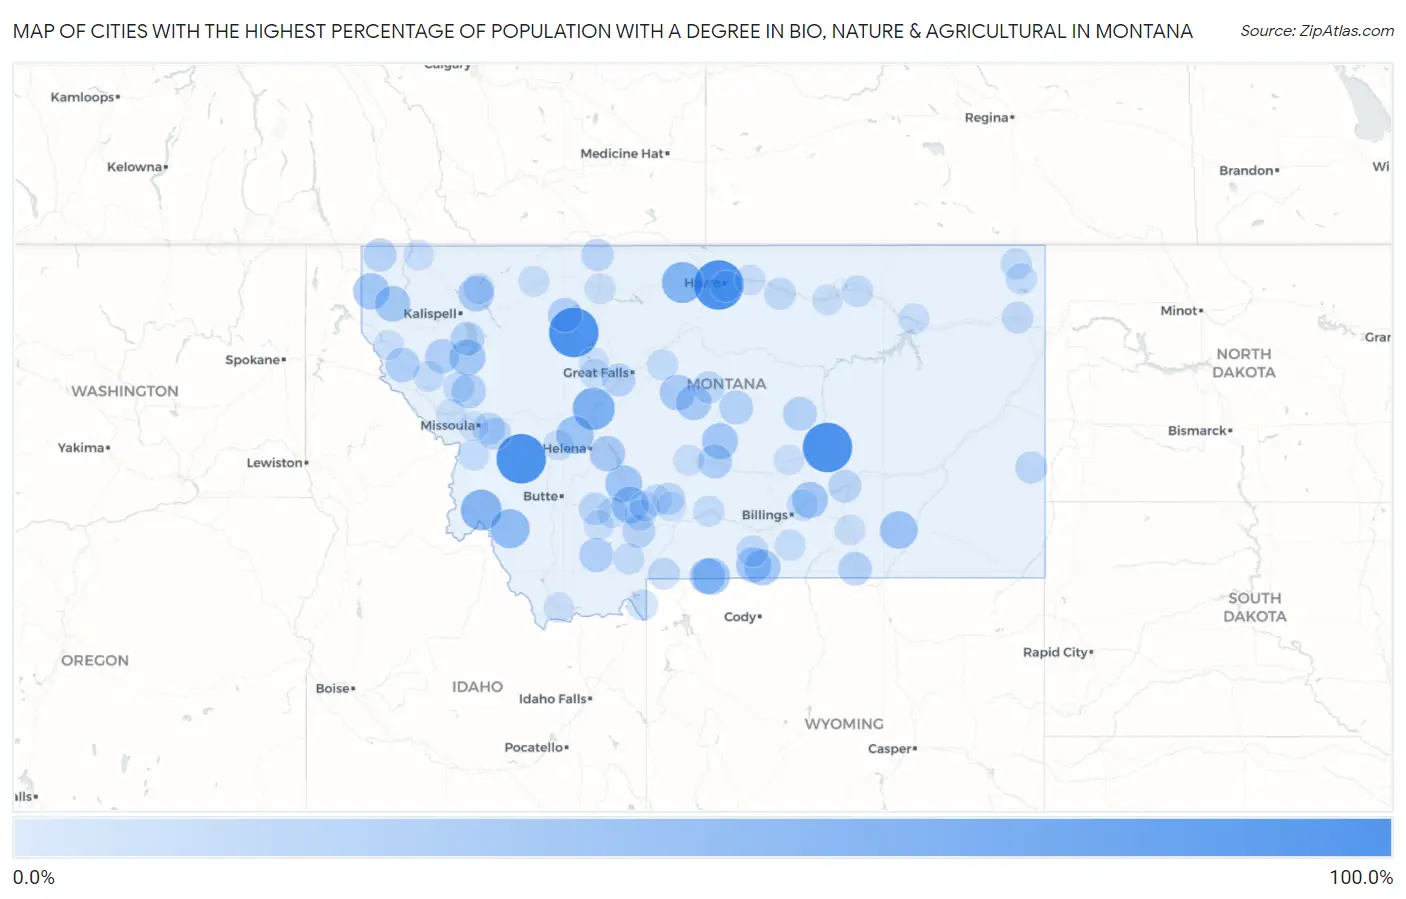
Map of Cities with the Highest Percentage of Population with a Degree in Bio, Nature & Agricultural in Montana
0.0%
100.0%
Cities with the Highest Percentage of Population with a Degree in Bio, Nature & Agricultural in Montana
| City | % Graduates | vs State | vs National | |
| 1. | Maxville | 100.0% | 11.2%(+88.8)#1 | 6.4%(+93.6)#50 |
| 2. | Melstone | 100.0% | 11.2%(+88.8)#2 | 6.4%(+93.6)#67 |
| 3. | Herron | 100.0% | 11.2%(+88.8)#3 | 6.4%(+93.6)#97 |
| 4. | Bynum | 100.0% | 11.2%(+88.8)#4 | 6.4%(+93.6)#108 |
| 5. | Bloomfield | 100.0% | 11.2%(+88.8)#5 | 6.4%(+93.6)#111 |
| 6. | Cyr | 78.4% | 11.2%(+67.2)#6 | 6.4%(+72.0)#146 |
| 7. | Craig | 66.7% | 11.2%(+55.5)#7 | 6.4%(+60.3)#198 |
| 8. | Hingham | 62.5% | 11.2%(+51.3)#8 | 6.4%(+56.1)#225 |
| 9. | Lakeview | 62.5% | 11.2%(+51.3)#9 | 6.4%(+56.1)#226 |
| 10. | Sula | 61.1% | 11.2%(+49.9)#10 | 6.4%(+54.8)#235 |
| 11. | Wisdom | 53.8% | 11.2%(+42.6)#11 | 6.4%(+47.5)#283 |
| 12. | Potomac | 52.6% | 11.2%(+41.4)#12 | 6.4%(+46.3)#299 |
| 13. | Montaqua | 50.0% | 11.2%(+38.8)#13 | 6.4%(+43.6)#350 |
| 14. | Essex | 48.7% | 11.2%(+37.5)#14 | 6.4%(+42.4)#386 |
| 15. | Lame Deer | 47.2% | 11.2%(+36.0)#15 | 6.4%(+40.9)#402 |
| 16. | Marysville | 47.1% | 11.2%(+35.9)#16 | 6.4%(+40.7)#410 |
| 17. | Cooke City | 44.4% | 11.2%(+33.2)#17 | 6.4%(+38.1)#449 |
| 18. | Toston | 44.0% | 11.2%(+32.8)#18 | 6.4%(+37.6)#456 |
| 19. | Gallatin River Ranch | 43.8% | 11.2%(+32.6)#19 | 6.4%(+37.4)#462 |
| 20. | Troy | 41.5% | 11.2%(+30.3)#20 | 6.4%(+35.2)#504 |
| 21. | Judith Gap | 41.2% | 11.2%(+30.0)#21 | 6.4%(+34.8)#513 |
| 22. | Worden | 41.1% | 11.2%(+29.9)#22 | 6.4%(+34.7)#515 |
| 23. | Kerr | 40.0% | 11.2%(+28.8)#23 | 6.4%(+33.6)#545 |
| 24. | Belfry | 39.5% | 11.2%(+28.3)#24 | 6.4%(+33.2)#572 |
| 25. | Pioneer Junction | 39.1% | 11.2%(+27.9)#25 | 6.4%(+32.8)#583 |
| 26. | Silver Gate | 39.1% | 11.2%(+27.9)#26 | 6.4%(+32.8)#586 |
| 27. | Coram | 38.3% | 11.2%(+27.1)#27 | 6.4%(+31.9)#603 |
| 28. | Bearcreek | 38.2% | 11.2%(+27.0)#28 | 6.4%(+31.9)#605 |
| 29. | Geyser | 38.1% | 11.2%(+26.9)#29 | 6.4%(+31.7)#609 |
| 30. | Stanford | 37.9% | 11.2%(+26.7)#30 | 6.4%(+31.6)#612 |
| 31. | Spokane Creek | 37.8% | 11.2%(+26.6)#31 | 6.4%(+31.5)#617 |
| 32. | York | 36.0% | 11.2%(+24.8)#32 | 6.4%(+29.6)#680 |
| 33. | Thompson Falls | 33.3% | 11.2%(+22.1)#33 | 6.4%(+27.0)#747 |
| 34. | Harlowton | 33.3% | 11.2%(+22.1)#34 | 6.4%(+27.0)#749 |
| 35. | Ravalli | 33.3% | 11.2%(+22.1)#35 | 6.4%(+27.0)#783 |
| 36. | Lonepine | 33.3% | 11.2%(+22.1)#36 | 6.4%(+27.0)#793 |
| 37. | Dupuyer | 33.3% | 11.2%(+22.1)#37 | 6.4%(+27.0)#797 |
| 38. | Grant | 33.3% | 11.2%(+22.1)#38 | 6.4%(+27.0)#823 |
| 39. | Wise River | 33.3% | 11.2%(+22.1)#39 | 6.4%(+27.0)#831 |
| 40. | Virginia City | 32.4% | 11.2%(+21.2)#40 | 6.4%(+26.0)#854 |
| 41. | Winnett | 31.6% | 11.2%(+20.4)#41 | 6.4%(+25.2)#888 |
| 42. | Pinnacle | 31.2% | 11.2%(+20.1)#42 | 6.4%(+24.9)#908 |
| 43. | Rollins | 31.0% | 11.2%(+19.8)#43 | 6.4%(+24.7)#920 |
| 44. | Lewistown Heights | 30.9% | 11.2%(+19.7)#44 | 6.4%(+24.6)#925 |
| 45. | Wyola | 30.4% | 11.2%(+19.2)#45 | 6.4%(+24.1)#955 |
| 46. | Yaak | 28.6% | 11.2%(+17.4)#46 | 6.4%(+22.2)#1,054 |
| 47. | Ulm | 28.2% | 11.2%(+17.0)#47 | 6.4%(+21.8)#1,096 |
| 48. | Gallatin Gateway | 28.1% | 11.2%(+16.9)#48 | 6.4%(+21.7)#1,101 |
| 49. | Custer | 26.9% | 11.2%(+15.7)#49 | 6.4%(+20.6)#1,181 |
| 50. | Turah | 25.9% | 11.2%(+14.7)#50 | 6.4%(+19.5)#1,278 |
| 51. | Clinton | 25.5% | 11.2%(+14.3)#51 | 6.4%(+19.2)#1,315 |
| 52. | Sunburst | 25.4% | 11.2%(+14.2)#52 | 6.4%(+19.0)#1,324 |
| 53. | Unionville | 25.1% | 11.2%(+13.9)#53 | 6.4%(+18.8)#1,344 |
| 54. | Cardwell | 25.0% | 11.2%(+13.8)#54 | 6.4%(+18.6)#1,433 |
| 55. | Baker | 24.6% | 11.2%(+13.4)#55 | 6.4%(+18.2)#1,465 |
| 56. | Denton | 24.4% | 11.2%(+13.2)#56 | 6.4%(+18.0)#1,475 |
| 57. | Wilsall | 23.9% | 11.2%(+12.7)#57 | 6.4%(+17.6)#1,520 |
| 58. | Fort Belknap Agency | 23.4% | 11.2%(+12.2)#58 | 6.4%(+17.1)#1,570 |
| 59. | Gardiner | 23.1% | 11.2%(+11.9)#59 | 6.4%(+16.8)#1,598 |
| 60. | Culbertson | 23.1% | 11.2%(+11.9)#60 | 6.4%(+16.7)#1,602 |
| 61. | Roberts | 22.6% | 11.2%(+11.4)#61 | 6.4%(+16.2)#1,665 |
| 62. | Saco | 21.7% | 11.2%(+10.5)#62 | 6.4%(+15.4)#1,784 |
| 63. | Huntley | 21.4% | 11.2%(+10.2)#63 | 6.4%(+15.1)#1,817 |
| 64. | Saddle Butte | 21.4% | 11.2%(+10.2)#64 | 6.4%(+15.1)#1,825 |
| 65. | Belgrade | 21.1% | 11.2%(+9.92)#65 | 6.4%(+14.8)#1,866 |
| 66. | Dixon | 20.9% | 11.2%(+9.73)#66 | 6.4%(+14.6)#1,893 |
| 67. | Big Sky | 20.9% | 11.2%(+9.67)#67 | 6.4%(+14.5)#1,901 |
| 68. | Plentywood | 20.8% | 11.2%(+9.59)#68 | 6.4%(+14.4)#1,915 |
| 69. | Stevensville | 20.1% | 11.2%(+8.85)#69 | 6.4%(+13.7)#1,990 |
| 70. | Big Timber | 20.0% | 11.2%(+8.80)#70 | 6.4%(+13.6)#1,996 |
| 71. | Pryor | 20.0% | 11.2%(+8.80)#71 | 6.4%(+13.6)#2,007 |
| 72. | West Glacier | 20.0% | 11.2%(+8.80)#72 | 6.4%(+13.6)#2,058 |
| 73. | Reserve | 20.0% | 11.2%(+8.80)#73 | 6.4%(+13.6)#2,088 |
| 74. | Jackson | 20.0% | 11.2%(+8.80)#74 | 6.4%(+13.6)#2,090 |
| 75. | Plains | 19.7% | 11.2%(+8.53)#75 | 6.4%(+13.4)#2,112 |
| 76. | Sedan | 19.6% | 11.2%(+8.45)#76 | 6.4%(+13.3)#2,130 |
| 77. | Highwood | 19.4% | 11.2%(+8.25)#77 | 6.4%(+13.1)#2,165 |
| 78. | West Yellowstone | 19.4% | 11.2%(+8.23)#78 | 6.4%(+13.1)#2,168 |
| 79. | Shelby | 19.2% | 11.2%(+7.99)#79 | 6.4%(+12.8)#2,210 |
| 80. | Martinsdale | 18.9% | 11.2%(+7.72)#80 | 6.4%(+12.6)#2,276 |
| 81. | Springhill | 18.9% | 11.2%(+7.65)#81 | 6.4%(+12.5)#2,284 |
| 82. | Nashua | 18.8% | 11.2%(+7.55)#82 | 6.4%(+12.4)#2,306 |
| 83. | North Browning | 18.5% | 11.2%(+7.33)#83 | 6.4%(+12.2)#2,339 |
| 84. | Avon | 18.4% | 11.2%(+7.17)#84 | 6.4%(+12.0)#2,373 |
| 85. | Willow Creek | 18.2% | 11.2%(+6.98)#85 | 6.4%(+11.8)#2,417 |
| 86. | Silver Star | 18.2% | 11.2%(+6.98)#86 | 6.4%(+11.8)#2,429 |
| 87. | Crow Agency | 18.1% | 11.2%(+6.89)#87 | 6.4%(+11.7)#2,447 |
| 88. | Malta | 18.0% | 11.2%(+6.82)#88 | 6.4%(+11.7)#2,460 |
| 89. | Chinook | 17.9% | 11.2%(+6.72)#89 | 6.4%(+11.6)#2,475 |
| 90. | Eureka | 17.8% | 11.2%(+6.58)#90 | 6.4%(+11.4)#2,498 |
| 91. | Pony | 17.1% | 11.2%(+5.88)#91 | 6.4%(+10.7)#2,628 |
| 92. | Fairfield | 17.0% | 11.2%(+5.80)#92 | 6.4%(+10.6)#2,642 |
| 93. | Roundup | 16.9% | 11.2%(+5.74)#93 | 6.4%(+10.6)#2,658 |
| 94. | Alberton | 16.9% | 11.2%(+5.69)#94 | 6.4%(+10.5)#2,670 |
| 95. | Lima | 16.7% | 11.2%(+5.47)#95 | 6.4%(+10.3)#2,763 |
| 96. | Maverick Mountain | 16.7% | 11.2%(+5.47)#96 | 6.4%(+10.3)#2,796 |
| 97. | Clyde Park | 16.3% | 11.2%(+5.08)#97 | 6.4%(+9.93)#2,870 |
| 98. | Trout Creek | 16.0% | 11.2%(+4.76)#98 | 6.4%(+9.60)#2,962 |
| 99. | Orchard Homes | 15.9% | 11.2%(+4.74)#99 | 6.4%(+9.58)#2,968 |
| 100. | Simms | 15.8% | 11.2%(+4.59)#100 | 6.4%(+9.44)#3,007 |
Common Questions
What are the Top 10 Cities with the Highest Percentage of Population with a Degree in Bio, Nature & Agricultural in Montana?
Top 10 Cities with the Highest Percentage of Population with a Degree in Bio, Nature & Agricultural in Montana are:
What city has the Highest Percentage of Population with a Degree in Bio, Nature & Agricultural in Montana?
Maxville has the Highest Percentage of Population with a Degree in Bio, Nature & Agricultural in Montana with 100.0%.
What is the Percentage of Population with a Degree in Bio, Nature & Agricultural in the State of Montana?
Percentage of Population with a Degree in Bio, Nature & Agricultural in Montana is 11.2%.
What is the Percentage of Population with a Degree in Bio, Nature & Agricultural in the United States?
Percentage of Population with a Degree in Bio, Nature & Agricultural in the United States is 6.4%.