Cities with the Highest Poverty Level Among Children Under the Age of 5 in Iowa
RELATED REPORTS & OPTIONS
Highest Poverty | Child 0-5
Iowa
Compare Cities
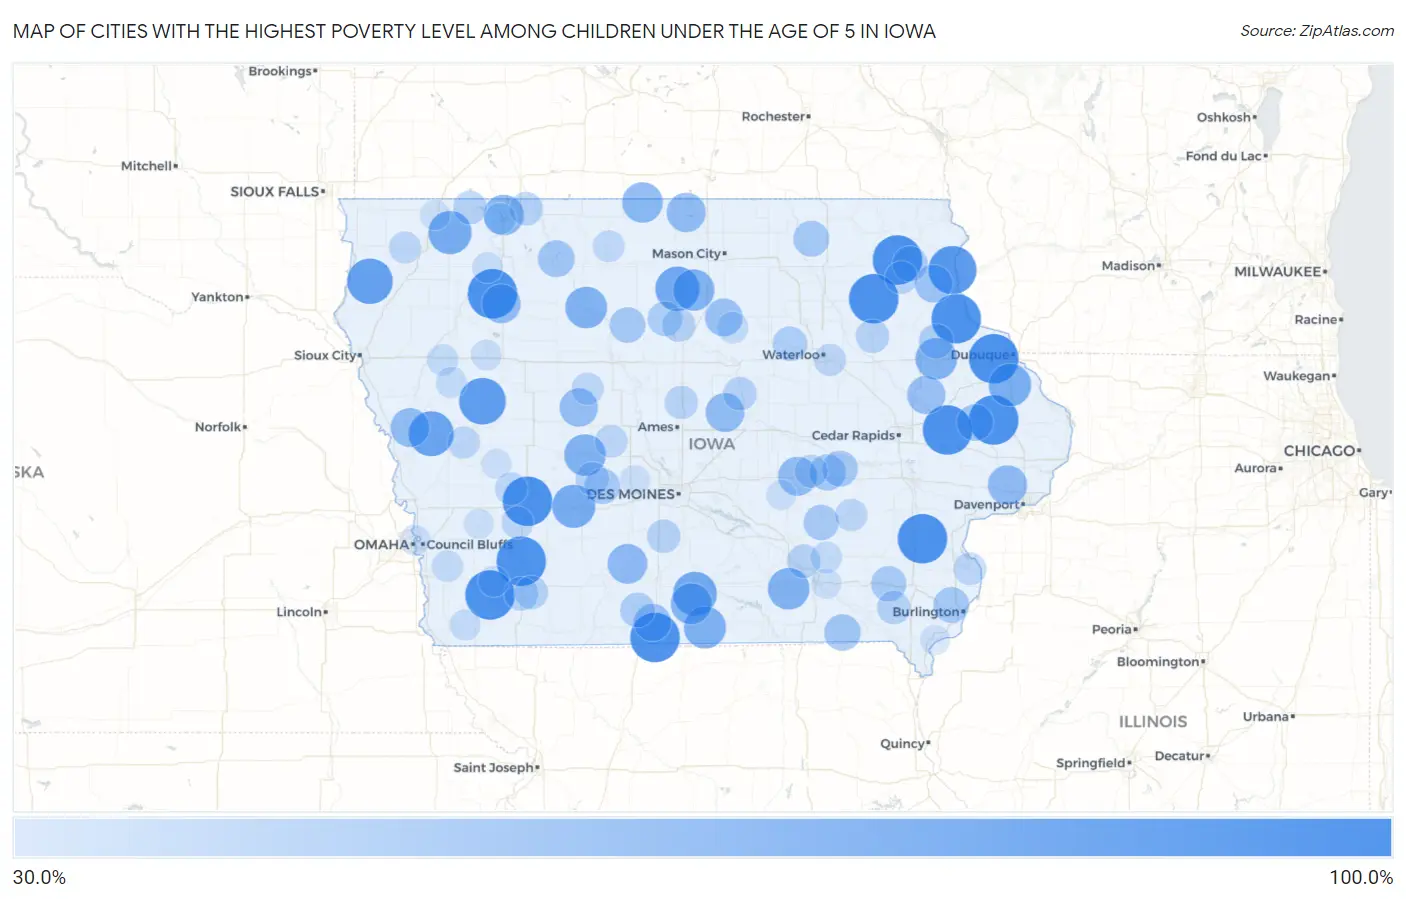
Map of Cities with the Highest Poverty Level Among Children Under the Age of 5 in Iowa
0.0%
100.0%
Cities with the Highest Poverty Level Among Children Under the Age of 5 in Iowa
| City | Child Poverty | vs State | vs National | |
| 1. | Davis City | 100.0% | 14.3%(+85.7)#1 | 18.1%(+81.9)#551 |
| 2. | Osterdock | 100.0% | 14.3%(+85.7)#2 | 18.1%(+81.9)#655 |
| 3. | Linn Grove | 100.0% | 14.3%(+85.7)#3 | 18.1%(+81.9)#676 |
| 4. | Castalia | 100.0% | 14.3%(+85.7)#4 | 18.1%(+81.9)#686 |
| 5. | Baldwin | 100.0% | 14.3%(+85.7)#5 | 18.1%(+81.9)#692 |
| 6. | Centralia | 100.0% | 14.3%(+85.7)#6 | 18.1%(+81.9)#707 |
| 7. | Brayton | 100.0% | 14.3%(+85.7)#7 | 18.1%(+81.9)#750 |
| 8. | Randalia | 100.0% | 14.3%(+85.7)#8 | 18.1%(+81.9)#838 |
| 9. | Grant | 100.0% | 14.3%(+85.7)#9 | 18.1%(+81.9)#841 |
| 10. | Morley | 100.0% | 14.3%(+85.7)#10 | 18.1%(+81.9)#866 |
| 11. | Coburg | 100.0% | 14.3%(+85.7)#11 | 18.1%(+81.9)#878 |
| 12. | Cotter | 100.0% | 14.3%(+85.7)#12 | 18.1%(+81.9)#907 |
| 13. | Marquette | 95.0% | 14.3%(+80.7)#13 | 18.1%(+76.9)#940 |
| 14. | Kiron | 90.9% | 14.3%(+76.6)#14 | 18.1%(+72.8)#1,007 |
| 15. | Ireton | 87.5% | 14.3%(+73.2)#15 | 18.1%(+69.4)#1,077 |
| 16. | Soldier | 85.7% | 14.3%(+71.4)#16 | 18.1%(+67.7)#1,144 |
| 17. | Goodell | 83.3% | 14.3%(+69.0)#17 | 18.1%(+65.3)#1,229 |
| 18. | Derby | 81.8% | 14.3%(+67.5)#18 | 18.1%(+63.8)#1,273 |
| 19. | Casey | 80.0% | 14.3%(+65.7)#19 | 18.1%(+61.9)#1,331 |
| 20. | Melvin | 80.0% | 14.3%(+65.7)#20 | 18.1%(+61.9)#1,338 |
| 21. | Zwingle | 77.8% | 14.3%(+63.5)#21 | 18.1%(+59.7)#1,419 |
| 22. | Allerton | 76.2% | 14.3%(+61.9)#22 | 18.1%(+58.1)#1,480 |
| 23. | Blakesburg | 75.0% | 14.3%(+60.7)#23 | 18.1%(+56.9)#1,535 |
| 24. | Bagley | 75.0% | 14.3%(+60.7)#24 | 18.1%(+56.9)#1,536 |
| 25. | Delaware | 75.0% | 14.3%(+60.7)#26 | 18.1%(+56.9)#1,552 |
| 26. | Bradgate | 75.0% | 14.3%(+60.7)#27 | 18.1%(+56.9)#1,553 |
| 27. | Meservey | 74.1% | 14.3%(+59.8)#28 | 18.1%(+56.0)#1,579 |
| 28. | Humeston | 72.7% | 14.3%(+58.4)#29 | 18.1%(+54.7)#1,646 |
| 29. | Rake | 71.4% | 14.3%(+57.1)#30 | 18.1%(+53.4)#1,710 |
| 30. | Okoboji | 70.8% | 14.3%(+56.5)#31 | 18.1%(+52.8)#1,740 |
| 31. | Lorimor | 69.0% | 14.3%(+54.7)#32 | 18.1%(+50.9)#1,847 |
| 32. | Maysville | 68.0% | 14.3%(+53.7)#33 | 18.1%(+49.9)#1,899 |
| 33. | Lake Mills | 67.3% | 14.3%(+53.0)#34 | 18.1%(+49.2)#1,944 |
| 34. | Malcom | 66.7% | 14.3%(+52.4)#35 | 18.1%(+48.6)#2,009 |
| 35. | Rembrandt | 66.7% | 14.3%(+52.4)#36 | 18.1%(+48.6)#2,016 |
| 36. | Turin | 66.7% | 14.3%(+52.4)#37 | 18.1%(+48.6)#2,024 |
| 37. | St Anthony | 66.7% | 14.3%(+52.4)#38 | 18.1%(+48.6)#2,029 |
| 38. | Churdan | 65.0% | 14.3%(+50.7)#39 | 18.1%(+46.9)#2,114 |
| 39. | Prairieburg | 64.3% | 14.3%(+50.0)#40 | 18.1%(+46.2)#2,170 |
| 40. | Hampton | 62.6% | 14.3%(+48.3)#41 | 18.1%(+44.6)#2,284 |
| 41. | Farmersburg | 62.5% | 14.3%(+48.2)#42 | 18.1%(+44.4)#2,303 |
| 42. | Decatur City | 61.5% | 14.3%(+47.2)#43 | 18.1%(+43.5)#2,390 |
| 43. | Emmetsburg | 59.8% | 14.3%(+45.5)#44 | 18.1%(+41.7)#2,557 |
| 44. | Wyoming | 59.1% | 14.3%(+44.8)#45 | 18.1%(+41.0)#2,597 |
| 45. | Milton | 59.1% | 14.3%(+44.8)#46 | 18.1%(+41.0)#2,598 |
| 46. | Victor | 58.7% | 14.3%(+44.4)#47 | 18.1%(+40.6)#2,634 |
| 47. | Elma | 57.1% | 14.3%(+42.8)#48 | 18.1%(+39.1)#2,759 |
| 48. | Ladora | 57.1% | 14.3%(+42.8)#49 | 18.1%(+39.1)#2,768 |
| 49. | Beaverdale | 56.8% | 14.3%(+42.5)#50 | 18.1%(+38.8)#2,791 |
| 50. | Thor | 56.5% | 14.3%(+42.2)#51 | 18.1%(+38.5)#2,820 |
| 51. | Linden | 56.2% | 14.3%(+42.0)#52 | 18.1%(+38.2)#2,844 |
| 52. | What Cheer | 56.0% | 14.3%(+41.7)#53 | 18.1%(+37.9)#2,863 |
| 53. | Postville | 55.8% | 14.3%(+41.5)#54 | 18.1%(+37.7)#2,889 |
| 54. | Lockridge | 55.6% | 14.3%(+41.3)#55 | 18.1%(+37.5)#2,913 |
| 55. | Clarion | 53.8% | 14.3%(+39.5)#56 | 18.1%(+35.8)#3,044 |
| 56. | Grand River | 53.8% | 14.3%(+39.5)#57 | 18.1%(+35.8)#3,054 |
| 57. | Greeley | 53.6% | 14.3%(+39.3)#58 | 18.1%(+35.5)#3,080 |
| 58. | New Hartford | 53.3% | 14.3%(+39.0)#59 | 18.1%(+35.3)#3,101 |
| 59. | Villisca | 51.4% | 14.3%(+37.1)#60 | 18.1%(+33.3)#3,297 |
| 60. | Hazleton | 50.0% | 14.3%(+35.7)#61 | 18.1%(+31.9)#3,434 |
| 61. | Union | 50.0% | 14.3%(+35.7)#62 | 18.1%(+31.9)#3,474 |
| 62. | Kirkville | 50.0% | 14.3%(+35.7)#63 | 18.1%(+31.9)#3,507 |
| 63. | Harris | 50.0% | 14.3%(+35.7)#64 | 18.1%(+31.9)#3,529 |
| 64. | Hillsboro | 50.0% | 14.3%(+35.7)#65 | 18.1%(+31.9)#3,549 |
| 65. | Superior | 50.0% | 14.3%(+35.7)#66 | 18.1%(+31.9)#3,551 |
| 66. | St Marys | 50.0% | 14.3%(+35.7)#67 | 18.1%(+31.9)#3,555 |
| 67. | Nodaway | 50.0% | 14.3%(+35.7)#68 | 18.1%(+31.9)#3,571 |
| 68. | Galt | 50.0% | 14.3%(+35.7)#69 | 18.1%(+31.9)#3,574 |
| 69. | Panora | 49.6% | 14.3%(+35.3)#70 | 18.1%(+31.5)#3,603 |
| 70. | Story City | 49.4% | 14.3%(+35.1)#71 | 18.1%(+31.3)#3,612 |
| 71. | Brooklyn | 48.3% | 14.3%(+34.0)#72 | 18.1%(+30.2)#3,716 |
| 72. | Clermont | 47.6% | 14.3%(+33.3)#73 | 18.1%(+29.6)#3,792 |
| 73. | Rippey | 47.4% | 14.3%(+33.1)#74 | 18.1%(+29.3)#3,825 |
| 74. | Oakville | 47.1% | 14.3%(+32.8)#75 | 18.1%(+29.0)#3,873 |
| 75. | Kimballton | 46.7% | 14.3%(+32.4)#76 | 18.1%(+28.6)#3,926 |
| 76. | Evansdale | 46.3% | 14.3%(+32.0)#77 | 18.1%(+28.2)#3,974 |
| 77. | Farnhamville | 46.2% | 14.3%(+31.9)#78 | 18.1%(+28.1)#3,995 |
| 78. | Dow City | 46.2% | 14.3%(+31.9)#79 | 18.1%(+28.1)#3,997 |
| 79. | South English | 46.2% | 14.3%(+31.9)#80 | 18.1%(+28.1)#4,003 |
| 80. | Atlantic | 45.8% | 14.3%(+31.5)#81 | 18.1%(+27.8)#4,038 |
| 81. | Boyden | 45.7% | 14.3%(+31.4)#82 | 18.1%(+27.6)#4,062 |
| 82. | Burt | 44.7% | 14.3%(+30.4)#83 | 18.1%(+26.7)#4,182 |
| 83. | Hedrick | 44.4% | 14.3%(+30.1)#84 | 18.1%(+26.4)#4,215 |
| 84. | Silver City | 44.4% | 14.3%(+30.1)#85 | 18.1%(+26.4)#4,223 |
| 85. | Geneva | 44.4% | 14.3%(+30.1)#86 | 18.1%(+26.4)#4,240 |
| 86. | Wahpeton | 43.8% | 14.3%(+29.5)#87 | 18.1%(+25.7)#4,327 |
| 87. | Cushing | 43.8% | 14.3%(+29.5)#88 | 18.1%(+25.7)#4,333 |
| 88. | Battle Creek | 42.9% | 14.3%(+28.6)#89 | 18.1%(+24.8)#4,449 |
| 89. | Farragut | 42.9% | 14.3%(+28.6)#90 | 18.1%(+24.8)#4,467 |
| 90. | Red Oak | 42.4% | 14.3%(+28.1)#91 | 18.1%(+24.3)#4,530 |
| 91. | Royal | 42.2% | 14.3%(+27.9)#92 | 18.1%(+24.1)#4,561 |
| 92. | Schaller | 41.5% | 14.3%(+27.2)#93 | 18.1%(+23.4)#4,651 |
| 93. | Carter Lake | 40.7% | 14.3%(+26.4)#94 | 18.1%(+22.6)#4,763 |
| 94. | Sibley | 40.4% | 14.3%(+26.1)#95 | 18.1%(+22.3)#4,813 |
| 95. | Fort Madison | 40.0% | 14.3%(+25.7)#96 | 18.1%(+22.0)#4,844 |
| 96. | Dallas Center | 40.0% | 14.3%(+25.7)#97 | 18.1%(+21.9)#4,851 |
| 97. | Agency | 40.0% | 14.3%(+25.7)#98 | 18.1%(+21.9)#4,879 |
| 98. | Irwin | 40.0% | 14.3%(+25.7)#99 | 18.1%(+21.9)#4,888 |
| 99. | Hancock | 40.0% | 14.3%(+25.7)#100 | 18.1%(+21.9)#4,898 |
| 100. | Searsboro | 40.0% | 14.3%(+25.7)#101 | 18.1%(+21.9)#4,919 |
Common Questions
What are the Top 10 Cities with the Highest Poverty Level Among Children Under the Age of 5 in Iowa?
Top 10 Cities with the Highest Poverty Level Among Children Under the Age of 5 in Iowa are:
#1
100.0%
#2
100.0%
#3
100.0%
#4
100.0%
#5
100.0%
#6
100.0%
#7
100.0%
#8
100.0%
#9
100.0%
#10
100.0%
What city has the Highest Poverty Level Among Children Under the Age of 5 in Iowa?
Davis City has the Highest Poverty Level Among Children Under the Age of 5 in Iowa with 100.0%.
What is the Poverty Level Among Children Under the Age of 5 in the State of Iowa?
Poverty Level Among Children Under the Age of 5 in Iowa is 14.3%.
What is the Poverty Level Among Children Under the Age of 5 in the United States?
Poverty Level Among Children Under the Age of 5 in the United States is 18.1%.