Cities with the Highest Poverty Level Among Children Under the Age of 5 in Pennsylvania
RELATED REPORTS & OPTIONS
Highest Poverty | Child 0-5
Pennsylvania
Compare Cities
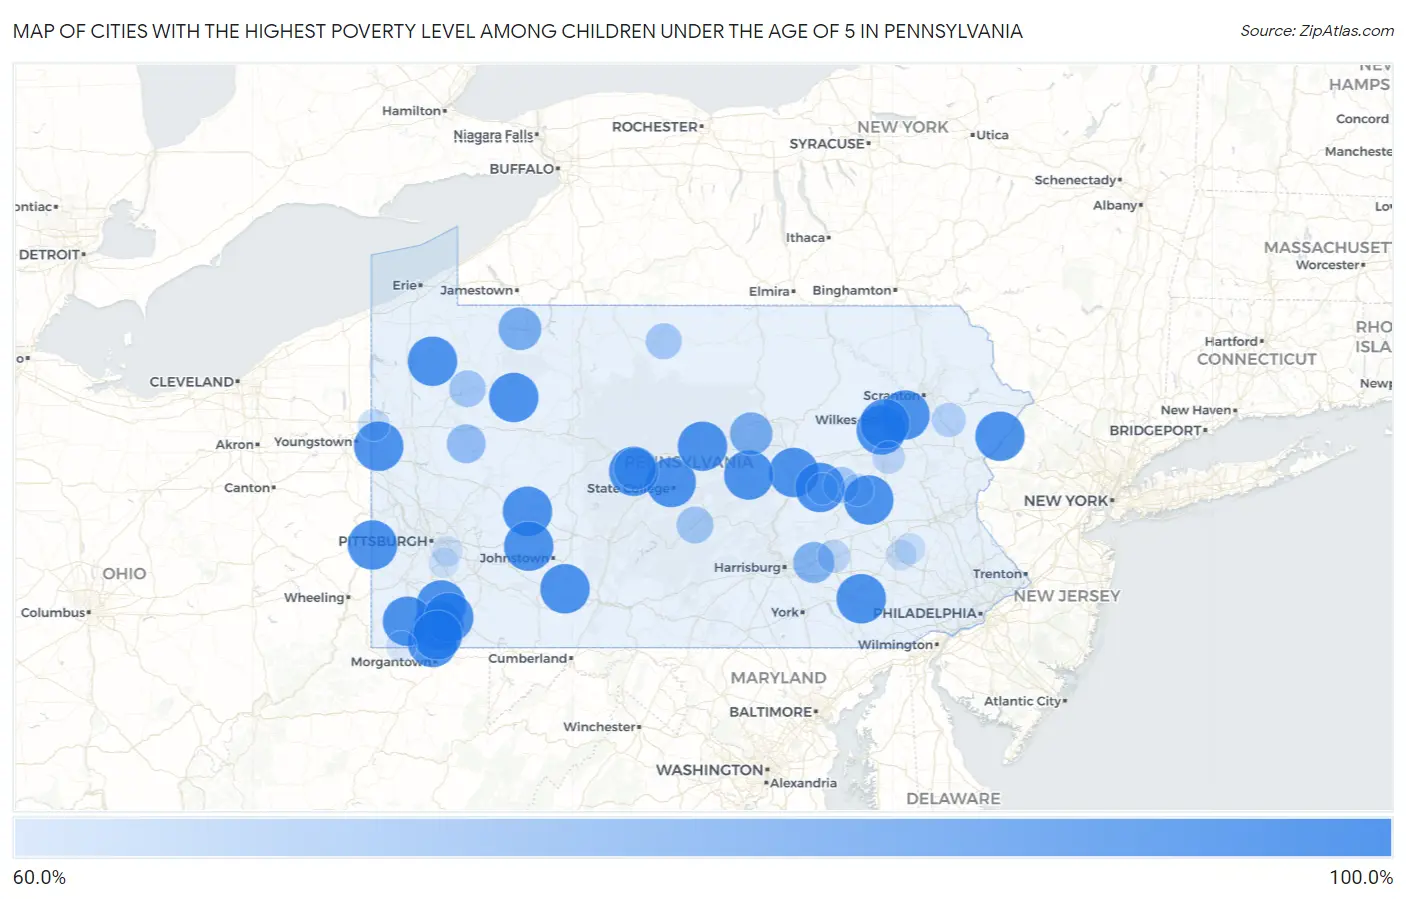
Map of Cities with the Highest Poverty Level Among Children Under the Age of 5 in Pennsylvania
0.0%
100.0%
Cities with the Highest Poverty Level Among Children Under the Age of 5 in Pennsylvania
| City | Child Poverty | vs State | vs National | |
| 1. | Donora Borough | 100.0% | 17.3%(+82.7)#1 | 18.1%(+81.9)#8 |
| 2. | Pine Ridge | 100.0% | 17.3%(+82.7)#2 | 18.1%(+81.9)#21 |
| 3. | Toftrees | 100.0% | 17.3%(+82.7)#3 | 18.1%(+81.9)#44 |
| 4. | Braddock Borough | 100.0% | 17.3%(+82.7)#4 | 18.1%(+81.9)#65 |
| 5. | Hudson | 100.0% | 17.3%(+82.7)#5 | 18.1%(+81.9)#101 |
| 6. | Chevy Chase Heights | 100.0% | 17.3%(+82.7)#6 | 18.1%(+81.9)#115 |
| 7. | Hiller | 100.0% | 17.3%(+82.7)#7 | 18.1%(+81.9)#118 |
| 8. | Nemacolin | 100.0% | 17.3%(+82.7)#8 | 18.1%(+81.9)#180 |
| 9. | Bobtown | 100.0% | 17.3%(+82.7)#9 | 18.1%(+81.9)#216 |
| 10. | Kapp Heights | 100.0% | 17.3%(+82.7)#10 | 18.1%(+81.9)#219 |
| 11. | North Philipsburg | 100.0% | 17.3%(+82.7)#11 | 18.1%(+81.9)#241 |
| 12. | Wanamie | 100.0% | 17.3%(+82.7)#13 | 18.1%(+81.9)#265 |
| 13. | Paris | 100.0% | 17.3%(+82.7)#14 | 18.1%(+81.9)#266 |
| 14. | Cairnbrook | 100.0% | 17.3%(+82.7)#15 | 18.1%(+81.9)#298 |
| 15. | West Nanticoke | 100.0% | 17.3%(+82.7)#16 | 18.1%(+81.9)#299 |
| 16. | Blanchard | 100.0% | 17.3%(+82.7)#17 | 18.1%(+81.9)#313 |
| 17. | Robinson | 100.0% | 17.3%(+82.7)#18 | 18.1%(+81.9)#320 |
| 18. | West Waynesburg | 100.0% | 17.3%(+82.7)#19 | 18.1%(+81.9)#338 |
| 19. | Laurelton | 100.0% | 17.3%(+82.7)#20 | 18.1%(+81.9)#395 |
| 20. | Frizzleburg | 100.0% | 17.3%(+82.7)#21 | 18.1%(+81.9)#452 |
| 21. | Aaronsburg Cdp Washington County | 100.0% | 17.3%(+82.7)#22 | 18.1%(+81.9)#459 |
| 22. | Tharptown Uniontown | 100.0% | 17.3%(+82.7)#23 | 18.1%(+81.9)#482 |
| 23. | Mckee | 100.0% | 17.3%(+82.7)#24 | 18.1%(+81.9)#500 |
| 24. | Witmer | 100.0% | 17.3%(+82.7)#25 | 18.1%(+81.9)#504 |
| 25. | Cumbola | 100.0% | 17.3%(+82.7)#26 | 18.1%(+81.9)#508 |
| 26. | Crown | 100.0% | 17.3%(+82.7)#27 | 18.1%(+81.9)#541 |
| 27. | Washingtonville Borough | 100.0% | 17.3%(+82.7)#28 | 18.1%(+81.9)#546 |
| 28. | Clarksville Borough | 100.0% | 17.3%(+82.7)#29 | 18.1%(+81.9)#564 |
| 29. | Ashville Borough | 100.0% | 17.3%(+82.7)#30 | 18.1%(+81.9)#570 |
| 30. | Karns City Borough | 100.0% | 17.3%(+82.7)#31 | 18.1%(+81.9)#603 |
| 31. | Atwood Borough | 100.0% | 17.3%(+82.7)#32 | 18.1%(+81.9)#609 |
| 32. | Charlottsville | 100.0% | 17.3%(+82.7)#33 | 18.1%(+81.9)#627 |
| 33. | Friendsville Borough | 100.0% | 17.3%(+82.7)#34 | 18.1%(+81.9)#632 |
| 34. | Callensburg Borough | 100.0% | 17.3%(+82.7)#35 | 18.1%(+81.9)#637 |
| 35. | Benson Borough | 100.0% | 17.3%(+82.7)#36 | 18.1%(+81.9)#687 |
| 36. | Buffington | 100.0% | 17.3%(+82.7)#37 | 18.1%(+81.9)#715 |
| 37. | Guys Mills | 100.0% | 17.3%(+82.7)#38 | 18.1%(+81.9)#718 |
| 38. | Mapletown | 100.0% | 17.3%(+82.7)#39 | 18.1%(+81.9)#739 |
| 39. | Coalmont Borough | 100.0% | 17.3%(+82.7)#40 | 18.1%(+81.9)#874 |
| 40. | Beavertown | 100.0% | 17.3%(+82.7)#41 | 18.1%(+81.9)#903 |
| 41. | Wattsburg Borough | 90.0% | 17.3%(+72.7)#42 | 18.1%(+71.9)#1,026 |
| 42. | Brisbin Borough | 90.0% | 17.3%(+72.7)#43 | 18.1%(+71.9)#1,027 |
| 43. | Mahaffey Borough | 90.0% | 17.3%(+72.7)#44 | 18.1%(+71.9)#1,029 |
| 44. | East Conemaugh Borough | 89.7% | 17.3%(+72.4)#45 | 18.1%(+71.6)#1,035 |
| 45. | Ashley Borough | 87.9% | 17.3%(+70.6)#46 | 18.1%(+69.8)#1,065 |
| 46. | Starbrick | 87.6% | 17.3%(+70.3)#47 | 18.1%(+69.5)#1,072 |
| 47. | Oval | 87.2% | 17.3%(+69.9)#48 | 18.1%(+69.1)#1,096 |
| 48. | Hawk Run | 86.4% | 17.3%(+69.1)#49 | 18.1%(+68.3)#1,119 |
| 49. | Lykens Borough | 85.9% | 17.3%(+68.7)#50 | 18.1%(+67.9)#1,131 |
| 50. | Sharon Hill Borough | 85.3% | 17.3%(+68.1)#51 | 18.1%(+67.3)#1,154 |
| 51. | Wall Borough | 84.8% | 17.3%(+67.6)#52 | 18.1%(+66.8)#1,160 |
| 52. | Palmdale | 84.3% | 17.3%(+67.1)#53 | 18.1%(+66.3)#1,180 |
| 53. | Roseville Borough | 83.3% | 17.3%(+66.1)#54 | 18.1%(+65.3)#1,230 |
| 54. | Millville Borough | 82.6% | 17.3%(+65.3)#55 | 18.1%(+64.5)#1,244 |
| 55. | Pringle Borough | 82.1% | 17.3%(+64.8)#56 | 18.1%(+64.0)#1,261 |
| 56. | Knoxville Borough | 80.8% | 17.3%(+63.5)#57 | 18.1%(+62.7)#1,300 |
| 57. | Continental Courts | 80.0% | 17.3%(+62.7)#58 | 18.1%(+61.9)#1,323 |
| 58. | Parker | 80.0% | 17.3%(+62.7)#59 | 18.1%(+61.9)#1,327 |
| 59. | Plumville Borough | 80.0% | 17.3%(+62.7)#60 | 18.1%(+61.9)#1,347 |
| 60. | Slippery Rock Borough | 78.9% | 17.3%(+61.6)#61 | 18.1%(+60.8)#1,376 |
| 61. | Coalport Borough | 78.6% | 17.3%(+61.3)#62 | 18.1%(+60.5)#1,387 |
| 62. | Knox Borough | 78.1% | 17.3%(+60.9)#63 | 18.1%(+60.1)#1,399 |
| 63. | Rankin Borough | 77.2% | 17.3%(+59.9)#64 | 18.1%(+59.1)#1,437 |
| 64. | Applewold Borough | 76.9% | 17.3%(+59.7)#65 | 18.1%(+58.9)#1,453 |
| 65. | Rainsburg Borough | 76.5% | 17.3%(+59.2)#66 | 18.1%(+58.4)#1,469 |
| 66. | Strodes Mills | 76.4% | 17.3%(+59.1)#67 | 18.1%(+58.3)#1,470 |
| 67. | Hasson Heights | 76.0% | 17.3%(+58.8)#68 | 18.1%(+58.0)#1,484 |
| 68. | Athens Borough | 75.9% | 17.3%(+58.6)#69 | 18.1%(+57.8)#1,488 |
| 69. | Hydetown Borough | 75.0% | 17.3%(+57.7)#70 | 18.1%(+56.9)#1,518 |
| 70. | Wilburton Number One | 75.0% | 17.3%(+57.7)#71 | 18.1%(+56.9)#1,526 |
| 71. | Fayette City Borough | 75.0% | 17.3%(+57.7)#72 | 18.1%(+56.9)#1,528 |
| 72. | Sweden Valley | 75.0% | 17.3%(+57.7)#73 | 18.1%(+56.9)#1,540 |
| 73. | Spring Drive Mobile Home Park | 75.0% | 17.3%(+57.7)#74 | 18.1%(+56.9)#1,543 |
| 74. | Lehighton Borough | 73.7% | 17.3%(+56.5)#75 | 18.1%(+55.7)#1,599 |
| 75. | Bath Borough | 71.7% | 17.3%(+54.4)#76 | 18.1%(+53.6)#1,683 |
| 76. | Gouldsboro | 71.4% | 17.3%(+54.2)#77 | 18.1%(+53.4)#1,698 |
| 77. | Ehrenfeld Borough | 71.4% | 17.3%(+54.2)#78 | 18.1%(+53.4)#1,711 |
| 78. | Lansford Borough | 70.9% | 17.3%(+53.7)#79 | 18.1%(+52.9)#1,733 |
| 79. | Punxsutawney Borough | 70.3% | 17.3%(+53.0)#80 | 18.1%(+52.2)#1,768 |
| 80. | Pleasant Hill | 69.1% | 17.3%(+51.8)#81 | 18.1%(+51.0)#1,843 |
| 81. | Pardeesville | 68.9% | 17.3%(+51.6)#82 | 18.1%(+50.8)#1,849 |
| 82. | Englewood | 68.0% | 17.3%(+50.8)#83 | 18.1%(+50.0)#1,894 |
| 83. | Farrell | 67.2% | 17.3%(+49.9)#84 | 18.1%(+49.1)#1,949 |
| 84. | Shamokin | 66.9% | 17.3%(+49.6)#85 | 18.1%(+48.8)#1,958 |
| 85. | Montrose Borough | 66.7% | 17.3%(+49.4)#86 | 18.1%(+48.6)#1,966 |
| 86. | Point Marion Borough | 66.7% | 17.3%(+49.4)#87 | 18.1%(+48.6)#1,967 |
| 87. | Ernest Borough | 66.7% | 17.3%(+49.4)#88 | 18.1%(+48.6)#1,993 |
| 88. | Burnside Borough | 66.7% | 17.3%(+49.4)#89 | 18.1%(+48.6)#2,021 |
| 89. | Luzerne Borough | 66.4% | 17.3%(+49.1)#90 | 18.1%(+48.3)#2,042 |
| 90. | Turtle Creek Borough | 65.8% | 17.3%(+48.5)#91 | 18.1%(+47.7)#2,063 |
| 91. | Oley | 65.7% | 17.3%(+48.5)#92 | 18.1%(+47.7)#2,068 |
| 92. | Wilmerding Borough | 65.7% | 17.3%(+48.4)#93 | 18.1%(+47.6)#2,069 |
| 93. | Freedom Borough | 65.5% | 17.3%(+48.2)#94 | 18.1%(+47.4)#2,084 |
| 94. | Stony Creek Mills | 65.5% | 17.3%(+48.2)#95 | 18.1%(+47.4)#2,085 |
| 95. | Nesquehoning Borough | 65.4% | 17.3%(+48.1)#96 | 18.1%(+47.3)#2,089 |
| 96. | Brave | 65.0% | 17.3%(+47.7)#97 | 18.1%(+46.9)#2,117 |
| 97. | Houston Borough | 64.6% | 17.3%(+47.4)#98 | 18.1%(+46.6)#2,147 |
| 98. | Tunkhannock Borough | 64.6% | 17.3%(+47.4)#99 | 18.1%(+46.6)#2,148 |
| 99. | Duquesne | 64.5% | 17.3%(+47.2)#100 | 18.1%(+46.4)#2,154 |
| 100. | Clairton | 64.2% | 17.3%(+46.9)#101 | 18.1%(+46.1)#2,172 |
Common Questions
What are the Top 10 Cities with the Highest Poverty Level Among Children Under the Age of 5 in Pennsylvania?
Top 10 Cities with the Highest Poverty Level Among Children Under the Age of 5 in Pennsylvania are:
#1
100.0%
#2
100.0%
#3
100.0%
#4
100.0%
#5
100.0%
#6
100.0%
#7
100.0%
#8
100.0%
#9
100.0%
#10
100.0%
What city has the Highest Poverty Level Among Children Under the Age of 5 in Pennsylvania?
Pine Ridge has the Highest Poverty Level Among Children Under the Age of 5 in Pennsylvania with 100.0%.
What is the Poverty Level Among Children Under the Age of 5 in the State of Pennsylvania?
Poverty Level Among Children Under the Age of 5 in Pennsylvania is 17.3%.
What is the Poverty Level Among Children Under the Age of 5 in the United States?
Poverty Level Among Children Under the Age of 5 in the United States is 18.1%.