Cities with the Most Immigrants from Eastern Africa in North Carolina
RELATED REPORTS & OPTIONS
Eastern Africa
North Carolina
Compare Cities
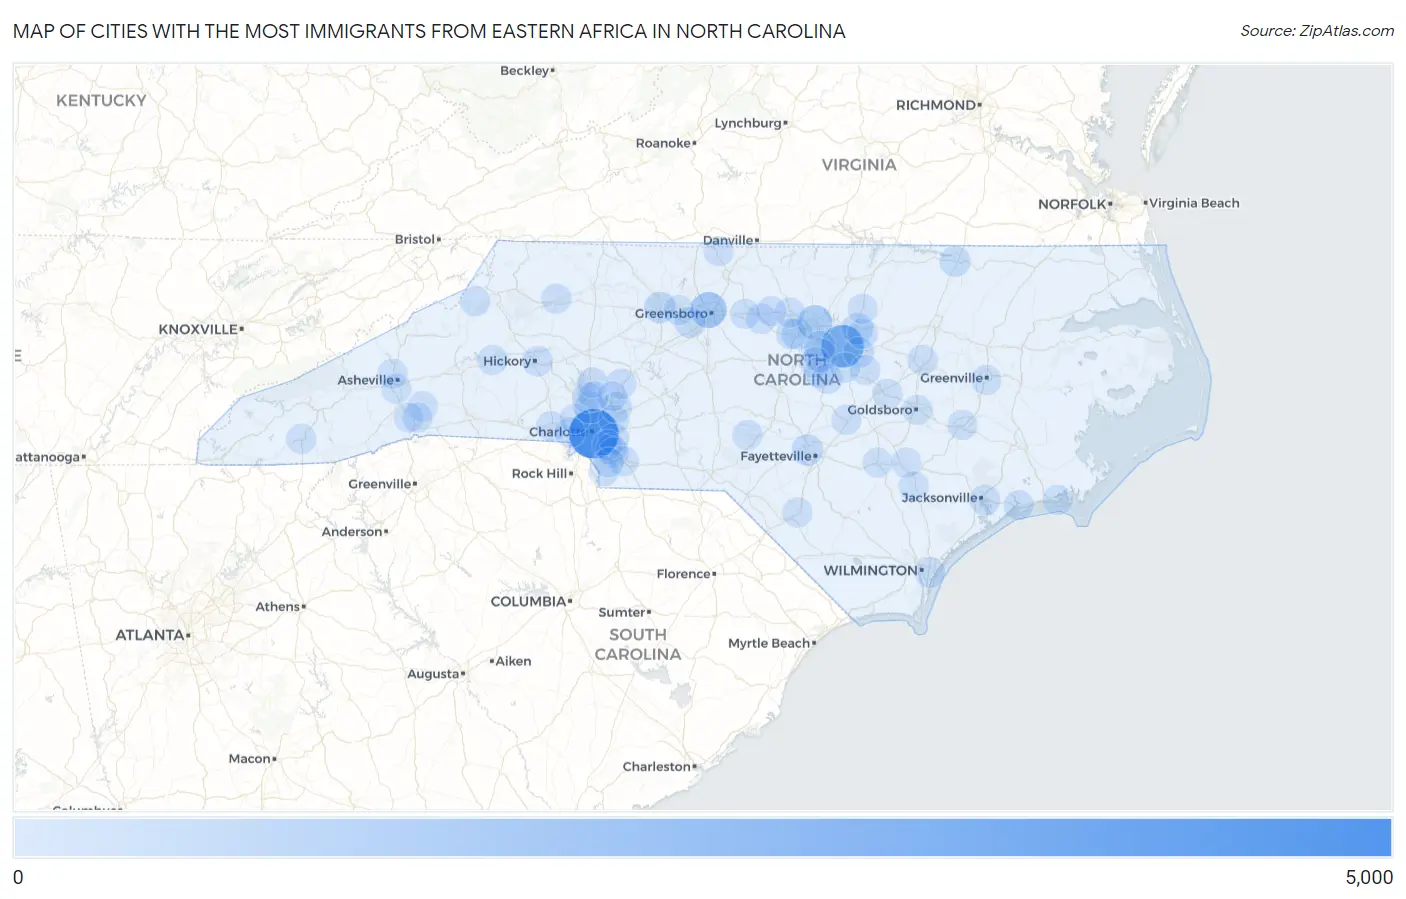
Map of Cities with the Most Immigrants from Eastern Africa in North Carolina
0
5,000
Cities with the Most Immigrants from Eastern Africa in North Carolina
| City | Eastern Africa | vs State | vs National | |
| 1. | Charlotte | 4,333 | 16,285(26.61%)#1 | 752,337(0.58%)#22 |
| 2. | Raleigh | 2,744 | 16,285(16.85%)#2 | 752,337(0.36%)#41 |
| 3. | Greensboro | 1,231 | 16,285(7.56%)#3 | 752,337(0.16%)#101 |
| 4. | Durham | 984 | 16,285(6.04%)#4 | 752,337(0.13%)#127 |
| 5. | Cary | 647 | 16,285(3.97%)#5 | 752,337(0.09%)#194 |
| 6. | Winston Salem | 344 | 16,285(2.11%)#6 | 752,337(0.05%)#331 |
| 7. | Huntersville | 324 | 16,285(1.99%)#7 | 752,337(0.04%)#353 |
| 8. | Fayetteville | 297 | 16,285(1.82%)#8 | 752,337(0.04%)#384 |
| 9. | Wake Forest | 295 | 16,285(1.81%)#9 | 752,337(0.04%)#387 |
| 10. | Chapel Hill | 274 | 16,285(1.68%)#10 | 752,337(0.04%)#410 |
| 11. | High Point | 237 | 16,285(1.46%)#11 | 752,337(0.03%)#460 |
| 12. | Roanoke Rapids | 203 | 16,285(1.25%)#12 | 752,337(0.03%)#527 |
| 13. | Concord | 198 | 16,285(1.22%)#13 | 752,337(0.03%)#540 |
| 14. | Morrisville | 179 | 16,285(1.10%)#14 | 752,337(0.02%)#580 |
| 15. | Knightdale | 160 | 16,285(0.98%)#15 | 752,337(0.02%)#627 |
| 16. | Carrboro | 118 | 16,285(0.72%)#16 | 752,337(0.02%)#795 |
| 17. | Jacksonville | 111 | 16,285(0.68%)#17 | 752,337(0.01%)#832 |
| 18. | Mint Hill | 110 | 16,285(0.68%)#18 | 752,337(0.01%)#838 |
| 19. | Hickory | 106 | 16,285(0.65%)#19 | 752,337(0.01%)#865 |
| 20. | Swepsonville | 106 | 16,285(0.65%)#20 | 752,337(0.01%)#868 |
| 21. | Stallings | 101 | 16,285(0.62%)#21 | 752,337(0.01%)#896 |
| 22. | Apex | 97 | 16,285(0.60%)#22 | 752,337(0.01%)#909 |
| 23. | Holly Springs | 93 | 16,285(0.57%)#23 | 752,337(0.01%)#932 |
| 24. | Gastonia | 87 | 16,285(0.53%)#24 | 752,337(0.01%)#968 |
| 25. | Cornelius | 76 | 16,285(0.47%)#25 | 752,337(0.01%)#1,058 |
| 26. | Wilmington | 71 | 16,285(0.44%)#26 | 752,337(0.01%)#1,103 |
| 27. | China Grove | 70 | 16,285(0.43%)#27 | 752,337(0.01%)#1,129 |
| 28. | Mooresville | 65 | 16,285(0.40%)#28 | 752,337(0.01%)#1,174 |
| 29. | Rolesville | 65 | 16,285(0.40%)#29 | 752,337(0.01%)#1,177 |
| 30. | Fuquay Varina | 57 | 16,285(0.35%)#30 | 752,337(0.01%)#1,270 |
| 31. | Harrisburg | 46 | 16,285(0.28%)#31 | 752,337(0.01%)#1,443 |
| 32. | Belmont | 44 | 16,285(0.27%)#32 | 752,337(0.01%)#1,472 |
| 33. | Pinehurst | 36 | 16,285(0.22%)#33 | 752,337(0.00%)#1,615 |
| 34. | Hillsborough | 36 | 16,285(0.22%)#34 | 752,337(0.00%)#1,621 |
| 35. | North Wilkesboro | 36 | 16,285(0.22%)#35 | 752,337(0.00%)#1,628 |
| 36. | Indian Trail | 35 | 16,285(0.21%)#36 | 752,337(0.00%)#1,636 |
| 37. | Kannapolis | 34 | 16,285(0.21%)#37 | 752,337(0.00%)#1,655 |
| 38. | Wilson | 34 | 16,285(0.21%)#38 | 752,337(0.00%)#1,656 |
| 39. | Kernersville | 30 | 16,285(0.18%)#39 | 752,337(0.00%)#1,761 |
| 40. | Clayton | 27 | 16,285(0.17%)#40 | 752,337(0.00%)#1,860 |
| 41. | Lumberton | 26 | 16,285(0.16%)#41 | 752,337(0.00%)#1,895 |
| 42. | Asheville | 23 | 16,285(0.14%)#42 | 752,337(0.00%)#1,989 |
| 43. | Davidson | 23 | 16,285(0.14%)#43 | 752,337(0.00%)#2,015 |
| 44. | Edneyville | 23 | 16,285(0.14%)#44 | 752,337(0.00%)#2,029 |
| 45. | Woodfin | 22 | 16,285(0.14%)#45 | 752,337(0.00%)#2,053 |
| 46. | Garner | 20 | 16,285(0.12%)#46 | 752,337(0.00%)#2,114 |
| 47. | Matthews | 19 | 16,285(0.12%)#47 | 752,337(0.00%)#2,157 |
| 48. | Franklin | 19 | 16,285(0.12%)#48 | 752,337(0.00%)#2,175 |
| 49. | Kinston | 17 | 16,285(0.10%)#49 | 752,337(0.00%)#2,242 |
| 50. | Mount Holly | 16 | 16,285(0.10%)#50 | 752,337(0.00%)#2,279 |
| 51. | Dana | 16 | 16,285(0.10%)#51 | 752,337(0.00%)#2,296 |
| 52. | Waxhaw | 15 | 16,285(0.09%)#52 | 752,337(0.00%)#2,320 |
| 53. | Mebane | 15 | 16,285(0.09%)#53 | 752,337(0.00%)#2,322 |
| 54. | Monroe | 14 | 16,285(0.09%)#54 | 752,337(0.00%)#2,376 |
| 55. | Anderson Creek | 14 | 16,285(0.09%)#55 | 752,337(0.00%)#2,387 |
| 56. | Morehead City | 14 | 16,285(0.09%)#56 | 752,337(0.00%)#2,402 |
| 57. | Goldsboro | 12 | 16,285(0.07%)#57 | 752,337(0.00%)#2,483 |
| 58. | Wesley Chapel | 12 | 16,285(0.07%)#58 | 752,337(0.00%)#2,504 |
| 59. | Pine Level | 11 | 16,285(0.07%)#59 | 752,337(0.00%)#2,593 |
| 60. | Clinton | 7 | 16,285(0.04%)#60 | 752,337(0.00%)#2,862 |
| 61. | Cedar Point | 7 | 16,285(0.04%)#61 | 752,337(0.00%)#2,893 |
| 62. | Banner Elk | 7 | 16,285(0.04%)#62 | 752,337(0.00%)#2,898 |
| 63. | Hendersonville | 6 | 16,285(0.04%)#63 | 752,337(0.00%)#2,929 |
| 64. | Franklinton | 6 | 16,285(0.04%)#64 | 752,337(0.00%)#2,970 |
| 65. | Burlington | 4 | 16,285(0.02%)#65 | 752,337(0.00%)#3,086 |
| 66. | Dunn | 4 | 16,285(0.02%)#66 | 752,337(0.00%)#3,112 |
| 67. | Warsaw | 4 | 16,285(0.02%)#67 | 752,337(0.00%)#3,133 |
| 68. | Greenville | 3 | 16,285(0.02%)#68 | 752,337(0.00%)#3,176 |
| 69. | Morganton | 3 | 16,285(0.02%)#69 | 752,337(0.00%)#3,194 |
| 70. | Eden | 1 | 16,285(0.01%)#70 | 752,337(0.00%)#3,393 |
| 71. | Rose Hill | 1 | 16,285(0.01%)#71 | 752,337(0.00%)#3,457 |
Common Questions
What are the Top 10 Cities with the Most Immigrants from Eastern Africa in North Carolina?
Top 10 Cities with the Most Immigrants from Eastern Africa in North Carolina are:
#1
4,333
#2
2,744
#3
1,231
#4
984
#5
647
#6
344
#7
324
#8
297
#9
295
#10
274
What city has the Most Immigrants from Eastern Africa in North Carolina?
Charlotte has the Most Immigrants from Eastern Africa in North Carolina with 4,333.
What is the Total Immigrants from Eastern Africa in the State of North Carolina?
Total Immigrants from Eastern Africa in North Carolina is 16,285.
What is the Total Immigrants from Eastern Africa in the United States?
Total Immigrants from Eastern Africa in the United States is 752,337.