Cities with the Most Immigrants from Eastern Africa in Utah
RELATED REPORTS & OPTIONS
Eastern Africa
Utah
Compare Cities
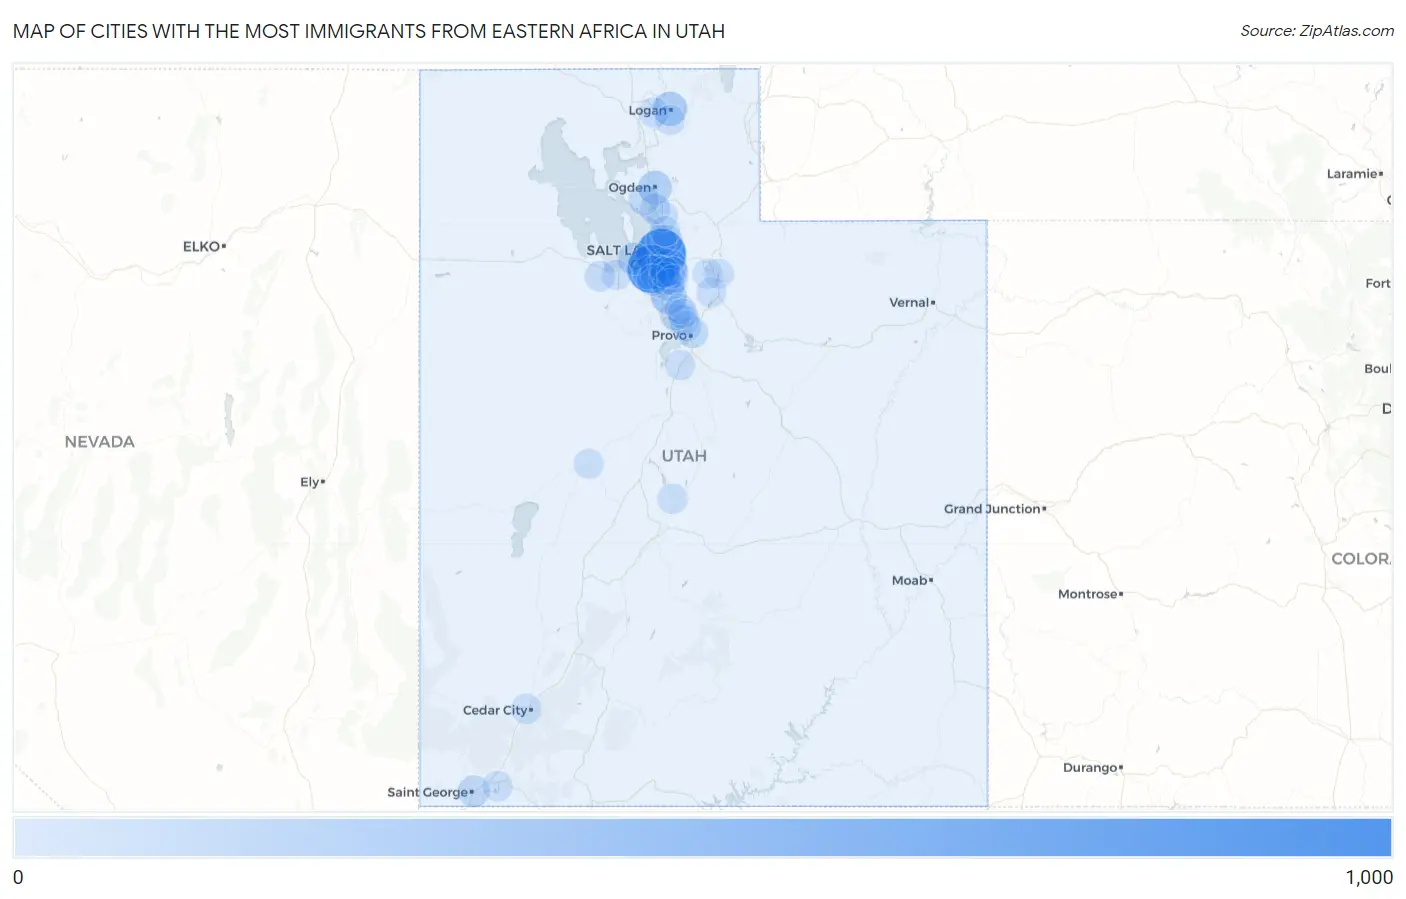
Map of Cities with the Most Immigrants from Eastern Africa in Utah
0
1,000
Cities with the Most Immigrants from Eastern Africa in Utah
| City | Eastern Africa | vs State | vs National | |
| 1. | Salt Lake City | 829 | 3,956(20.96%)#1 | 752,337(0.11%)#150 |
| 2. | West Valley City | 762 | 3,956(19.26%)#2 | 752,337(0.10%)#163 |
| 3. | Millcreek | 281 | 3,956(7.10%)#3 | 752,337(0.04%)#399 |
| 4. | Draper | 234 | 3,956(5.92%)#4 | 752,337(0.03%)#468 |
| 5. | Taylorsville | 207 | 3,956(5.23%)#5 | 752,337(0.03%)#519 |
| 6. | Kearns | 177 | 3,956(4.47%)#6 | 752,337(0.02%)#584 |
| 7. | Logan | 173 | 3,956(4.37%)#7 | 752,337(0.02%)#595 |
| 8. | Ogden | 149 | 3,956(3.77%)#8 | 752,337(0.02%)#671 |
| 9. | South Salt Lake | 144 | 3,956(3.64%)#9 | 752,337(0.02%)#689 |
| 10. | Midvale | 114 | 3,956(2.88%)#10 | 752,337(0.02%)#813 |
| 11. | Magna | 94 | 3,956(2.38%)#11 | 752,337(0.01%)#928 |
| 12. | Sandy | 74 | 3,956(1.87%)#12 | 752,337(0.01%)#1,079 |
| 13. | St George | 71 | 3,956(1.79%)#13 | 752,337(0.01%)#1,105 |
| 14. | Provo | 53 | 3,956(1.34%)#14 | 752,337(0.01%)#1,328 |
| 15. | West Jordan | 51 | 3,956(1.29%)#15 | 752,337(0.01%)#1,365 |
| 16. | Holladay | 50 | 3,956(1.26%)#16 | 752,337(0.01%)#1,381 |
| 17. | Fruit Heights | 34 | 3,956(0.86%)#17 | 752,337(0.00%)#1,668 |
| 18. | Layton | 30 | 3,956(0.76%)#18 | 752,337(0.00%)#1,753 |
| 19. | Clinton | 26 | 3,956(0.66%)#19 | 752,337(0.00%)#1,890 |
| 20. | Bountiful | 25 | 3,956(0.63%)#20 | 752,337(0.00%)#1,913 |
| 21. | Lindon | 24 | 3,956(0.61%)#21 | 752,337(0.00%)#1,965 |
| 22. | Grantsville | 23 | 3,956(0.58%)#22 | 752,337(0.00%)#2,018 |
| 23. | Orem | 21 | 3,956(0.53%)#23 | 752,337(0.00%)#2,067 |
| 24. | American Fork | 19 | 3,956(0.48%)#24 | 752,337(0.00%)#2,155 |
| 25. | Hurricane | 18 | 3,956(0.46%)#25 | 752,337(0.00%)#2,198 |
| 26. | Cottonwood Heights | 16 | 3,956(0.40%)#26 | 752,337(0.00%)#2,273 |
| 27. | Woods Cross | 16 | 3,956(0.40%)#27 | 752,337(0.00%)#2,283 |
| 28. | Cedar Hills | 12 | 3,956(0.30%)#28 | 752,337(0.00%)#2,501 |
| 29. | Cedar City | 11 | 3,956(0.28%)#29 | 752,337(0.00%)#2,544 |
| 30. | Payson | 10 | 3,956(0.25%)#30 | 752,337(0.00%)#2,627 |
| 31. | Mendon | 10 | 3,956(0.25%)#31 | 752,337(0.00%)#2,663 |
| 32. | Murray | 9 | 3,956(0.23%)#32 | 752,337(0.00%)#2,672 |
| 33. | Centerfield | 8 | 3,956(0.20%)#33 | 752,337(0.00%)#2,817 |
| 34. | Centerville | 6 | 3,956(0.15%)#34 | 752,337(0.00%)#2,924 |
| 35. | Stansbury Park | 6 | 3,956(0.15%)#35 | 752,337(0.00%)#2,940 |
| 36. | Delta | 5 | 3,956(0.13%)#36 | 752,337(0.00%)#3,047 |
| 37. | Park City | 4 | 3,956(0.10%)#37 | 752,337(0.00%)#3,114 |
| 38. | Midway | 3 | 3,956(0.08%)#38 | 752,337(0.00%)#3,206 |
| 39. | Pleasant Grove | 2 | 3,956(0.05%)#39 | 752,337(0.00%)#3,267 |
| 40. | Hideout | 2 | 3,956(0.05%)#40 | 752,337(0.00%)#3,328 |
| 41. | Nibley | 1 | 3,956(0.03%)#41 | 752,337(0.00%)#3,420 |
Common Questions
What are the Top 10 Cities with the Most Immigrants from Eastern Africa in Utah?
Top 10 Cities with the Most Immigrants from Eastern Africa in Utah are:
#1
829
#2
762
#3
281
#4
234
#5
207
#6
177
#7
173
#8
149
#9
144
#10
114
What city has the Most Immigrants from Eastern Africa in Utah?
Salt Lake City has the Most Immigrants from Eastern Africa in Utah with 829.
What is the Total Immigrants from Eastern Africa in the State of Utah?
Total Immigrants from Eastern Africa in Utah is 3,956.
What is the Total Immigrants from Eastern Africa in the United States?
Total Immigrants from Eastern Africa in the United States is 752,337.