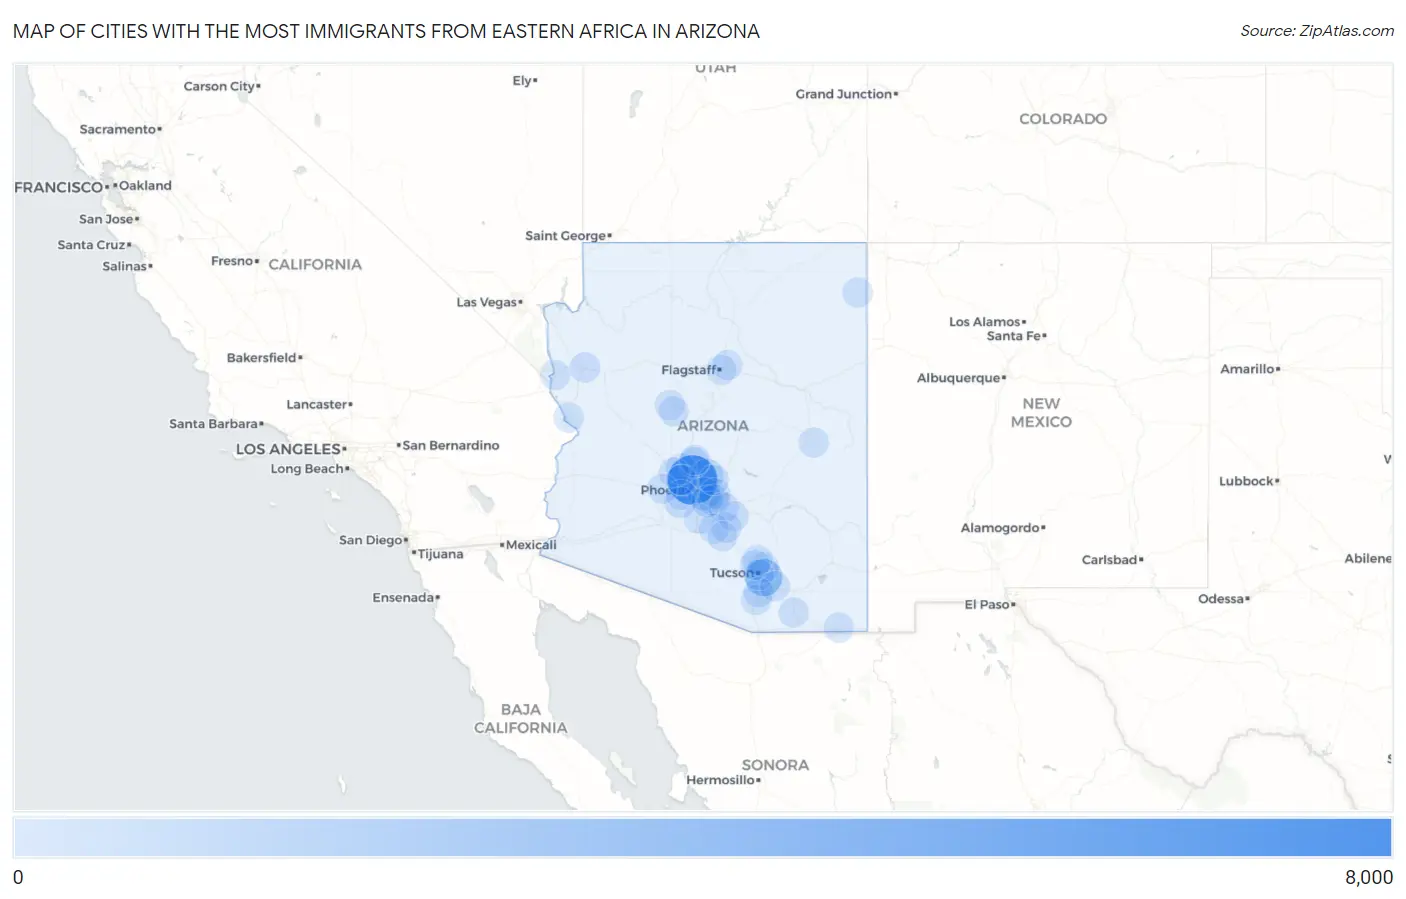
Cities with the Most Immigrants from Eastern Africa in Arizona
RELATED REPORTS & OPTIONS
Eastern Africa
Arizona
Compare Cities
Map of Cities with the Most Immigrants from Eastern Africa in Arizona
0
8,000
Cities with the Most Immigrants from Eastern Africa in Arizona
| City | Eastern Africa | vs State | vs National | |
| 1. | Phoenix | 7,355 | 15,514(47.41%)#1 | 752,337(0.98%)#12 |
| 2. | Tucson | 2,543 | 15,514(16.39%)#2 | 752,337(0.34%)#44 |
| 3. | Tempe | 1,032 | 15,514(6.65%)#3 | 752,337(0.14%)#122 |
| 4. | Scottsdale | 782 | 15,514(5.04%)#4 | 752,337(0.10%)#160 |
| 5. | Chandler | 540 | 15,514(3.48%)#5 | 752,337(0.07%)#233 |
| 6. | Glendale | 535 | 15,514(3.45%)#6 | 752,337(0.07%)#236 |
| 7. | Goodyear | 438 | 15,514(2.82%)#7 | 752,337(0.06%)#262 |
| 8. | Mesa | 387 | 15,514(2.49%)#8 | 752,337(0.05%)#293 |
| 9. | Gilbert | 317 | 15,514(2.04%)#9 | 752,337(0.04%)#356 |
| 10. | Peoria | 168 | 15,514(1.08%)#10 | 752,337(0.02%)#604 |
| 11. | Kingman | 121 | 15,514(0.78%)#11 | 752,337(0.02%)#786 |
| 12. | Catalina Foothills | 119 | 15,514(0.77%)#12 | 752,337(0.02%)#792 |
| 13. | San Tan Valley | 107 | 15,514(0.69%)#13 | 752,337(0.01%)#855 |
| 14. | Coolidge | 75 | 15,514(0.48%)#14 | 752,337(0.01%)#1,072 |
| 15. | Anthem | 72 | 15,514(0.46%)#15 | 752,337(0.01%)#1,099 |
| 16. | Green Valley | 61 | 15,514(0.39%)#16 | 752,337(0.01%)#1,213 |
| 17. | Flagstaff | 56 | 15,514(0.36%)#17 | 752,337(0.01%)#1,283 |
| 18. | Fountain Hills | 56 | 15,514(0.36%)#18 | 752,337(0.01%)#1,288 |
| 19. | South Tucson | 56 | 15,514(0.36%)#19 | 752,337(0.01%)#1,293 |
| 20. | Bullhead City | 55 | 15,514(0.35%)#20 | 752,337(0.01%)#1,301 |
| 21. | Avondale | 43 | 15,514(0.28%)#21 | 752,337(0.01%)#1,482 |
| 22. | Sahuarita | 43 | 15,514(0.28%)#22 | 752,337(0.01%)#1,486 |
| 23. | Florence | 37 | 15,514(0.24%)#23 | 752,337(0.00%)#1,598 |
| 24. | Tsaile | 36 | 15,514(0.23%)#24 | 752,337(0.00%)#1,630 |
| 25. | Oro Valley | 31 | 15,514(0.20%)#25 | 752,337(0.00%)#1,730 |
| 26. | Surprise | 28 | 15,514(0.18%)#26 | 752,337(0.00%)#1,812 |
| 27. | Casas Adobes | 27 | 15,514(0.17%)#27 | 752,337(0.00%)#1,849 |
| 28. | New River | 23 | 15,514(0.15%)#28 | 752,337(0.00%)#2,009 |
| 29. | Maricopa | 22 | 15,514(0.14%)#29 | 752,337(0.00%)#2,034 |
| 30. | Casa Grande | 20 | 15,514(0.13%)#30 | 752,337(0.00%)#2,107 |
| 31. | Eloy | 18 | 15,514(0.12%)#31 | 752,337(0.00%)#2,203 |
| 32. | Williamson | 17 | 15,514(0.11%)#32 | 752,337(0.00%)#2,256 |
| 33. | Lake Havasu City | 12 | 15,514(0.08%)#33 | 752,337(0.00%)#2,477 |
| 34. | Lake Of The Woods | 12 | 15,514(0.08%)#34 | 752,337(0.00%)#2,517 |
| 35. | Vail | 11 | 15,514(0.07%)#35 | 752,337(0.00%)#2,556 |
| 36. | Doney Park | 11 | 15,514(0.07%)#36 | 752,337(0.00%)#2,582 |
| 37. | Buckeye | 8 | 15,514(0.05%)#37 | 752,337(0.00%)#2,752 |
| 38. | Huachuca City | 7 | 15,514(0.05%)#38 | 752,337(0.00%)#2,896 |
| 39. | Prescott | 6 | 15,514(0.04%)#39 | 752,337(0.00%)#2,909 |
| 40. | El Mirage | 3 | 15,514(0.02%)#40 | 752,337(0.00%)#3,184 |
| 41. | Douglas | 3 | 15,514(0.02%)#41 | 752,337(0.00%)#3,195 |
Common Questions
What are the Top 10 Cities with the Most Immigrants from Eastern Africa in Arizona?
Top 10 Cities with the Most Immigrants from Eastern Africa in Arizona are:
What city has the Most Immigrants from Eastern Africa in Arizona?
Phoenix has the Most Immigrants from Eastern Africa in Arizona with 7,355.
What is the Total Immigrants from Eastern Africa in the State of Arizona?
Total Immigrants from Eastern Africa in Arizona is 15,514.
What is the Total Immigrants from Eastern Africa in the United States?
Total Immigrants from Eastern Africa in the United States is 752,337.