Cities with the Most Immigrants from Eastern Africa in Kansas
RELATED REPORTS & OPTIONS
Eastern Africa
Kansas
Compare Cities
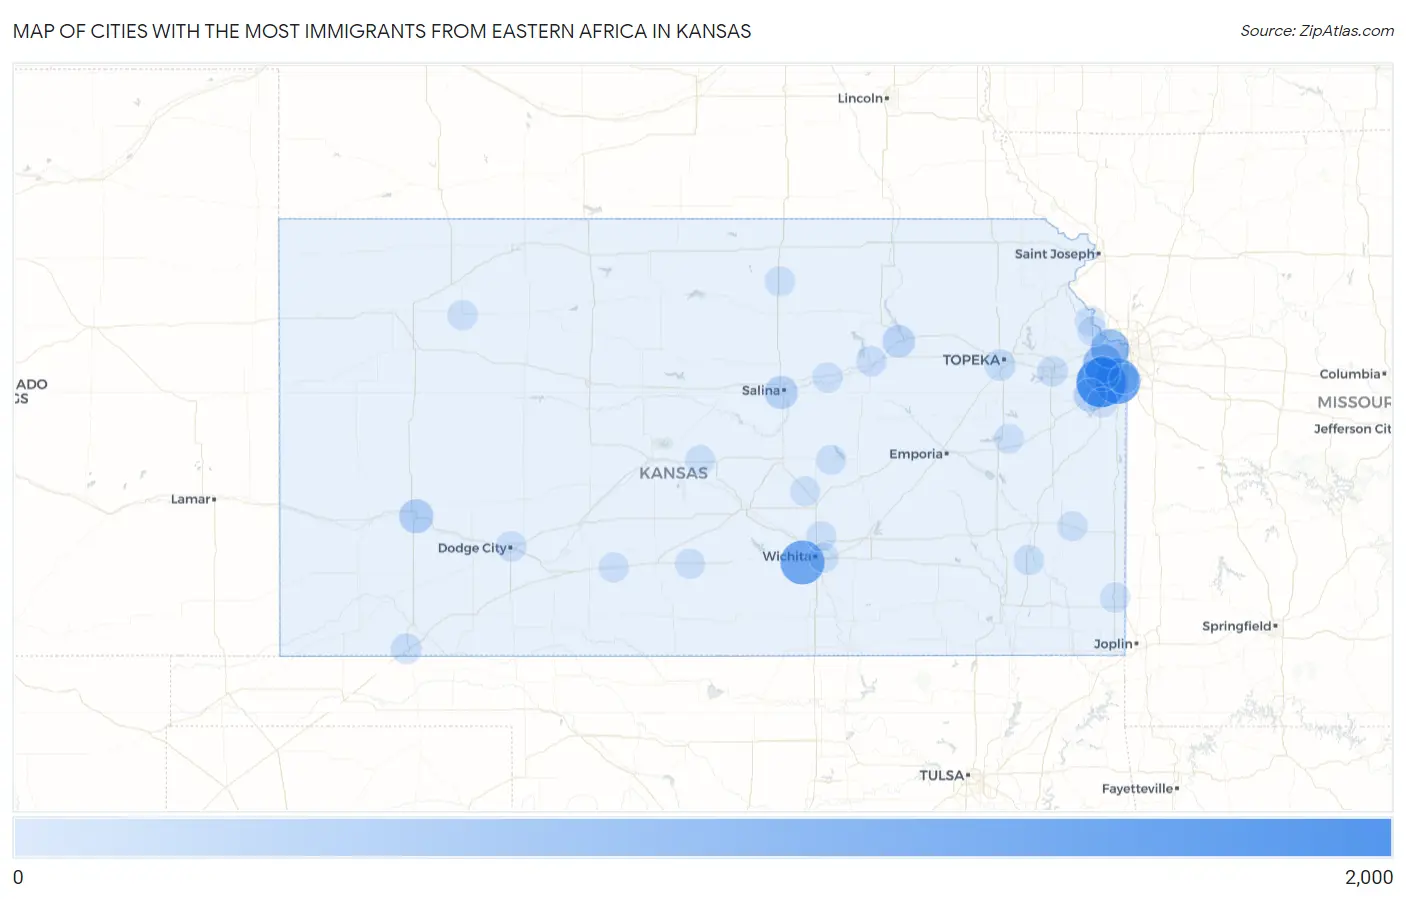
Map of Cities with the Most Immigrants from Eastern Africa in Kansas
0
2,000
Cities with the Most Immigrants from Eastern Africa in Kansas
| City | Eastern Africa | vs State | vs National | |
| 1. | Olathe | 1,652 | 7,396(22.34%)#1 | 752,337(0.22%)#70 |
| 2. | Overland Park | 1,300 | 7,396(17.58%)#2 | 752,337(0.17%)#95 |
| 3. | Wichita | 1,175 | 7,396(15.89%)#3 | 752,337(0.16%)#102 |
| 4. | Shawnee | 728 | 7,396(9.84%)#4 | 752,337(0.10%)#170 |
| 5. | Kansas City | 711 | 7,396(9.61%)#5 | 752,337(0.09%)#176 |
| 6. | Lenexa | 412 | 7,396(5.57%)#6 | 752,337(0.05%)#278 |
| 7. | Garden City | 327 | 7,396(4.42%)#7 | 752,337(0.04%)#349 |
| 8. | Salina | 258 | 7,396(3.49%)#8 | 752,337(0.03%)#430 |
| 9. | Gardner | 236 | 7,396(3.19%)#9 | 752,337(0.03%)#463 |
| 10. | Manhattan | 202 | 7,396(2.73%)#10 | 752,337(0.03%)#528 |
| 11. | Topeka | 94 | 7,396(1.27%)#11 | 752,337(0.01%)#926 |
| 12. | Lawrence | 45 | 7,396(0.61%)#12 | 752,337(0.01%)#1,455 |
| 13. | Liberal | 43 | 7,396(0.58%)#13 | 752,337(0.01%)#1,492 |
| 14. | Junction City | 29 | 7,396(0.39%)#14 | 752,337(0.00%)#1,794 |
| 15. | Niles | 24 | 7,396(0.32%)#15 | 752,337(0.00%)#1,987 |
| 16. | Dodge City | 23 | 7,396(0.31%)#16 | 752,337(0.00%)#2,002 |
| 17. | Chanute | 21 | 7,396(0.28%)#17 | 752,337(0.00%)#2,088 |
| 18. | Leavenworth | 13 | 7,396(0.18%)#18 | 752,337(0.00%)#2,429 |
| 19. | Abilene | 13 | 7,396(0.18%)#19 | 752,337(0.00%)#2,453 |
| 20. | Pittsburg | 7 | 7,396(0.09%)#20 | 752,337(0.00%)#2,846 |
| 21. | Concordia | 6 | 7,396(0.08%)#21 | 752,337(0.00%)#2,954 |
| 22. | Kechi | 6 | 7,396(0.08%)#22 | 752,337(0.00%)#2,963 |
| 23. | Melvern | 6 | 7,396(0.08%)#23 | 752,337(0.00%)#2,995 |
| 24. | Lansing | 5 | 7,396(0.07%)#24 | 752,337(0.00%)#3,023 |
| 25. | Bronson | 5 | 7,396(0.07%)#25 | 752,337(0.00%)#3,078 |
| 26. | Spring Hill | 4 | 7,396(0.05%)#26 | 752,337(0.00%)#3,115 |
| 27. | Hesston | 4 | 7,396(0.05%)#27 | 752,337(0.00%)#3,126 |
| 28. | Chase | 4 | 7,396(0.05%)#28 | 752,337(0.00%)#3,169 |
| 29. | Leawood | 3 | 7,396(0.04%)#29 | 752,337(0.00%)#3,186 |
| 30. | Hillsboro | 3 | 7,396(0.04%)#30 | 752,337(0.00%)#3,215 |
| 31. | Eastborough | 2 | 7,396(0.03%)#31 | 752,337(0.00%)#3,338 |
| 32. | Hoxie | 1 | 7,396(0.01%)#32 | 752,337(0.00%)#3,464 |
| 33. | Haviland | 1 | 7,396(0.01%)#33 | 752,337(0.00%)#3,475 |
| 34. | Cunningham | 1 | 7,396(0.01%)#34 | 752,337(0.00%)#3,483 |
Common Questions
What are the Top 10 Cities with the Most Immigrants from Eastern Africa in Kansas?
Top 10 Cities with the Most Immigrants from Eastern Africa in Kansas are:
#1
1,652
#2
1,300
#3
1,175
#4
728
#5
711
#6
412
#7
327
#8
258
#9
236
#10
202
What city has the Most Immigrants from Eastern Africa in Kansas?
Olathe has the Most Immigrants from Eastern Africa in Kansas with 1,652.
What is the Total Immigrants from Eastern Africa in the State of Kansas?
Total Immigrants from Eastern Africa in Kansas is 7,396.
What is the Total Immigrants from Eastern Africa in the United States?
Total Immigrants from Eastern Africa in the United States is 752,337.