Cities with the Highest Percentage of Population Employed in Enterprise Management in Ohio
RELATED REPORTS & OPTIONS
Enterprise Management
Ohio
Compare Cities
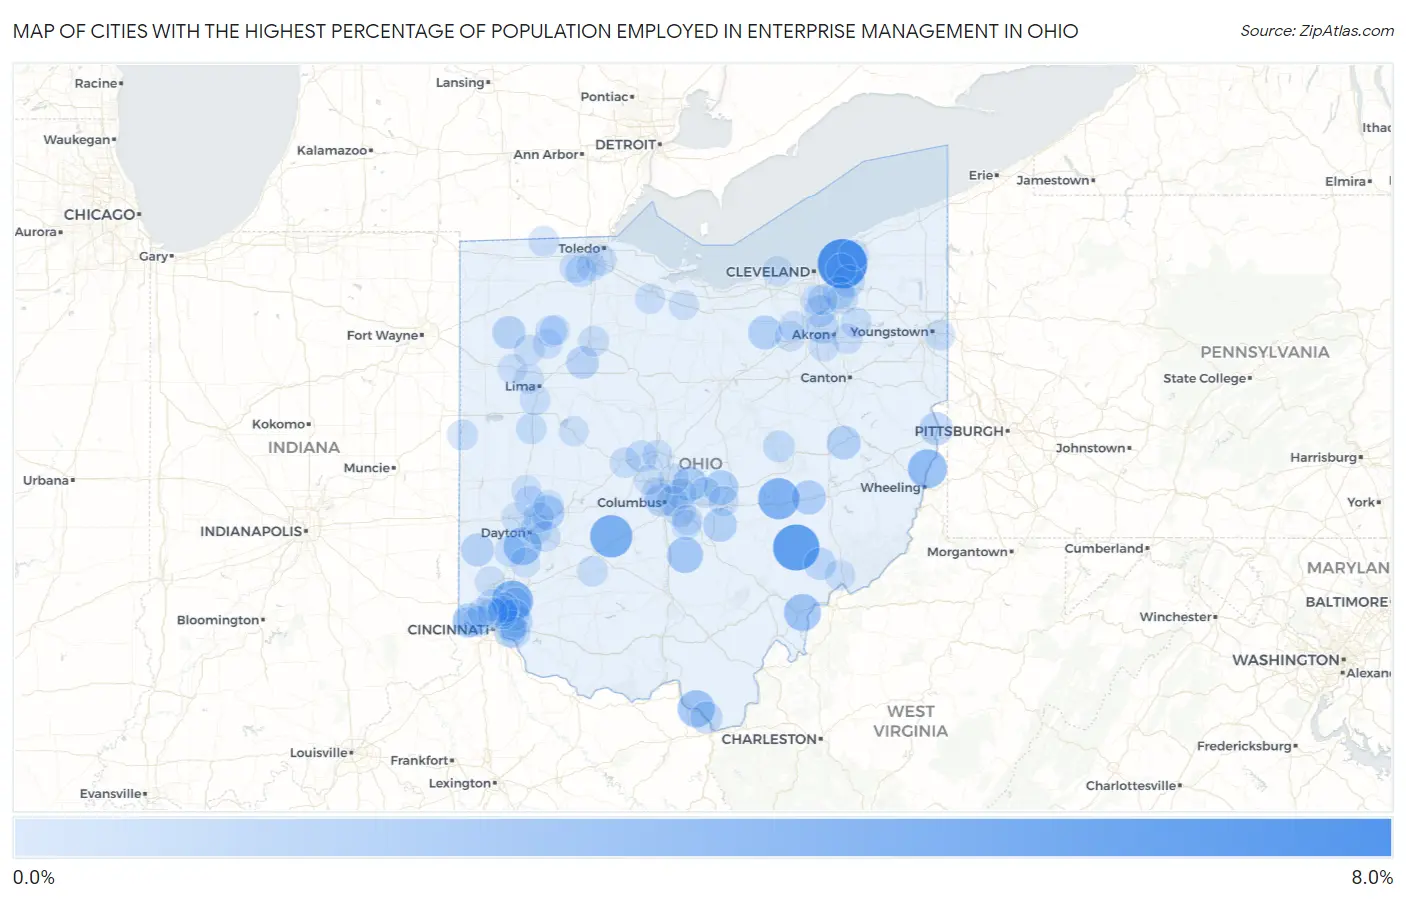
Map of Cities with the Highest Percentage of Population Employed in Enterprise Management in Ohio
0.0%
8.0%
Cities with the Highest Percentage of Population Employed in Enterprise Management in Ohio
| City | % Employed | vs State | vs National | |
| 1. | Mayfield | 7.0% | 0.14%(+6.85)#1 | 0.14%(+6.85)#29 |
| 2. | Mcconnelsville | 5.8% | 0.14%(+5.68)#2 | 0.14%(+5.68)#42 |
| 3. | Midway | 4.4% | 0.14%(+4.28)#3 | 0.14%(+4.29)#68 |
| 4. | Highpoint | 4.1% | 0.14%(+3.93)#4 | 0.14%(+3.93)#79 |
| 5. | North Zanesville | 4.1% | 0.14%(+3.92)#5 | 0.14%(+3.92)#80 |
| 6. | Rayland | 3.3% | 0.14%(+3.13)#6 | 0.14%(+3.13)#115 |
| 7. | West Carrollton | 2.8% | 0.14%(+2.67)#7 | 0.14%(+2.67)#143 |
| 8. | Hanging Rock | 2.7% | 0.14%(+2.52)#8 | 0.14%(+2.53)#156 |
| 9. | Coolville | 2.6% | 0.14%(+2.47)#9 | 0.14%(+2.48)#167 |
| 10. | Stoutsville | 2.2% | 0.14%(+2.10)#10 | 0.14%(+2.11)#211 |
| 11. | New Albany | 1.8% | 0.14%(+1.65)#11 | 0.14%(+1.65)#284 |
| 12. | Granville | 1.8% | 0.14%(+1.62)#12 | 0.14%(+1.63)#291 |
| 13. | New Concord | 1.7% | 0.14%(+1.52)#13 | 0.14%(+1.53)#317 |
| 14. | Park Layne | 1.6% | 0.14%(+1.47)#14 | 0.14%(+1.47)#329 |
| 15. | Spencer | 1.6% | 0.14%(+1.42)#15 | 0.14%(+1.42)#341 |
| 16. | Miami Heights | 1.5% | 0.14%(+1.38)#16 | 0.14%(+1.38)#354 |
| 17. | Pleasantville | 1.5% | 0.14%(+1.37)#17 | 0.14%(+1.37)#356 |
| 18. | Gnadenhutten | 1.5% | 0.14%(+1.36)#18 | 0.14%(+1.36)#362 |
| 19. | Toronto | 1.4% | 0.14%(+1.21)#19 | 0.14%(+1.22)#412 |
| 20. | Oakwood | 1.3% | 0.14%(+1.15)#20 | 0.14%(+1.16)#435 |
| 21. | Camden | 1.3% | 0.14%(+1.12)#21 | 0.14%(+1.13)#446 |
| 22. | Grandview Heights | 1.3% | 0.14%(+1.11)#22 | 0.14%(+1.12)#452 |
| 23. | Middlebranch | 1.2% | 0.14%(+1.03)#23 | 0.14%(+1.03)#488 |
| 24. | Jenera | 1.1% | 0.14%(+1.01)#24 | 0.14%(+1.01)#499 |
| 25. | Terrace Park | 1.1% | 0.14%(+0.999)#25 | 0.14%(+1.00)#505 |
| 26. | Chagrin Falls | 1.1% | 0.14%(+0.934)#26 | 0.14%(+0.938)#532 |
| 27. | Fairlawn | 1.0% | 0.14%(+0.889)#27 | 0.14%(+0.893)#566 |
| 28. | Beverly | 1.0% | 0.14%(+0.872)#28 | 0.14%(+0.876)#581 |
| 29. | Coal Grove | 1.0% | 0.14%(+0.864)#29 | 0.14%(+0.868)#586 |
| 30. | Sherwood | 0.93% | 0.14%(+0.783)#30 | 0.14%(+0.787)#659 |
| 31. | Sixteen Mile Stand | 0.93% | 0.14%(+0.783)#31 | 0.14%(+0.787)#661 |
| 32. | Glenwillow | 0.89% | 0.14%(+0.747)#32 | 0.14%(+0.752)#698 |
| 33. | Richfield | 0.88% | 0.14%(+0.737)#33 | 0.14%(+0.741)#706 |
| 34. | Greenhills | 0.83% | 0.14%(+0.690)#34 | 0.14%(+0.694)#749 |
| 35. | The Village Of Indian Hill | 0.82% | 0.14%(+0.674)#35 | 0.14%(+0.678)#765 |
| 36. | Warsaw | 0.80% | 0.14%(+0.660)#36 | 0.14%(+0.665)#784 |
| 37. | Ostrander | 0.80% | 0.14%(+0.659)#37 | 0.14%(+0.663)#786 |
| 38. | West Leipsic | 0.76% | 0.14%(+0.615)#38 | 0.14%(+0.619)#848 |
| 39. | Blacklick Estates | 0.76% | 0.14%(+0.613)#39 | 0.14%(+0.617)#851 |
| 40. | Waterville | 0.75% | 0.14%(+0.603)#40 | 0.14%(+0.607)#869 |
| 41. | Twinsburg | 0.69% | 0.14%(+0.550)#41 | 0.14%(+0.554)#941 |
| 42. | Newtown | 0.66% | 0.14%(+0.521)#42 | 0.14%(+0.526)#975 |
| 43. | Cherry Grove | 0.65% | 0.14%(+0.511)#43 | 0.14%(+0.515)#995 |
| 44. | Riverside | 0.64% | 0.14%(+0.494)#44 | 0.14%(+0.498)#1,016 |
| 45. | Beechwood Trails | 0.61% | 0.14%(+0.470)#45 | 0.14%(+0.474)#1,069 |
| 46. | Germantown | 0.60% | 0.14%(+0.457)#46 | 0.14%(+0.461)#1,090 |
| 47. | Botkins | 0.59% | 0.14%(+0.450)#47 | 0.14%(+0.454)#1,099 |
| 48. | Amberley | 0.57% | 0.14%(+0.431)#48 | 0.14%(+0.435)#1,137 |
| 49. | Kirtland | 0.57% | 0.14%(+0.430)#49 | 0.14%(+0.435)#1,139 |
| 50. | Bridgetown | 0.56% | 0.14%(+0.422)#50 | 0.14%(+0.426)#1,164 |
| 51. | Gahanna | 0.56% | 0.14%(+0.420)#51 | 0.14%(+0.424)#1,170 |
| 52. | Rossford | 0.56% | 0.14%(+0.414)#52 | 0.14%(+0.418)#1,184 |
| 53. | Sabina | 0.55% | 0.14%(+0.407)#53 | 0.14%(+0.411)#1,204 |
| 54. | Cridersville | 0.54% | 0.14%(+0.402)#54 | 0.14%(+0.406)#1,215 |
| 55. | Devola | 0.54% | 0.14%(+0.400)#55 | 0.14%(+0.404)#1,221 |
| 56. | Kalida | 0.53% | 0.14%(+0.391)#56 | 0.14%(+0.396)#1,240 |
| 57. | Whitehouse | 0.53% | 0.14%(+0.389)#57 | 0.14%(+0.394)#1,245 |
| 58. | Broadview Heights | 0.53% | 0.14%(+0.388)#58 | 0.14%(+0.392)#1,250 |
| 59. | Tipp City | 0.52% | 0.14%(+0.378)#59 | 0.14%(+0.383)#1,270 |
| 60. | Campbell | 0.52% | 0.14%(+0.378)#60 | 0.14%(+0.382)#1,272 |
| 61. | Brady Lake | 0.52% | 0.14%(+0.375)#61 | 0.14%(+0.380)#1,280 |
| 62. | Lyons | 0.51% | 0.14%(+0.371)#62 | 0.14%(+0.376)#1,289 |
| 63. | Evendale | 0.51% | 0.14%(+0.369)#63 | 0.14%(+0.373)#1,291 |
| 64. | Marysville | 0.51% | 0.14%(+0.365)#64 | 0.14%(+0.369)#1,301 |
| 65. | Bexley | 0.50% | 0.14%(+0.361)#65 | 0.14%(+0.365)#1,317 |
| 66. | Beavercreek | 0.50% | 0.14%(+0.359)#66 | 0.14%(+0.363)#1,323 |
| 67. | Fort Recovery | 0.50% | 0.14%(+0.354)#67 | 0.14%(+0.358)#1,338 |
| 68. | Findlay | 0.49% | 0.14%(+0.343)#68 | 0.14%(+0.348)#1,365 |
| 69. | Chippewa Lake | 0.46% | 0.14%(+0.318)#69 | 0.14%(+0.322)#1,422 |
| 70. | North Bend | 0.44% | 0.14%(+0.301)#70 | 0.14%(+0.305)#1,476 |
| 71. | Lithopolis | 0.43% | 0.14%(+0.287)#71 | 0.14%(+0.291)#1,511 |
| 72. | Medina | 0.43% | 0.14%(+0.285)#72 | 0.14%(+0.289)#1,518 |
| 73. | Mogadore | 0.43% | 0.14%(+0.282)#73 | 0.14%(+0.287)#1,531 |
| 74. | Mayfield Heights | 0.42% | 0.14%(+0.276)#74 | 0.14%(+0.280)#1,545 |
| 75. | Delaware | 0.41% | 0.14%(+0.267)#75 | 0.14%(+0.271)#1,578 |
| 76. | Barberton | 0.41% | 0.14%(+0.266)#76 | 0.14%(+0.271)#1,581 |
| 77. | Canal Winchester | 0.41% | 0.14%(+0.265)#77 | 0.14%(+0.269)#1,586 |
| 78. | Ballville | 0.40% | 0.14%(+0.261)#78 | 0.14%(+0.265)#1,601 |
| 79. | Huber Heights | 0.40% | 0.14%(+0.260)#79 | 0.14%(+0.264)#1,608 |
| 80. | Hebron | 0.39% | 0.14%(+0.252)#80 | 0.14%(+0.256)#1,637 |
| 81. | Upper Arlington | 0.39% | 0.14%(+0.251)#81 | 0.14%(+0.255)#1,638 |
| 82. | Avon Lake | 0.39% | 0.14%(+0.251)#82 | 0.14%(+0.255)#1,639 |
| 83. | Ottawa | 0.39% | 0.14%(+0.248)#83 | 0.14%(+0.253)#1,653 |
| 84. | Elida | 0.39% | 0.14%(+0.243)#84 | 0.14%(+0.247)#1,673 |
| 85. | Brecksville | 0.37% | 0.14%(+0.231)#85 | 0.14%(+0.236)#1,714 |
| 86. | Westerville | 0.37% | 0.14%(+0.230)#86 | 0.14%(+0.234)#1,730 |
| 87. | Troy | 0.37% | 0.14%(+0.225)#87 | 0.14%(+0.229)#1,751 |
| 88. | Leipsic | 0.37% | 0.14%(+0.222)#88 | 0.14%(+0.227)#1,759 |
| 89. | Englewood | 0.36% | 0.14%(+0.222)#89 | 0.14%(+0.226)#1,765 |
| 90. | Huntsville | 0.36% | 0.14%(+0.214)#90 | 0.14%(+0.219)#1,792 |
| 91. | Reading | 0.35% | 0.14%(+0.208)#91 | 0.14%(+0.212)#1,816 |
| 92. | Bellevue | 0.35% | 0.14%(+0.207)#92 | 0.14%(+0.211)#1,818 |
| 93. | Dublin | 0.35% | 0.14%(+0.206)#93 | 0.14%(+0.210)#1,821 |
| 94. | Finneytown | 0.35% | 0.14%(+0.203)#94 | 0.14%(+0.207)#1,834 |
| 95. | Perrysburg | 0.35% | 0.14%(+0.202)#95 | 0.14%(+0.207)#1,836 |
| 96. | New Carlisle | 0.34% | 0.14%(+0.202)#96 | 0.14%(+0.206)#1,838 |
| 97. | Delphos | 0.33% | 0.14%(+0.186)#97 | 0.14%(+0.190)#1,913 |
| 98. | New Miami | 0.32% | 0.14%(+0.174)#98 | 0.14%(+0.178)#1,959 |
| 99. | Springboro | 0.32% | 0.14%(+0.172)#99 | 0.14%(+0.177)#1,966 |
| 100. | White Oak | 0.31% | 0.14%(+0.171)#100 | 0.14%(+0.175)#1,974 |
Common Questions
What are the Top 10 Cities with the Highest Percentage of Population Employed in Enterprise Management in Ohio?
Top 10 Cities with the Highest Percentage of Population Employed in Enterprise Management in Ohio are:
#1
7.0%
#2
5.8%
#3
4.4%
#4
4.1%
#5
4.1%
#6
3.3%
#7
2.8%
#8
2.7%
#9
2.6%
#10
2.2%
What city has the Highest Percentage of Population Employed in Enterprise Management in Ohio?
Mayfield has the Highest Percentage of Population Employed in Enterprise Management in Ohio with 7.0%.
What is the Percentage of Population Employed in Enterprise Management in the State of Ohio?
Percentage of Population Employed in Enterprise Management in Ohio is 0.14%.
What is the Percentage of Population Employed in Enterprise Management in the United States?
Percentage of Population Employed in Enterprise Management in the United States is 0.14%.