Ovilla, TX
Ovilla Map
Ovilla Overview
4,077
TOTAL POPULATION
1,966
MALE POPULATION
2,111
FEMALE POPULATION
93.13
MALES / 100 FEMALES
107.38
FEMALES / 100 MALES
45.2
MEDIAN AGE
3.1
AVG FAMILY SIZE
2.7
AVG HOUSEHOLD SIZE
$48,664
PER CAPITA INCOME
$132,685
AVG FAMILY INCOME
$109,130
AVG HOUSEHOLD INCOME
41.4%
WAGE / INCOME GAP [ % ]
58.6¢/ $1
WAGE / INCOME GAP [ $ ]
$17,805
FAMILY INCOME DEFICIT
0.36
INEQUALITY / GINI INDEX
1,925
LABOR FORCE [ PEOPLE ]
58.9%
PERCENT IN LABOR FORCE
3.4%
UNEMPLOYMENT RATE
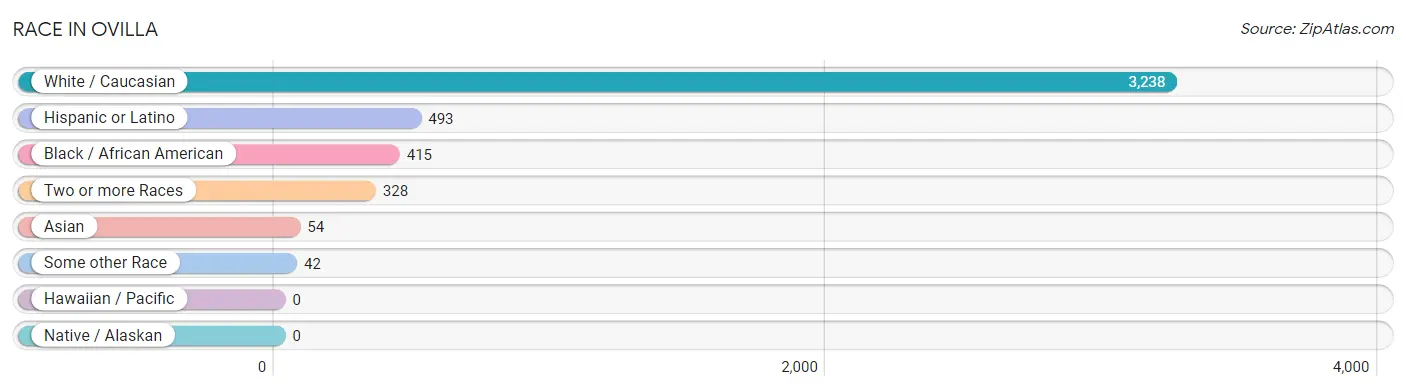
Race in Ovilla
The most populous races in Ovilla are White / Caucasian (3,238 | 79.4%), Hispanic or Latino (493 | 12.1%), and Black / African American (415 | 10.2%).
| Race | # Population | % Population |
| Asian | 54 | 1.3% |
| Black / African American | 415 | 10.2% |
| Hawaiian / Pacific | 0 | 0.0% |
| Hispanic or Latino | 493 | 12.1% |
| Native / Alaskan | 0 | 0.0% |
| White / Caucasian | 3,238 | 79.4% |
| Two or more Races | 328 | 8.1% |
| Some other Race | 42 | 1.0% |
| Total | 4,077 | 100.0% |
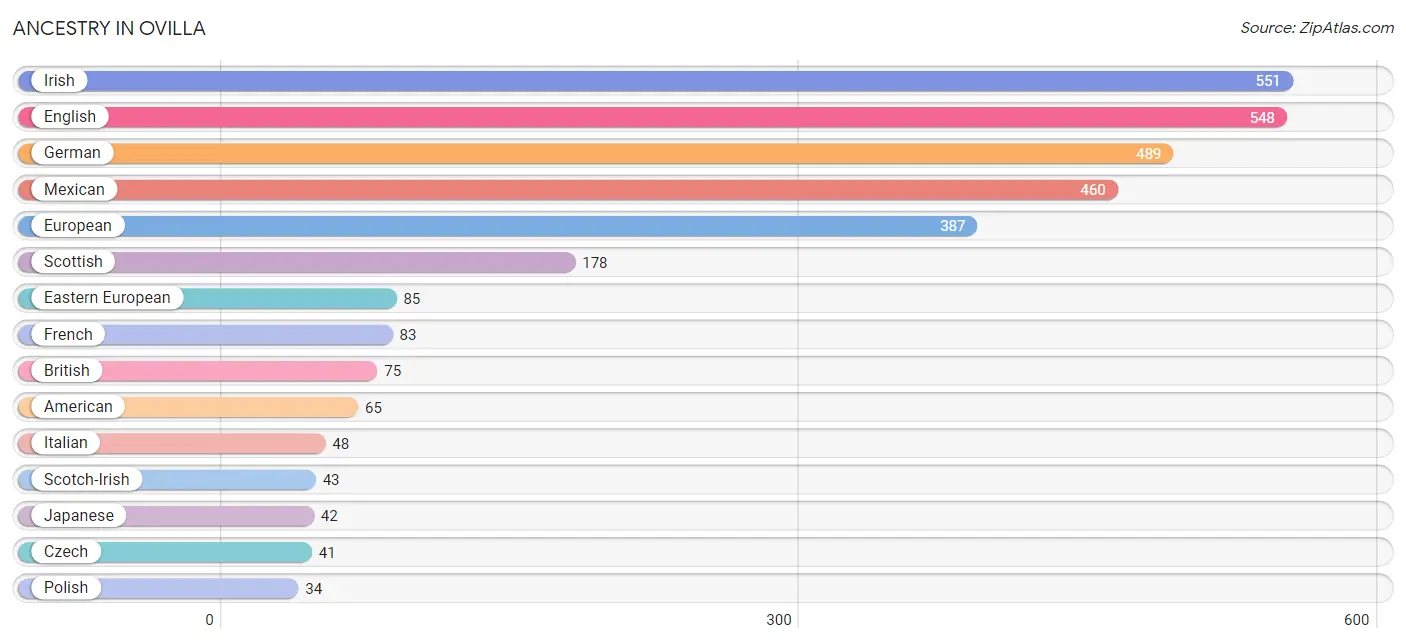
Ancestry in Ovilla
The most populous ancestries reported in Ovilla are Irish (551 | 13.5%), English (548 | 13.4%), German (489 | 12.0%), Mexican (460 | 11.3%), and European (387 | 9.5%), together accounting for 59.7% of all Ovilla residents.
| Ancestry | # Population | % Population |
| American | 65 | 1.6% |
| Belgian | 27 | 0.7% |
| British | 75 | 1.8% |
| Cherokee | 6 | 0.2% |
| Czech | 41 | 1.0% |
| Dutch | 6 | 0.2% |
| Eastern European | 85 | 2.1% |
| English | 548 | 13.4% |
| European | 387 | 9.5% |
| French | 83 | 2.0% |
| German | 489 | 12.0% |
| Indian (Asian) | 12 | 0.3% |
| Irish | 551 | 13.5% |
| Italian | 48 | 1.2% |
| Japanese | 42 | 1.0% |
| Mexican | 460 | 11.3% |
| Norwegian | 17 | 0.4% |
| Polish | 34 | 0.8% |
| Puerto Rican | 33 | 0.8% |
| Scotch-Irish | 43 | 1.1% |
| Scottish | 178 | 4.4% |
| Swedish | 24 | 0.6% |
| Swiss | 5 | 0.1% |
| Welsh | 8 | 0.2% | View All 24 Rows |
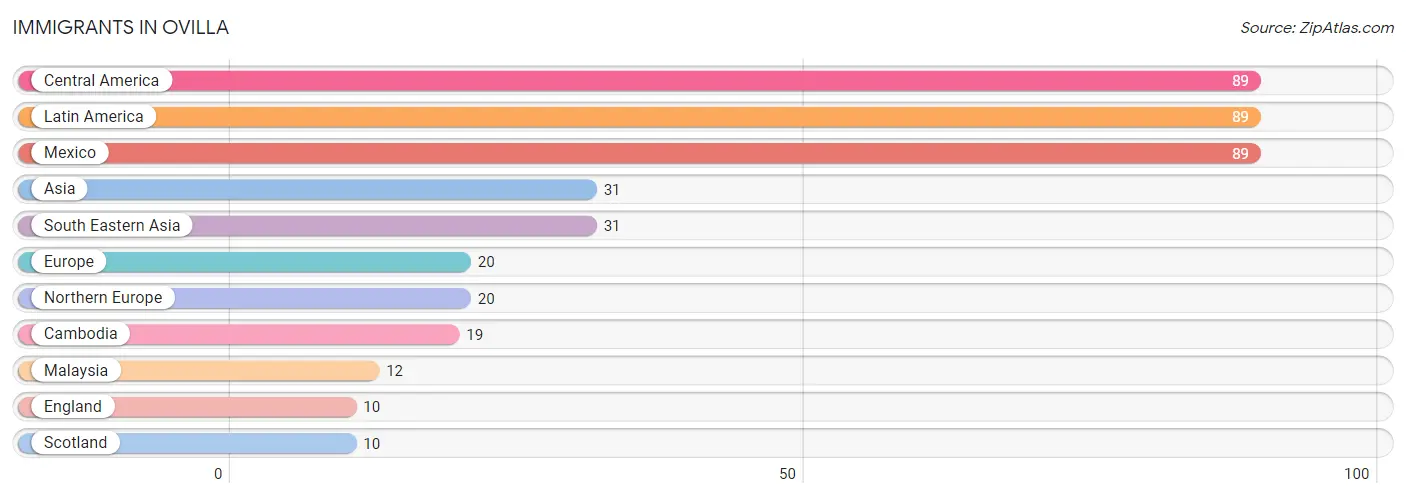
Immigrants in Ovilla
The most numerous immigrant groups reported in Ovilla came from Central America (89 | 2.2%), Latin America (89 | 2.2%), Mexico (89 | 2.2%), Asia (31 | 0.8%), and South Eastern Asia (31 | 0.8%), together accounting for 8.1% of all Ovilla residents.
| Immigration Origin | # Population | % Population |
| Asia | 31 | 0.8% |
| Cambodia | 19 | 0.5% |
| Central America | 89 | 2.2% |
| England | 10 | 0.3% |
| Europe | 20 | 0.5% |
| Latin America | 89 | 2.2% |
| Malaysia | 12 | 0.3% |
| Mexico | 89 | 2.2% |
| Northern Europe | 20 | 0.5% |
| Scotland | 10 | 0.3% |
| South Eastern Asia | 31 | 0.8% | View All 11 Rows |
Sex and Age in Ovilla
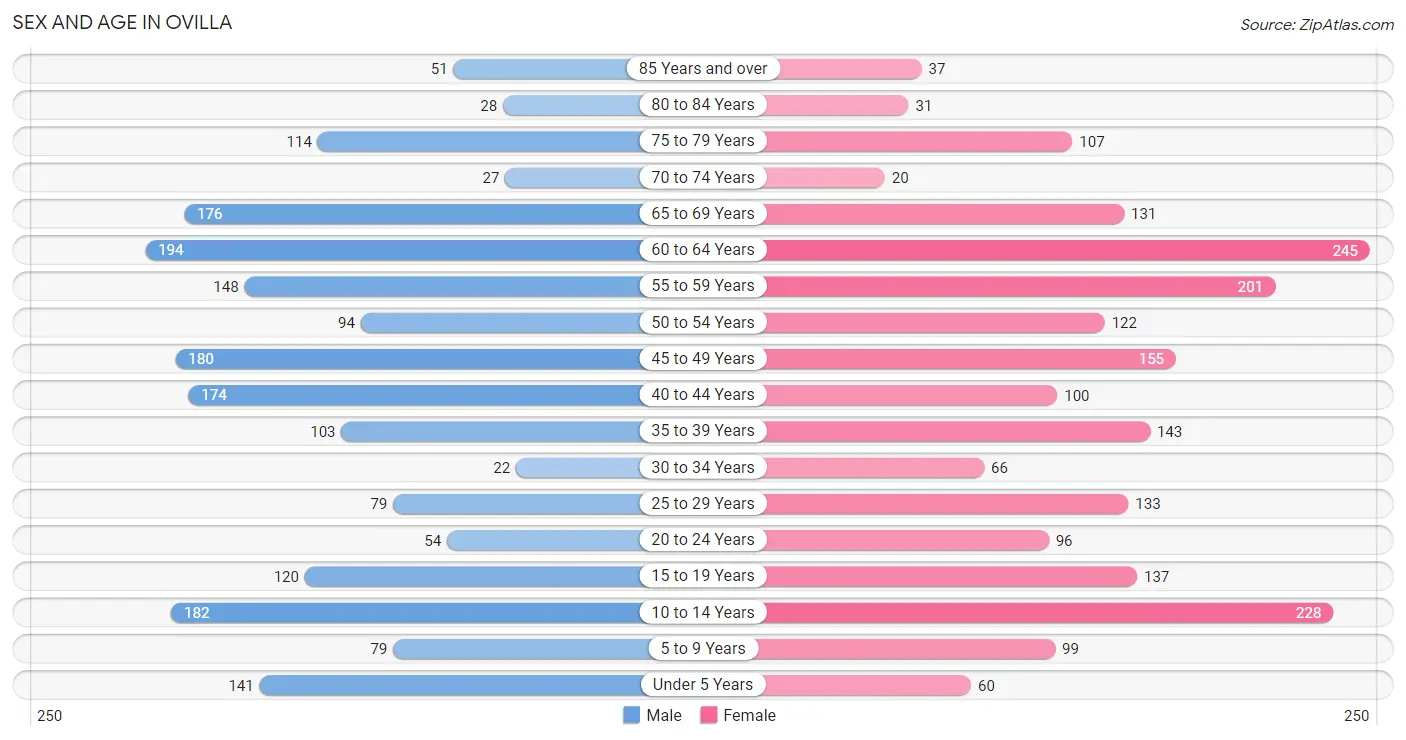
Sex and Age in Ovilla
The most populous age groups in Ovilla are 60 to 64 Years (194 | 9.9%) for men and 60 to 64 Years (245 | 11.6%) for women.
| Age Bracket | Male | Female |
| Under 5 Years | 141 (7.2%) | 60 (2.8%) |
| 5 to 9 Years | 79 (4.0%) | 99 (4.7%) |
| 10 to 14 Years | 182 (9.3%) | 228 (10.8%) |
| 15 to 19 Years | 120 (6.1%) | 137 (6.5%) |
| 20 to 24 Years | 54 (2.8%) | 96 (4.5%) |
| 25 to 29 Years | 79 (4.0%) | 133 (6.3%) |
| 30 to 34 Years | 22 (1.1%) | 66 (3.1%) |
| 35 to 39 Years | 103 (5.2%) | 143 (6.8%) |
| 40 to 44 Years | 174 (8.8%) | 100 (4.7%) |
| 45 to 49 Years | 180 (9.2%) | 155 (7.3%) |
| 50 to 54 Years | 94 (4.8%) | 122 (5.8%) |
| 55 to 59 Years | 148 (7.5%) | 201 (9.5%) |
| 60 to 64 Years | 194 (9.9%) | 245 (11.6%) |
| 65 to 69 Years | 176 (8.9%) | 131 (6.2%) |
| 70 to 74 Years | 27 (1.4%) | 20 (0.9%) |
| 75 to 79 Years | 114 (5.8%) | 107 (5.1%) |
| 80 to 84 Years | 28 (1.4%) | 31 (1.5%) |
| 85 Years and over | 51 (2.6%) | 37 (1.8%) |
| Total | 1,966 (100.0%) | 2,111 (100.0%) |
Families and Households in Ovilla
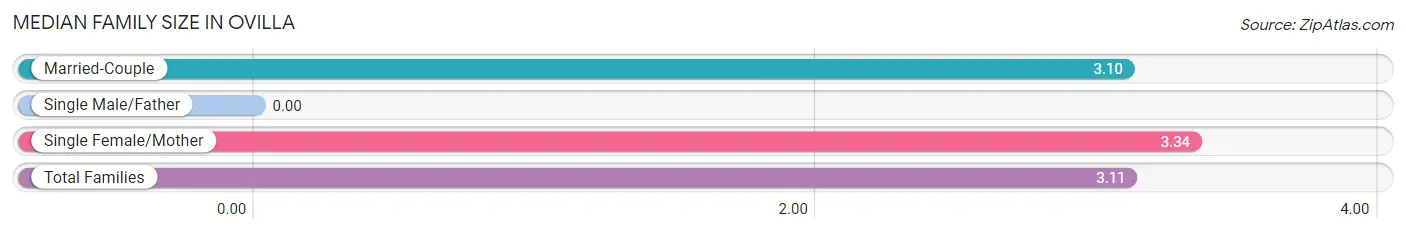
Median Family Size in Ovilla
| Family Type | # Families | Family Size |
| Married-Couple | 1,164 (96.8%) | 3.10 |
| Single Male/Father | 0 (0.0%) | - |
| Single Female/Mother | 38 (3.2%) | 3.34 |
| Total Families | 1,202 (100.0%) | 3.11 |
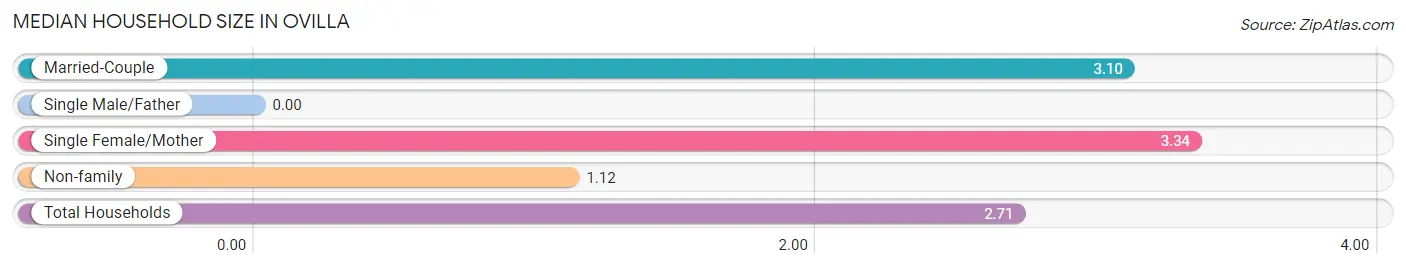
Median Household Size in Ovilla
| Household Type | # Households | Household Size |
| Married-Couple | 1,164 (77.4%) | 3.10 |
| Single Male/Father | 0 (0.0%) | - |
| Single Female/Mother | 38 (2.5%) | 3.34 |
| Non-family | 302 (20.1%) | 1.12 |
| Total Households | 1,504 (100.0%) | 2.71 |
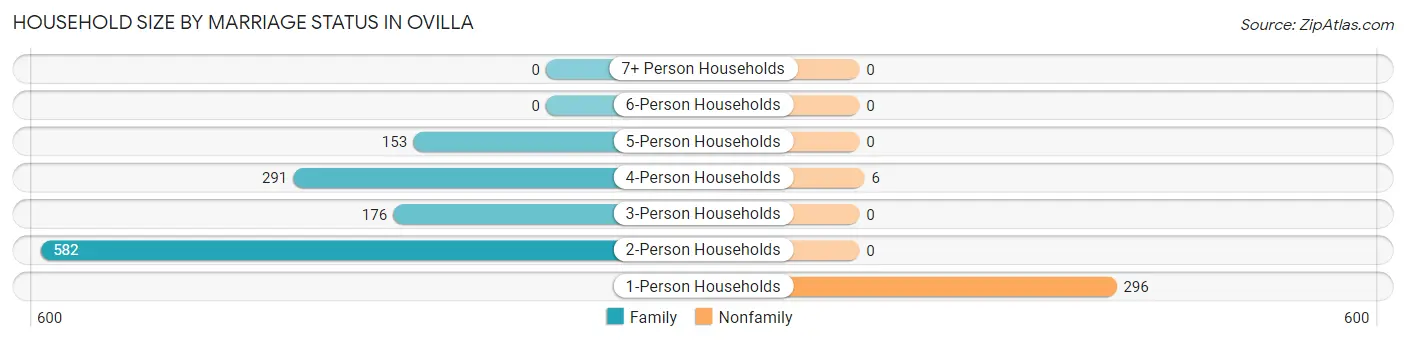
Household Size by Marriage Status in Ovilla
Out of a total of 1,504 households in Ovilla, 1,202 (79.9%) are family households, while 302 (20.1%) are nonfamily households. The most numerous type of family households are 2-person households, comprising 582, and the most common type of nonfamily households are 1-person households, comprising 296.
| Household Size | Family Households | Nonfamily Households |
| 1-Person Households | - | 296 (19.7%) |
| 2-Person Households | 582 (38.7%) | 0 (0.0%) |
| 3-Person Households | 176 (11.7%) | 0 (0.0%) |
| 4-Person Households | 291 (19.4%) | 6 (0.4%) |
| 5-Person Households | 153 (10.2%) | 0 (0.0%) |
| 6-Person Households | 0 (0.0%) | 0 (0.0%) |
| 7+ Person Households | 0 (0.0%) | 0 (0.0%) |
| Total | 1,202 (79.9%) | 302 (20.1%) |
Female Fertility in Ovilla
Fertility by Age in Ovilla
Average fertility rate in Ovilla is 96.0 births per 1,000 women. Women in the age bracket of 20 to 34 years have the highest fertility rate with 285.0 births per 1,000 women. Women in the age bracket of 20 to 34 years acount for 100.0% of all women with births.
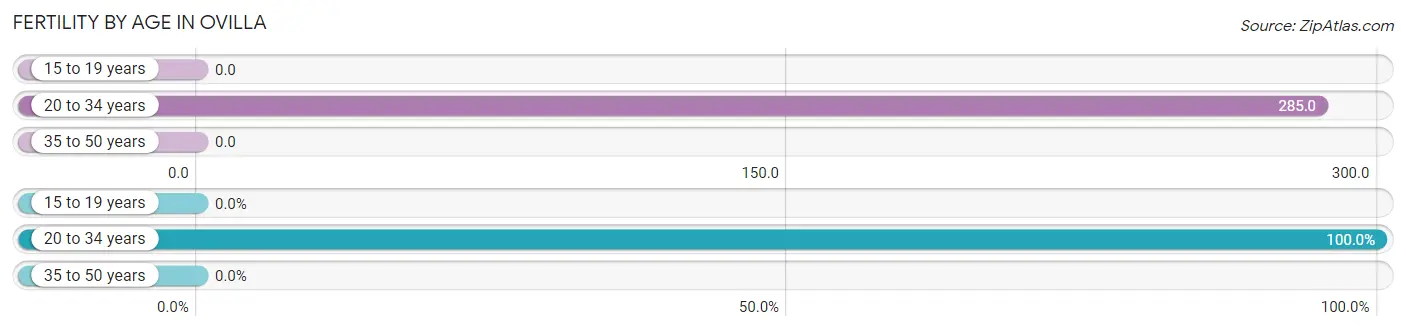
| Age Bracket | Women with Births | Births / 1,000 Women |
| 15 to 19 years | 0 (0.0%) | 0.0 |
| 20 to 34 years | 84 (100.0%) | 285.0 |
| 35 to 50 years | 0 (0.0%) | 0.0 |
| Total | 84 (100.0%) | 96.0 |
Fertility by Age by Marriage Status in Ovilla
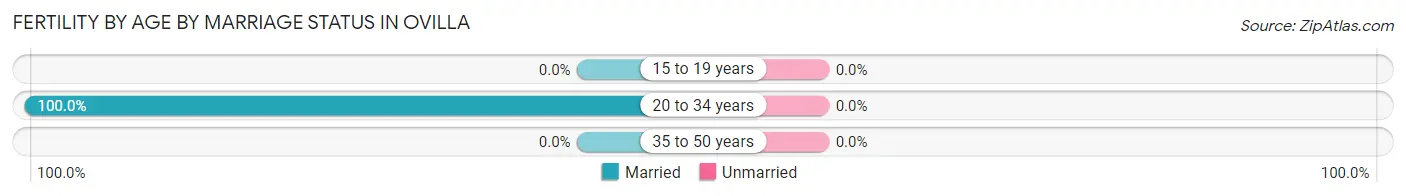
| Age Bracket | Married | Unmarried |
| 15 to 19 years | 0 (0.0%) | 0 (0.0%) |
| 20 to 34 years | 84 (100.0%) | 0 (0.0%) |
| 35 to 50 years | 0 (0.0%) | 0 (0.0%) |
| Total | 84 (100.0%) | 0 (0.0%) |
Fertility by Education in Ovilla
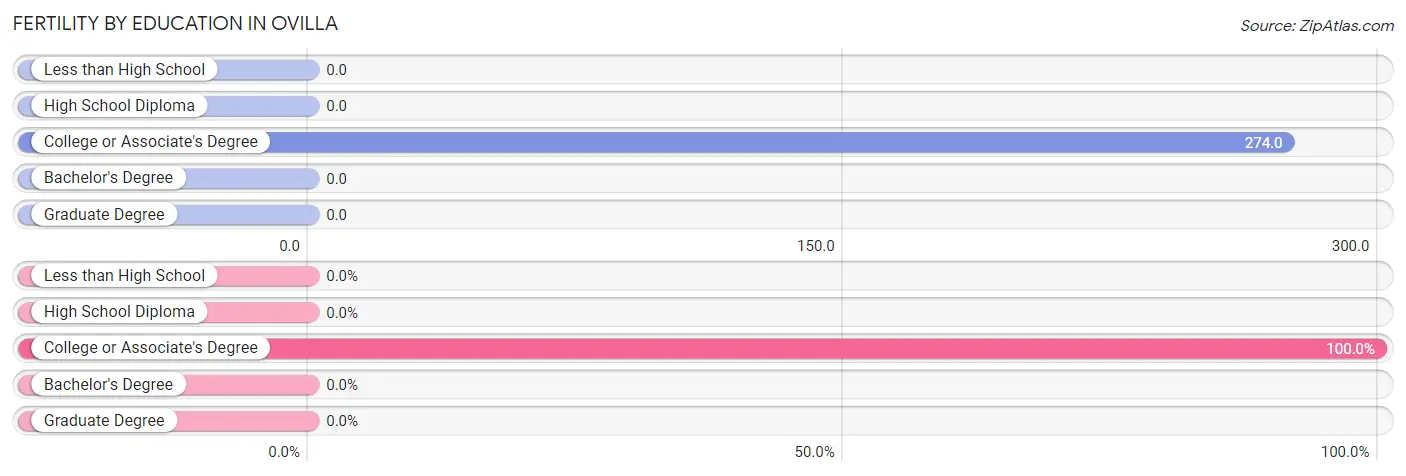
| Educational Attainment | Women with Births | Births / 1,000 Women |
| Less than High School | 0 (0.0%) | 0.0 |
| High School Diploma | 0 (0.0%) | 0.0 |
| College or Associate's Degree | 84 (100.0%) | 274.0 |
| Bachelor's Degree | 0 (0.0%) | 0.0 |
| Graduate Degree | 0 (0.0%) | 0.0 |
| Total | 84 (100.0%) | 96.0 |
Fertility by Education by Marriage Status in Ovilla
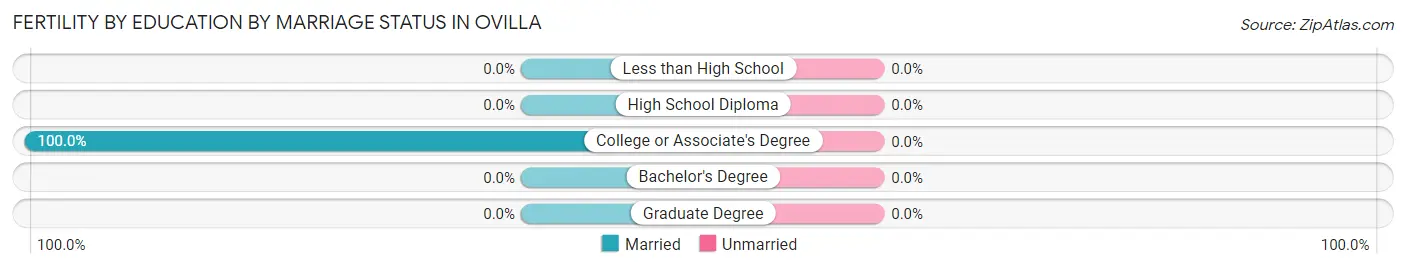
| Educational Attainment | Married | Unmarried |
| Less than High School | 0 (0.0%) | 0 (0.0%) |
| High School Diploma | 0 (0.0%) | 0 (0.0%) |
| College or Associate's Degree | 84 (100.0%) | 0 (0.0%) |
| Bachelor's Degree | 0 (0.0%) | 0 (0.0%) |
| Graduate Degree | 0 (0.0%) | 0 (0.0%) |
| Total | 84 (100.0%) | 0 (0.0%) |
Income in Ovilla
Income Overview in Ovilla
Per Capita Income in Ovilla is $48,664, while median incomes of families and households are $132,685 and $109,130 respectively.
| Characteristic | Number | Measure |
| Per Capita Income | 4,077 | $48,664 |
| Median Family Income | 1,202 | $132,685 |
| Mean Family Income | 1,202 | $144,842 |
| Median Household Income | 1,504 | $109,130 |
| Mean Household Income | 1,504 | $128,703 |
| Income Deficit | 1,202 | $17,805 |
| Wage / Income Gap (%) | 4,077 | 41.40% |
| Wage / Income Gap ($) | 4,077 | 58.60¢ per $1 |
| Gini / Inequality Index | 4,077 | 0.36 |
Earnings by Sex in Ovilla
Average Earnings in Ovilla are $62,959, $85,225 for men and $49,940 for women, a difference of 41.4%.
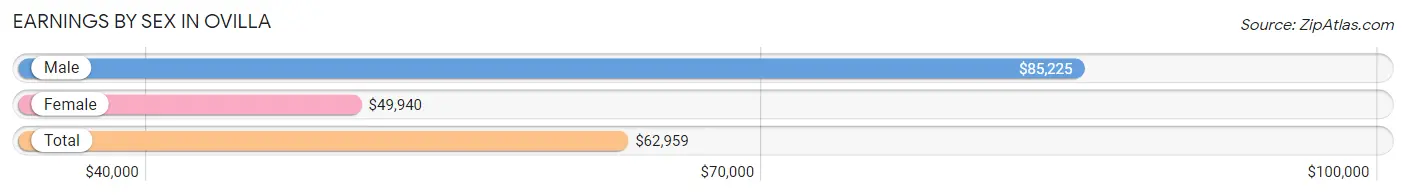
| Sex | Number | Average Earnings |
| Male | 1,021 (51.3%) | $85,225 |
| Female | 969 (48.7%) | $49,940 |
| Total | 1,990 (100.0%) | $62,959 |
Earnings by Sex by Income Bracket in Ovilla
The most common earnings brackets in Ovilla are $100,000+ for men (383 | 37.5%) and $75,000 to $99,999 for women (164 | 16.9%).
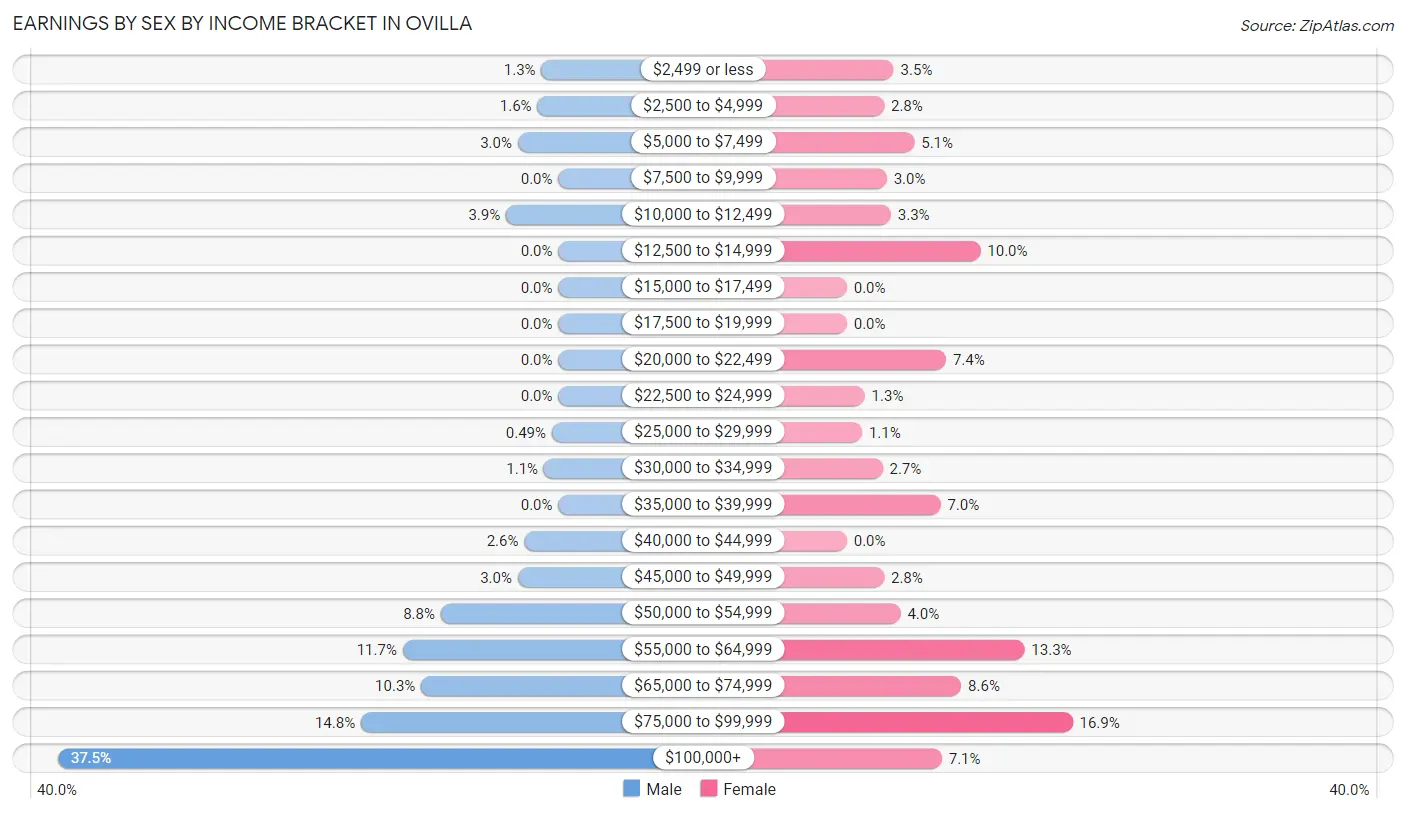
| Income | Male | Female |
| $2,499 or less | 13 (1.3%) | 34 (3.5%) |
| $2,500 to $4,999 | 16 (1.6%) | 27 (2.8%) |
| $5,000 to $7,499 | 31 (3.0%) | 49 (5.1%) |
| $7,500 to $9,999 | 0 (0.0%) | 29 (3.0%) |
| $10,000 to $12,499 | 40 (3.9%) | 32 (3.3%) |
| $12,500 to $14,999 | 0 (0.0%) | 97 (10.0%) |
| $15,000 to $17,499 | 0 (0.0%) | 0 (0.0%) |
| $17,500 to $19,999 | 0 (0.0%) | 0 (0.0%) |
| $20,000 to $22,499 | 0 (0.0%) | 72 (7.4%) |
| $22,500 to $24,999 | 0 (0.0%) | 13 (1.3%) |
| $25,000 to $29,999 | 5 (0.5%) | 11 (1.1%) |
| $30,000 to $34,999 | 11 (1.1%) | 26 (2.7%) |
| $35,000 to $39,999 | 0 (0.0%) | 68 (7.0%) |
| $40,000 to $44,999 | 26 (2.5%) | 0 (0.0%) |
| $45,000 to $49,999 | 31 (3.0%) | 27 (2.8%) |
| $50,000 to $54,999 | 90 (8.8%) | 39 (4.0%) |
| $55,000 to $64,999 | 119 (11.7%) | 129 (13.3%) |
| $65,000 to $74,999 | 105 (10.3%) | 83 (8.6%) |
| $75,000 to $99,999 | 151 (14.8%) | 164 (16.9%) |
| $100,000+ | 383 (37.5%) | 69 (7.1%) |
| Total | 1,021 (100.0%) | 969 (100.0%) |
Earnings by Sex by Educational Attainment in Ovilla
Average earnings in Ovilla are $86,650 for men and $55,750 for women, a difference of 35.7%. Men with an educational attainment of bachelor's degree enjoy the highest average annual earnings of $98,750, while those with college or associate's degree education earn the least with $71,115. Women with an educational attainment of bachelor's degree earn the most with the average annual earnings of $73,045, while those with high school diploma education have the smallest earnings of $38,125.
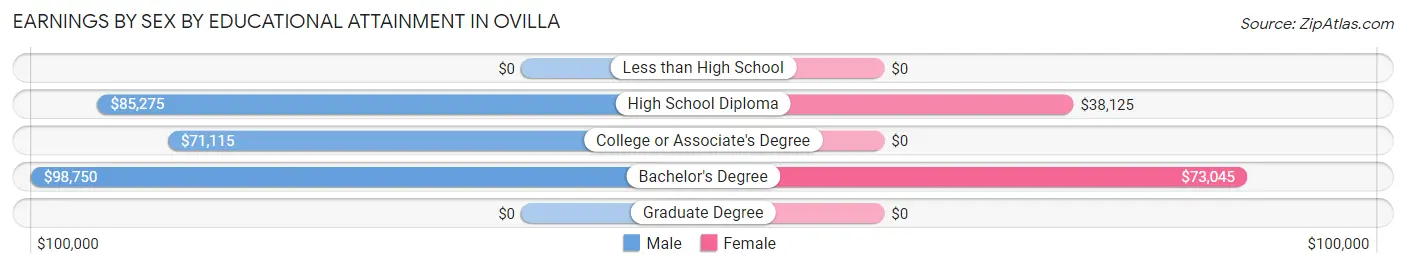
| Educational Attainment | Male Income | Female Income |
| Less than High School | - | - |
| High School Diploma | $85,275 | $38,125 |
| College or Associate's Degree | $71,115 | $0 |
| Bachelor's Degree | $98,750 | $73,045 |
| Graduate Degree | - | - |
| Total | $86,650 | $55,750 |
Family Income in Ovilla
Family Income Brackets in Ovilla
According to the Ovilla family income data, there are 358 families falling into the $100,000 to $149,999 income range, which is the most common income bracket and makes up 29.8% of all families.
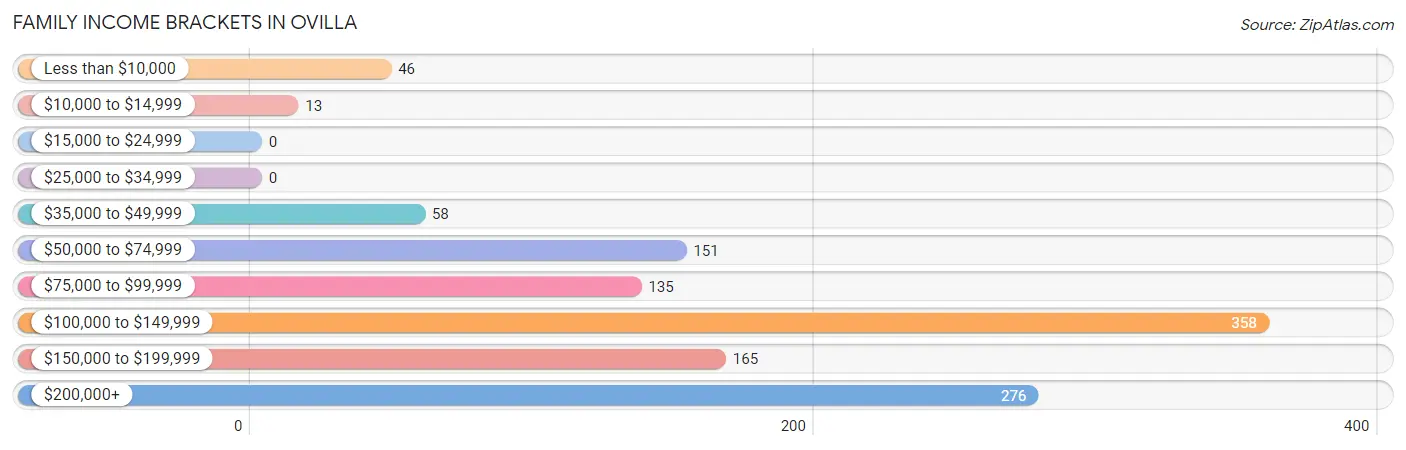
| Income Bracket | # Families | % Families |
| Less than $10,000 | 46 | 3.8% |
| $10,000 to $14,999 | 13 | 1.1% |
| $15,000 to $24,999 | 0 | 0.0% |
| $25,000 to $34,999 | 0 | 0.0% |
| $35,000 to $49,999 | 58 | 4.8% |
| $50,000 to $74,999 | 151 | 12.6% |
| $75,000 to $99,999 | 135 | 11.2% |
| $100,000 to $149,999 | 358 | 29.8% |
| $150,000 to $199,999 | 165 | 13.7% |
| $200,000+ | 276 | 23.0% |
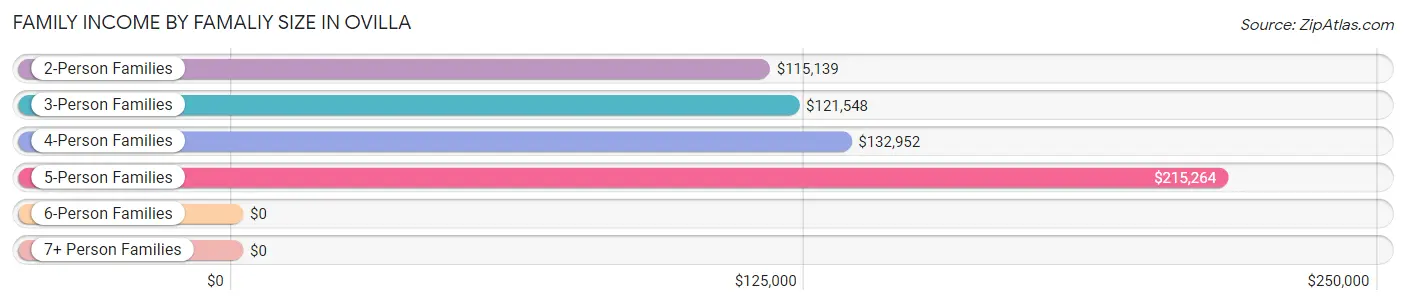
Family Income by Famaliy Size in Ovilla
5-person families (153 | 12.7%) account for the highest median family income in Ovilla with $215,264 per family, while 2-person families (582 | 48.4%) have the highest median income of $57,570 per family member.
| Income Bracket | # Families | Median Income |
| 2-Person Families | 582 (48.4%) | $115,139 |
| 3-Person Families | 176 (14.6%) | $121,548 |
| 4-Person Families | 291 (24.2%) | $132,952 |
| 5-Person Families | 153 (12.7%) | $215,264 |
| 6-Person Families | 0 (0.0%) | $0 |
| 7+ Person Families | 0 (0.0%) | $0 |
| Total | 1,202 (100.0%) | $132,685 |
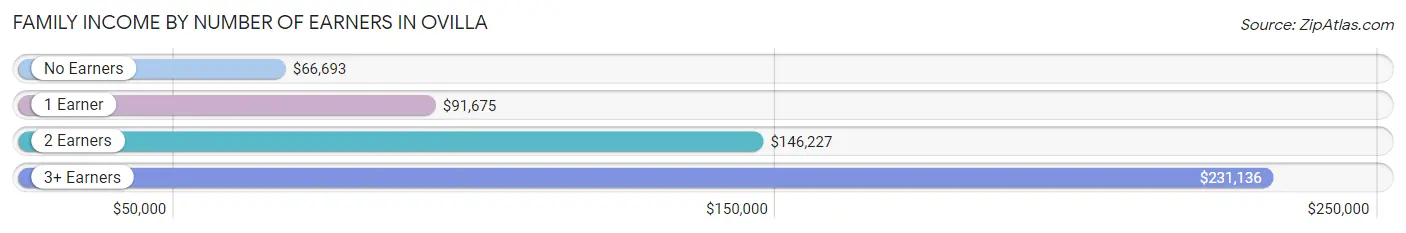
Family Income by Number of Earners in Ovilla
The median family income in Ovilla is $132,685, with families comprising 3+ earners (84) having the highest median family income of $231,136, while families with no earners (241) have the lowest median family income of $66,693, accounting for 7.0% and 20.1% of families, respectively.
| Number of Earners | # Families | Median Income |
| No Earners | 241 (20.1%) | $66,693 |
| 1 Earner | 199 (16.6%) | $91,675 |
| 2 Earners | 678 (56.4%) | $146,227 |
| 3+ Earners | 84 (7.0%) | $231,136 |
| Total | 1,202 (100.0%) | $132,685 |
Household Income in Ovilla
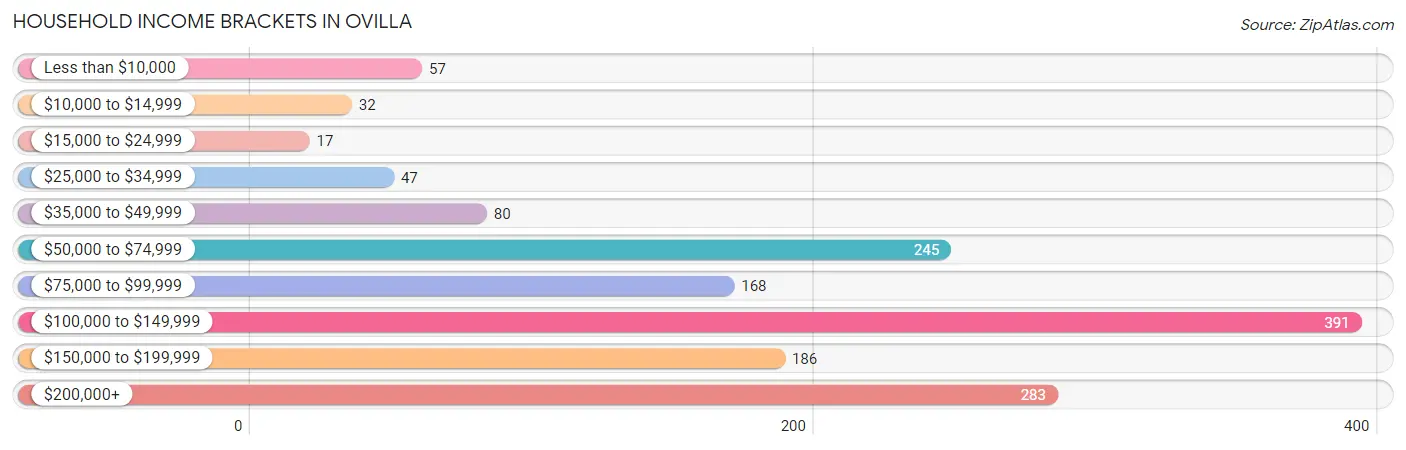
Household Income Brackets in Ovilla
With 391 households falling in the category, the $100,000 to $149,999 income range is the most frequent in Ovilla, accounting for 26.0% of all households. In contrast, only 17 households (1.1%) fall into the $15,000 to $24,999 income bracket, making it the least populous group.
| Income Bracket | # Households | % Households |
| Less than $10,000 | 57 | 3.8% |
| $10,000 to $14,999 | 32 | 2.1% |
| $15,000 to $24,999 | 17 | 1.1% |
| $25,000 to $34,999 | 47 | 3.1% |
| $35,000 to $49,999 | 80 | 5.3% |
| $50,000 to $74,999 | 245 | 16.3% |
| $75,000 to $99,999 | 168 | 11.2% |
| $100,000 to $149,999 | 391 | 26.0% |
| $150,000 to $199,999 | 186 | 12.4% |
| $200,000+ | 283 | 18.8% |
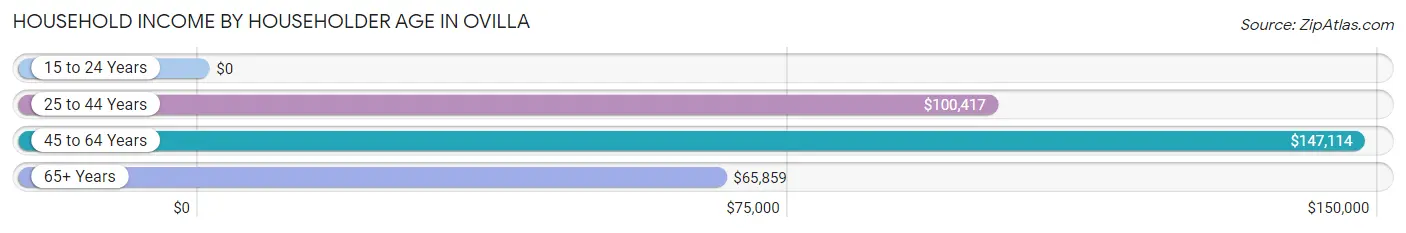
Household Income by Householder Age in Ovilla
The median household income in Ovilla is $109,130, with the highest median household income of $147,114 found in the 45 to 64 years age bracket for the primary householder. A total of 653 households (43.4%) fall into this category.
| Income Bracket | # Households | Median Income |
| 15 to 24 Years | 0 (0.0%) | $0 |
| 25 to 44 Years | 358 (23.8%) | $100,417 |
| 45 to 64 Years | 653 (43.4%) | $147,114 |
| 65+ Years | 493 (32.8%) | $65,859 |
| Total | 1,504 (100.0%) | $109,130 |
Poverty in Ovilla
Income Below Poverty by Sex and Age in Ovilla
With 3.6% poverty level for males and 4.8% for females among the residents of Ovilla, 35 to 44 year old males and 12 to 14 year old females are the most vulnerable to poverty, with 39 males (14.1%) and 26 females (24.3%) in their respective age groups living below the poverty level.
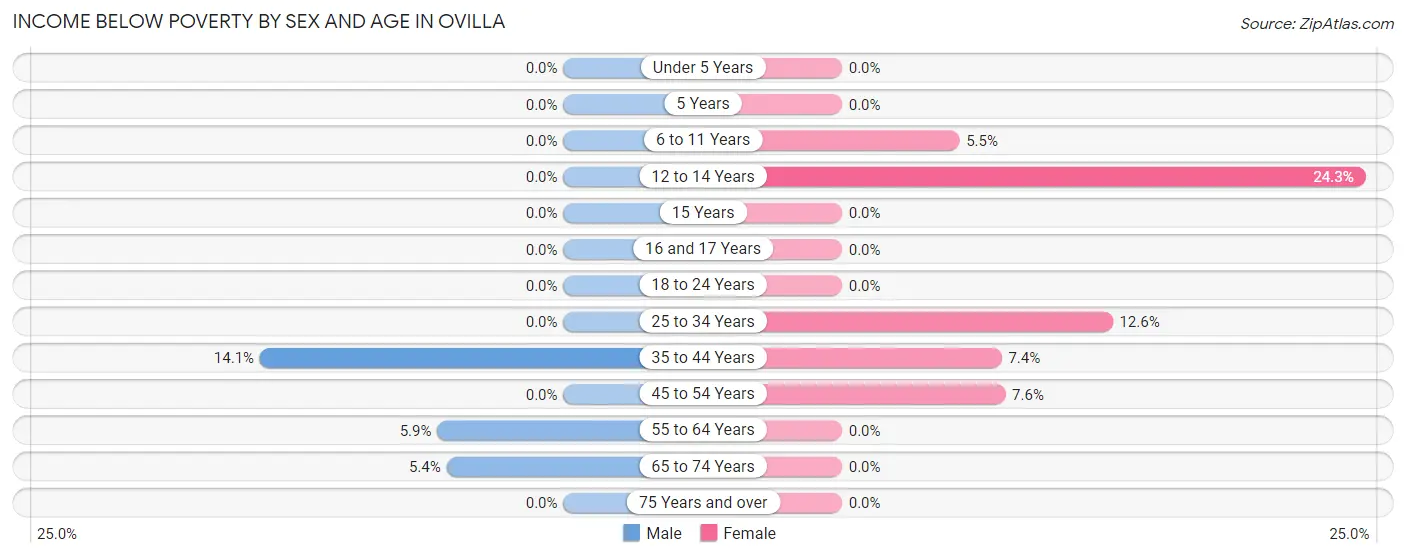
| Age Bracket | Male | Female |
| Under 5 Years | 0 (0.0%) | 0 (0.0%) |
| 5 Years | 0 (0.0%) | 0 (0.0%) |
| 6 to 11 Years | 0 (0.0%) | 12 (5.4%) |
| 12 to 14 Years | 0 (0.0%) | 26 (24.3%) |
| 15 Years | 0 (0.0%) | 0 (0.0%) |
| 16 and 17 Years | 0 (0.0%) | 0 (0.0%) |
| 18 to 24 Years | 0 (0.0%) | 0 (0.0%) |
| 25 to 34 Years | 0 (0.0%) | 25 (12.6%) |
| 35 to 44 Years | 39 (14.1%) | 18 (7.4%) |
| 45 to 54 Years | 0 (0.0%) | 21 (7.6%) |
| 55 to 64 Years | 20 (5.9%) | 0 (0.0%) |
| 65 to 74 Years | 11 (5.4%) | 0 (0.0%) |
| 75 Years and over | 0 (0.0%) | 0 (0.0%) |
| Total | 70 (3.6%) | 102 (4.8%) |
Income Above Poverty by Sex and Age in Ovilla
According to the poverty statistics in Ovilla, males aged under 5 years and females aged under 5 years are the age groups that are most secure financially, with 100.0% of males and 100.0% of females in these age groups living above the poverty line.
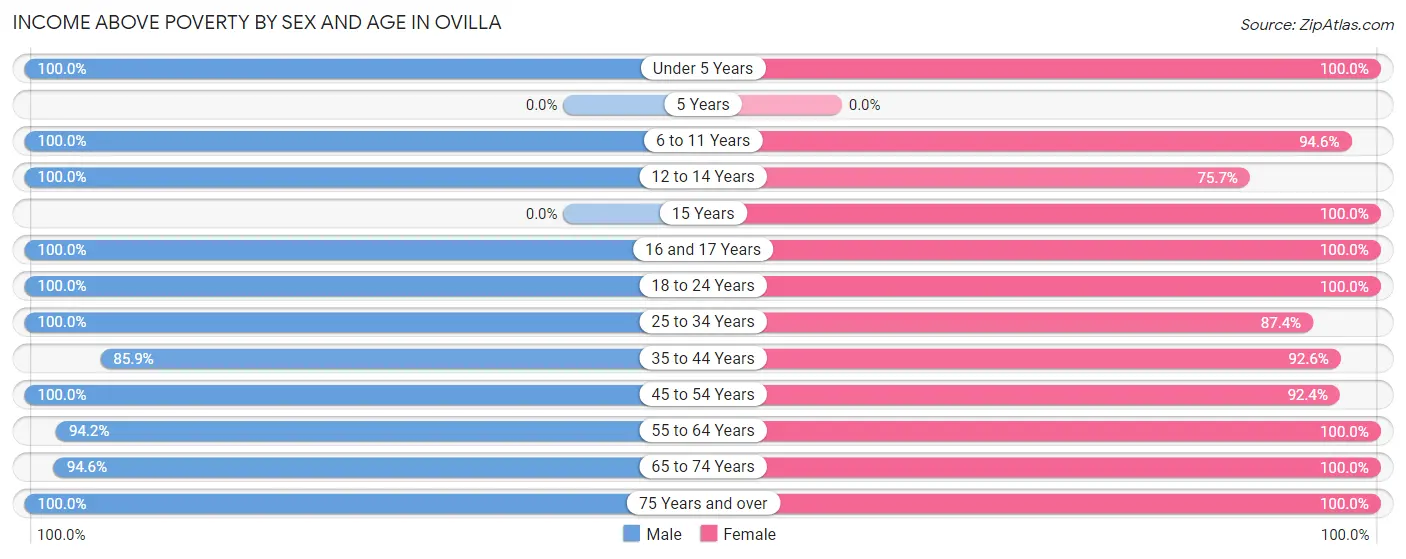
| Age Bracket | Male | Female |
| Under 5 Years | 141 (100.0%) | 60 (100.0%) |
| 5 Years | 0 (0.0%) | 0 (0.0%) |
| 6 to 11 Years | 196 (100.0%) | 208 (94.6%) |
| 12 to 14 Years | 65 (100.0%) | 81 (75.7%) |
| 15 Years | 0 (0.0%) | 19 (100.0%) |
| 16 and 17 Years | 39 (100.0%) | 108 (100.0%) |
| 18 to 24 Years | 135 (100.0%) | 106 (100.0%) |
| 25 to 34 Years | 101 (100.0%) | 174 (87.4%) |
| 35 to 44 Years | 238 (85.9%) | 225 (92.6%) |
| 45 to 54 Years | 274 (100.0%) | 256 (92.4%) |
| 55 to 64 Years | 322 (94.2%) | 446 (100.0%) |
| 65 to 74 Years | 192 (94.6%) | 151 (100.0%) |
| 75 Years and over | 193 (100.0%) | 175 (100.0%) |
| Total | 1,896 (96.4%) | 2,009 (95.2%) |
Income Below Poverty Among Married-Couple Families in Ovilla
The poverty statistics for married-couple families in Ovilla show that 5.1% or 59 of the total 1,164 families live below the poverty line. Families with 3 or 4 children have the highest poverty rate of 9.3%, comprising of 13 families. On the other hand, families with 1 or 2 children have the lowest poverty rate of 0.0%, which includes 0 families.
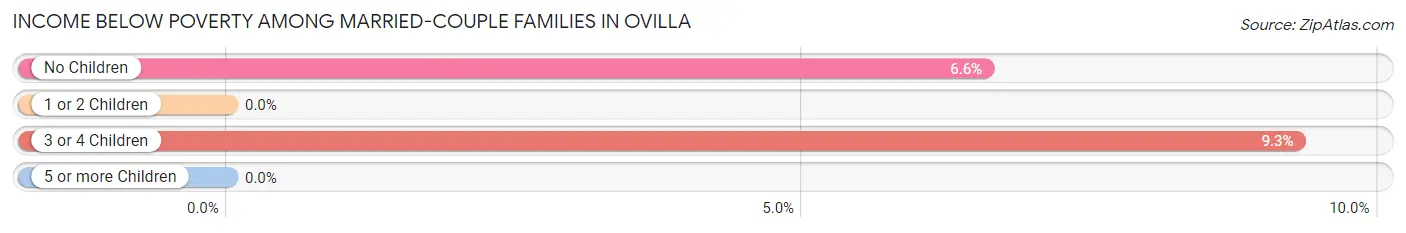
| Children | Above Poverty | Below Poverty |
| No Children | 653 (93.4%) | 46 (6.6%) |
| 1 or 2 Children | 325 (100.0%) | 0 (0.0%) |
| 3 or 4 Children | 127 (90.7%) | 13 (9.3%) |
| 5 or more Children | 0 (0.0%) | 0 (0.0%) |
| Total | 1,105 (94.9%) | 59 (5.1%) |
Income Below Poverty Among Single-Parent Households in Ovilla
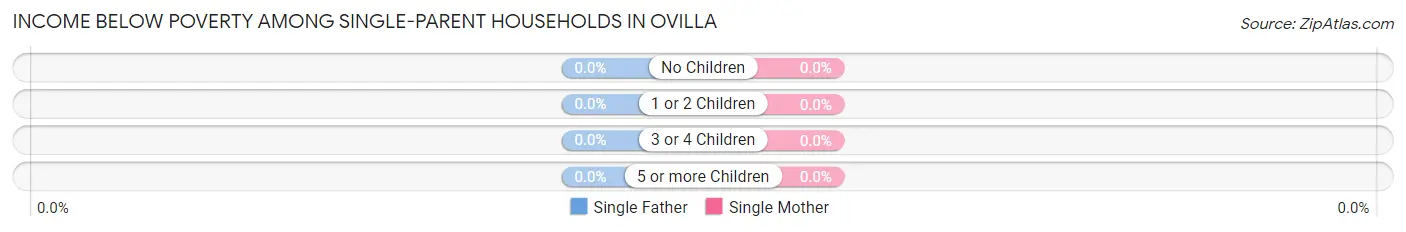
| Children | Single Father | Single Mother |
| No Children | 0 (0.0%) | 0 (0.0%) |
| 1 or 2 Children | 0 (0.0%) | 0 (0.0%) |
| 3 or 4 Children | 0 (0.0%) | 0 (0.0%) |
| 5 or more Children | 0 (0.0%) | 0 (0.0%) |
| Total | 0 (0.0%) | 0 (0.0%) |
Income Below Poverty Among Married-Couple vs Single-Parent Households in Ovilla
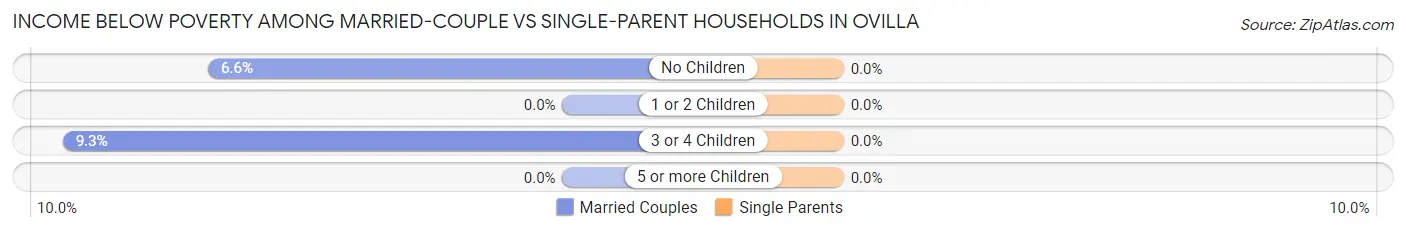
| Children | Married-Couple Families | Single-Parent Households |
| No Children | 46 (6.6%) | 0 (0.0%) |
| 1 or 2 Children | 0 (0.0%) | 0 (0.0%) |
| 3 or 4 Children | 13 (9.3%) | 0 (0.0%) |
| 5 or more Children | 0 (0.0%) | 0 (0.0%) |
| Total | 59 (5.1%) | 0 (0.0%) |
Employment Characteristics in Ovilla
Employment by Class of Employer in Ovilla
Among the 1,748 employed individuals in Ovilla, private company employees (943 | 53.9%), local government employees (278 | 15.9%), and not-for-profit organizations (183 | 10.5%) make up the most common classes of employment.
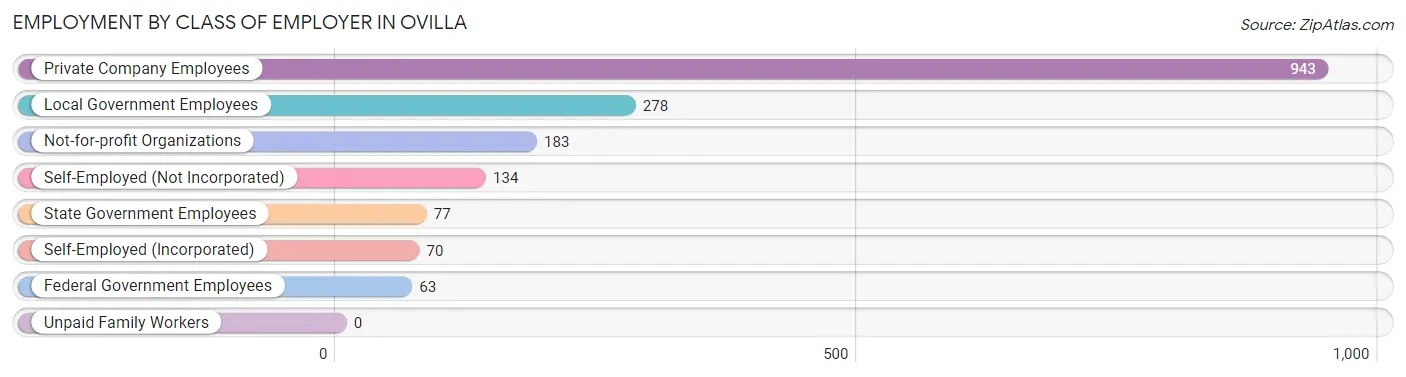
| Employer Class | # Employees | % Employees |
| Private Company Employees | 943 | 53.9% |
| Self-Employed (Incorporated) | 70 | 4.0% |
| Self-Employed (Not Incorporated) | 134 | 7.7% |
| Not-for-profit Organizations | 183 | 10.5% |
| Local Government Employees | 278 | 15.9% |
| State Government Employees | 77 | 4.4% |
| Federal Government Employees | 63 | 3.6% |
| Unpaid Family Workers | 0 | 0.0% |
| Total | 1,748 | 100.0% |
Employment Status by Age in Ovilla
According to the labor force statistics for Ovilla, out of the total population over 16 years of age (3,269), 58.9% or 1,925 individuals are in the labor force, with 3.4% or 65 of them unemployed. The age group with the highest labor force participation rate is 45 to 54 years, with 96.7% or 533 individuals in the labor force. Within the labor force, the 65 to 74 years age range has the highest percentage of unemployed individuals, with 18.4% or 18 of them being unemployed.
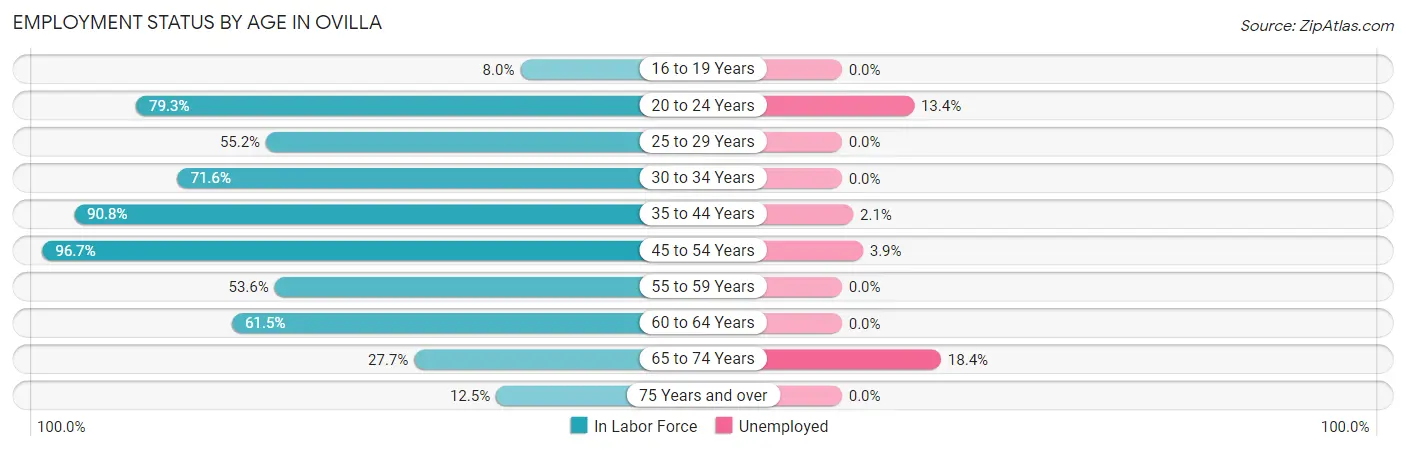
| Age Bracket | In Labor Force | Unemployed |
| 16 to 19 Years | 19 (8.0%) | 0 (0.0%) |
| 20 to 24 Years | 119 (79.3%) | 16 (13.4%) |
| 25 to 29 Years | 117 (55.2%) | 0 (0.0%) |
| 30 to 34 Years | 63 (71.6%) | 0 (0.0%) |
| 35 to 44 Years | 472 (90.8%) | 10 (2.1%) |
| 45 to 54 Years | 533 (96.7%) | 21 (3.9%) |
| 55 to 59 Years | 187 (53.6%) | 0 (0.0%) |
| 60 to 64 Years | 270 (61.5%) | 0 (0.0%) |
| 65 to 74 Years | 98 (27.7%) | 18 (18.4%) |
| 75 Years and over | 46 (12.5%) | 0 (0.0%) |
| Total | 1,925 (58.9%) | 65 (3.4%) |
Employment Status by Educational Attainment in Ovilla
According to labor force statistics for Ovilla, 76.1% of individuals (1,643) out of the total population between 25 and 64 years of age (2,159) are in the labor force, with 1.9% or 31 of them being unemployed. The group with the highest labor force participation rate are those with the educational attainment of bachelor's degree or higher, with 89.2% or 901 individuals in the labor force. Within the labor force, individuals with less than high school education have the highest percentage of unemployment, with 29.4% or 10 of them being unemployed.
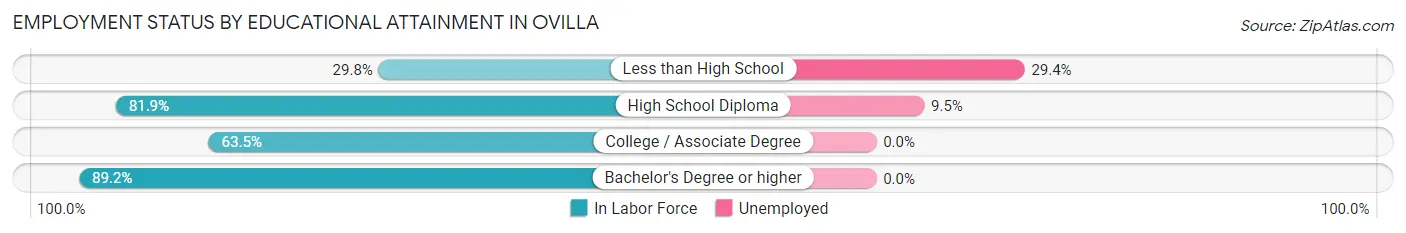
| Educational Attainment | In Labor Force | Unemployed |
| Less than High School | 34 (29.8%) | 34 (29.4%) |
| High School Diploma | 221 (81.9%) | 26 (9.5%) |
| College / Associate Degree | 486 (63.5%) | 0 (0.0%) |
| Bachelor's Degree or higher | 901 (89.2%) | 0 (0.0%) |
| Total | 1,643 (76.1%) | 41 (1.9%) |
Employment Occupations by Sex in Ovilla
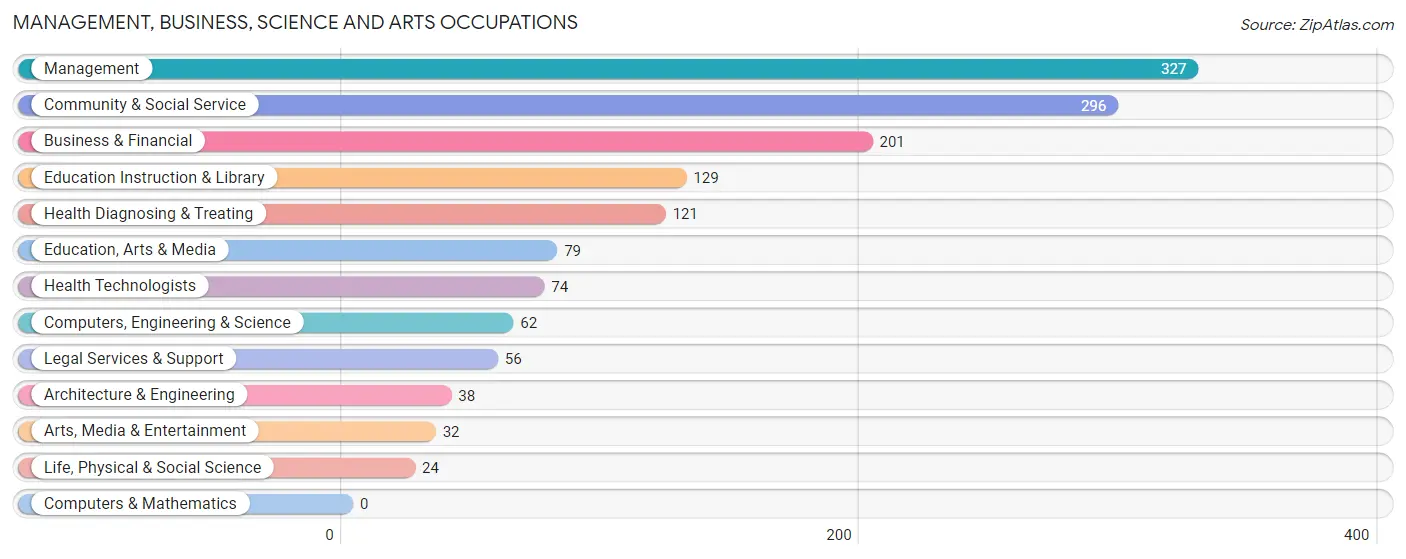
Management, Business, Science and Arts Occupations
The most common Management, Business, Science and Arts occupations in Ovilla are Management (327 | 17.6%), Community & Social Service (296 | 15.9%), Business & Financial (201 | 10.8%), Education Instruction & Library (129 | 6.9%), and Health Diagnosing & Treating (121 | 6.5%).
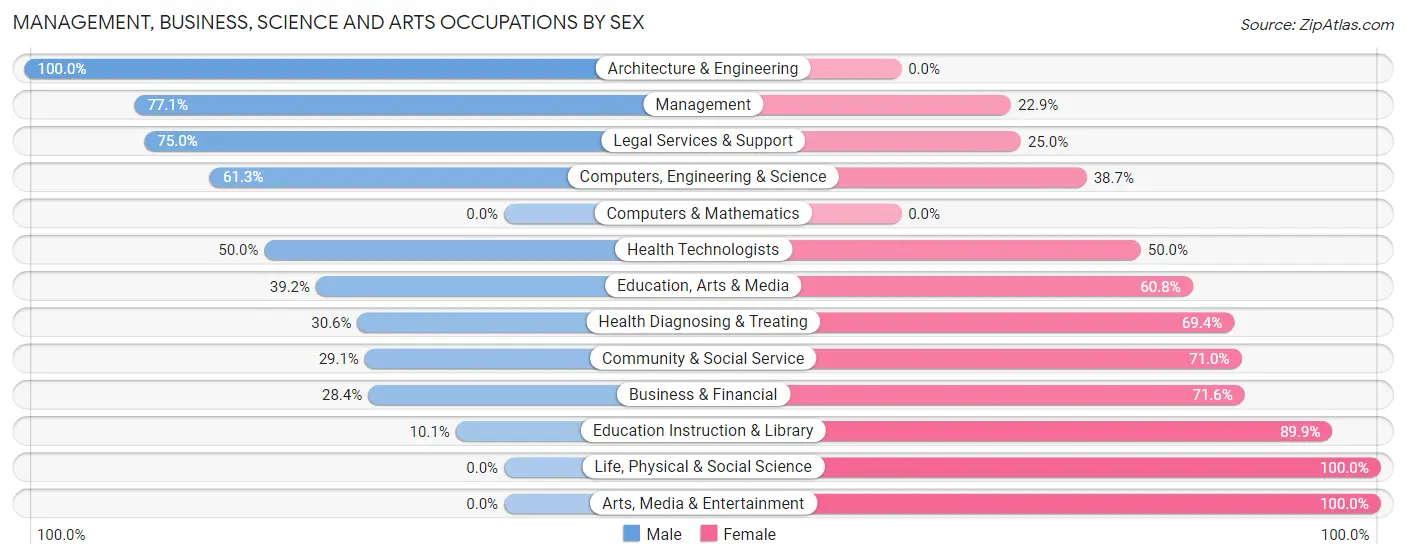
Management, Business, Science and Arts Occupations by Sex
Within the Management, Business, Science and Arts occupations in Ovilla, the most male-oriented occupations are Architecture & Engineering (100.0%), Management (77.1%), and Legal Services & Support (75.0%), while the most female-oriented occupations are Life, Physical & Social Science (100.0%), Arts, Media & Entertainment (100.0%), and Education Instruction & Library (89.9%).
| Occupation | Male | Female |
| Management | 252 (77.1%) | 75 (22.9%) |
| Business & Financial | 57 (28.4%) | 144 (71.6%) |
| Computers, Engineering & Science | 38 (61.3%) | 24 (38.7%) |
| Computers & Mathematics | 0 (0.0%) | 0 (0.0%) |
| Architecture & Engineering | 38 (100.0%) | 0 (0.0%) |
| Life, Physical & Social Science | 0 (0.0%) | 24 (100.0%) |
| Community & Social Service | 86 (29.0%) | 210 (71.0%) |
| Education, Arts & Media | 31 (39.2%) | 48 (60.8%) |
| Legal Services & Support | 42 (75.0%) | 14 (25.0%) |
| Education Instruction & Library | 13 (10.1%) | 116 (89.9%) |
| Arts, Media & Entertainment | 0 (0.0%) | 32 (100.0%) |
| Health Diagnosing & Treating | 37 (30.6%) | 84 (69.4%) |
| Health Technologists | 37 (50.0%) | 37 (50.0%) |
| Total (Category) | 470 (46.7%) | 537 (53.3%) |
| Total (Overall) | 966 (52.0%) | 893 (48.0%) |
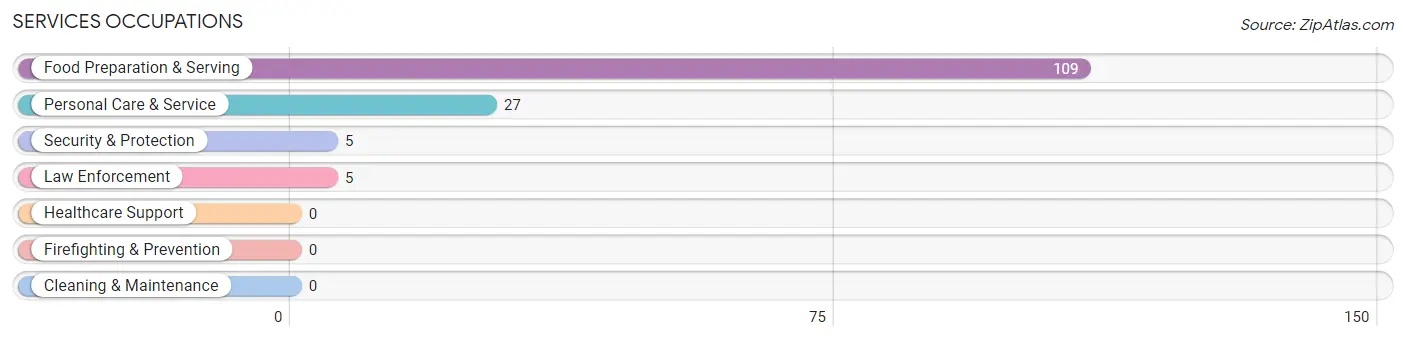
Services Occupations
The most common Services occupations in Ovilla are Food Preparation & Serving (109 | 5.9%), Personal Care & Service (27 | 1.5%), Security & Protection (5 | 0.3%), and Law Enforcement (5 | 0.3%).
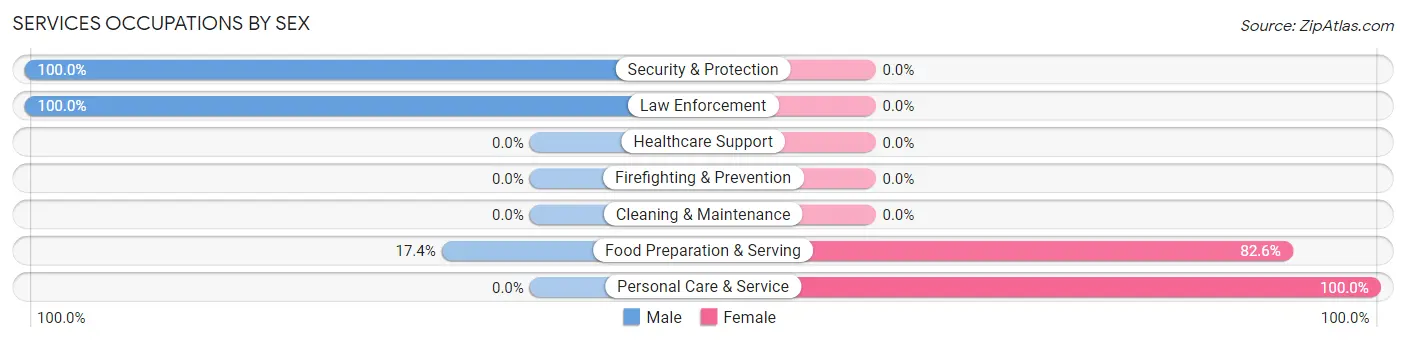
Services Occupations by Sex
Within the Services occupations in Ovilla, the most male-oriented occupations are Security & Protection (100.0%), Law Enforcement (100.0%), and Food Preparation & Serving (17.4%), while the most female-oriented occupations are Personal Care & Service (100.0%), and Food Preparation & Serving (82.6%).
| Occupation | Male | Female |
| Healthcare Support | 0 (0.0%) | 0 (0.0%) |
| Security & Protection | 5 (100.0%) | 0 (0.0%) |
| Firefighting & Prevention | 0 (0.0%) | 0 (0.0%) |
| Law Enforcement | 5 (100.0%) | 0 (0.0%) |
| Food Preparation & Serving | 19 (17.4%) | 90 (82.6%) |
| Cleaning & Maintenance | 0 (0.0%) | 0 (0.0%) |
| Personal Care & Service | 0 (0.0%) | 27 (100.0%) |
| Total (Category) | 24 (17.0%) | 117 (83.0%) |
| Total (Overall) | 966 (52.0%) | 893 (48.0%) |
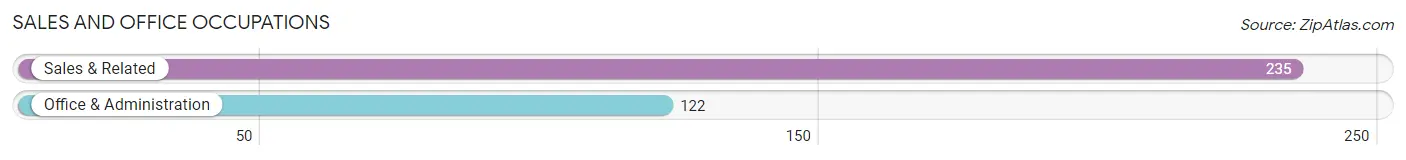
Sales and Office Occupations
The most common Sales and Office occupations in Ovilla are Sales & Related (235 | 12.6%), and Office & Administration (122 | 6.6%).
Sales and Office Occupations by Sex
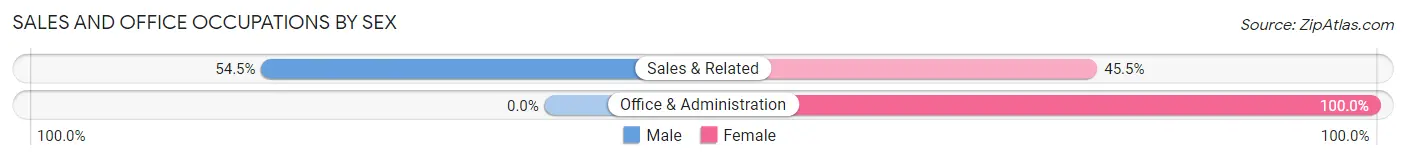
| Occupation | Male | Female |
| Sales & Related | 128 (54.5%) | 107 (45.5%) |
| Office & Administration | 0 (0.0%) | 122 (100.0%) |
| Total (Category) | 128 (35.8%) | 229 (64.1%) |
| Total (Overall) | 966 (52.0%) | 893 (48.0%) |
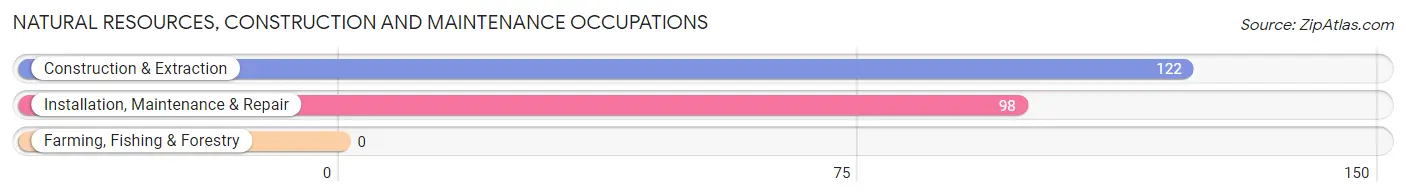
Natural Resources, Construction and Maintenance Occupations
The most common Natural Resources, Construction and Maintenance occupations in Ovilla are Construction & Extraction (122 | 6.6%), and Installation, Maintenance & Repair (98 | 5.3%).
Natural Resources, Construction and Maintenance Occupations by Sex
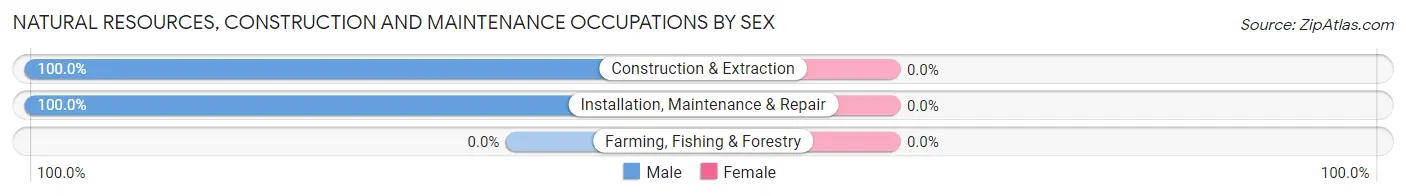
| Occupation | Male | Female |
| Farming, Fishing & Forestry | 0 (0.0%) | 0 (0.0%) |
| Construction & Extraction | 122 (100.0%) | 0 (0.0%) |
| Installation, Maintenance & Repair | 98 (100.0%) | 0 (0.0%) |
| Total (Category) | 220 (100.0%) | 0 (0.0%) |
| Total (Overall) | 966 (52.0%) | 893 (48.0%) |
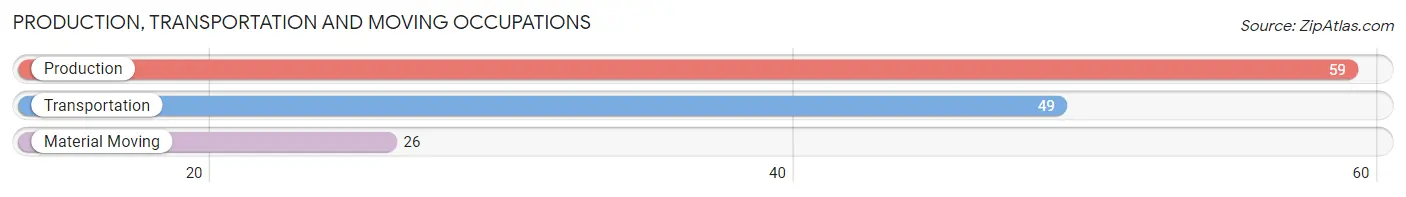
Production, Transportation and Moving Occupations
The most common Production, Transportation and Moving occupations in Ovilla are Production (59 | 3.2%), Transportation (49 | 2.6%), and Material Moving (26 | 1.4%).
Production, Transportation and Moving Occupations by Sex
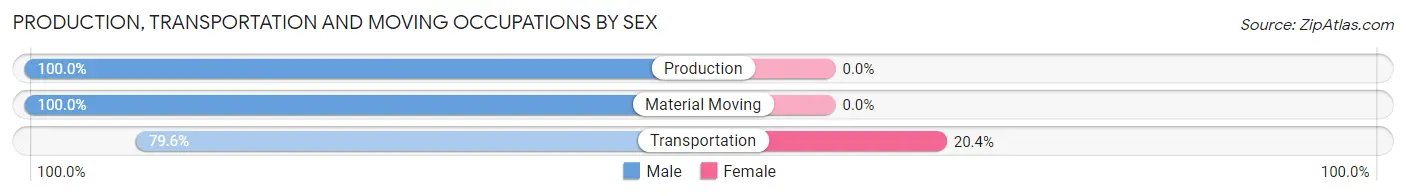
| Occupation | Male | Female |
| Production | 59 (100.0%) | 0 (0.0%) |
| Transportation | 39 (79.6%) | 10 (20.4%) |
| Material Moving | 26 (100.0%) | 0 (0.0%) |
| Total (Category) | 124 (92.5%) | 10 (7.5%) |
| Total (Overall) | 966 (52.0%) | 893 (48.0%) |
Employment Industries by Sex in Ovilla
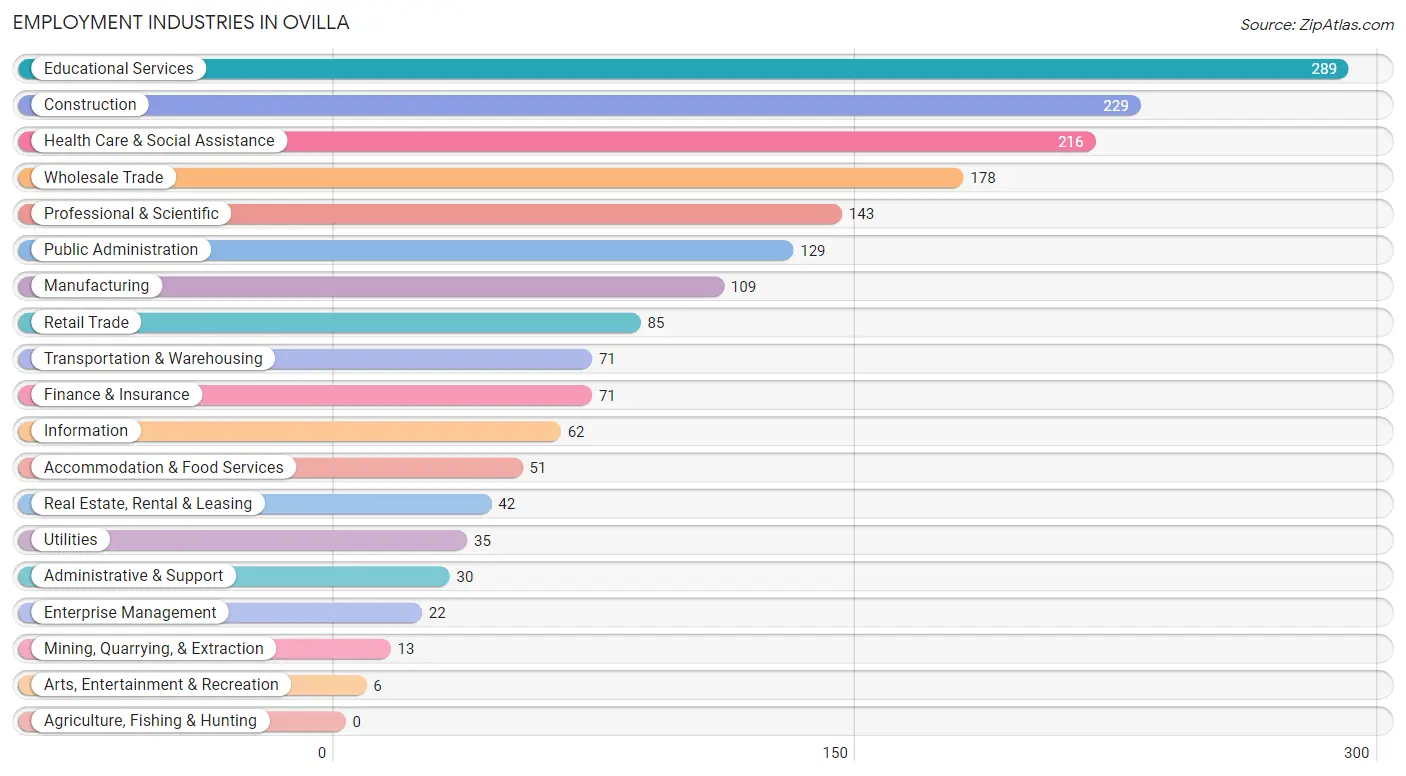
Employment Industries in Ovilla
The major employment industries in Ovilla include Educational Services (289 | 15.5%), Construction (229 | 12.3%), Health Care & Social Assistance (216 | 11.6%), Wholesale Trade (178 | 9.6%), and Professional & Scientific (143 | 7.7%).
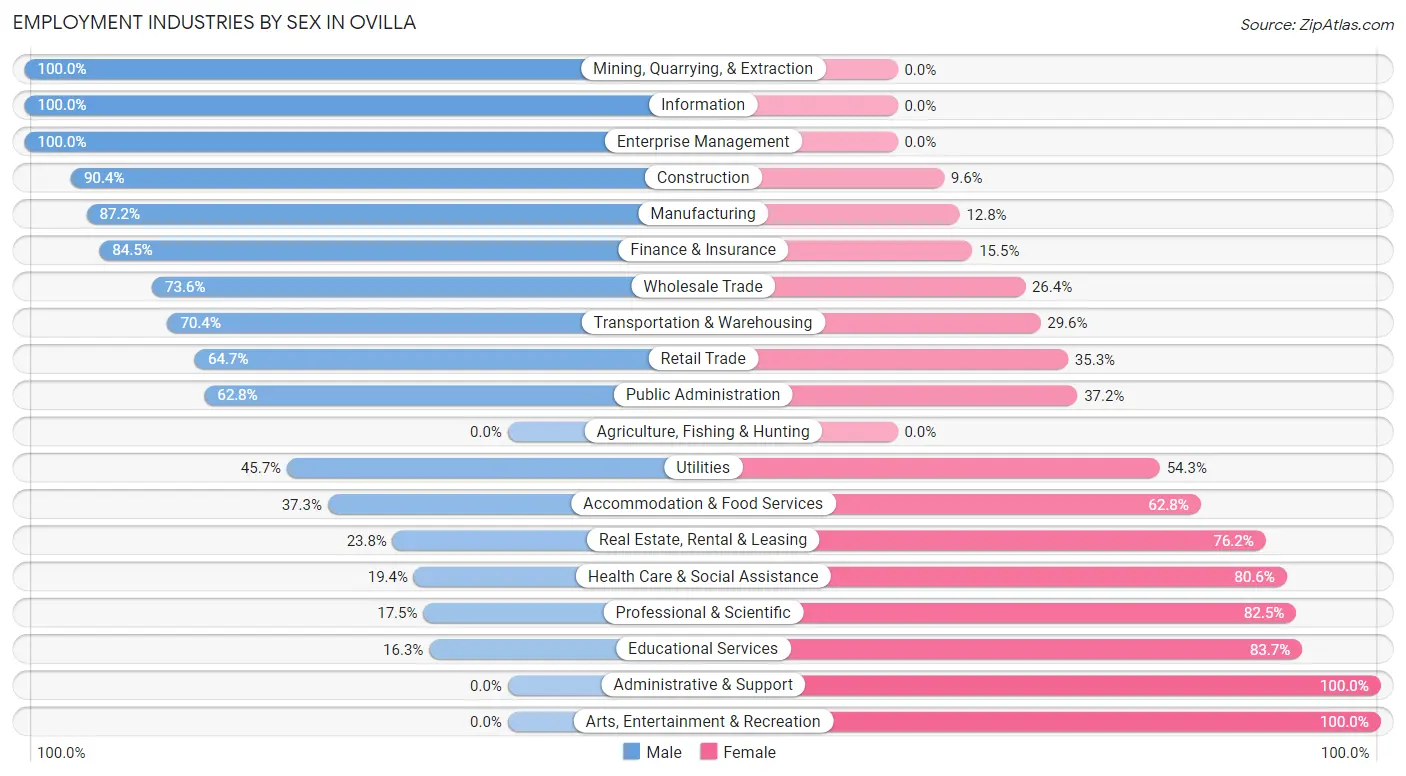
Employment Industries by Sex in Ovilla
The Ovilla industries that see more men than women are Mining, Quarrying, & Extraction (100.0%), Information (100.0%), and Enterprise Management (100.0%), whereas the industries that tend to have a higher number of women are Administrative & Support (100.0%), Arts, Entertainment & Recreation (100.0%), and Educational Services (83.7%).
| Industry | Male | Female |
| Agriculture, Fishing & Hunting | 0 (0.0%) | 0 (0.0%) |
| Mining, Quarrying, & Extraction | 13 (100.0%) | 0 (0.0%) |
| Construction | 207 (90.4%) | 22 (9.6%) |
| Manufacturing | 95 (87.2%) | 14 (12.8%) |
| Wholesale Trade | 131 (73.6%) | 47 (26.4%) |
| Retail Trade | 55 (64.7%) | 30 (35.3%) |
| Transportation & Warehousing | 50 (70.4%) | 21 (29.6%) |
| Utilities | 16 (45.7%) | 19 (54.3%) |
| Information | 62 (100.0%) | 0 (0.0%) |
| Finance & Insurance | 60 (84.5%) | 11 (15.5%) |
| Real Estate, Rental & Leasing | 10 (23.8%) | 32 (76.2%) |
| Professional & Scientific | 25 (17.5%) | 118 (82.5%) |
| Enterprise Management | 22 (100.0%) | 0 (0.0%) |
| Administrative & Support | 0 (0.0%) | 30 (100.0%) |
| Educational Services | 47 (16.3%) | 242 (83.7%) |
| Health Care & Social Assistance | 42 (19.4%) | 174 (80.6%) |
| Arts, Entertainment & Recreation | 0 (0.0%) | 6 (100.0%) |
| Accommodation & Food Services | 19 (37.2%) | 32 (62.7%) |
| Public Administration | 81 (62.8%) | 48 (37.2%) |
| Total | 966 (52.0%) | 893 (48.0%) |
Education in Ovilla
School Enrollment in Ovilla
The most common levels of schooling among the 893 students in Ovilla are middle school (337 | 37.7%), high school (200 | 22.4%), and elementary school (153 | 17.1%).
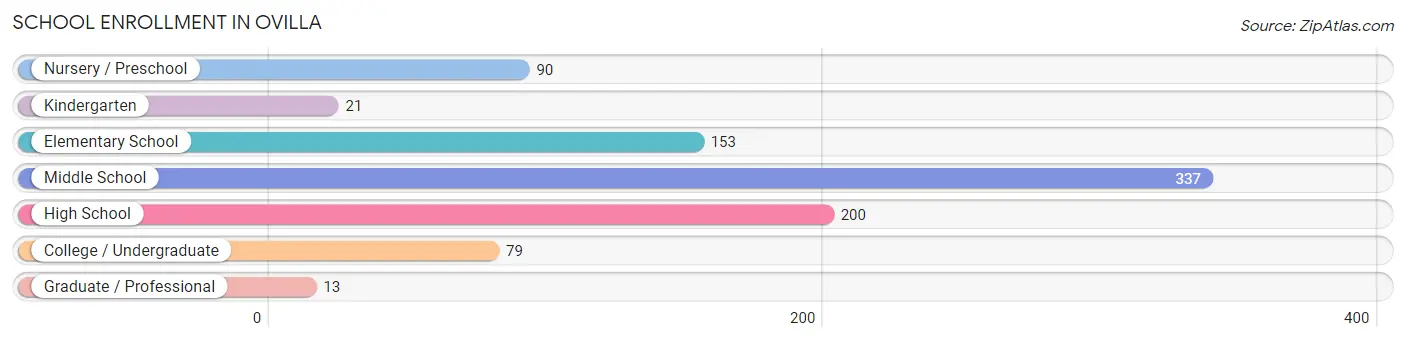
| School Level | # Students | % Students |
| Nursery / Preschool | 90 | 10.1% |
| Kindergarten | 21 | 2.4% |
| Elementary School | 153 | 17.1% |
| Middle School | 337 | 37.7% |
| High School | 200 | 22.4% |
| College / Undergraduate | 79 | 8.8% |
| Graduate / Professional | 13 | 1.5% |
| Total | 893 | 100.0% |
School Enrollment by Age by Funding Source in Ovilla
Out of a total of 893 students who are enrolled in schools in Ovilla, 162 (18.1%) attend a private institution, while the remaining 731 (81.9%) are enrolled in public schools. The age group of 3 to 4 year olds has the highest likelihood of being enrolled in private schools, with 60 (100.0% in the age bracket) enrolled. Conversely, the age group of 18 to 19 year olds has the lowest likelihood of being enrolled in a private school, with 10 (100.0% in the age bracket) attending a public institution.
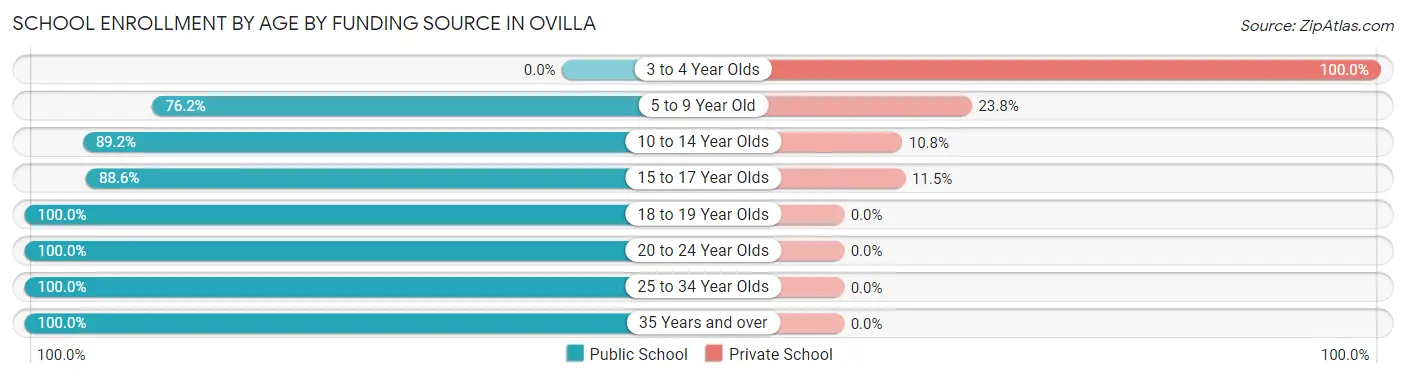
| Age Bracket | Public School | Private School |
| 3 to 4 Year Olds | 0 (0.0%) | 60 (100.0%) |
| 5 to 9 Year Old | 128 (76.2%) | 40 (23.8%) |
| 10 to 14 Year Olds | 354 (89.2%) | 43 (10.8%) |
| 15 to 17 Year Olds | 147 (88.5%) | 19 (11.5%) |
| 18 to 19 Year Olds | 10 (100.0%) | 0 (0.0%) |
| 20 to 24 Year Olds | 47 (100.0%) | 0 (0.0%) |
| 25 to 34 Year Olds | 13 (100.0%) | 0 (0.0%) |
| 35 Years and over | 32 (100.0%) | 0 (0.0%) |
| Total | 731 (81.9%) | 162 (18.1%) |
Educational Attainment by Field of Study in Ovilla
Business (273 | 20.3%), science & technology (180 | 13.4%), education (165 | 12.3%), social sciences (121 | 9.0%), and bio, nature & agricultural (111 | 8.3%) are the most common fields of study among 1,346 individuals in Ovilla who have obtained a bachelor's degree or higher.
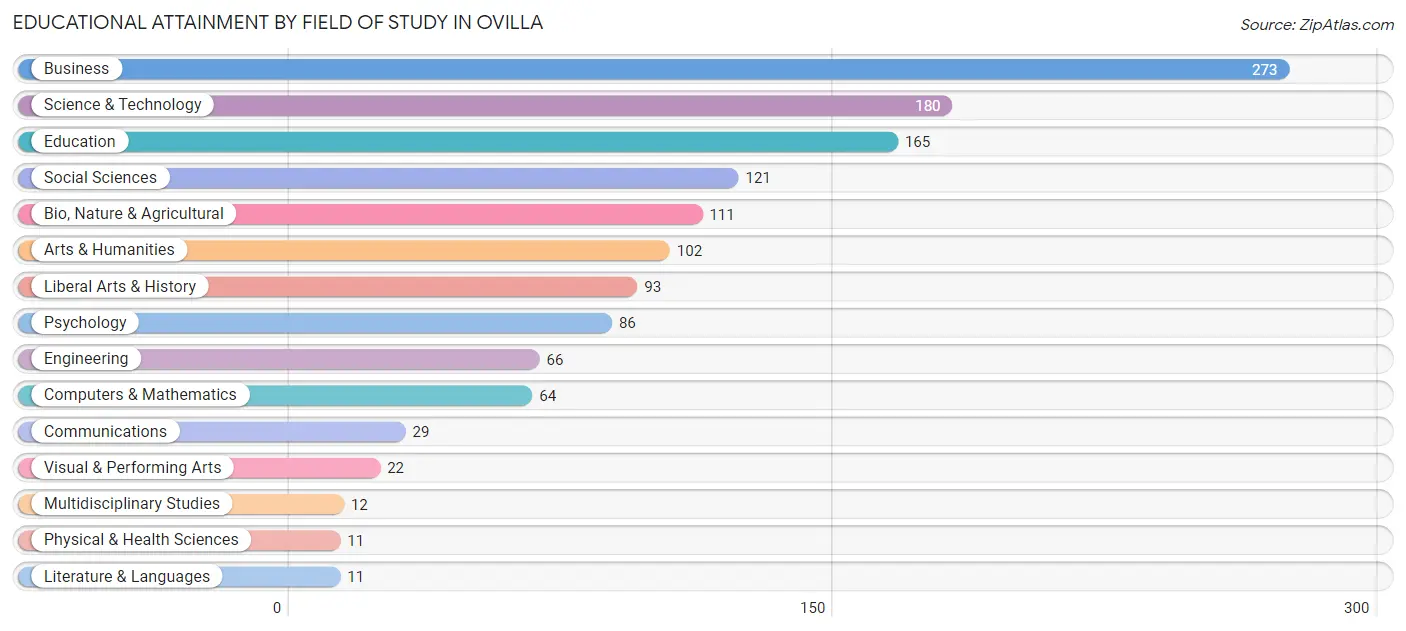
| Field of Study | # Graduates | % Graduates |
| Computers & Mathematics | 64 | 4.8% |
| Bio, Nature & Agricultural | 111 | 8.3% |
| Physical & Health Sciences | 11 | 0.8% |
| Psychology | 86 | 6.4% |
| Social Sciences | 121 | 9.0% |
| Engineering | 66 | 4.9% |
| Multidisciplinary Studies | 12 | 0.9% |
| Science & Technology | 180 | 13.4% |
| Business | 273 | 20.3% |
| Education | 165 | 12.3% |
| Literature & Languages | 11 | 0.8% |
| Liberal Arts & History | 93 | 6.9% |
| Visual & Performing Arts | 22 | 1.6% |
| Communications | 29 | 2.1% |
| Arts & Humanities | 102 | 7.6% |
| Total | 1,346 | 100.0% |
Transportation & Commute in Ovilla
Vehicle Availability by Sex in Ovilla
The most prevalent vehicle ownership categories in Ovilla are males with 3 vehicles (393, accounting for 43.2%) and females with 3 vehicles (331, making up 46.9%).
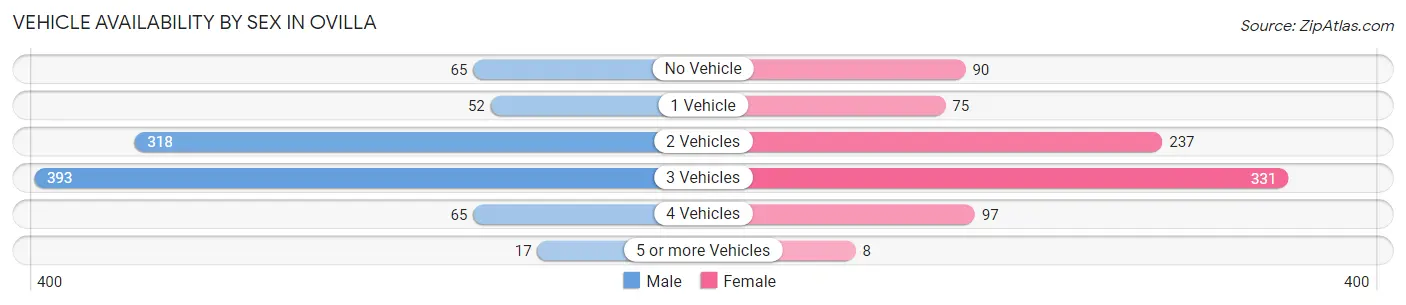
| Vehicles Available | Male | Female |
| No Vehicle | 65 (7.1%) | 90 (10.7%) |
| 1 Vehicle | 52 (5.7%) | 75 (8.9%) |
| 2 Vehicles | 318 (34.9%) | 237 (28.3%) |
| 3 Vehicles | 393 (43.2%) | 331 (39.5%) |
| 4 Vehicles | 65 (7.1%) | 97 (11.6%) |
| 5 or more Vehicles | 17 (1.9%) | 8 (0.9%) |
| Total | 910 (100.0%) | 838 (100.0%) |
Commute Time in Ovilla
The most frequently occuring commute durations in Ovilla are 20 to 24 minutes (299 commuters, 20.0%), 45 to 59 minutes (232 commuters, 15.5%), and 30 to 34 minutes (182 commuters, 12.2%).
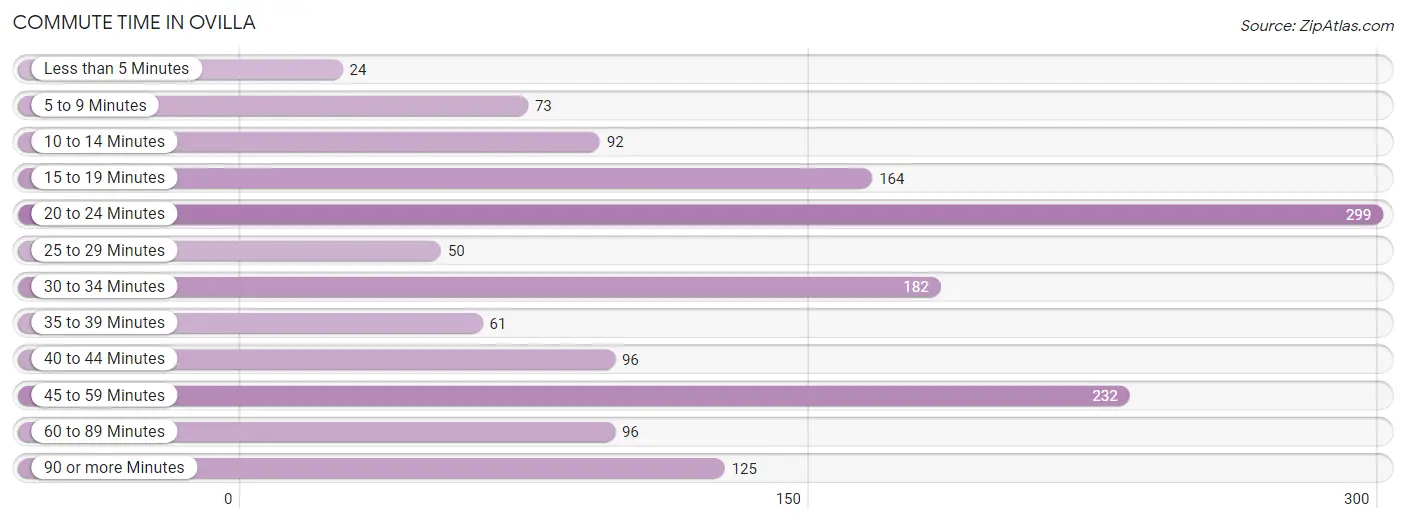
| Commute Time | # Commuters | % Commuters |
| Less than 5 Minutes | 24 | 1.6% |
| 5 to 9 Minutes | 73 | 4.9% |
| 10 to 14 Minutes | 92 | 6.2% |
| 15 to 19 Minutes | 164 | 11.0% |
| 20 to 24 Minutes | 299 | 20.0% |
| 25 to 29 Minutes | 50 | 3.4% |
| 30 to 34 Minutes | 182 | 12.2% |
| 35 to 39 Minutes | 61 | 4.1% |
| 40 to 44 Minutes | 96 | 6.4% |
| 45 to 59 Minutes | 232 | 15.5% |
| 60 to 89 Minutes | 96 | 6.4% |
| 90 or more Minutes | 125 | 8.4% |
Commute Time by Sex in Ovilla
The most common commute times in Ovilla are 20 to 24 minutes (196 commuters, 24.0%) for males and 45 to 59 minutes (148 commuters, 21.8%) for females.
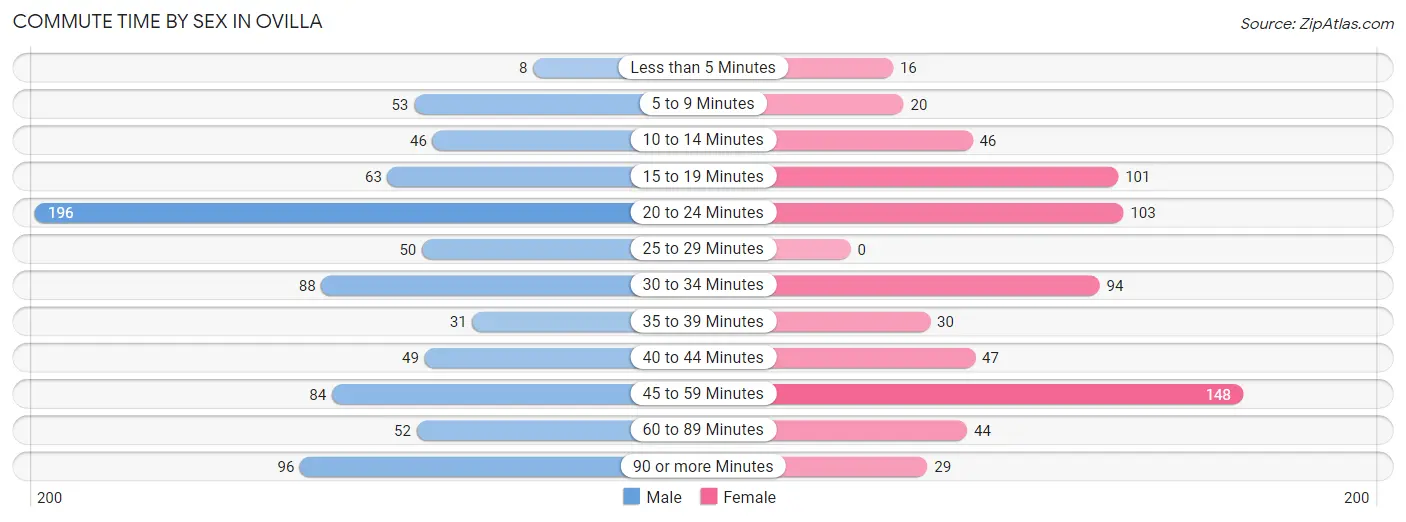
| Commute Time | Male | Female |
| Less than 5 Minutes | 8 (1.0%) | 16 (2.4%) |
| 5 to 9 Minutes | 53 (6.5%) | 20 (2.9%) |
| 10 to 14 Minutes | 46 (5.6%) | 46 (6.8%) |
| 15 to 19 Minutes | 63 (7.7%) | 101 (14.9%) |
| 20 to 24 Minutes | 196 (24.0%) | 103 (15.2%) |
| 25 to 29 Minutes | 50 (6.1%) | 0 (0.0%) |
| 30 to 34 Minutes | 88 (10.8%) | 94 (13.9%) |
| 35 to 39 Minutes | 31 (3.8%) | 30 (4.4%) |
| 40 to 44 Minutes | 49 (6.0%) | 47 (6.9%) |
| 45 to 59 Minutes | 84 (10.3%) | 148 (21.8%) |
| 60 to 89 Minutes | 52 (6.4%) | 44 (6.5%) |
| 90 or more Minutes | 96 (11.8%) | 29 (4.3%) |
Time of Departure to Work by Sex in Ovilla
The most frequent times of departure to work in Ovilla are 6:00 AM to 6:29 AM (223, 27.3%) for males and 6:30 AM to 6:59 AM (233, 34.4%) for females.
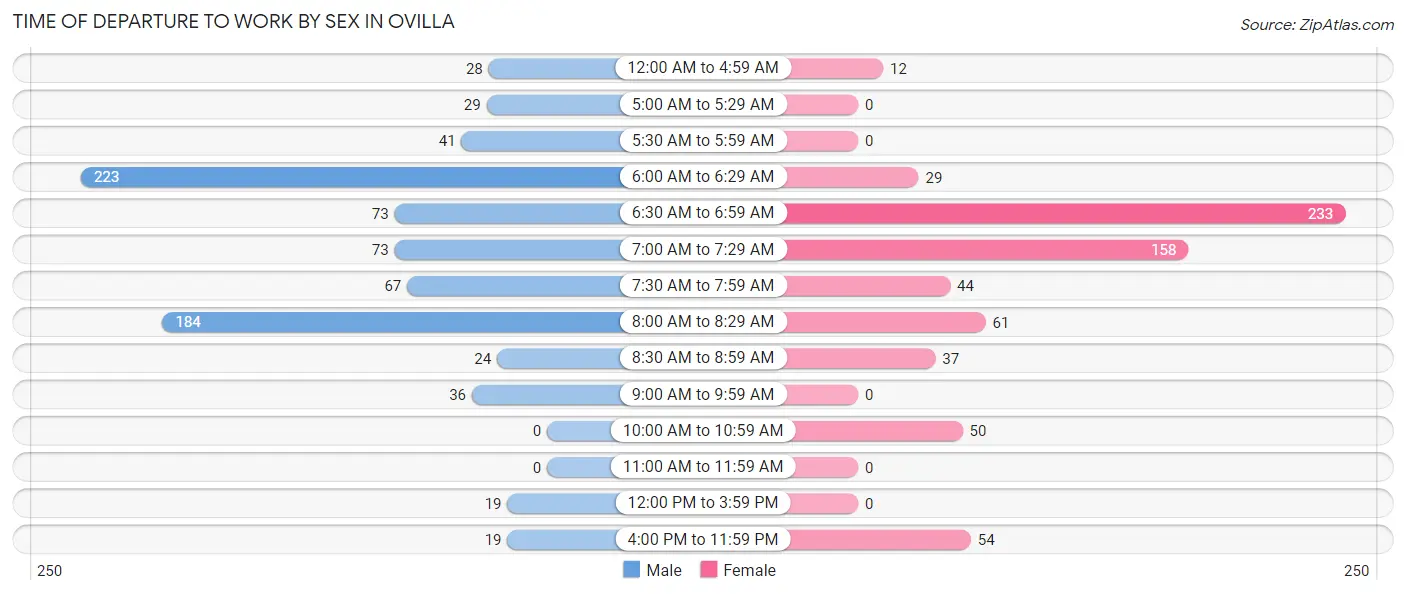
| Time of Departure | Male | Female |
| 12:00 AM to 4:59 AM | 28 (3.4%) | 12 (1.8%) |
| 5:00 AM to 5:29 AM | 29 (3.5%) | 0 (0.0%) |
| 5:30 AM to 5:59 AM | 41 (5.0%) | 0 (0.0%) |
| 6:00 AM to 6:29 AM | 223 (27.3%) | 29 (4.3%) |
| 6:30 AM to 6:59 AM | 73 (8.9%) | 233 (34.4%) |
| 7:00 AM to 7:29 AM | 73 (8.9%) | 158 (23.3%) |
| 7:30 AM to 7:59 AM | 67 (8.2%) | 44 (6.5%) |
| 8:00 AM to 8:29 AM | 184 (22.6%) | 61 (9.0%) |
| 8:30 AM to 8:59 AM | 24 (2.9%) | 37 (5.5%) |
| 9:00 AM to 9:59 AM | 36 (4.4%) | 0 (0.0%) |
| 10:00 AM to 10:59 AM | 0 (0.0%) | 50 (7.4%) |
| 11:00 AM to 11:59 AM | 0 (0.0%) | 0 (0.0%) |
| 12:00 PM to 3:59 PM | 19 (2.3%) | 0 (0.0%) |
| 4:00 PM to 11:59 PM | 19 (2.3%) | 54 (8.0%) |
| Total | 816 (100.0%) | 678 (100.0%) |
Housing Occupancy in Ovilla
Occupancy by Ownership in Ovilla
Of the total 1,504 dwellings in Ovilla, owner-occupied units account for 1,386 (92.1%), while renter-occupied units make up 118 (7.9%).
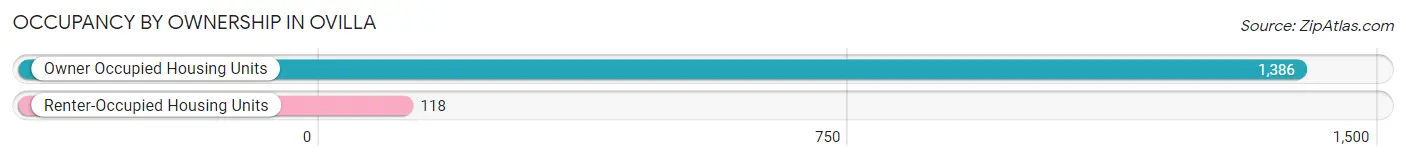
| Occupancy | # Housing Units | % Housing Units |
| Owner Occupied Housing Units | 1,386 | 92.1% |
| Renter-Occupied Housing Units | 118 | 7.9% |
| Total Occupied Housing Units | 1,504 | 100.0% |
Occupancy by Household Size in Ovilla
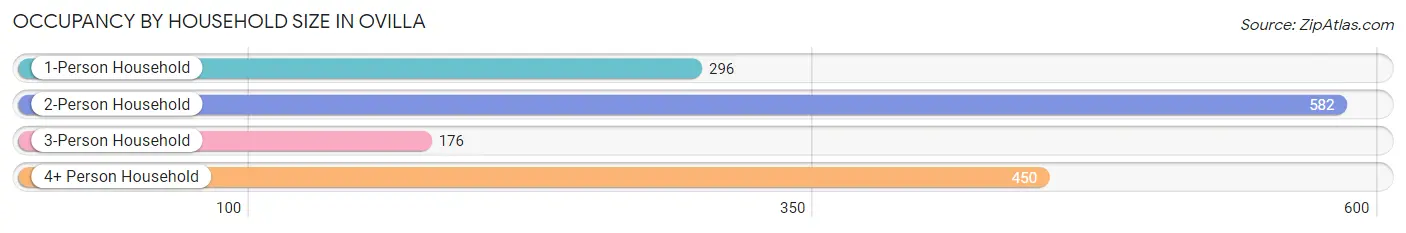
| Household Size | # Housing Units | % Housing Units |
| 1-Person Household | 296 | 19.7% |
| 2-Person Household | 582 | 38.7% |
| 3-Person Household | 176 | 11.7% |
| 4+ Person Household | 450 | 29.9% |
| Total Housing Units | 1,504 | 100.0% |
Occupancy by Ownership by Household Size in Ovilla
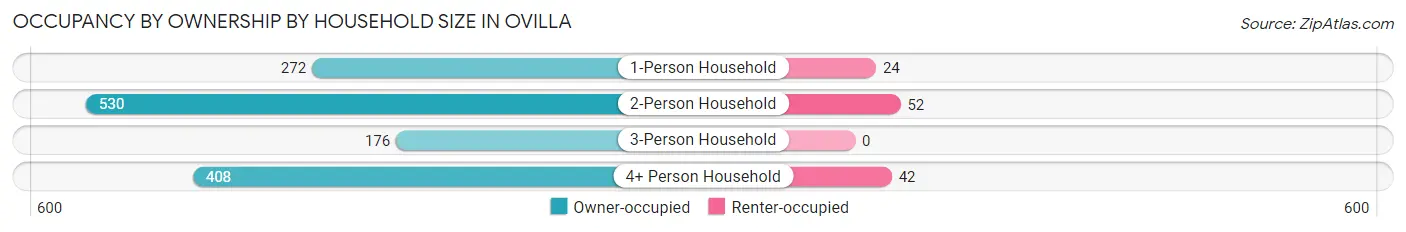
| Household Size | Owner-occupied | Renter-occupied |
| 1-Person Household | 272 (91.9%) | 24 (8.1%) |
| 2-Person Household | 530 (91.1%) | 52 (8.9%) |
| 3-Person Household | 176 (100.0%) | 0 (0.0%) |
| 4+ Person Household | 408 (90.7%) | 42 (9.3%) |
| Total Housing Units | 1,386 (92.1%) | 118 (7.9%) |
Occupancy by Educational Attainment in Ovilla
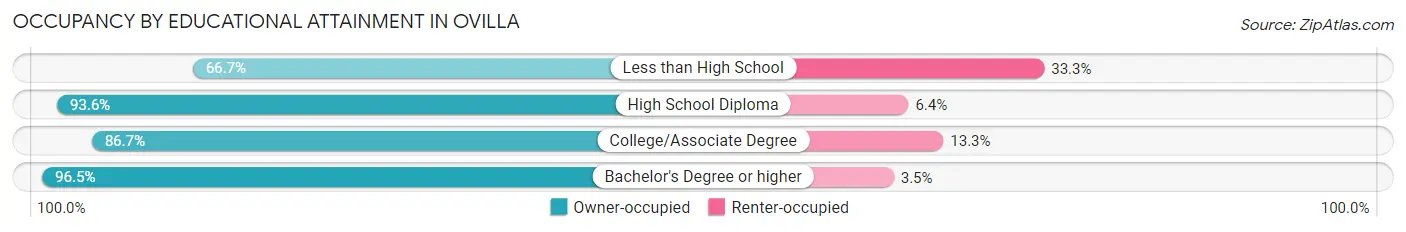
| Household Size | Owner-occupied | Renter-occupied |
| Less than High School | 52 (66.7%) | 26 (33.3%) |
| High School Diploma | 146 (93.6%) | 10 (6.4%) |
| College/Associate Degree | 332 (86.7%) | 51 (13.3%) |
| Bachelor's Degree or higher | 856 (96.5%) | 31 (3.5%) |
Occupancy by Age of Householder in Ovilla
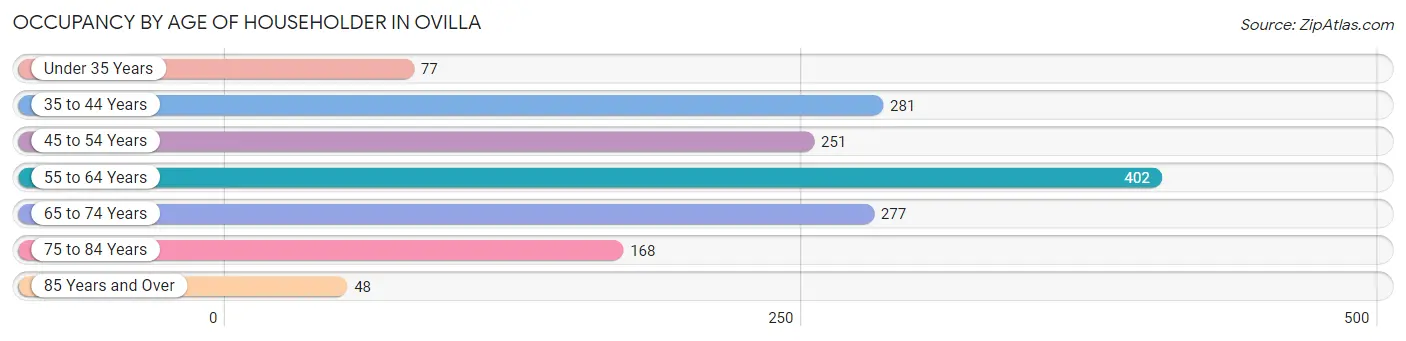
| Age Bracket | # Households | % Households |
| Under 35 Years | 77 | 5.1% |
| 35 to 44 Years | 281 | 18.7% |
| 45 to 54 Years | 251 | 16.7% |
| 55 to 64 Years | 402 | 26.7% |
| 65 to 74 Years | 277 | 18.4% |
| 75 to 84 Years | 168 | 11.2% |
| 85 Years and Over | 48 | 3.2% |
| Total | 1,504 | 100.0% |
Housing Finances in Ovilla
Median Income by Occupancy in Ovilla
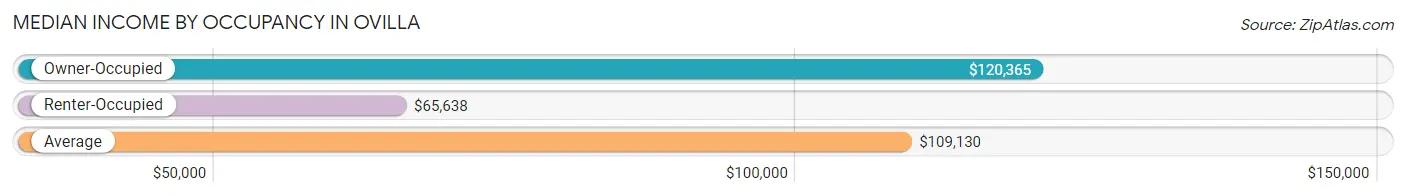
| Occupancy Type | # Households | Median Income |
| Owner-Occupied | 1,386 (92.1%) | $120,365 |
| Renter-Occupied | 118 (7.9%) | $65,638 |
| Average | 1,504 (100.0%) | $109,130 |
Occupancy by Householder Income Bracket in Ovilla
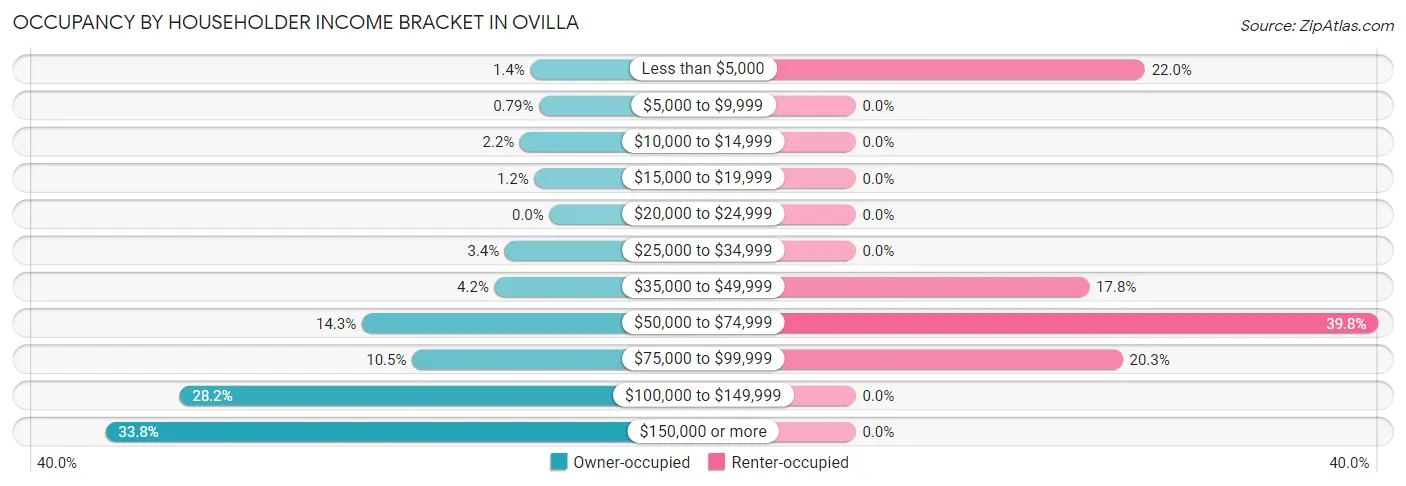
| Income Bracket | Owner-occupied | Renter-occupied |
| Less than $5,000 | 20 (1.4%) | 26 (22.0%) |
| $5,000 to $9,999 | 11 (0.8%) | 0 (0.0%) |
| $10,000 to $14,999 | 31 (2.2%) | 0 (0.0%) |
| $15,000 to $19,999 | 16 (1.1%) | 0 (0.0%) |
| $20,000 to $24,999 | 0 (0.0%) | 0 (0.0%) |
| $25,000 to $34,999 | 47 (3.4%) | 0 (0.0%) |
| $35,000 to $49,999 | 58 (4.2%) | 21 (17.8%) |
| $50,000 to $74,999 | 198 (14.3%) | 47 (39.8%) |
| $75,000 to $99,999 | 145 (10.5%) | 24 (20.3%) |
| $100,000 to $149,999 | 391 (28.2%) | 0 (0.0%) |
| $150,000 or more | 469 (33.8%) | 0 (0.0%) |
| Total | 1,386 (100.0%) | 118 (100.0%) |
Monthly Housing Cost Tiers in Ovilla
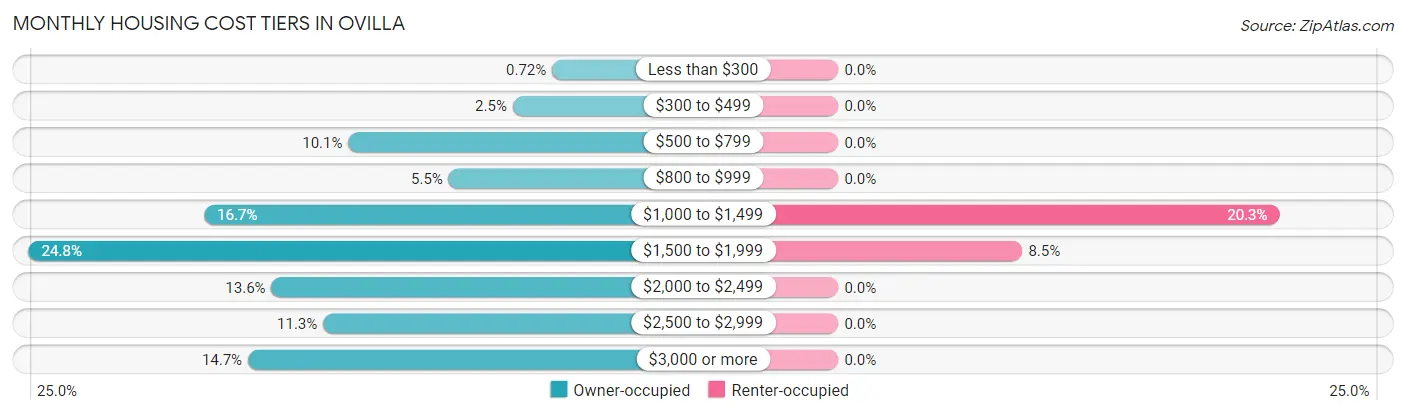
| Monthly Cost | Owner-occupied | Renter-occupied |
| Less than $300 | 10 (0.7%) | 0 (0.0%) |
| $300 to $499 | 35 (2.5%) | 0 (0.0%) |
| $500 to $799 | 140 (10.1%) | 0 (0.0%) |
| $800 to $999 | 76 (5.5%) | 0 (0.0%) |
| $1,000 to $1,499 | 232 (16.7%) | 24 (20.3%) |
| $1,500 to $1,999 | 344 (24.8%) | 10 (8.5%) |
| $2,000 to $2,499 | 189 (13.6%) | 0 (0.0%) |
| $2,500 to $2,999 | 156 (11.3%) | 0 (0.0%) |
| $3,000 or more | 204 (14.7%) | 0 (0.0%) |
| Total | 1,386 (100.0%) | 118 (100.0%) |
Physical Housing Characteristics in Ovilla
Housing Structures in Ovilla
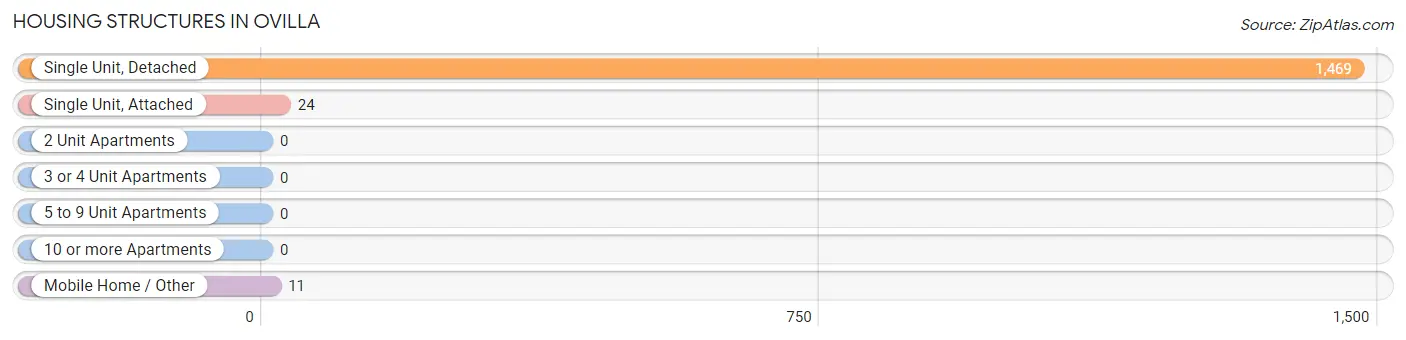
| Structure Type | # Housing Units | % Housing Units |
| Single Unit, Detached | 1,469 | 97.7% |
| Single Unit, Attached | 24 | 1.6% |
| 2 Unit Apartments | 0 | 0.0% |
| 3 or 4 Unit Apartments | 0 | 0.0% |
| 5 to 9 Unit Apartments | 0 | 0.0% |
| 10 or more Apartments | 0 | 0.0% |
| Mobile Home / Other | 11 | 0.7% |
| Total | 1,504 | 100.0% |
Housing Structures by Occupancy in Ovilla
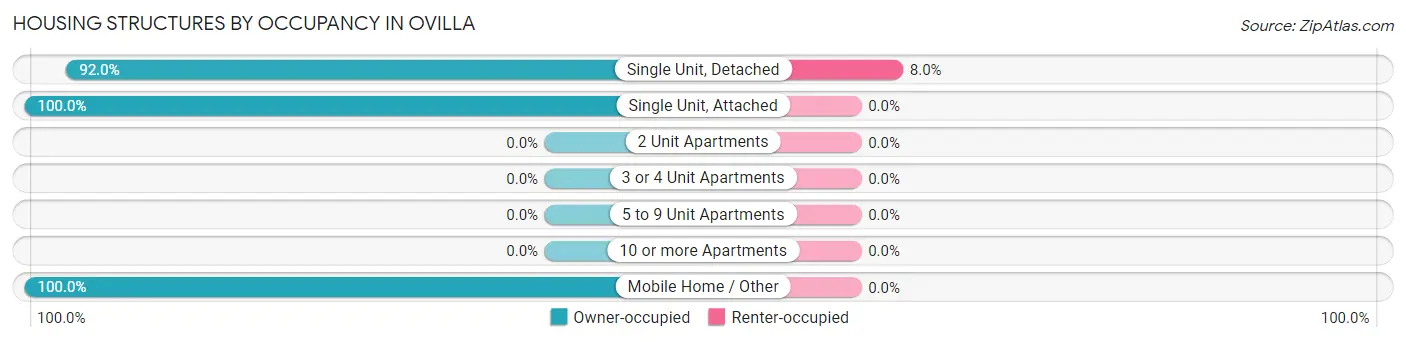
| Structure Type | Owner-occupied | Renter-occupied |
| Single Unit, Detached | 1,351 (92.0%) | 118 (8.0%) |
| Single Unit, Attached | 24 (100.0%) | 0 (0.0%) |
| 2 Unit Apartments | 0 (0.0%) | 0 (0.0%) |
| 3 or 4 Unit Apartments | 0 (0.0%) | 0 (0.0%) |
| 5 to 9 Unit Apartments | 0 (0.0%) | 0 (0.0%) |
| 10 or more Apartments | 0 (0.0%) | 0 (0.0%) |
| Mobile Home / Other | 11 (100.0%) | 0 (0.0%) |
| Total | 1,386 (92.1%) | 118 (7.9%) |
Housing Structures by Number of Rooms in Ovilla
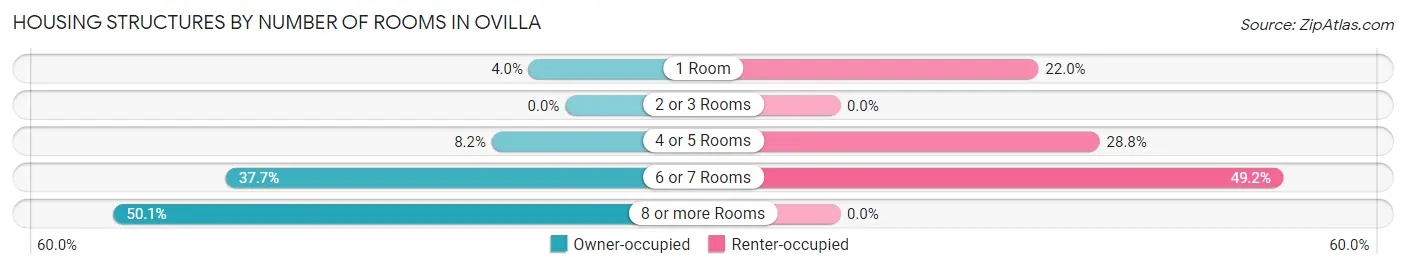
| Number of Rooms | Owner-occupied | Renter-occupied |
| 1 Room | 56 (4.0%) | 26 (22.0%) |
| 2 or 3 Rooms | 0 (0.0%) | 0 (0.0%) |
| 4 or 5 Rooms | 113 (8.2%) | 34 (28.8%) |
| 6 or 7 Rooms | 522 (37.7%) | 58 (49.1%) |
| 8 or more Rooms | 695 (50.1%) | 0 (0.0%) |
| Total | 1,386 (100.0%) | 118 (100.0%) |
Housing Structure by Heating Type in Ovilla
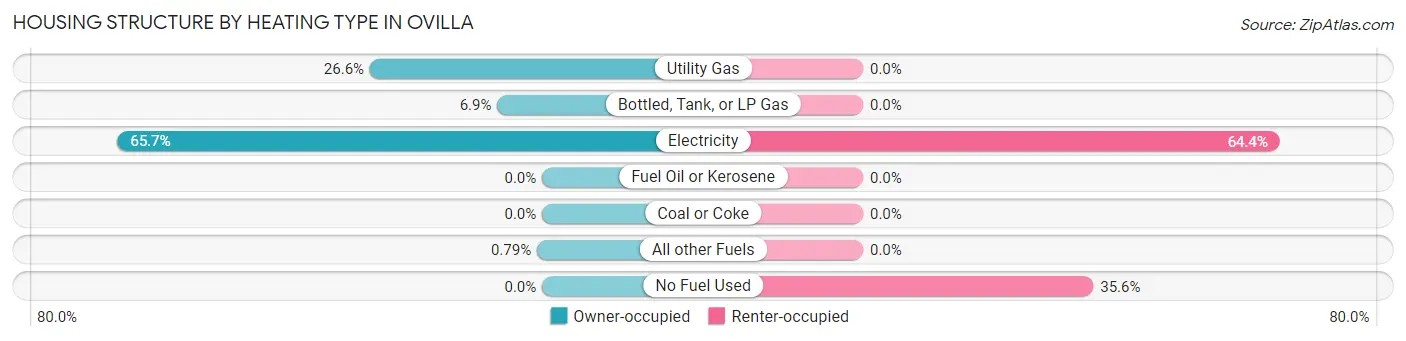
| Heating Type | Owner-occupied | Renter-occupied |
| Utility Gas | 369 (26.6%) | 0 (0.0%) |
| Bottled, Tank, or LP Gas | 96 (6.9%) | 0 (0.0%) |
| Electricity | 910 (65.7%) | 76 (64.4%) |
| Fuel Oil or Kerosene | 0 (0.0%) | 0 (0.0%) |
| Coal or Coke | 0 (0.0%) | 0 (0.0%) |
| All other Fuels | 11 (0.8%) | 0 (0.0%) |
| No Fuel Used | 0 (0.0%) | 42 (35.6%) |
| Total | 1,386 (100.0%) | 118 (100.0%) |
Household Vehicle Usage in Ovilla
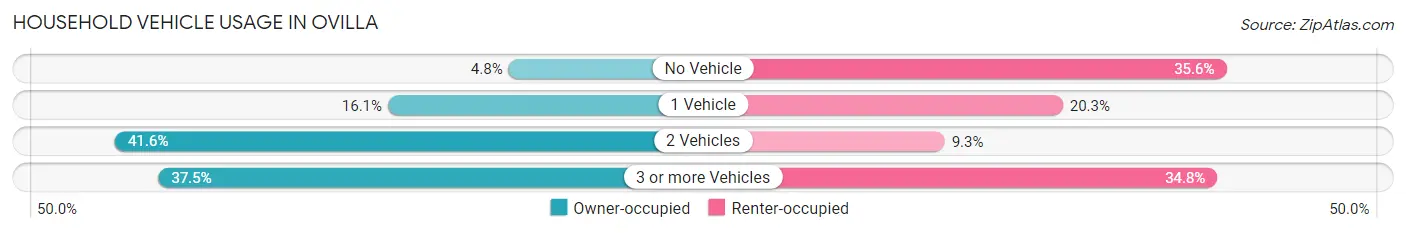
| Vehicles per Household | Owner-occupied | Renter-occupied |
| No Vehicle | 67 (4.8%) | 42 (35.6%) |
| 1 Vehicle | 223 (16.1%) | 24 (20.3%) |
| 2 Vehicles | 576 (41.6%) | 11 (9.3%) |
| 3 or more Vehicles | 520 (37.5%) | 41 (34.7%) |
| Total | 1,386 (100.0%) | 118 (100.0%) |
Real Estate & Mortgages in Ovilla
Real Estate and Mortgage Overview in Ovilla
| Characteristic | Without Mortgage | With Mortgage |
| Housing Units | 580 | 806 |
| Median Property Value | $375,900 | $317,300 |
| Median Household Income | $117,308 | $235 |
| Monthly Housing Costs | $1,074 | $204 |
| Real Estate Taxes | $6,516 | $11 |
Property Value by Mortgage Status in Ovilla
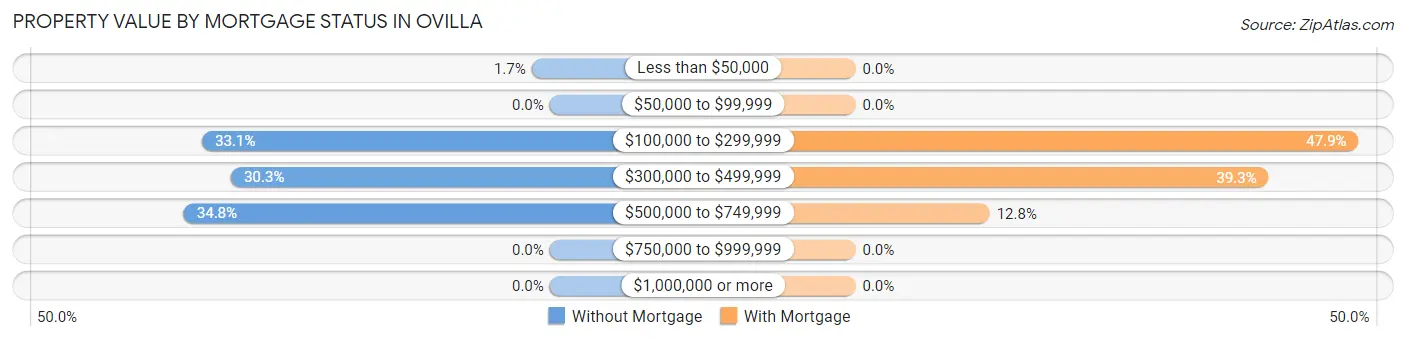
| Property Value | Without Mortgage | With Mortgage |
| Less than $50,000 | 10 (1.7%) | 0 (0.0%) |
| $50,000 to $99,999 | 0 (0.0%) | 0 (0.0%) |
| $100,000 to $299,999 | 192 (33.1%) | 386 (47.9%) |
| $300,000 to $499,999 | 176 (30.3%) | 317 (39.3%) |
| $500,000 to $749,999 | 202 (34.8%) | 103 (12.8%) |
| $750,000 to $999,999 | 0 (0.0%) | 0 (0.0%) |
| $1,000,000 or more | 0 (0.0%) | 0 (0.0%) |
| Total | 580 (100.0%) | 806 (100.0%) |
Household Income by Mortgage Status in Ovilla
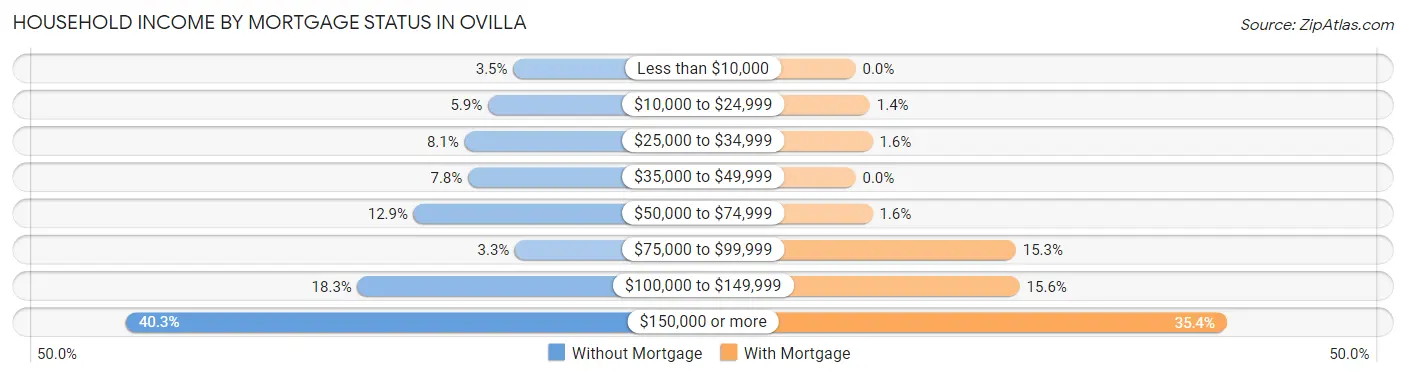
| Household Income | Without Mortgage | With Mortgage |
| Less than $10,000 | 20 (3.5%) | 0 (0.0%) |
| $10,000 to $24,999 | 34 (5.9%) | 11 (1.4%) |
| $25,000 to $34,999 | 47 (8.1%) | 13 (1.6%) |
| $35,000 to $49,999 | 45 (7.8%) | 0 (0.0%) |
| $50,000 to $74,999 | 75 (12.9%) | 13 (1.6%) |
| $75,000 to $99,999 | 19 (3.3%) | 123 (15.3%) |
| $100,000 to $149,999 | 106 (18.3%) | 126 (15.6%) |
| $150,000 or more | 234 (40.3%) | 285 (35.4%) |
| Total | 580 (100.0%) | 806 (100.0%) |
Property Value to Household Income Ratio in Ovilla
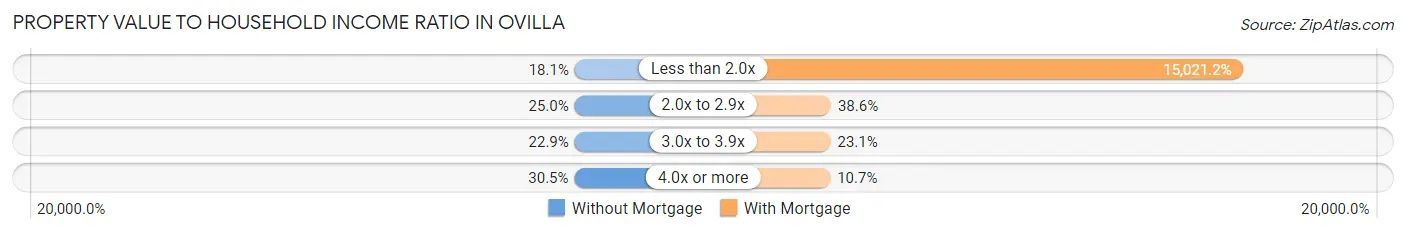
| Value-to-Income Ratio | Without Mortgage | With Mortgage |
| Less than 2.0x | 105 (18.1%) | 121,071 (15,021.2%) |
| 2.0x to 2.9x | 145 (25.0%) | 311 (38.6%) |
| 3.0x to 3.9x | 133 (22.9%) | 186 (23.1%) |
| 4.0x or more | 177 (30.5%) | 86 (10.7%) |
| Total | 580 (100.0%) | 806 (100.0%) |
Real Estate Taxes by Mortgage Status in Ovilla
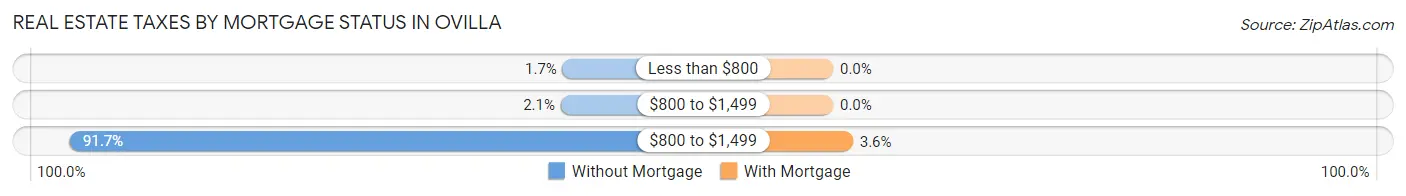
| Property Taxes | Without Mortgage | With Mortgage |
| Less than $800 | 10 (1.7%) | 0 (0.0%) |
| $800 to $1,499 | 12 (2.1%) | 0 (0.0%) |
| $800 to $1,499 | 532 (91.7%) | 29 (3.6%) |
| Total | 580 (100.0%) | 806 (100.0%) |
Health & Disability in Ovilla
Health Insurance Coverage by Age in Ovilla
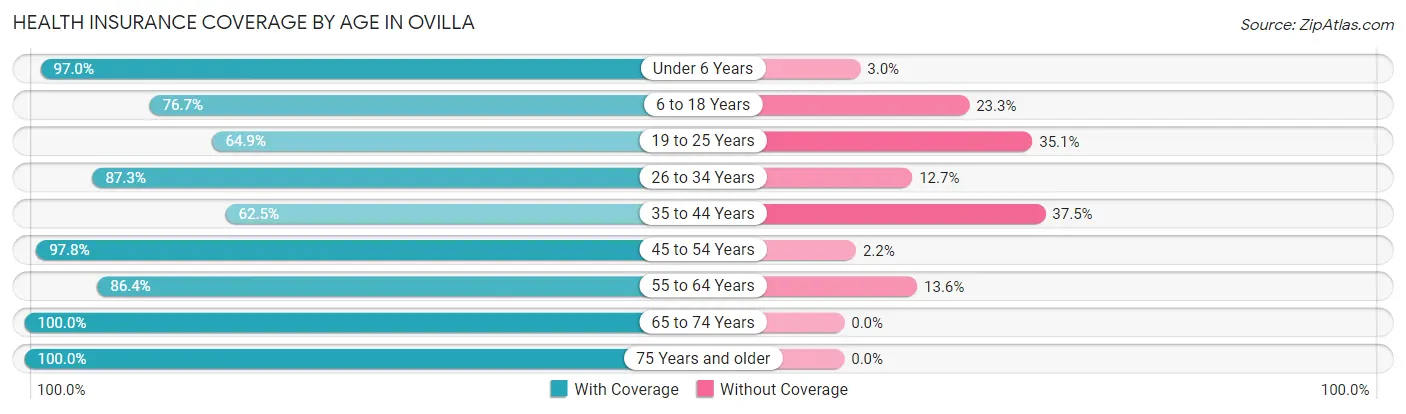
| Age Bracket | With Coverage | Without Coverage |
| Under 6 Years | 195 (97.0%) | 6 (3.0%) |
| 6 to 18 Years | 586 (76.7%) | 178 (23.3%) |
| 19 to 25 Years | 150 (64.9%) | 81 (35.1%) |
| 26 to 34 Years | 262 (87.3%) | 38 (12.7%) |
| 35 to 44 Years | 325 (62.5%) | 195 (37.5%) |
| 45 to 54 Years | 539 (97.8%) | 12 (2.2%) |
| 55 to 64 Years | 681 (86.4%) | 107 (13.6%) |
| 65 to 74 Years | 354 (100.0%) | 0 (0.0%) |
| 75 Years and older | 368 (100.0%) | 0 (0.0%) |
| Total | 3,460 (84.9%) | 617 (15.1%) |
Health Insurance Coverage by Citizenship Status in Ovilla
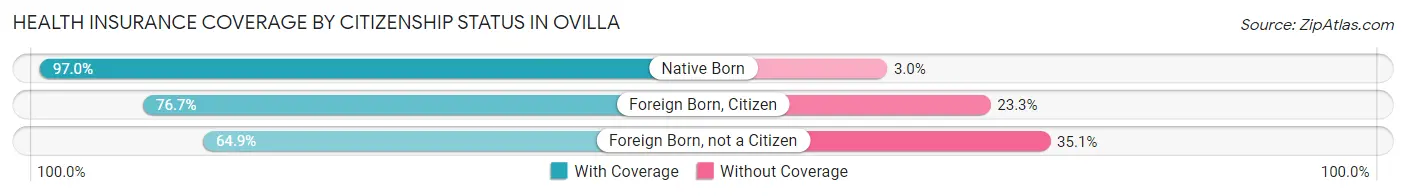
| Citizenship Status | With Coverage | Without Coverage |
| Native Born | 195 (97.0%) | 6 (3.0%) |
| Foreign Born, Citizen | 586 (76.7%) | 178 (23.3%) |
| Foreign Born, not a Citizen | 150 (64.9%) | 81 (35.1%) |
Health Insurance Coverage by Household Income in Ovilla
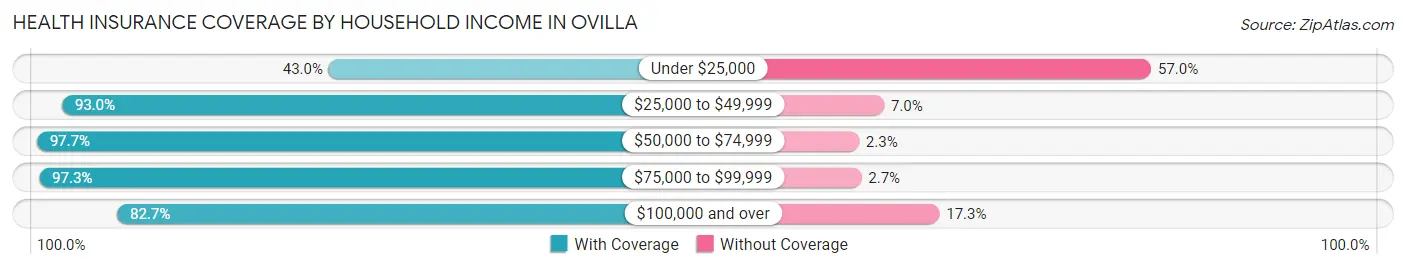
| Household Income | With Coverage | Without Coverage |
| Under $25,000 | 86 (43.0%) | 114 (57.0%) |
| $25,000 to $49,999 | 227 (93.0%) | 17 (7.0%) |
| $50,000 to $74,999 | 516 (97.7%) | 12 (2.3%) |
| $75,000 to $99,999 | 427 (97.3%) | 12 (2.7%) |
| $100,000 and over | 2,204 (82.7%) | 462 (17.3%) |
Public vs Private Health Insurance Coverage by Age in Ovilla
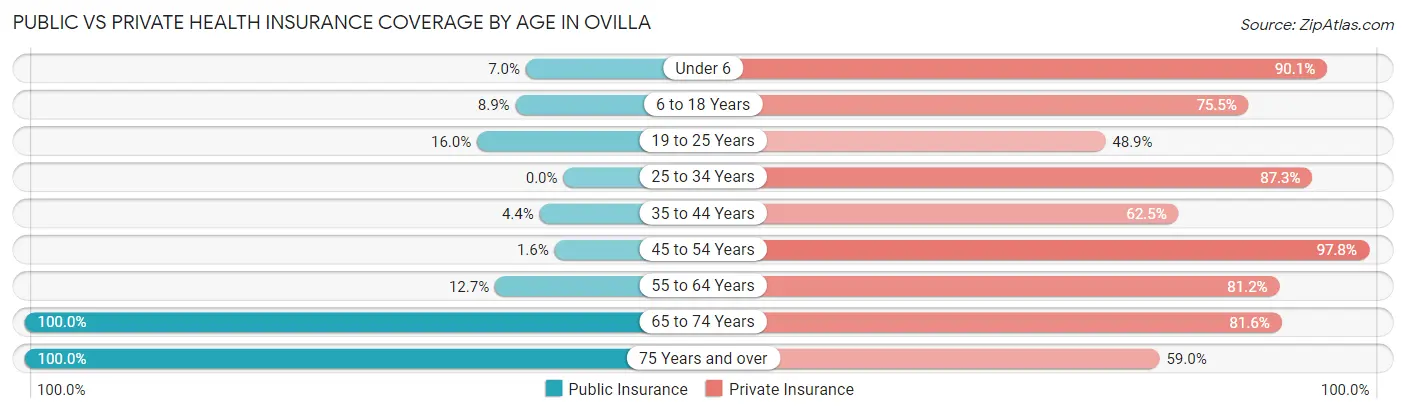
| Age Bracket | Public Insurance | Private Insurance |
| Under 6 | 14 (7.0%) | 181 (90.0%) |
| 6 to 18 Years | 68 (8.9%) | 577 (75.5%) |
| 19 to 25 Years | 37 (16.0%) | 113 (48.9%) |
| 25 to 34 Years | 0 (0.0%) | 262 (87.3%) |
| 35 to 44 Years | 23 (4.4%) | 325 (62.5%) |
| 45 to 54 Years | 9 (1.6%) | 539 (97.8%) |
| 55 to 64 Years | 100 (12.7%) | 640 (81.2%) |
| 65 to 74 Years | 354 (100.0%) | 289 (81.6%) |
| 75 Years and over | 368 (100.0%) | 217 (59.0%) |
| Total | 973 (23.9%) | 3,143 (77.1%) |
Disability Status by Sex by Age in Ovilla
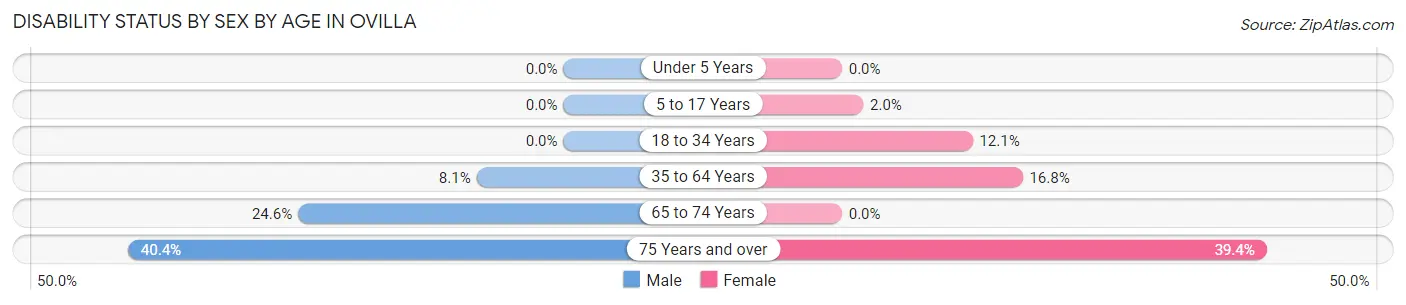
| Age Bracket | Male | Female |
| Under 5 Years | 0 (0.0%) | 0 (0.0%) |
| 5 to 17 Years | 0 (0.0%) | 9 (2.0%) |
| 18 to 34 Years | 0 (0.0%) | 37 (12.1%) |
| 35 to 64 Years | 72 (8.1%) | 162 (16.8%) |
| 65 to 74 Years | 50 (24.6%) | 0 (0.0%) |
| 75 Years and over | 78 (40.4%) | 69 (39.4%) |
Disability Class by Sex by Age in Ovilla
Disability Class: Hearing Difficulty
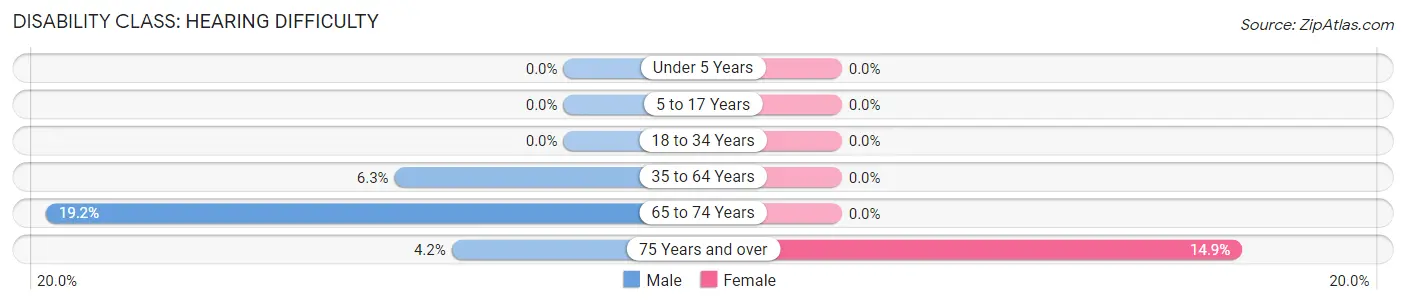
| Age Bracket | Male | Female |
| Under 5 Years | 0 (0.0%) | 0 (0.0%) |
| 5 to 17 Years | 0 (0.0%) | 0 (0.0%) |
| 18 to 34 Years | 0 (0.0%) | 0 (0.0%) |
| 35 to 64 Years | 56 (6.3%) | 0 (0.0%) |
| 65 to 74 Years | 39 (19.2%) | 0 (0.0%) |
| 75 Years and over | 8 (4.2%) | 26 (14.9%) |
Disability Class: Vision Difficulty
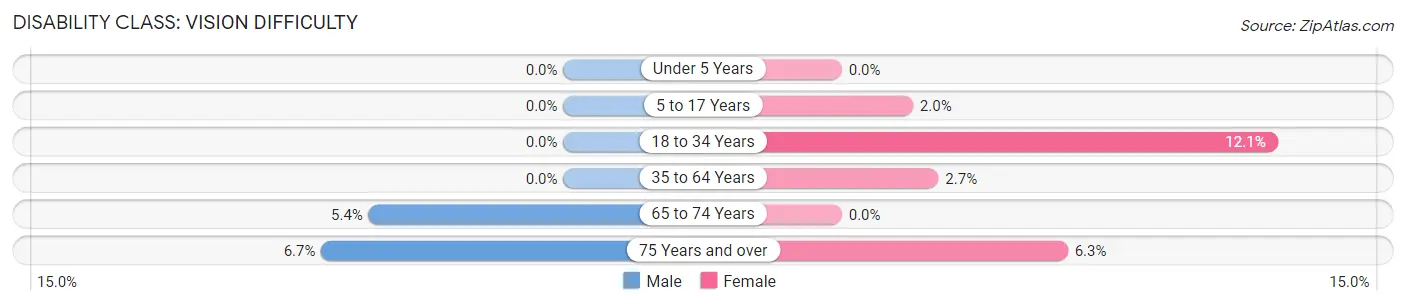
| Age Bracket | Male | Female |
| Under 5 Years | 0 (0.0%) | 0 (0.0%) |
| 5 to 17 Years | 0 (0.0%) | 9 (2.0%) |
| 18 to 34 Years | 0 (0.0%) | 37 (12.1%) |
| 35 to 64 Years | 0 (0.0%) | 26 (2.7%) |
| 65 to 74 Years | 11 (5.4%) | 0 (0.0%) |
| 75 Years and over | 13 (6.7%) | 11 (6.3%) |
Disability Class: Cognitive Difficulty
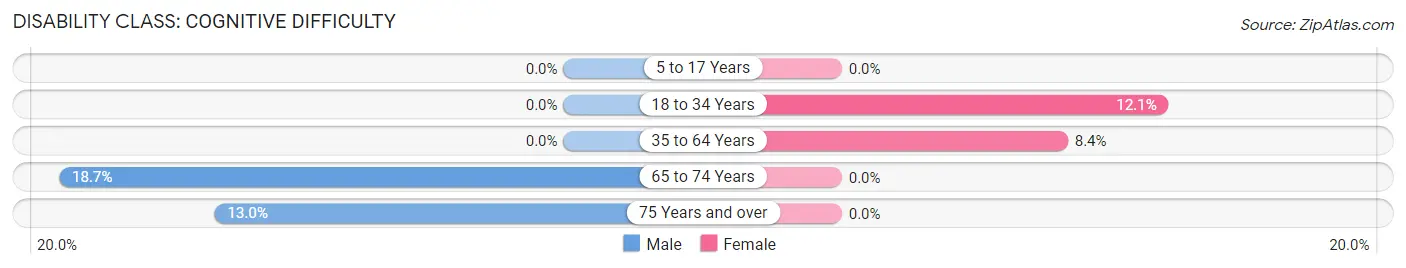
| Age Bracket | Male | Female |
| 5 to 17 Years | 0 (0.0%) | 0 (0.0%) |
| 18 to 34 Years | 0 (0.0%) | 37 (12.1%) |
| 35 to 64 Years | 0 (0.0%) | 81 (8.4%) |
| 65 to 74 Years | 38 (18.7%) | 0 (0.0%) |
| 75 Years and over | 25 (13.0%) | 0 (0.0%) |
Disability Class: Ambulatory Difficulty
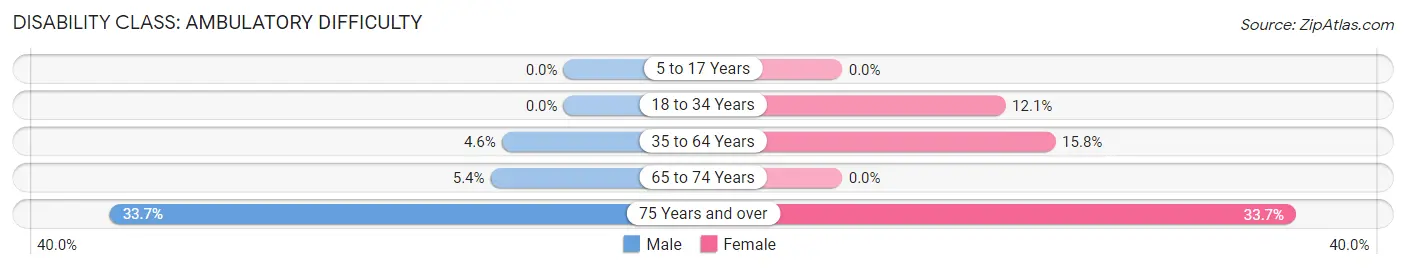
| Age Bracket | Male | Female |
| 5 to 17 Years | 0 (0.0%) | 0 (0.0%) |
| 18 to 34 Years | 0 (0.0%) | 37 (12.1%) |
| 35 to 64 Years | 41 (4.6%) | 153 (15.8%) |
| 65 to 74 Years | 11 (5.4%) | 0 (0.0%) |
| 75 Years and over | 65 (33.7%) | 59 (33.7%) |
Disability Class: Self-Care Difficulty
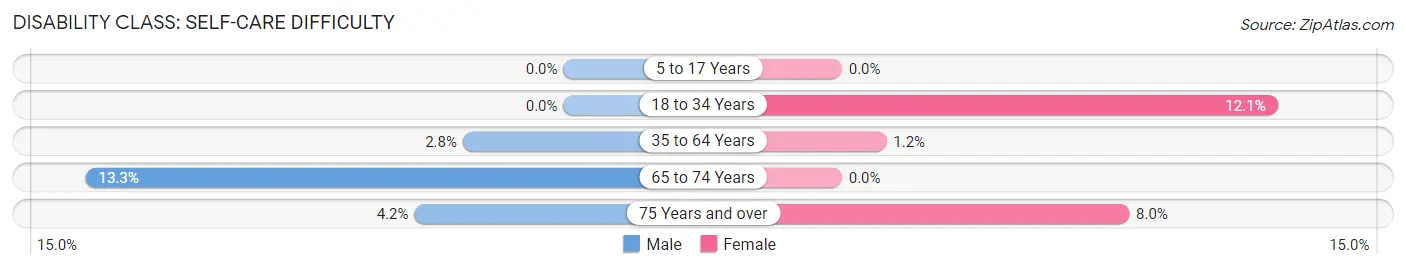
| Age Bracket | Male | Female |
| 5 to 17 Years | 0 (0.0%) | 0 (0.0%) |
| 18 to 34 Years | 0 (0.0%) | 37 (12.1%) |
| 35 to 64 Years | 25 (2.8%) | 12 (1.2%) |
| 65 to 74 Years | 27 (13.3%) | 0 (0.0%) |
| 75 Years and over | 8 (4.2%) | 14 (8.0%) |
Technology Access in Ovilla
Computing Device Access in Ovilla
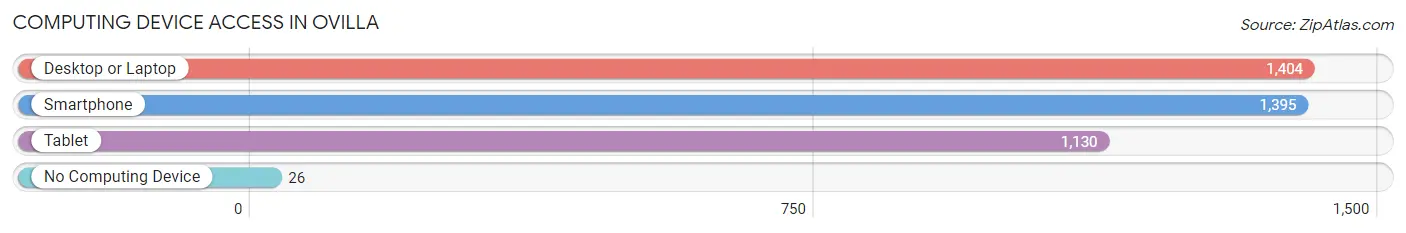
| Device Type | # Households | % Households |
| Desktop or Laptop | 1,404 | 93.3% |
| Smartphone | 1,395 | 92.7% |
| Tablet | 1,130 | 75.1% |
| No Computing Device | 26 | 1.7% |
| Total | 1,504 | 100.0% |
Internet Access in Ovilla
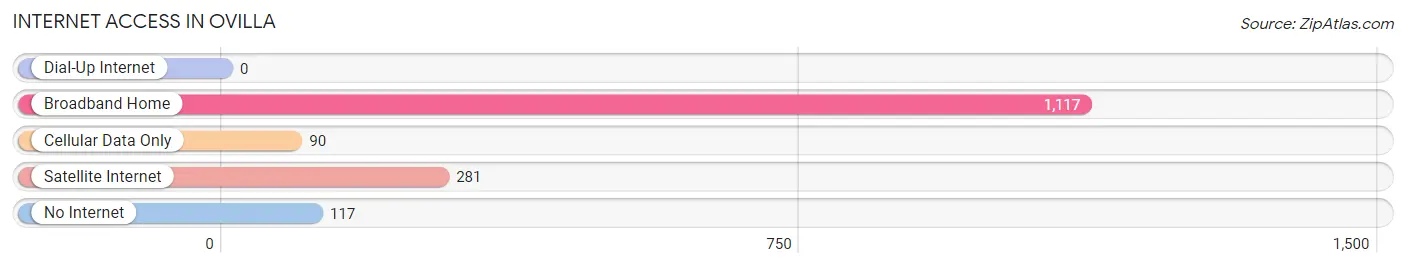
| Internet Type | # Households | % Households |
| Dial-Up Internet | 0 | 0.0% |
| Broadband Home | 1,117 | 74.3% |
| Cellular Data Only | 90 | 6.0% |
| Satellite Internet | 281 | 18.7% |
| No Internet | 117 | 7.8% |
| Total | 1,504 | 100.0% |
Ovilla Summary
Ovilla is a small town located in Ellis County, Texas, United States. It is situated about 20 miles south of Dallas and is part of the Dallas-Fort Worth Metroplex. The town was founded in 1854 and has a population of about 3,000 people.
History
Ovilla was founded in 1854 by a group of settlers from Kentucky. The town was named after the nearby Ovilla Creek, which was named after the Spanish word for “little egg”. The town was originally a farming community, but it soon became a stop on the Texas and Pacific Railway. This allowed the town to become a shipping center for the surrounding area.
In the late 19th century, Ovilla was a thriving community with a population of over 1,000 people. The town had several stores, churches, a school, and a post office. In the early 20th century, the town began to decline as the railroad was replaced by the automobile. By the 1950s, the population had dropped to just over 500 people.
Geography
Ovilla is located in Ellis County, Texas, about 20 miles south of Dallas. The town is situated on the western edge of the Dallas-Fort Worth Metroplex. The town is bordered by the cities of Red Oak, Glenn Heights, and Midlothian. The town is located on the Ovilla Creek, which is a tributary of the Trinity River.
The town has a total area of 2.2 square miles, all of which is land. The terrain is mostly flat with some rolling hills. The climate is humid subtropical, with hot summers and mild winters.
Economy
Ovilla’s economy is largely based on agriculture and light manufacturing. The town is home to several small businesses, including a feed store, a hardware store, and a lumber yard. The town also has a few restaurants and a few small retail stores.
The town is also home to several large employers, including a manufacturing plant, a trucking company, and a distribution center. The town is also home to a few small industrial parks.
Demographics
As of the 2010 census, the population of Ovilla was 3,037. The racial makeup of the town was 79.3% White, 11.2% African American, 0.7% Native American, 0.7% Asian, and 6.9% from other races. Hispanic or Latino of any race were 16.2% of the population.
The median income for a household in the town was $50,972, and the median income for a family was $60,972. The per capita income for the town was $22,972. About 8.2% of families and 10.2% of the population were below the poverty line, including 14.2% of those under age 18 and 6.2% of those age 65 or over.
Ovilla is a small town with a rich history and a bright future. The town is home to a diverse population and a thriving economy. The town is a great place to live, work, and raise a family.
Common Questions
What is the Total Population of Ovilla?
Total Population of Ovilla is 4,077.
What is the Total Male Population of Ovilla?
Total Male Population of Ovilla is 1,966.
What is the Total Female Population of Ovilla?
Total Female Population of Ovilla is 2,111.
What is the Ratio of Males per 100 Females in Ovilla?
There are 93.13 Males per 100 Females in Ovilla.
What is the Ratio of Females per 100 Males in Ovilla?
There are 107.38 Females per 100 Males in Ovilla.
What is the Median Population Age in Ovilla?
Median Population Age in Ovilla is 45.2 Years.
What is the Average Family Size in Ovilla
Average Family Size in Ovilla is 3.1 People.
What is the Average Household Size in Ovilla
Average Household Size in Ovilla is 2.7 People.
What is Per Capita Income in Ovilla?
Per Capita income in Ovilla is $48,664.
What is the Median Family Income in Ovilla?
Median Family Income in Ovilla is $132,685.
What is the Median Household income in Ovilla?
Median Household Income in Ovilla is $109,130.
What is Income or Wage Gap in Ovilla?
Income or Wage Gap in Ovilla is 41.4%.
Women in Ovilla earn 58.6 cents for every dollar earned by a man.
What is Family Income Deficit in Ovilla?
Family Income Deficit in Ovilla is $17,805.
Families that are below poverty line in Ovilla earn $17,805 less on average than the poverty threshold level.
What is Inequality or Gini Index in Ovilla?
Inequality or Gini Index in Ovilla is 0.36.
How Large is the Labor Force in Ovilla?
There are 1,925 People in the Labor Forcein in Ovilla.
What is the Percentage of People in the Labor Force in Ovilla?
58.9% of People are in the Labor Force in Ovilla.
What is the Unemployment Rate in Ovilla?
Unemployment Rate in Ovilla is 3.4%.