Cities with the Highest Percentage of Population Employed in Enterprise Management in Washington
RELATED REPORTS & OPTIONS
Enterprise Management
Washington
Compare Cities
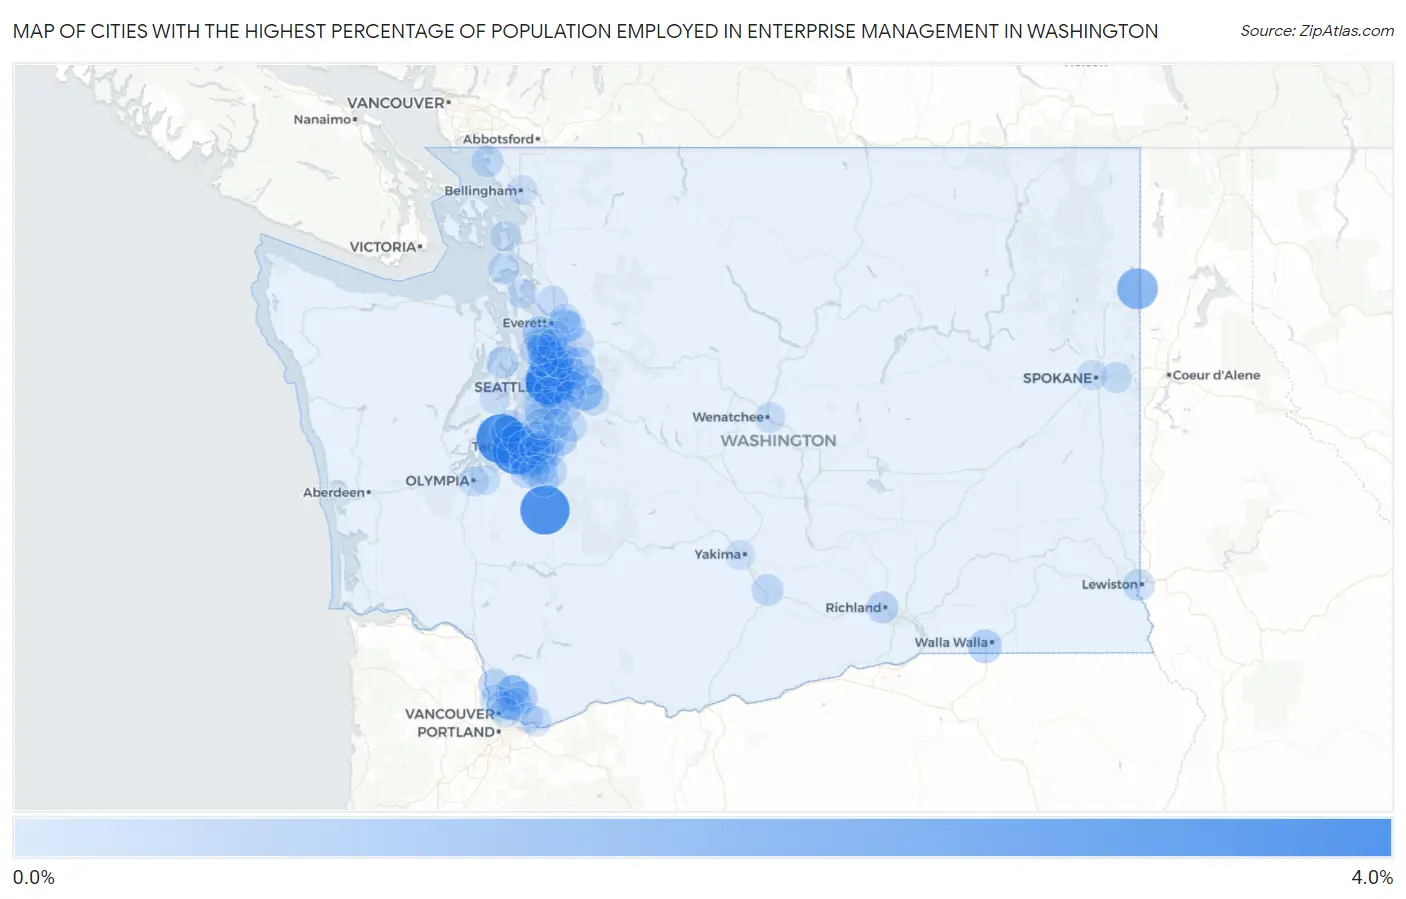
Map of Cities with the Highest Percentage of Population Employed in Enterprise Management in Washington
0.0%
4.0%
Cities with the Highest Percentage of Population Employed in Enterprise Management in Washington
| City | % Employed | vs State | vs National | |
| 1. | Artondale | 3.4% | 0.16%(+3.23)#1 | 0.14%(+3.25)#105 |
| 2. | Eatonville | 3.3% | 0.16%(+3.18)#2 | 0.14%(+3.20)#107 |
| 3. | Yarrow Point | 3.3% | 0.16%(+3.13)#3 | 0.14%(+3.15)#114 |
| 4. | Fircrest | 3.2% | 0.16%(+3.09)#4 | 0.14%(+3.11)#116 |
| 5. | Medina | 2.3% | 0.16%(+2.13)#5 | 0.14%(+2.15)#207 |
| 6. | Newport | 1.9% | 0.16%(+1.71)#6 | 0.14%(+1.73)#271 |
| 7. | Fall City | 1.0% | 0.16%(+0.860)#7 | 0.14%(+0.879)#578 |
| 8. | Kenmore | 1.0% | 0.16%(+0.848)#8 | 0.14%(+0.867)#588 |
| 9. | Midland | 0.91% | 0.16%(+0.749)#9 | 0.14%(+0.768)#682 |
| 10. | Mukilteo | 0.84% | 0.16%(+0.687)#10 | 0.14%(+0.706)#738 |
| 11. | Fairwood Cdp King County | 0.78% | 0.16%(+0.622)#11 | 0.14%(+0.640)#814 |
| 12. | Meadow Glade | 0.75% | 0.16%(+0.593)#12 | 0.14%(+0.612)#861 |
| 13. | Bunk Foss | 0.73% | 0.16%(+0.576)#13 | 0.14%(+0.594)#881 |
| 14. | Lake Holm | 0.70% | 0.16%(+0.547)#14 | 0.14%(+0.565)#921 |
| 15. | College Place | 0.66% | 0.16%(+0.502)#15 | 0.14%(+0.520)#988 |
| 16. | Kitsap Lake | 0.66% | 0.16%(+0.500)#16 | 0.14%(+0.519)#991 |
| 17. | Bothell West | 0.65% | 0.16%(+0.490)#17 | 0.14%(+0.509)#1,005 |
| 18. | Gig Harbor | 0.62% | 0.16%(+0.465)#18 | 0.14%(+0.483)#1,050 |
| 19. | Newcastle | 0.60% | 0.16%(+0.446)#19 | 0.14%(+0.465)#1,083 |
| 20. | Alderwood Manor | 0.58% | 0.16%(+0.426)#20 | 0.14%(+0.444)#1,121 |
| 21. | North Lynnwood | 0.58% | 0.16%(+0.425)#21 | 0.14%(+0.444)#1,122 |
| 22. | Bothell East | 0.56% | 0.16%(+0.408)#22 | 0.14%(+0.426)#1,163 |
| 23. | University Place | 0.56% | 0.16%(+0.404)#23 | 0.14%(+0.422)#1,175 |
| 24. | Edgewood | 0.55% | 0.16%(+0.390)#24 | 0.14%(+0.408)#1,209 |
| 25. | Cottage Lake | 0.54% | 0.16%(+0.379)#25 | 0.14%(+0.397)#1,237 |
| 26. | Duvall | 0.52% | 0.16%(+0.360)#26 | 0.14%(+0.379)#1,283 |
| 27. | Bothell | 0.52% | 0.16%(+0.360)#27 | 0.14%(+0.378)#1,284 |
| 28. | Hockinson | 0.51% | 0.16%(+0.352)#28 | 0.14%(+0.370)#1,297 |
| 29. | Redmond | 0.49% | 0.16%(+0.335)#29 | 0.14%(+0.353)#1,349 |
| 30. | Maplewood | 0.47% | 0.16%(+0.317)#30 | 0.14%(+0.336)#1,395 |
| 31. | Ridgefield | 0.46% | 0.16%(+0.304)#31 | 0.14%(+0.322)#1,423 |
| 32. | Richland | 0.38% | 0.16%(+0.221)#32 | 0.14%(+0.240)#1,699 |
| 33. | Orchards | 0.38% | 0.16%(+0.220)#33 | 0.14%(+0.238)#1,706 |
| 34. | Poulsbo | 0.35% | 0.16%(+0.196)#34 | 0.14%(+0.214)#1,806 |
| 35. | Union Hill Novelty Hill | 0.35% | 0.16%(+0.195)#35 | 0.14%(+0.213)#1,808 |
| 36. | Waller | 0.35% | 0.16%(+0.190)#36 | 0.14%(+0.209)#1,828 |
| 37. | Birch Bay | 0.34% | 0.16%(+0.181)#37 | 0.14%(+0.199)#1,877 |
| 38. | Clarkston | 0.34% | 0.16%(+0.178)#38 | 0.14%(+0.197)#1,889 |
| 39. | Parkland | 0.34% | 0.16%(+0.178)#39 | 0.14%(+0.197)#1,890 |
| 40. | Toppenish | 0.33% | 0.16%(+0.176)#40 | 0.14%(+0.195)#1,898 |
| 41. | Sumner | 0.32% | 0.16%(+0.161)#41 | 0.14%(+0.179)#1,950 |
| 42. | Puyallup | 0.31% | 0.16%(+0.155)#42 | 0.14%(+0.174)#1,977 |
| 43. | Seatac | 0.31% | 0.16%(+0.148)#43 | 0.14%(+0.167)#2,012 |
| 44. | Bellevue | 0.30% | 0.16%(+0.147)#44 | 0.14%(+0.165)#2,023 |
| 45. | Spanaway | 0.30% | 0.16%(+0.146)#45 | 0.14%(+0.165)#2,025 |
| 46. | Ruston | 0.30% | 0.16%(+0.138)#46 | 0.14%(+0.157)#2,076 |
| 47. | Orting | 0.29% | 0.16%(+0.130)#47 | 0.14%(+0.148)#2,122 |
| 48. | Auburn | 0.28% | 0.16%(+0.125)#48 | 0.14%(+0.144)#2,139 |
| 49. | Tacoma | 0.28% | 0.16%(+0.122)#49 | 0.14%(+0.140)#2,157 |
| 50. | Seattle | 0.26% | 0.16%(+0.107)#50 | 0.14%(+0.125)#2,243 |
| 51. | Maple Valley | 0.26% | 0.16%(+0.106)#51 | 0.14%(+0.125)#2,245 |
| 52. | Oak Harbor | 0.24% | 0.16%(+0.083)#52 | 0.14%(+0.101)#2,375 |
| 53. | Graham | 0.23% | 0.16%(+0.073)#53 | 0.14%(+0.091)#2,434 |
| 54. | Spokane Valley | 0.23% | 0.16%(+0.071)#54 | 0.14%(+0.089)#2,451 |
| 55. | Burien | 0.22% | 0.16%(+0.067)#55 | 0.14%(+0.085)#2,475 |
| 56. | Marysville | 0.22% | 0.16%(+0.065)#56 | 0.14%(+0.083)#2,487 |
| 57. | Carnation | 0.21% | 0.16%(+0.057)#57 | 0.14%(+0.075)#2,535 |
| 58. | Kirkland | 0.21% | 0.16%(+0.052)#58 | 0.14%(+0.070)#2,562 |
| 59. | Snoqualmie | 0.20% | 0.16%(+0.047)#59 | 0.14%(+0.065)#2,597 |
| 60. | Fife | 0.20% | 0.16%(+0.045)#60 | 0.14%(+0.064)#2,605 |
| 61. | Sammamish | 0.20% | 0.16%(+0.044)#61 | 0.14%(+0.062)#2,614 |
| 62. | Woodinville | 0.19% | 0.16%(+0.032)#62 | 0.14%(+0.051)#2,706 |
| 63. | Picnic Point | 0.19% | 0.16%(+0.031)#63 | 0.14%(+0.050)#2,712 |
| 64. | Felida | 0.19% | 0.16%(+0.030)#64 | 0.14%(+0.048)#2,726 |
| 65. | Camas | 0.17% | 0.16%(+0.010)#65 | 0.14%(+0.028)#2,863 |
| 66. | Hazel Dell | 0.17% | 0.16%(+0.008)#66 | 0.14%(+0.026)#2,879 |
| 67. | Lakeland North | 0.16% | 0.16%(+0.006)#67 | 0.14%(+0.024)#2,894 |
| 68. | East Renton Highlands | 0.16% | 0.16%(+0.005)#68 | 0.14%(+0.023)#2,911 |
| 69. | Maltby | 0.15% | 0.16%(-0.011)#69 | 0.14%(+0.008)#3,016 |
| 70. | East Wenatchee | 0.15% | 0.16%(-0.012)#70 | 0.14%(+0.007)#3,029 |
| 71. | Everett | 0.14% | 0.16%(-0.017)#71 | 0.14%(+0.002)#3,060 |
| 72. | South Hill | 0.14% | 0.16%(-0.019)#72 | 0.14%(-0.001)#3,079 |
| 73. | Bremerton | 0.14% | 0.16%(-0.022)#73 | 0.14%(-0.004)#3,104 |
| 74. | Federal Way | 0.13% | 0.16%(-0.023)#74 | 0.14%(-0.004)#3,115 |
| 75. | Milton | 0.13% | 0.16%(-0.025)#75 | 0.14%(-0.006)#3,127 |
| 76. | Frederickson | 0.13% | 0.16%(-0.027)#76 | 0.14%(-0.008)#3,142 |
| 77. | Renton | 0.12% | 0.16%(-0.033)#77 | 0.14%(-0.015)#3,198 |
| 78. | Bryn Mawr Skyway | 0.12% | 0.16%(-0.033)#78 | 0.14%(-0.015)#3,199 |
| 79. | Eastmont | 0.12% | 0.16%(-0.039)#79 | 0.14%(-0.021)#3,251 |
| 80. | Olympia | 0.11% | 0.16%(-0.043)#80 | 0.14%(-0.024)#3,293 |
| 81. | Mercer Island | 0.11% | 0.16%(-0.048)#81 | 0.14%(-0.029)#3,344 |
| 82. | Washougal | 0.11% | 0.16%(-0.050)#82 | 0.14%(-0.031)#3,357 |
| 83. | Lake Forest Park | 0.11% | 0.16%(-0.050)#83 | 0.14%(-0.032)#3,362 |
| 84. | Anacortes | 0.098% | 0.16%(-0.059)#84 | 0.14%(-0.040)#3,431 |
| 85. | Issaquah | 0.097% | 0.16%(-0.060)#85 | 0.14%(-0.041)#3,443 |
| 86. | Spokane | 0.096% | 0.16%(-0.060)#86 | 0.14%(-0.042)#3,454 |
| 87. | Five Corners | 0.094% | 0.16%(-0.063)#87 | 0.14%(-0.045)#3,483 |
| 88. | Camano | 0.092% | 0.16%(-0.065)#88 | 0.14%(-0.046)#3,501 |
| 89. | Battle Ground | 0.091% | 0.16%(-0.066)#89 | 0.14%(-0.048)#3,518 |
| 90. | Vancouver | 0.088% | 0.16%(-0.069)#90 | 0.14%(-0.050)#3,540 |
| 91. | Edmonds | 0.081% | 0.16%(-0.076)#91 | 0.14%(-0.058)#3,616 |
| 92. | Monroe | 0.077% | 0.16%(-0.080)#92 | 0.14%(-0.062)#3,648 |
| 93. | Lynnwood | 0.069% | 0.16%(-0.088)#93 | 0.14%(-0.069)#3,713 |
| 94. | Yakima | 0.061% | 0.16%(-0.096)#94 | 0.14%(-0.077)#3,781 |
| 95. | Des Moines | 0.059% | 0.16%(-0.098)#95 | 0.14%(-0.080)#3,792 |
| 96. | Lake Stevens | 0.056% | 0.16%(-0.101)#96 | 0.14%(-0.082)#3,813 |
| 97. | Bellingham | 0.052% | 0.16%(-0.105)#97 | 0.14%(-0.086)#3,839 |
| 98. | Lacey | 0.045% | 0.16%(-0.112)#98 | 0.14%(-0.094)#3,903 |
| 99. | Kent | 0.039% | 0.16%(-0.118)#99 | 0.14%(-0.100)#3,947 |
| 100. | Mill Creek | 0.037% | 0.16%(-0.120)#100 | 0.14%(-0.102)#3,961 |
Common Questions
What are the Top 10 Cities with the Highest Percentage of Population Employed in Enterprise Management in Washington?
Top 10 Cities with the Highest Percentage of Population Employed in Enterprise Management in Washington are:
#1
3.4%
#2
3.3%
#3
3.3%
#4
3.2%
#5
2.3%
#6
1.9%
#7
1.0%
#8
1.0%
#9
0.91%
#10
0.84%
What city has the Highest Percentage of Population Employed in Enterprise Management in Washington?
Artondale has the Highest Percentage of Population Employed in Enterprise Management in Washington with 3.4%.
What is the Percentage of Population Employed in Enterprise Management in the State of Washington?
Percentage of Population Employed in Enterprise Management in Washington is 0.16%.
What is the Percentage of Population Employed in Enterprise Management in the United States?
Percentage of Population Employed in Enterprise Management in the United States is 0.14%.