Eastport, NY
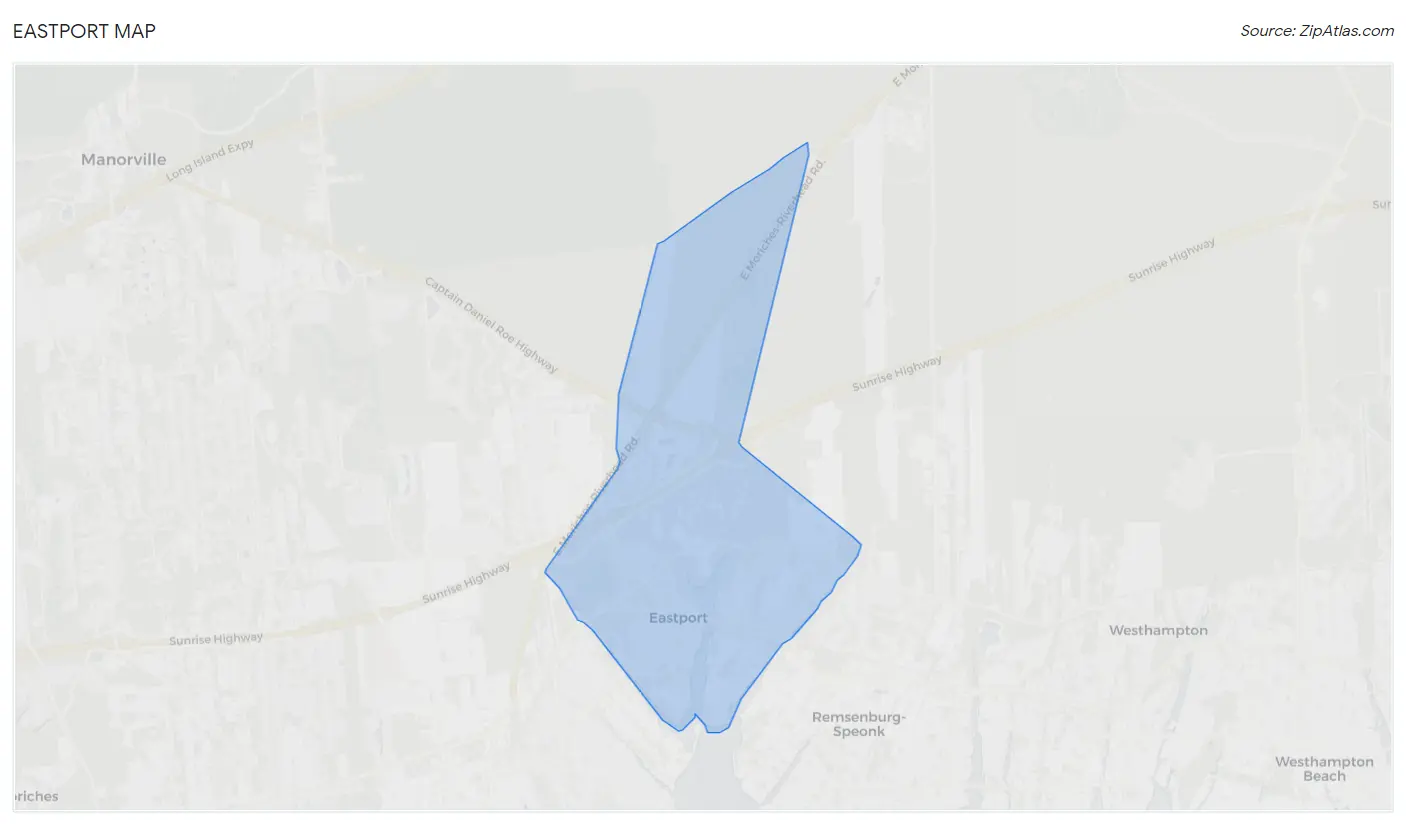
Eastport Map
Eastport Overview
2,136
TOTAL POPULATION
998
MALE POPULATION
1,138
FEMALE POPULATION
87.70
MALES / 100 FEMALES
114.03
FEMALES / 100 MALES
40.8
MEDIAN AGE
3.2
AVG FAMILY SIZE
2.9
AVG HOUSEHOLD SIZE
$55,493
PER CAPITA INCOME
$134,900
AVG FAMILY INCOME
$127,931
AVG HOUSEHOLD INCOME
35.5%
WAGE / INCOME GAP [ % ]
64.5¢/ $1
WAGE / INCOME GAP [ $ ]
0.41
INEQUALITY / GINI INDEX
1,048
LABOR FORCE [ PEOPLE ]
59.7%
PERCENT IN LABOR FORCE
2.8%
UNEMPLOYMENT RATE
Eastport Zip Codes
Eastport Area Codes
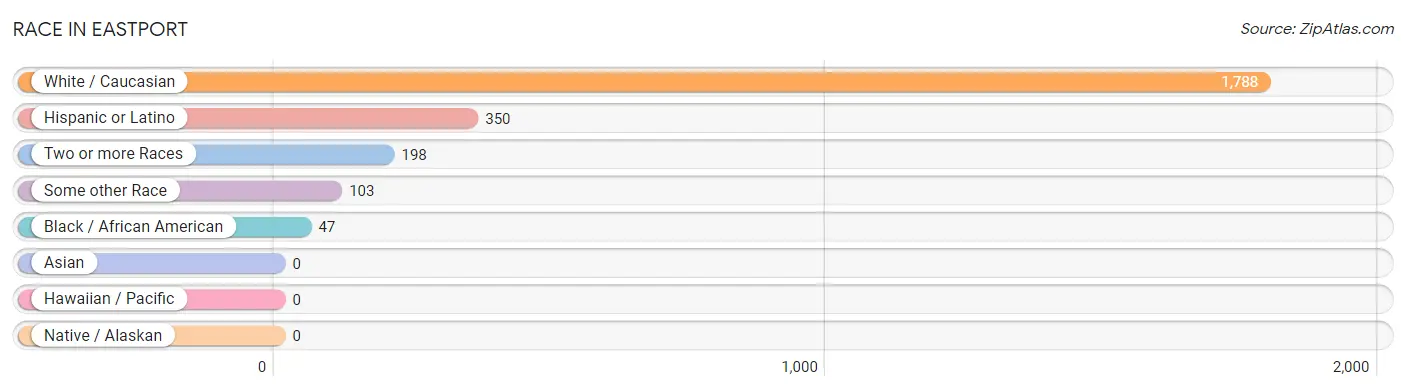
Race in Eastport
The most populous races in Eastport are White / Caucasian (1,788 | 83.7%), Hispanic or Latino (350 | 16.4%), and Two or more Races (198 | 9.3%).
| Race | # Population | % Population |
| Asian | 0 | 0.0% |
| Black / African American | 47 | 2.2% |
| Hawaiian / Pacific | 0 | 0.0% |
| Hispanic or Latino | 350 | 16.4% |
| Native / Alaskan | 0 | 0.0% |
| White / Caucasian | 1,788 | 83.7% |
| Two or more Races | 198 | 9.3% |
| Some other Race | 103 | 4.8% |
| Total | 2,136 | 100.0% |
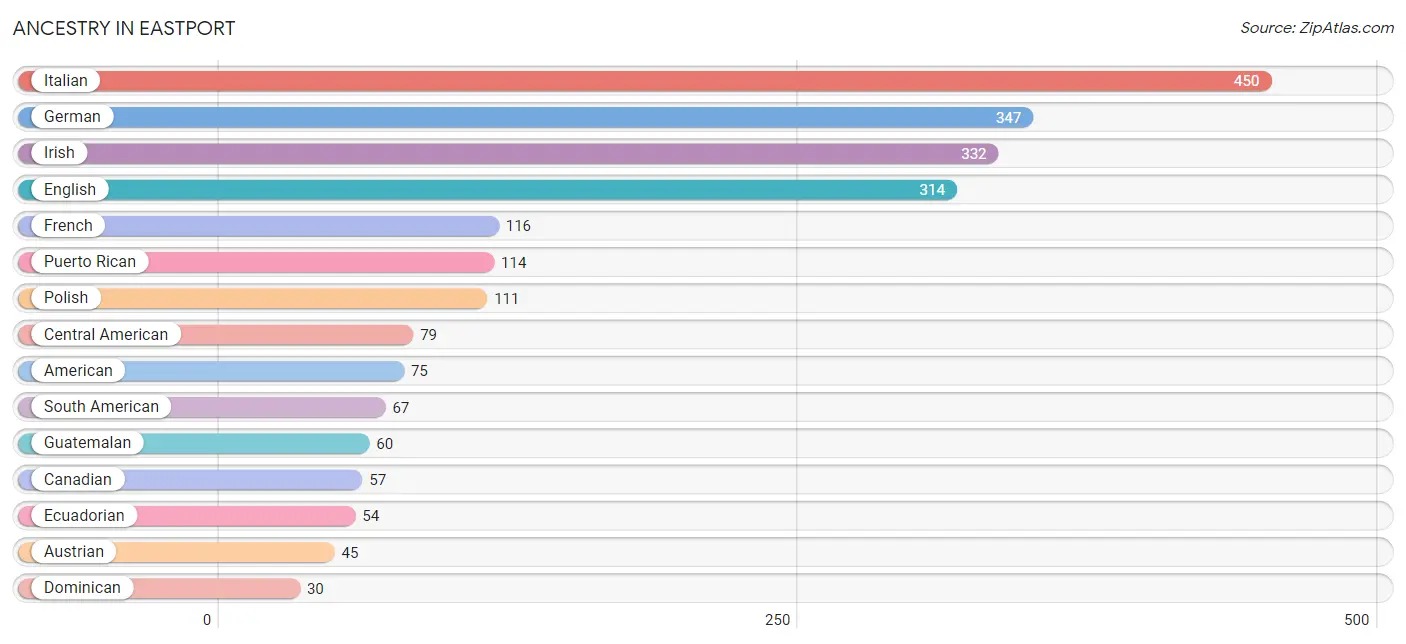
Ancestry in Eastport
The most populous ancestries reported in Eastport are Italian (450 | 21.1%), German (347 | 16.3%), Irish (332 | 15.5%), English (314 | 14.7%), and French (116 | 5.4%), together accounting for 73.0% of all Eastport residents.
| Ancestry | # Population | % Population |
| American | 75 | 3.5% |
| Austrian | 45 | 2.1% |
| British | 19 | 0.9% |
| Canadian | 57 | 2.7% |
| Central American | 79 | 3.7% |
| Colombian | 13 | 0.6% |
| Dominican | 30 | 1.4% |
| Dutch | 16 | 0.7% |
| Eastern European | 13 | 0.6% |
| Ecuadorian | 54 | 2.5% |
| English | 314 | 14.7% |
| European | 11 | 0.5% |
| Finnish | 6 | 0.3% |
| French | 116 | 5.4% |
| German | 347 | 16.3% |
| Guatemalan | 60 | 2.8% |
| Hungarian | 11 | 0.5% |
| Irish | 332 | 15.5% |
| Israeli | 9 | 0.4% |
| Italian | 450 | 21.1% |
| Mexican | 13 | 0.6% |
| Native Hawaiian | 18 | 0.8% |
| Polish | 111 | 5.2% |
| Puerto Rican | 114 | 5.3% |
| Russian | 26 | 1.2% |
| Salvadoran | 19 | 0.9% |
| Samoan | 18 | 0.8% |
| Scottish | 17 | 0.8% |
| South American | 67 | 3.1% |
| Subsaharan African | 15 | 0.7% |
| Swiss | 7 | 0.3% | View All 31 Rows |
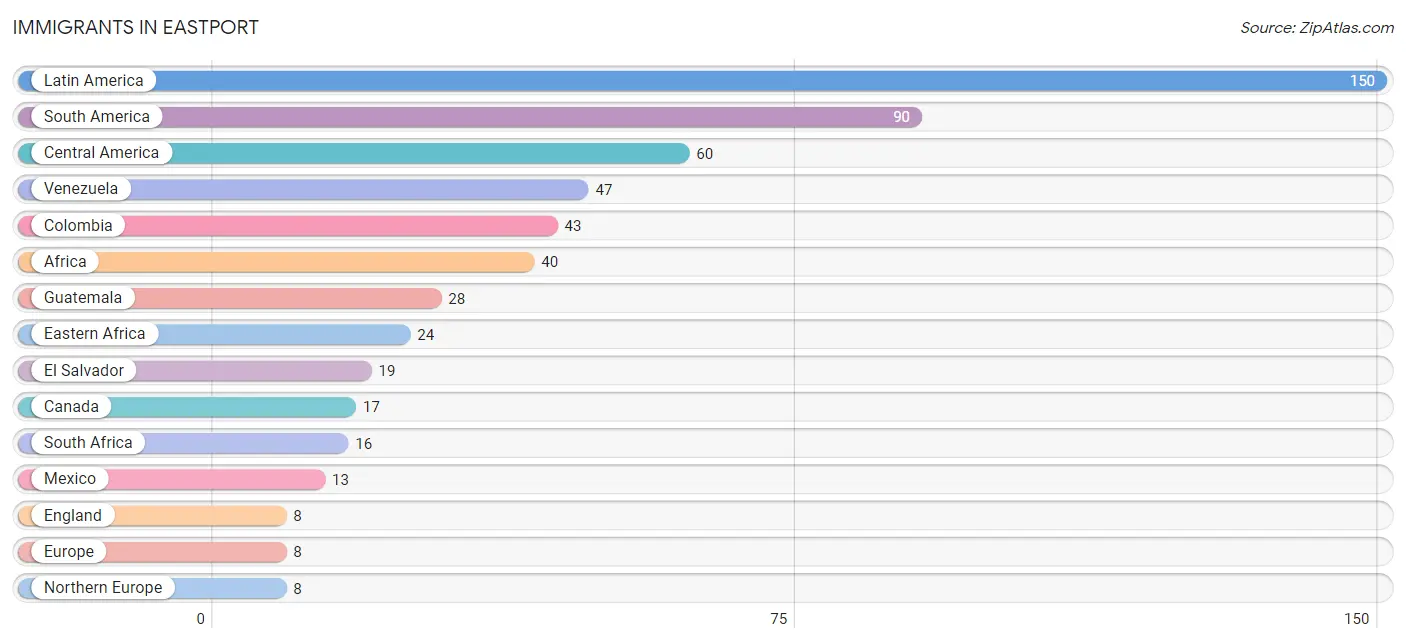
Immigrants in Eastport
The most numerous immigrant groups reported in Eastport came from Latin America (150 | 7.0%), South America (90 | 4.2%), Central America (60 | 2.8%), Venezuela (47 | 2.2%), and Colombia (43 | 2.0%), together accounting for 18.2% of all Eastport residents.
| Immigration Origin | # Population | % Population |
| Africa | 40 | 1.9% |
| Canada | 17 | 0.8% |
| Central America | 60 | 2.8% |
| Colombia | 43 | 2.0% |
| Eastern Africa | 24 | 1.1% |
| El Salvador | 19 | 0.9% |
| England | 8 | 0.4% |
| Europe | 8 | 0.4% |
| Guatemala | 28 | 1.3% |
| Latin America | 150 | 7.0% |
| Mexico | 13 | 0.6% |
| Northern Europe | 8 | 0.4% |
| South Africa | 16 | 0.7% |
| South America | 90 | 4.2% |
| Venezuela | 47 | 2.2% | View All 15 Rows |
Sex and Age in Eastport
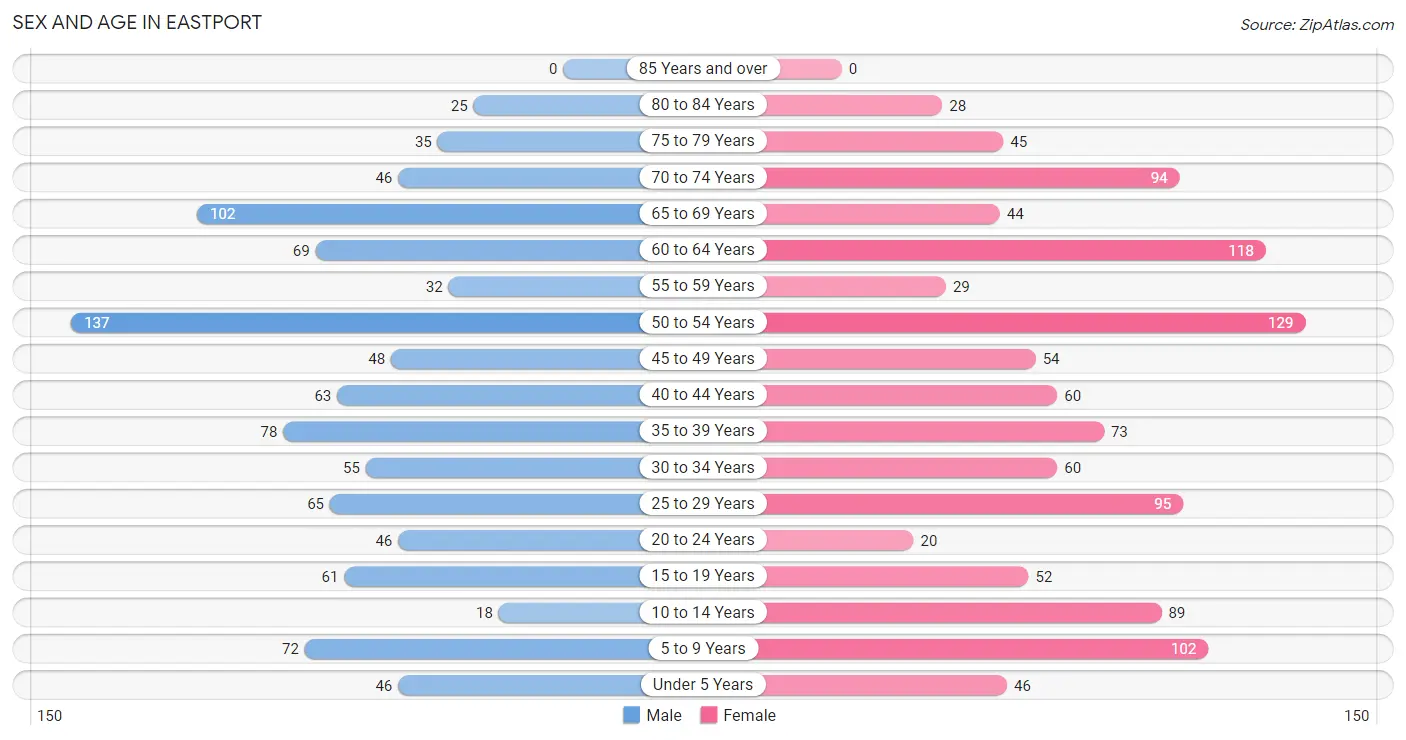
Sex and Age in Eastport
The most populous age groups in Eastport are 50 to 54 Years (137 | 13.7%) for men and 50 to 54 Years (129 | 11.3%) for women.
| Age Bracket | Male | Female |
| Under 5 Years | 46 (4.6%) | 46 (4.0%) |
| 5 to 9 Years | 72 (7.2%) | 102 (9.0%) |
| 10 to 14 Years | 18 (1.8%) | 89 (7.8%) |
| 15 to 19 Years | 61 (6.1%) | 52 (4.6%) |
| 20 to 24 Years | 46 (4.6%) | 20 (1.8%) |
| 25 to 29 Years | 65 (6.5%) | 95 (8.4%) |
| 30 to 34 Years | 55 (5.5%) | 60 (5.3%) |
| 35 to 39 Years | 78 (7.8%) | 73 (6.4%) |
| 40 to 44 Years | 63 (6.3%) | 60 (5.3%) |
| 45 to 49 Years | 48 (4.8%) | 54 (4.8%) |
| 50 to 54 Years | 137 (13.7%) | 129 (11.3%) |
| 55 to 59 Years | 32 (3.2%) | 29 (2.5%) |
| 60 to 64 Years | 69 (6.9%) | 118 (10.4%) |
| 65 to 69 Years | 102 (10.2%) | 44 (3.9%) |
| 70 to 74 Years | 46 (4.6%) | 94 (8.3%) |
| 75 to 79 Years | 35 (3.5%) | 45 (4.0%) |
| 80 to 84 Years | 25 (2.5%) | 28 (2.5%) |
| 85 Years and over | 0 (0.0%) | 0 (0.0%) |
| Total | 998 (100.0%) | 1,138 (100.0%) |
Families and Households in Eastport
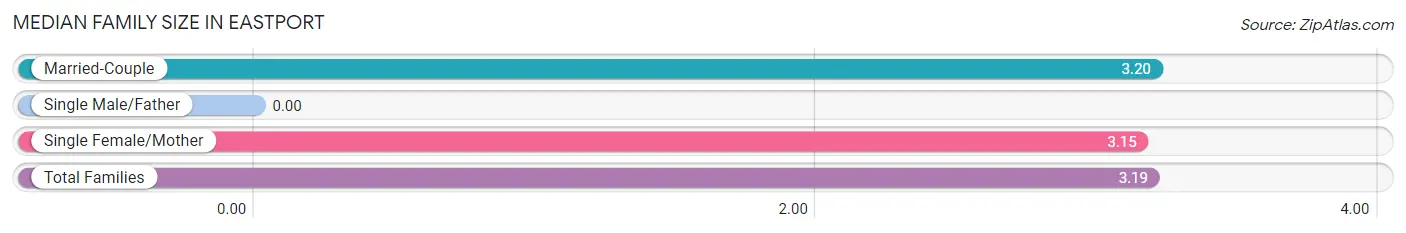
Median Family Size in Eastport
| Family Type | # Families | Family Size |
| Married-Couple | 520 (91.5%) | 3.20 |
| Single Male/Father | 0 (0.0%) | - |
| Single Female/Mother | 48 (8.5%) | 3.15 |
| Total Families | 568 (100.0%) | 3.19 |
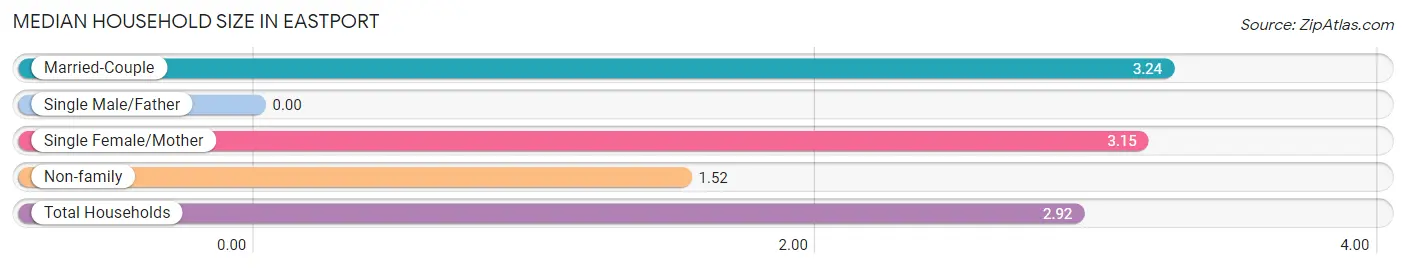
Median Household Size in Eastport
| Household Type | # Households | Household Size |
| Married-Couple | 520 (74.5%) | 3.24 |
| Single Male/Father | 0 (0.0%) | - |
| Single Female/Mother | 48 (6.9%) | 3.15 |
| Non-family | 130 (18.6%) | 1.52 |
| Total Households | 698 (100.0%) | 2.92 |
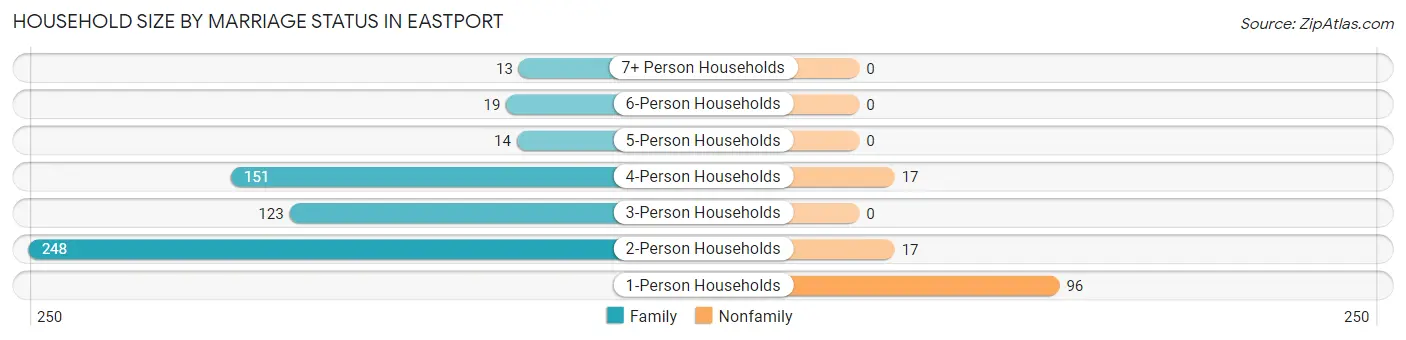
Household Size by Marriage Status in Eastport
Out of a total of 698 households in Eastport, 568 (81.4%) are family households, while 130 (18.6%) are nonfamily households. The most numerous type of family households are 2-person households, comprising 248, and the most common type of nonfamily households are 1-person households, comprising 96.
| Household Size | Family Households | Nonfamily Households |
| 1-Person Households | - | 96 (13.8%) |
| 2-Person Households | 248 (35.5%) | 17 (2.4%) |
| 3-Person Households | 123 (17.6%) | 0 (0.0%) |
| 4-Person Households | 151 (21.6%) | 17 (2.4%) |
| 5-Person Households | 14 (2.0%) | 0 (0.0%) |
| 6-Person Households | 19 (2.7%) | 0 (0.0%) |
| 7+ Person Households | 13 (1.9%) | 0 (0.0%) |
| Total | 568 (81.4%) | 130 (18.6%) |
Female Fertility in Eastport
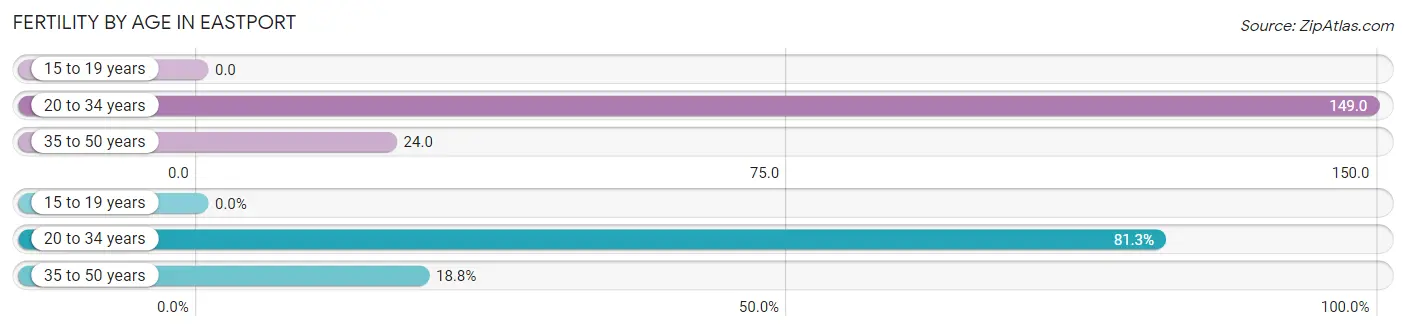
Fertility by Age in Eastport
Average fertility rate in Eastport is 67.0 births per 1,000 women. Women in the age bracket of 20 to 34 years have the highest fertility rate with 149.0 births per 1,000 women. Women in the age bracket of 20 to 34 years acount for 81.2% of all women with births.
| Age Bracket | Women with Births | Births / 1,000 Women |
| 15 to 19 years | 0 (0.0%) | 0.0 |
| 20 to 34 years | 26 (81.2%) | 149.0 |
| 35 to 50 years | 6 (18.8%) | 24.0 |
| Total | 32 (100.0%) | 67.0 |
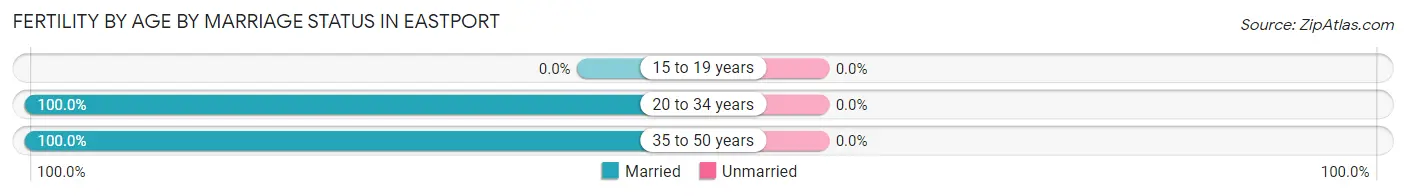
Fertility by Age by Marriage Status in Eastport
| Age Bracket | Married | Unmarried |
| 15 to 19 years | 0 (0.0%) | 0 (0.0%) |
| 20 to 34 years | 26 (100.0%) | 0 (0.0%) |
| 35 to 50 years | 6 (100.0%) | 0 (0.0%) |
| Total | 32 (100.0%) | 0 (0.0%) |
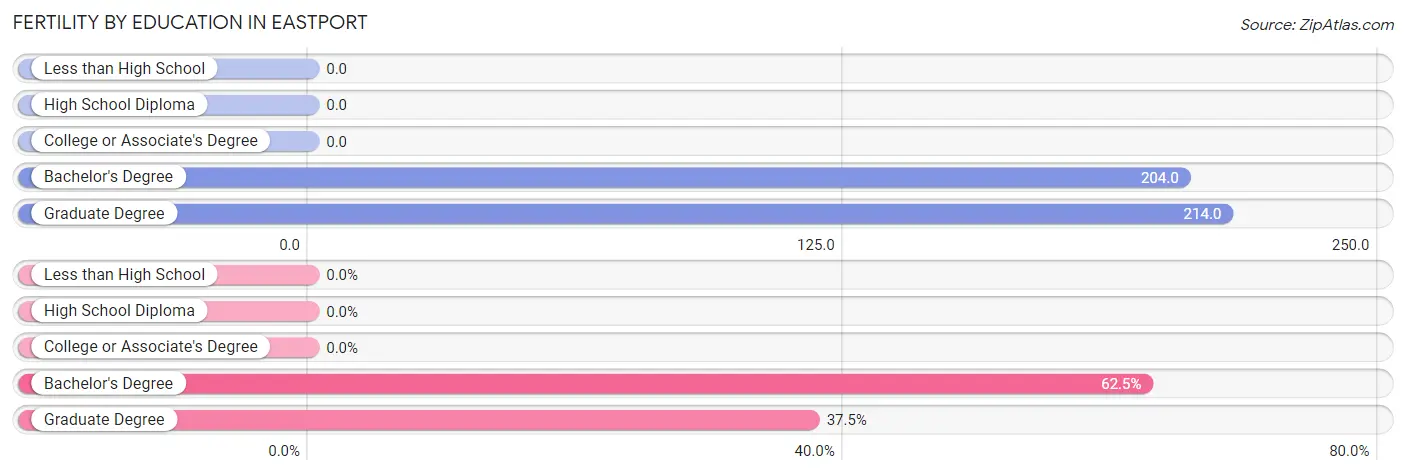
Fertility by Education in Eastport
| Educational Attainment | Women with Births | Births / 1,000 Women |
| Less than High School | 0 (0.0%) | 0.0 |
| High School Diploma | 0 (0.0%) | 0.0 |
| College or Associate's Degree | 0 (0.0%) | 0.0 |
| Bachelor's Degree | 20 (62.5%) | 204.0 |
| Graduate Degree | 12 (37.5%) | 214.0 |
| Total | 32 (100.0%) | 67.0 |
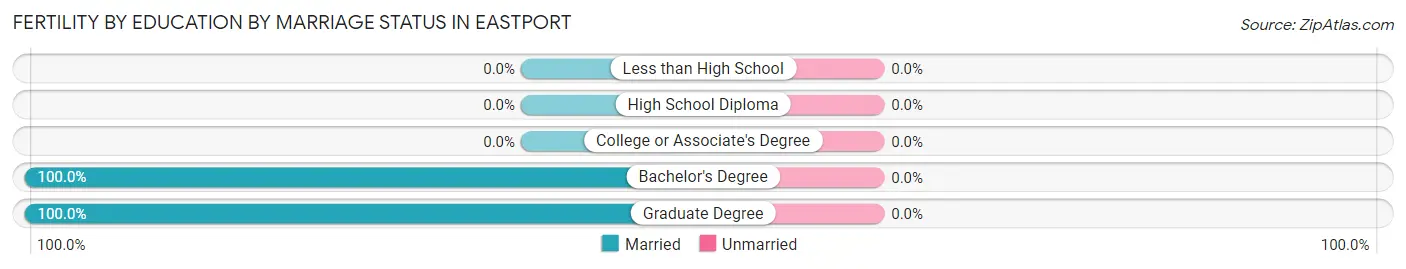
Fertility by Education by Marriage Status in Eastport
| Educational Attainment | Married | Unmarried |
| Less than High School | 0 (0.0%) | 0 (0.0%) |
| High School Diploma | 0 (0.0%) | 0 (0.0%) |
| College or Associate's Degree | 0 (0.0%) | 0 (0.0%) |
| Bachelor's Degree | 20 (100.0%) | 0 (0.0%) |
| Graduate Degree | 12 (100.0%) | 0 (0.0%) |
| Total | 32 (100.0%) | 0 (0.0%) |
Income in Eastport
Income Overview in Eastport
Per Capita Income in Eastport is $55,493, while median incomes of families and households are $134,900 and $127,931 respectively.
| Characteristic | Number | Measure |
| Per Capita Income | 2,136 | $55,493 |
| Median Family Income | 568 | $134,900 |
| Mean Family Income | 568 | $178,434 |
| Median Household Income | 698 | $127,931 |
| Mean Household Income | 698 | $160,358 |
| Income Deficit | 568 | $0 |
| Wage / Income Gap (%) | 2,136 | 35.48% |
| Wage / Income Gap ($) | 2,136 | 64.52¢ per $1 |
| Gini / Inequality Index | 2,136 | 0.41 |
Earnings by Sex in Eastport
Average Earnings in Eastport are $65,234, $86,813 for men and $56,012 for women, a difference of 35.5%.
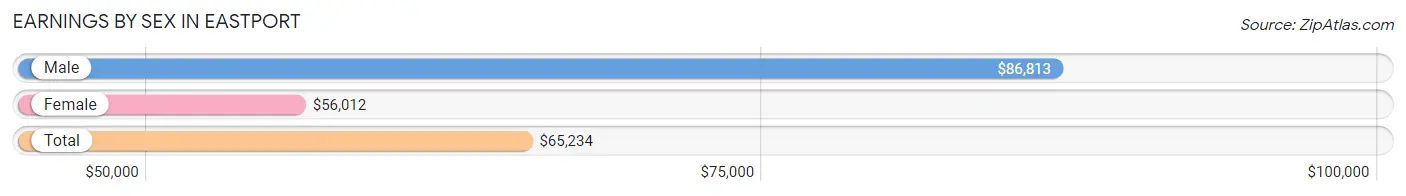
| Sex | Number | Average Earnings |
| Male | 637 (60.4%) | $86,813 |
| Female | 418 (39.6%) | $56,012 |
| Total | 1,055 (100.0%) | $65,234 |
Earnings by Sex by Income Bracket in Eastport
The most common earnings brackets in Eastport are $100,000+ for men (295 | 46.3%) and $100,000+ for women (81 | 19.4%).
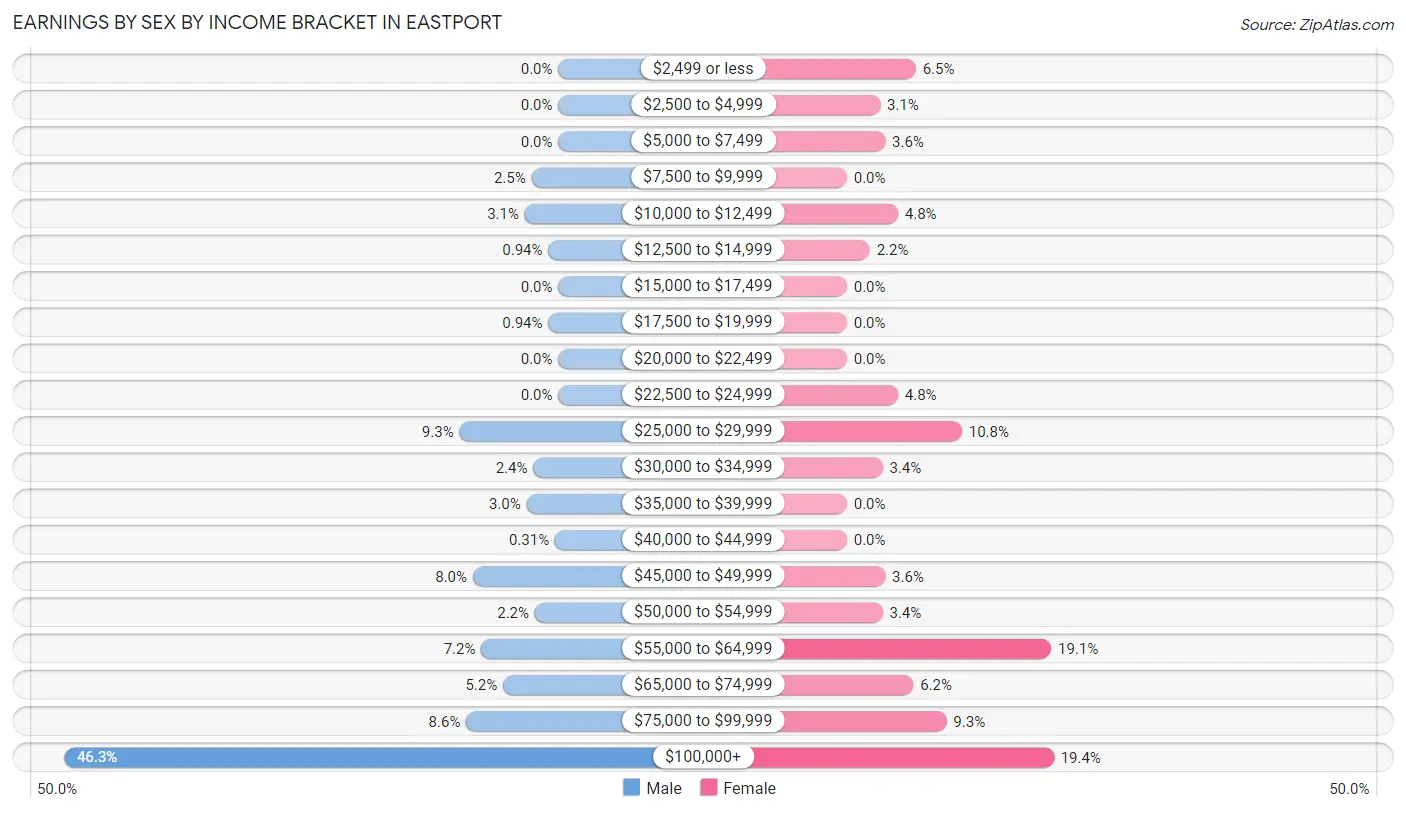
| Income | Male | Female |
| $2,499 or less | 0 (0.0%) | 27 (6.5%) |
| $2,500 to $4,999 | 0 (0.0%) | 13 (3.1%) |
| $5,000 to $7,499 | 0 (0.0%) | 15 (3.6%) |
| $7,500 to $9,999 | 16 (2.5%) | 0 (0.0%) |
| $10,000 to $12,499 | 20 (3.1%) | 20 (4.8%) |
| $12,500 to $14,999 | 6 (0.9%) | 9 (2.1%) |
| $15,000 to $17,499 | 0 (0.0%) | 0 (0.0%) |
| $17,500 to $19,999 | 6 (0.9%) | 0 (0.0%) |
| $20,000 to $22,499 | 0 (0.0%) | 0 (0.0%) |
| $22,500 to $24,999 | 0 (0.0%) | 20 (4.8%) |
| $25,000 to $29,999 | 59 (9.3%) | 45 (10.8%) |
| $30,000 to $34,999 | 15 (2.4%) | 14 (3.4%) |
| $35,000 to $39,999 | 19 (3.0%) | 0 (0.0%) |
| $40,000 to $44,999 | 2 (0.3%) | 0 (0.0%) |
| $45,000 to $49,999 | 51 (8.0%) | 15 (3.6%) |
| $50,000 to $54,999 | 14 (2.2%) | 14 (3.4%) |
| $55,000 to $64,999 | 46 (7.2%) | 80 (19.1%) |
| $65,000 to $74,999 | 33 (5.2%) | 26 (6.2%) |
| $75,000 to $99,999 | 55 (8.6%) | 39 (9.3%) |
| $100,000+ | 295 (46.3%) | 81 (19.4%) |
| Total | 637 (100.0%) | 418 (100.0%) |
Earnings by Sex by Educational Attainment in Eastport
Average earnings in Eastport are $86,938 for men and $56,994 for women, a difference of 34.4%. Men with an educational attainment of graduate degree enjoy the highest average annual earnings of $131,250, while those with less than high school education earn the least with $26,641. Women with an educational attainment of bachelor's degree earn the most with the average annual earnings of $100,083, while those with high school diploma education have the smallest earnings of $48,750.
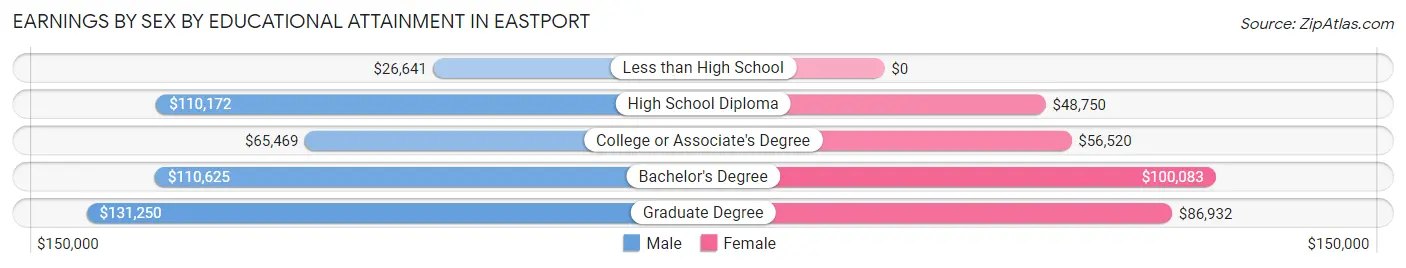
| Educational Attainment | Male Income | Female Income |
| Less than High School | $26,641 | $0 |
| High School Diploma | $110,172 | $48,750 |
| College or Associate's Degree | $65,469 | $56,520 |
| Bachelor's Degree | $110,625 | $100,083 |
| Graduate Degree | $131,250 | $86,932 |
| Total | $86,938 | $56,994 |
Family Income in Eastport
Family Income Brackets in Eastport
According to the Eastport family income data, there are 214 families falling into the $100,000 to $149,999 income range, which is the most common income bracket and makes up 37.7% of all families.
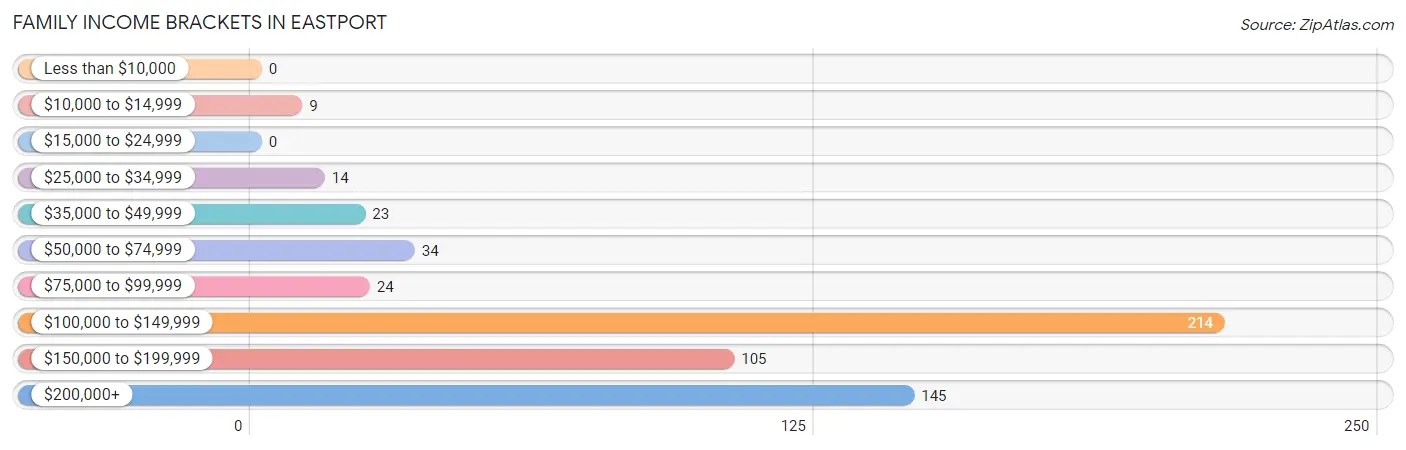
| Income Bracket | # Families | % Families |
| Less than $10,000 | 0 | 0.0% |
| $10,000 to $14,999 | 9 | 1.6% |
| $15,000 to $24,999 | 0 | 0.0% |
| $25,000 to $34,999 | 14 | 2.5% |
| $35,000 to $49,999 | 23 | 4.0% |
| $50,000 to $74,999 | 34 | 6.0% |
| $75,000 to $99,999 | 24 | 4.2% |
| $100,000 to $149,999 | 214 | 37.7% |
| $150,000 to $199,999 | 105 | 18.5% |
| $200,000+ | 145 | 25.5% |
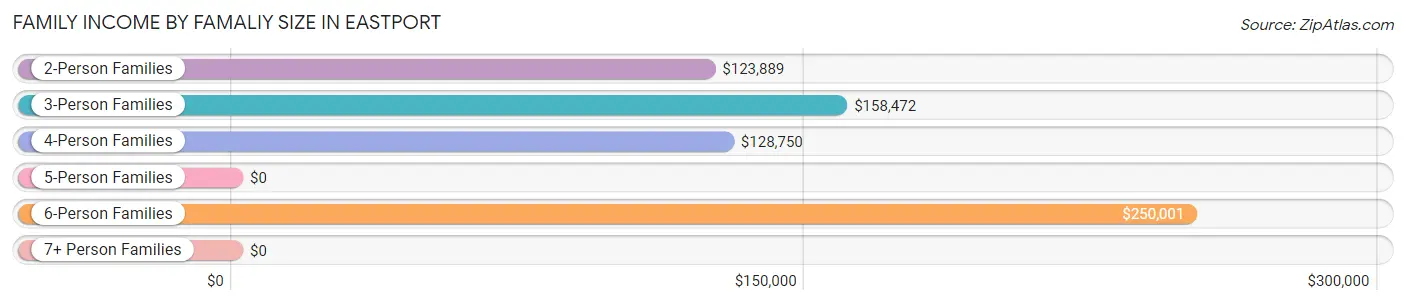
Family Income by Famaliy Size in Eastport
6-person families (32 | 5.6%) account for the highest median family income in Eastport with $250,001 per family, while 2-person families (254 | 44.7%) have the highest median income of $61,944 per family member.
| Income Bracket | # Families | Median Income |
| 2-Person Families | 254 (44.7%) | $123,889 |
| 3-Person Families | 117 (20.6%) | $158,472 |
| 4-Person Families | 151 (26.6%) | $128,750 |
| 5-Person Families | 14 (2.5%) | $0 |
| 6-Person Families | 32 (5.6%) | $250,001 |
| 7+ Person Families | 0 (0.0%) | $0 |
| Total | 568 (100.0%) | $134,900 |
Family Income by Number of Earners in Eastport
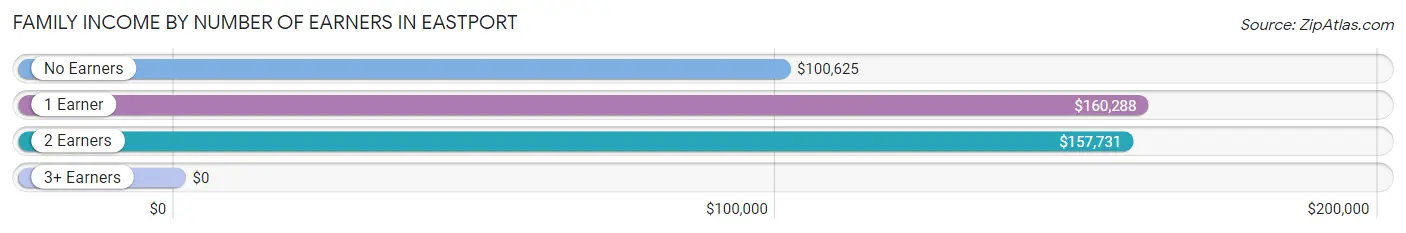
| Number of Earners | # Families | Median Income |
| No Earners | 106 (18.7%) | $100,625 |
| 1 Earner | 147 (25.9%) | $160,288 |
| 2 Earners | 287 (50.5%) | $157,731 |
| 3+ Earners | 28 (4.9%) | $0 |
| Total | 568 (100.0%) | $134,900 |
Household Income in Eastport
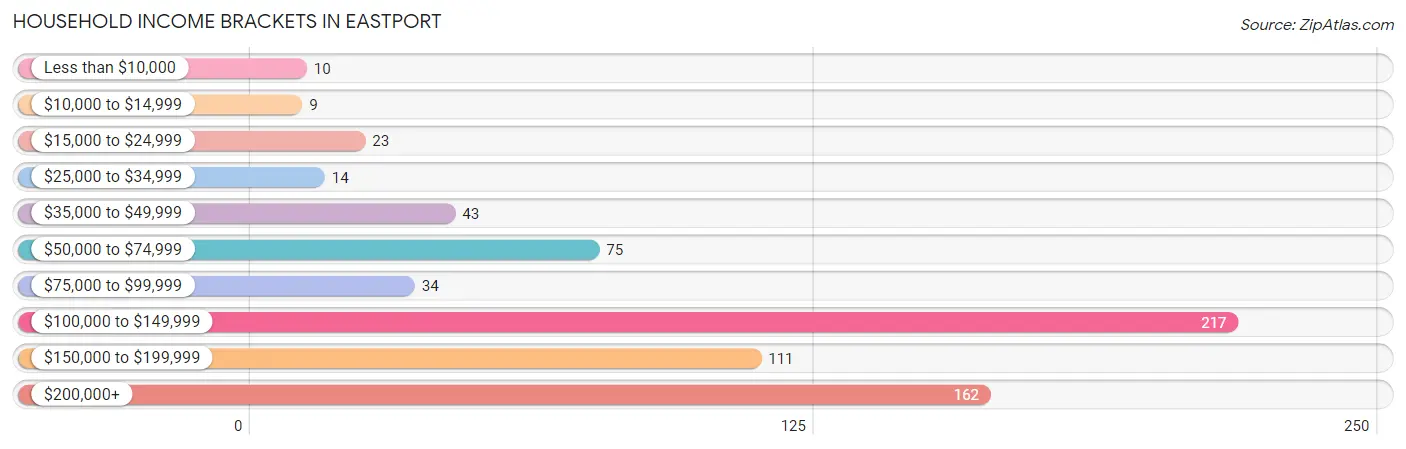
Household Income Brackets in Eastport
With 217 households falling in the category, the $100,000 to $149,999 income range is the most frequent in Eastport, accounting for 31.1% of all households. In contrast, only 9 households (1.3%) fall into the $10,000 to $14,999 income bracket, making it the least populous group.
| Income Bracket | # Households | % Households |
| Less than $10,000 | 10 | 1.4% |
| $10,000 to $14,999 | 9 | 1.3% |
| $15,000 to $24,999 | 23 | 3.3% |
| $25,000 to $34,999 | 14 | 2.0% |
| $35,000 to $49,999 | 43 | 6.2% |
| $50,000 to $74,999 | 75 | 10.7% |
| $75,000 to $99,999 | 34 | 4.9% |
| $100,000 to $149,999 | 217 | 31.1% |
| $150,000 to $199,999 | 111 | 15.9% |
| $200,000+ | 162 | 23.2% |
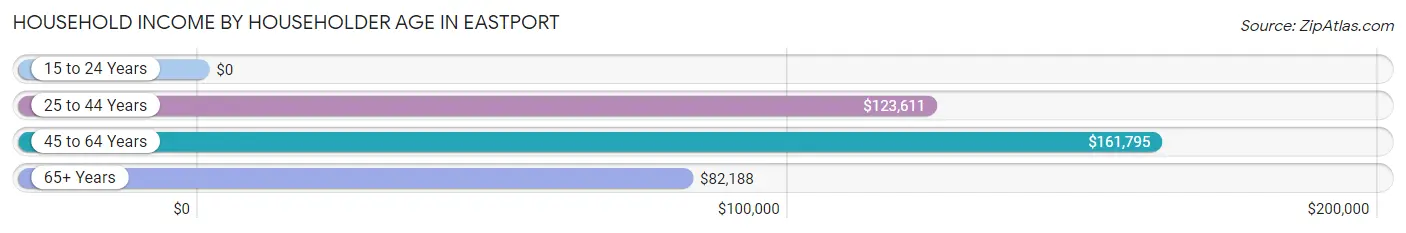
Household Income by Householder Age in Eastport
The median household income in Eastport is $127,931, with the highest median household income of $161,795 found in the 45 to 64 years age bracket for the primary householder. A total of 284 households (40.7%) fall into this category.
| Income Bracket | # Households | Median Income |
| 15 to 24 Years | 0 (0.0%) | $0 |
| 25 to 44 Years | 168 (24.1%) | $123,611 |
| 45 to 64 Years | 284 (40.7%) | $161,795 |
| 65+ Years | 246 (35.2%) | $82,188 |
| Total | 698 (100.0%) | $127,931 |
Poverty in Eastport
Income Below Poverty by Sex and Age in Eastport
With 5.4% poverty level for males and 2.7% for females among the residents of Eastport, 12 to 14 year old males and 18 to 24 year old females are the most vulnerable to poverty, with 6 males (100.0%) and 16 females (44.4%) in their respective age groups living below the poverty level.
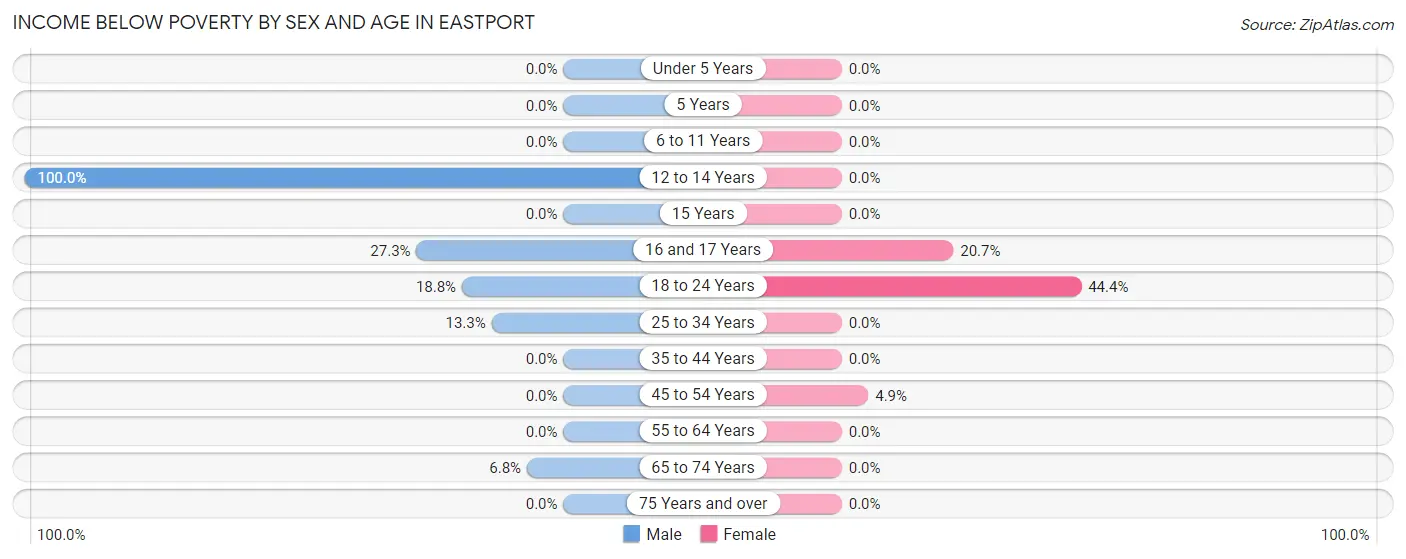
| Age Bracket | Male | Female |
| Under 5 Years | 0 (0.0%) | 0 (0.0%) |
| 5 Years | 0 (0.0%) | 0 (0.0%) |
| 6 to 11 Years | 0 (0.0%) | 0 (0.0%) |
| 12 to 14 Years | 6 (100.0%) | 0 (0.0%) |
| 15 Years | 0 (0.0%) | 0 (0.0%) |
| 16 and 17 Years | 6 (27.3%) | 6 (20.7%) |
| 18 to 24 Years | 16 (18.8%) | 16 (44.4%) |
| 25 to 34 Years | 16 (13.3%) | 0 (0.0%) |
| 35 to 44 Years | 0 (0.0%) | 0 (0.0%) |
| 45 to 54 Years | 0 (0.0%) | 9 (4.9%) |
| 55 to 64 Years | 0 (0.0%) | 0 (0.0%) |
| 65 to 74 Years | 10 (6.8%) | 0 (0.0%) |
| 75 Years and over | 0 (0.0%) | 0 (0.0%) |
| Total | 54 (5.4%) | 31 (2.7%) |
Income Above Poverty by Sex and Age in Eastport
According to the poverty statistics in Eastport, males aged under 5 years and females aged under 5 years are the age groups that are most secure financially, with 100.0% of males and 100.0% of females in these age groups living above the poverty line.
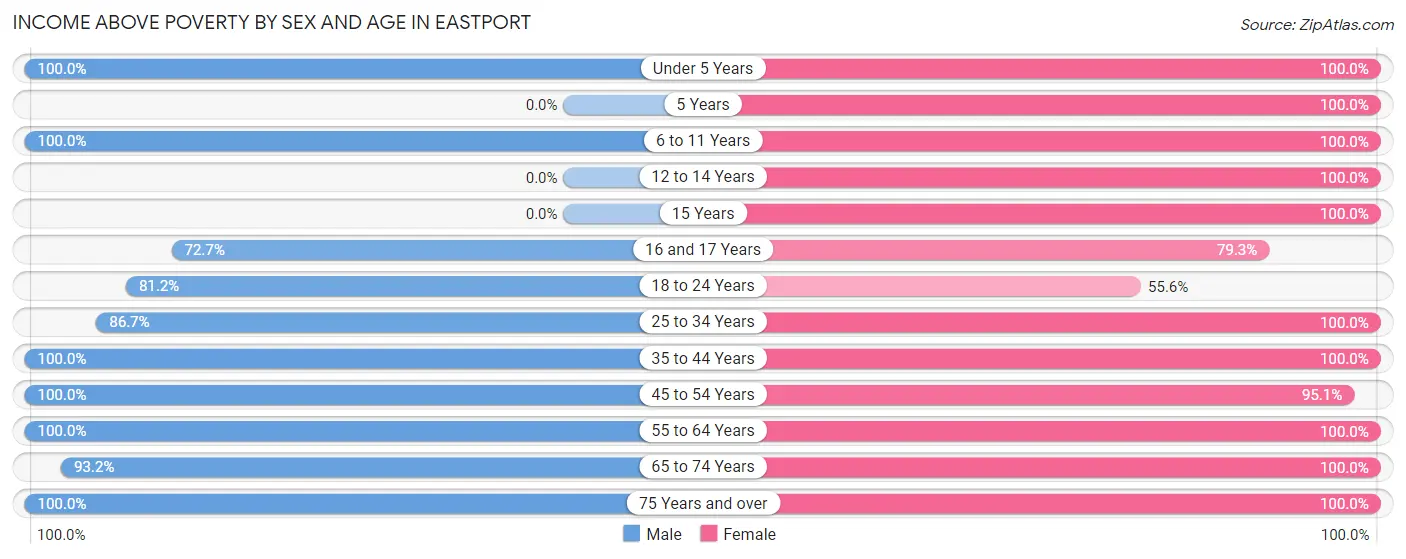
| Age Bracket | Male | Female |
| Under 5 Years | 46 (100.0%) | 46 (100.0%) |
| 5 Years | 0 (0.0%) | 15 (100.0%) |
| 6 to 11 Years | 84 (100.0%) | 145 (100.0%) |
| 12 to 14 Years | 0 (0.0%) | 31 (100.0%) |
| 15 Years | 0 (0.0%) | 7 (100.0%) |
| 16 and 17 Years | 16 (72.7%) | 23 (79.3%) |
| 18 to 24 Years | 69 (81.2%) | 20 (55.6%) |
| 25 to 34 Years | 104 (86.7%) | 155 (100.0%) |
| 35 to 44 Years | 141 (100.0%) | 133 (100.0%) |
| 45 to 54 Years | 185 (100.0%) | 174 (95.1%) |
| 55 to 64 Years | 101 (100.0%) | 147 (100.0%) |
| 65 to 74 Years | 138 (93.2%) | 138 (100.0%) |
| 75 Years and over | 60 (100.0%) | 73 (100.0%) |
| Total | 944 (94.6%) | 1,107 (97.3%) |
Income Below Poverty Among Married-Couple Families in Eastport
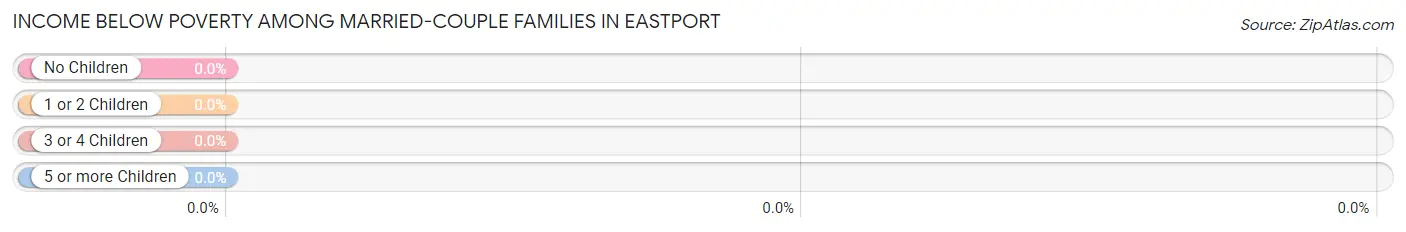
| Children | Above Poverty | Below Poverty |
| No Children | 326 (100.0%) | 0 (0.0%) |
| 1 or 2 Children | 175 (100.0%) | 0 (0.0%) |
| 3 or 4 Children | 19 (100.0%) | 0 (0.0%) |
| 5 or more Children | 0 (0.0%) | 0 (0.0%) |
| Total | 520 (100.0%) | 0 (0.0%) |
Income Below Poverty Among Single-Parent Households in Eastport
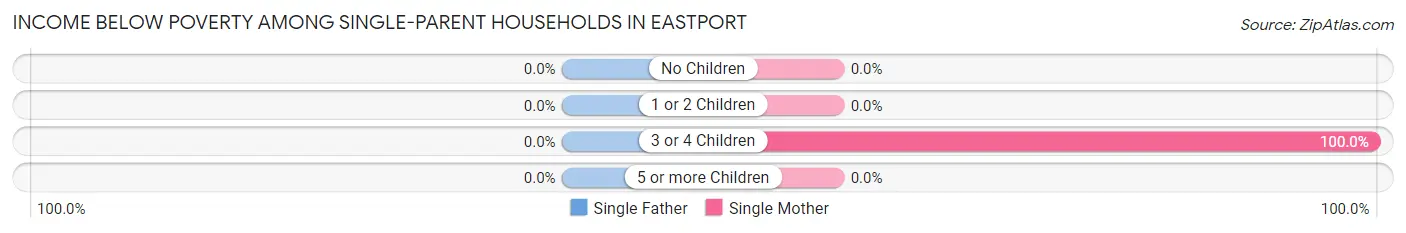
| Children | Single Father | Single Mother |
| No Children | 0 (0.0%) | 0 (0.0%) |
| 1 or 2 Children | 0 (0.0%) | 0 (0.0%) |
| 3 or 4 Children | 0 (0.0%) | 9 (100.0%) |
| 5 or more Children | 0 (0.0%) | 0 (0.0%) |
| Total | 0 (0.0%) | 9 (18.8%) |
Income Below Poverty Among Married-Couple vs Single-Parent Households in Eastport
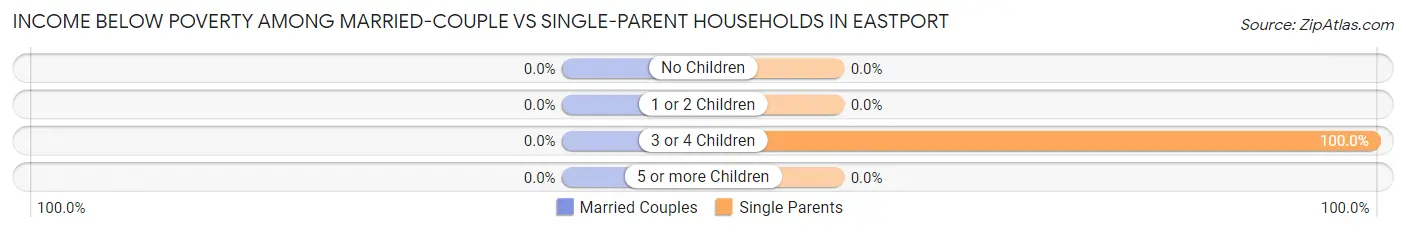
| Children | Married-Couple Families | Single-Parent Households |
| No Children | 0 (0.0%) | 0 (0.0%) |
| 1 or 2 Children | 0 (0.0%) | 0 (0.0%) |
| 3 or 4 Children | 0 (0.0%) | 9 (100.0%) |
| 5 or more Children | 0 (0.0%) | 0 (0.0%) |
| Total | 0 (0.0%) | 9 (18.8%) |
Employment Characteristics in Eastport
Employment by Class of Employer in Eastport
Among the 1,020 employed individuals in Eastport, private company employees (656 | 64.3%), local government employees (99 | 9.7%), and state government employees (89 | 8.7%) make up the most common classes of employment.
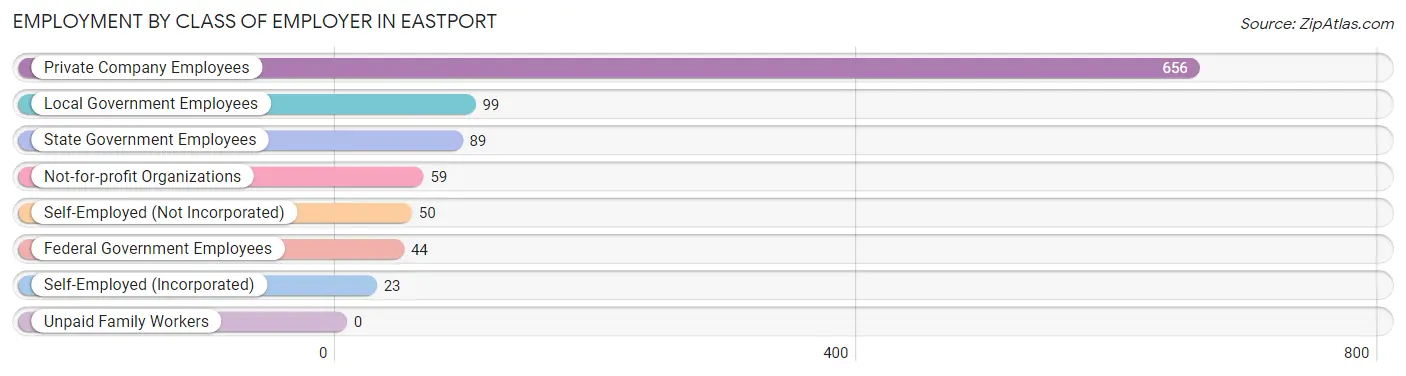
| Employer Class | # Employees | % Employees |
| Private Company Employees | 656 | 64.3% |
| Self-Employed (Incorporated) | 23 | 2.2% |
| Self-Employed (Not Incorporated) | 50 | 4.9% |
| Not-for-profit Organizations | 59 | 5.8% |
| Local Government Employees | 99 | 9.7% |
| State Government Employees | 89 | 8.7% |
| Federal Government Employees | 44 | 4.3% |
| Unpaid Family Workers | 0 | 0.0% |
| Total | 1,020 | 100.0% |
Employment Status by Age in Eastport
According to the labor force statistics for Eastport, out of the total population over 16 years of age (1,756), 59.7% or 1,048 individuals are in the labor force, with 2.8% or 29 of them unemployed. The age group with the highest labor force participation rate is 20 to 24 years, with 100.0% or 66 individuals in the labor force. Within the labor force, the 30 to 34 years age range has the highest percentage of unemployed individuals, with 20.2% or 20 of them being unemployed.
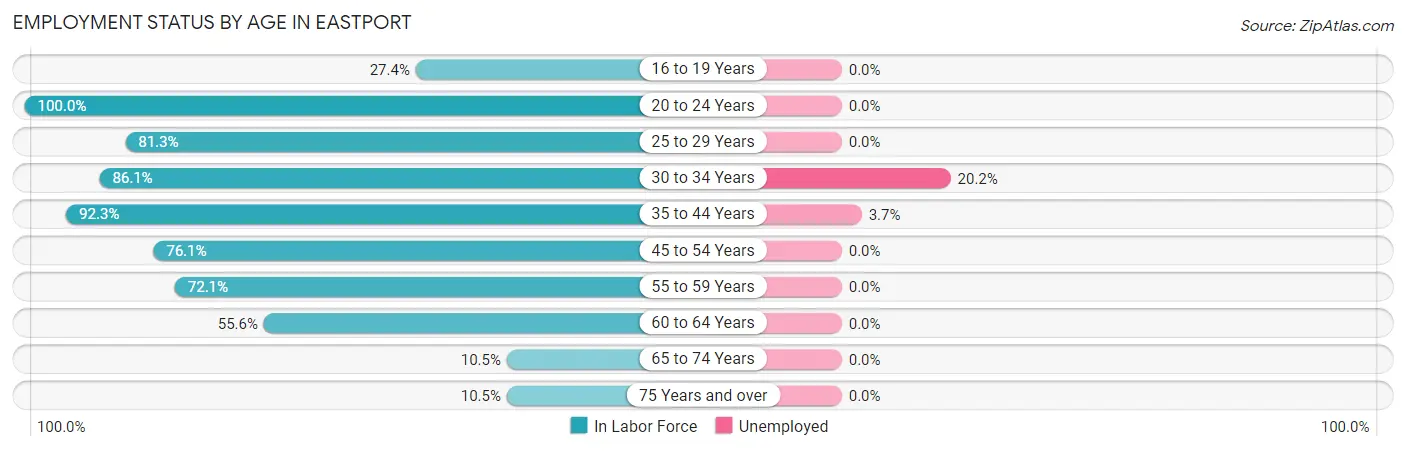
| Age Bracket | In Labor Force | Unemployed |
| 16 to 19 Years | 29 (27.4%) | 0 (0.0%) |
| 20 to 24 Years | 66 (100.0%) | 0 (0.0%) |
| 25 to 29 Years | 130 (81.3%) | 0 (0.0%) |
| 30 to 34 Years | 99 (86.1%) | 20 (20.2%) |
| 35 to 44 Years | 253 (92.3%) | 9 (3.7%) |
| 45 to 54 Years | 280 (76.1%) | 0 (0.0%) |
| 55 to 59 Years | 44 (72.1%) | 0 (0.0%) |
| 60 to 64 Years | 104 (55.6%) | 0 (0.0%) |
| 65 to 74 Years | 30 (10.5%) | 0 (0.0%) |
| 75 Years and over | 14 (10.5%) | 0 (0.0%) |
| Total | 1,048 (59.7%) | 29 (2.8%) |
Employment Status by Educational Attainment in Eastport
According to labor force statistics for Eastport, 78.1% of individuals (910) out of the total population between 25 and 64 years of age (1,165) are in the labor force, with 3.2% or 29 of them being unemployed. The group with the highest labor force participation rate are those with the educational attainment of college / associate degree, with 89.1% or 335 individuals in the labor force. Within the labor force, individuals with bachelor's degree or higher education have the highest percentage of unemployment, with 7.9% or 29 of them being unemployed.
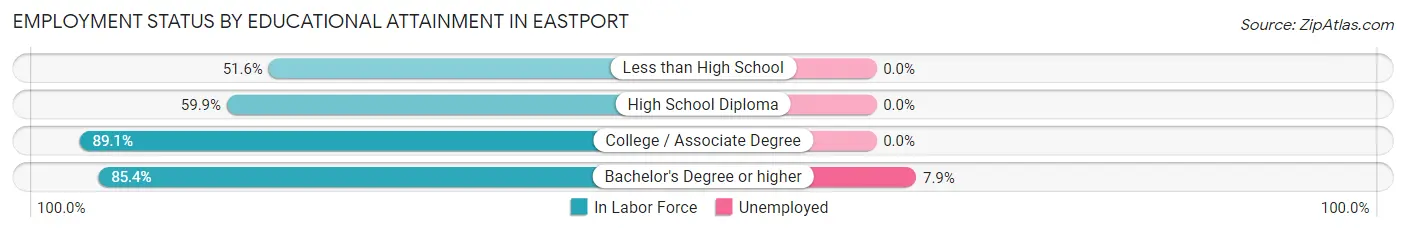
| Educational Attainment | In Labor Force | Unemployed |
| Less than High School | 49 (51.6%) | 0 (0.0%) |
| High School Diploma | 157 (59.9%) | 0 (0.0%) |
| College / Associate Degree | 335 (89.1%) | 0 (0.0%) |
| Bachelor's Degree or higher | 369 (85.4%) | 34 (7.9%) |
| Total | 910 (78.1%) | 37 (3.2%) |
Employment Occupations by Sex in Eastport
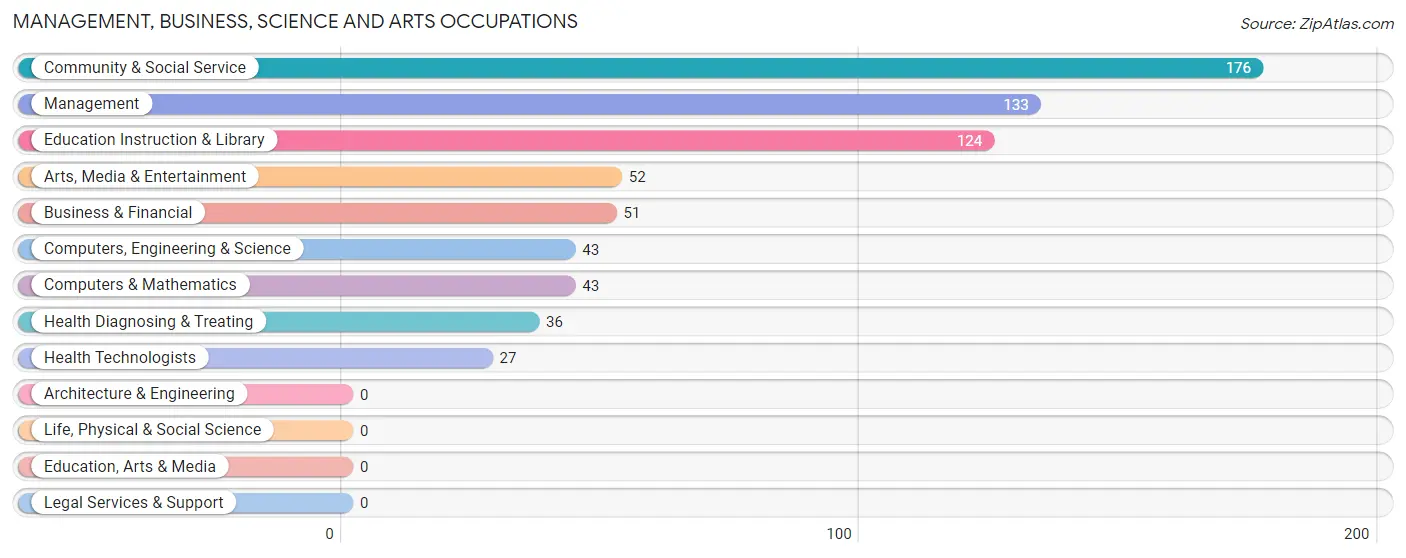
Management, Business, Science and Arts Occupations
The most common Management, Business, Science and Arts occupations in Eastport are Community & Social Service (176 | 17.4%), Management (133 | 13.1%), Education Instruction & Library (124 | 12.2%), Arts, Media & Entertainment (52 | 5.1%), and Business & Financial (51 | 5.0%).
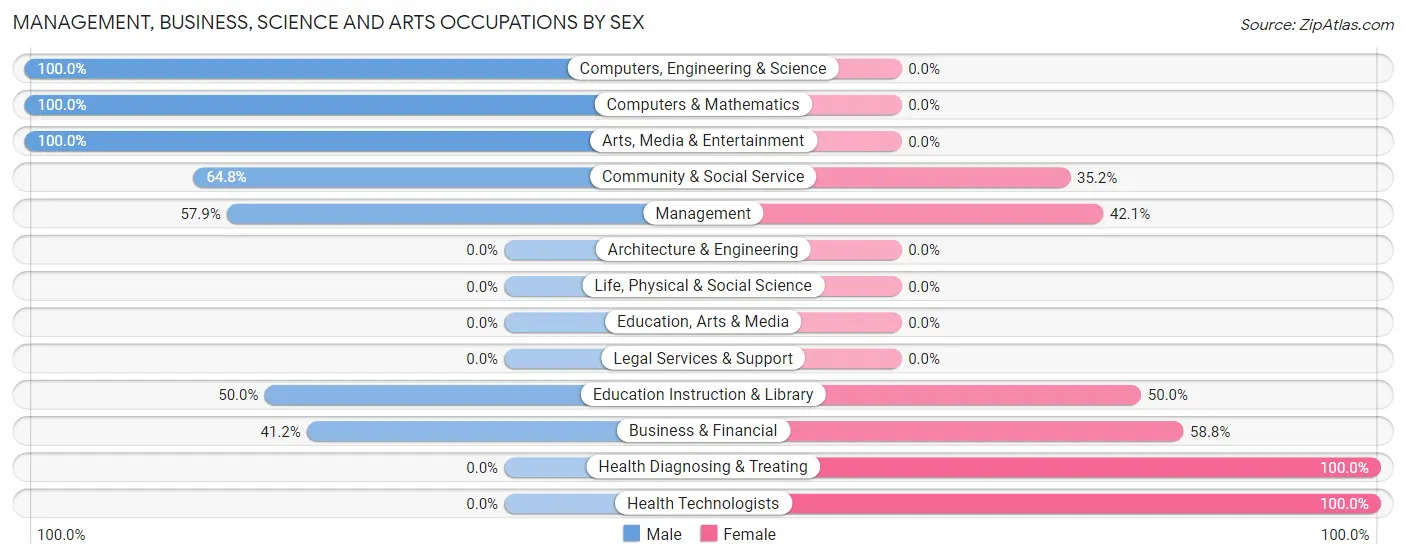
Management, Business, Science and Arts Occupations by Sex
Within the Management, Business, Science and Arts occupations in Eastport, the most male-oriented occupations are Computers, Engineering & Science (100.0%), Computers & Mathematics (100.0%), and Arts, Media & Entertainment (100.0%), while the most female-oriented occupations are Health Diagnosing & Treating (100.0%), Health Technologists (100.0%), and Business & Financial (58.8%).
| Occupation | Male | Female |
| Management | 77 (57.9%) | 56 (42.1%) |
| Business & Financial | 21 (41.2%) | 30 (58.8%) |
| Computers, Engineering & Science | 43 (100.0%) | 0 (0.0%) |
| Computers & Mathematics | 43 (100.0%) | 0 (0.0%) |
| Architecture & Engineering | 0 (0.0%) | 0 (0.0%) |
| Life, Physical & Social Science | 0 (0.0%) | 0 (0.0%) |
| Community & Social Service | 114 (64.8%) | 62 (35.2%) |
| Education, Arts & Media | 0 (0.0%) | 0 (0.0%) |
| Legal Services & Support | 0 (0.0%) | 0 (0.0%) |
| Education Instruction & Library | 62 (50.0%) | 62 (50.0%) |
| Arts, Media & Entertainment | 52 (100.0%) | 0 (0.0%) |
| Health Diagnosing & Treating | 0 (0.0%) | 36 (100.0%) |
| Health Technologists | 0 (0.0%) | 27 (100.0%) |
| Total (Category) | 255 (58.1%) | 184 (41.9%) |
| Total (Overall) | 630 (62.2%) | 383 (37.8%) |
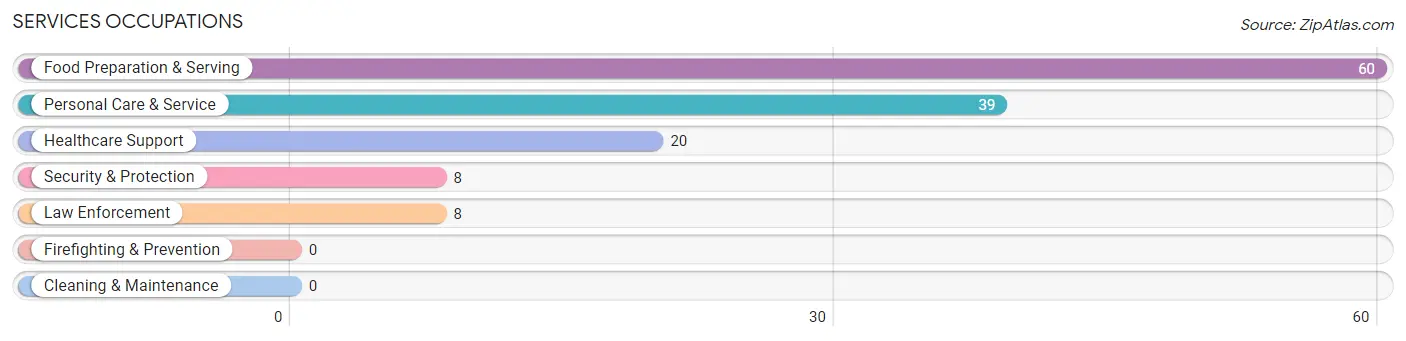
Services Occupations
The most common Services occupations in Eastport are Food Preparation & Serving (60 | 5.9%), Personal Care & Service (39 | 3.8%), Healthcare Support (20 | 2.0%), Security & Protection (8 | 0.8%), and Law Enforcement (8 | 0.8%).
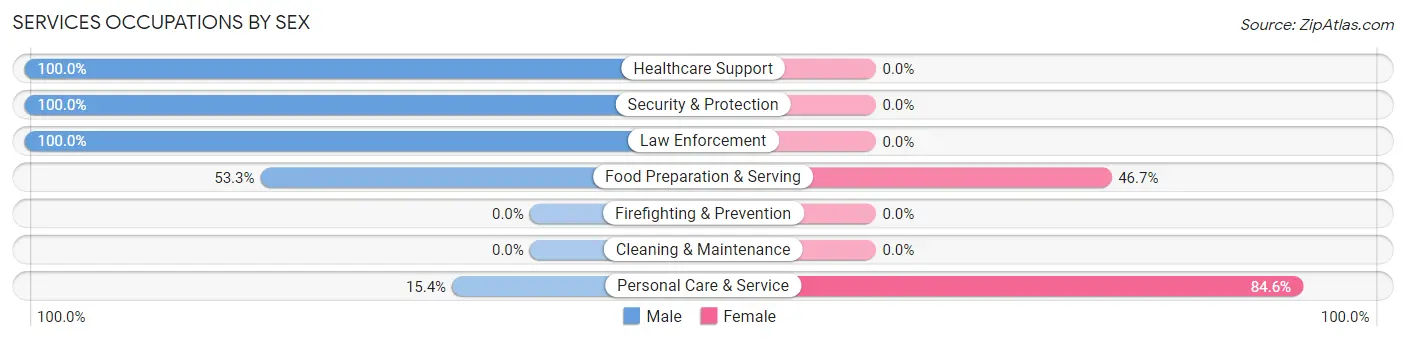
Services Occupations by Sex
Within the Services occupations in Eastport, the most male-oriented occupations are Healthcare Support (100.0%), Security & Protection (100.0%), and Law Enforcement (100.0%), while the most female-oriented occupations are Personal Care & Service (84.6%), and Food Preparation & Serving (46.7%).
| Occupation | Male | Female |
| Healthcare Support | 20 (100.0%) | 0 (0.0%) |
| Security & Protection | 8 (100.0%) | 0 (0.0%) |
| Firefighting & Prevention | 0 (0.0%) | 0 (0.0%) |
| Law Enforcement | 8 (100.0%) | 0 (0.0%) |
| Food Preparation & Serving | 32 (53.3%) | 28 (46.7%) |
| Cleaning & Maintenance | 0 (0.0%) | 0 (0.0%) |
| Personal Care & Service | 6 (15.4%) | 33 (84.6%) |
| Total (Category) | 66 (52.0%) | 61 (48.0%) |
| Total (Overall) | 630 (62.2%) | 383 (37.8%) |
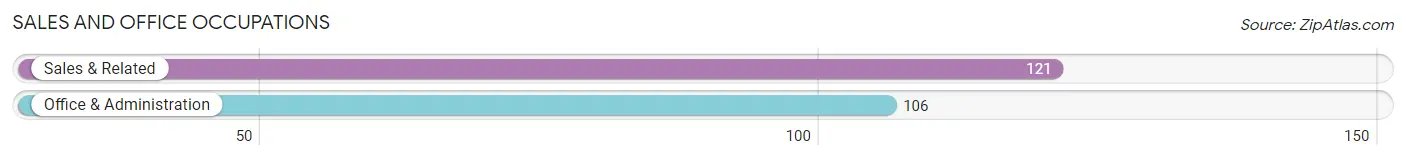
Sales and Office Occupations
The most common Sales and Office occupations in Eastport are Sales & Related (121 | 11.9%), and Office & Administration (106 | 10.5%).
Sales and Office Occupations by Sex
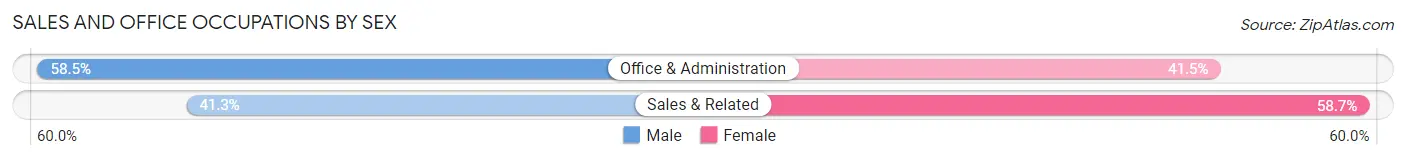
| Occupation | Male | Female |
| Sales & Related | 50 (41.3%) | 71 (58.7%) |
| Office & Administration | 62 (58.5%) | 44 (41.5%) |
| Total (Category) | 112 (49.3%) | 115 (50.7%) |
| Total (Overall) | 630 (62.2%) | 383 (37.8%) |
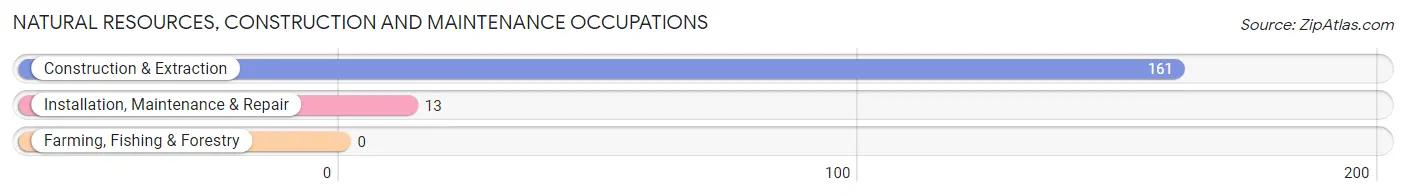
Natural Resources, Construction and Maintenance Occupations
The most common Natural Resources, Construction and Maintenance occupations in Eastport are Construction & Extraction (161 | 15.9%), and Installation, Maintenance & Repair (13 | 1.3%).
Natural Resources, Construction and Maintenance Occupations by Sex
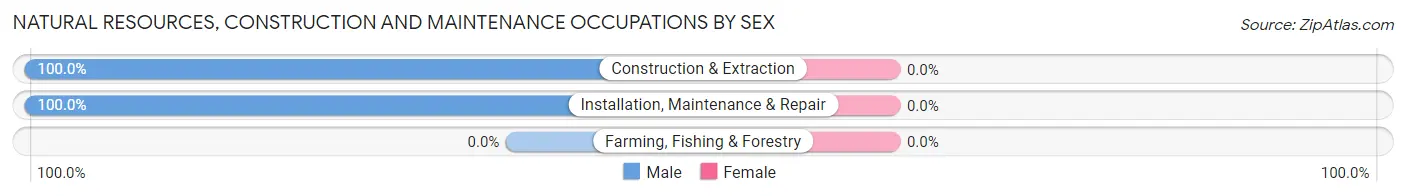
| Occupation | Male | Female |
| Farming, Fishing & Forestry | 0 (0.0%) | 0 (0.0%) |
| Construction & Extraction | 161 (100.0%) | 0 (0.0%) |
| Installation, Maintenance & Repair | 13 (100.0%) | 0 (0.0%) |
| Total (Category) | 174 (100.0%) | 0 (0.0%) |
| Total (Overall) | 630 (62.2%) | 383 (37.8%) |
Production, Transportation and Moving Occupations
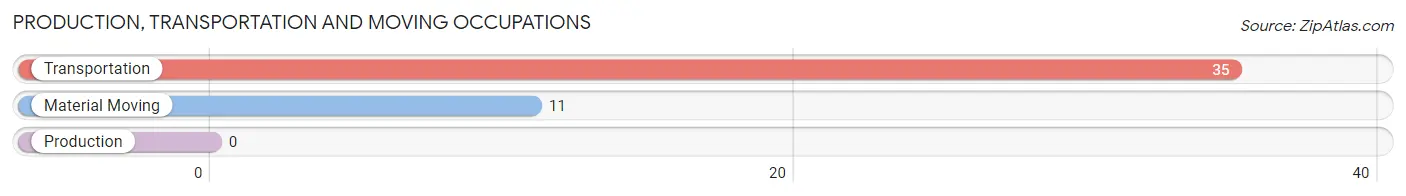
The most common Production, Transportation and Moving occupations in Eastport are Transportation (35 | 3.5%), and Material Moving (11 | 1.1%).
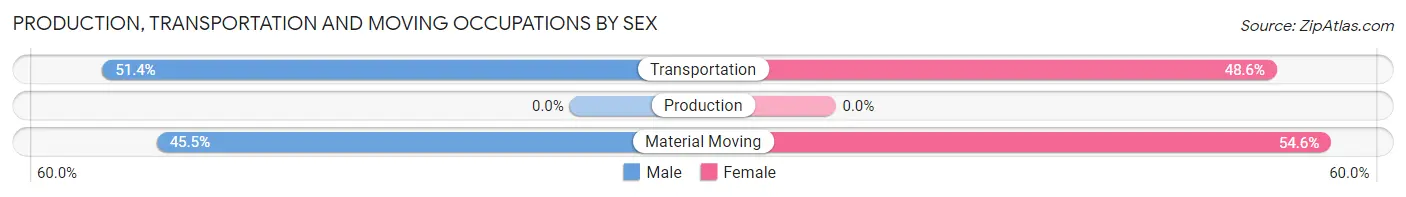
Production, Transportation and Moving Occupations by Sex
| Occupation | Male | Female |
| Production | 0 (0.0%) | 0 (0.0%) |
| Transportation | 18 (51.4%) | 17 (48.6%) |
| Material Moving | 5 (45.5%) | 6 (54.5%) |
| Total (Category) | 23 (50.0%) | 23 (50.0%) |
| Total (Overall) | 630 (62.2%) | 383 (37.8%) |
Employment Industries by Sex in Eastport
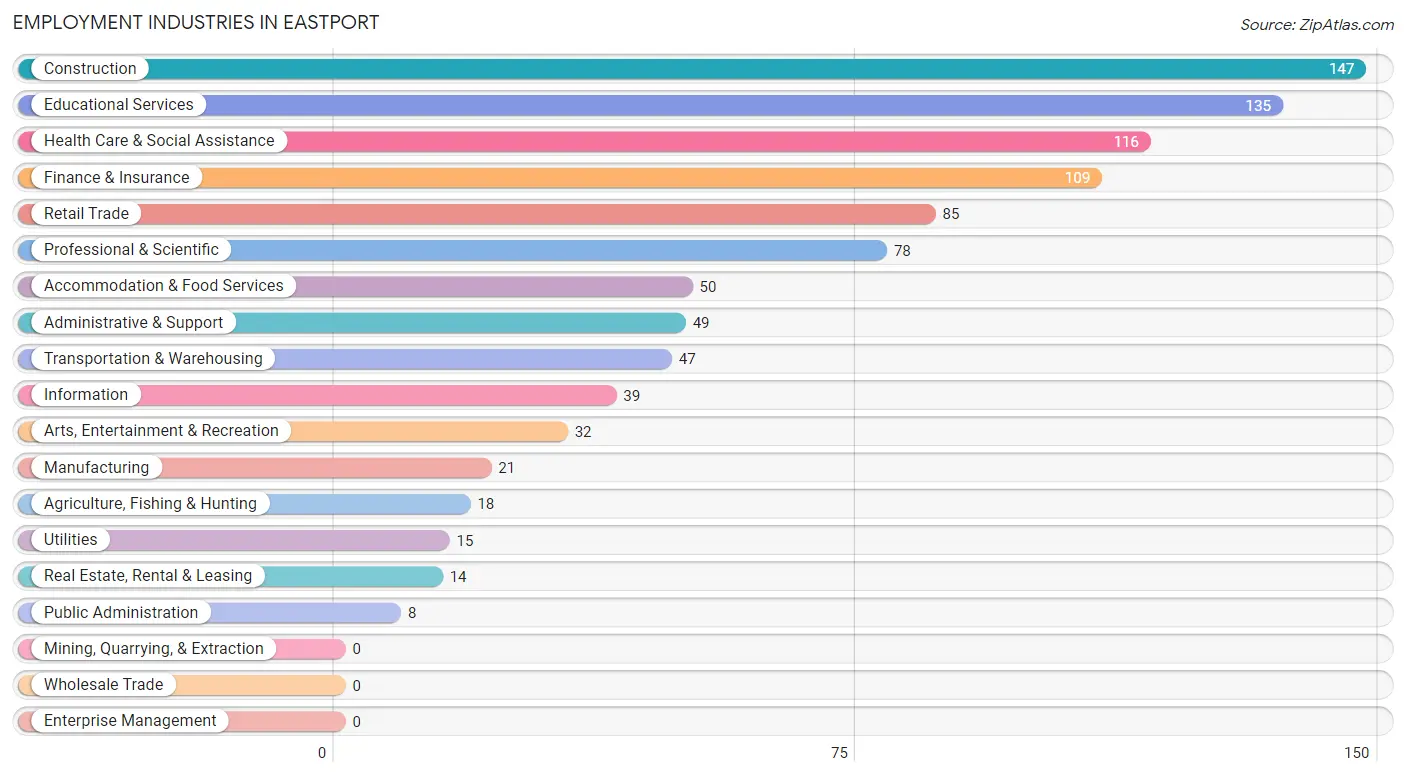
Employment Industries in Eastport
The major employment industries in Eastport include Construction (147 | 14.5%), Educational Services (135 | 13.3%), Health Care & Social Assistance (116 | 11.5%), Finance & Insurance (109 | 10.8%), and Retail Trade (85 | 8.4%).
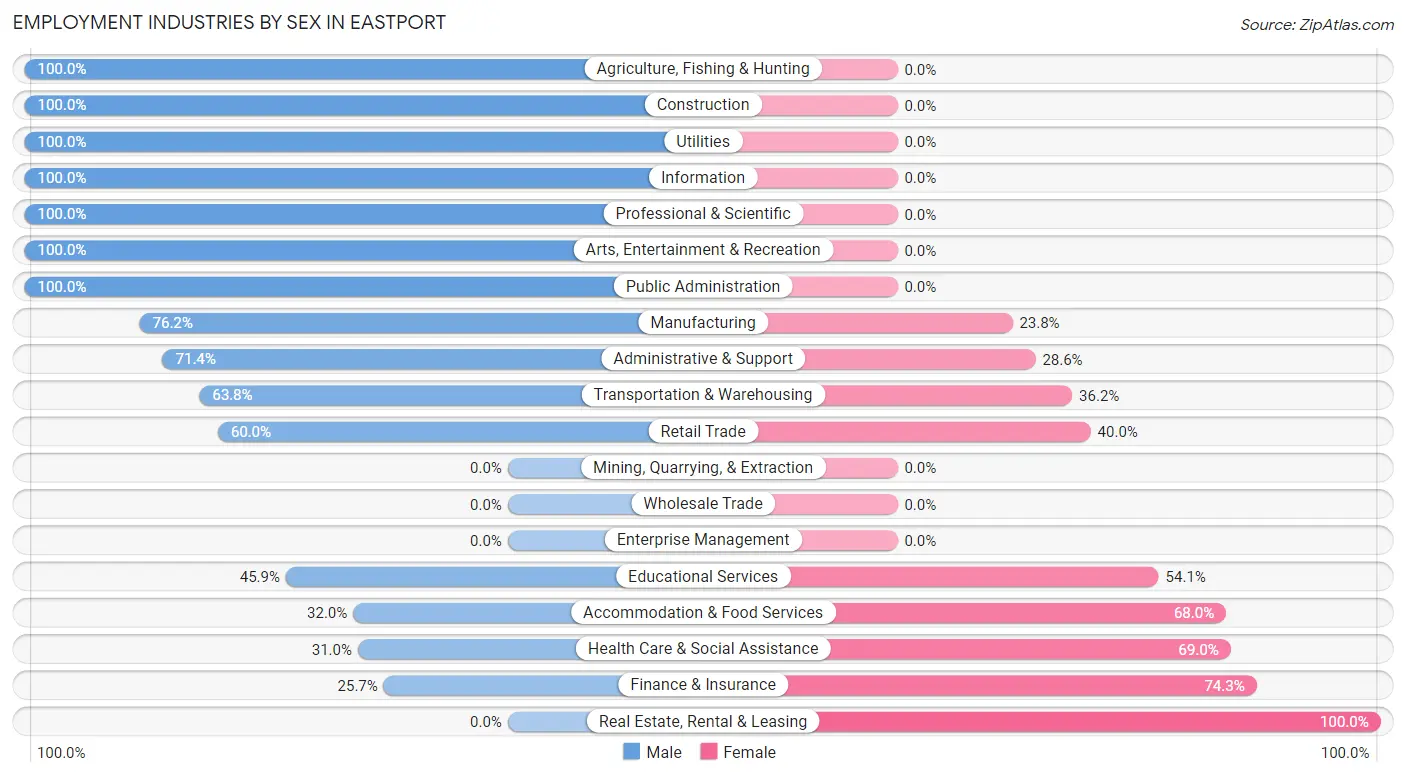
Employment Industries by Sex in Eastport
The Eastport industries that see more men than women are Agriculture, Fishing & Hunting (100.0%), Construction (100.0%), and Utilities (100.0%), whereas the industries that tend to have a higher number of women are Real Estate, Rental & Leasing (100.0%), Finance & Insurance (74.3%), and Health Care & Social Assistance (69.0%).
| Industry | Male | Female |
| Agriculture, Fishing & Hunting | 18 (100.0%) | 0 (0.0%) |
| Mining, Quarrying, & Extraction | 0 (0.0%) | 0 (0.0%) |
| Construction | 147 (100.0%) | 0 (0.0%) |
| Manufacturing | 16 (76.2%) | 5 (23.8%) |
| Wholesale Trade | 0 (0.0%) | 0 (0.0%) |
| Retail Trade | 51 (60.0%) | 34 (40.0%) |
| Transportation & Warehousing | 30 (63.8%) | 17 (36.2%) |
| Utilities | 15 (100.0%) | 0 (0.0%) |
| Information | 39 (100.0%) | 0 (0.0%) |
| Finance & Insurance | 28 (25.7%) | 81 (74.3%) |
| Real Estate, Rental & Leasing | 0 (0.0%) | 14 (100.0%) |
| Professional & Scientific | 78 (100.0%) | 0 (0.0%) |
| Enterprise Management | 0 (0.0%) | 0 (0.0%) |
| Administrative & Support | 35 (71.4%) | 14 (28.6%) |
| Educational Services | 62 (45.9%) | 73 (54.1%) |
| Health Care & Social Assistance | 36 (31.0%) | 80 (69.0%) |
| Arts, Entertainment & Recreation | 32 (100.0%) | 0 (0.0%) |
| Accommodation & Food Services | 16 (32.0%) | 34 (68.0%) |
| Public Administration | 8 (100.0%) | 0 (0.0%) |
| Total | 630 (62.2%) | 383 (37.8%) |
Education in Eastport
School Enrollment in Eastport
The most common levels of schooling among the 440 students in Eastport are elementary school (153 | 34.8%), middle school (87 | 19.8%), and high school (60 | 13.6%).
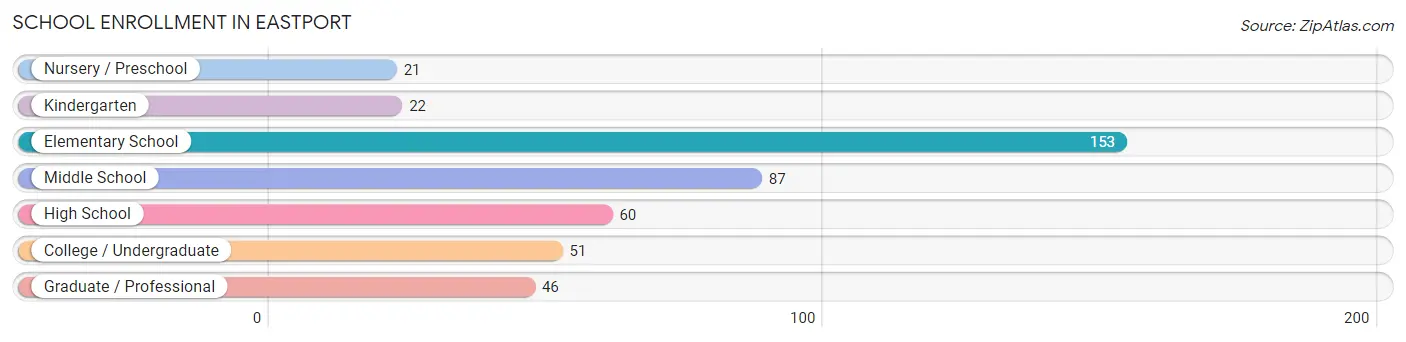
| School Level | # Students | % Students |
| Nursery / Preschool | 21 | 4.8% |
| Kindergarten | 22 | 5.0% |
| Elementary School | 153 | 34.8% |
| Middle School | 87 | 19.8% |
| High School | 60 | 13.6% |
| College / Undergraduate | 51 | 11.6% |
| Graduate / Professional | 46 | 10.4% |
| Total | 440 | 100.0% |
School Enrollment by Age by Funding Source in Eastport
Out of a total of 440 students who are enrolled in schools in Eastport, 111 (25.2%) attend a private institution, while the remaining 329 (74.8%) are enrolled in public schools. The age group of 25 to 34 year olds has the highest likelihood of being enrolled in private schools, with 33 (100.0% in the age bracket) enrolled. Conversely, the age group of 5 to 9 year old has the lowest likelihood of being enrolled in a private school, with 156 (100.0% in the age bracket) attending a public institution.
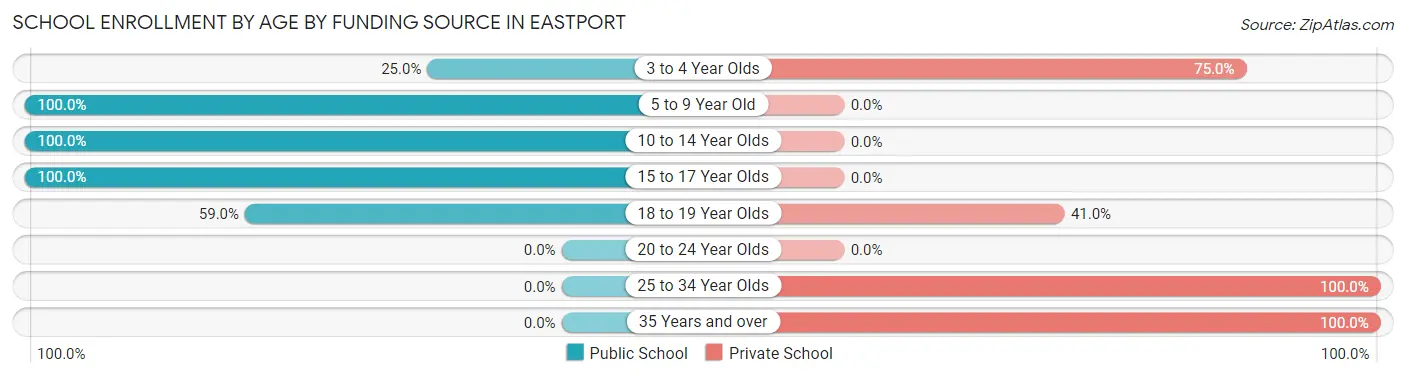
| Age Bracket | Public School | Private School |
| 3 to 4 Year Olds | 7 (25.0%) | 21 (75.0%) |
| 5 to 9 Year Old | 156 (100.0%) | 0 (0.0%) |
| 10 to 14 Year Olds | 99 (100.0%) | 0 (0.0%) |
| 15 to 17 Year Olds | 44 (100.0%) | 0 (0.0%) |
| 18 to 19 Year Olds | 23 (59.0%) | 16 (41.0%) |
| 20 to 24 Year Olds | 0 (0.0%) | 0 (0.0%) |
| 25 to 34 Year Olds | 0 (0.0%) | 33 (100.0%) |
| 35 Years and over | 0 (0.0%) | 41 (100.0%) |
| Total | 329 (74.8%) | 111 (25.2%) |
Educational Attainment by Field of Study in Eastport
Business (114 | 19.5%), social sciences (79 | 13.5%), literature & languages (69 | 11.8%), bio, nature & agricultural (47 | 8.0%), and psychology (43 | 7.3%) are the most common fields of study among 586 individuals in Eastport who have obtained a bachelor's degree or higher.
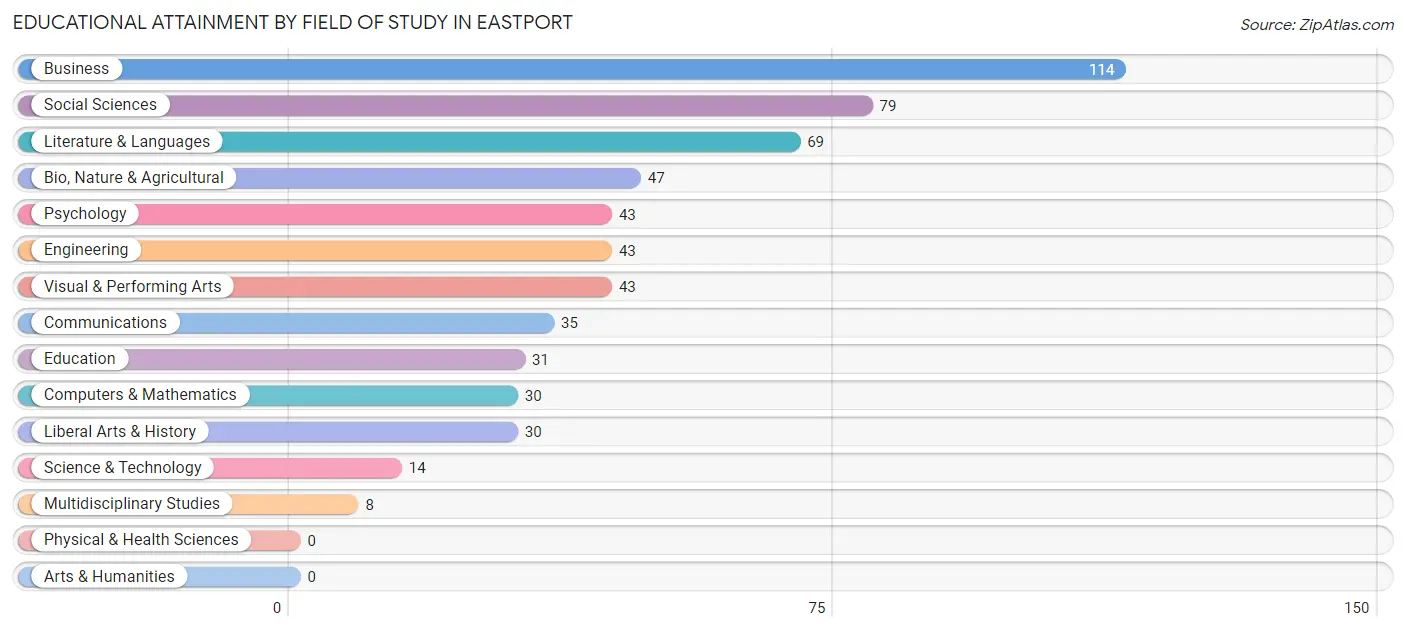
| Field of Study | # Graduates | % Graduates |
| Computers & Mathematics | 30 | 5.1% |
| Bio, Nature & Agricultural | 47 | 8.0% |
| Physical & Health Sciences | 0 | 0.0% |
| Psychology | 43 | 7.3% |
| Social Sciences | 79 | 13.5% |
| Engineering | 43 | 7.3% |
| Multidisciplinary Studies | 8 | 1.4% |
| Science & Technology | 14 | 2.4% |
| Business | 114 | 19.5% |
| Education | 31 | 5.3% |
| Literature & Languages | 69 | 11.8% |
| Liberal Arts & History | 30 | 5.1% |
| Visual & Performing Arts | 43 | 7.3% |
| Communications | 35 | 6.0% |
| Arts & Humanities | 0 | 0.0% |
| Total | 586 | 100.0% |
Transportation & Commute in Eastport
Vehicle Availability by Sex in Eastport
The most prevalent vehicle ownership categories in Eastport are males with 3 vehicles (191, accounting for 32.7%) and females with 3 vehicles (97, making up 51.9%).
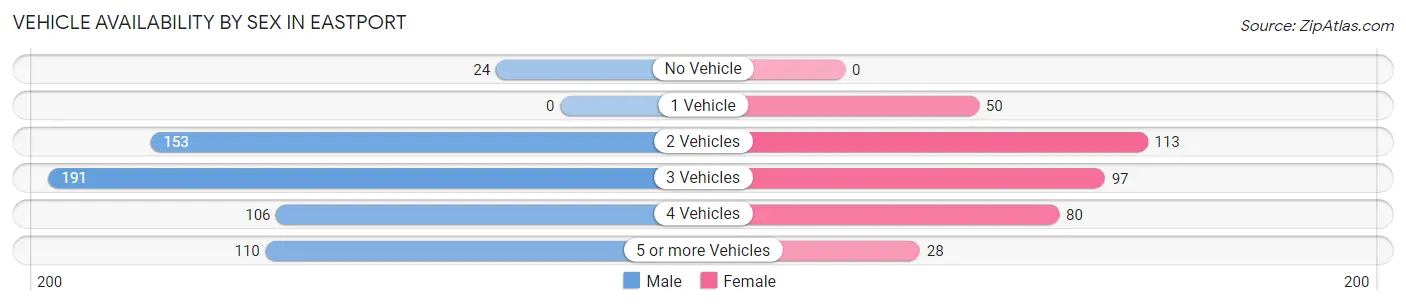
| Vehicles Available | Male | Female |
| No Vehicle | 24 (4.1%) | 0 (0.0%) |
| 1 Vehicle | 0 (0.0%) | 50 (13.6%) |
| 2 Vehicles | 153 (26.2%) | 113 (30.7%) |
| 3 Vehicles | 191 (32.7%) | 97 (26.4%) |
| 4 Vehicles | 106 (18.1%) | 80 (21.7%) |
| 5 or more Vehicles | 110 (18.8%) | 28 (7.6%) |
| Total | 584 (100.0%) | 368 (100.0%) |
Commute Time in Eastport
The most frequently occuring commute durations in Eastport are 20 to 24 minutes (207 commuters, 21.5%), 10 to 14 minutes (151 commuters, 15.7%), and 45 to 59 minutes (147 commuters, 15.3%).
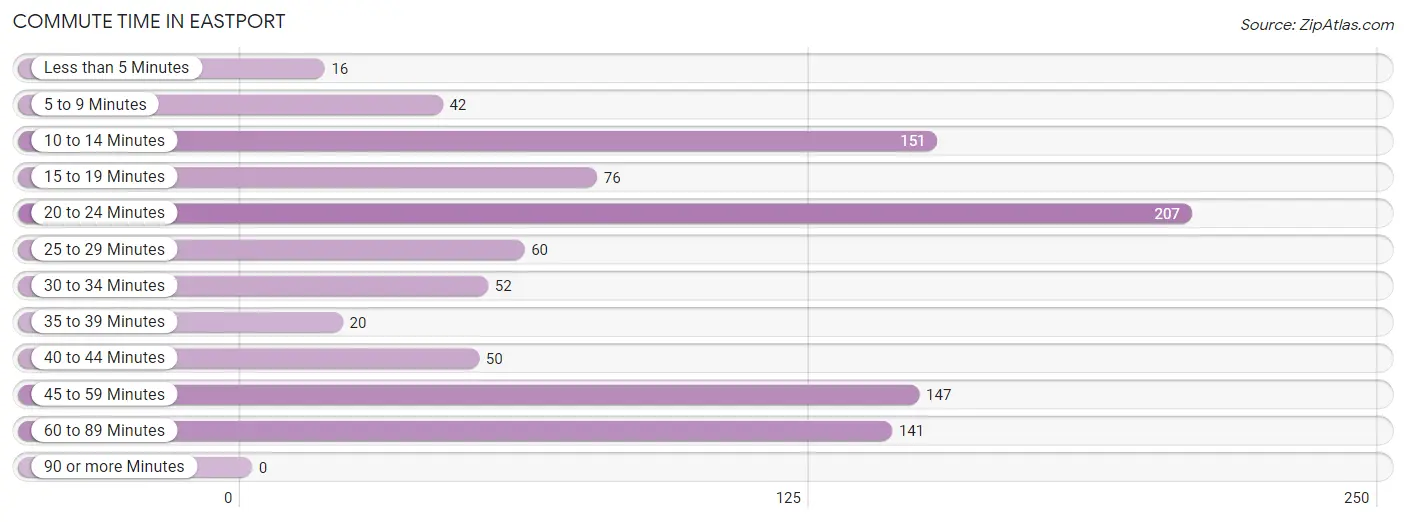
| Commute Time | # Commuters | % Commuters |
| Less than 5 Minutes | 16 | 1.7% |
| 5 to 9 Minutes | 42 | 4.4% |
| 10 to 14 Minutes | 151 | 15.7% |
| 15 to 19 Minutes | 76 | 7.9% |
| 20 to 24 Minutes | 207 | 21.5% |
| 25 to 29 Minutes | 60 | 6.2% |
| 30 to 34 Minutes | 52 | 5.4% |
| 35 to 39 Minutes | 20 | 2.1% |
| 40 to 44 Minutes | 50 | 5.2% |
| 45 to 59 Minutes | 147 | 15.3% |
| 60 to 89 Minutes | 141 | 14.7% |
| 90 or more Minutes | 0 | 0.0% |
Commute Time by Sex in Eastport
The most common commute times in Eastport are 20 to 24 minutes (143 commuters, 24.2%) for males and 10 to 14 minutes (108 commuters, 29.0%) for females.
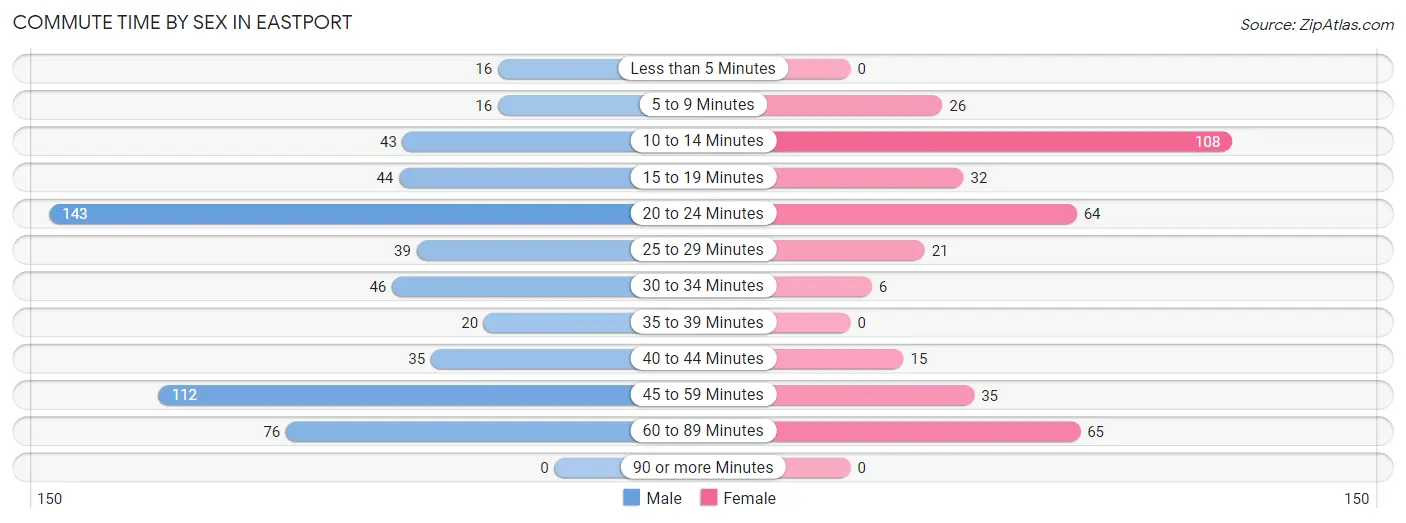
| Commute Time | Male | Female |
| Less than 5 Minutes | 16 (2.7%) | 0 (0.0%) |
| 5 to 9 Minutes | 16 (2.7%) | 26 (7.0%) |
| 10 to 14 Minutes | 43 (7.3%) | 108 (29.0%) |
| 15 to 19 Minutes | 44 (7.5%) | 32 (8.6%) |
| 20 to 24 Minutes | 143 (24.2%) | 64 (17.2%) |
| 25 to 29 Minutes | 39 (6.6%) | 21 (5.7%) |
| 30 to 34 Minutes | 46 (7.8%) | 6 (1.6%) |
| 35 to 39 Minutes | 20 (3.4%) | 0 (0.0%) |
| 40 to 44 Minutes | 35 (5.9%) | 15 (4.0%) |
| 45 to 59 Minutes | 112 (19.0%) | 35 (9.4%) |
| 60 to 89 Minutes | 76 (12.9%) | 65 (17.5%) |
| 90 or more Minutes | 0 (0.0%) | 0 (0.0%) |
Time of Departure to Work by Sex in Eastport
The most frequent times of departure to work in Eastport are 6:30 AM to 6:59 AM (200, 33.9%) for males and 8:00 AM to 8:29 AM (92, 24.7%) for females.
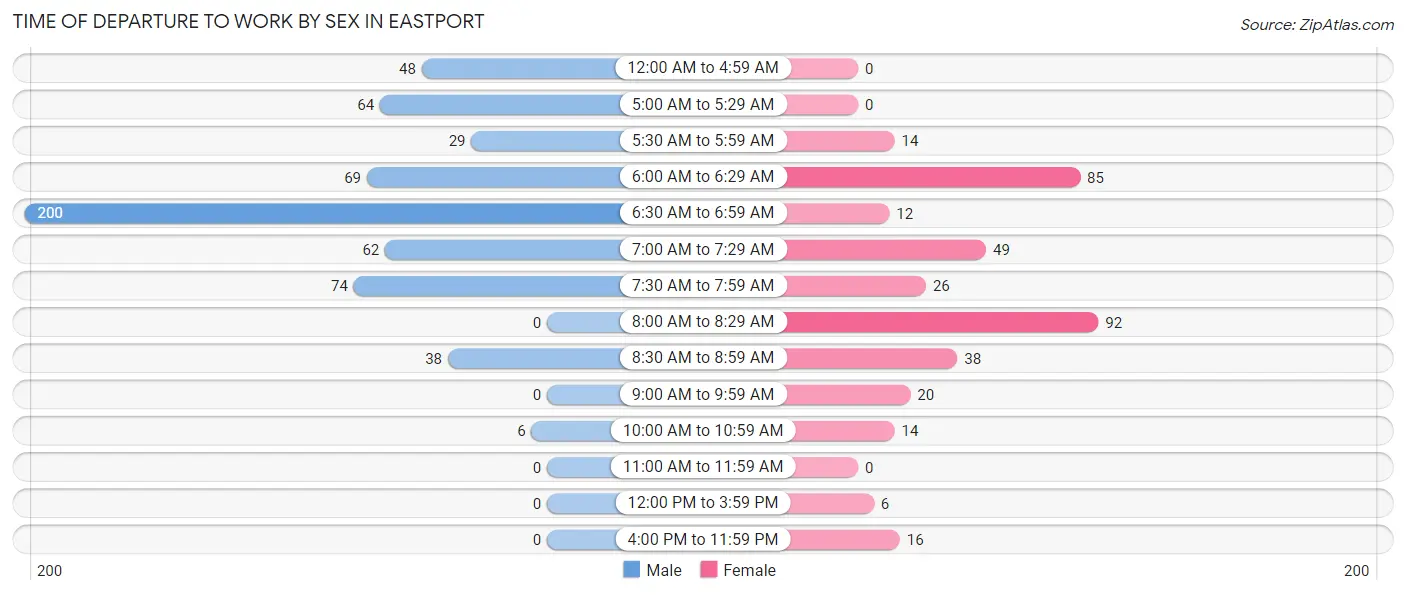
| Time of Departure | Male | Female |
| 12:00 AM to 4:59 AM | 48 (8.1%) | 0 (0.0%) |
| 5:00 AM to 5:29 AM | 64 (10.8%) | 0 (0.0%) |
| 5:30 AM to 5:59 AM | 29 (4.9%) | 14 (3.8%) |
| 6:00 AM to 6:29 AM | 69 (11.7%) | 85 (22.9%) |
| 6:30 AM to 6:59 AM | 200 (33.9%) | 12 (3.2%) |
| 7:00 AM to 7:29 AM | 62 (10.5%) | 49 (13.2%) |
| 7:30 AM to 7:59 AM | 74 (12.5%) | 26 (7.0%) |
| 8:00 AM to 8:29 AM | 0 (0.0%) | 92 (24.7%) |
| 8:30 AM to 8:59 AM | 38 (6.4%) | 38 (10.2%) |
| 9:00 AM to 9:59 AM | 0 (0.0%) | 20 (5.4%) |
| 10:00 AM to 10:59 AM | 6 (1.0%) | 14 (3.8%) |
| 11:00 AM to 11:59 AM | 0 (0.0%) | 0 (0.0%) |
| 12:00 PM to 3:59 PM | 0 (0.0%) | 6 (1.6%) |
| 4:00 PM to 11:59 PM | 0 (0.0%) | 16 (4.3%) |
| Total | 590 (100.0%) | 372 (100.0%) |
Housing Occupancy in Eastport
Occupancy by Ownership in Eastport
Of the total 698 dwellings in Eastport, owner-occupied units account for 678 (97.1%), while renter-occupied units make up 20 (2.9%).
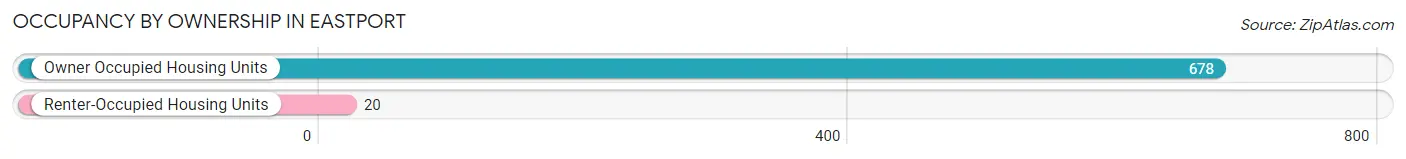
| Occupancy | # Housing Units | % Housing Units |
| Owner Occupied Housing Units | 678 | 97.1% |
| Renter-Occupied Housing Units | 20 | 2.9% |
| Total Occupied Housing Units | 698 | 100.0% |
Occupancy by Household Size in Eastport
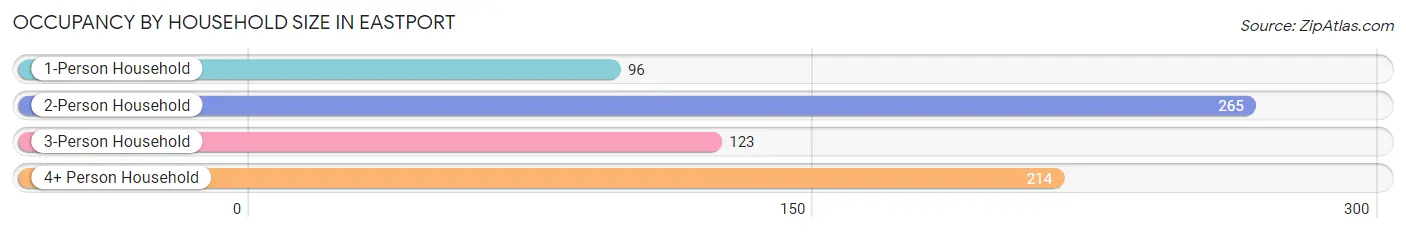
| Household Size | # Housing Units | % Housing Units |
| 1-Person Household | 96 | 13.8% |
| 2-Person Household | 265 | 38.0% |
| 3-Person Household | 123 | 17.6% |
| 4+ Person Household | 214 | 30.7% |
| Total Housing Units | 698 | 100.0% |
Occupancy by Ownership by Household Size in Eastport
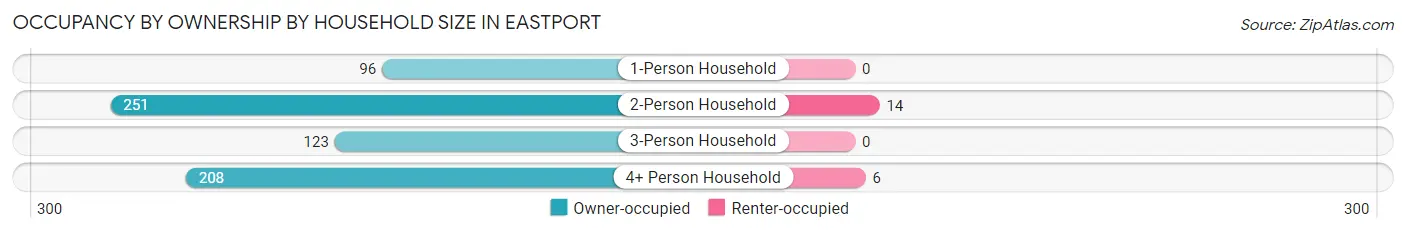
| Household Size | Owner-occupied | Renter-occupied |
| 1-Person Household | 96 (100.0%) | 0 (0.0%) |
| 2-Person Household | 251 (94.7%) | 14 (5.3%) |
| 3-Person Household | 123 (100.0%) | 0 (0.0%) |
| 4+ Person Household | 208 (97.2%) | 6 (2.8%) |
| Total Housing Units | 678 (97.1%) | 20 (2.9%) |
Occupancy by Educational Attainment in Eastport
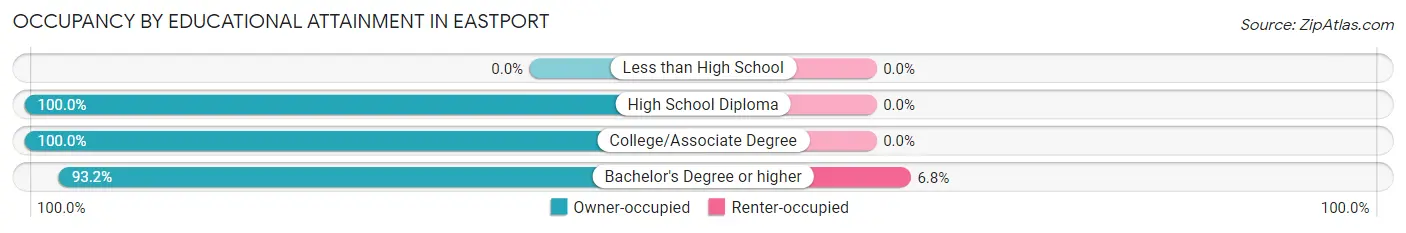
| Household Size | Owner-occupied | Renter-occupied |
| Less than High School | 0 (0.0%) | 0 (0.0%) |
| High School Diploma | 188 (100.0%) | 0 (0.0%) |
| College/Associate Degree | 216 (100.0%) | 0 (0.0%) |
| Bachelor's Degree or higher | 274 (93.2%) | 20 (6.8%) |
Occupancy by Age of Householder in Eastport
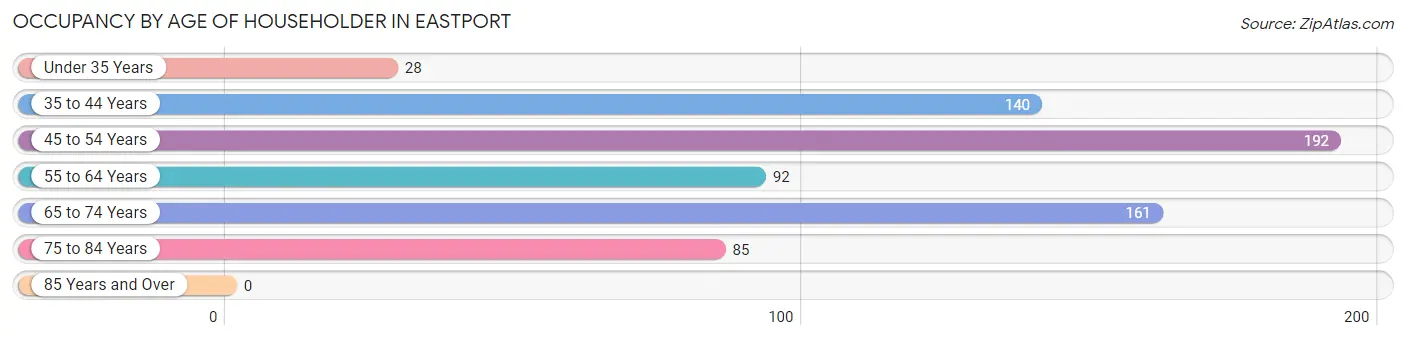
| Age Bracket | # Households | % Households |
| Under 35 Years | 28 | 4.0% |
| 35 to 44 Years | 140 | 20.1% |
| 45 to 54 Years | 192 | 27.5% |
| 55 to 64 Years | 92 | 13.2% |
| 65 to 74 Years | 161 | 23.1% |
| 75 to 84 Years | 85 | 12.2% |
| 85 Years and Over | 0 | 0.0% |
| Total | 698 | 100.0% |
Housing Finances in Eastport
Median Income by Occupancy in Eastport
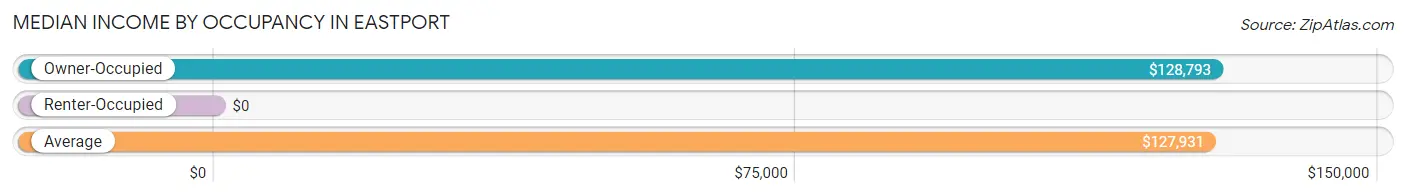
| Occupancy Type | # Households | Median Income |
| Owner-Occupied | 678 (97.1%) | $128,793 |
| Renter-Occupied | 20 (2.9%) | $0 |
| Average | 698 (100.0%) | $127,931 |
Occupancy by Householder Income Bracket in Eastport
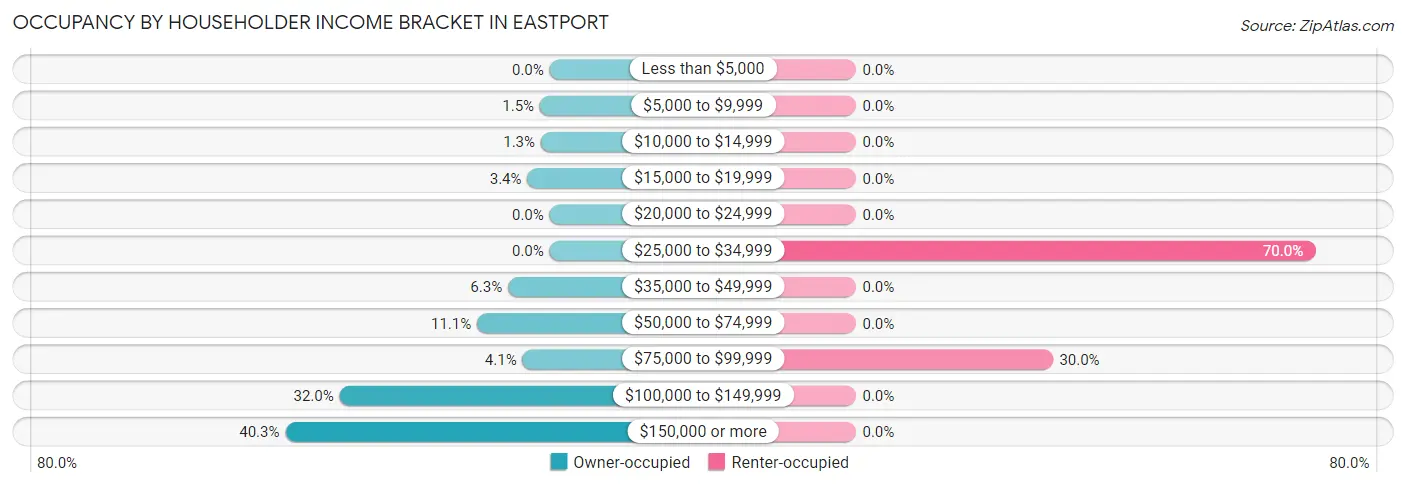
| Income Bracket | Owner-occupied | Renter-occupied |
| Less than $5,000 | 0 (0.0%) | 0 (0.0%) |
| $5,000 to $9,999 | 10 (1.5%) | 0 (0.0%) |
| $10,000 to $14,999 | 9 (1.3%) | 0 (0.0%) |
| $15,000 to $19,999 | 23 (3.4%) | 0 (0.0%) |
| $20,000 to $24,999 | 0 (0.0%) | 0 (0.0%) |
| $25,000 to $34,999 | 0 (0.0%) | 14 (70.0%) |
| $35,000 to $49,999 | 43 (6.3%) | 0 (0.0%) |
| $50,000 to $74,999 | 75 (11.1%) | 0 (0.0%) |
| $75,000 to $99,999 | 28 (4.1%) | 6 (30.0%) |
| $100,000 to $149,999 | 217 (32.0%) | 0 (0.0%) |
| $150,000 or more | 273 (40.3%) | 0 (0.0%) |
| Total | 678 (100.0%) | 20 (100.0%) |
Monthly Housing Cost Tiers in Eastport
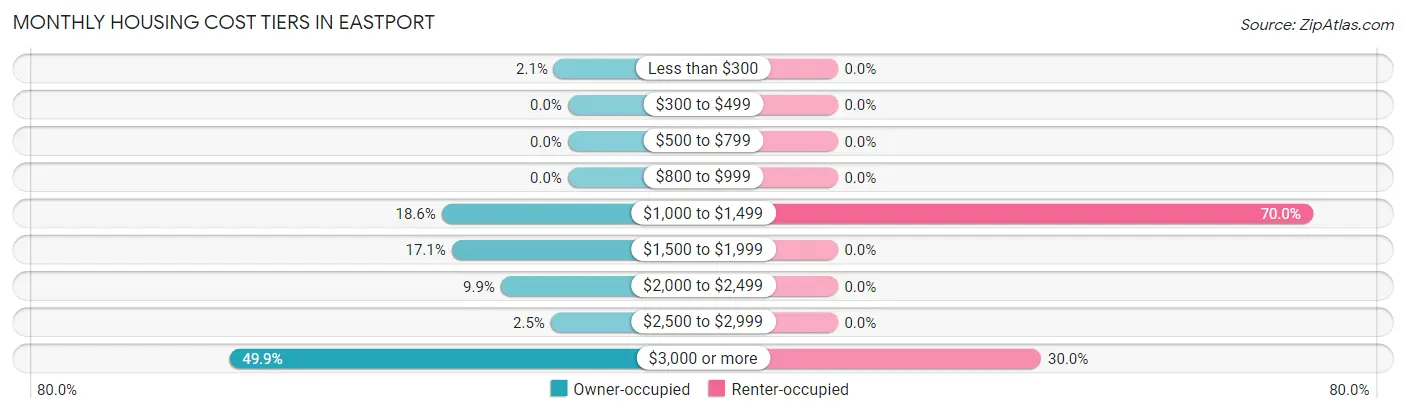
| Monthly Cost | Owner-occupied | Renter-occupied |
| Less than $300 | 14 (2.1%) | 0 (0.0%) |
| $300 to $499 | 0 (0.0%) | 0 (0.0%) |
| $500 to $799 | 0 (0.0%) | 0 (0.0%) |
| $800 to $999 | 0 (0.0%) | 0 (0.0%) |
| $1,000 to $1,499 | 126 (18.6%) | 14 (70.0%) |
| $1,500 to $1,999 | 116 (17.1%) | 0 (0.0%) |
| $2,000 to $2,499 | 67 (9.9%) | 0 (0.0%) |
| $2,500 to $2,999 | 17 (2.5%) | 0 (0.0%) |
| $3,000 or more | 338 (49.8%) | 6 (30.0%) |
| Total | 678 (100.0%) | 20 (100.0%) |
Physical Housing Characteristics in Eastport
Housing Structures in Eastport
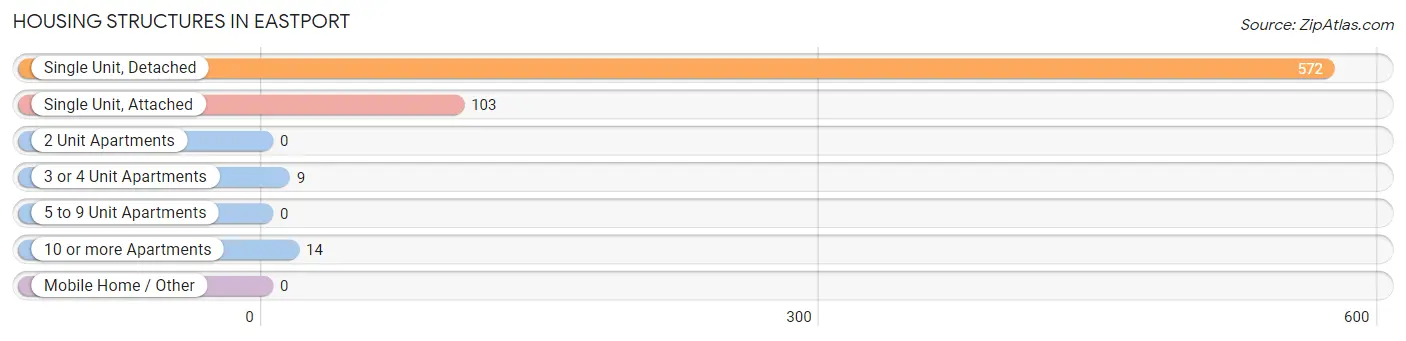
| Structure Type | # Housing Units | % Housing Units |
| Single Unit, Detached | 572 | 82.0% |
| Single Unit, Attached | 103 | 14.8% |
| 2 Unit Apartments | 0 | 0.0% |
| 3 or 4 Unit Apartments | 9 | 1.3% |
| 5 to 9 Unit Apartments | 0 | 0.0% |
| 10 or more Apartments | 14 | 2.0% |
| Mobile Home / Other | 0 | 0.0% |
| Total | 698 | 100.0% |
Housing Structures by Occupancy in Eastport
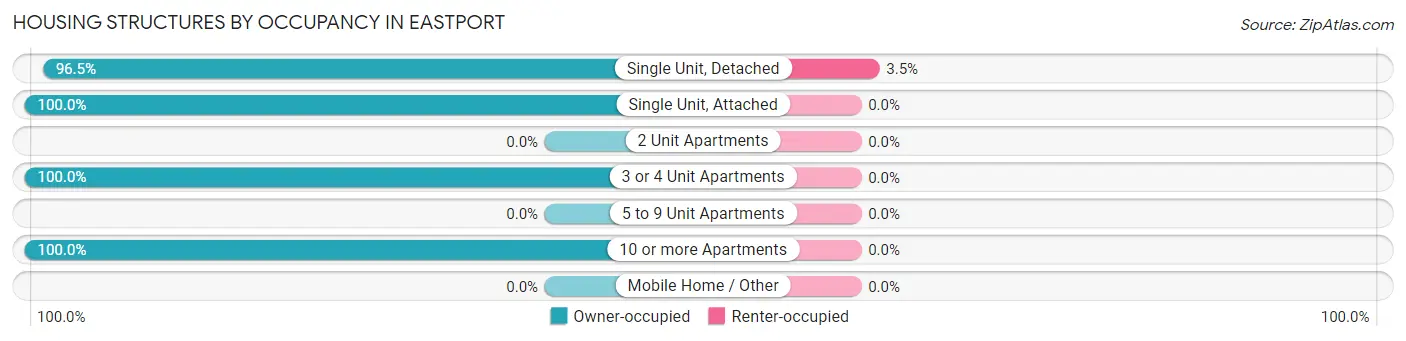
| Structure Type | Owner-occupied | Renter-occupied |
| Single Unit, Detached | 552 (96.5%) | 20 (3.5%) |
| Single Unit, Attached | 103 (100.0%) | 0 (0.0%) |
| 2 Unit Apartments | 0 (0.0%) | 0 (0.0%) |
| 3 or 4 Unit Apartments | 9 (100.0%) | 0 (0.0%) |
| 5 to 9 Unit Apartments | 0 (0.0%) | 0 (0.0%) |
| 10 or more Apartments | 14 (100.0%) | 0 (0.0%) |
| Mobile Home / Other | 0 (0.0%) | 0 (0.0%) |
| Total | 678 (97.1%) | 20 (2.9%) |
Housing Structures by Number of Rooms in Eastport
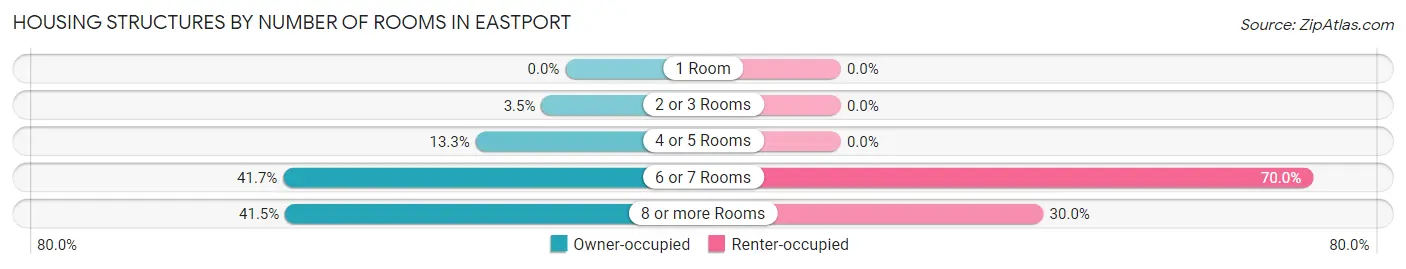
| Number of Rooms | Owner-occupied | Renter-occupied |
| 1 Room | 0 (0.0%) | 0 (0.0%) |
| 2 or 3 Rooms | 24 (3.5%) | 0 (0.0%) |
| 4 or 5 Rooms | 90 (13.3%) | 0 (0.0%) |
| 6 or 7 Rooms | 283 (41.7%) | 14 (70.0%) |
| 8 or more Rooms | 281 (41.4%) | 6 (30.0%) |
| Total | 678 (100.0%) | 20 (100.0%) |
Housing Structure by Heating Type in Eastport
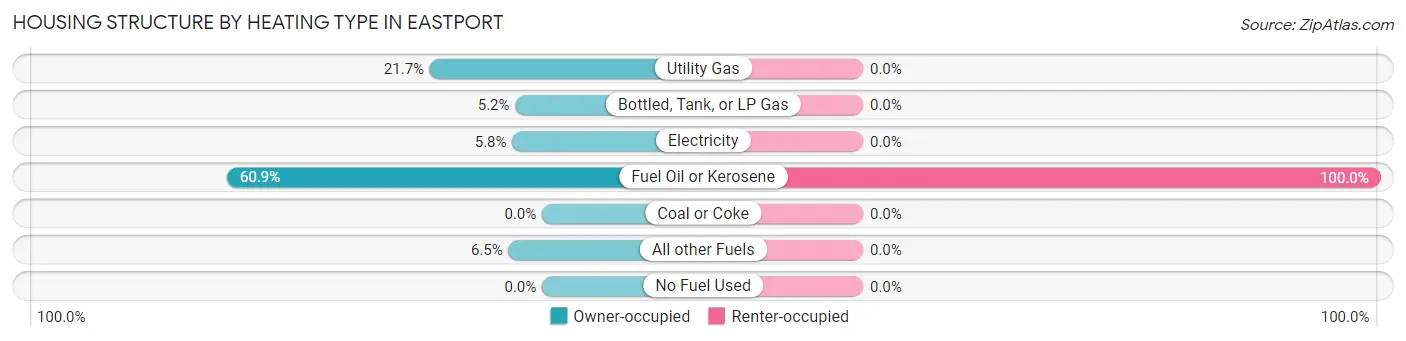
| Heating Type | Owner-occupied | Renter-occupied |
| Utility Gas | 147 (21.7%) | 0 (0.0%) |
| Bottled, Tank, or LP Gas | 35 (5.2%) | 0 (0.0%) |
| Electricity | 39 (5.8%) | 0 (0.0%) |
| Fuel Oil or Kerosene | 413 (60.9%) | 20 (100.0%) |
| Coal or Coke | 0 (0.0%) | 0 (0.0%) |
| All other Fuels | 44 (6.5%) | 0 (0.0%) |
| No Fuel Used | 0 (0.0%) | 0 (0.0%) |
| Total | 678 (100.0%) | 20 (100.0%) |
Household Vehicle Usage in Eastport
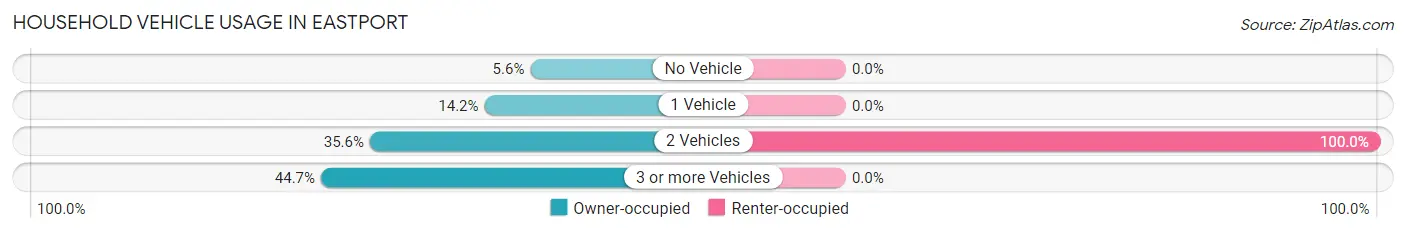
| Vehicles per Household | Owner-occupied | Renter-occupied |
| No Vehicle | 38 (5.6%) | 0 (0.0%) |
| 1 Vehicle | 96 (14.2%) | 0 (0.0%) |
| 2 Vehicles | 241 (35.5%) | 20 (100.0%) |
| 3 or more Vehicles | 303 (44.7%) | 0 (0.0%) |
| Total | 678 (100.0%) | 20 (100.0%) |
Real Estate & Mortgages in Eastport
Real Estate and Mortgage Overview in Eastport
| Characteristic | Without Mortgage | With Mortgage |
| Housing Units | 178 | 500 |
| Median Property Value | $788,000 | $513,100 |
| Median Household Income | $118,667 | $210 |
| Monthly Housing Costs | $1,501 | $300 |
| Real Estate Taxes | $9,861 | $14 |
Property Value by Mortgage Status in Eastport
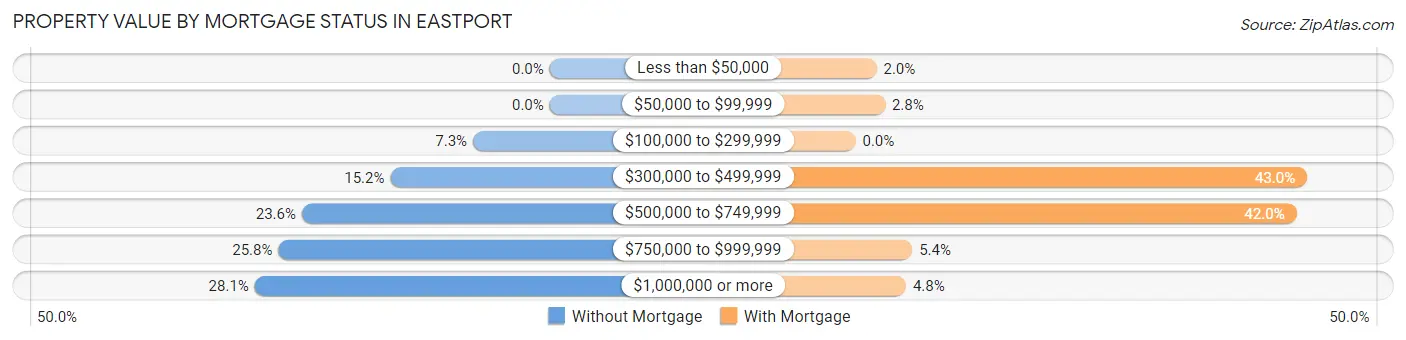
| Property Value | Without Mortgage | With Mortgage |
| Less than $50,000 | 0 (0.0%) | 10 (2.0%) |
| $50,000 to $99,999 | 0 (0.0%) | 14 (2.8%) |
| $100,000 to $299,999 | 13 (7.3%) | 0 (0.0%) |
| $300,000 to $499,999 | 27 (15.2%) | 215 (43.0%) |
| $500,000 to $749,999 | 42 (23.6%) | 210 (42.0%) |
| $750,000 to $999,999 | 46 (25.8%) | 27 (5.4%) |
| $1,000,000 or more | 50 (28.1%) | 24 (4.8%) |
| Total | 178 (100.0%) | 500 (100.0%) |
Household Income by Mortgage Status in Eastport
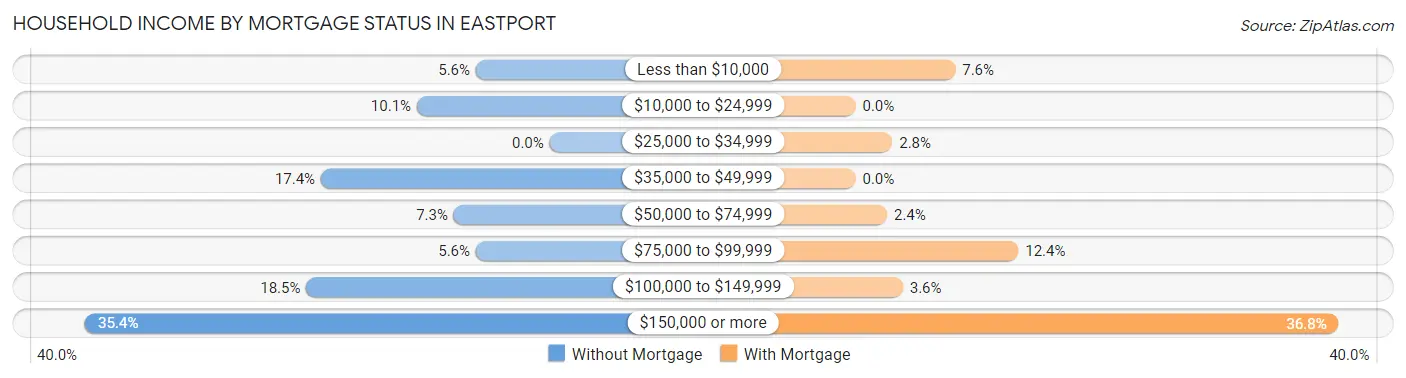
| Household Income | Without Mortgage | With Mortgage |
| Less than $10,000 | 10 (5.6%) | 38 (7.6%) |
| $10,000 to $24,999 | 18 (10.1%) | 0 (0.0%) |
| $25,000 to $34,999 | 0 (0.0%) | 14 (2.8%) |
| $35,000 to $49,999 | 31 (17.4%) | 0 (0.0%) |
| $50,000 to $74,999 | 13 (7.3%) | 12 (2.4%) |
| $75,000 to $99,999 | 10 (5.6%) | 62 (12.4%) |
| $100,000 to $149,999 | 33 (18.5%) | 18 (3.6%) |
| $150,000 or more | 63 (35.4%) | 184 (36.8%) |
| Total | 178 (100.0%) | 500 (100.0%) |
Property Value to Household Income Ratio in Eastport
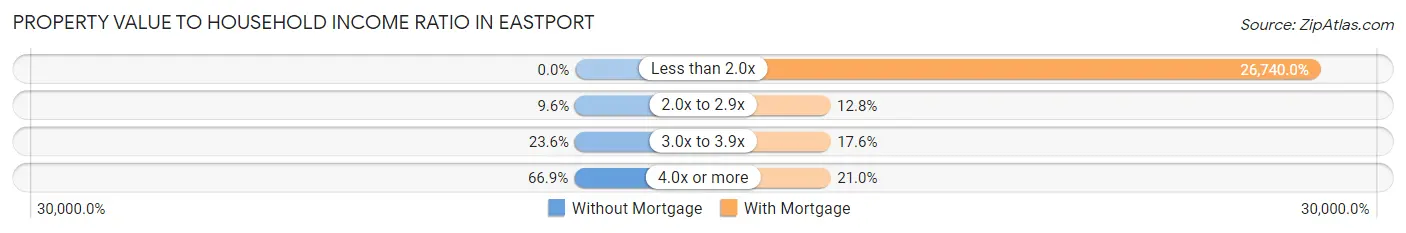
| Value-to-Income Ratio | Without Mortgage | With Mortgage |
| Less than 2.0x | 0 (0.0%) | 133,700 (26,740.0%) |
| 2.0x to 2.9x | 17 (9.6%) | 64 (12.8%) |
| 3.0x to 3.9x | 42 (23.6%) | 88 (17.6%) |
| 4.0x or more | 119 (66.8%) | 105 (21.0%) |
| Total | 178 (100.0%) | 500 (100.0%) |
Real Estate Taxes by Mortgage Status in Eastport
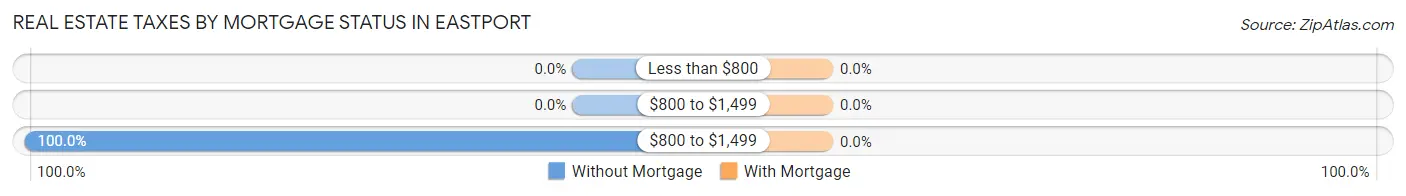
| Property Taxes | Without Mortgage | With Mortgage |
| Less than $800 | 0 (0.0%) | 0 (0.0%) |
| $800 to $1,499 | 0 (0.0%) | 0 (0.0%) |
| $800 to $1,499 | 178 (100.0%) | 0 (0.0%) |
| Total | 178 (100.0%) | 500 (100.0%) |
Health & Disability in Eastport
Health Insurance Coverage by Age in Eastport
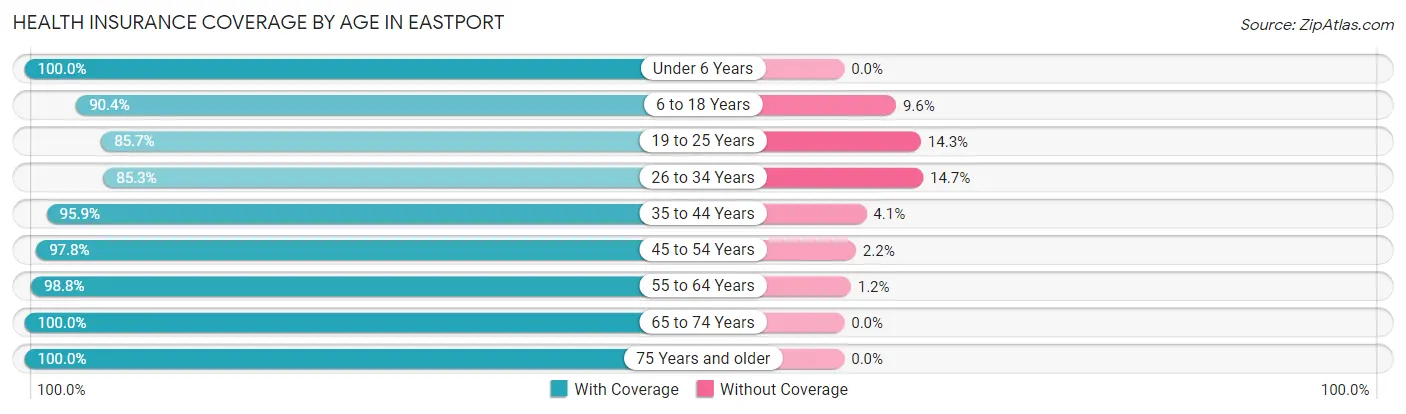
| Age Bracket | With Coverage | Without Coverage |
| Under 6 Years | 107 (100.0%) | 0 (0.0%) |
| 6 to 18 Years | 328 (90.4%) | 35 (9.6%) |
| 19 to 25 Years | 96 (85.7%) | 16 (14.3%) |
| 26 to 34 Years | 209 (85.3%) | 36 (14.7%) |
| 35 to 44 Years | 256 (95.9%) | 11 (4.1%) |
| 45 to 54 Years | 360 (97.8%) | 8 (2.2%) |
| 55 to 64 Years | 245 (98.8%) | 3 (1.2%) |
| 65 to 74 Years | 286 (100.0%) | 0 (0.0%) |
| 75 Years and older | 133 (100.0%) | 0 (0.0%) |
| Total | 2,020 (94.9%) | 109 (5.1%) |
Health Insurance Coverage by Citizenship Status in Eastport
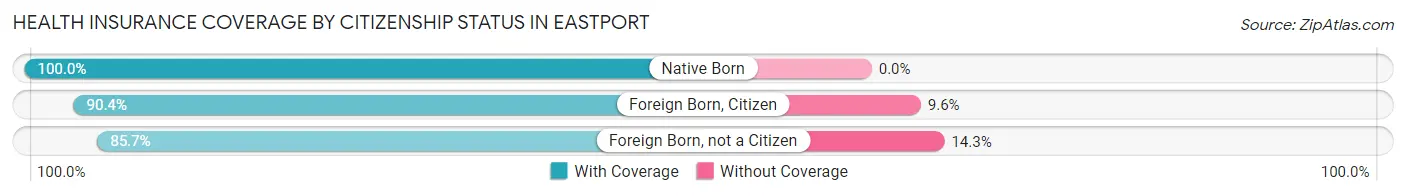
| Citizenship Status | With Coverage | Without Coverage |
| Native Born | 107 (100.0%) | 0 (0.0%) |
| Foreign Born, Citizen | 328 (90.4%) | 35 (9.6%) |
| Foreign Born, not a Citizen | 96 (85.7%) | 16 (14.3%) |
Health Insurance Coverage by Household Income in Eastport
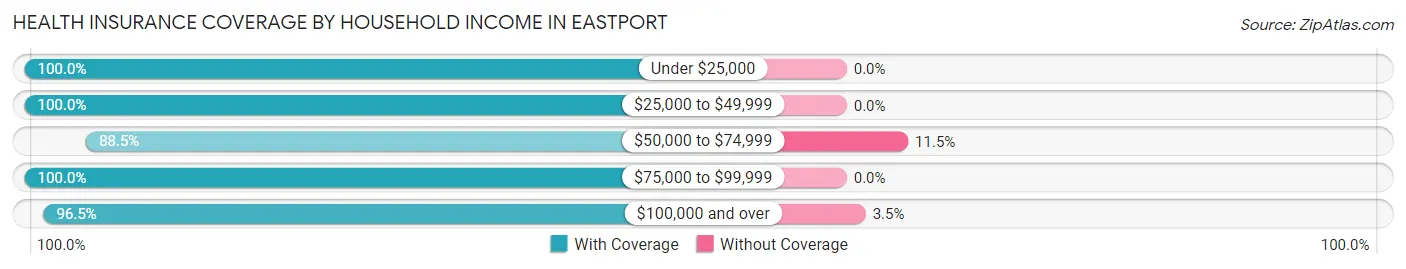
| Household Income | With Coverage | Without Coverage |
| Under $25,000 | 60 (100.0%) | 0 (0.0%) |
| $25,000 to $49,999 | 100 (100.0%) | 0 (0.0%) |
| $50,000 to $74,999 | 100 (88.5%) | 13 (11.5%) |
| $75,000 to $99,999 | 90 (100.0%) | 0 (0.0%) |
| $100,000 and over | 1,607 (96.5%) | 59 (3.5%) |
Public vs Private Health Insurance Coverage by Age in Eastport
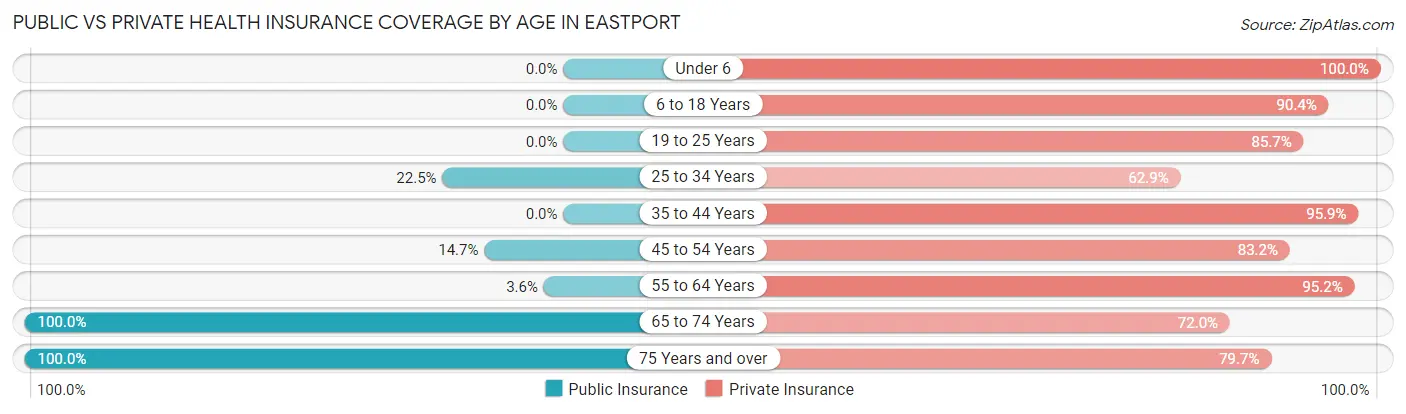
| Age Bracket | Public Insurance | Private Insurance |
| Under 6 | 0 (0.0%) | 107 (100.0%) |
| 6 to 18 Years | 0 (0.0%) | 328 (90.4%) |
| 19 to 25 Years | 0 (0.0%) | 96 (85.7%) |
| 25 to 34 Years | 55 (22.5%) | 154 (62.9%) |
| 35 to 44 Years | 0 (0.0%) | 256 (95.9%) |
| 45 to 54 Years | 54 (14.7%) | 306 (83.2%) |
| 55 to 64 Years | 9 (3.6%) | 236 (95.2%) |
| 65 to 74 Years | 286 (100.0%) | 206 (72.0%) |
| 75 Years and over | 133 (100.0%) | 106 (79.7%) |
| Total | 537 (25.2%) | 1,795 (84.3%) |
Disability Status by Sex by Age in Eastport
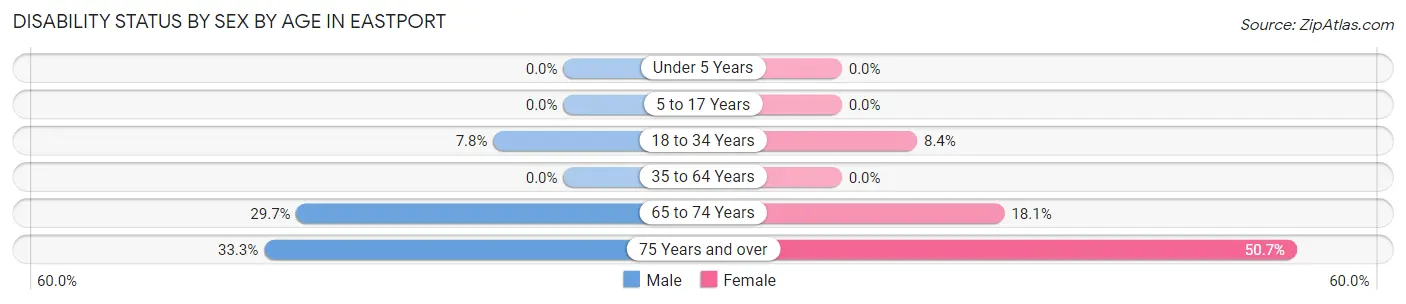
| Age Bracket | Male | Female |
| Under 5 Years | 0 (0.0%) | 0 (0.0%) |
| 5 to 17 Years | 0 (0.0%) | 0 (0.0%) |
| 18 to 34 Years | 16 (7.8%) | 16 (8.4%) |
| 35 to 64 Years | 0 (0.0%) | 0 (0.0%) |
| 65 to 74 Years | 44 (29.7%) | 25 (18.1%) |
| 75 Years and over | 20 (33.3%) | 37 (50.7%) |
Disability Class by Sex by Age in Eastport
Disability Class: Hearing Difficulty
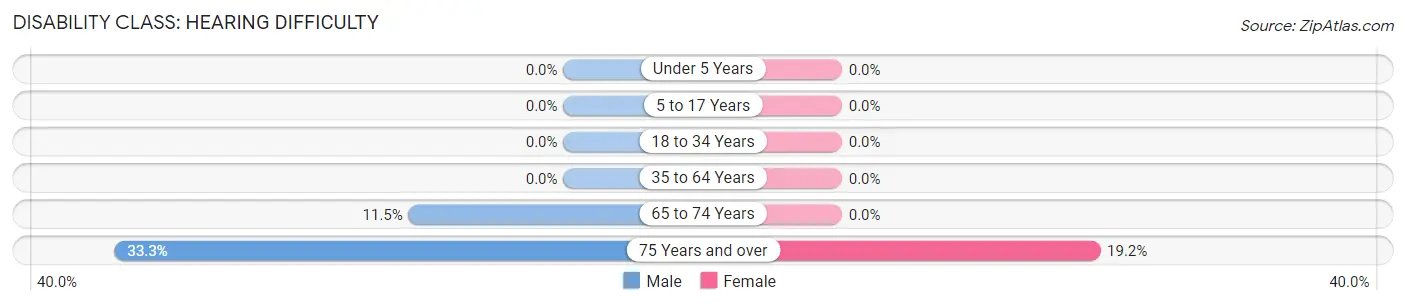
| Age Bracket | Male | Female |
| Under 5 Years | 0 (0.0%) | 0 (0.0%) |
| 5 to 17 Years | 0 (0.0%) | 0 (0.0%) |
| 18 to 34 Years | 0 (0.0%) | 0 (0.0%) |
| 35 to 64 Years | 0 (0.0%) | 0 (0.0%) |
| 65 to 74 Years | 17 (11.5%) | 0 (0.0%) |
| 75 Years and over | 20 (33.3%) | 14 (19.2%) |
Disability Class: Vision Difficulty
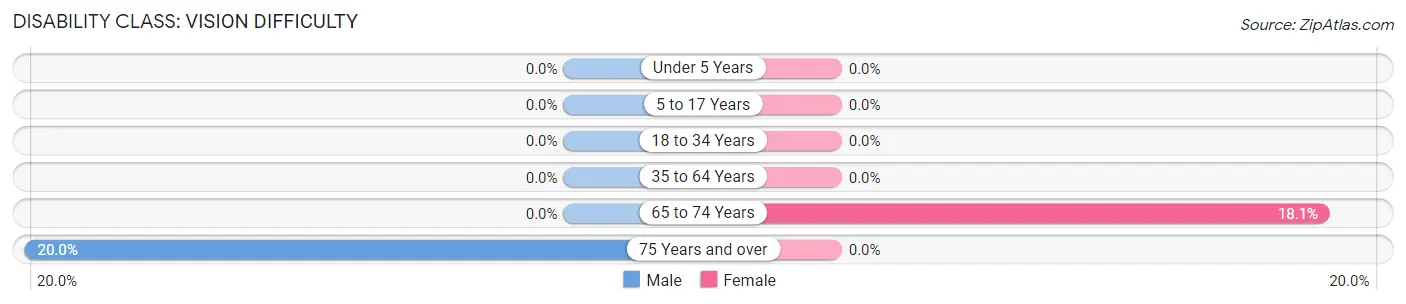
| Age Bracket | Male | Female |
| Under 5 Years | 0 (0.0%) | 0 (0.0%) |
| 5 to 17 Years | 0 (0.0%) | 0 (0.0%) |
| 18 to 34 Years | 0 (0.0%) | 0 (0.0%) |
| 35 to 64 Years | 0 (0.0%) | 0 (0.0%) |
| 65 to 74 Years | 0 (0.0%) | 25 (18.1%) |
| 75 Years and over | 12 (20.0%) | 0 (0.0%) |
Disability Class: Cognitive Difficulty
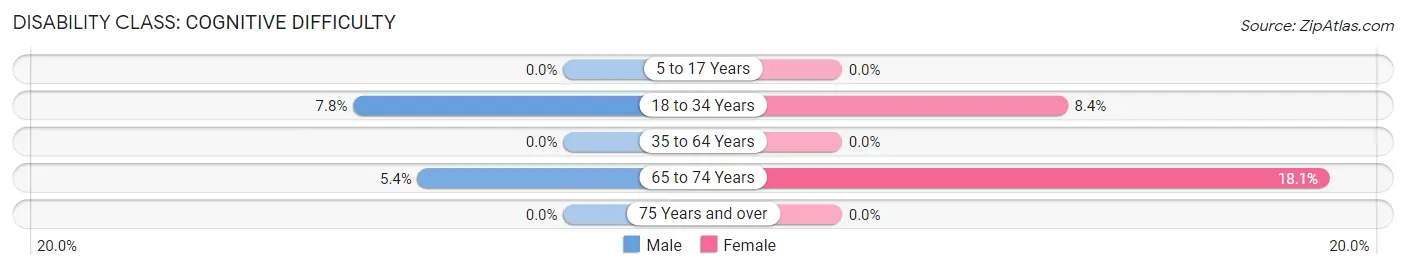
| Age Bracket | Male | Female |
| 5 to 17 Years | 0 (0.0%) | 0 (0.0%) |
| 18 to 34 Years | 16 (7.8%) | 16 (8.4%) |
| 35 to 64 Years | 0 (0.0%) | 0 (0.0%) |
| 65 to 74 Years | 8 (5.4%) | 25 (18.1%) |
| 75 Years and over | 0 (0.0%) | 0 (0.0%) |
Disability Class: Ambulatory Difficulty
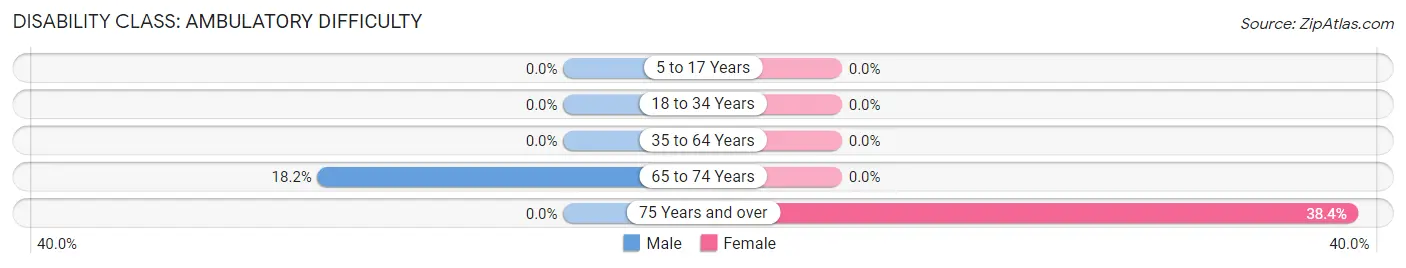
| Age Bracket | Male | Female |
| 5 to 17 Years | 0 (0.0%) | 0 (0.0%) |
| 18 to 34 Years | 0 (0.0%) | 0 (0.0%) |
| 35 to 64 Years | 0 (0.0%) | 0 (0.0%) |
| 65 to 74 Years | 27 (18.2%) | 0 (0.0%) |
| 75 Years and over | 0 (0.0%) | 28 (38.4%) |
Disability Class: Self-Care Difficulty
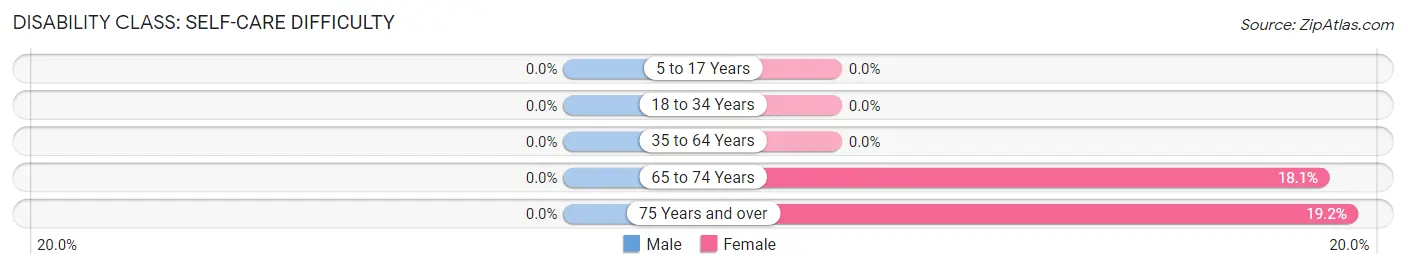
| Age Bracket | Male | Female |
| 5 to 17 Years | 0 (0.0%) | 0 (0.0%) |
| 18 to 34 Years | 0 (0.0%) | 0 (0.0%) |
| 35 to 64 Years | 0 (0.0%) | 0 (0.0%) |
| 65 to 74 Years | 0 (0.0%) | 25 (18.1%) |
| 75 Years and over | 0 (0.0%) | 14 (19.2%) |
Technology Access in Eastport
Computing Device Access in Eastport
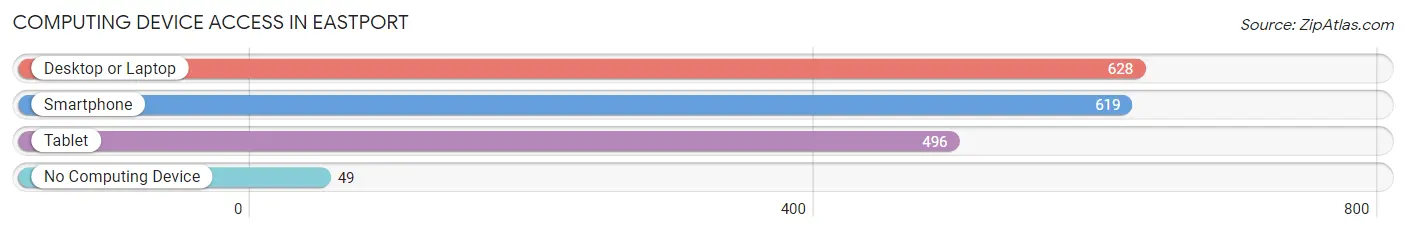
| Device Type | # Households | % Households |
| Desktop or Laptop | 628 | 90.0% |
| Smartphone | 619 | 88.7% |
| Tablet | 496 | 71.1% |
| No Computing Device | 49 | 7.0% |
| Total | 698 | 100.0% |
Internet Access in Eastport
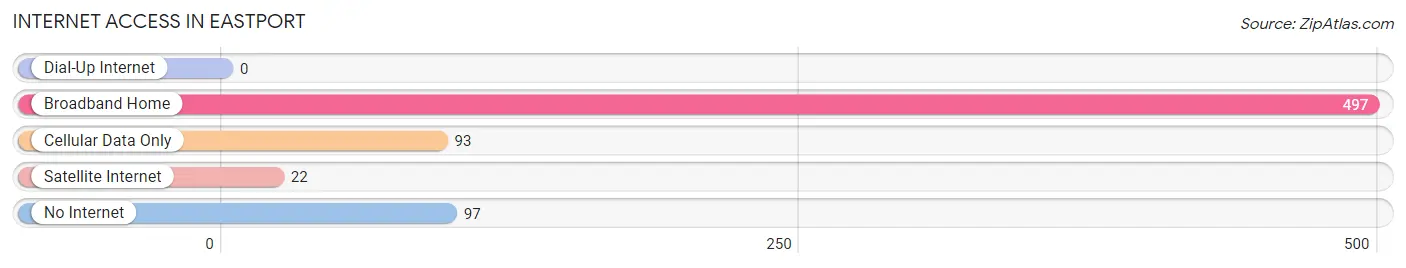
| Internet Type | # Households | % Households |
| Dial-Up Internet | 0 | 0.0% |
| Broadband Home | 497 | 71.2% |
| Cellular Data Only | 93 | 13.3% |
| Satellite Internet | 22 | 3.2% |
| No Internet | 97 | 13.9% |
| Total | 698 | 100.0% |
Eastport Summary
Eastport is a hamlet located in the Town of Brookhaven in Suffolk County, New York. It is situated on the south shore of Long Island, approximately 60 miles east of New York City. The hamlet is bordered by the Great South Bay to the north, the Atlantic Ocean to the south, and the hamlets of Bellport and Patchogue to the west.
History
The area that is now Eastport was originally inhabited by the Secatogue Indians, a sub-tribe of the larger Montaukett tribe. The Secatogue Indians were a peaceful people who lived off the land, fishing, hunting, and gathering shellfish. The first European settlers arrived in the area in the late 1600s, and the hamlet was officially established in 1790.
The hamlet was originally known as "Eastport Landing," and was a popular spot for fishing and oystering. In the late 1800s, the area began to develop as a resort destination, with several hotels and inns being built. The hamlet was officially renamed "Eastport" in 1891.
In the early 1900s, Eastport became a popular spot for summer vacationers, and the area experienced a period of rapid growth. The hamlet was home to several large hotels, including the Eastport Hotel, the Eastport Inn, and the Eastport Beach Hotel.
In the 1950s, Eastport began to decline as a resort destination, and many of the hotels and inns closed. The hamlet experienced a resurgence in the late 1970s, when it became a popular spot for boaters and fishermen.
Geography
Eastport is located on the south shore of Long Island, approximately 60 miles east of New York City. The hamlet is bordered by the Great South Bay to the north, the Atlantic Ocean to the south, and the hamlets of Bellport and Patchogue to the west.
The hamlet is situated on a peninsula, with the Great South Bay to the north and the Atlantic Ocean to the south. The hamlet is home to several marinas, including the Eastport Yacht Club and the Eastport Marina.
Economy
The economy of Eastport is largely based on tourism and recreation. The hamlet is home to several marinas, which attract boaters and fishermen from all over the region. The hamlet is also home to several restaurants, bars, and shops, which cater to both locals and tourists.
The hamlet is also home to several businesses, including a boat repair shop, a bait and tackle shop, and a marine supply store. The hamlet is also home to several real estate offices, which specialize in waterfront properties.
Demographics
As of the 2010 census, the population of Eastport was 2,845. The population is largely white (90.3%), with small percentages of African American (3.2%), Asian (2.2%), and Hispanic (2.2%) residents. The median household income is $77,857, and the median home value is $521,000.
Conclusion
Eastport is a hamlet located in the Town of Brookhaven in Suffolk County, New York. It is situated on the south shore of Long Island, approximately 60 miles east of New York City. The hamlet is bordered by the Great South Bay to the north, the Atlantic Ocean to the south, and the hamlets of Bellport and Patchogue to the west. The economy of Eastport is largely based on tourism and recreation, and the population is largely white. The median household income is $77,857, and the median home value is $521,000.
Common Questions
What is the Total Population of Eastport?
Total Population of Eastport is 2,136.
What is the Total Male Population of Eastport?
Total Male Population of Eastport is 998.
What is the Total Female Population of Eastport?
Total Female Population of Eastport is 1,138.
What is the Ratio of Males per 100 Females in Eastport?
There are 87.70 Males per 100 Females in Eastport.
What is the Ratio of Females per 100 Males in Eastport?
There are 114.03 Females per 100 Males in Eastport.
What is the Median Population Age in Eastport?
Median Population Age in Eastport is 40.8 Years.
What is the Average Family Size in Eastport
Average Family Size in Eastport is 3.2 People.
What is the Average Household Size in Eastport
Average Household Size in Eastport is 2.9 People.
What is Per Capita Income in Eastport?
Per Capita income in Eastport is $55,493.
What is the Median Family Income in Eastport?
Median Family Income in Eastport is $134,900.
What is the Median Household income in Eastport?
Median Household Income in Eastport is $127,931.
What is Income or Wage Gap in Eastport?
Income or Wage Gap in Eastport is 35.5%.
Women in Eastport earn 64.5 cents for every dollar earned by a man.
What is Inequality or Gini Index in Eastport?
Inequality or Gini Index in Eastport is 0.41.
How Large is the Labor Force in Eastport?
There are 1,048 People in the Labor Forcein in Eastport.
What is the Percentage of People in the Labor Force in Eastport?
59.7% of People are in the Labor Force in Eastport.
What is the Unemployment Rate in Eastport?
Unemployment Rate in Eastport is 2.8%.