Amenia, NY
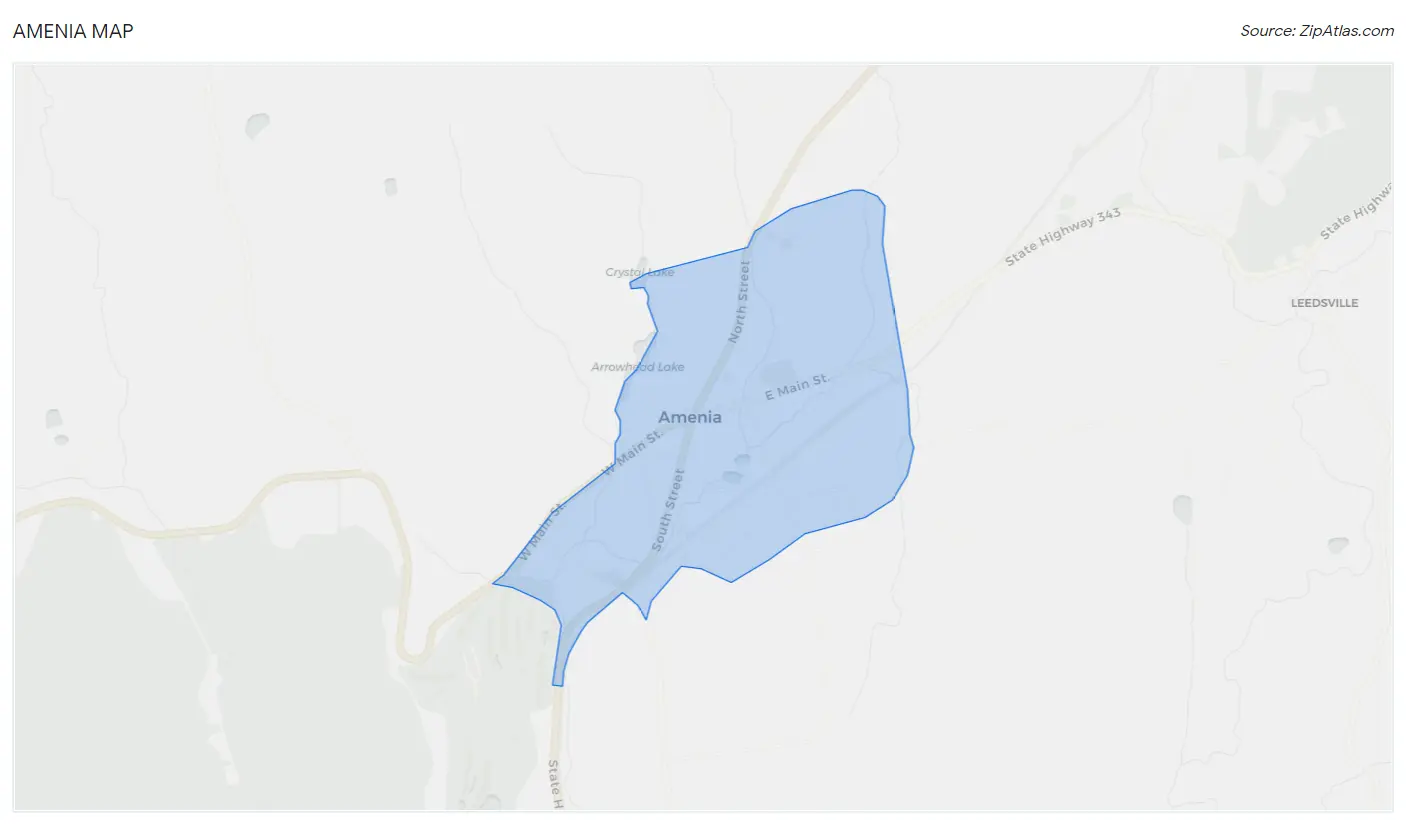
Amenia Map
Amenia Overview
831
TOTAL POPULATION
522
MALE POPULATION
309
FEMALE POPULATION
168.93
MALES / 100 FEMALES
59.20
FEMALES / 100 MALES
50.4
MEDIAN AGE
2.5
AVG FAMILY SIZE
2.0
AVG HOUSEHOLD SIZE
$39,850
PER CAPITA INCOME
$90,167
AVG FAMILY INCOME
$78,512
AVG HOUSEHOLD INCOME
7.0%
WAGE / INCOME GAP [ % ]
93.0¢/ $1
WAGE / INCOME GAP [ $ ]
0.39
INEQUALITY / GINI INDEX
478
LABOR FORCE [ PEOPLE ]
65.7%
PERCENT IN LABOR FORCE
Amenia Zip Codes
Amenia Area Codes
Race in Amenia
The most populous races in Amenia are White / Caucasian (591 | 71.1%), Some other Race (240 | 28.9%), and Hispanic or Latino (213 | 25.6%).
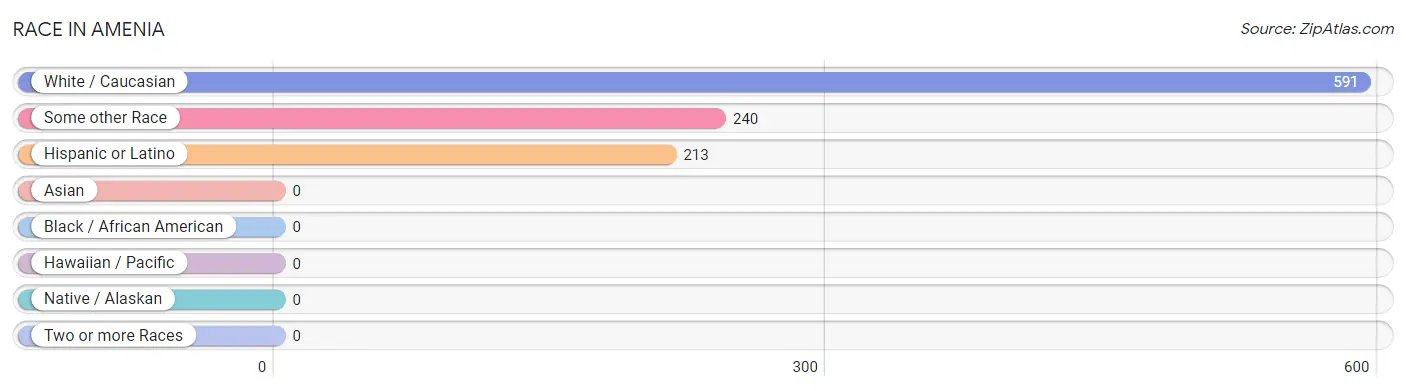
| Race | # Population | % Population |
| Asian | 0 | 0.0% |
| Black / African American | 0 | 0.0% |
| Hawaiian / Pacific | 0 | 0.0% |
| Hispanic or Latino | 213 | 25.6% |
| Native / Alaskan | 0 | 0.0% |
| White / Caucasian | 591 | 71.1% |
| Two or more Races | 0 | 0.0% |
| Some other Race | 240 | 28.9% |
| Total | 831 | 100.0% |
Ancestry in Amenia
The most populous ancestries reported in Amenia are Irish (176 | 21.2%), Central American (140 | 16.9%), Guatemalan (140 | 16.9%), German (127 | 15.3%), and English (119 | 14.3%), together accounting for 84.5% of all Amenia residents.
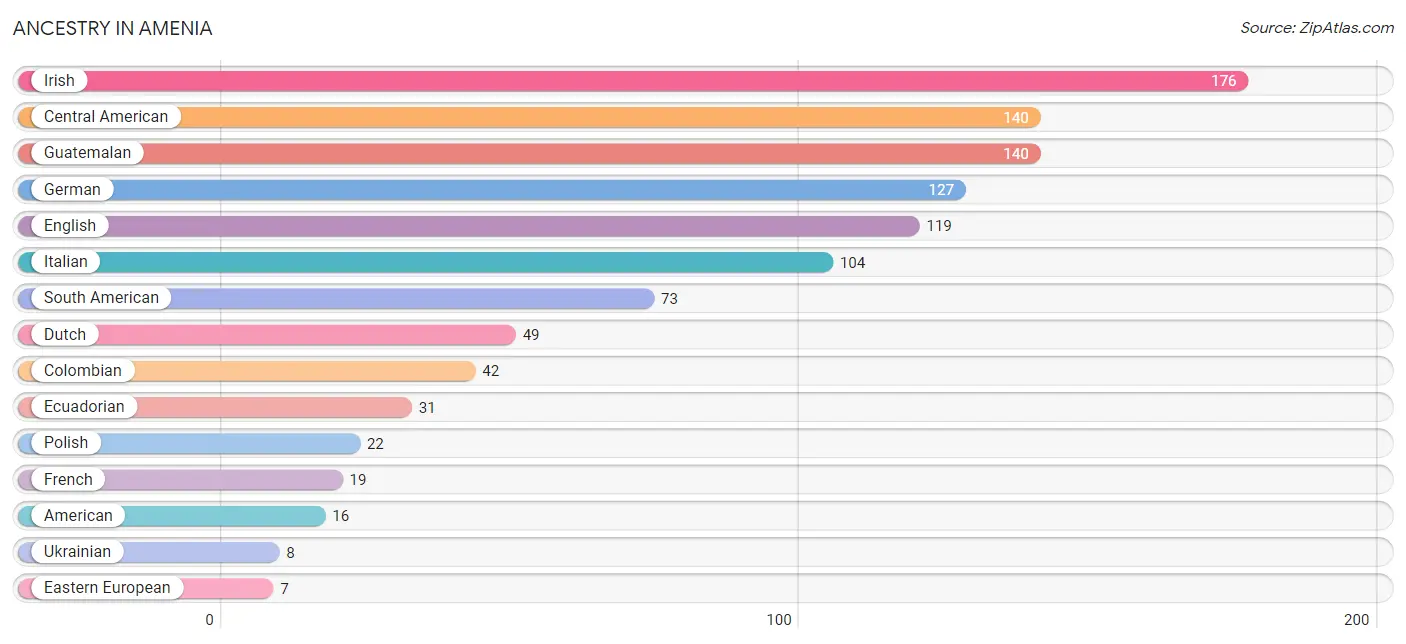
| Ancestry | # Population | % Population |
| American | 16 | 1.9% |
| Central American | 140 | 16.9% |
| Colombian | 42 | 5.1% |
| Dutch | 49 | 5.9% |
| Eastern European | 7 | 0.8% |
| Ecuadorian | 31 | 3.7% |
| English | 119 | 14.3% |
| European | 6 | 0.7% |
| French | 19 | 2.3% |
| German | 127 | 15.3% |
| Guatemalan | 140 | 16.9% |
| Irish | 176 | 21.2% |
| Italian | 104 | 12.5% |
| Polish | 22 | 2.6% |
| South American | 73 | 8.8% |
| Ukrainian | 8 | 1.0% |
| Welsh | 6 | 0.7% | View All 17 Rows |
Immigrants in Amenia
The most numerous immigrant groups reported in Amenia came from Latin America (73 | 8.8%), South America (73 | 8.8%), Colombia (42 | 5.1%), Ecuador (31 | 3.7%), and Europe (17 | 2.1%), together accounting for 28.4% of all Amenia residents.
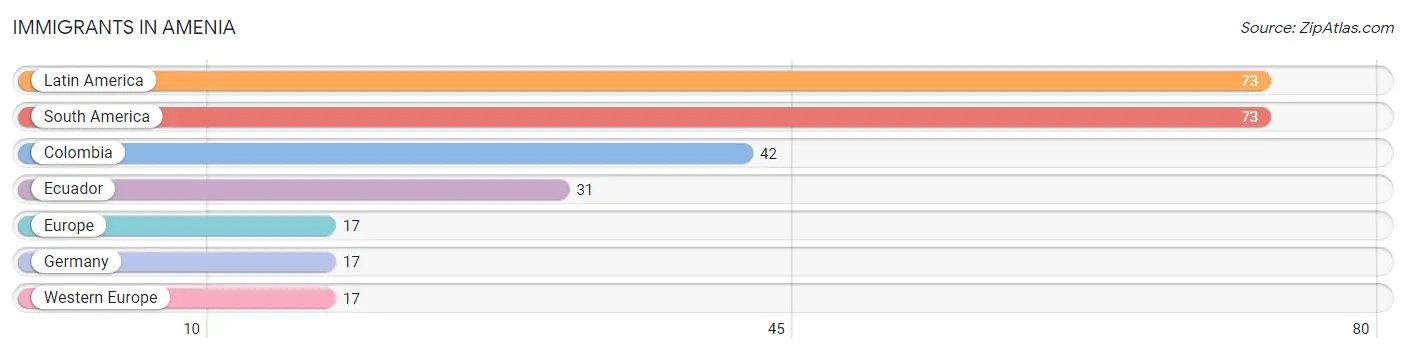
| Immigration Origin | # Population | % Population |
| Colombia | 42 | 5.1% |
| Ecuador | 31 | 3.7% |
| Europe | 17 | 2.1% |
| Germany | 17 | 2.1% |
| Latin America | 73 | 8.8% |
| South America | 73 | 8.8% |
| Western Europe | 17 | 2.1% | View All 7 Rows |
Sex and Age in Amenia
Sex and Age in Amenia
The most populous age groups in Amenia are 50 to 54 Years (81 | 15.5%) for men and 5 to 9 Years (58 | 18.8%) for women.
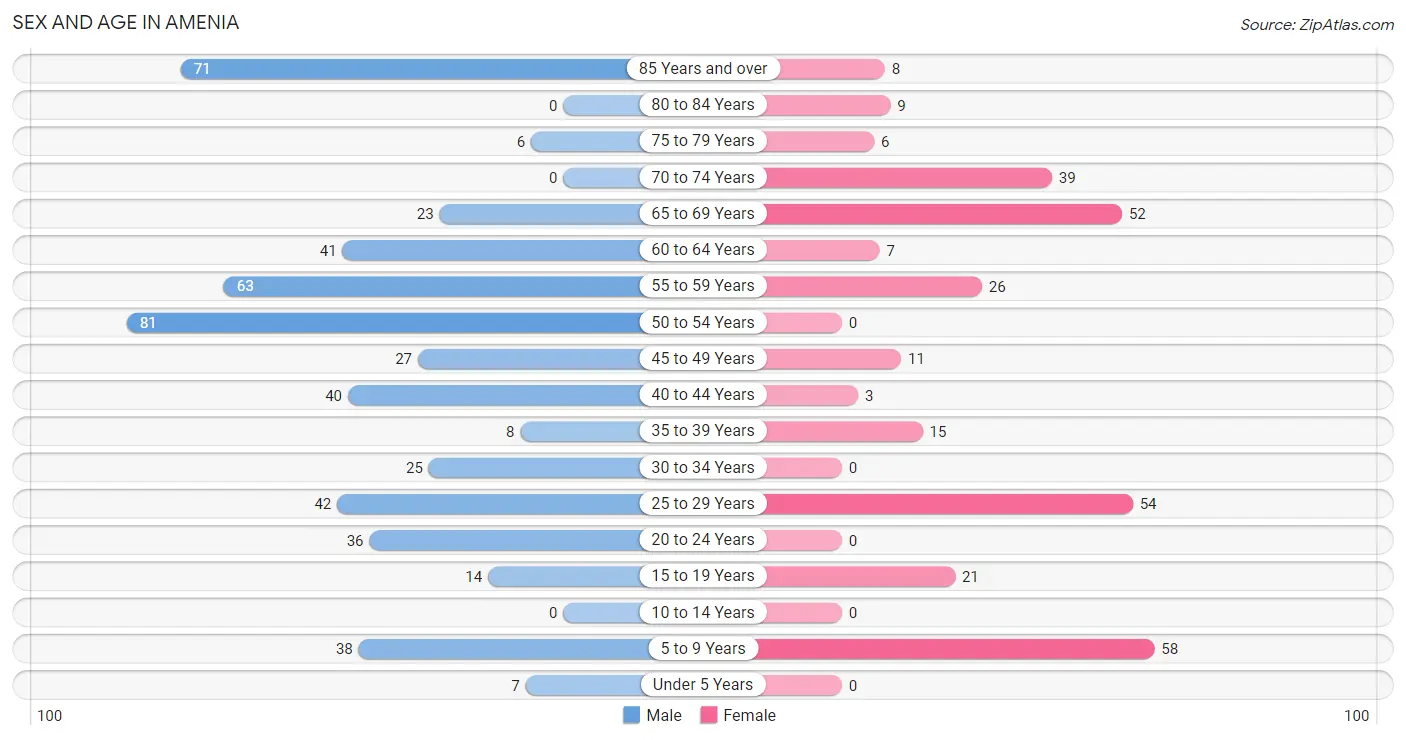
| Age Bracket | Male | Female |
| Under 5 Years | 7 (1.3%) | 0 (0.0%) |
| 5 to 9 Years | 38 (7.3%) | 58 (18.8%) |
| 10 to 14 Years | 0 (0.0%) | 0 (0.0%) |
| 15 to 19 Years | 14 (2.7%) | 21 (6.8%) |
| 20 to 24 Years | 36 (6.9%) | 0 (0.0%) |
| 25 to 29 Years | 42 (8.1%) | 54 (17.5%) |
| 30 to 34 Years | 25 (4.8%) | 0 (0.0%) |
| 35 to 39 Years | 8 (1.5%) | 15 (4.9%) |
| 40 to 44 Years | 40 (7.7%) | 3 (1.0%) |
| 45 to 49 Years | 27 (5.2%) | 11 (3.6%) |
| 50 to 54 Years | 81 (15.5%) | 0 (0.0%) |
| 55 to 59 Years | 63 (12.1%) | 26 (8.4%) |
| 60 to 64 Years | 41 (7.9%) | 7 (2.3%) |
| 65 to 69 Years | 23 (4.4%) | 52 (16.8%) |
| 70 to 74 Years | 0 (0.0%) | 39 (12.6%) |
| 75 to 79 Years | 6 (1.1%) | 6 (1.9%) |
| 80 to 84 Years | 0 (0.0%) | 9 (2.9%) |
| 85 Years and over | 71 (13.6%) | 8 (2.6%) |
| Total | 522 (100.0%) | 309 (100.0%) |
Families and Households in Amenia
Median Family Size in Amenia
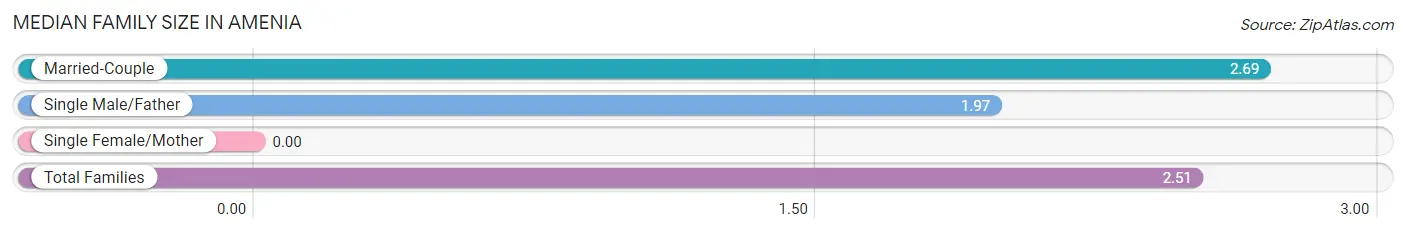
| Family Type | # Families | Family Size |
| Married-Couple | 190 (74.8%) | 2.69 |
| Single Male/Father | 64 (25.2%) | 1.97 |
| Single Female/Mother | 0 (0.0%) | - |
| Total Families | 254 (100.0%) | 2.51 |
Median Household Size in Amenia
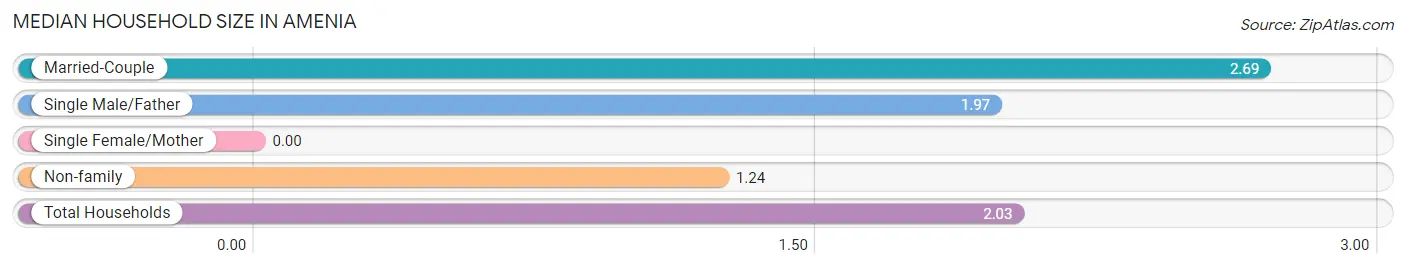
| Household Type | # Households | Household Size |
| Married-Couple | 190 (46.3%) | 2.69 |
| Single Male/Father | 64 (15.6%) | 1.97 |
| Single Female/Mother | 0 (0.0%) | - |
| Non-family | 156 (38.1%) | 1.24 |
| Total Households | 410 (100.0%) | 2.03 |
Household Size by Marriage Status in Amenia
Out of a total of 410 households in Amenia, 254 (62.0%) are family households, while 156 (38.1%) are nonfamily households. The most numerous type of family households are 2-person households, comprising 119, and the most common type of nonfamily households are 1-person households, comprising 134.
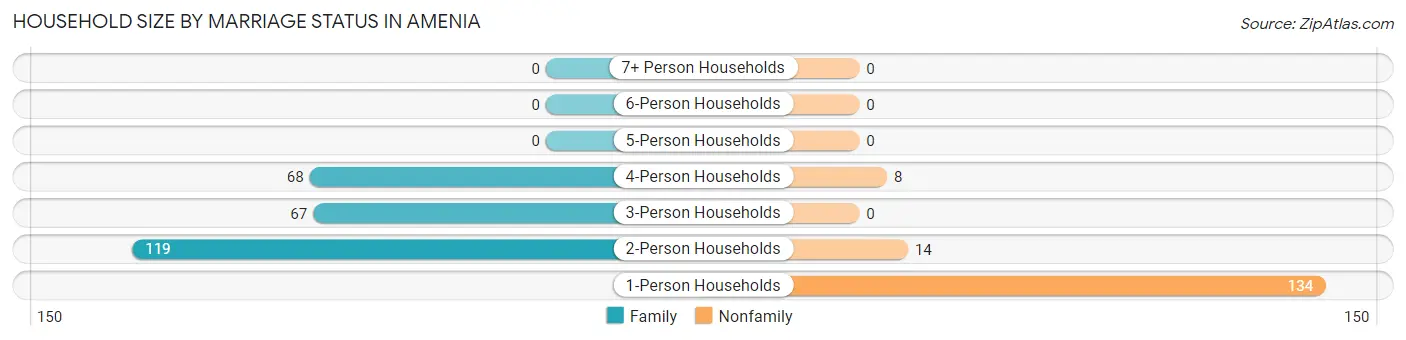
| Household Size | Family Households | Nonfamily Households |
| 1-Person Households | - | 134 (32.7%) |
| 2-Person Households | 119 (29.0%) | 14 (3.4%) |
| 3-Person Households | 67 (16.3%) | 0 (0.0%) |
| 4-Person Households | 68 (16.6%) | 8 (1.9%) |
| 5-Person Households | 0 (0.0%) | 0 (0.0%) |
| 6-Person Households | 0 (0.0%) | 0 (0.0%) |
| 7+ Person Households | 0 (0.0%) | 0 (0.0%) |
| Total | 254 (62.0%) | 156 (38.1%) |
Female Fertility in Amenia
Fertility by Age in Amenia
| Age Bracket | Women with Births | Births / 1,000 Women |
| 15 to 19 years | 0 (0.0%) | 0.0 |
| 20 to 34 years | 0 (0.0%) | 0.0 |
| 35 to 50 years | 0 (0.0%) | 0.0 |
| Total | 0 (0.0%) | 0.0 |
Fertility by Age by Marriage Status in Amenia
| Age Bracket | Married | Unmarried |
| 15 to 19 years | 0 (0.0%) | 0 (0.0%) |
| 20 to 34 years | 0 (0.0%) | 0 (0.0%) |
| 35 to 50 years | 0 (0.0%) | 0 (0.0%) |
| Total | 0 (0.0%) | 0 (0.0%) |
Fertility by Education in Amenia
| Educational Attainment | Women with Births | Births / 1,000 Women |
| Less than High School | 0 (0.0%) | 0.0 |
| High School Diploma | 0 (0.0%) | 0.0 |
| College or Associate's Degree | 0 (0.0%) | 0.0 |
| Bachelor's Degree | 0 (0.0%) | 0.0 |
| Graduate Degree | 0 (0.0%) | 0.0 |
| Total | 0 (0.0%) | 0.0 |
Fertility by Education by Marriage Status in Amenia
| Educational Attainment | Married | Unmarried |
| Less than High School | 0 (0.0%) | 0 (0.0%) |
| High School Diploma | 0 (0.0%) | 0 (0.0%) |
| College or Associate's Degree | 0 (0.0%) | 0 (0.0%) |
| Bachelor's Degree | 0 (0.0%) | 0 (0.0%) |
| Graduate Degree | 0 (0.0%) | 0 (0.0%) |
| Total | 0 (0.0%) | 0 (0.0%) |
Income in Amenia
Income Overview in Amenia
Per Capita Income in Amenia is $39,850, while median incomes of families and households are $90,167 and $78,512 respectively.
| Characteristic | Number | Measure |
| Per Capita Income | 831 | $39,850 |
| Median Family Income | 254 | $90,167 |
| Mean Family Income | 254 | $105,084 |
| Median Household Income | 410 | $78,512 |
| Mean Household Income | 410 | $83,582 |
| Income Deficit | 254 | $0 |
| Wage / Income Gap (%) | 831 | 6.98% |
| Wage / Income Gap ($) | 831 | 93.02¢ per $1 |
| Gini / Inequality Index | 831 | 0.39 |
Earnings by Sex in Amenia
Average Earnings in Amenia are $48,571, $48,061 for men and $51,667 for women, a difference of 7.0%.
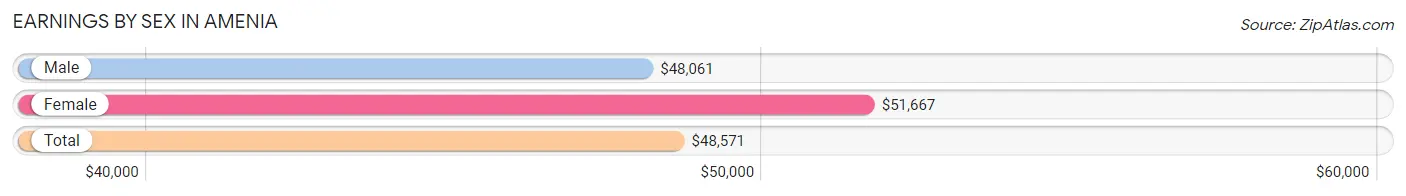
| Sex | Number | Average Earnings |
| Male | 352 (73.6%) | $48,061 |
| Female | 126 (26.4%) | $51,667 |
| Total | 478 (100.0%) | $48,571 |
Earnings by Sex by Income Bracket in Amenia
The most common earnings brackets in Amenia are $45,000 to $49,999 for men (118 | 33.5%) and $75,000 to $99,999 for women (31 | 24.6%).
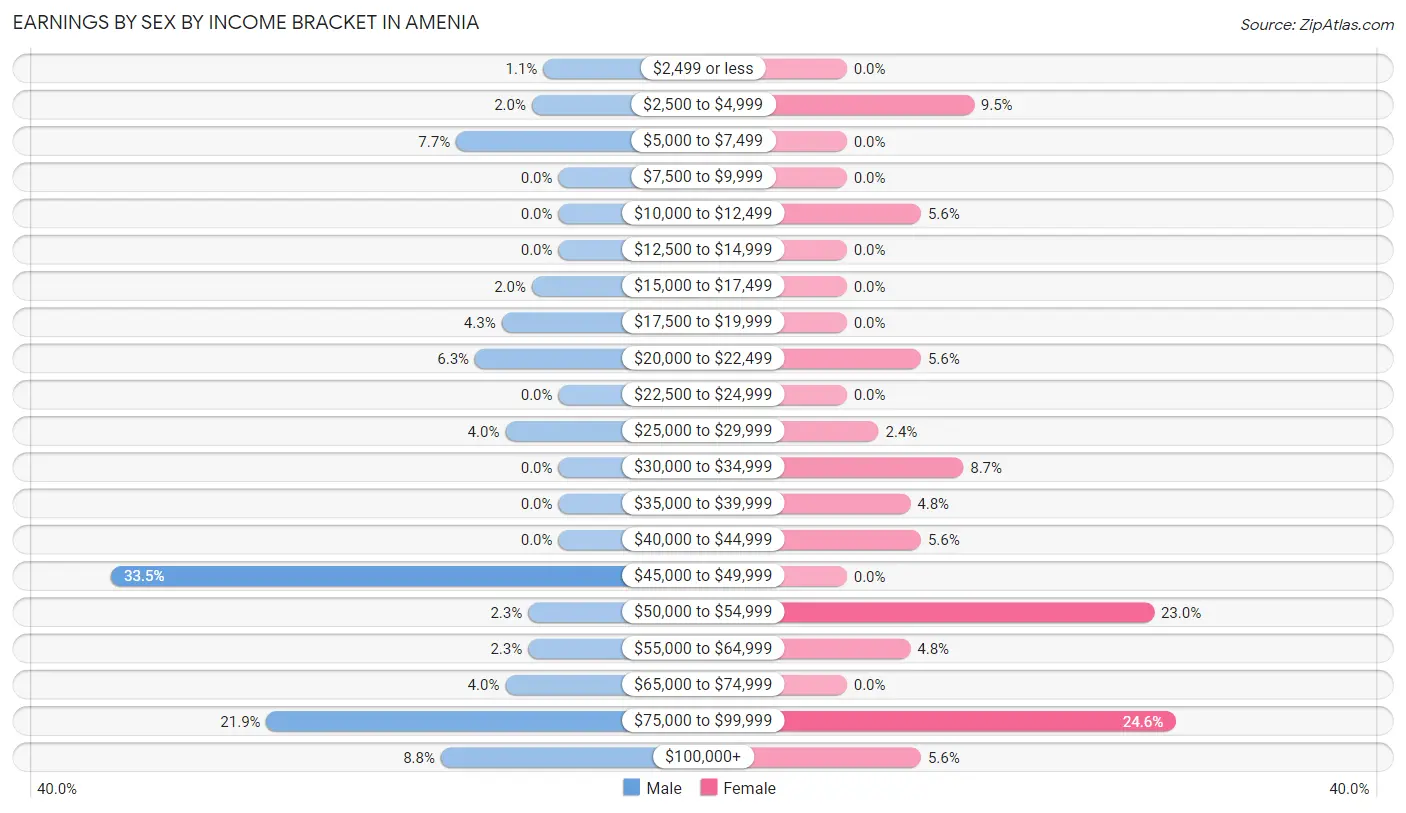
| Income | Male | Female |
| $2,499 or less | 4 (1.1%) | 0 (0.0%) |
| $2,500 to $4,999 | 7 (2.0%) | 12 (9.5%) |
| $5,000 to $7,499 | 27 (7.7%) | 0 (0.0%) |
| $7,500 to $9,999 | 0 (0.0%) | 0 (0.0%) |
| $10,000 to $12,499 | 0 (0.0%) | 7 (5.6%) |
| $12,500 to $14,999 | 0 (0.0%) | 0 (0.0%) |
| $15,000 to $17,499 | 7 (2.0%) | 0 (0.0%) |
| $17,500 to $19,999 | 15 (4.3%) | 0 (0.0%) |
| $20,000 to $22,499 | 22 (6.2%) | 7 (5.6%) |
| $22,500 to $24,999 | 0 (0.0%) | 0 (0.0%) |
| $25,000 to $29,999 | 14 (4.0%) | 3 (2.4%) |
| $30,000 to $34,999 | 0 (0.0%) | 11 (8.7%) |
| $35,000 to $39,999 | 0 (0.0%) | 6 (4.8%) |
| $40,000 to $44,999 | 0 (0.0%) | 7 (5.6%) |
| $45,000 to $49,999 | 118 (33.5%) | 0 (0.0%) |
| $50,000 to $54,999 | 8 (2.3%) | 29 (23.0%) |
| $55,000 to $64,999 | 8 (2.3%) | 6 (4.8%) |
| $65,000 to $74,999 | 14 (4.0%) | 0 (0.0%) |
| $75,000 to $99,999 | 77 (21.9%) | 31 (24.6%) |
| $100,000+ | 31 (8.8%) | 7 (5.6%) |
| Total | 352 (100.0%) | 126 (100.0%) |
Earnings by Sex by Educational Attainment in Amenia
Average earnings in Amenia are $49,337 for men and $52,083 for women, a difference of 5.3%. Men with an educational attainment of bachelor's degree enjoy the highest average annual earnings of $92,188, while those with college or associate's degree education earn the least with $46,520. Women with an educational attainment of college or associate's degree earn the most with the average annual earnings of $50,250, while those with bachelor's degree education have the smallest earnings of $21,250.
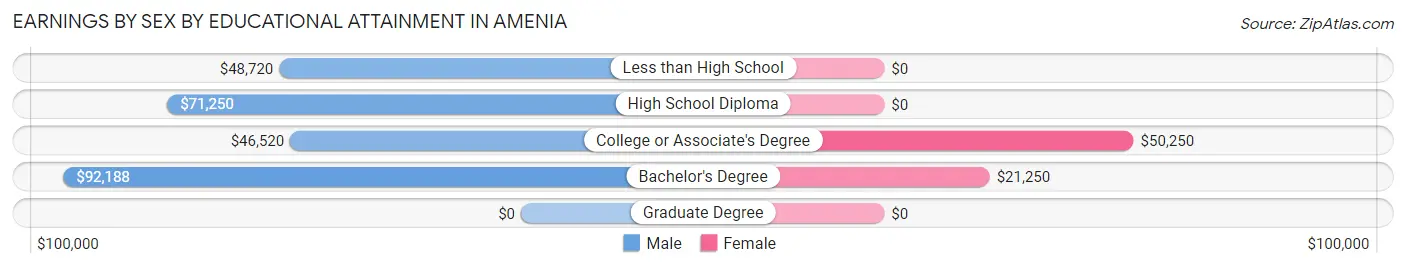
| Educational Attainment | Male Income | Female Income |
| Less than High School | $48,720 | $0 |
| High School Diploma | $71,250 | $0 |
| College or Associate's Degree | $46,520 | $50,250 |
| Bachelor's Degree | $92,188 | $21,250 |
| Graduate Degree | - | - |
| Total | $49,337 | $52,083 |
Family Income in Amenia
Family Income Brackets in Amenia
According to the Amenia family income data, there are 90 families falling into the $100,000 to $149,999 income range, which is the most common income bracket and makes up 35.4% of all families.
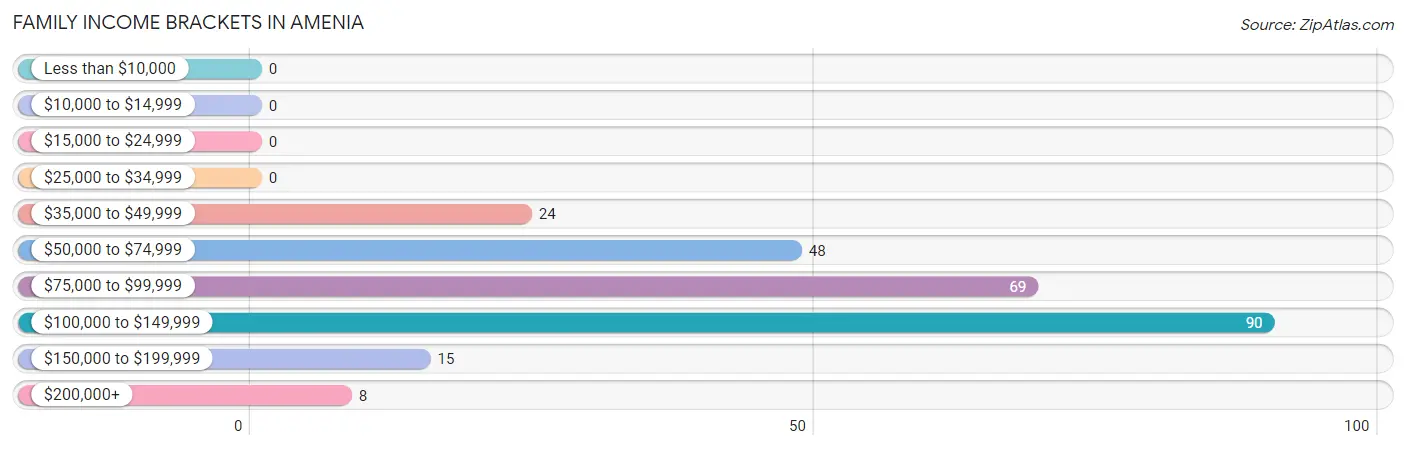
| Income Bracket | # Families | % Families |
| Less than $10,000 | 0 | 0.0% |
| $10,000 to $14,999 | 0 | 0.0% |
| $15,000 to $24,999 | 0 | 0.0% |
| $25,000 to $34,999 | 0 | 0.0% |
| $35,000 to $49,999 | 24 | 9.4% |
| $50,000 to $74,999 | 48 | 18.9% |
| $75,000 to $99,999 | 69 | 27.2% |
| $100,000 to $149,999 | 90 | 35.4% |
| $150,000 to $199,999 | 15 | 5.9% |
| $200,000+ | 8 | 3.1% |
Family Income by Famaliy Size in Amenia
2-person families (119 | 46.9%) account for the highest median family income in Amenia with $136,620 per family, while 2-person families (119 | 46.9%) have the highest median income of $68,310 per family member.
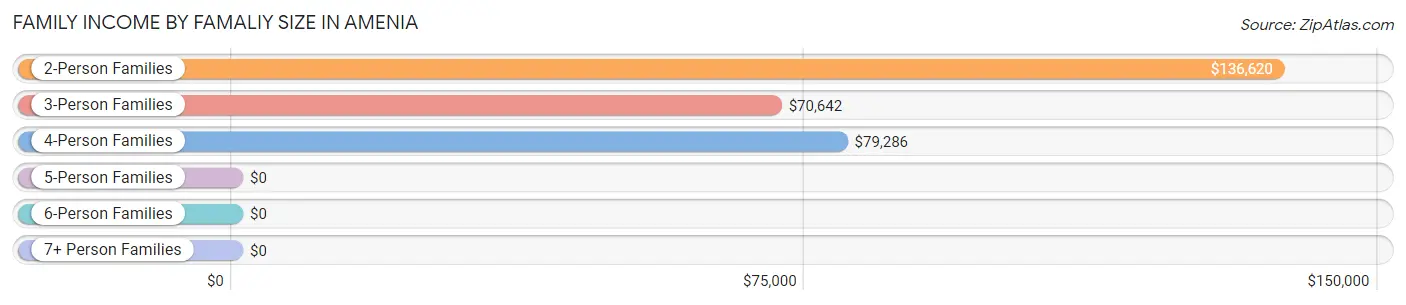
| Income Bracket | # Families | Median Income |
| 2-Person Families | 119 (46.9%) | $136,620 |
| 3-Person Families | 67 (26.4%) | $70,642 |
| 4-Person Families | 68 (26.8%) | $79,286 |
| 5-Person Families | 0 (0.0%) | $0 |
| 6-Person Families | 0 (0.0%) | $0 |
| 7+ Person Families | 0 (0.0%) | $0 |
| Total | 254 (100.0%) | $90,167 |
Family Income by Number of Earners in Amenia
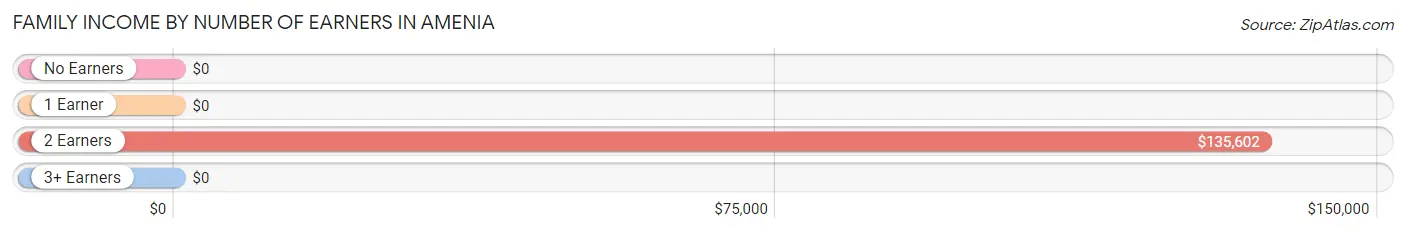
| Number of Earners | # Families | Median Income |
| No Earners | 31 (12.2%) | $0 |
| 1 Earner | 48 (18.9%) | $0 |
| 2 Earners | 171 (67.3%) | $135,602 |
| 3+ Earners | 4 (1.6%) | $0 |
| Total | 254 (100.0%) | $90,167 |
Household Income in Amenia
Household Income Brackets in Amenia
With 112 households falling in the category, the $100,000 to $149,999 income range is the most frequent in Amenia, accounting for 27.3% of all households. In contrast, only 7 households (1.7%) fall into the $15,000 to $24,999 income bracket, making it the least populous group.
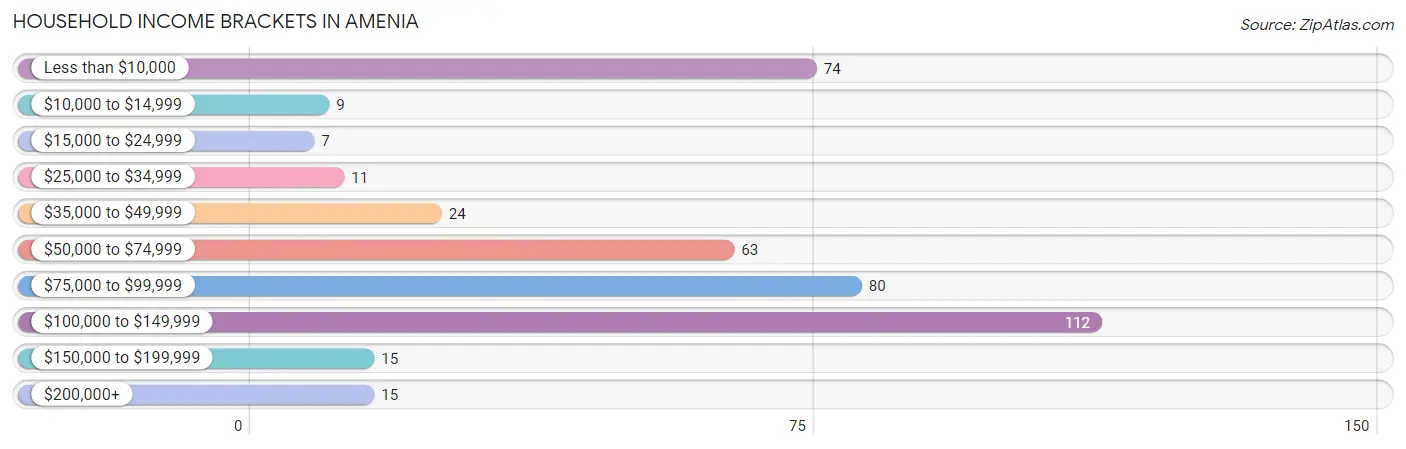
| Income Bracket | # Households | % Households |
| Less than $10,000 | 74 | 18.0% |
| $10,000 to $14,999 | 9 | 2.2% |
| $15,000 to $24,999 | 7 | 1.7% |
| $25,000 to $34,999 | 11 | 2.7% |
| $35,000 to $49,999 | 24 | 5.9% |
| $50,000 to $74,999 | 63 | 15.4% |
| $75,000 to $99,999 | 80 | 19.5% |
| $100,000 to $149,999 | 112 | 27.3% |
| $150,000 to $199,999 | 15 | 3.7% |
| $200,000+ | 15 | 3.7% |
Household Income by Householder Age in Amenia
The median household income in Amenia is $78,512, with the highest median household income of $88,438 found in the 45 to 64 years age bracket for the primary householder. A total of 195 households (47.6%) fall into this category.
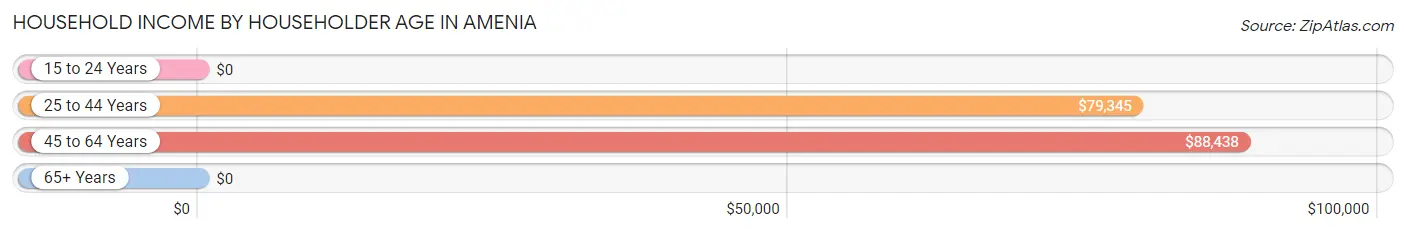
| Income Bracket | # Households | Median Income |
| 15 to 24 Years | 0 (0.0%) | $0 |
| 25 to 44 Years | 82 (20.0%) | $79,345 |
| 45 to 64 Years | 195 (47.6%) | $88,438 |
| 65+ Years | 133 (32.4%) | $0 |
| Total | 410 (100.0%) | $78,512 |
Poverty in Amenia
Income Below Poverty by Sex and Age in Amenia
With 15.7% poverty level for males and 2.9% for females among the residents of Amenia, 75 year old and over males and 75 year old and over females are the most vulnerable to poverty, with 47 males (61.0%) and 9 females (39.1%) in their respective age groups living below the poverty level.
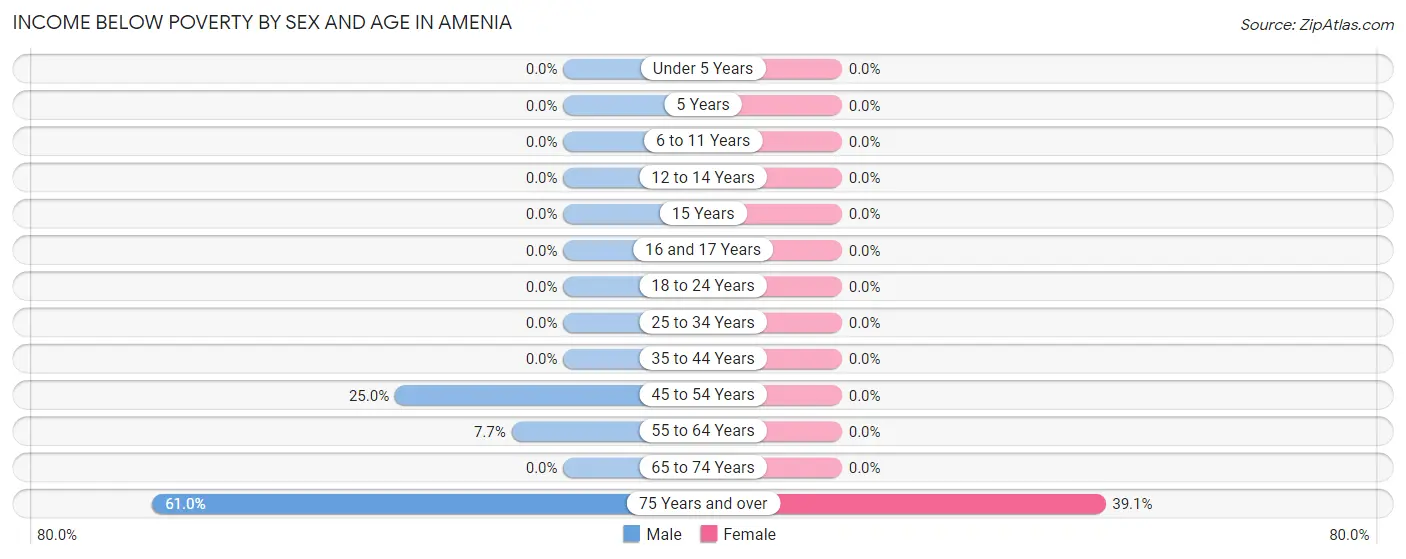
| Age Bracket | Male | Female |
| Under 5 Years | 0 (0.0%) | 0 (0.0%) |
| 5 Years | 0 (0.0%) | 0 (0.0%) |
| 6 to 11 Years | 0 (0.0%) | 0 (0.0%) |
| 12 to 14 Years | 0 (0.0%) | 0 (0.0%) |
| 15 Years | 0 (0.0%) | 0 (0.0%) |
| 16 and 17 Years | 0 (0.0%) | 0 (0.0%) |
| 18 to 24 Years | 0 (0.0%) | 0 (0.0%) |
| 25 to 34 Years | 0 (0.0%) | 0 (0.0%) |
| 35 to 44 Years | 0 (0.0%) | 0 (0.0%) |
| 45 to 54 Years | 27 (25.0%) | 0 (0.0%) |
| 55 to 64 Years | 8 (7.7%) | 0 (0.0%) |
| 65 to 74 Years | 0 (0.0%) | 0 (0.0%) |
| 75 Years and over | 47 (61.0%) | 9 (39.1%) |
| Total | 82 (15.7%) | 9 (2.9%) |
Income Above Poverty by Sex and Age in Amenia
According to the poverty statistics in Amenia, males aged under 5 years and females aged 6 to 11 years are the age groups that are most secure financially, with 100.0% of males and 100.0% of females in these age groups living above the poverty line.
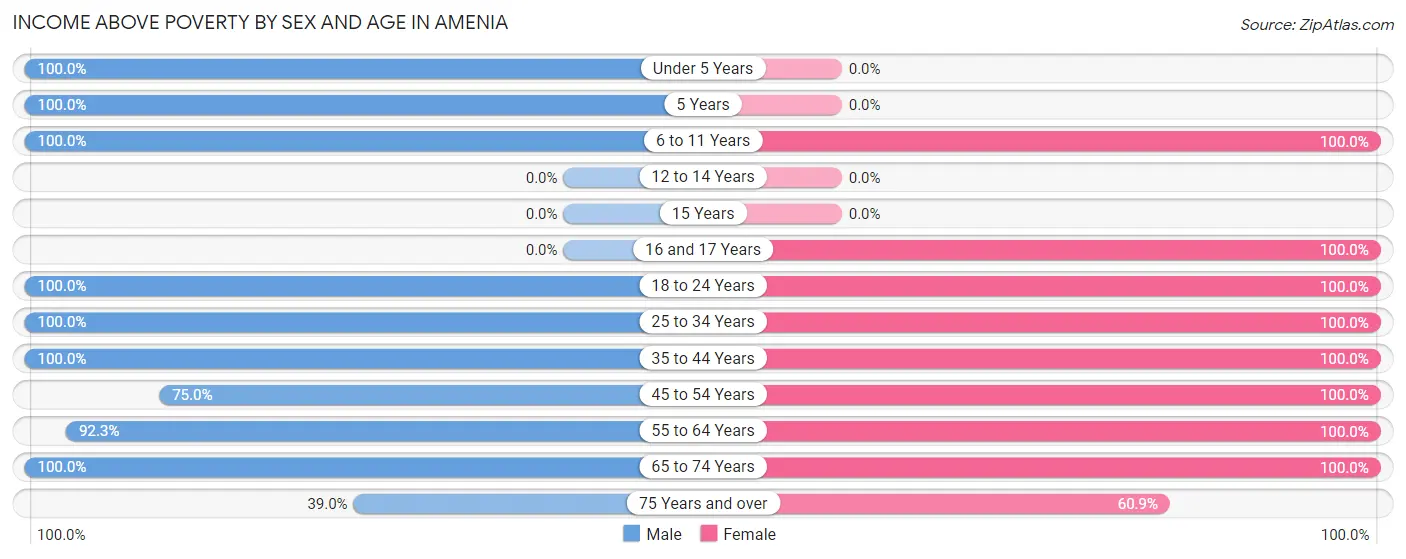
| Age Bracket | Male | Female |
| Under 5 Years | 7 (100.0%) | 0 (0.0%) |
| 5 Years | 15 (100.0%) | 0 (0.0%) |
| 6 to 11 Years | 23 (100.0%) | 58 (100.0%) |
| 12 to 14 Years | 0 (0.0%) | 0 (0.0%) |
| 15 Years | 0 (0.0%) | 0 (0.0%) |
| 16 and 17 Years | 0 (0.0%) | 16 (100.0%) |
| 18 to 24 Years | 50 (100.0%) | 5 (100.0%) |
| 25 to 34 Years | 67 (100.0%) | 54 (100.0%) |
| 35 to 44 Years | 48 (100.0%) | 18 (100.0%) |
| 45 to 54 Years | 81 (75.0%) | 11 (100.0%) |
| 55 to 64 Years | 96 (92.3%) | 33 (100.0%) |
| 65 to 74 Years | 23 (100.0%) | 91 (100.0%) |
| 75 Years and over | 30 (39.0%) | 14 (60.9%) |
| Total | 440 (84.3%) | 300 (97.1%) |
Income Below Poverty Among Married-Couple Families in Amenia
| Children | Above Poverty | Below Poverty |
| No Children | 126 (100.0%) | 0 (0.0%) |
| 1 or 2 Children | 64 (100.0%) | 0 (0.0%) |
| 3 or 4 Children | 0 (0.0%) | 0 (0.0%) |
| 5 or more Children | 0 (0.0%) | 0 (0.0%) |
| Total | 190 (100.0%) | 0 (0.0%) |
Income Below Poverty Among Single-Parent Households in Amenia
| Children | Single Father | Single Mother |
| No Children | 0 (0.0%) | 0 (0.0%) |
| 1 or 2 Children | 0 (0.0%) | 0 (0.0%) |
| 3 or 4 Children | 0 (0.0%) | 0 (0.0%) |
| 5 or more Children | 0 (0.0%) | 0 (0.0%) |
| Total | 0 (0.0%) | 0 (0.0%) |
Income Below Poverty Among Married-Couple vs Single-Parent Households in Amenia
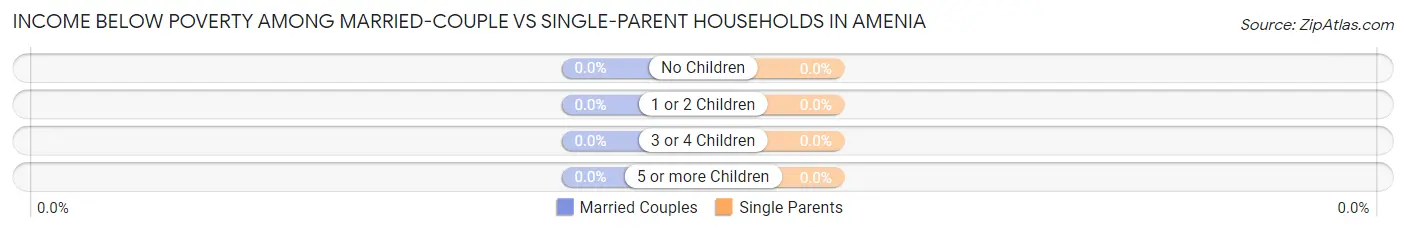
| Children | Married-Couple Families | Single-Parent Households |
| No Children | 0 (0.0%) | 0 (0.0%) |
| 1 or 2 Children | 0 (0.0%) | 0 (0.0%) |
| 3 or 4 Children | 0 (0.0%) | 0 (0.0%) |
| 5 or more Children | 0 (0.0%) | 0 (0.0%) |
| Total | 0 (0.0%) | 0 (0.0%) |
Employment Characteristics in Amenia
Employment by Class of Employer in Amenia
Among the 460 employed individuals in Amenia, private company employees (332 | 72.2%), not-for-profit organizations (53 | 11.5%), and self-employed (not incorporated) (27 | 5.9%) make up the most common classes of employment.
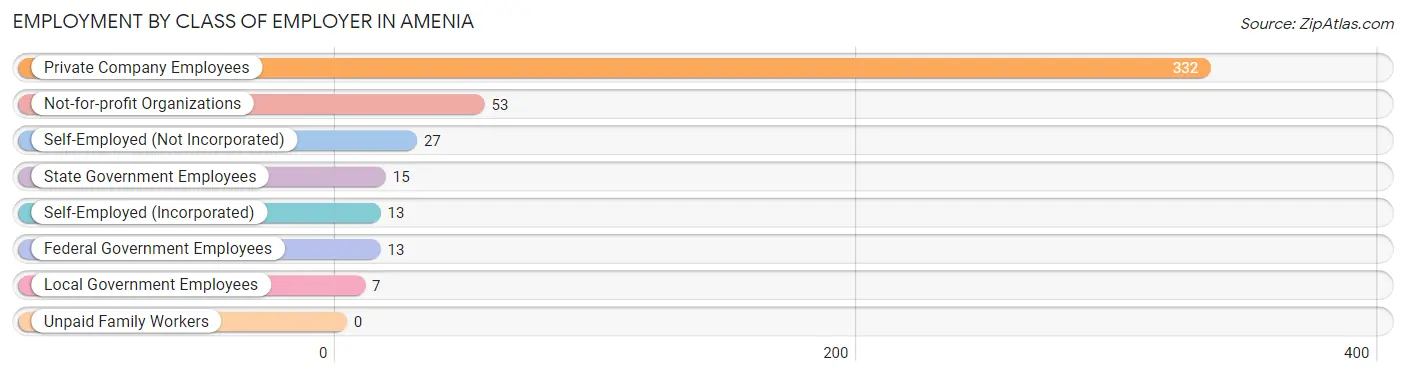
| Employer Class | # Employees | % Employees |
| Private Company Employees | 332 | 72.2% |
| Self-Employed (Incorporated) | 13 | 2.8% |
| Self-Employed (Not Incorporated) | 27 | 5.9% |
| Not-for-profit Organizations | 53 | 11.5% |
| Local Government Employees | 7 | 1.5% |
| State Government Employees | 15 | 3.3% |
| Federal Government Employees | 13 | 2.8% |
| Unpaid Family Workers | 0 | 0.0% |
| Total | 460 | 100.0% |
Employment Status by Age in Amenia
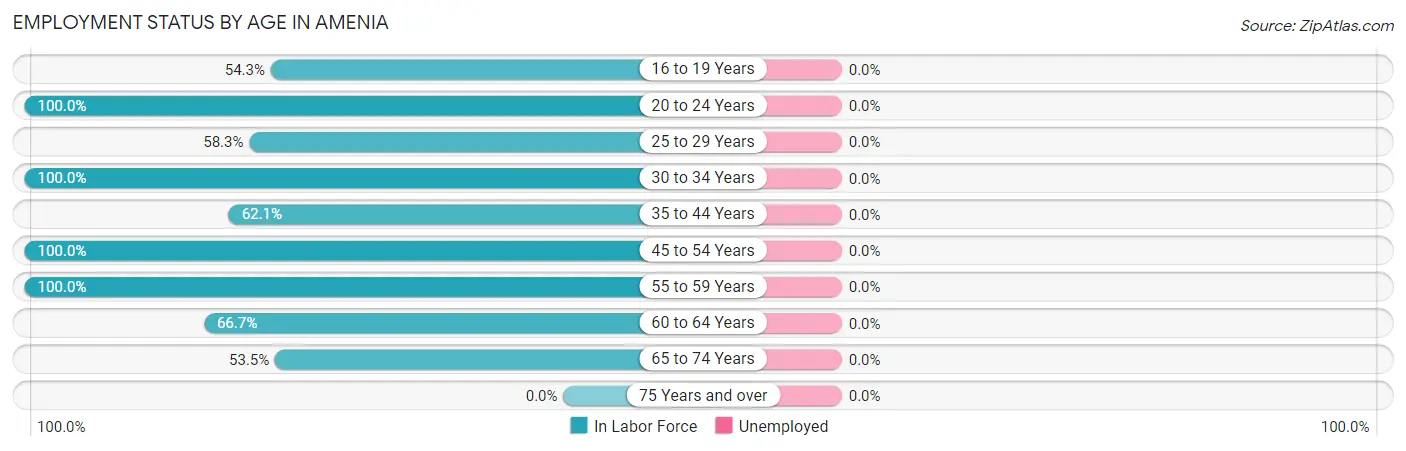
| Age Bracket | In Labor Force | Unemployed |
| 16 to 19 Years | 19 (54.3%) | 0 (0.0%) |
| 20 to 24 Years | 36 (100.0%) | 0 (0.0%) |
| 25 to 29 Years | 56 (58.3%) | 0 (0.0%) |
| 30 to 34 Years | 25 (100.0%) | 0 (0.0%) |
| 35 to 44 Years | 41 (62.1%) | 0 (0.0%) |
| 45 to 54 Years | 119 (100.0%) | 0 (0.0%) |
| 55 to 59 Years | 89 (100.0%) | 0 (0.0%) |
| 60 to 64 Years | 32 (66.7%) | 0 (0.0%) |
| 65 to 74 Years | 61 (53.5%) | 0 (0.0%) |
| 75 Years and over | 0 (0.0%) | 0 (0.0%) |
| Total | 478 (65.7%) | 0 (0.0%) |
Employment Status by Educational Attainment in Amenia
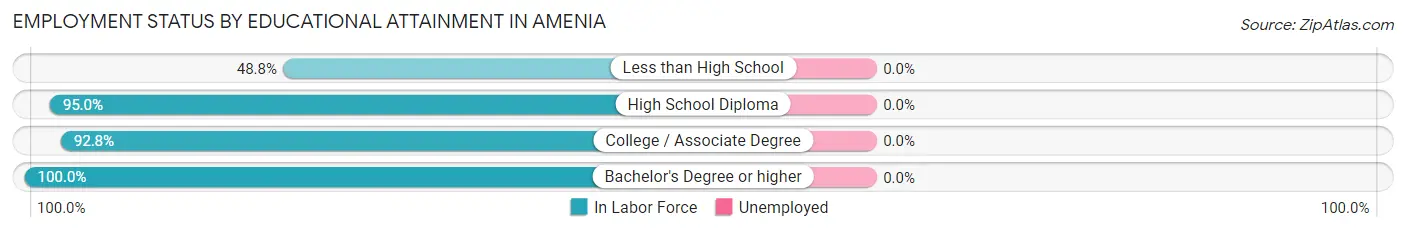
| Educational Attainment | In Labor Force | Unemployed |
| Less than High School | 62 (48.8%) | 0 (0.0%) |
| High School Diploma | 151 (95.0%) | 0 (0.0%) |
| College / Associate Degree | 103 (92.8%) | 0 (0.0%) |
| Bachelor's Degree or higher | 46 (100.0%) | 0 (0.0%) |
| Total | 362 (81.7%) | 0 (0.0%) |
Employment Occupations by Sex in Amenia
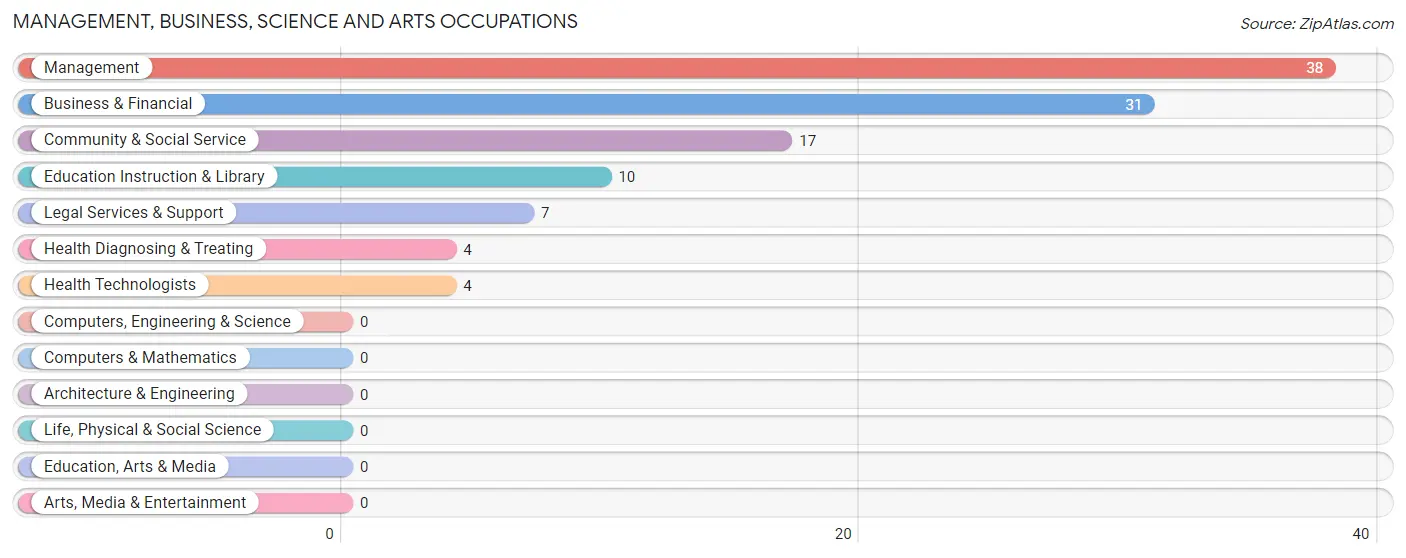
Management, Business, Science and Arts Occupations
The most common Management, Business, Science and Arts occupations in Amenia are Management (38 | 8.0%), Business & Financial (31 | 6.5%), Community & Social Service (17 | 3.6%), Education Instruction & Library (10 | 2.1%), and Legal Services & Support (7 | 1.5%).
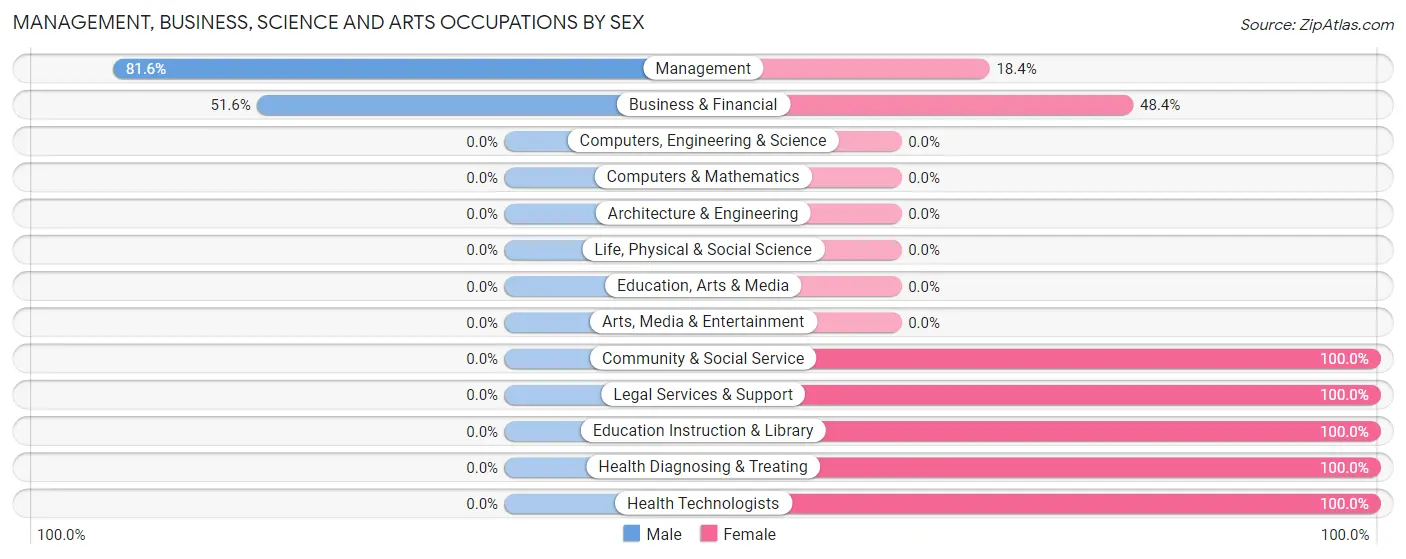
Management, Business, Science and Arts Occupations by Sex
Within the Management, Business, Science and Arts occupations in Amenia, the most male-oriented occupations are Management (81.6%), and Business & Financial (51.6%), while the most female-oriented occupations are Community & Social Service (100.0%), Legal Services & Support (100.0%), and Education Instruction & Library (100.0%).
| Occupation | Male | Female |
| Management | 31 (81.6%) | 7 (18.4%) |
| Business & Financial | 16 (51.6%) | 15 (48.4%) |
| Computers, Engineering & Science | 0 (0.0%) | 0 (0.0%) |
| Computers & Mathematics | 0 (0.0%) | 0 (0.0%) |
| Architecture & Engineering | 0 (0.0%) | 0 (0.0%) |
| Life, Physical & Social Science | 0 (0.0%) | 0 (0.0%) |
| Community & Social Service | 0 (0.0%) | 17 (100.0%) |
| Education, Arts & Media | 0 (0.0%) | 0 (0.0%) |
| Legal Services & Support | 0 (0.0%) | 7 (100.0%) |
| Education Instruction & Library | 0 (0.0%) | 10 (100.0%) |
| Arts, Media & Entertainment | 0 (0.0%) | 0 (0.0%) |
| Health Diagnosing & Treating | 0 (0.0%) | 4 (100.0%) |
| Health Technologists | 0 (0.0%) | 4 (100.0%) |
| Total (Category) | 47 (52.2%) | 43 (47.8%) |
| Total (Overall) | 352 (73.6%) | 126 (26.4%) |
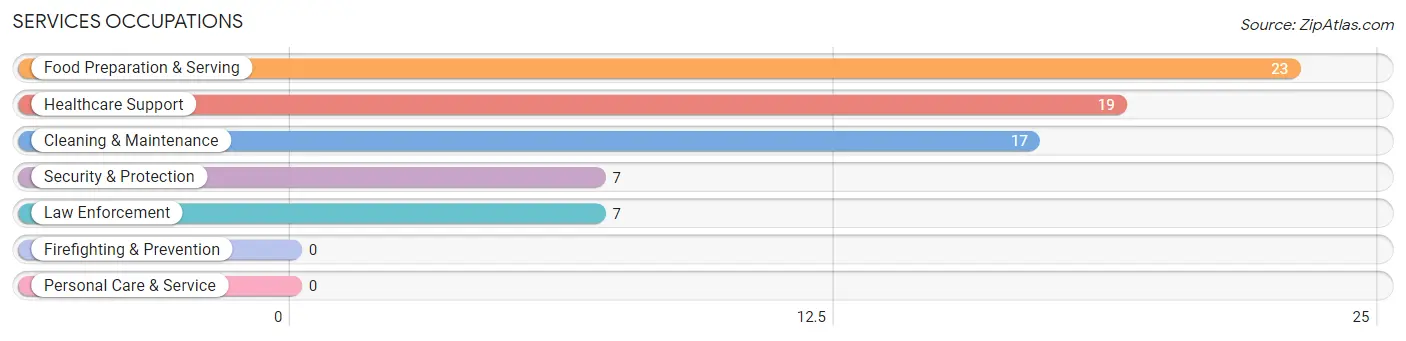
Services Occupations
The most common Services occupations in Amenia are Food Preparation & Serving (23 | 4.8%), Healthcare Support (19 | 4.0%), Cleaning & Maintenance (17 | 3.6%), Security & Protection (7 | 1.5%), and Law Enforcement (7 | 1.5%).
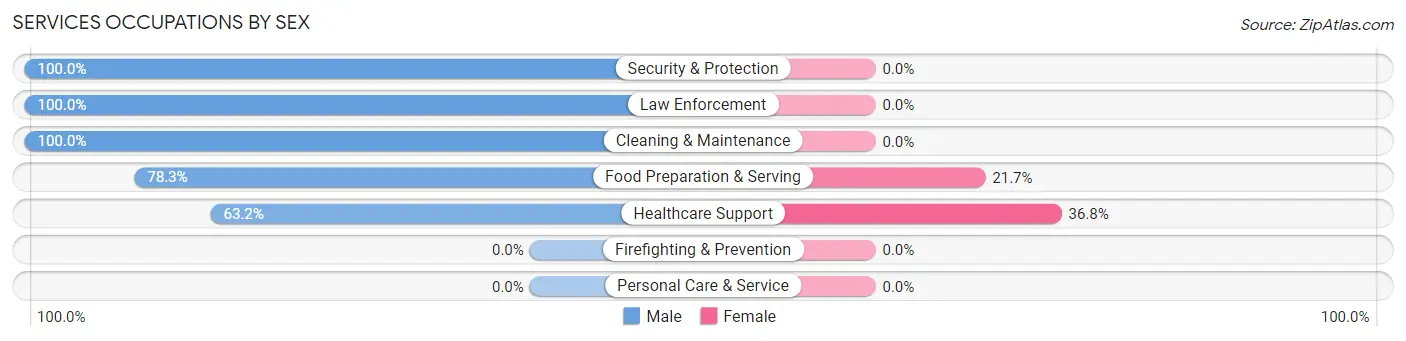
Services Occupations by Sex
Within the Services occupations in Amenia, the most male-oriented occupations are Security & Protection (100.0%), Law Enforcement (100.0%), and Cleaning & Maintenance (100.0%), while the most female-oriented occupations are Healthcare Support (36.8%), and Food Preparation & Serving (21.7%).
| Occupation | Male | Female |
| Healthcare Support | 12 (63.2%) | 7 (36.8%) |
| Security & Protection | 7 (100.0%) | 0 (0.0%) |
| Firefighting & Prevention | 0 (0.0%) | 0 (0.0%) |
| Law Enforcement | 7 (100.0%) | 0 (0.0%) |
| Food Preparation & Serving | 18 (78.3%) | 5 (21.7%) |
| Cleaning & Maintenance | 17 (100.0%) | 0 (0.0%) |
| Personal Care & Service | 0 (0.0%) | 0 (0.0%) |
| Total (Category) | 54 (81.8%) | 12 (18.2%) |
| Total (Overall) | 352 (73.6%) | 126 (26.4%) |
Sales and Office Occupations
The most common Sales and Office occupations in Amenia are Sales & Related (80 | 16.7%), and Office & Administration (27 | 5.7%).
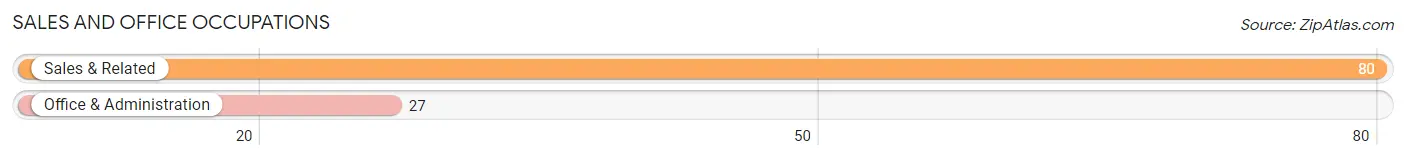
Sales and Office Occupations by Sex
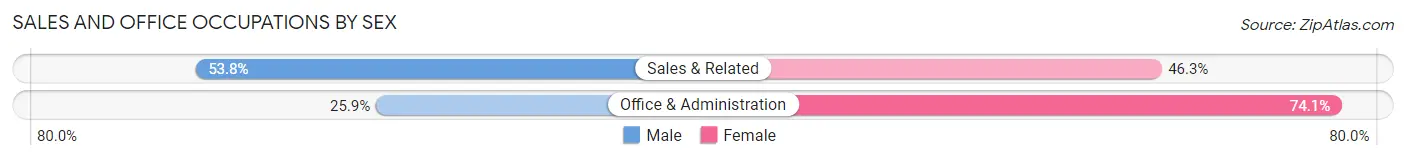
| Occupation | Male | Female |
| Sales & Related | 43 (53.7%) | 37 (46.3%) |
| Office & Administration | 7 (25.9%) | 20 (74.1%) |
| Total (Category) | 50 (46.7%) | 57 (53.3%) |
| Total (Overall) | 352 (73.6%) | 126 (26.4%) |
Natural Resources, Construction and Maintenance Occupations
The most common Natural Resources, Construction and Maintenance occupations in Amenia are Construction & Extraction (33 | 6.9%), and Farming, Fishing & Forestry (7 | 1.5%).
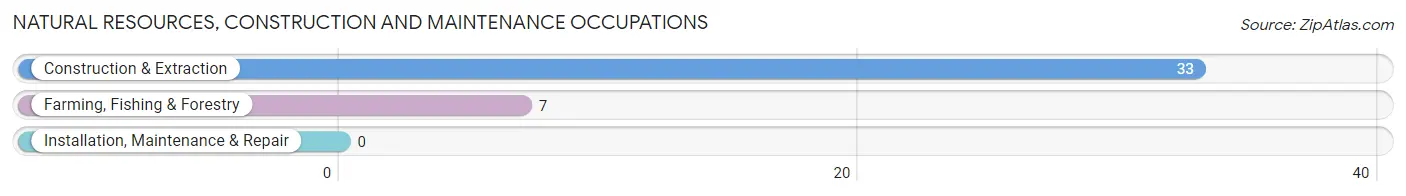
Natural Resources, Construction and Maintenance Occupations by Sex
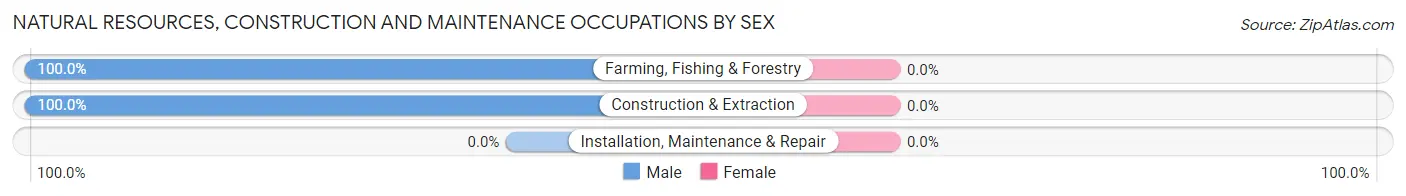
| Occupation | Male | Female |
| Farming, Fishing & Forestry | 7 (100.0%) | 0 (0.0%) |
| Construction & Extraction | 33 (100.0%) | 0 (0.0%) |
| Installation, Maintenance & Repair | 0 (0.0%) | 0 (0.0%) |
| Total (Category) | 40 (100.0%) | 0 (0.0%) |
| Total (Overall) | 352 (73.6%) | 126 (26.4%) |
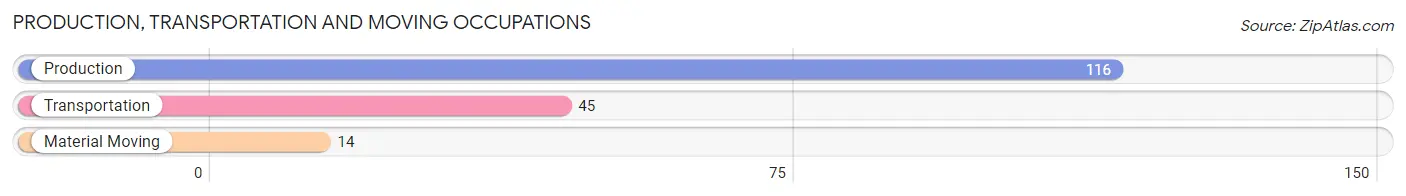
Production, Transportation and Moving Occupations
The most common Production, Transportation and Moving occupations in Amenia are Production (116 | 24.3%), Transportation (45 | 9.4%), and Material Moving (14 | 2.9%).
Production, Transportation and Moving Occupations by Sex
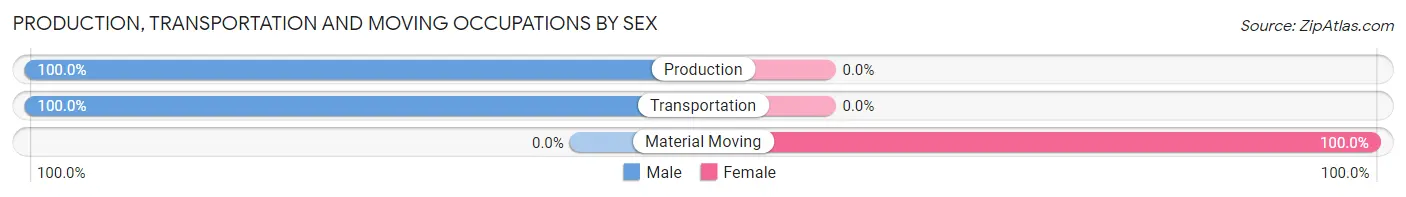
| Occupation | Male | Female |
| Production | 116 (100.0%) | 0 (0.0%) |
| Transportation | 45 (100.0%) | 0 (0.0%) |
| Material Moving | 0 (0.0%) | 14 (100.0%) |
| Total (Category) | 161 (92.0%) | 14 (8.0%) |
| Total (Overall) | 352 (73.6%) | 126 (26.4%) |
Employment Industries by Sex in Amenia
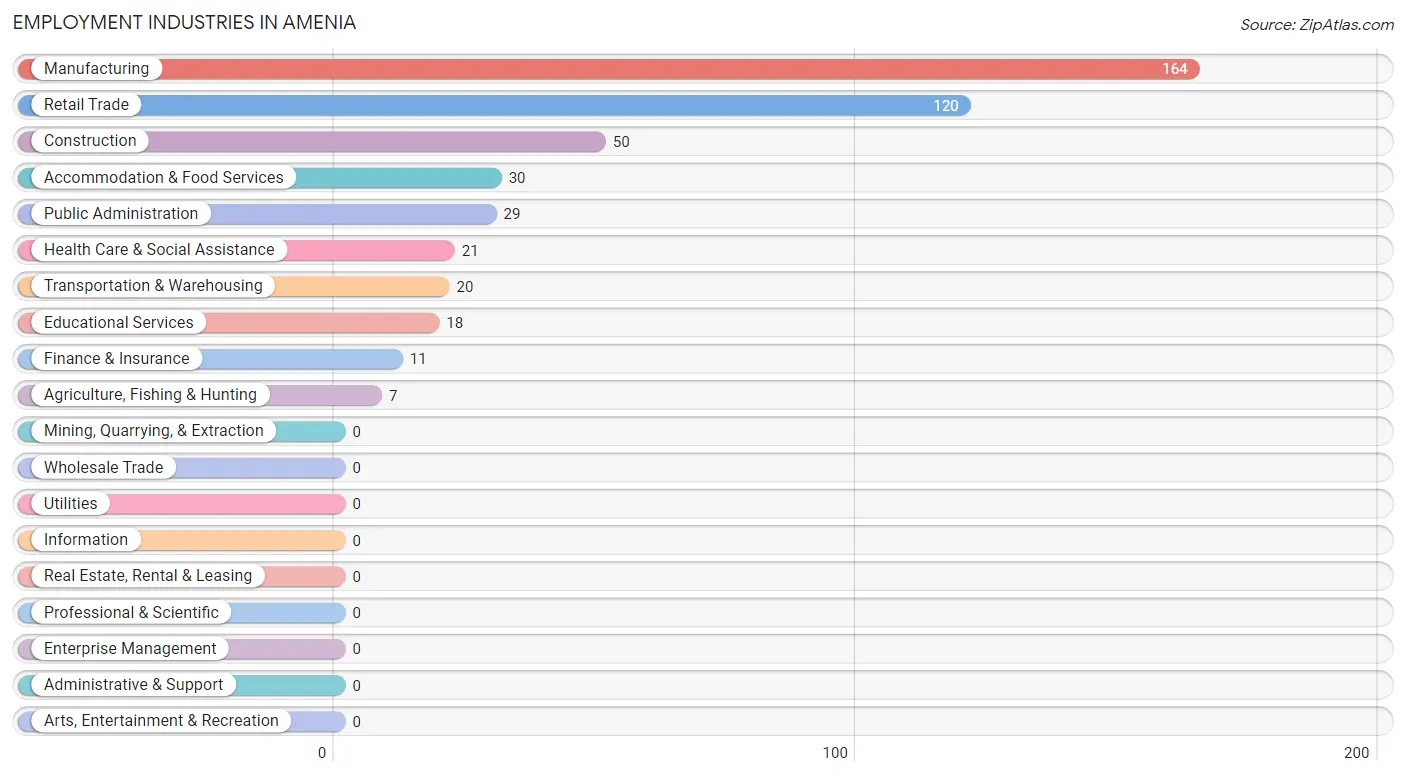
Employment Industries in Amenia
The major employment industries in Amenia include Manufacturing (164 | 34.3%), Retail Trade (120 | 25.1%), Construction (50 | 10.5%), Accommodation & Food Services (30 | 6.3%), and Public Administration (29 | 6.1%).
Employment Industries by Sex in Amenia
The Amenia industries that see more men than women are Agriculture, Fishing & Hunting (100.0%), Construction (100.0%), and Finance & Insurance (100.0%), whereas the industries that tend to have a higher number of women are Transportation & Warehousing (65.0%), Educational Services (55.6%), and Health Care & Social Assistance (52.4%).
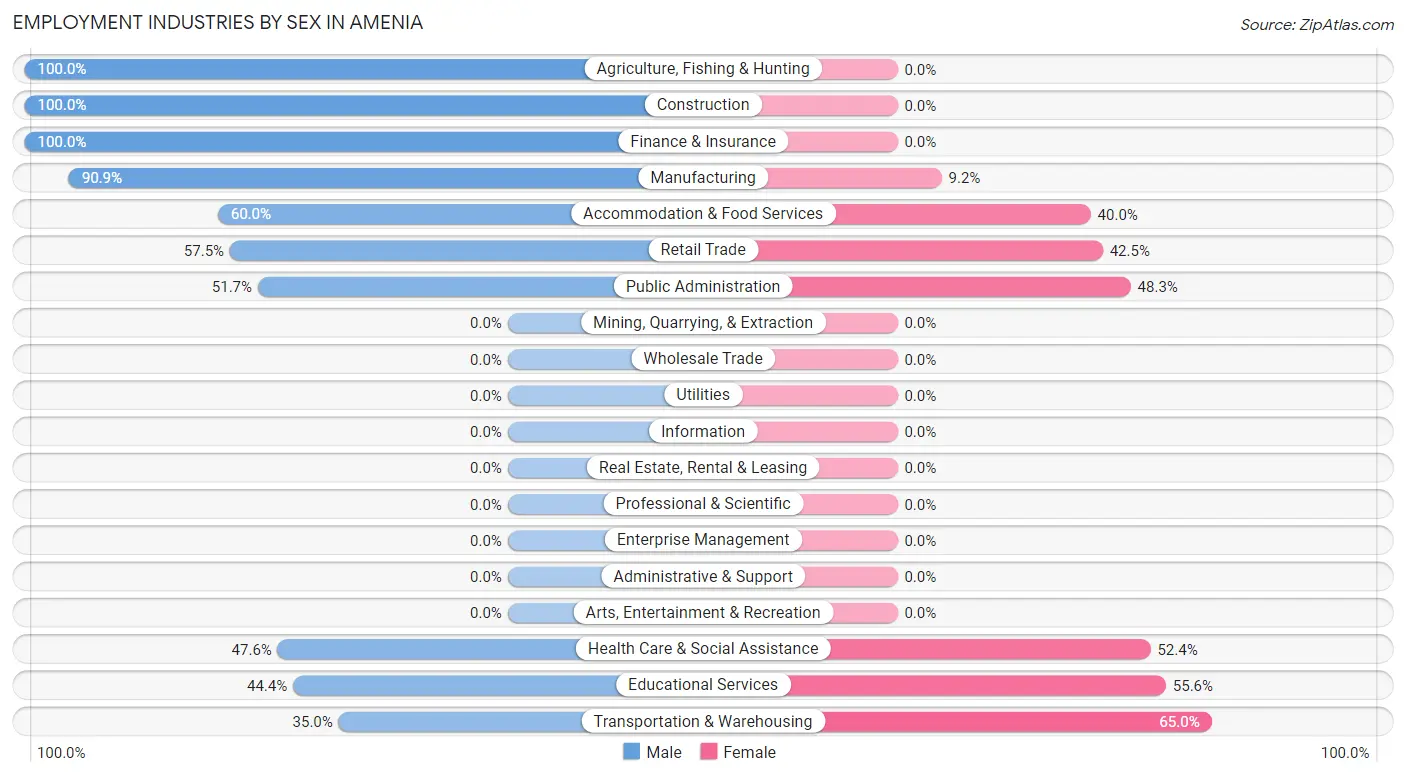
| Industry | Male | Female |
| Agriculture, Fishing & Hunting | 7 (100.0%) | 0 (0.0%) |
| Mining, Quarrying, & Extraction | 0 (0.0%) | 0 (0.0%) |
| Construction | 50 (100.0%) | 0 (0.0%) |
| Manufacturing | 149 (90.8%) | 15 (9.1%) |
| Wholesale Trade | 0 (0.0%) | 0 (0.0%) |
| Retail Trade | 69 (57.5%) | 51 (42.5%) |
| Transportation & Warehousing | 7 (35.0%) | 13 (65.0%) |
| Utilities | 0 (0.0%) | 0 (0.0%) |
| Information | 0 (0.0%) | 0 (0.0%) |
| Finance & Insurance | 11 (100.0%) | 0 (0.0%) |
| Real Estate, Rental & Leasing | 0 (0.0%) | 0 (0.0%) |
| Professional & Scientific | 0 (0.0%) | 0 (0.0%) |
| Enterprise Management | 0 (0.0%) | 0 (0.0%) |
| Administrative & Support | 0 (0.0%) | 0 (0.0%) |
| Educational Services | 8 (44.4%) | 10 (55.6%) |
| Health Care & Social Assistance | 10 (47.6%) | 11 (52.4%) |
| Arts, Entertainment & Recreation | 0 (0.0%) | 0 (0.0%) |
| Accommodation & Food Services | 18 (60.0%) | 12 (40.0%) |
| Public Administration | 15 (51.7%) | 14 (48.3%) |
| Total | 352 (73.6%) | 126 (26.4%) |
Education in Amenia
School Enrollment in Amenia
The most common levels of schooling among the 99 students in Amenia are elementary school (52 | 52.5%), nursery / preschool (22 | 22.2%), and high school (16 | 16.2%).
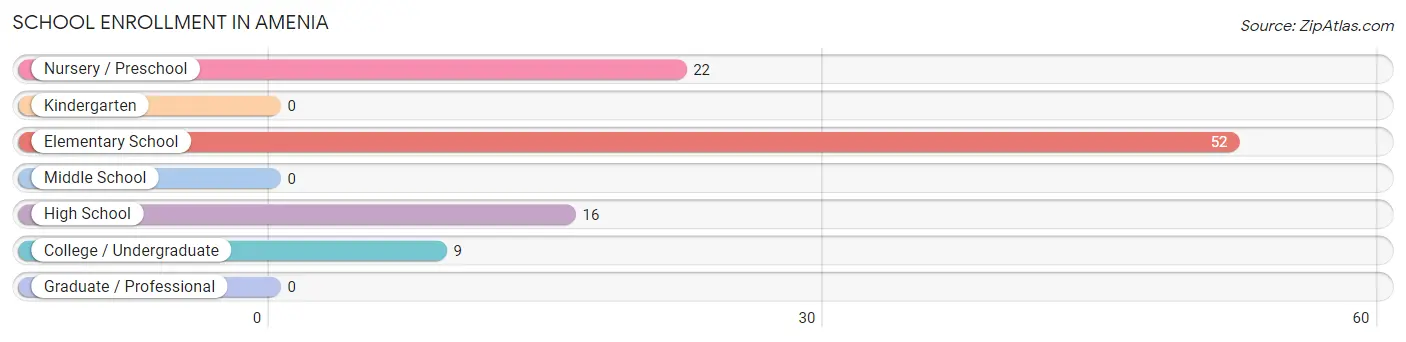
| School Level | # Students | % Students |
| Nursery / Preschool | 22 | 22.2% |
| Kindergarten | 0 | 0.0% |
| Elementary School | 52 | 52.5% |
| Middle School | 0 | 0.0% |
| High School | 16 | 16.2% |
| College / Undergraduate | 9 | 9.1% |
| Graduate / Professional | 0 | 0.0% |
| Total | 99 | 100.0% |
School Enrollment by Age by Funding Source in Amenia
Out of a total of 99 students who are enrolled in schools in Amenia, 5 (5.1%) attend a private institution, while the remaining 94 (94.9%) are enrolled in public schools. The age group of 18 to 19 year olds has the highest likelihood of being enrolled in private schools, with 5 (100.0% in the age bracket) enrolled. Conversely, the age group of 3 to 4 year olds has the lowest likelihood of being enrolled in a private school, with 7 (100.0% in the age bracket) attending a public institution.
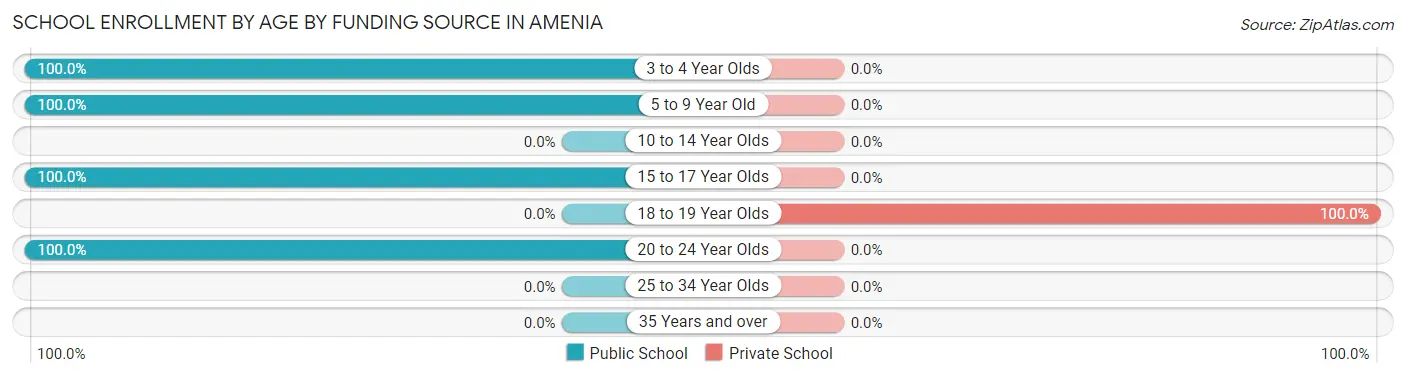
| Age Bracket | Public School | Private School |
| 3 to 4 Year Olds | 7 (100.0%) | 0 (0.0%) |
| 5 to 9 Year Old | 67 (100.0%) | 0 (0.0%) |
| 10 to 14 Year Olds | 0 (0.0%) | 0 (0.0%) |
| 15 to 17 Year Olds | 16 (100.0%) | 0 (0.0%) |
| 18 to 19 Year Olds | 0 (0.0%) | 5 (100.0%) |
| 20 to 24 Year Olds | 4 (100.0%) | 0 (0.0%) |
| 25 to 34 Year Olds | 0 (0.0%) | 0 (0.0%) |
| 35 Years and over | 0 (0.0%) | 0 (0.0%) |
| Total | 94 (94.9%) | 5 (5.1%) |
Educational Attainment by Field of Study in Amenia
Business (53 | 40.5%), liberal arts & history (22 | 16.8%), social sciences (15 | 11.5%), education (10 | 7.6%), and computers & mathematics (8 | 6.1%) are the most common fields of study among 131 individuals in Amenia who have obtained a bachelor's degree or higher.
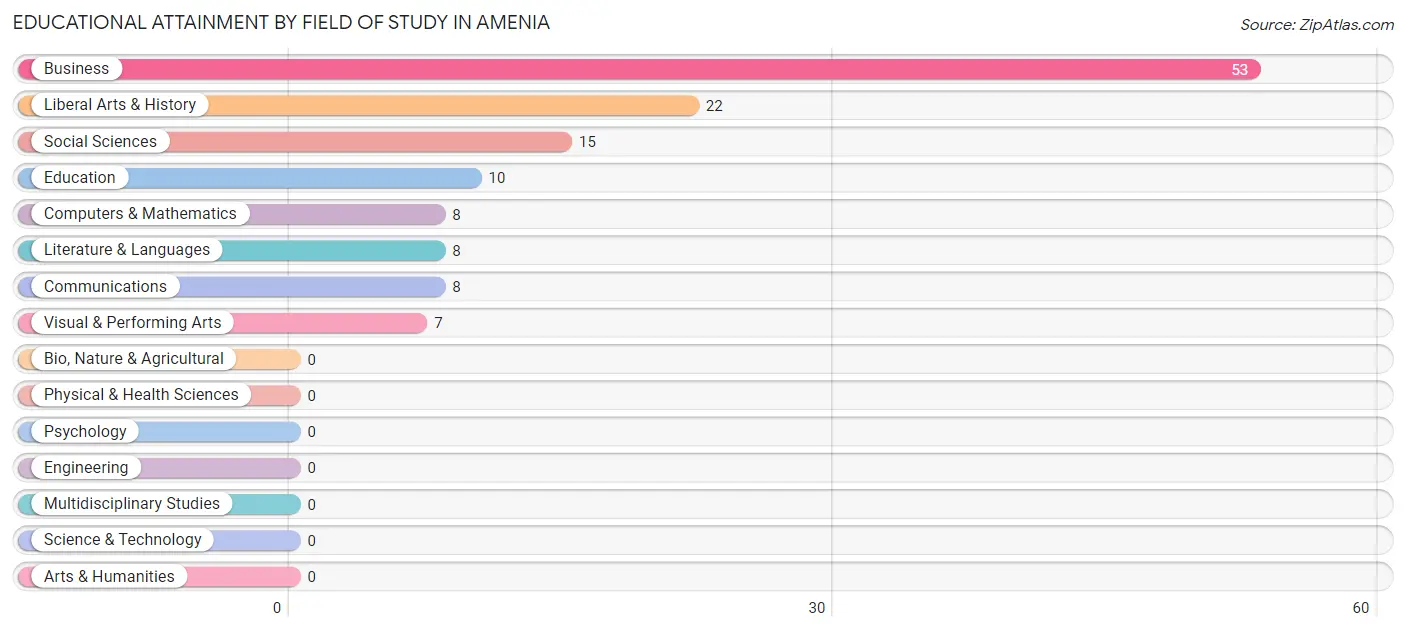
| Field of Study | # Graduates | % Graduates |
| Computers & Mathematics | 8 | 6.1% |
| Bio, Nature & Agricultural | 0 | 0.0% |
| Physical & Health Sciences | 0 | 0.0% |
| Psychology | 0 | 0.0% |
| Social Sciences | 15 | 11.5% |
| Engineering | 0 | 0.0% |
| Multidisciplinary Studies | 0 | 0.0% |
| Science & Technology | 0 | 0.0% |
| Business | 53 | 40.5% |
| Education | 10 | 7.6% |
| Literature & Languages | 8 | 6.1% |
| Liberal Arts & History | 22 | 16.8% |
| Visual & Performing Arts | 7 | 5.3% |
| Communications | 8 | 6.1% |
| Arts & Humanities | 0 | 0.0% |
| Total | 131 | 100.0% |
Transportation & Commute in Amenia
Vehicle Availability by Sex in Amenia
The most prevalent vehicle ownership categories in Amenia are males with 1 vehicle (208, accounting for 62.3%) and females with 1 vehicle (38, making up 165.1%).
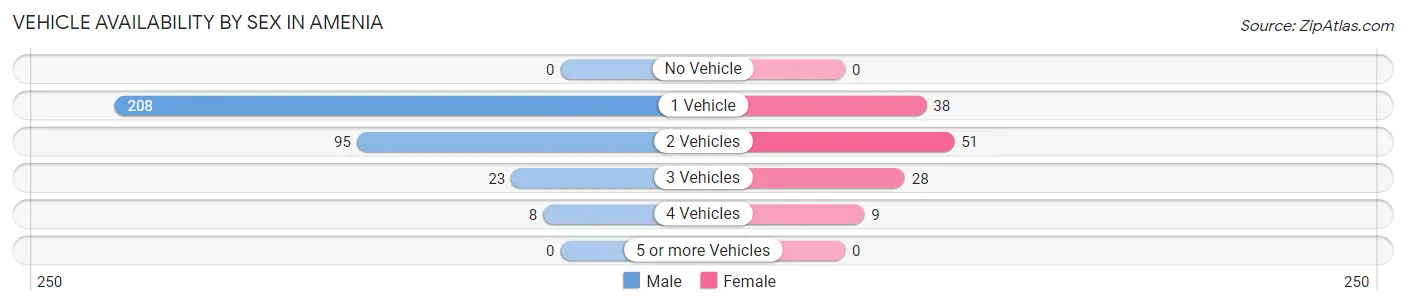
| Vehicles Available | Male | Female |
| No Vehicle | 0 (0.0%) | 0 (0.0%) |
| 1 Vehicle | 208 (62.3%) | 38 (30.2%) |
| 2 Vehicles | 95 (28.4%) | 51 (40.5%) |
| 3 Vehicles | 23 (6.9%) | 28 (22.2%) |
| 4 Vehicles | 8 (2.4%) | 9 (7.1%) |
| 5 or more Vehicles | 0 (0.0%) | 0 (0.0%) |
| Total | 334 (100.0%) | 126 (100.0%) |
Commute Time in Amenia
The most frequently occuring commute durations in Amenia are 10 to 14 minutes (129 commuters, 29.8%), 5 to 9 minutes (81 commuters, 18.7%), and less than 5 minutes (65 commuters, 15.0%).
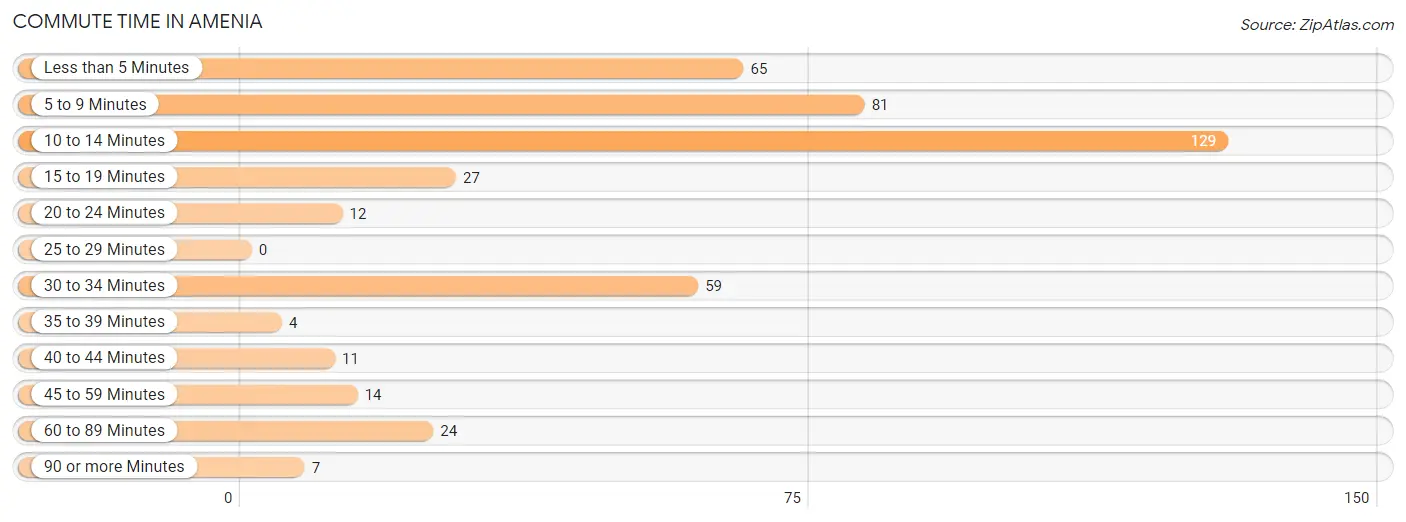
| Commute Time | # Commuters | % Commuters |
| Less than 5 Minutes | 65 | 15.0% |
| 5 to 9 Minutes | 81 | 18.7% |
| 10 to 14 Minutes | 129 | 29.8% |
| 15 to 19 Minutes | 27 | 6.2% |
| 20 to 24 Minutes | 12 | 2.8% |
| 25 to 29 Minutes | 0 | 0.0% |
| 30 to 34 Minutes | 59 | 13.6% |
| 35 to 39 Minutes | 4 | 0.9% |
| 40 to 44 Minutes | 11 | 2.5% |
| 45 to 59 Minutes | 14 | 3.2% |
| 60 to 89 Minutes | 24 | 5.5% |
| 90 or more Minutes | 7 | 1.6% |
Commute Time by Sex in Amenia
The most common commute times in Amenia are 10 to 14 minutes (76 commuters, 24.5%) for males and 10 to 14 minutes (53 commuters, 43.1%) for females.
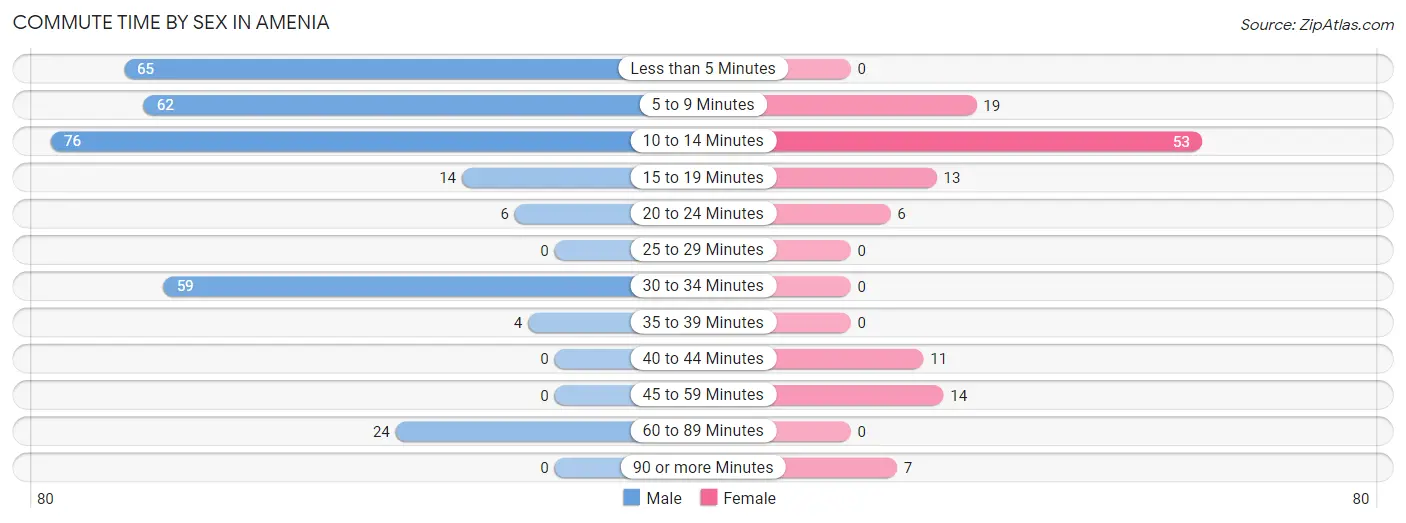
| Commute Time | Male | Female |
| Less than 5 Minutes | 65 (21.0%) | 0 (0.0%) |
| 5 to 9 Minutes | 62 (20.0%) | 19 (15.4%) |
| 10 to 14 Minutes | 76 (24.5%) | 53 (43.1%) |
| 15 to 19 Minutes | 14 (4.5%) | 13 (10.6%) |
| 20 to 24 Minutes | 6 (1.9%) | 6 (4.9%) |
| 25 to 29 Minutes | 0 (0.0%) | 0 (0.0%) |
| 30 to 34 Minutes | 59 (19.0%) | 0 (0.0%) |
| 35 to 39 Minutes | 4 (1.3%) | 0 (0.0%) |
| 40 to 44 Minutes | 0 (0.0%) | 11 (8.9%) |
| 45 to 59 Minutes | 0 (0.0%) | 14 (11.4%) |
| 60 to 89 Minutes | 24 (7.7%) | 0 (0.0%) |
| 90 or more Minutes | 0 (0.0%) | 7 (5.7%) |
Time of Departure to Work by Sex in Amenia
The most frequent times of departure to work in Amenia are 7:30 AM to 7:59 AM (58, 18.7%) for males and 8:00 AM to 8:29 AM (31, 25.2%) for females.
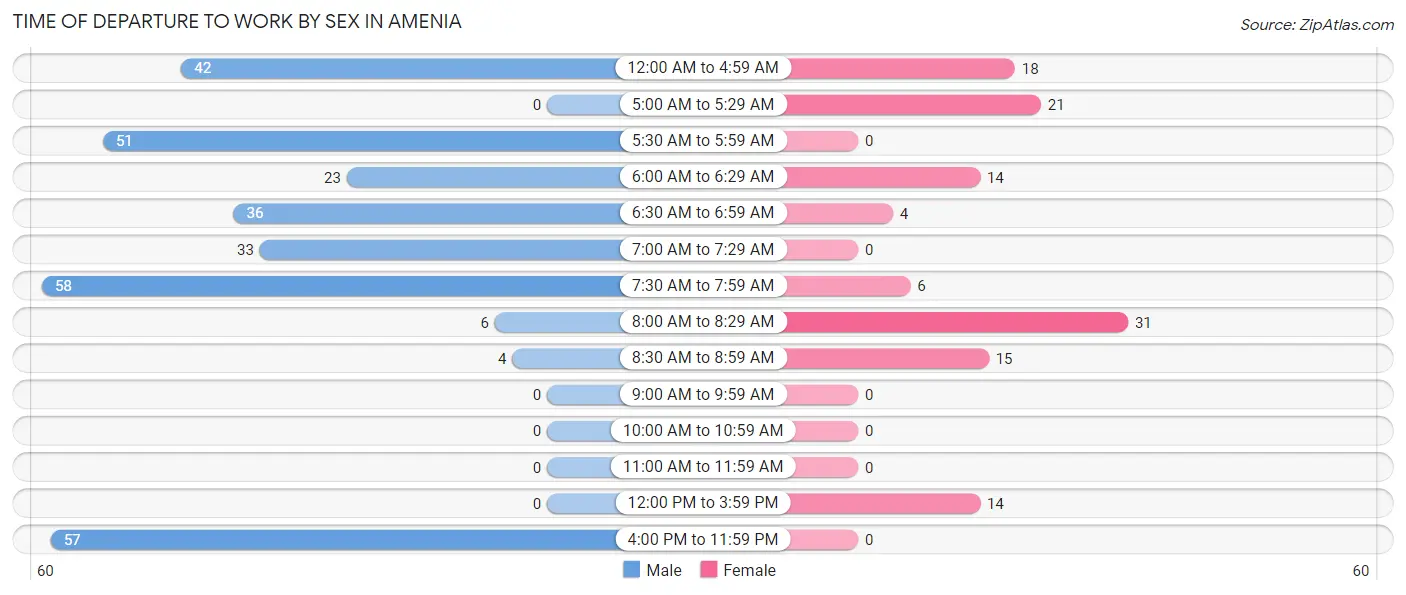
| Time of Departure | Male | Female |
| 12:00 AM to 4:59 AM | 42 (13.6%) | 18 (14.6%) |
| 5:00 AM to 5:29 AM | 0 (0.0%) | 21 (17.1%) |
| 5:30 AM to 5:59 AM | 51 (16.5%) | 0 (0.0%) |
| 6:00 AM to 6:29 AM | 23 (7.4%) | 14 (11.4%) |
| 6:30 AM to 6:59 AM | 36 (11.6%) | 4 (3.3%) |
| 7:00 AM to 7:29 AM | 33 (10.6%) | 0 (0.0%) |
| 7:30 AM to 7:59 AM | 58 (18.7%) | 6 (4.9%) |
| 8:00 AM to 8:29 AM | 6 (1.9%) | 31 (25.2%) |
| 8:30 AM to 8:59 AM | 4 (1.3%) | 15 (12.2%) |
| 9:00 AM to 9:59 AM | 0 (0.0%) | 0 (0.0%) |
| 10:00 AM to 10:59 AM | 0 (0.0%) | 0 (0.0%) |
| 11:00 AM to 11:59 AM | 0 (0.0%) | 0 (0.0%) |
| 12:00 PM to 3:59 PM | 0 (0.0%) | 14 (11.4%) |
| 4:00 PM to 11:59 PM | 57 (18.4%) | 0 (0.0%) |
| Total | 310 (100.0%) | 123 (100.0%) |
Housing Occupancy in Amenia
Occupancy by Ownership in Amenia
Of the total 410 dwellings in Amenia, owner-occupied units account for 173 (42.2%), while renter-occupied units make up 237 (57.8%).
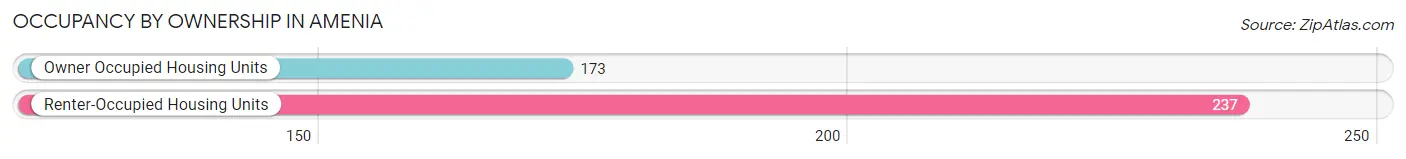
| Occupancy | # Housing Units | % Housing Units |
| Owner Occupied Housing Units | 173 | 42.2% |
| Renter-Occupied Housing Units | 237 | 57.8% |
| Total Occupied Housing Units | 410 | 100.0% |
Occupancy by Household Size in Amenia
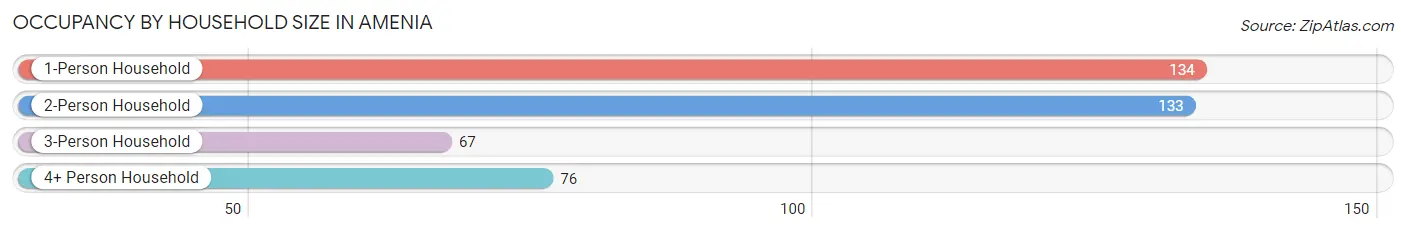
| Household Size | # Housing Units | % Housing Units |
| 1-Person Household | 134 | 32.7% |
| 2-Person Household | 133 | 32.4% |
| 3-Person Household | 67 | 16.3% |
| 4+ Person Household | 76 | 18.5% |
| Total Housing Units | 410 | 100.0% |
Occupancy by Ownership by Household Size in Amenia
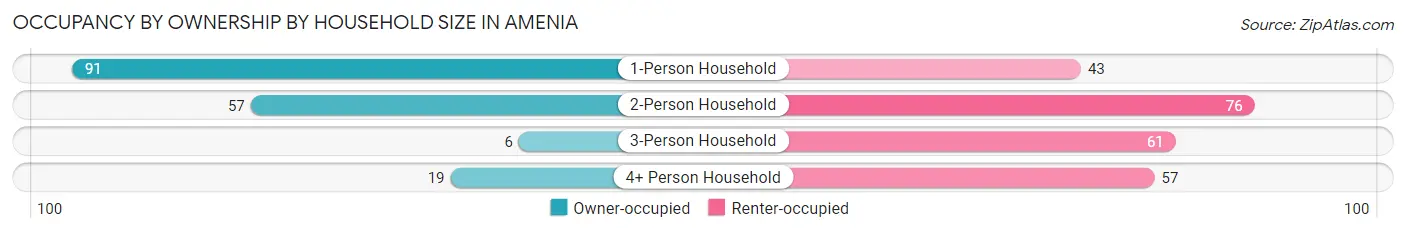
| Household Size | Owner-occupied | Renter-occupied |
| 1-Person Household | 91 (67.9%) | 43 (32.1%) |
| 2-Person Household | 57 (42.9%) | 76 (57.1%) |
| 3-Person Household | 6 (9.0%) | 61 (91.0%) |
| 4+ Person Household | 19 (25.0%) | 57 (75.0%) |
| Total Housing Units | 173 (42.2%) | 237 (57.8%) |
Occupancy by Educational Attainment in Amenia
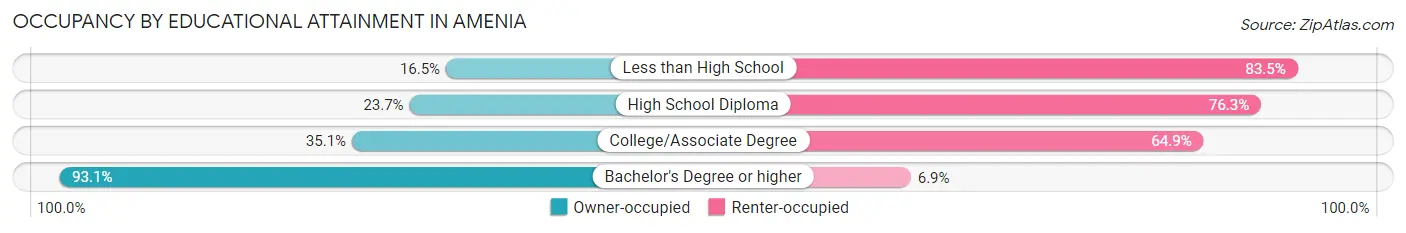
| Household Size | Owner-occupied | Renter-occupied |
| Less than High School | 13 (16.5%) | 66 (83.5%) |
| High School Diploma | 32 (23.7%) | 103 (76.3%) |
| College/Associate Degree | 33 (35.1%) | 61 (64.9%) |
| Bachelor's Degree or higher | 95 (93.1%) | 7 (6.9%) |
Occupancy by Age of Householder in Amenia
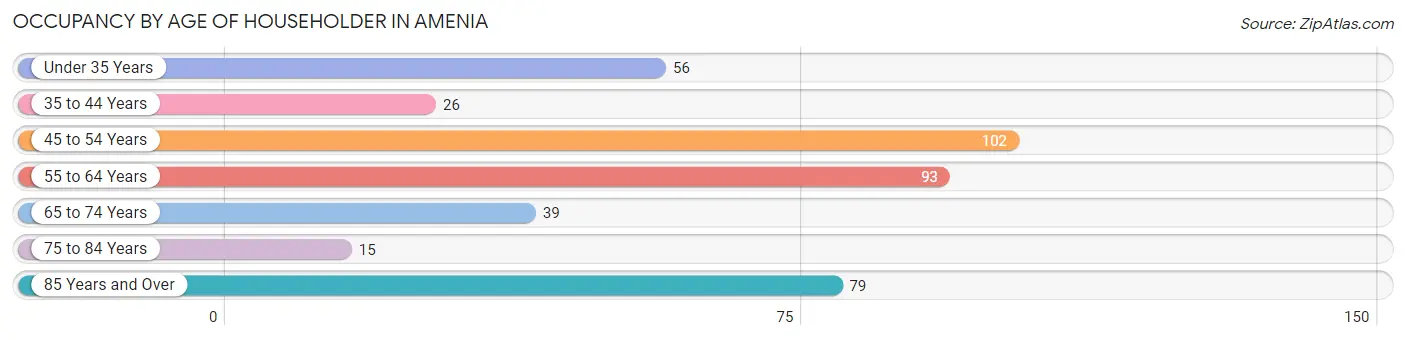
| Age Bracket | # Households | % Households |
| Under 35 Years | 56 | 13.7% |
| 35 to 44 Years | 26 | 6.3% |
| 45 to 54 Years | 102 | 24.9% |
| 55 to 64 Years | 93 | 22.7% |
| 65 to 74 Years | 39 | 9.5% |
| 75 to 84 Years | 15 | 3.7% |
| 85 Years and Over | 79 | 19.3% |
| Total | 410 | 100.0% |
Housing Finances in Amenia
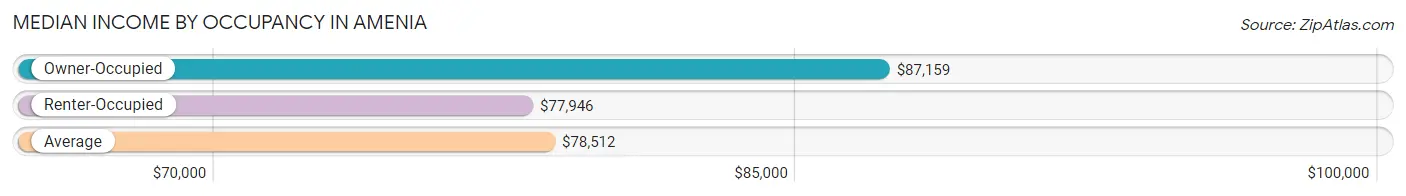
Median Income by Occupancy in Amenia
| Occupancy Type | # Households | Median Income |
| Owner-Occupied | 173 (42.2%) | $87,159 |
| Renter-Occupied | 237 (57.8%) | $77,946 |
| Average | 410 (100.0%) | $78,512 |
Occupancy by Householder Income Bracket in Amenia
| Income Bracket | Owner-occupied | Renter-occupied |
| Less than $5,000 | 0 (0.0%) | 0 (0.0%) |
| $5,000 to $9,999 | 47 (27.2%) | 27 (11.4%) |
| $10,000 to $14,999 | 0 (0.0%) | 9 (3.8%) |
| $15,000 to $19,999 | 0 (0.0%) | 0 (0.0%) |
| $20,000 to $24,999 | 0 (0.0%) | 7 (2.9%) |
| $25,000 to $34,999 | 11 (6.4%) | 0 (0.0%) |
| $35,000 to $49,999 | 0 (0.0%) | 24 (10.1%) |
| $50,000 to $74,999 | 19 (11.0%) | 44 (18.6%) |
| $75,000 to $99,999 | 38 (22.0%) | 42 (17.7%) |
| $100,000 to $149,999 | 28 (16.2%) | 84 (35.4%) |
| $150,000 or more | 30 (17.3%) | 0 (0.0%) |
| Total | 173 (100.0%) | 237 (100.0%) |
Monthly Housing Cost Tiers in Amenia
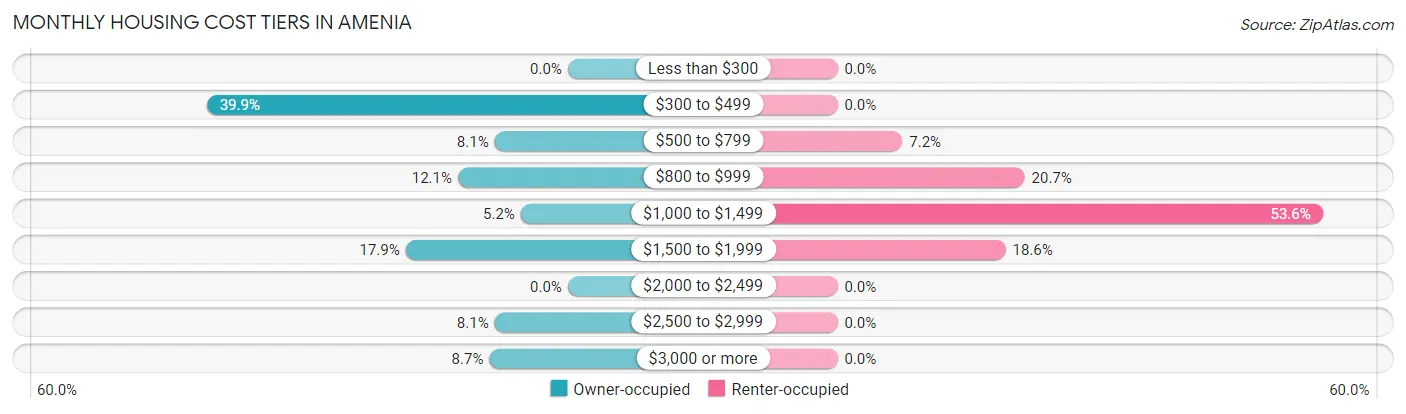
| Monthly Cost | Owner-occupied | Renter-occupied |
| Less than $300 | 0 (0.0%) | 0 (0.0%) |
| $300 to $499 | 69 (39.9%) | 0 (0.0%) |
| $500 to $799 | 14 (8.1%) | 17 (7.2%) |
| $800 to $999 | 21 (12.1%) | 49 (20.7%) |
| $1,000 to $1,499 | 9 (5.2%) | 127 (53.6%) |
| $1,500 to $1,999 | 31 (17.9%) | 44 (18.6%) |
| $2,000 to $2,499 | 0 (0.0%) | 0 (0.0%) |
| $2,500 to $2,999 | 14 (8.1%) | 0 (0.0%) |
| $3,000 or more | 15 (8.7%) | 0 (0.0%) |
| Total | 173 (100.0%) | 237 (100.0%) |
Physical Housing Characteristics in Amenia
Housing Structures in Amenia
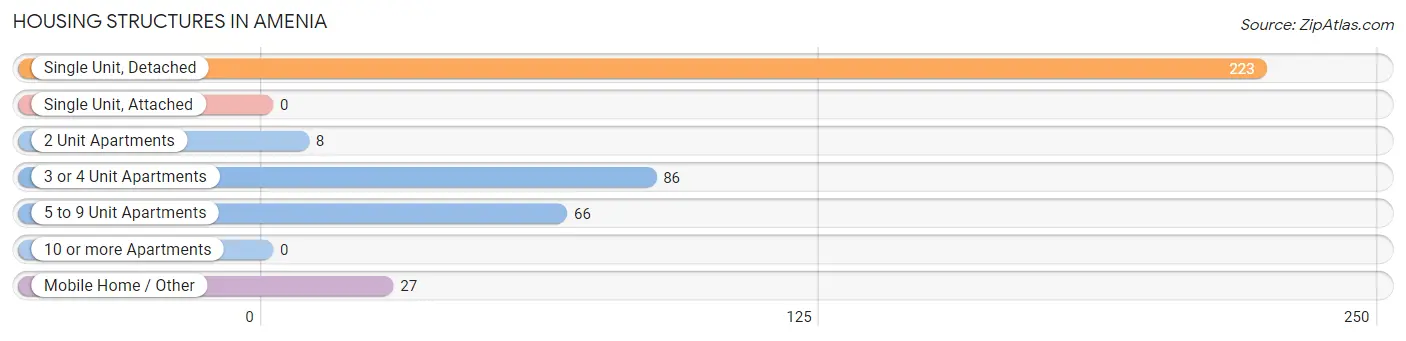
| Structure Type | # Housing Units | % Housing Units |
| Single Unit, Detached | 223 | 54.4% |
| Single Unit, Attached | 0 | 0.0% |
| 2 Unit Apartments | 8 | 1.9% |
| 3 or 4 Unit Apartments | 86 | 21.0% |
| 5 to 9 Unit Apartments | 66 | 16.1% |
| 10 or more Apartments | 0 | 0.0% |
| Mobile Home / Other | 27 | 6.6% |
| Total | 410 | 100.0% |
Housing Structures by Occupancy in Amenia
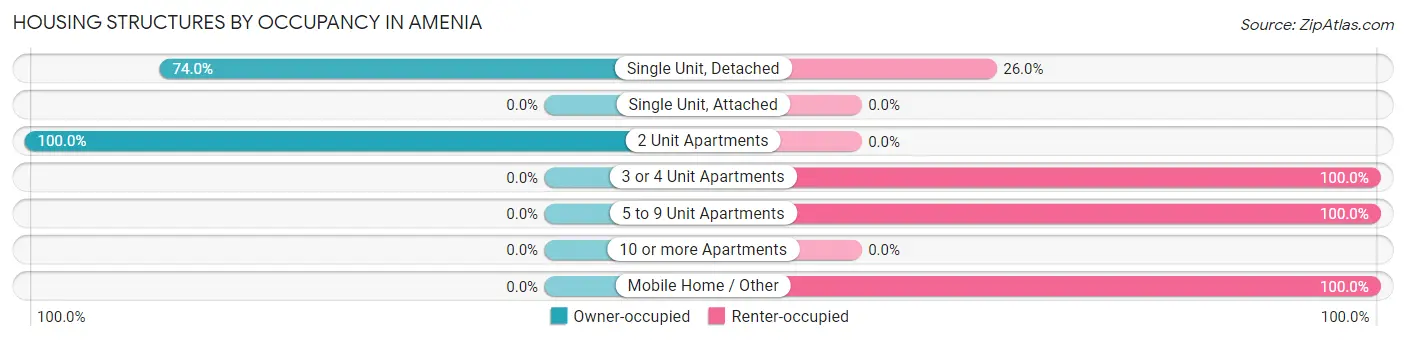
| Structure Type | Owner-occupied | Renter-occupied |
| Single Unit, Detached | 165 (74.0%) | 58 (26.0%) |
| Single Unit, Attached | 0 (0.0%) | 0 (0.0%) |
| 2 Unit Apartments | 8 (100.0%) | 0 (0.0%) |
| 3 or 4 Unit Apartments | 0 (0.0%) | 86 (100.0%) |
| 5 to 9 Unit Apartments | 0 (0.0%) | 66 (100.0%) |
| 10 or more Apartments | 0 (0.0%) | 0 (0.0%) |
| Mobile Home / Other | 0 (0.0%) | 27 (100.0%) |
| Total | 173 (42.2%) | 237 (57.8%) |
Housing Structures by Number of Rooms in Amenia
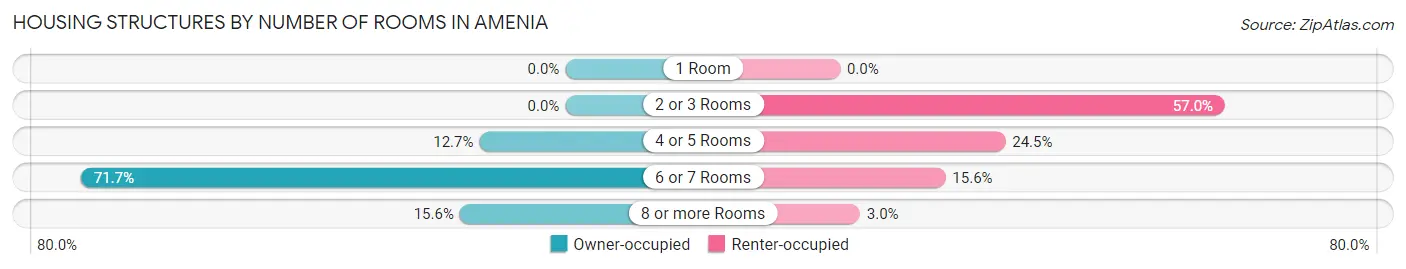
| Number of Rooms | Owner-occupied | Renter-occupied |
| 1 Room | 0 (0.0%) | 0 (0.0%) |
| 2 or 3 Rooms | 0 (0.0%) | 135 (57.0%) |
| 4 or 5 Rooms | 22 (12.7%) | 58 (24.5%) |
| 6 or 7 Rooms | 124 (71.7%) | 37 (15.6%) |
| 8 or more Rooms | 27 (15.6%) | 7 (2.9%) |
| Total | 173 (100.0%) | 237 (100.0%) |
Housing Structure by Heating Type in Amenia
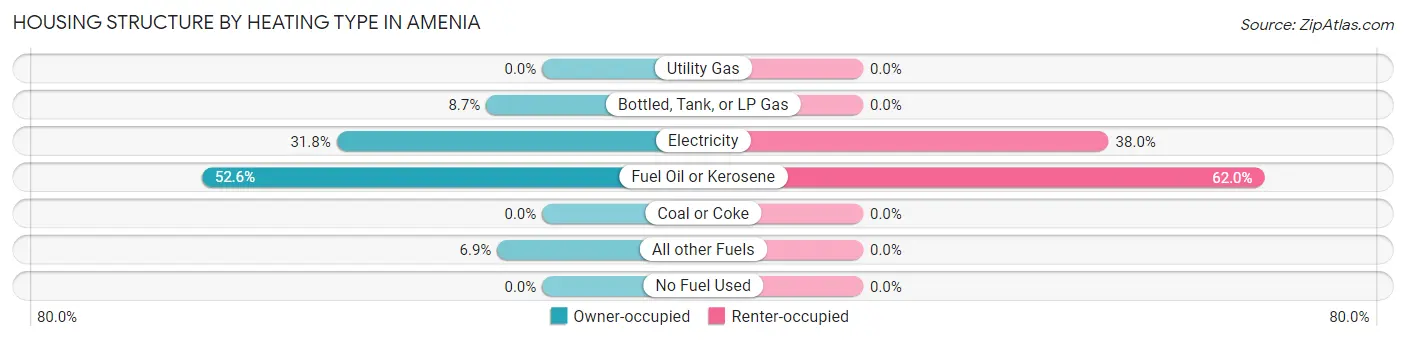
| Heating Type | Owner-occupied | Renter-occupied |
| Utility Gas | 0 (0.0%) | 0 (0.0%) |
| Bottled, Tank, or LP Gas | 15 (8.7%) | 0 (0.0%) |
| Electricity | 55 (31.8%) | 90 (38.0%) |
| Fuel Oil or Kerosene | 91 (52.6%) | 147 (62.0%) |
| Coal or Coke | 0 (0.0%) | 0 (0.0%) |
| All other Fuels | 12 (6.9%) | 0 (0.0%) |
| No Fuel Used | 0 (0.0%) | 0 (0.0%) |
| Total | 173 (100.0%) | 237 (100.0%) |
Household Vehicle Usage in Amenia
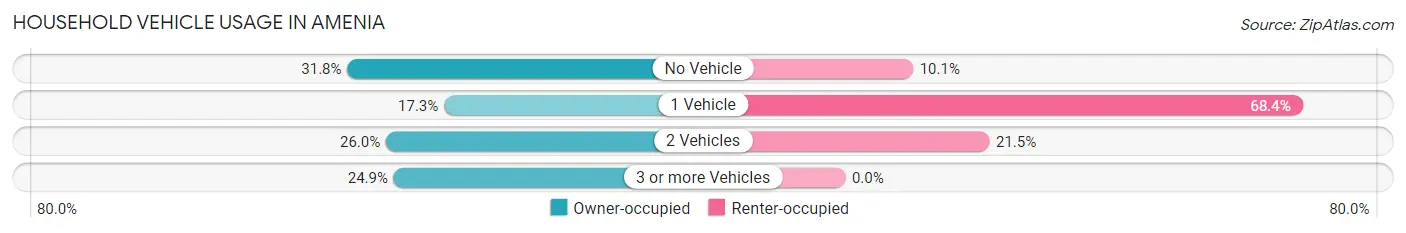
| Vehicles per Household | Owner-occupied | Renter-occupied |
| No Vehicle | 55 (31.8%) | 24 (10.1%) |
| 1 Vehicle | 30 (17.3%) | 162 (68.3%) |
| 2 Vehicles | 45 (26.0%) | 51 (21.5%) |
| 3 or more Vehicles | 43 (24.9%) | 0 (0.0%) |
| Total | 173 (100.0%) | 237 (100.0%) |
Real Estate & Mortgages in Amenia
Real Estate and Mortgage Overview in Amenia
| Characteristic | Without Mortgage | With Mortgage |
| Housing Units | 84 | 89 |
| Median Property Value | $266,100 | $243,500 |
| Median Household Income | - | - |
| Monthly Housing Costs | $395 | $15 |
| Real Estate Taxes | $1,279 | $0 |
Property Value by Mortgage Status in Amenia
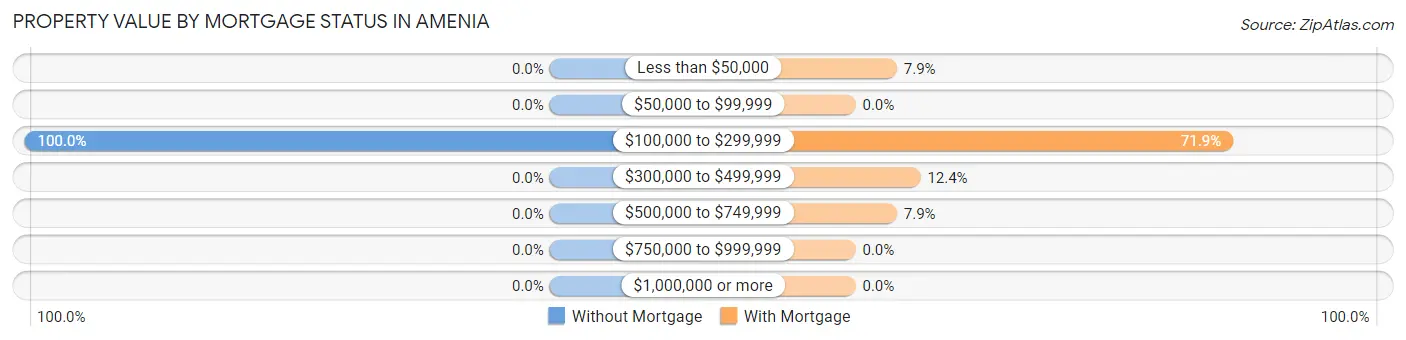
| Property Value | Without Mortgage | With Mortgage |
| Less than $50,000 | 0 (0.0%) | 7 (7.9%) |
| $50,000 to $99,999 | 0 (0.0%) | 0 (0.0%) |
| $100,000 to $299,999 | 84 (100.0%) | 64 (71.9%) |
| $300,000 to $499,999 | 0 (0.0%) | 11 (12.4%) |
| $500,000 to $749,999 | 0 (0.0%) | 7 (7.9%) |
| $750,000 to $999,999 | 0 (0.0%) | 0 (0.0%) |
| $1,000,000 or more | 0 (0.0%) | 0 (0.0%) |
| Total | 84 (100.0%) | 89 (100.0%) |
Household Income by Mortgage Status in Amenia
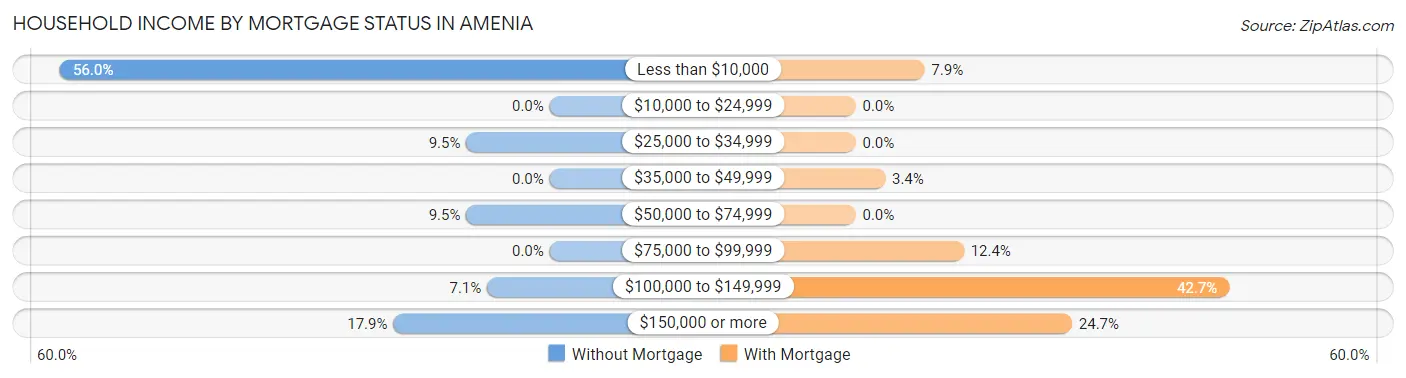
| Household Income | Without Mortgage | With Mortgage |
| Less than $10,000 | 47 (55.9%) | 7 (7.9%) |
| $10,000 to $24,999 | 0 (0.0%) | 0 (0.0%) |
| $25,000 to $34,999 | 8 (9.5%) | 0 (0.0%) |
| $35,000 to $49,999 | 0 (0.0%) | 3 (3.4%) |
| $50,000 to $74,999 | 8 (9.5%) | 0 (0.0%) |
| $75,000 to $99,999 | 0 (0.0%) | 11 (12.4%) |
| $100,000 to $149,999 | 6 (7.1%) | 38 (42.7%) |
| $150,000 or more | 15 (17.9%) | 22 (24.7%) |
| Total | 84 (100.0%) | 89 (100.0%) |
Property Value to Household Income Ratio in Amenia
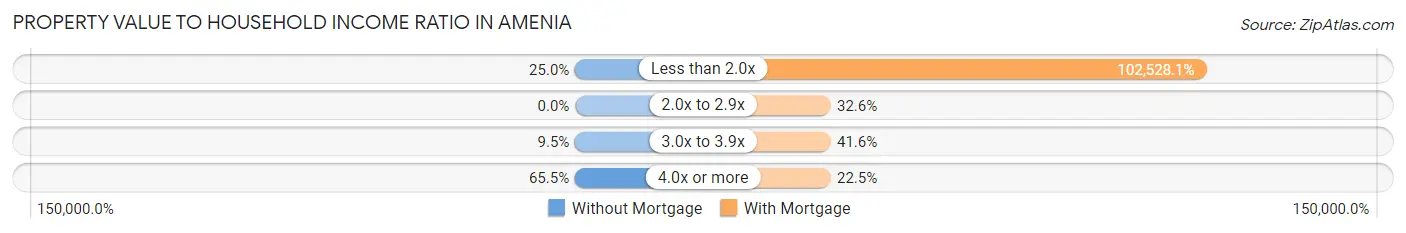
| Value-to-Income Ratio | Without Mortgage | With Mortgage |
| Less than 2.0x | 21 (25.0%) | 91,250 (102,528.1%) |
| 2.0x to 2.9x | 0 (0.0%) | 29 (32.6%) |
| 3.0x to 3.9x | 8 (9.5%) | 37 (41.6%) |
| 4.0x or more | 55 (65.5%) | 20 (22.5%) |
| Total | 84 (100.0%) | 89 (100.0%) |
Real Estate Taxes by Mortgage Status in Amenia
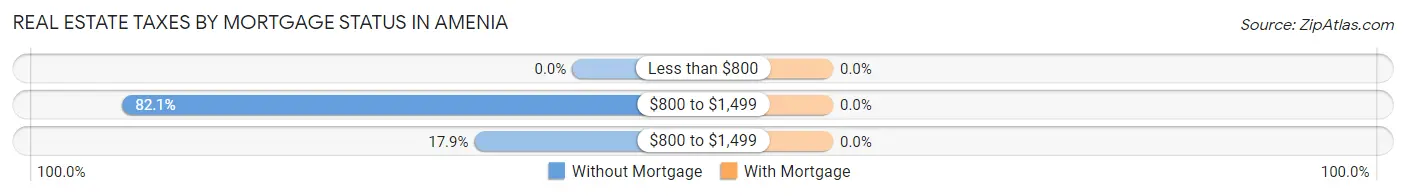
| Property Taxes | Without Mortgage | With Mortgage |
| Less than $800 | 0 (0.0%) | 0 (0.0%) |
| $800 to $1,499 | 69 (82.1%) | 0 (0.0%) |
| $800 to $1,499 | 15 (17.9%) | 0 (0.0%) |
| Total | 84 (100.0%) | 89 (100.0%) |
Health & Disability in Amenia
Health Insurance Coverage by Age in Amenia
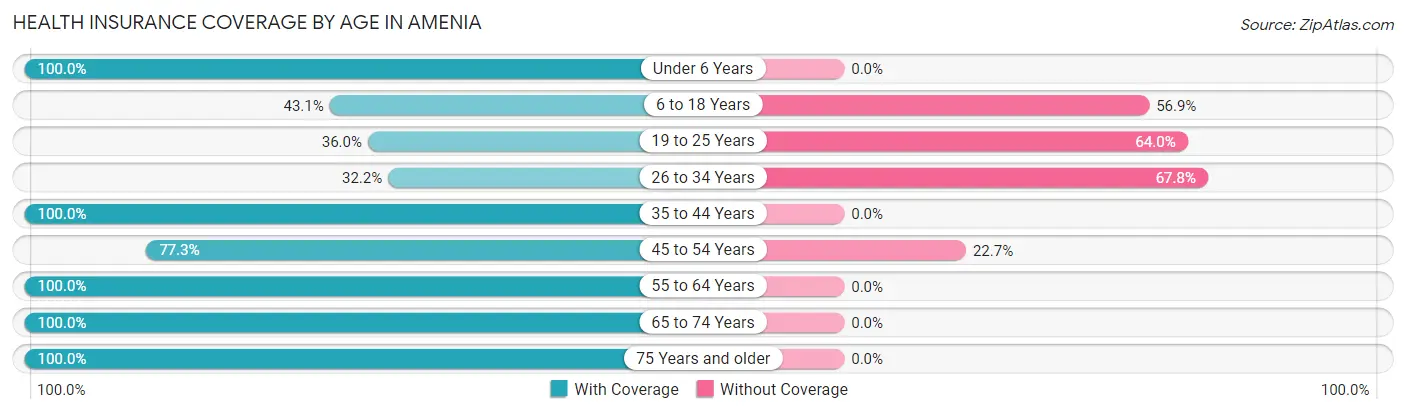
| Age Bracket | With Coverage | Without Coverage |
| Under 6 Years | 22 (100.0%) | 0 (0.0%) |
| 6 to 18 Years | 44 (43.1%) | 58 (56.9%) |
| 19 to 25 Years | 18 (36.0%) | 32 (64.0%) |
| 26 to 34 Years | 39 (32.2%) | 82 (67.8%) |
| 35 to 44 Years | 66 (100.0%) | 0 (0.0%) |
| 45 to 54 Years | 92 (77.3%) | 27 (22.7%) |
| 55 to 64 Years | 137 (100.0%) | 0 (0.0%) |
| 65 to 74 Years | 114 (100.0%) | 0 (0.0%) |
| 75 Years and older | 100 (100.0%) | 0 (0.0%) |
| Total | 632 (76.0%) | 199 (23.9%) |
Health Insurance Coverage by Citizenship Status in Amenia
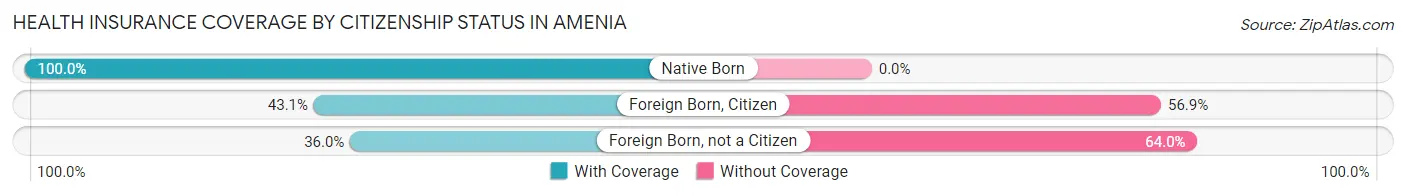
| Citizenship Status | With Coverage | Without Coverage |
| Native Born | 22 (100.0%) | 0 (0.0%) |
| Foreign Born, Citizen | 44 (43.1%) | 58 (56.9%) |
| Foreign Born, not a Citizen | 18 (36.0%) | 32 (64.0%) |
Health Insurance Coverage by Household Income in Amenia
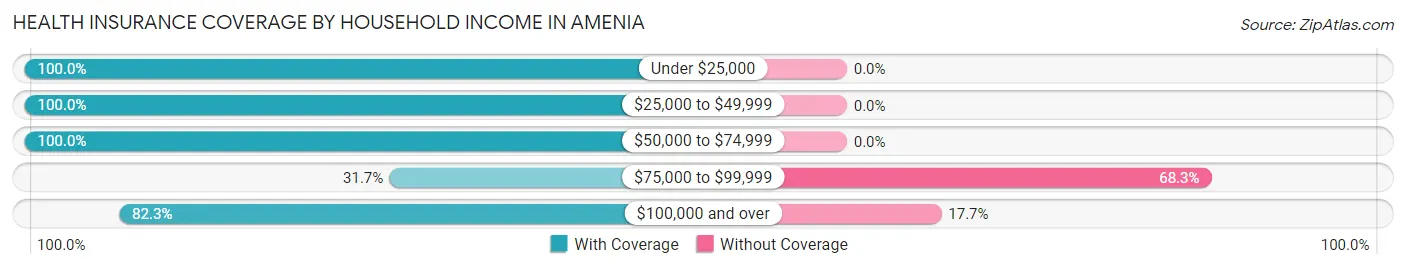
| Household Income | With Coverage | Without Coverage |
| Under $25,000 | 90 (100.0%) | 0 (0.0%) |
| $25,000 to $49,999 | 83 (100.0%) | 0 (0.0%) |
| $50,000 to $74,999 | 120 (100.0%) | 0 (0.0%) |
| $75,000 to $99,999 | 65 (31.7%) | 140 (68.3%) |
| $100,000 and over | 274 (82.3%) | 59 (17.7%) |
Public vs Private Health Insurance Coverage by Age in Amenia
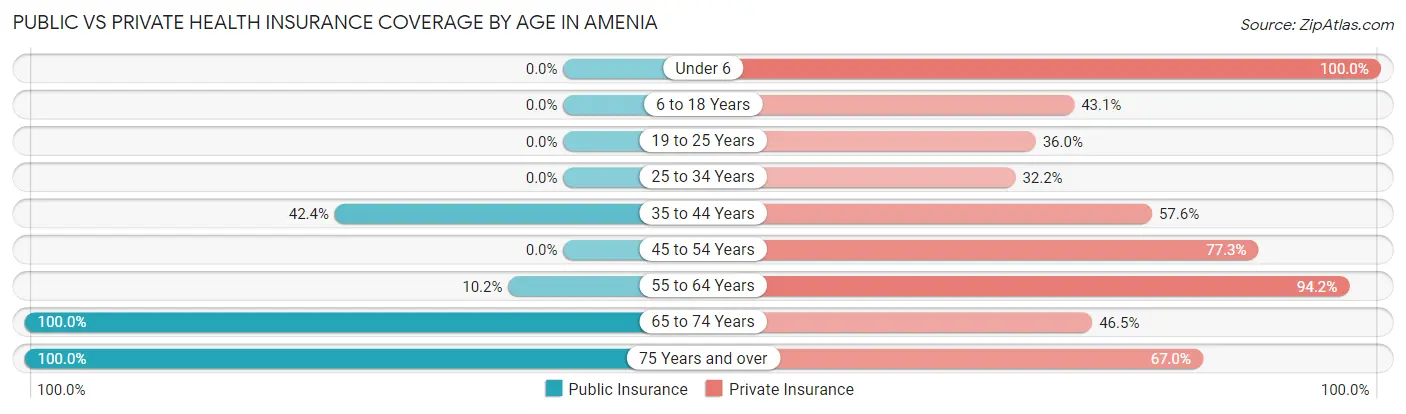
| Age Bracket | Public Insurance | Private Insurance |
| Under 6 | 0 (0.0%) | 22 (100.0%) |
| 6 to 18 Years | 0 (0.0%) | 44 (43.1%) |
| 19 to 25 Years | 0 (0.0%) | 18 (36.0%) |
| 25 to 34 Years | 0 (0.0%) | 39 (32.2%) |
| 35 to 44 Years | 28 (42.4%) | 38 (57.6%) |
| 45 to 54 Years | 0 (0.0%) | 92 (77.3%) |
| 55 to 64 Years | 14 (10.2%) | 129 (94.2%) |
| 65 to 74 Years | 114 (100.0%) | 53 (46.5%) |
| 75 Years and over | 100 (100.0%) | 67 (67.0%) |
| Total | 256 (30.8%) | 502 (60.4%) |
Disability Status by Sex by Age in Amenia
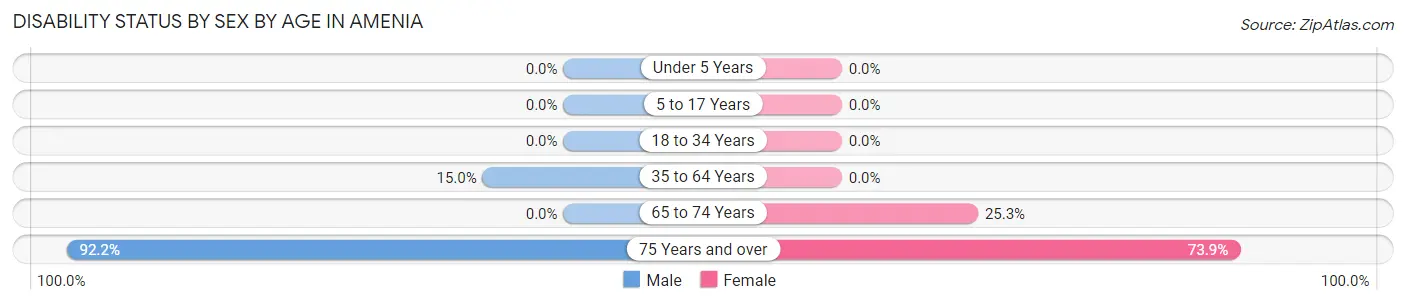
| Age Bracket | Male | Female |
| Under 5 Years | 0 (0.0%) | 0 (0.0%) |
| 5 to 17 Years | 0 (0.0%) | 0 (0.0%) |
| 18 to 34 Years | 0 (0.0%) | 0 (0.0%) |
| 35 to 64 Years | 39 (15.0%) | 0 (0.0%) |
| 65 to 74 Years | 0 (0.0%) | 23 (25.3%) |
| 75 Years and over | 71 (92.2%) | 17 (73.9%) |
Disability Class by Sex by Age in Amenia
Disability Class: Hearing Difficulty
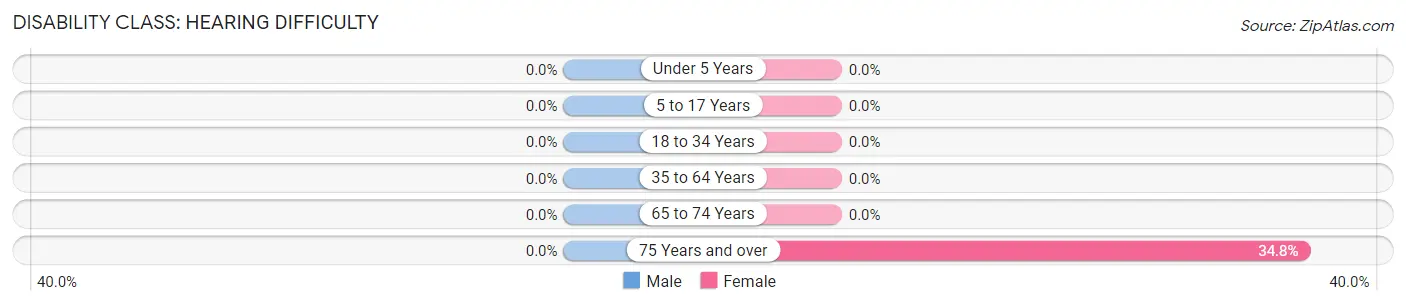
| Age Bracket | Male | Female |
| Under 5 Years | 0 (0.0%) | 0 (0.0%) |
| 5 to 17 Years | 0 (0.0%) | 0 (0.0%) |
| 18 to 34 Years | 0 (0.0%) | 0 (0.0%) |
| 35 to 64 Years | 0 (0.0%) | 0 (0.0%) |
| 65 to 74 Years | 0 (0.0%) | 0 (0.0%) |
| 75 Years and over | 0 (0.0%) | 8 (34.8%) |
Disability Class: Vision Difficulty
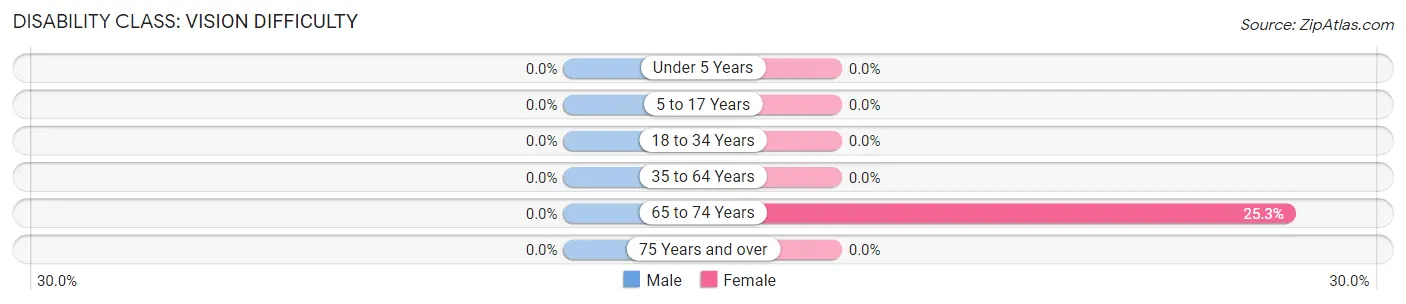
| Age Bracket | Male | Female |
| Under 5 Years | 0 (0.0%) | 0 (0.0%) |
| 5 to 17 Years | 0 (0.0%) | 0 (0.0%) |
| 18 to 34 Years | 0 (0.0%) | 0 (0.0%) |
| 35 to 64 Years | 0 (0.0%) | 0 (0.0%) |
| 65 to 74 Years | 0 (0.0%) | 23 (25.3%) |
| 75 Years and over | 0 (0.0%) | 0 (0.0%) |
Disability Class: Cognitive Difficulty
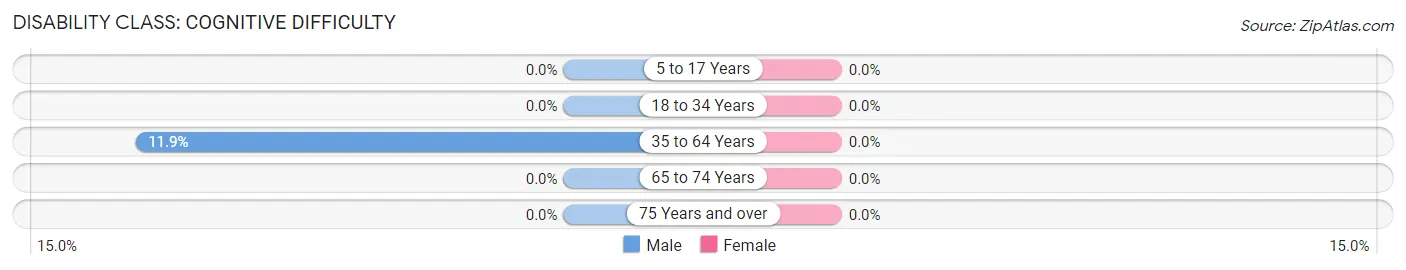
| Age Bracket | Male | Female |
| 5 to 17 Years | 0 (0.0%) | 0 (0.0%) |
| 18 to 34 Years | 0 (0.0%) | 0 (0.0%) |
| 35 to 64 Years | 31 (11.9%) | 0 (0.0%) |
| 65 to 74 Years | 0 (0.0%) | 0 (0.0%) |
| 75 Years and over | 0 (0.0%) | 0 (0.0%) |
Disability Class: Ambulatory Difficulty
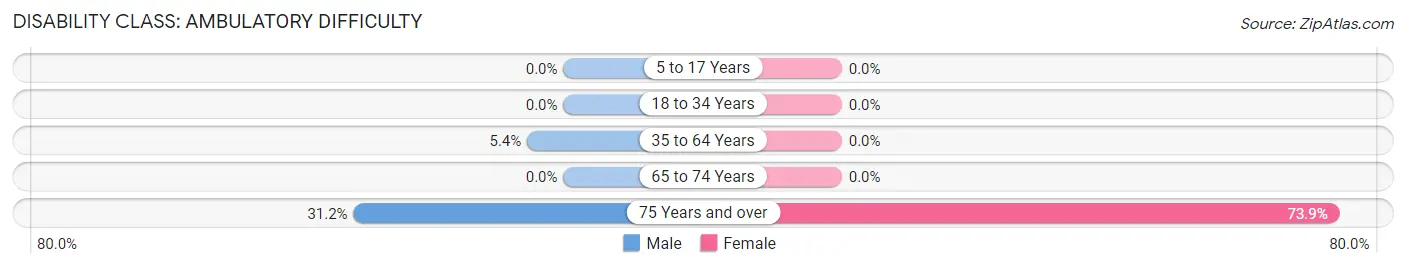
| Age Bracket | Male | Female |
| 5 to 17 Years | 0 (0.0%) | 0 (0.0%) |
| 18 to 34 Years | 0 (0.0%) | 0 (0.0%) |
| 35 to 64 Years | 14 (5.4%) | 0 (0.0%) |
| 65 to 74 Years | 0 (0.0%) | 0 (0.0%) |
| 75 Years and over | 24 (31.2%) | 17 (73.9%) |
Disability Class: Self-Care Difficulty
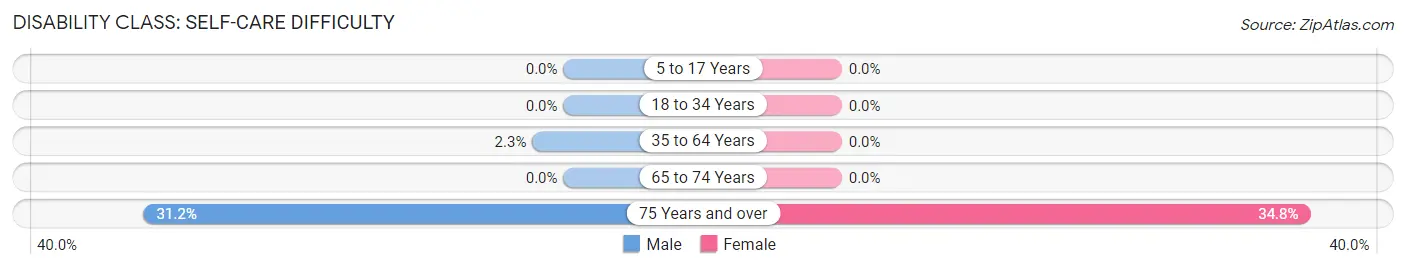
| Age Bracket | Male | Female |
| 5 to 17 Years | 0 (0.0%) | 0 (0.0%) |
| 18 to 34 Years | 0 (0.0%) | 0 (0.0%) |
| 35 to 64 Years | 6 (2.3%) | 0 (0.0%) |
| 65 to 74 Years | 0 (0.0%) | 0 (0.0%) |
| 75 Years and over | 24 (31.2%) | 8 (34.8%) |
Technology Access in Amenia
Computing Device Access in Amenia
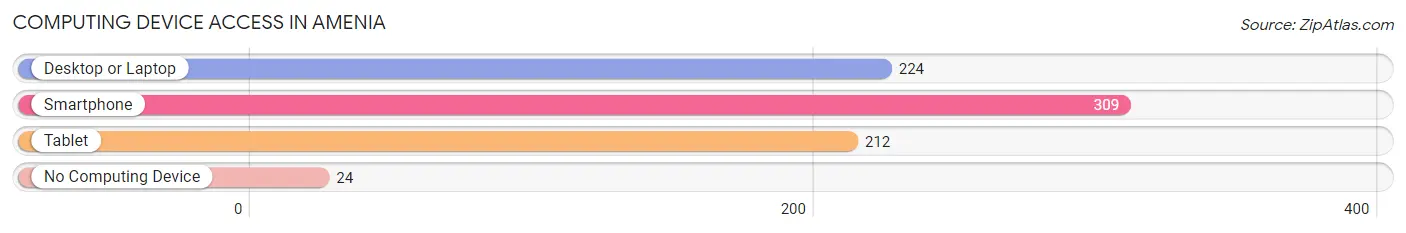
| Device Type | # Households | % Households |
| Desktop or Laptop | 224 | 54.6% |
| Smartphone | 309 | 75.4% |
| Tablet | 212 | 51.7% |
| No Computing Device | 24 | 5.9% |
| Total | 410 | 100.0% |
Internet Access in Amenia
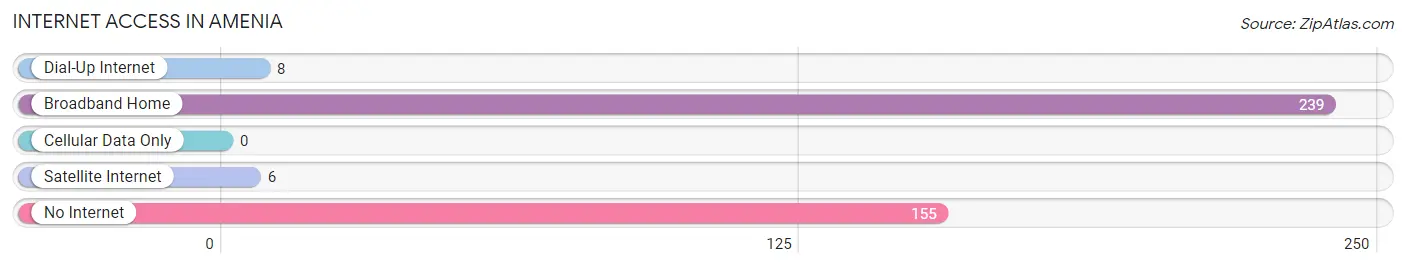
| Internet Type | # Households | % Households |
| Dial-Up Internet | 8 | 1.9% |
| Broadband Home | 239 | 58.3% |
| Cellular Data Only | 0 | 0.0% |
| Satellite Internet | 6 | 1.5% |
| No Internet | 155 | 37.8% |
| Total | 410 | 100.0% |
Amenia Summary
Amenia is a town located in Dutchess County, New York, United States. The population was 4,436 at the 2010 census. The town is in the northeast corner of the county, east of Poughkeepsie.
History
The town of Amenia was first settled in 1714 by Dutch and English settlers. The town was originally part of the Great Nine Partners Patent of 1697. The town was established in 1788, and was named after the ancient city of Amiens in France.
The town was an agricultural community for much of its history, with dairy farming being the primary industry. The town was also home to several mills, including a grist mill, a saw mill, and a paper mill.
Geography
Amenia is located in the northeast corner of Dutchess County, bordered by the towns of North East and Pine Plains to the north, Milan to the east, Washington to the south, and Clinton and Pleasant Valley to the west.
The town is located in the Hudson Valley, and is part of the Hudson River Valley National Heritage Area. The town is located in the Hudson River watershed, and is drained by the Ten Mile River and its tributaries.
The highest point in the town is 1,890 feet (576 m) above sea level, located on the summit of Mount Riga.
Economy
The economy of Amenia is largely based on agriculture and tourism. The town is home to several wineries, including Millbrook Vineyards and Winery, and the Benmarl Winery.
The town is also home to several small businesses, including a number of antique stores, a brewery, and a distillery.
Demographics
As of the census of 2010, there were 4,436 people, 1,717 households, and 1,097 families residing in the town. The population density was 97.3 people per square mile (37.6/km2). There were 1,845 housing units at an average density of 40.3 per square mile (15.6/km2). The racial makeup of the town was 92.2% White, 4.2% African American, 0.3% Native American, 0.7% Asian, 0.1% Pacific Islander, 0.9% from other races, and 1.6% from two or more races. Hispanic or Latino of any race were 4.2% of the population.
There were 1,717 households, out of which 28.2% had children under the age of 18 living with them, 48.2% were married couples living together, 11.2% had a female householder with no husband present, and 35.2% were non-families. 28.2% of all households were made up of individuals, and 11.2% had someone living alone who was 65 years of age or older. The average household size was 2.50 and the average family size was 3.06.
In the town, the population was spread out, with 24.2% under the age of 18, 6.2% from 18 to 24, 28.2% from 25 to 44, 27.2% from 45 to 64, and 14.2% who were 65 years of age or older. The median age was 40 years. For every 100 females, there were 97.2 males. For every 100 females age 18 and over, there were 94.2 males.
The median income for a household in the town was $50,938, and the median income for a family was $60,000. Males had a median income of $41,250 versus $30,000 for females. The per capita income for the town was $25,945. About 5.2% of families and 8.2% of the population were below the poverty line, including 10.2% of those under age 18 and 5.2% of those age 65 or over.
Common Questions
What is the Total Population of Amenia?
Total Population of Amenia is 831.
What is the Total Male Population of Amenia?
Total Male Population of Amenia is 522.
What is the Total Female Population of Amenia?
Total Female Population of Amenia is 309.
What is the Ratio of Males per 100 Females in Amenia?
There are 168.93 Males per 100 Females in Amenia.
What is the Ratio of Females per 100 Males in Amenia?
There are 59.20 Females per 100 Males in Amenia.
What is the Median Population Age in Amenia?
Median Population Age in Amenia is 50.4 Years.
What is the Average Family Size in Amenia
Average Family Size in Amenia is 2.5 People.
What is the Average Household Size in Amenia
Average Household Size in Amenia is 2.0 People.
What is Per Capita Income in Amenia?
Per Capita income in Amenia is $39,850.
What is the Median Family Income in Amenia?
Median Family Income in Amenia is $90,167.
What is the Median Household income in Amenia?
Median Household Income in Amenia is $78,512.
What is Income or Wage Gap in Amenia?
Income or Wage Gap in Amenia is 7.0%.
Women in Amenia earn 93.0 cents for every dollar earned by a man.
What is Inequality or Gini Index in Amenia?
Inequality or Gini Index in Amenia is 0.39.
How Large is the Labor Force in Amenia?
There are 478 People in the Labor Forcein in Amenia.
What is the Percentage of People in the Labor Force in Amenia?
65.7% of People are in the Labor Force in Amenia.