West Haverstraw, NY
West Haverstraw Map
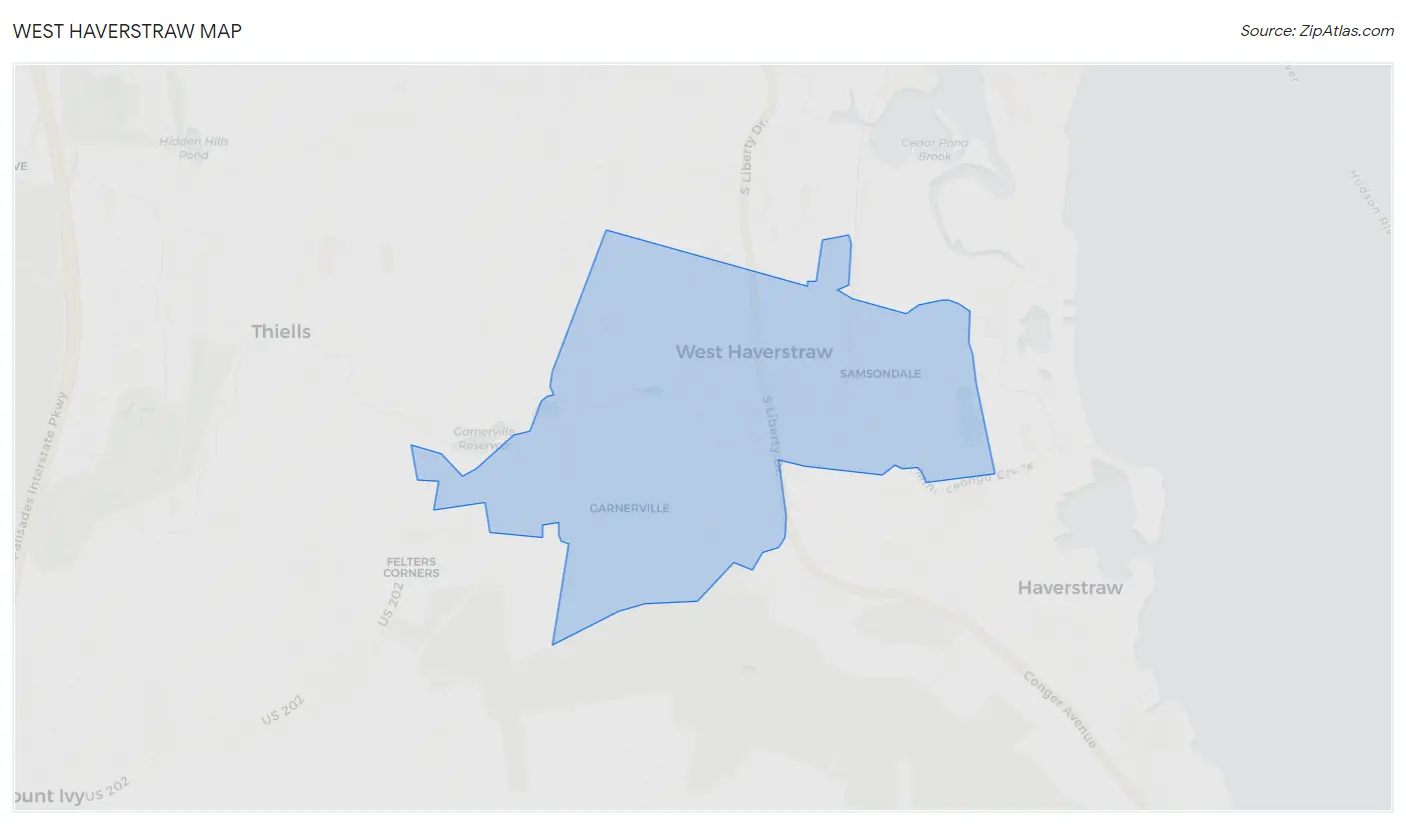
West Haverstraw Overview
10,649
TOTAL POPULATION
5,533
MALE POPULATION
5,116
FEMALE POPULATION
108.15
MALES / 100 FEMALES
92.46
FEMALES / 100 MALES
40.3
MEDIAN AGE
3.9
AVG FAMILY SIZE
3.2
AVG HOUSEHOLD SIZE
$34,493
PER CAPITA INCOME
$94,395
AVG FAMILY INCOME
$81,795
AVG HOUSEHOLD INCOME
17.5%
WAGE / INCOME GAP [ % ]
82.5¢/ $1
WAGE / INCOME GAP [ $ ]
0.41
INEQUALITY / GINI INDEX
5,824
LABOR FORCE [ PEOPLE ]
70.6%
PERCENT IN LABOR FORCE
6.4%
UNEMPLOYMENT RATE
West Haverstraw Zip Codes
West Haverstraw Area Codes
Race in West Haverstraw
The most populous races in West Haverstraw are Hispanic or Latino (5,972 | 56.1%), White / Caucasian (4,340 | 40.8%), and Some other Race (2,436 | 22.9%).
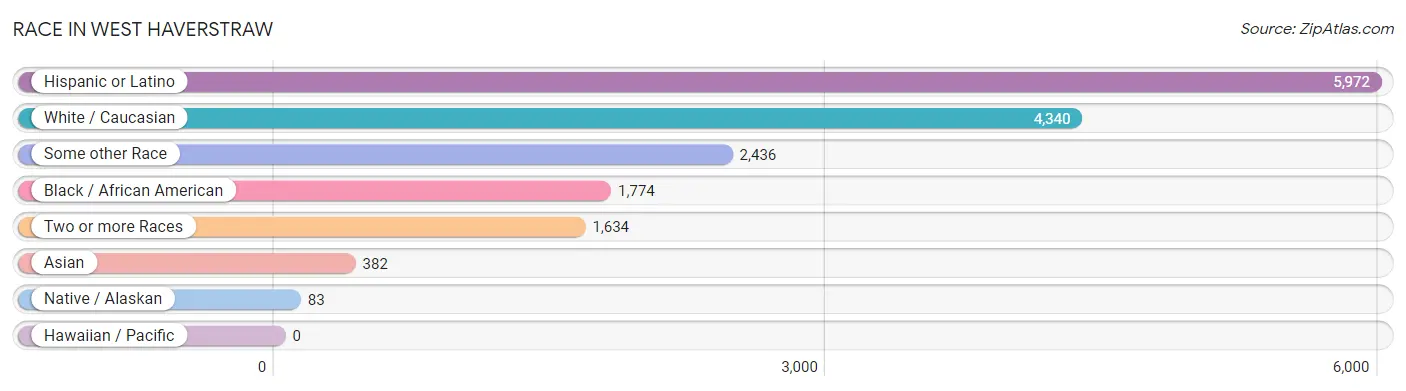
| Race | # Population | % Population |
| Asian | 382 | 3.6% |
| Black / African American | 1,774 | 16.7% |
| Hawaiian / Pacific | 0 | 0.0% |
| Hispanic or Latino | 5,972 | 56.1% |
| Native / Alaskan | 83 | 0.8% |
| White / Caucasian | 4,340 | 40.8% |
| Two or more Races | 1,634 | 15.3% |
| Some other Race | 2,436 | 22.9% |
| Total | 10,649 | 100.0% |
Ancestry in West Haverstraw
The most populous ancestries reported in West Haverstraw are Dominican (2,380 | 22.4%), Puerto Rican (1,612 | 15.1%), Italian (679 | 6.4%), Irish (640 | 6.0%), and Central American (552 | 5.2%), together accounting for 55.1% of all West Haverstraw residents.
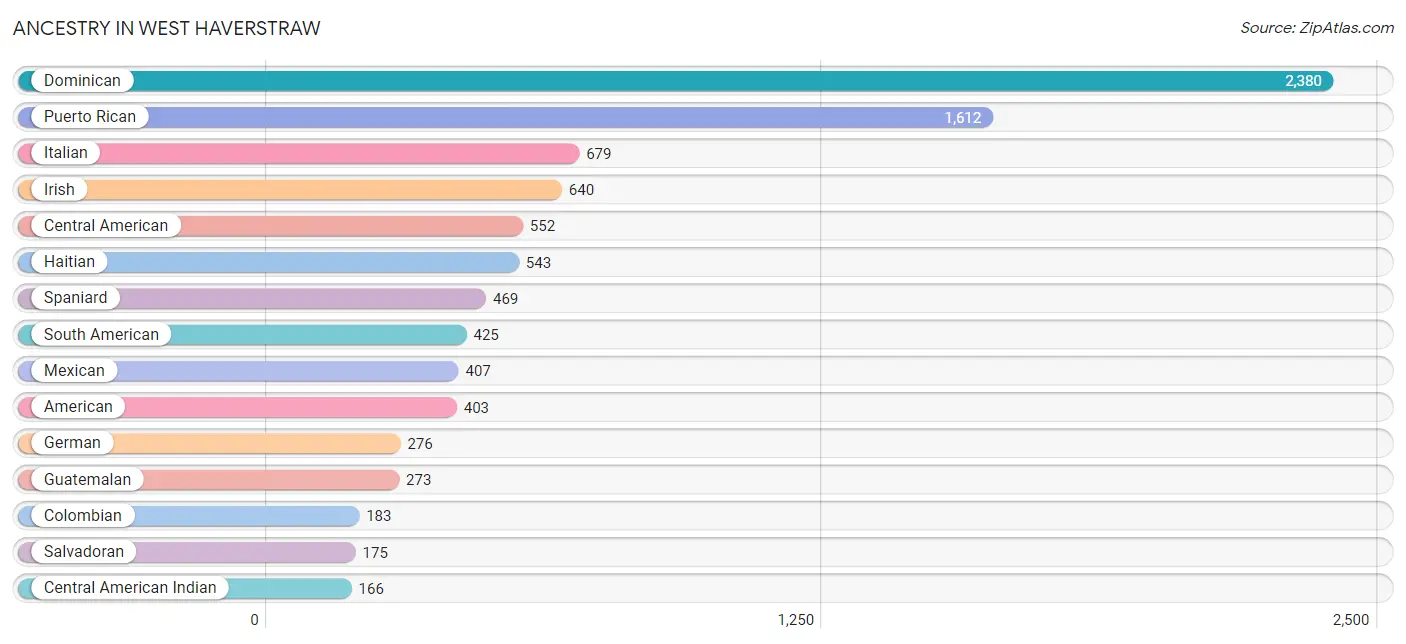
| Ancestry | # Population | % Population |
| African | 9 | 0.1% |
| American | 403 | 3.8% |
| Arab | 7 | 0.1% |
| Austrian | 12 | 0.1% |
| Brazilian | 15 | 0.1% |
| Central American | 552 | 5.2% |
| Central American Indian | 166 | 1.6% |
| Colombian | 183 | 1.7% |
| Czech | 3 | 0.0% |
| Delaware | 33 | 0.3% |
| Dominican | 2,380 | 22.4% |
| Dutch | 9 | 0.1% |
| Eastern European | 10 | 0.1% |
| Ecuadorian | 28 | 0.3% |
| Egyptian | 7 | 0.1% |
| English | 147 | 1.4% |
| European | 38 | 0.4% |
| French | 32 | 0.3% |
| German | 276 | 2.6% |
| Guatemalan | 273 | 2.6% |
| Haitian | 543 | 5.1% |
| Hungarian | 86 | 0.8% |
| Irish | 640 | 6.0% |
| Israeli | 12 | 0.1% |
| Italian | 679 | 6.4% |
| Jamaican | 54 | 0.5% |
| Kenyan | 35 | 0.3% |
| Korean | 125 | 1.2% |
| Mexican | 407 | 3.8% |
| Nicaraguan | 104 | 1.0% |
| Pennsylvania German | 1 | 0.0% |
| Peruvian | 70 | 0.7% |
| Polish | 62 | 0.6% |
| Puerto Rican | 1,612 | 15.1% |
| Russian | 31 | 0.3% |
| Salvadoran | 175 | 1.6% |
| Scottish | 18 | 0.2% |
| Slavic | 2 | 0.0% |
| Slovak | 96 | 0.9% |
| South American | 425 | 4.0% |
| South American Indian | 25 | 0.2% |
| Spaniard | 469 | 4.4% |
| Subsaharan African | 44 | 0.4% |
| Thai | 126 | 1.2% |
| Trinidadian and Tobagonian | 42 | 0.4% |
| Ukrainian | 7 | 0.1% |
| Venezuelan | 144 | 1.3% |
| Welsh | 12 | 0.1% | View All 48 Rows |
Immigrants in West Haverstraw
The most numerous immigrant groups reported in West Haverstraw came from Latin America (2,362 | 22.2%), Caribbean (1,462 | 13.7%), Dominican Republic (1,006 | 9.5%), Central America (667 | 6.3%), and Haiti (428 | 4.0%), together accounting for 55.6% of all West Haverstraw residents.
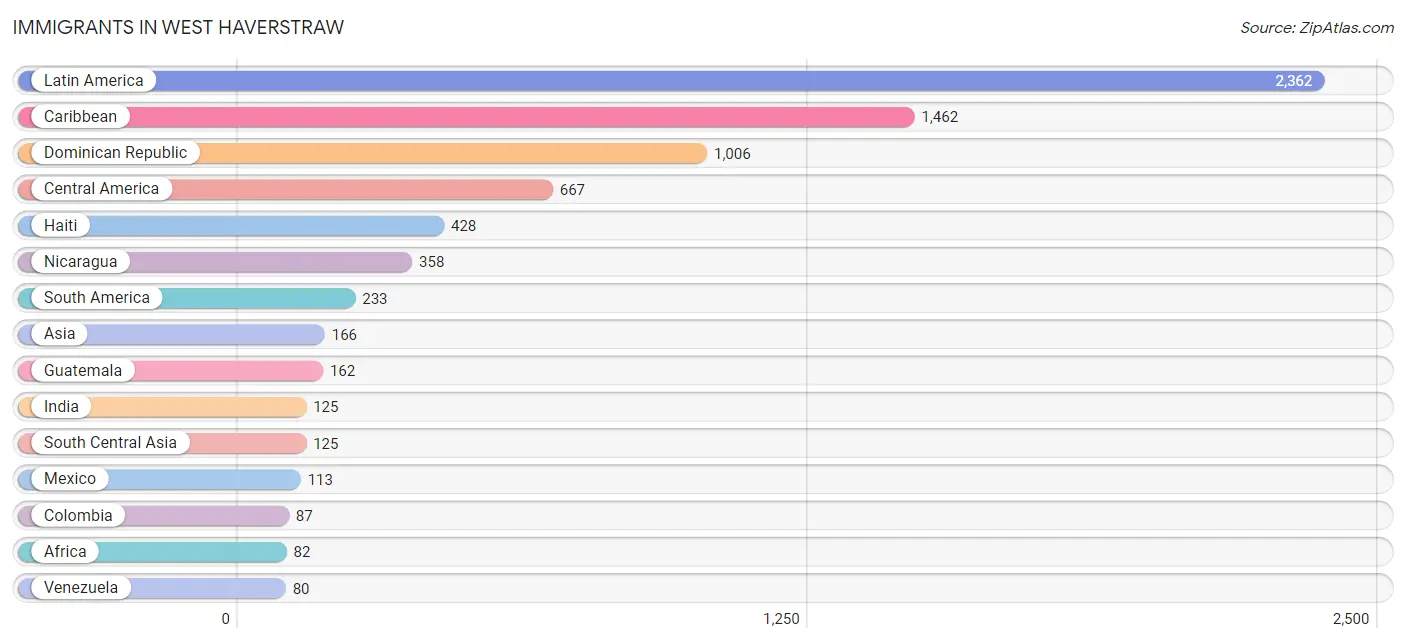
| Immigration Origin | # Population | % Population |
| Africa | 82 | 0.8% |
| Asia | 166 | 1.6% |
| Brazil | 13 | 0.1% |
| Caribbean | 1,462 | 13.7% |
| Central America | 667 | 6.3% |
| Colombia | 87 | 0.8% |
| Dominican Republic | 1,006 | 9.5% |
| Eastern Africa | 35 | 0.3% |
| Ecuador | 28 | 0.3% |
| El Salvador | 34 | 0.3% |
| Europe | 28 | 0.3% |
| Guatemala | 162 | 1.5% |
| Haiti | 428 | 4.0% |
| India | 125 | 1.2% |
| Ireland | 28 | 0.3% |
| Jamaica | 28 | 0.3% |
| Kenya | 35 | 0.3% |
| Latin America | 2,362 | 22.2% |
| Liberia | 47 | 0.4% |
| Mexico | 113 | 1.1% |
| Nicaragua | 358 | 3.4% |
| Northern Europe | 28 | 0.3% |
| Peru | 25 | 0.2% |
| Philippines | 41 | 0.4% |
| South America | 233 | 2.2% |
| South Central Asia | 125 | 1.2% |
| South Eastern Asia | 41 | 0.4% |
| Venezuela | 80 | 0.7% |
| Western Africa | 47 | 0.4% | View All 29 Rows |
Sex and Age in West Haverstraw
Sex and Age in West Haverstraw
The most populous age groups in West Haverstraw are 45 to 49 Years (542 | 9.8%) for men and 45 to 49 Years (658 | 12.9%) for women.
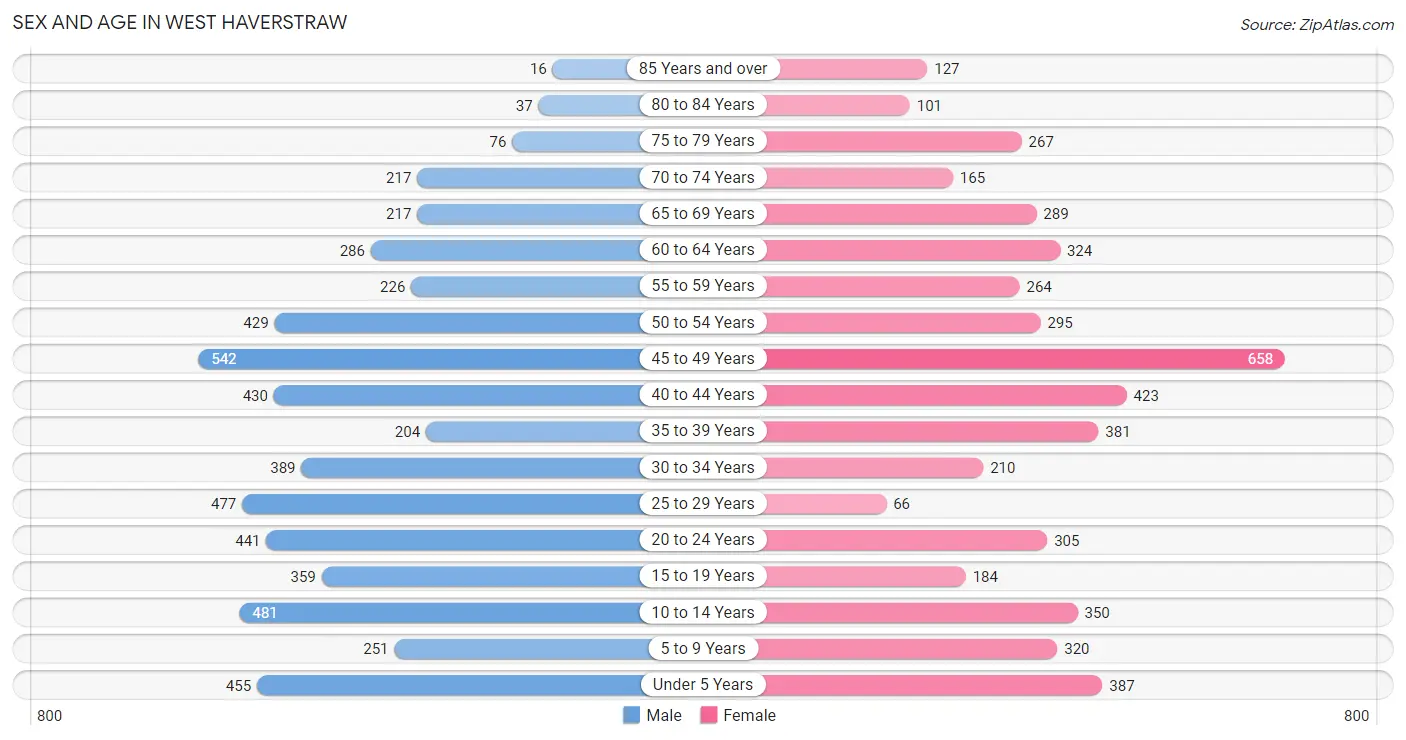
| Age Bracket | Male | Female |
| Under 5 Years | 455 (8.2%) | 387 (7.6%) |
| 5 to 9 Years | 251 (4.5%) | 320 (6.2%) |
| 10 to 14 Years | 481 (8.7%) | 350 (6.8%) |
| 15 to 19 Years | 359 (6.5%) | 184 (3.6%) |
| 20 to 24 Years | 441 (8.0%) | 305 (6.0%) |
| 25 to 29 Years | 477 (8.6%) | 66 (1.3%) |
| 30 to 34 Years | 389 (7.0%) | 210 (4.1%) |
| 35 to 39 Years | 204 (3.7%) | 381 (7.4%) |
| 40 to 44 Years | 430 (7.8%) | 423 (8.3%) |
| 45 to 49 Years | 542 (9.8%) | 658 (12.9%) |
| 50 to 54 Years | 429 (7.7%) | 295 (5.8%) |
| 55 to 59 Years | 226 (4.1%) | 264 (5.2%) |
| 60 to 64 Years | 286 (5.2%) | 324 (6.3%) |
| 65 to 69 Years | 217 (3.9%) | 289 (5.7%) |
| 70 to 74 Years | 217 (3.9%) | 165 (3.2%) |
| 75 to 79 Years | 76 (1.4%) | 267 (5.2%) |
| 80 to 84 Years | 37 (0.7%) | 101 (2.0%) |
| 85 Years and over | 16 (0.3%) | 127 (2.5%) |
| Total | 5,533 (100.0%) | 5,116 (100.0%) |
Families and Households in West Haverstraw
Median Family Size in West Haverstraw
The median family size in West Haverstraw is 3.86 persons per family, with single female/mother families (687 | 30.0%) accounting for the largest median family size of 3.93 persons per family. On the other hand, single male/father families (80 | 3.5%) represent the smallest median family size with 3.05 persons per family.
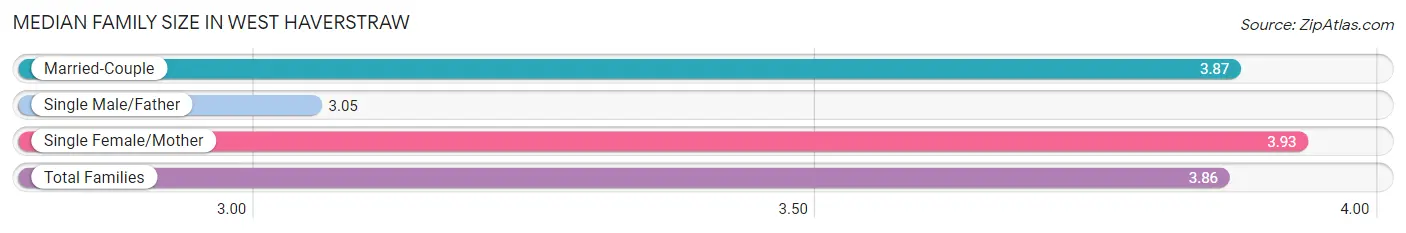
| Family Type | # Families | Family Size |
| Married-Couple | 1,521 (66.5%) | 3.87 |
| Single Male/Father | 80 (3.5%) | 3.05 |
| Single Female/Mother | 687 (30.0%) | 3.93 |
| Total Families | 2,288 (100.0%) | 3.86 |
Median Household Size in West Haverstraw
The median household size in West Haverstraw is 3.23 persons per household, with single female/mother households (687 | 21.0%) accounting for the largest median household size of 4.16 persons per household. non-family households (977 | 29.9%) represent the smallest median household size with 1.38 persons per household.
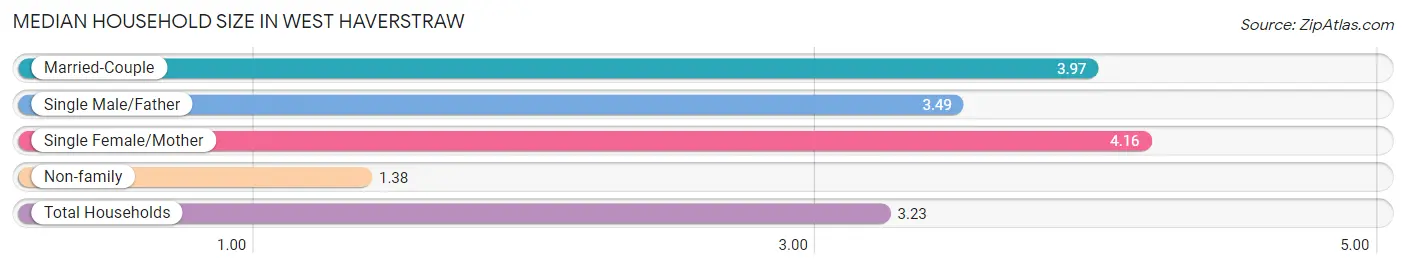
| Household Type | # Households | Household Size |
| Married-Couple | 1,521 (46.6%) | 3.97 |
| Single Male/Father | 80 (2.5%) | 3.49 |
| Single Female/Mother | 687 (21.0%) | 4.16 |
| Non-family | 977 (29.9%) | 1.38 |
| Total Households | 3,265 (100.0%) | 3.23 |
Household Size by Marriage Status in West Haverstraw
Out of a total of 3,265 households in West Haverstraw, 2,288 (70.1%) are family households, while 977 (29.9%) are nonfamily households. The most numerous type of family households are 4-person households, comprising 595, and the most common type of nonfamily households are 1-person households, comprising 665.
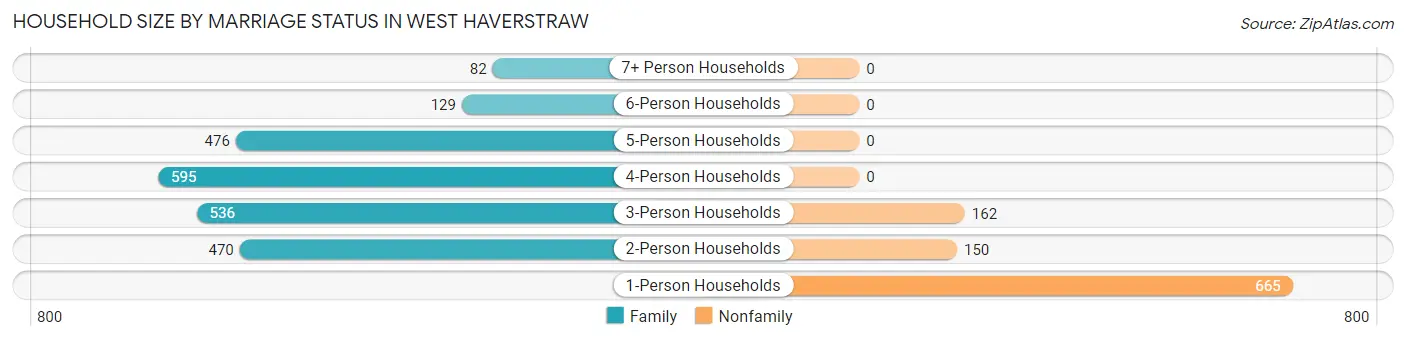
| Household Size | Family Households | Nonfamily Households |
| 1-Person Households | - | 665 (20.4%) |
| 2-Person Households | 470 (14.4%) | 150 (4.6%) |
| 3-Person Households | 536 (16.4%) | 162 (5.0%) |
| 4-Person Households | 595 (18.2%) | 0 (0.0%) |
| 5-Person Households | 476 (14.6%) | 0 (0.0%) |
| 6-Person Households | 129 (4.0%) | 0 (0.0%) |
| 7+ Person Households | 82 (2.5%) | 0 (0.0%) |
| Total | 2,288 (70.1%) | 977 (29.9%) |
Female Fertility in West Haverstraw
Fertility by Age in West Haverstraw
Average fertility rate in West Haverstraw is 73.0 births per 1,000 women. Women in the age bracket of 20 to 34 years have the highest fertility rate with 126.0 births per 1,000 women. Women in the age bracket of 35 to 50 years acount for 58.3% of all women with births.
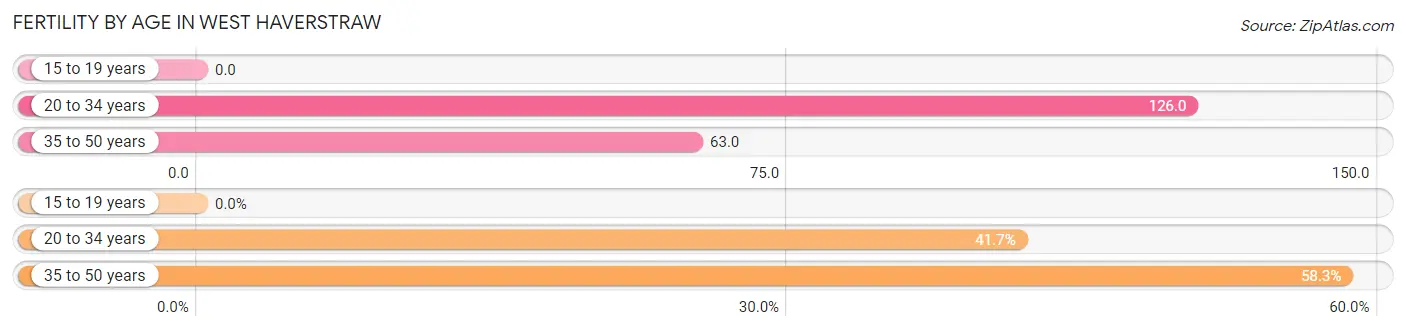
| Age Bracket | Women with Births | Births / 1,000 Women |
| 15 to 19 years | 0 (0.0%) | 0.0 |
| 20 to 34 years | 73 (41.7%) | 126.0 |
| 35 to 50 years | 102 (58.3%) | 63.0 |
| Total | 175 (100.0%) | 73.0 |
Fertility by Age by Marriage Status in West Haverstraw
54.3% of women with births (175) in West Haverstraw are married. The highest percentage of unmarried women with births falls into 35 to 50 years age bracket with 78.4% of them unmarried at the time of birth, while the lowest percentage of unmarried women with births belong to 20 to 34 years age bracket with 0.0% of them unmarried.
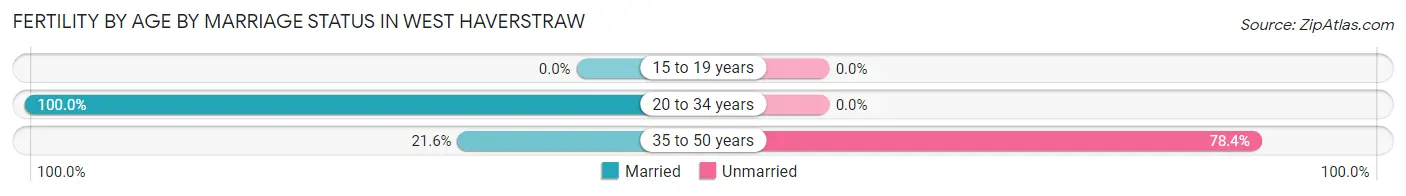
| Age Bracket | Married | Unmarried |
| 15 to 19 years | 0 (0.0%) | 0 (0.0%) |
| 20 to 34 years | 73 (100.0%) | 0 (0.0%) |
| 35 to 50 years | 22 (21.6%) | 80 (78.4%) |
| Total | 95 (54.3%) | 80 (45.7%) |
Fertility by Education in West Haverstraw
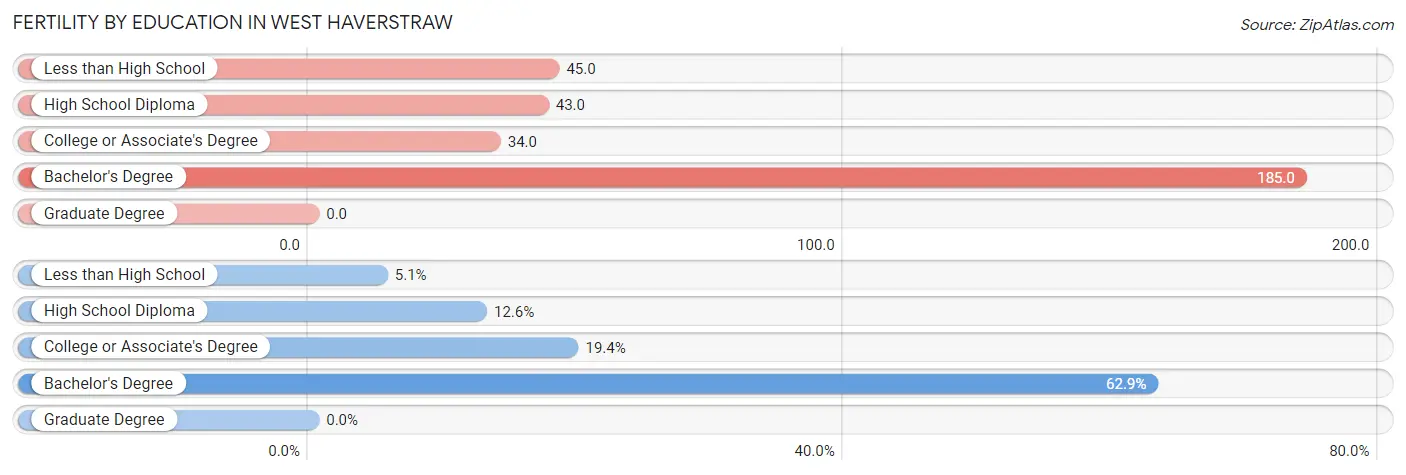
| Educational Attainment | Women with Births | Births / 1,000 Women |
| Less than High School | 9 (5.1%) | 45.0 |
| High School Diploma | 22 (12.6%) | 43.0 |
| College or Associate's Degree | 34 (19.4%) | 34.0 |
| Bachelor's Degree | 110 (62.9%) | 185.0 |
| Graduate Degree | 0 (0.0%) | 0.0 |
| Total | 175 (100.0%) | 73.0 |
Fertility by Education by Marriage Status in West Haverstraw
45.7% of women with births in West Haverstraw are unmarried. Women with the educational attainment of less than high school are most likely to be married with 100.0% of them married at childbirth, while women with the educational attainment of bachelor's degree are least likely to be married with 72.7% of them unmarried at childbirth.
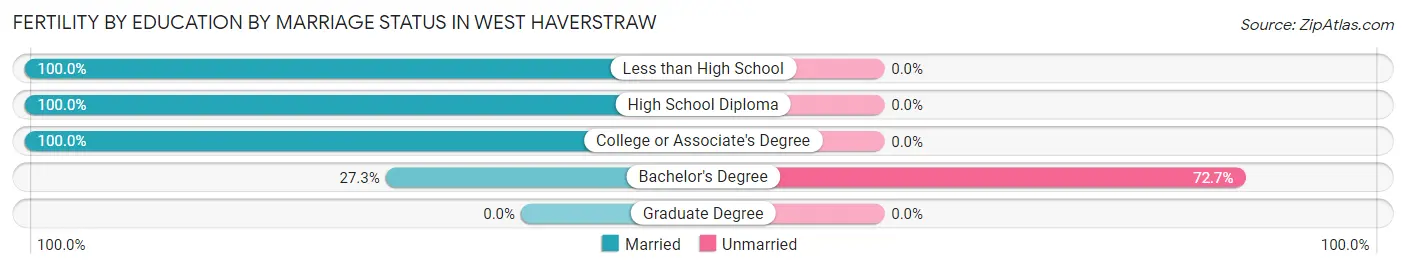
| Educational Attainment | Married | Unmarried |
| Less than High School | 9 (100.0%) | 0 (0.0%) |
| High School Diploma | 22 (100.0%) | 0 (0.0%) |
| College or Associate's Degree | 34 (100.0%) | 0 (0.0%) |
| Bachelor's Degree | 30 (27.3%) | 80 (72.7%) |
| Graduate Degree | 0 (0.0%) | 0 (0.0%) |
| Total | 95 (54.3%) | 80 (45.7%) |
Income in West Haverstraw
Income Overview in West Haverstraw
Per Capita Income in West Haverstraw is $34,493, while median incomes of families and households are $94,395 and $81,795 respectively.
| Characteristic | Number | Measure |
| Per Capita Income | 10,649 | $34,493 |
| Median Family Income | 2,288 | $94,395 |
| Mean Family Income | 2,288 | $120,393 |
| Median Household Income | 3,265 | $81,795 |
| Mean Household Income | 3,265 | $105,470 |
| Income Deficit | 2,288 | $0 |
| Wage / Income Gap (%) | 10,649 | 17.49% |
| Wage / Income Gap ($) | 10,649 | 82.51¢ per $1 |
| Gini / Inequality Index | 10,649 | 0.41 |
Earnings by Sex in West Haverstraw
Average Earnings in West Haverstraw are $39,533, $45,007 for men and $37,136 for women, a difference of 17.5%.
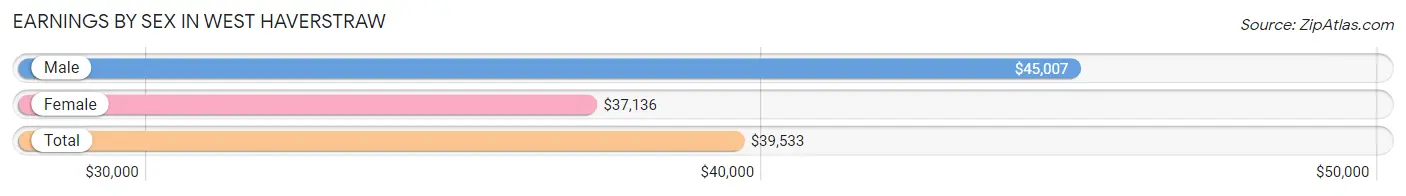
| Sex | Number | Average Earnings |
| Male | 3,337 (55.6%) | $45,007 |
| Female | 2,665 (44.4%) | $37,136 |
| Total | 6,002 (100.0%) | $39,533 |
Earnings by Sex by Income Bracket in West Haverstraw
The most common earnings brackets in West Haverstraw are $75,000 to $99,999 for men (419 | 12.6%) and $55,000 to $64,999 for women (341 | 12.8%).
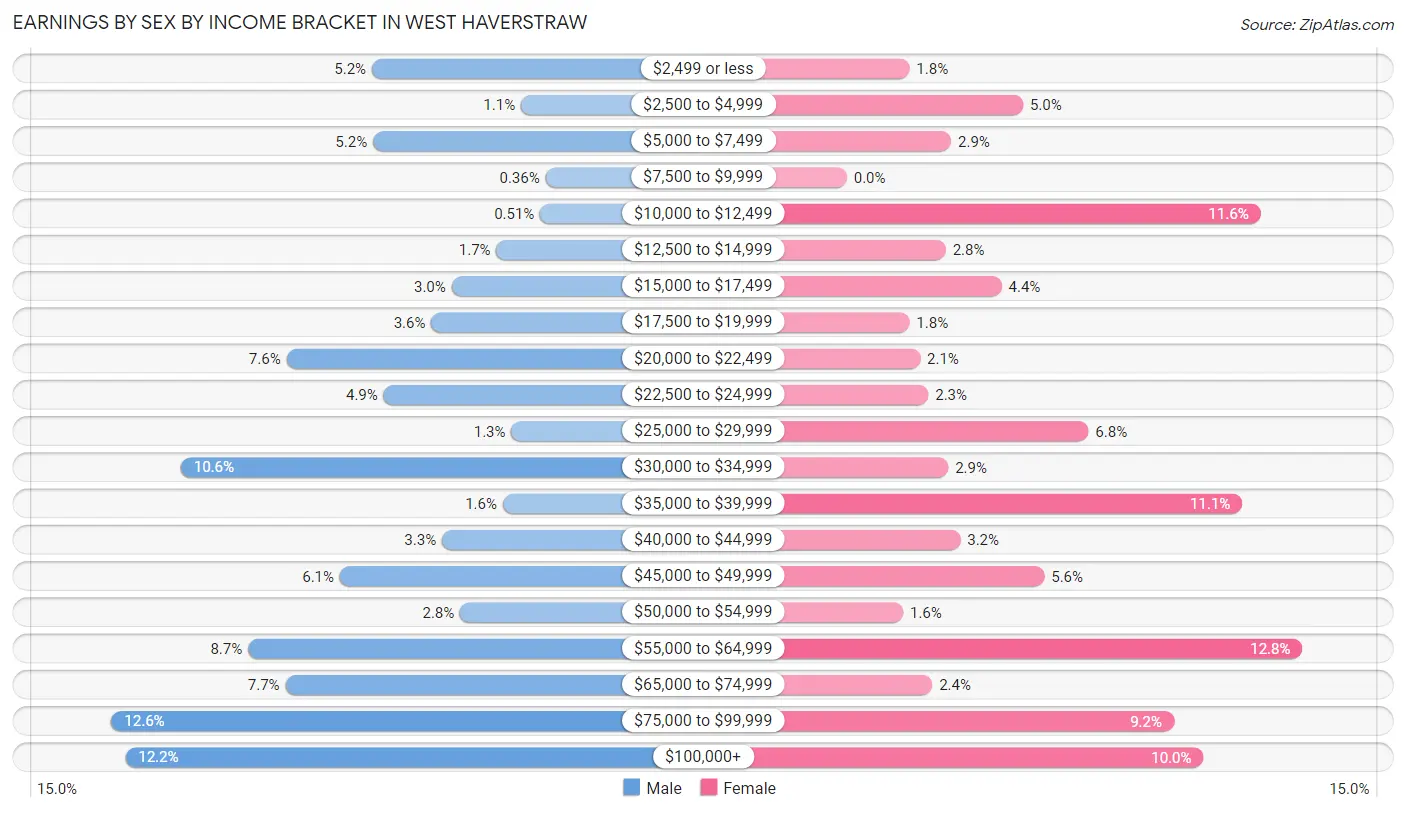
| Income | Male | Female |
| $2,499 or less | 175 (5.2%) | 47 (1.8%) |
| $2,500 to $4,999 | 35 (1.1%) | 132 (5.0%) |
| $5,000 to $7,499 | 174 (5.2%) | 78 (2.9%) |
| $7,500 to $9,999 | 12 (0.4%) | 0 (0.0%) |
| $10,000 to $12,499 | 17 (0.5%) | 310 (11.6%) |
| $12,500 to $14,999 | 58 (1.7%) | 74 (2.8%) |
| $15,000 to $17,499 | 100 (3.0%) | 116 (4.3%) |
| $17,500 to $19,999 | 119 (3.6%) | 47 (1.8%) |
| $20,000 to $22,499 | 255 (7.6%) | 55 (2.1%) |
| $22,500 to $24,999 | 164 (4.9%) | 61 (2.3%) |
| $25,000 to $29,999 | 44 (1.3%) | 181 (6.8%) |
| $30,000 to $34,999 | 354 (10.6%) | 76 (2.9%) |
| $35,000 to $39,999 | 52 (1.6%) | 296 (11.1%) |
| $40,000 to $44,999 | 109 (3.3%) | 85 (3.2%) |
| $45,000 to $49,999 | 205 (6.1%) | 148 (5.6%) |
| $50,000 to $54,999 | 92 (2.8%) | 42 (1.6%) |
| $55,000 to $64,999 | 291 (8.7%) | 341 (12.8%) |
| $65,000 to $74,999 | 256 (7.7%) | 64 (2.4%) |
| $75,000 to $99,999 | 419 (12.6%) | 245 (9.2%) |
| $100,000+ | 406 (12.2%) | 267 (10.0%) |
| Total | 3,337 (100.0%) | 2,665 (100.0%) |
Earnings by Sex by Educational Attainment in West Haverstraw
Average earnings in West Haverstraw are $51,304 for men and $36,827 for women, a difference of 28.2%. Men with an educational attainment of bachelor's degree enjoy the highest average annual earnings of $82,775, while those with college or associate's degree education earn the least with $45,952. Women with an educational attainment of graduate degree earn the most with the average annual earnings of $115,223, while those with college or associate's degree education have the smallest earnings of $29,659.
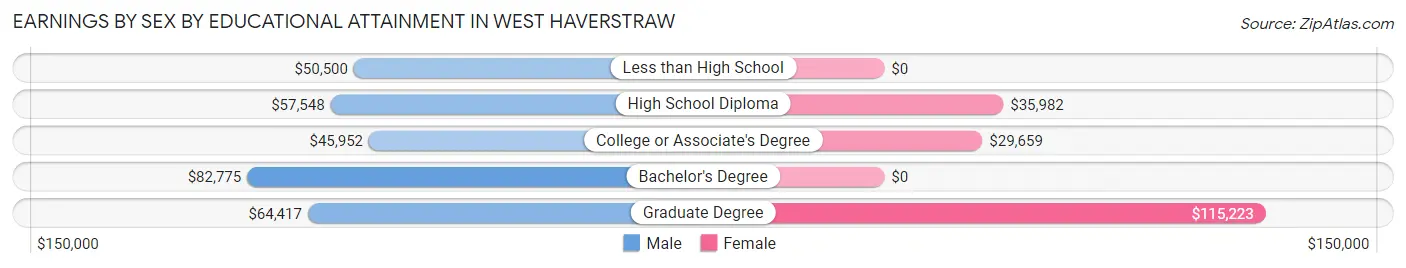
| Educational Attainment | Male Income | Female Income |
| Less than High School | $50,500 | $0 |
| High School Diploma | $57,548 | $35,982 |
| College or Associate's Degree | $45,952 | $29,659 |
| Bachelor's Degree | $82,775 | $0 |
| Graduate Degree | $64,417 | $115,223 |
| Total | $51,304 | $36,827 |
Family Income in West Haverstraw
Family Income Brackets in West Haverstraw
According to the West Haverstraw family income data, there are 474 families falling into the $50,000 to $74,999 income range, which is the most common income bracket and makes up 20.7% of all families. Conversely, the $10,000 to $14,999 income bracket is the least frequent group with only 23 families (1.0%) belonging to this category.
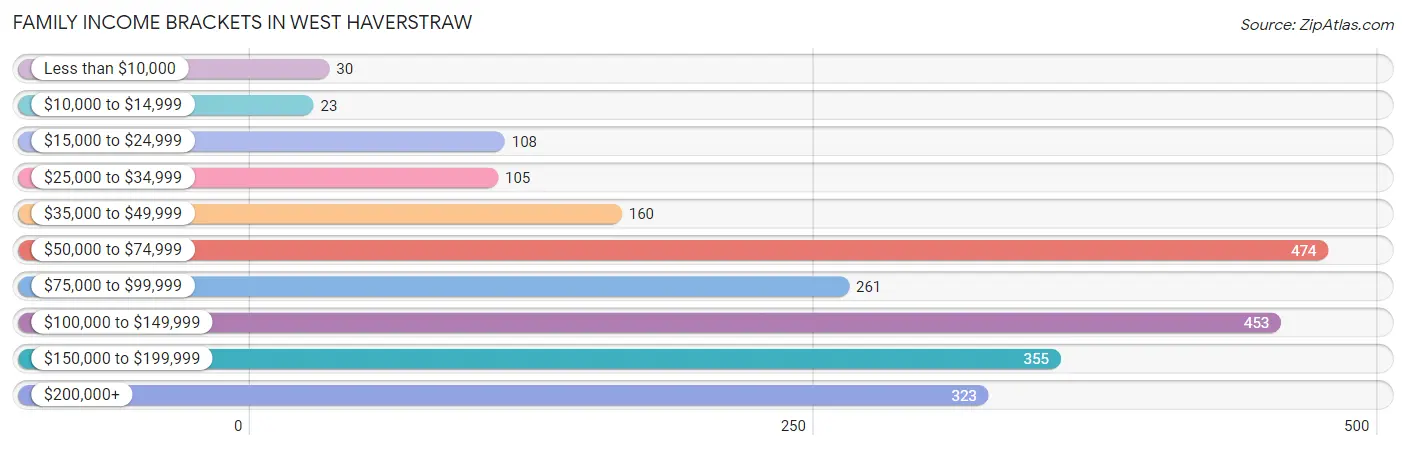
| Income Bracket | # Families | % Families |
| Less than $10,000 | 30 | 1.3% |
| $10,000 to $14,999 | 23 | 1.0% |
| $15,000 to $24,999 | 108 | 4.7% |
| $25,000 to $34,999 | 105 | 4.6% |
| $35,000 to $49,999 | 160 | 7.0% |
| $50,000 to $74,999 | 474 | 20.7% |
| $75,000 to $99,999 | 261 | 11.4% |
| $100,000 to $149,999 | 453 | 19.8% |
| $150,000 to $199,999 | 355 | 15.5% |
| $200,000+ | 323 | 14.1% |
Family Income by Famaliy Size in West Haverstraw
7+ person families (32 | 1.4%) account for the highest median family income in West Haverstraw with $250,001 per family, while 2-person families (549 | 24.0%) have the highest median income of $46,462 per family member.
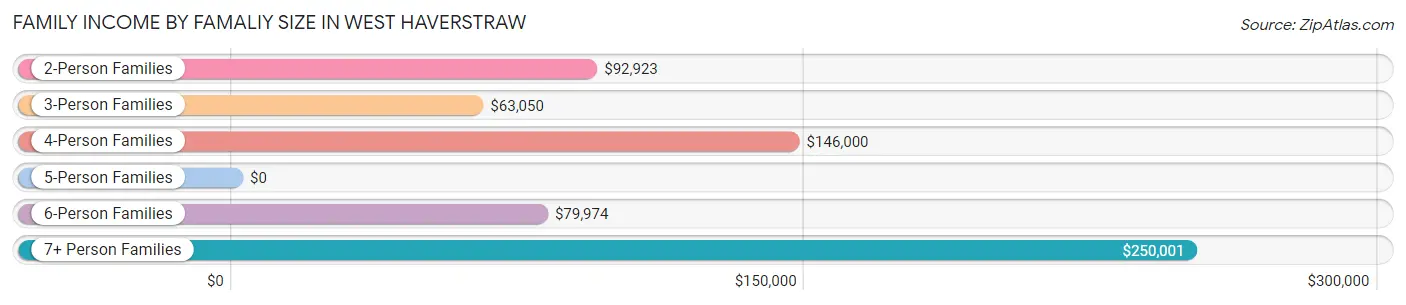
| Income Bracket | # Families | Median Income |
| 2-Person Families | 549 (24.0%) | $92,923 |
| 3-Person Families | 525 (23.0%) | $63,050 |
| 4-Person Families | 560 (24.5%) | $146,000 |
| 5-Person Families | 493 (21.5%) | $0 |
| 6-Person Families | 129 (5.6%) | $79,974 |
| 7+ Person Families | 32 (1.4%) | $250,001 |
| Total | 2,288 (100.0%) | $94,395 |
Family Income by Number of Earners in West Haverstraw
The median family income in West Haverstraw is $94,395, with families comprising 3+ earners (698) having the highest median family income of $182,917, while families with 1 earner (623) have the lowest median family income of $57,567, accounting for 30.5% and 27.2% of families, respectively.
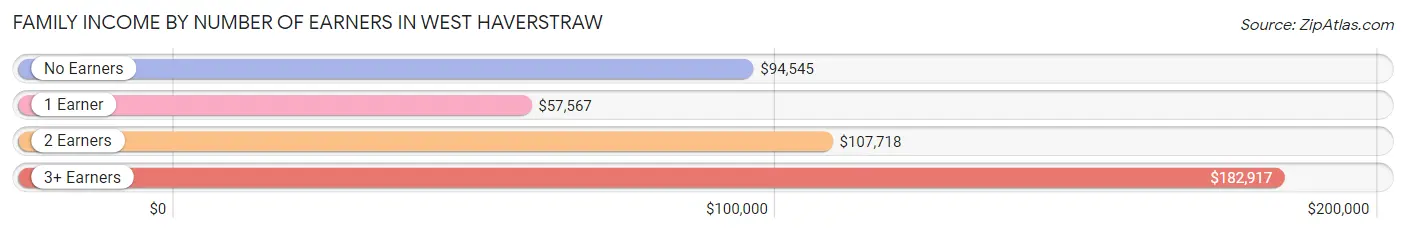
| Number of Earners | # Families | Median Income |
| No Earners | 128 (5.6%) | $94,545 |
| 1 Earner | 623 (27.2%) | $57,567 |
| 2 Earners | 839 (36.7%) | $107,718 |
| 3+ Earners | 698 (30.5%) | $182,917 |
| Total | 2,288 (100.0%) | $94,395 |
Household Income in West Haverstraw
Household Income Brackets in West Haverstraw
With 722 households falling in the category, the $100,000 to $149,999 income range is the most frequent in West Haverstraw, accounting for 22.1% of all households. In contrast, only 91 households (2.8%) fall into the less than $10,000 income bracket, making it the least populous group.
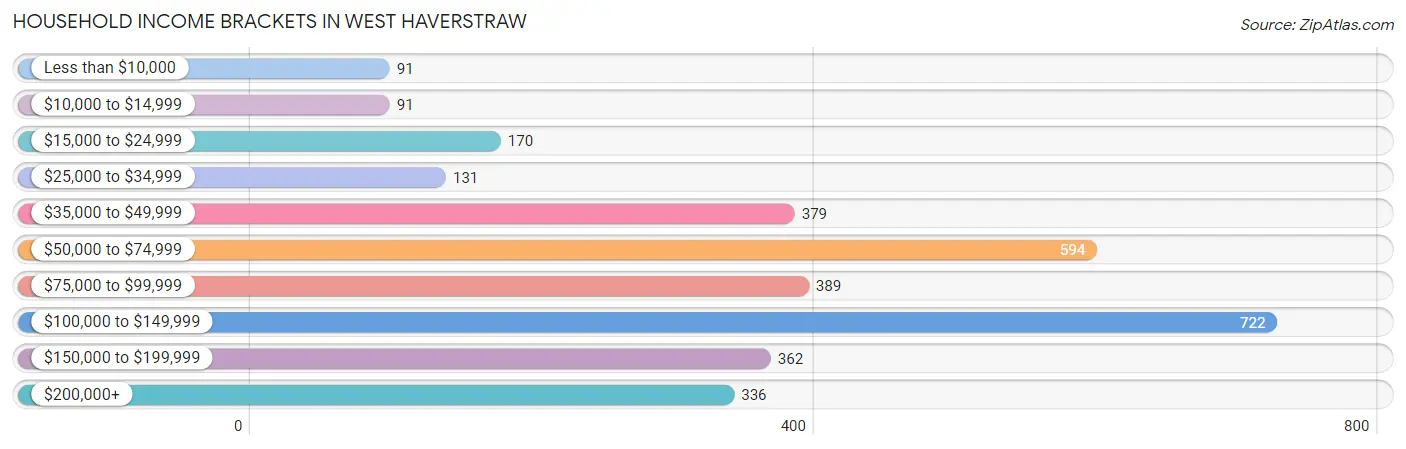
| Income Bracket | # Households | % Households |
| Less than $10,000 | 91 | 2.8% |
| $10,000 to $14,999 | 91 | 2.8% |
| $15,000 to $24,999 | 170 | 5.2% |
| $25,000 to $34,999 | 131 | 4.0% |
| $35,000 to $49,999 | 379 | 11.6% |
| $50,000 to $74,999 | 594 | 18.2% |
| $75,000 to $99,999 | 389 | 11.9% |
| $100,000 to $149,999 | 722 | 22.1% |
| $150,000 to $199,999 | 362 | 11.1% |
| $200,000+ | 336 | 10.3% |
Household Income by Householder Age in West Haverstraw
The median household income in West Haverstraw is $81,795, with the highest median household income of $97,440 found in the 45 to 64 years age bracket for the primary householder. A total of 1,431 households (43.8%) fall into this category. Meanwhile, the 15 to 24 years age bracket for the primary householder has the lowest median household income of $0, with 37 households (1.1%) in this group.
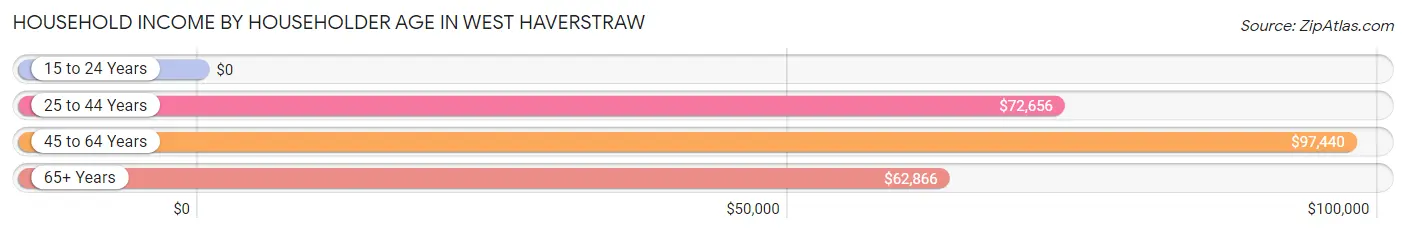
| Income Bracket | # Households | Median Income |
| 15 to 24 Years | 37 (1.1%) | $0 |
| 25 to 44 Years | 942 (28.8%) | $72,656 |
| 45 to 64 Years | 1,431 (43.8%) | $97,440 |
| 65+ Years | 855 (26.2%) | $62,866 |
| Total | 3,265 (100.0%) | $81,795 |
Poverty in West Haverstraw
Income Below Poverty by Sex and Age in West Haverstraw
With 8.6% poverty level for males and 16.7% for females among the residents of West Haverstraw, under 5 year old males and 15 year old females are the most vulnerable to poverty, with 142 males (33.9%) and 45 females (100.0%) in their respective age groups living below the poverty level.
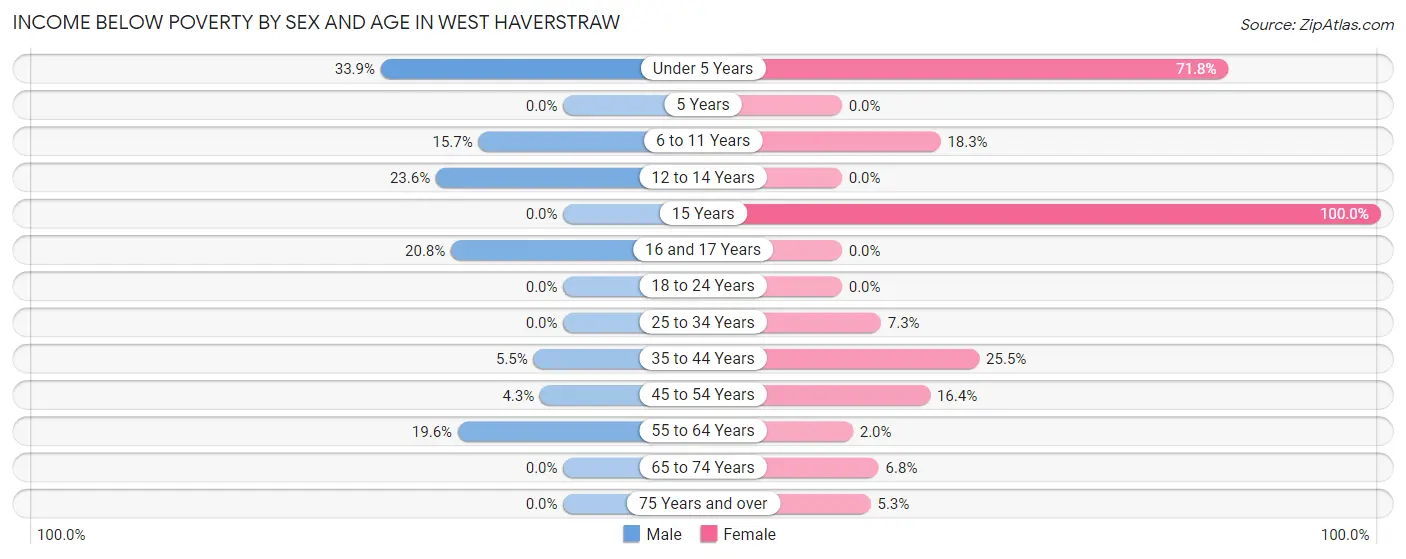
| Age Bracket | Male | Female |
| Under 5 Years | 142 (33.9%) | 259 (71.8%) |
| 5 Years | 0 (0.0%) | 0 (0.0%) |
| 6 to 11 Years | 51 (15.7%) | 91 (18.3%) |
| 12 to 14 Years | 78 (23.6%) | 0 (0.0%) |
| 15 Years | 0 (0.0%) | 45 (100.0%) |
| 16 and 17 Years | 20 (20.8%) | 0 (0.0%) |
| 18 to 24 Years | 0 (0.0%) | 0 (0.0%) |
| 25 to 34 Years | 0 (0.0%) | 20 (7.2%) |
| 35 to 44 Years | 35 (5.5%) | 205 (25.5%) |
| 45 to 54 Years | 42 (4.3%) | 156 (16.4%) |
| 55 to 64 Years | 100 (19.6%) | 12 (2.0%) |
| 65 to 74 Years | 0 (0.0%) | 31 (6.8%) |
| 75 Years and over | 0 (0.0%) | 26 (5.3%) |
| Total | 468 (8.6%) | 845 (16.7%) |
Income Above Poverty by Sex and Age in West Haverstraw
According to the poverty statistics in West Haverstraw, males aged 5 years and females aged 5 years are the age groups that are most secure financially, with 100.0% of males and 100.0% of females in these age groups living above the poverty line.
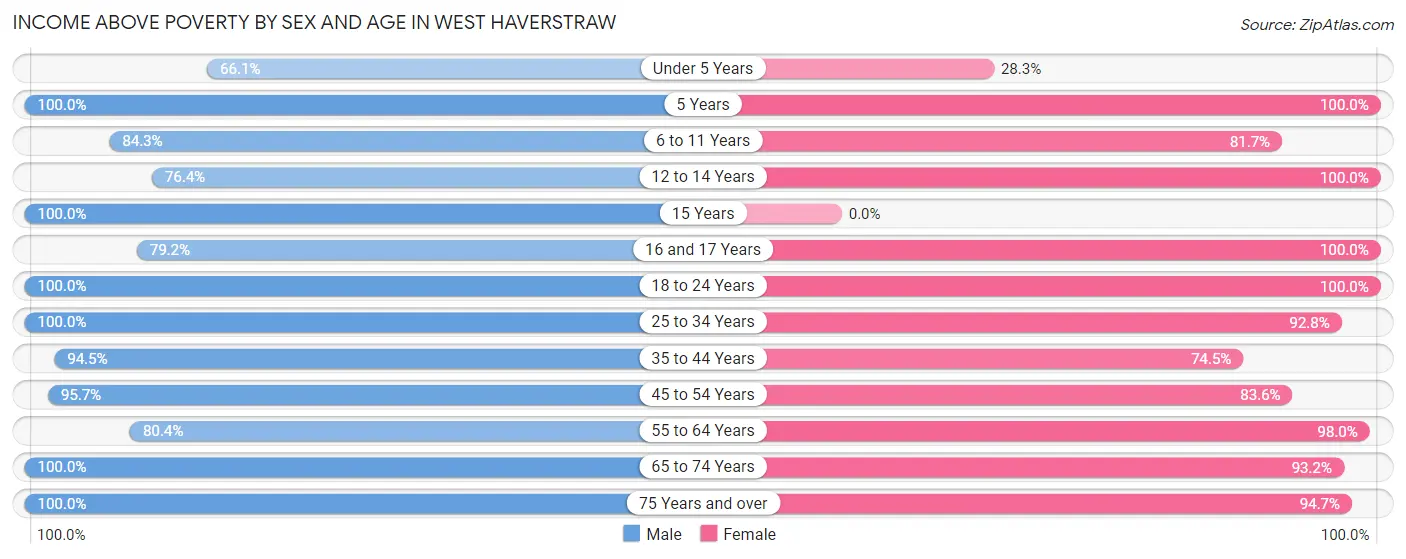
| Age Bracket | Male | Female |
| Under 5 Years | 277 (66.1%) | 102 (28.2%) |
| 5 Years | 50 (100.0%) | 125 (100.0%) |
| 6 to 11 Years | 273 (84.3%) | 406 (81.7%) |
| 12 to 14 Years | 252 (76.4%) | 18 (100.0%) |
| 15 Years | 111 (100.0%) | 0 (0.0%) |
| 16 and 17 Years | 76 (79.2%) | 139 (100.0%) |
| 18 to 24 Years | 593 (100.0%) | 305 (100.0%) |
| 25 to 34 Years | 866 (100.0%) | 256 (92.7%) |
| 35 to 44 Years | 599 (94.5%) | 599 (74.5%) |
| 45 to 54 Years | 929 (95.7%) | 797 (83.6%) |
| 55 to 64 Years | 411 (80.4%) | 575 (98.0%) |
| 65 to 74 Years | 434 (100.0%) | 422 (93.2%) |
| 75 Years and over | 124 (100.0%) | 462 (94.7%) |
| Total | 4,995 (91.4%) | 4,206 (83.3%) |
Income Below Poverty Among Married-Couple Families in West Haverstraw
The poverty statistics for married-couple families in West Haverstraw show that 3.5% or 54 of the total 1,521 families live below the poverty line. Families with 1 or 2 children have the highest poverty rate of 5.9%, comprising of 42 families. On the other hand, families with 3 or 4 children have the lowest poverty rate of 0.0%, which includes 0 families.
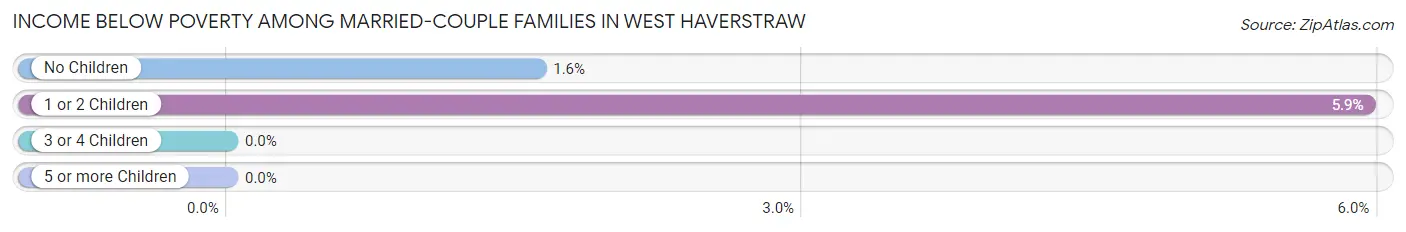
| Children | Above Poverty | Below Poverty |
| No Children | 733 (98.4%) | 12 (1.6%) |
| 1 or 2 Children | 665 (94.1%) | 42 (5.9%) |
| 3 or 4 Children | 61 (100.0%) | 0 (0.0%) |
| 5 or more Children | 8 (100.0%) | 0 (0.0%) |
| Total | 1,467 (96.5%) | 54 (3.5%) |
Income Below Poverty Among Single-Parent Households in West Haverstraw
According to the poverty data in West Haverstraw, 43.8% or 35 single-father households and 16.3% or 112 single-mother households are living below the poverty line. Among single-father households, those with 1 or 2 children have the highest poverty rate, with 35 households (100.0%) experiencing poverty. Likewise, among single-mother households, those with 3 or 4 children have the highest poverty rate, with 80 households (100.0%) falling below the poverty line.
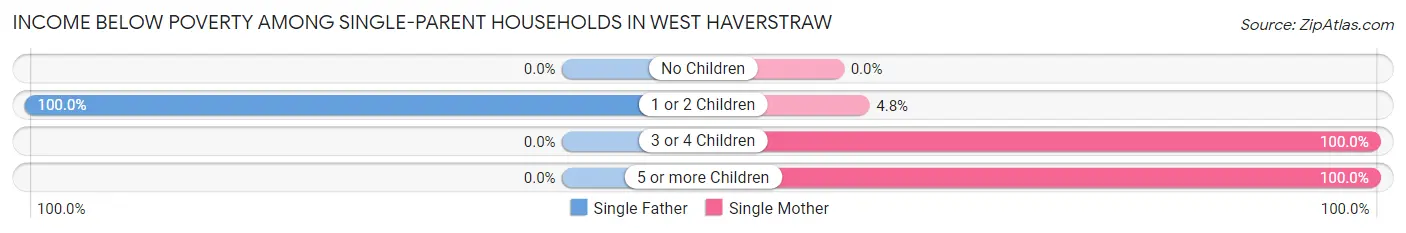
| Children | Single Father | Single Mother |
| No Children | 0 (0.0%) | 0 (0.0%) |
| 1 or 2 Children | 35 (100.0%) | 15 (4.8%) |
| 3 or 4 Children | 0 (0.0%) | 80 (100.0%) |
| 5 or more Children | 0 (0.0%) | 17 (100.0%) |
| Total | 35 (43.8%) | 112 (16.3%) |
Income Below Poverty Among Married-Couple vs Single-Parent Households in West Haverstraw
The poverty data for West Haverstraw shows that 54 of the married-couple family households (3.5%) and 147 of the single-parent households (19.2%) are living below the poverty level. Within the married-couple family households, those with 1 or 2 children have the highest poverty rate, with 42 households (5.9%) falling below the poverty line. Among the single-parent households, those with 3 or 4 children have the highest poverty rate, with 80 household (100.0%) living below poverty.
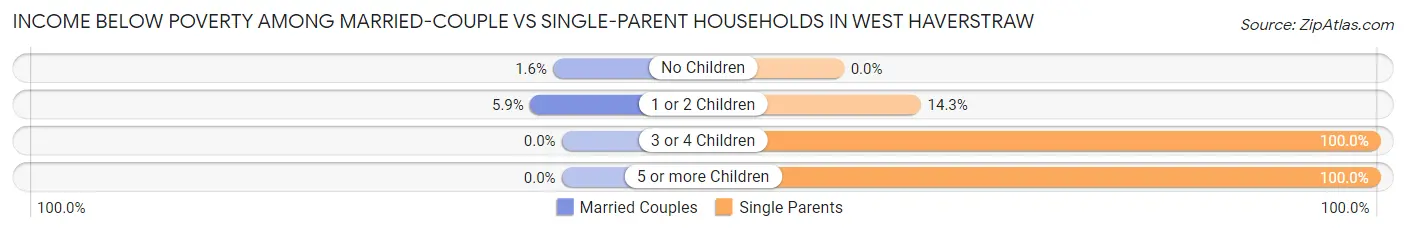
| Children | Married-Couple Families | Single-Parent Households |
| No Children | 12 (1.6%) | 0 (0.0%) |
| 1 or 2 Children | 42 (5.9%) | 50 (14.3%) |
| 3 or 4 Children | 0 (0.0%) | 80 (100.0%) |
| 5 or more Children | 0 (0.0%) | 17 (100.0%) |
| Total | 54 (3.5%) | 147 (19.2%) |
Employment Characteristics in West Haverstraw
Employment by Class of Employer in West Haverstraw
Among the 5,189 employed individuals in West Haverstraw, private company employees (3,216 | 62.0%), local government employees (730 | 14.1%), and not-for-profit organizations (619 | 11.9%) make up the most common classes of employment.
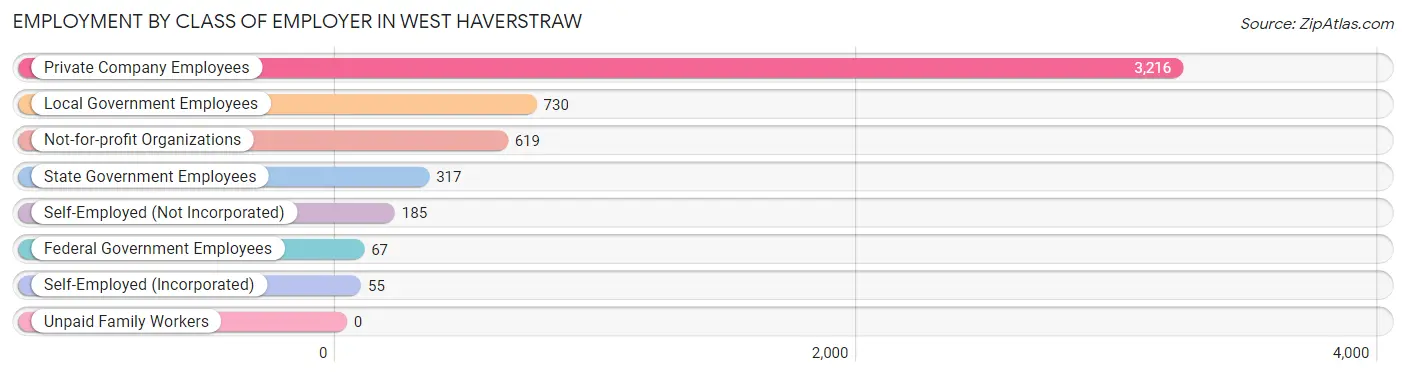
| Employer Class | # Employees | % Employees |
| Private Company Employees | 3,216 | 62.0% |
| Self-Employed (Incorporated) | 55 | 1.1% |
| Self-Employed (Not Incorporated) | 185 | 3.6% |
| Not-for-profit Organizations | 619 | 11.9% |
| Local Government Employees | 730 | 14.1% |
| State Government Employees | 317 | 6.1% |
| Federal Government Employees | 67 | 1.3% |
| Unpaid Family Workers | 0 | 0.0% |
| Total | 5,189 | 100.0% |
Employment Status by Age in West Haverstraw
According to the labor force statistics for West Haverstraw, out of the total population over 16 years of age (8,249), 70.6% or 5,824 individuals are in the labor force, with 6.4% or 373 of them unemployed. The age group with the highest labor force participation rate is 30 to 34 years, with 96.0% or 575 individuals in the labor force. Within the labor force, the 25 to 29 years age range has the highest percentage of unemployed individuals, with 16.2% or 82 of them being unemployed.
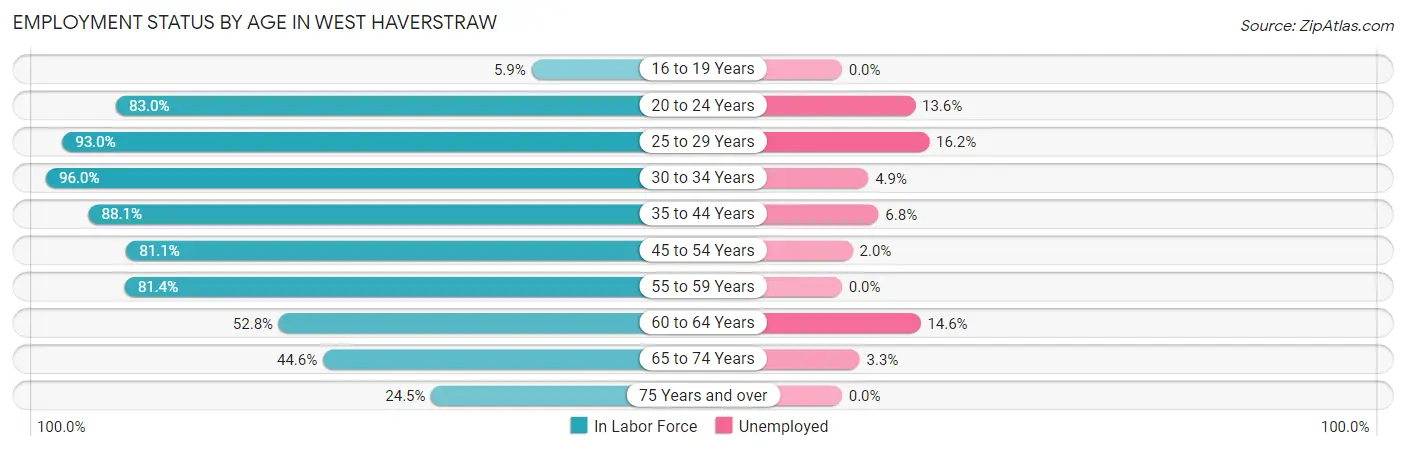
| Age Bracket | In Labor Force | Unemployed |
| 16 to 19 Years | 23 (5.9%) | 0 (0.0%) |
| 20 to 24 Years | 619 (83.0%) | 84 (13.6%) |
| 25 to 29 Years | 505 (93.0%) | 82 (16.2%) |
| 30 to 34 Years | 575 (96.0%) | 28 (4.9%) |
| 35 to 44 Years | 1,267 (88.1%) | 86 (6.8%) |
| 45 to 54 Years | 1,560 (81.1%) | 31 (2.0%) |
| 55 to 59 Years | 399 (81.4%) | 0 (0.0%) |
| 60 to 64 Years | 322 (52.8%) | 47 (14.6%) |
| 65 to 74 Years | 396 (44.6%) | 13 (3.3%) |
| 75 Years and over | 153 (24.5%) | 0 (0.0%) |
| Total | 5,824 (70.6%) | 373 (6.4%) |
Employment Status by Educational Attainment in West Haverstraw
According to labor force statistics for West Haverstraw, 82.6% of individuals (4,629) out of the total population between 25 and 64 years of age (5,604) are in the labor force, with 5.9% or 273 of them being unemployed. The group with the highest labor force participation rate are those with the educational attainment of bachelor's degree or higher, with 90.8% or 1,212 individuals in the labor force. Within the labor force, individuals with college / associate degree education have the highest percentage of unemployment, with 6.3% or 114 of them being unemployed.
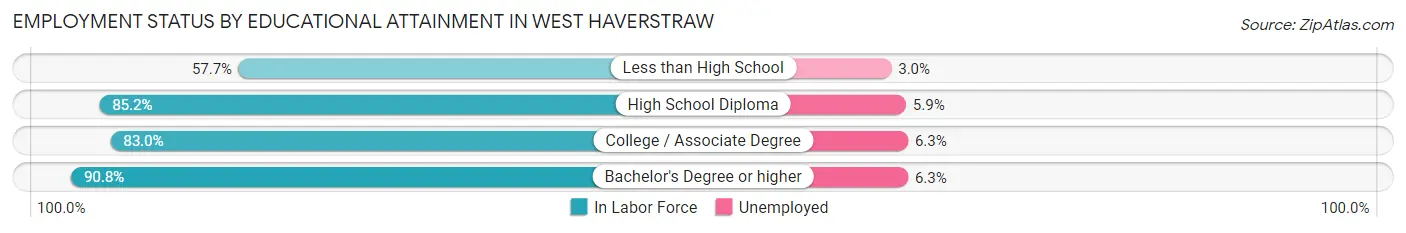
| Educational Attainment | In Labor Force | Unemployed |
| Less than High School | 362 (57.7%) | 19 (3.0%) |
| High School Diploma | 1,246 (85.2%) | 86 (5.9%) |
| College / Associate Degree | 1,809 (83.0%) | 137 (6.3%) |
| Bachelor's Degree or higher | 1,212 (90.8%) | 84 (6.3%) |
| Total | 4,629 (82.6%) | 331 (5.9%) |
Employment Occupations by Sex in West Haverstraw
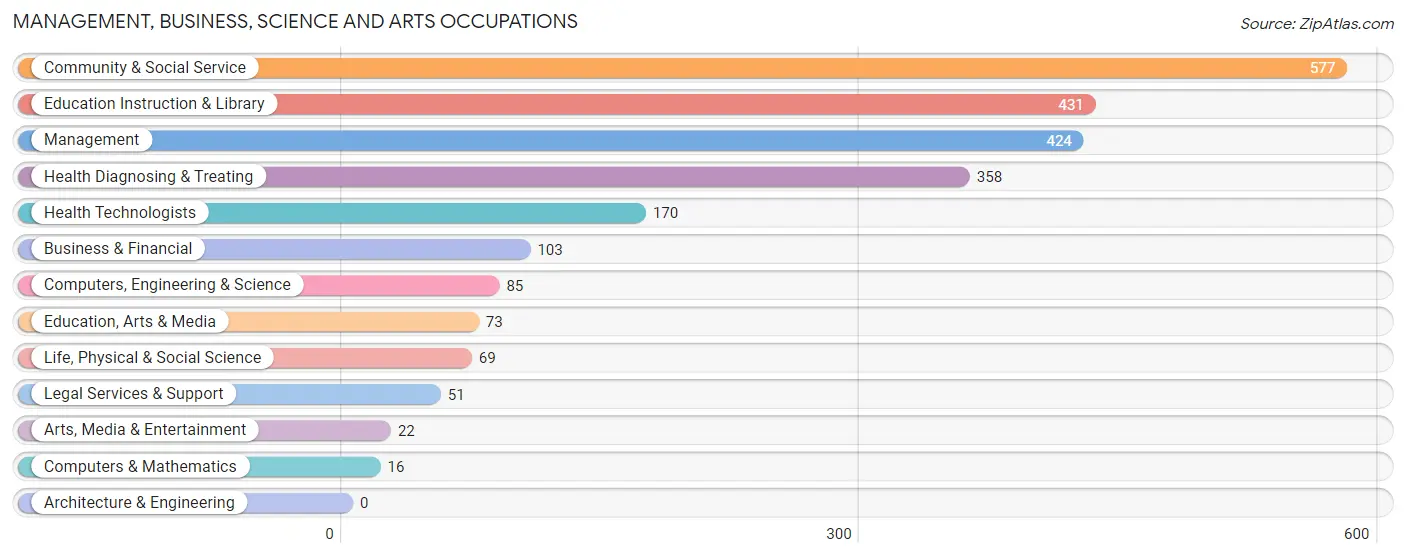
Management, Business, Science and Arts Occupations
The most common Management, Business, Science and Arts occupations in West Haverstraw are Community & Social Service (577 | 10.6%), Education Instruction & Library (431 | 7.9%), Management (424 | 7.8%), Health Diagnosing & Treating (358 | 6.6%), and Health Technologists (170 | 3.1%).
Management, Business, Science and Arts Occupations by Sex
Within the Management, Business, Science and Arts occupations in West Haverstraw, the most male-oriented occupations are Computers, Engineering & Science (100.0%), Computers & Mathematics (100.0%), and Life, Physical & Social Science (100.0%), while the most female-oriented occupations are Legal Services & Support (100.0%), Arts, Media & Entertainment (100.0%), and Business & Financial (84.5%).
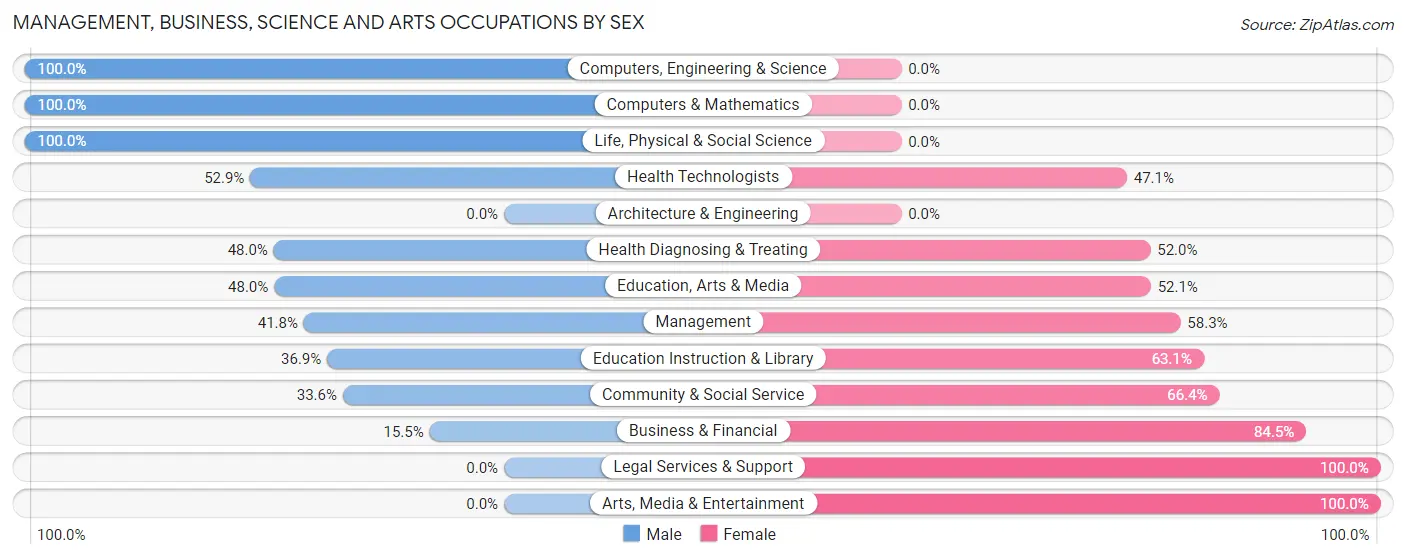
| Occupation | Male | Female |
| Management | 177 (41.7%) | 247 (58.3%) |
| Business & Financial | 16 (15.5%) | 87 (84.5%) |
| Computers, Engineering & Science | 85 (100.0%) | 0 (0.0%) |
| Computers & Mathematics | 16 (100.0%) | 0 (0.0%) |
| Architecture & Engineering | 0 (0.0%) | 0 (0.0%) |
| Life, Physical & Social Science | 69 (100.0%) | 0 (0.0%) |
| Community & Social Service | 194 (33.6%) | 383 (66.4%) |
| Education, Arts & Media | 35 (47.9%) | 38 (52.0%) |
| Legal Services & Support | 0 (0.0%) | 51 (100.0%) |
| Education Instruction & Library | 159 (36.9%) | 272 (63.1%) |
| Arts, Media & Entertainment | 0 (0.0%) | 22 (100.0%) |
| Health Diagnosing & Treating | 172 (48.0%) | 186 (52.0%) |
| Health Technologists | 90 (52.9%) | 80 (47.1%) |
| Total (Category) | 644 (41.6%) | 903 (58.4%) |
| Total (Overall) | 3,005 (55.1%) | 2,444 (44.9%) |
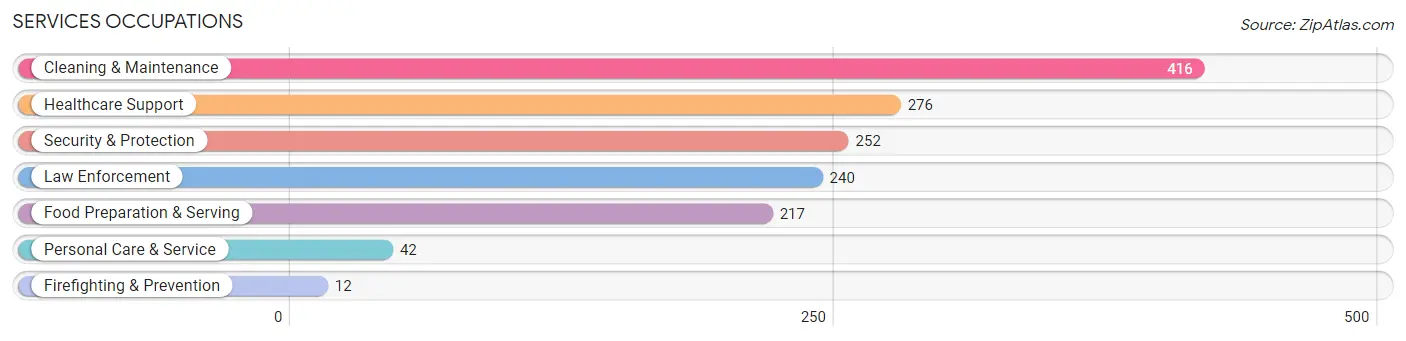
Services Occupations
The most common Services occupations in West Haverstraw are Cleaning & Maintenance (416 | 7.6%), Healthcare Support (276 | 5.1%), Security & Protection (252 | 4.6%), Law Enforcement (240 | 4.4%), and Food Preparation & Serving (217 | 4.0%).
Services Occupations by Sex
Within the Services occupations in West Haverstraw, the most male-oriented occupations are Security & Protection (100.0%), Firefighting & Prevention (100.0%), and Law Enforcement (100.0%), while the most female-oriented occupations are Healthcare Support (84.8%), Personal Care & Service (45.2%), and Cleaning & Maintenance (32.9%).
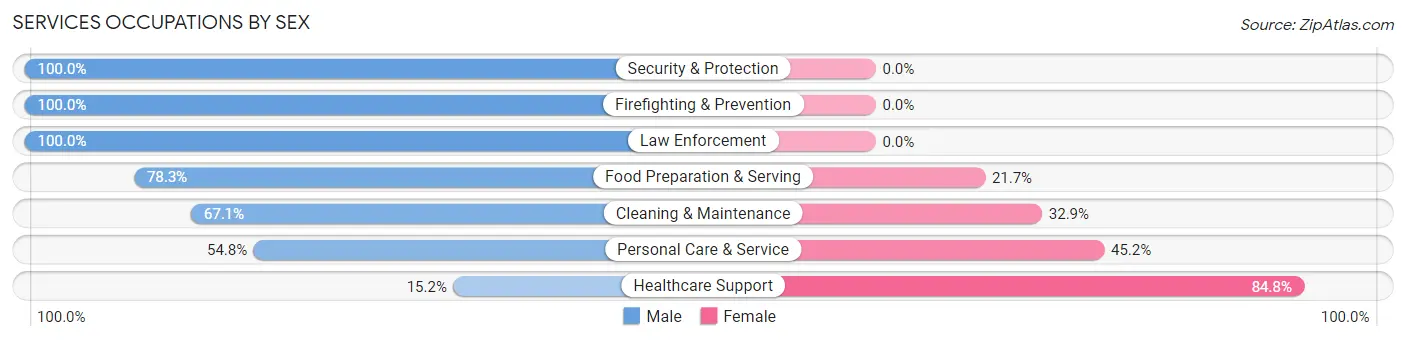
| Occupation | Male | Female |
| Healthcare Support | 42 (15.2%) | 234 (84.8%) |
| Security & Protection | 252 (100.0%) | 0 (0.0%) |
| Firefighting & Prevention | 12 (100.0%) | 0 (0.0%) |
| Law Enforcement | 240 (100.0%) | 0 (0.0%) |
| Food Preparation & Serving | 170 (78.3%) | 47 (21.7%) |
| Cleaning & Maintenance | 279 (67.1%) | 137 (32.9%) |
| Personal Care & Service | 23 (54.8%) | 19 (45.2%) |
| Total (Category) | 766 (63.7%) | 437 (36.3%) |
| Total (Overall) | 3,005 (55.1%) | 2,444 (44.9%) |
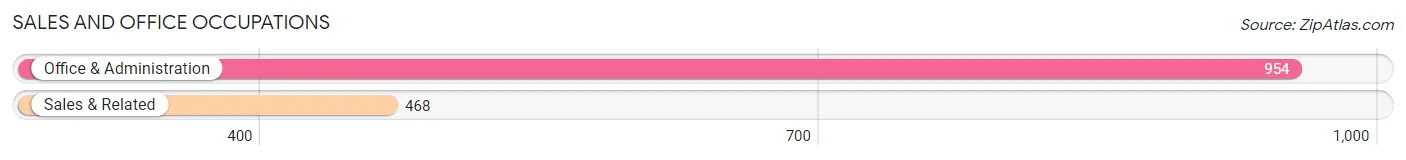
Sales and Office Occupations
The most common Sales and Office occupations in West Haverstraw are Office & Administration (954 | 17.5%), and Sales & Related (468 | 8.6%).
Sales and Office Occupations by Sex
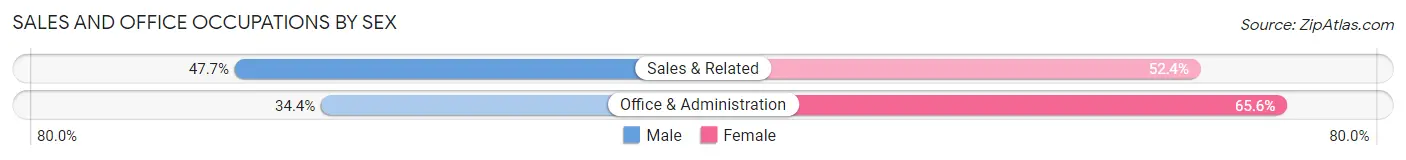
| Occupation | Male | Female |
| Sales & Related | 223 (47.6%) | 245 (52.3%) |
| Office & Administration | 328 (34.4%) | 626 (65.6%) |
| Total (Category) | 551 (38.8%) | 871 (61.3%) |
| Total (Overall) | 3,005 (55.1%) | 2,444 (44.9%) |
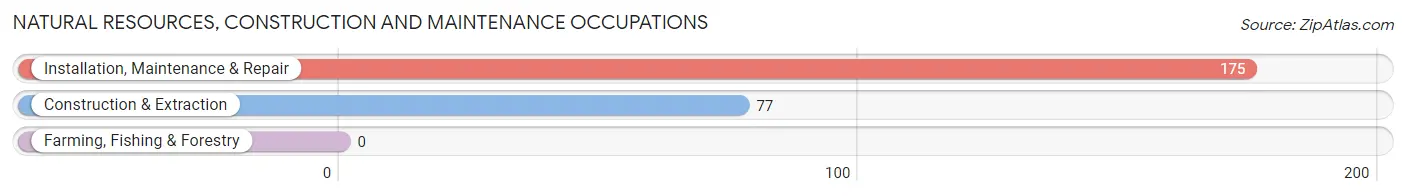
Natural Resources, Construction and Maintenance Occupations
The most common Natural Resources, Construction and Maintenance occupations in West Haverstraw are Installation, Maintenance & Repair (175 | 3.2%), and Construction & Extraction (77 | 1.4%).
Natural Resources, Construction and Maintenance Occupations by Sex
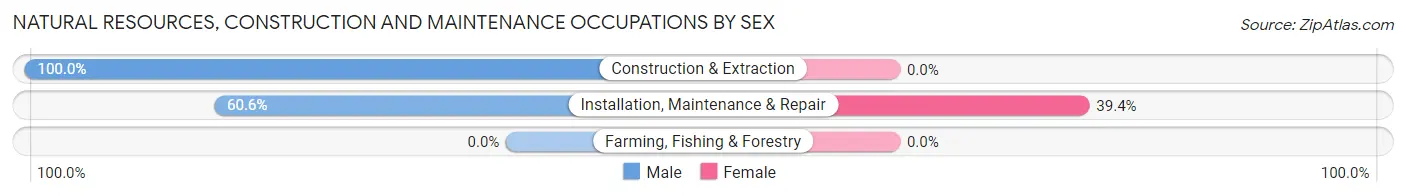
| Occupation | Male | Female |
| Farming, Fishing & Forestry | 0 (0.0%) | 0 (0.0%) |
| Construction & Extraction | 77 (100.0%) | 0 (0.0%) |
| Installation, Maintenance & Repair | 106 (60.6%) | 69 (39.4%) |
| Total (Category) | 183 (72.6%) | 69 (27.4%) |
| Total (Overall) | 3,005 (55.1%) | 2,444 (44.9%) |
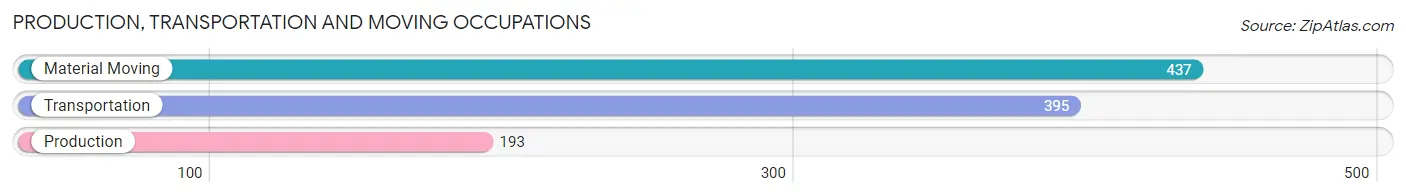
Production, Transportation and Moving Occupations
The most common Production, Transportation and Moving occupations in West Haverstraw are Material Moving (437 | 8.0%), Transportation (395 | 7.2%), and Production (193 | 3.5%).
Production, Transportation and Moving Occupations by Sex
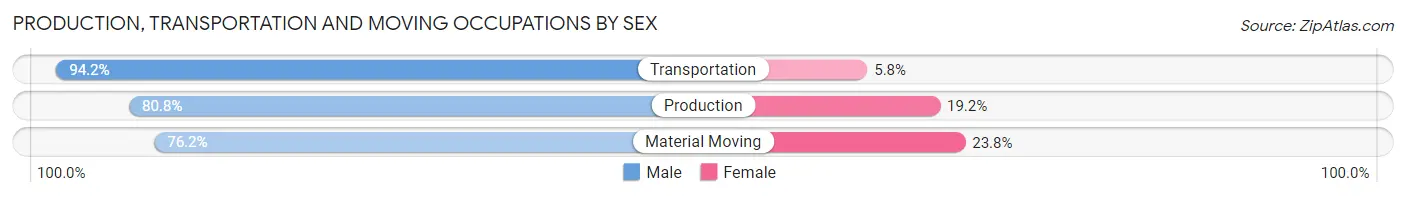
| Occupation | Male | Female |
| Production | 156 (80.8%) | 37 (19.2%) |
| Transportation | 372 (94.2%) | 23 (5.8%) |
| Material Moving | 333 (76.2%) | 104 (23.8%) |
| Total (Category) | 861 (84.0%) | 164 (16.0%) |
| Total (Overall) | 3,005 (55.1%) | 2,444 (44.9%) |
Employment Industries by Sex in West Haverstraw
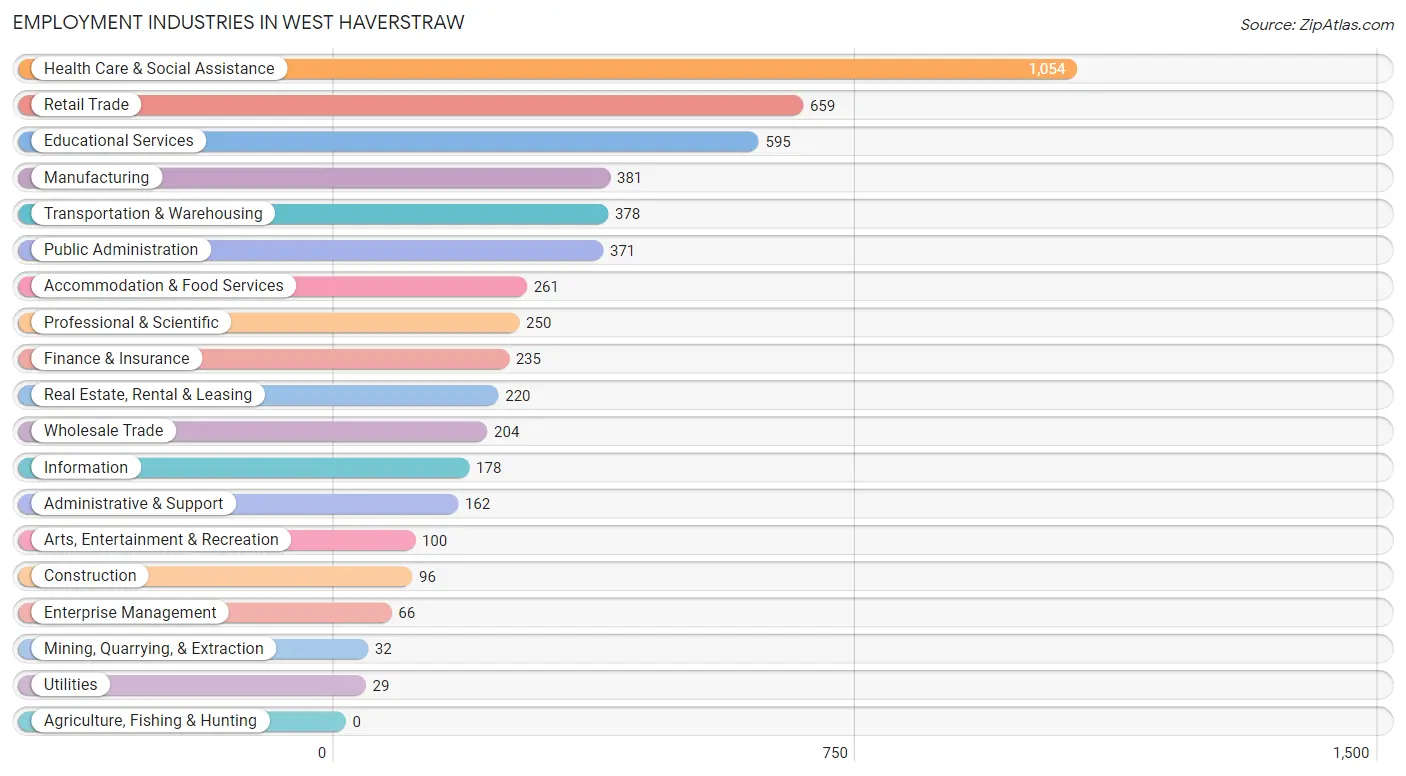
Employment Industries in West Haverstraw
The major employment industries in West Haverstraw include Health Care & Social Assistance (1,054 | 19.3%), Retail Trade (659 | 12.1%), Educational Services (595 | 10.9%), Manufacturing (381 | 7.0%), and Transportation & Warehousing (378 | 6.9%).
Employment Industries by Sex in West Haverstraw
The West Haverstraw industries that see more men than women are Mining, Quarrying, & Extraction (100.0%), Construction (100.0%), and Transportation & Warehousing (100.0%), whereas the industries that tend to have a higher number of women are Enterprise Management (100.0%), Finance & Insurance (78.3%), and Health Care & Social Assistance (72.2%).
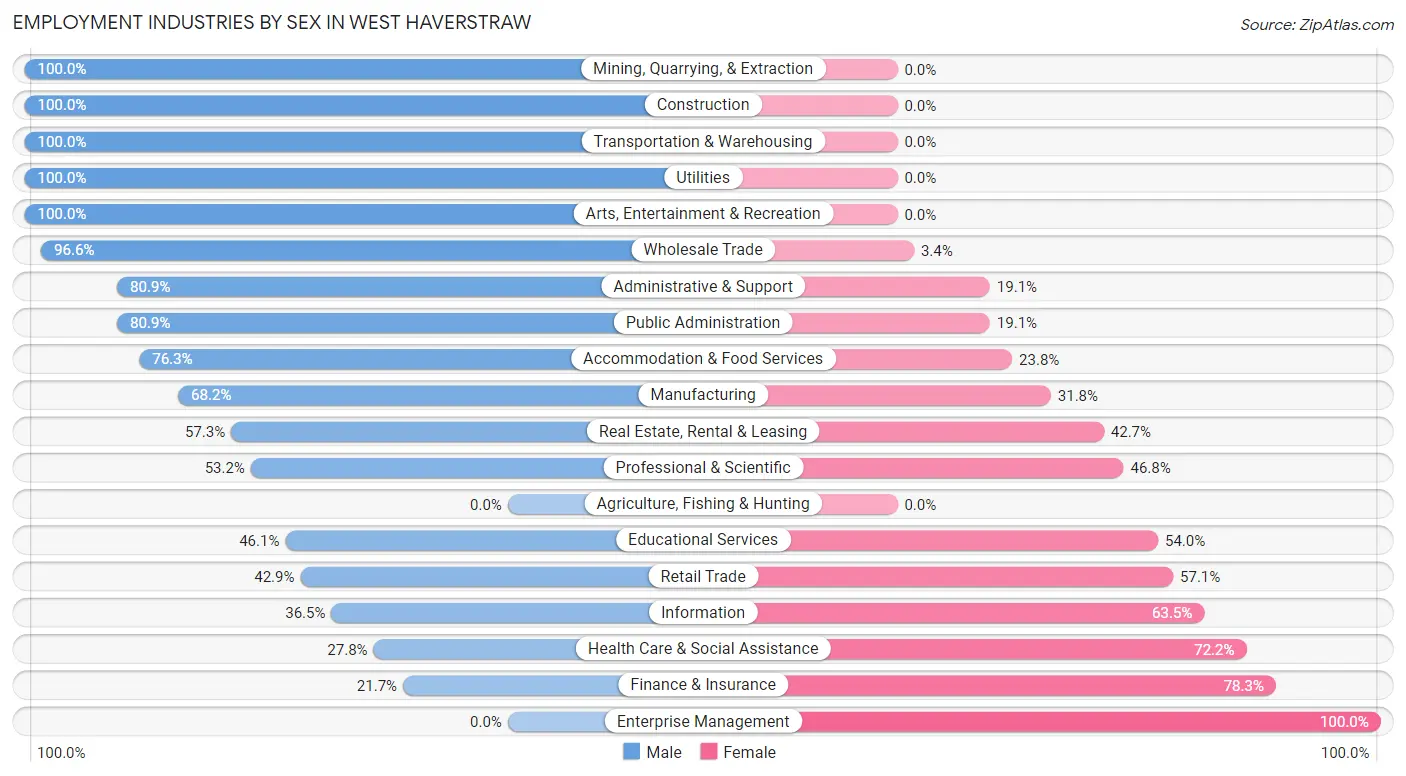
| Industry | Male | Female |
| Agriculture, Fishing & Hunting | 0 (0.0%) | 0 (0.0%) |
| Mining, Quarrying, & Extraction | 32 (100.0%) | 0 (0.0%) |
| Construction | 96 (100.0%) | 0 (0.0%) |
| Manufacturing | 260 (68.2%) | 121 (31.8%) |
| Wholesale Trade | 197 (96.6%) | 7 (3.4%) |
| Retail Trade | 283 (42.9%) | 376 (57.1%) |
| Transportation & Warehousing | 378 (100.0%) | 0 (0.0%) |
| Utilities | 29 (100.0%) | 0 (0.0%) |
| Information | 65 (36.5%) | 113 (63.5%) |
| Finance & Insurance | 51 (21.7%) | 184 (78.3%) |
| Real Estate, Rental & Leasing | 126 (57.3%) | 94 (42.7%) |
| Professional & Scientific | 133 (53.2%) | 117 (46.8%) |
| Enterprise Management | 0 (0.0%) | 66 (100.0%) |
| Administrative & Support | 131 (80.9%) | 31 (19.1%) |
| Educational Services | 274 (46.1%) | 321 (53.9%) |
| Health Care & Social Assistance | 293 (27.8%) | 761 (72.2%) |
| Arts, Entertainment & Recreation | 100 (100.0%) | 0 (0.0%) |
| Accommodation & Food Services | 199 (76.2%) | 62 (23.7%) |
| Public Administration | 300 (80.9%) | 71 (19.1%) |
| Total | 3,005 (55.1%) | 2,444 (44.9%) |
Education in West Haverstraw
School Enrollment in West Haverstraw
The most common levels of schooling among the 2,500 students in West Haverstraw are middle school (803 | 32.1%), college / undergraduate (551 | 22.0%), and elementary school (410 | 16.4%).
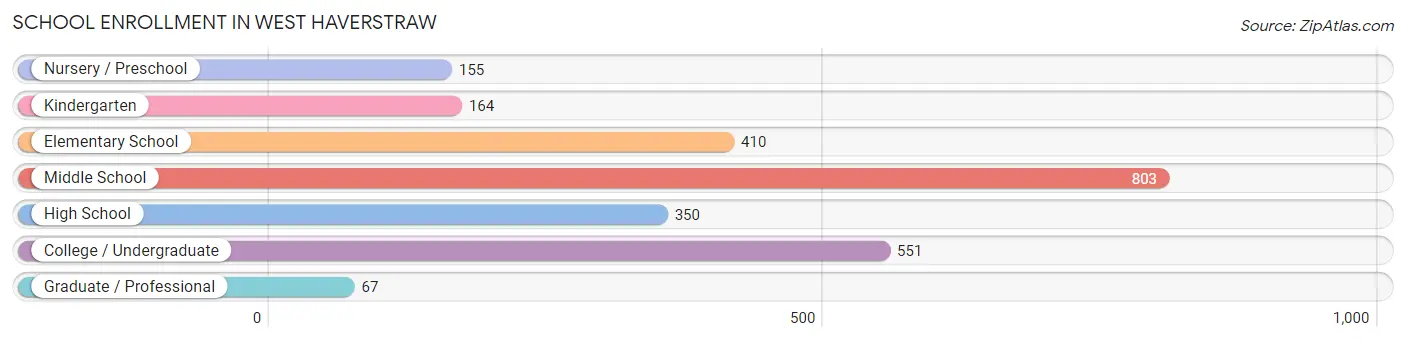
| School Level | # Students | % Students |
| Nursery / Preschool | 155 | 6.2% |
| Kindergarten | 164 | 6.6% |
| Elementary School | 410 | 16.4% |
| Middle School | 803 | 32.1% |
| High School | 350 | 14.0% |
| College / Undergraduate | 551 | 22.0% |
| Graduate / Professional | 67 | 2.7% |
| Total | 2,500 | 100.0% |
School Enrollment by Age by Funding Source in West Haverstraw
Out of a total of 2,500 students who are enrolled in schools in West Haverstraw, 178 (7.1%) attend a private institution, while the remaining 2,322 (92.9%) are enrolled in public schools. The age group of 18 to 19 year olds has the highest likelihood of being enrolled in private schools, with 47 (100.0% in the age bracket) enrolled. Conversely, the age group of 15 to 17 year olds has the lowest likelihood of being enrolled in a private school, with 391 (100.0% in the age bracket) attending a public institution.
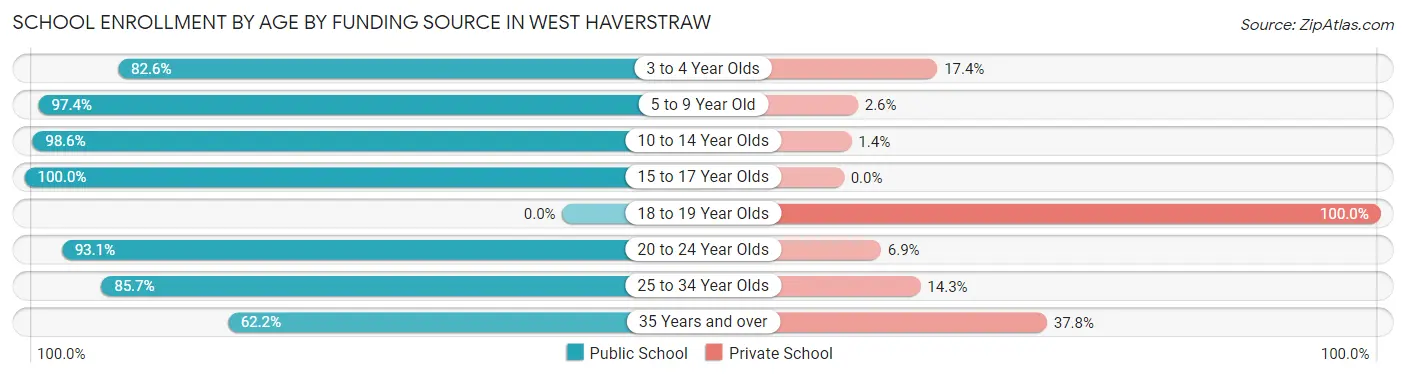
| Age Bracket | Public School | Private School |
| 3 to 4 Year Olds | 128 (82.6%) | 27 (17.4%) |
| 5 to 9 Year Old | 556 (97.4%) | 15 (2.6%) |
| 10 to 14 Year Olds | 819 (98.6%) | 12 (1.4%) |
| 15 to 17 Year Olds | 391 (100.0%) | 0 (0.0%) |
| 18 to 19 Year Olds | 0 (0.0%) | 47 (100.0%) |
| 20 to 24 Year Olds | 269 (93.1%) | 20 (6.9%) |
| 25 to 34 Year Olds | 90 (85.7%) | 15 (14.3%) |
| 35 Years and over | 69 (62.2%) | 42 (37.8%) |
| Total | 2,322 (92.9%) | 178 (7.1%) |
Educational Attainment by Field of Study in West Haverstraw
Business (701 | 39.9%), science & technology (254 | 14.5%), arts & humanities (187 | 10.6%), psychology (155 | 8.8%), and education (99 | 5.6%) are the most common fields of study among 1,757 individuals in West Haverstraw who have obtained a bachelor's degree or higher.
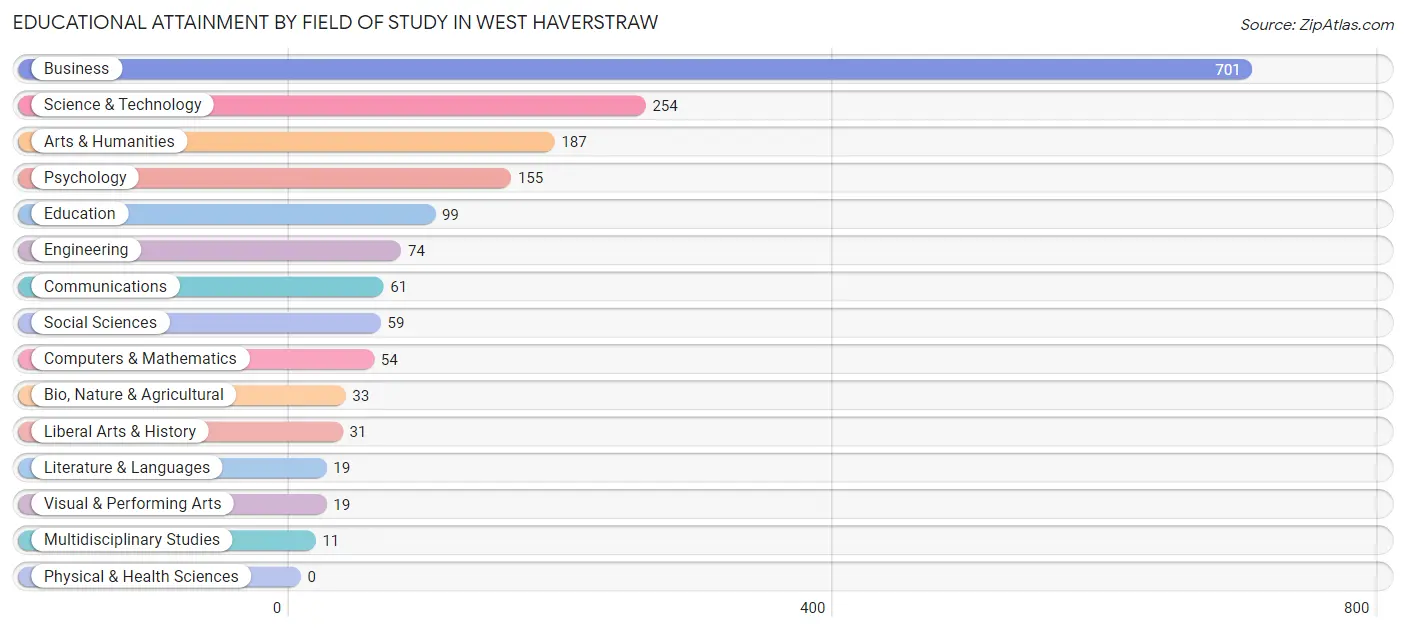
| Field of Study | # Graduates | % Graduates |
| Computers & Mathematics | 54 | 3.1% |
| Bio, Nature & Agricultural | 33 | 1.9% |
| Physical & Health Sciences | 0 | 0.0% |
| Psychology | 155 | 8.8% |
| Social Sciences | 59 | 3.4% |
| Engineering | 74 | 4.2% |
| Multidisciplinary Studies | 11 | 0.6% |
| Science & Technology | 254 | 14.5% |
| Business | 701 | 39.9% |
| Education | 99 | 5.6% |
| Literature & Languages | 19 | 1.1% |
| Liberal Arts & History | 31 | 1.8% |
| Visual & Performing Arts | 19 | 1.1% |
| Communications | 61 | 3.5% |
| Arts & Humanities | 187 | 10.6% |
| Total | 1,757 | 100.0% |
Transportation & Commute in West Haverstraw
Vehicle Availability by Sex in West Haverstraw
The most prevalent vehicle ownership categories in West Haverstraw are males with 2 vehicles (822, accounting for 28.7%) and females with 2 vehicles (543, making up 35.3%).
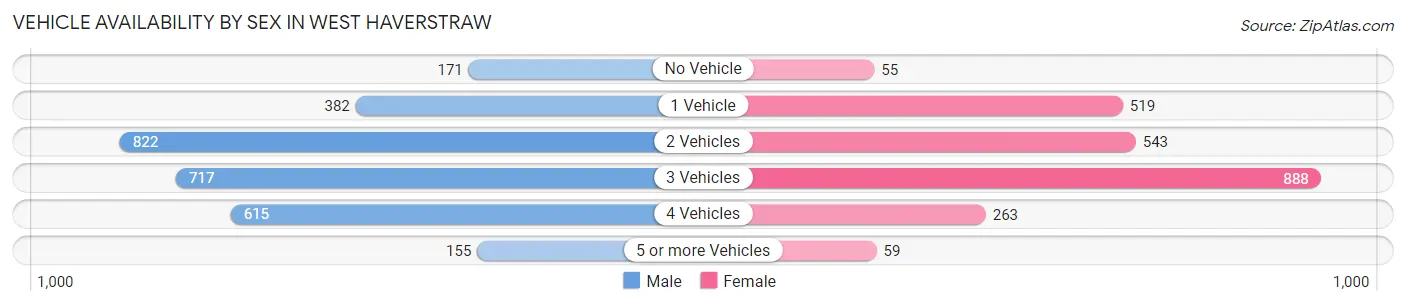
| Vehicles Available | Male | Female |
| No Vehicle | 171 (6.0%) | 55 (2.4%) |
| 1 Vehicle | 382 (13.4%) | 519 (22.3%) |
| 2 Vehicles | 822 (28.7%) | 543 (23.3%) |
| 3 Vehicles | 717 (25.1%) | 888 (38.2%) |
| 4 Vehicles | 615 (21.5%) | 263 (11.3%) |
| 5 or more Vehicles | 155 (5.4%) | 59 (2.5%) |
| Total | 2,862 (100.0%) | 2,327 (100.0%) |
Commute Time in West Haverstraw
The most frequently occuring commute durations in West Haverstraw are 10 to 14 minutes (877 commuters, 18.0%), 30 to 34 minutes (620 commuters, 12.7%), and 20 to 24 minutes (522 commuters, 10.7%).
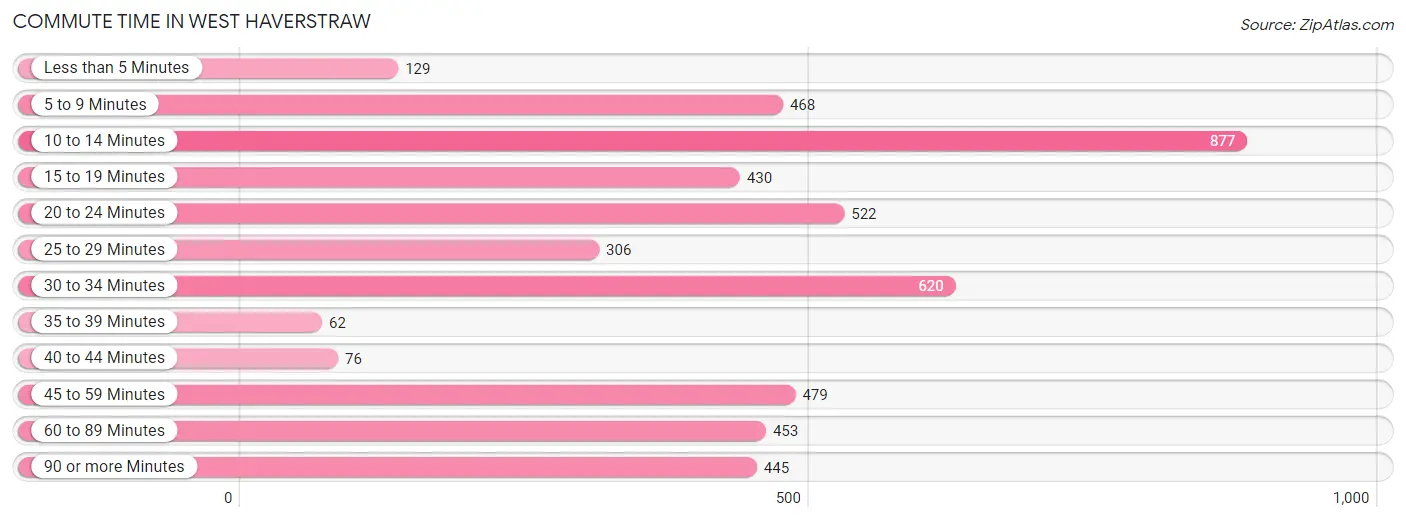
| Commute Time | # Commuters | % Commuters |
| Less than 5 Minutes | 129 | 2.6% |
| 5 to 9 Minutes | 468 | 9.6% |
| 10 to 14 Minutes | 877 | 18.0% |
| 15 to 19 Minutes | 430 | 8.8% |
| 20 to 24 Minutes | 522 | 10.7% |
| 25 to 29 Minutes | 306 | 6.3% |
| 30 to 34 Minutes | 620 | 12.7% |
| 35 to 39 Minutes | 62 | 1.3% |
| 40 to 44 Minutes | 76 | 1.6% |
| 45 to 59 Minutes | 479 | 9.8% |
| 60 to 89 Minutes | 453 | 9.3% |
| 90 or more Minutes | 445 | 9.1% |
Commute Time by Sex in West Haverstraw
The most common commute times in West Haverstraw are 10 to 14 minutes (526 commuters, 19.4%) for males and 10 to 14 minutes (351 commuters, 16.3%) for females.
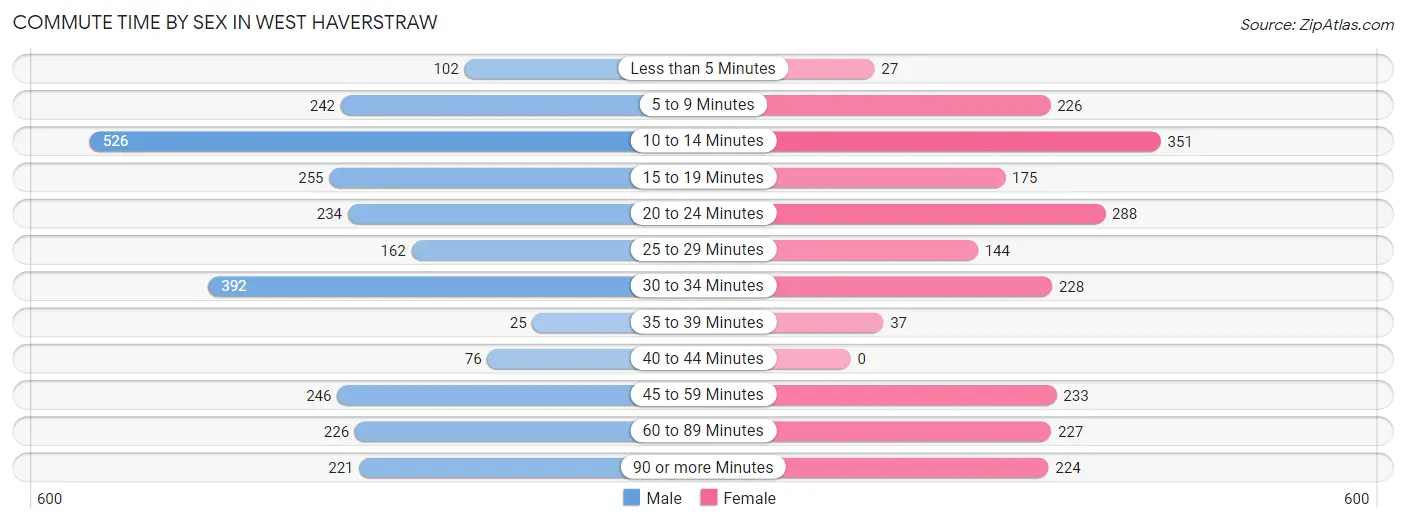
| Commute Time | Male | Female |
| Less than 5 Minutes | 102 (3.8%) | 27 (1.3%) |
| 5 to 9 Minutes | 242 (8.9%) | 226 (10.5%) |
| 10 to 14 Minutes | 526 (19.4%) | 351 (16.3%) |
| 15 to 19 Minutes | 255 (9.4%) | 175 (8.1%) |
| 20 to 24 Minutes | 234 (8.6%) | 288 (13.3%) |
| 25 to 29 Minutes | 162 (6.0%) | 144 (6.7%) |
| 30 to 34 Minutes | 392 (14.5%) | 228 (10.6%) |
| 35 to 39 Minutes | 25 (0.9%) | 37 (1.7%) |
| 40 to 44 Minutes | 76 (2.8%) | 0 (0.0%) |
| 45 to 59 Minutes | 246 (9.1%) | 233 (10.8%) |
| 60 to 89 Minutes | 226 (8.4%) | 227 (10.5%) |
| 90 or more Minutes | 221 (8.2%) | 224 (10.4%) |
Time of Departure to Work by Sex in West Haverstraw
The most frequent times of departure to work in West Haverstraw are 12:00 PM to 3:59 PM (449, 16.6%) for males and 8:00 AM to 8:29 AM (396, 18.3%) for females.
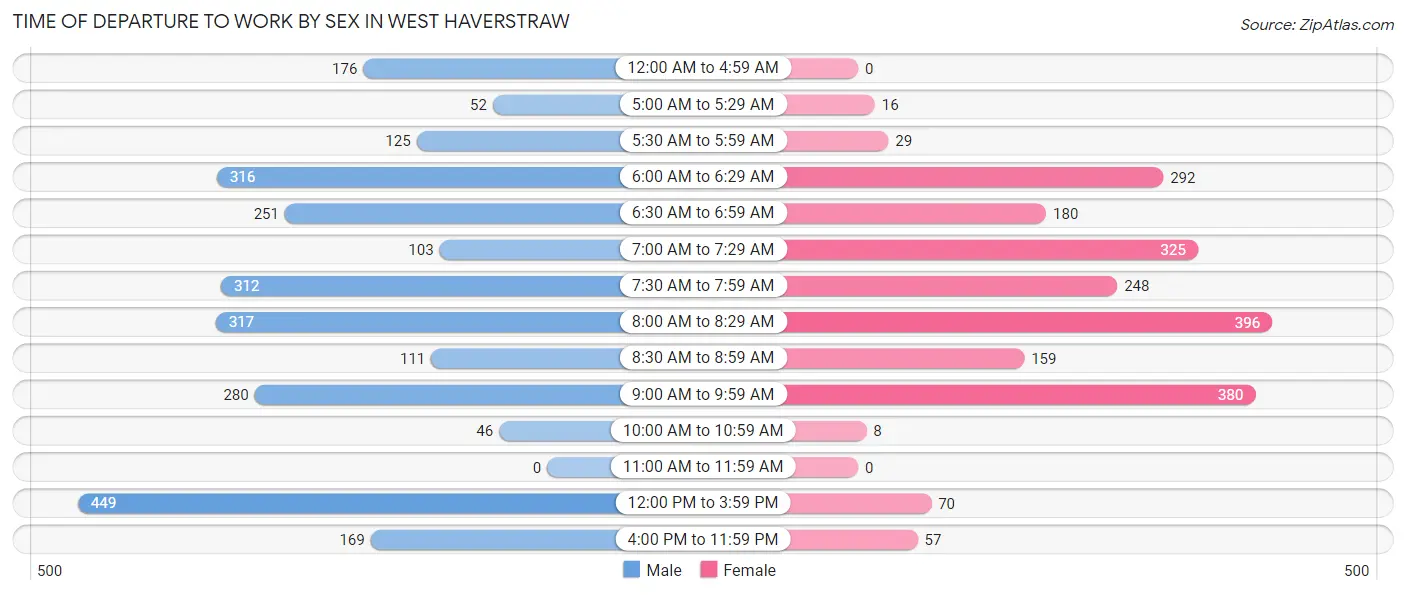
| Time of Departure | Male | Female |
| 12:00 AM to 4:59 AM | 176 (6.5%) | 0 (0.0%) |
| 5:00 AM to 5:29 AM | 52 (1.9%) | 16 (0.7%) |
| 5:30 AM to 5:59 AM | 125 (4.6%) | 29 (1.3%) |
| 6:00 AM to 6:29 AM | 316 (11.7%) | 292 (13.5%) |
| 6:30 AM to 6:59 AM | 251 (9.3%) | 180 (8.3%) |
| 7:00 AM to 7:29 AM | 103 (3.8%) | 325 (15.0%) |
| 7:30 AM to 7:59 AM | 312 (11.5%) | 248 (11.5%) |
| 8:00 AM to 8:29 AM | 317 (11.7%) | 396 (18.3%) |
| 8:30 AM to 8:59 AM | 111 (4.1%) | 159 (7.4%) |
| 9:00 AM to 9:59 AM | 280 (10.3%) | 380 (17.6%) |
| 10:00 AM to 10:59 AM | 46 (1.7%) | 8 (0.4%) |
| 11:00 AM to 11:59 AM | 0 (0.0%) | 0 (0.0%) |
| 12:00 PM to 3:59 PM | 449 (16.6%) | 70 (3.2%) |
| 4:00 PM to 11:59 PM | 169 (6.2%) | 57 (2.6%) |
| Total | 2,707 (100.0%) | 2,160 (100.0%) |
Housing Occupancy in West Haverstraw
Occupancy by Ownership in West Haverstraw
Of the total 3,265 dwellings in West Haverstraw, owner-occupied units account for 2,037 (62.4%), while renter-occupied units make up 1,228 (37.6%).
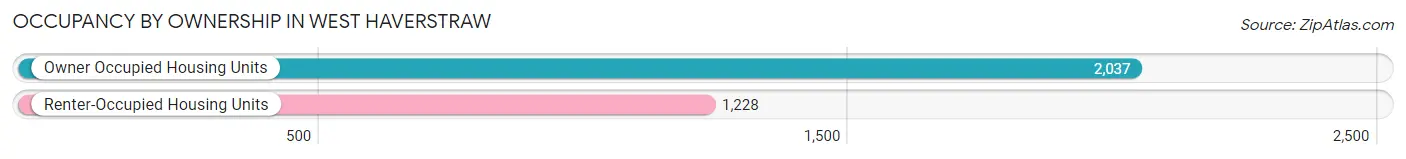
| Occupancy | # Housing Units | % Housing Units |
| Owner Occupied Housing Units | 2,037 | 62.4% |
| Renter-Occupied Housing Units | 1,228 | 37.6% |
| Total Occupied Housing Units | 3,265 | 100.0% |
Occupancy by Household Size in West Haverstraw
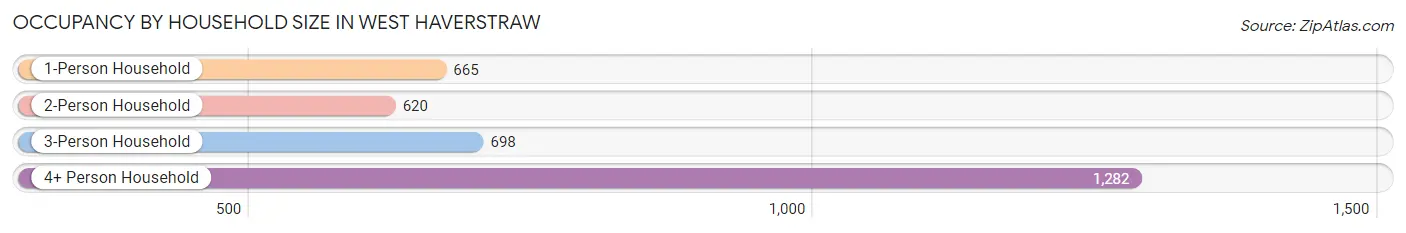
| Household Size | # Housing Units | % Housing Units |
| 1-Person Household | 665 | 20.4% |
| 2-Person Household | 620 | 19.0% |
| 3-Person Household | 698 | 21.4% |
| 4+ Person Household | 1,282 | 39.3% |
| Total Housing Units | 3,265 | 100.0% |
Occupancy by Ownership by Household Size in West Haverstraw
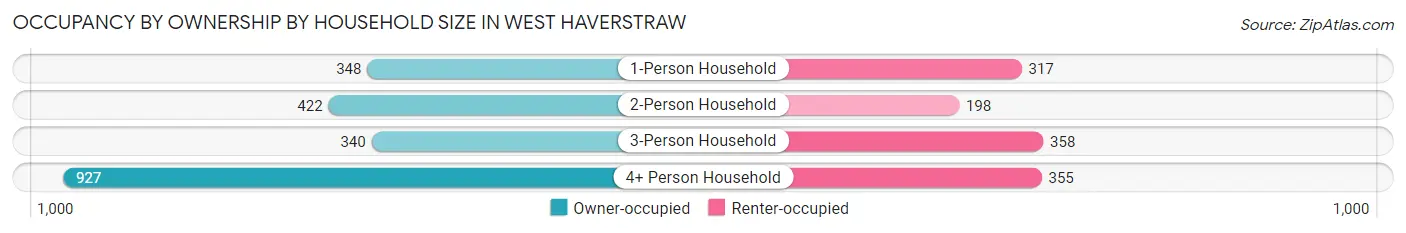
| Household Size | Owner-occupied | Renter-occupied |
| 1-Person Household | 348 (52.3%) | 317 (47.7%) |
| 2-Person Household | 422 (68.1%) | 198 (31.9%) |
| 3-Person Household | 340 (48.7%) | 358 (51.3%) |
| 4+ Person Household | 927 (72.3%) | 355 (27.7%) |
| Total Housing Units | 2,037 (62.4%) | 1,228 (37.6%) |
Occupancy by Educational Attainment in West Haverstraw
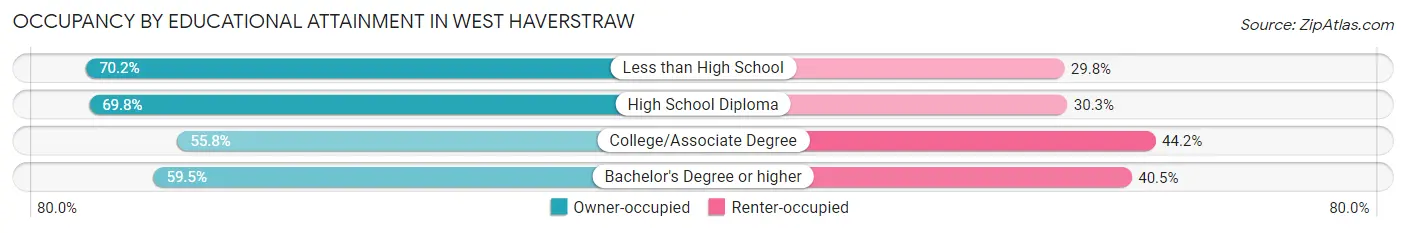
| Household Size | Owner-occupied | Renter-occupied |
| Less than High School | 250 (70.2%) | 106 (29.8%) |
| High School Diploma | 634 (69.8%) | 275 (30.2%) |
| College/Associate Degree | 557 (55.8%) | 442 (44.2%) |
| Bachelor's Degree or higher | 596 (59.5%) | 405 (40.5%) |
Occupancy by Age of Householder in West Haverstraw
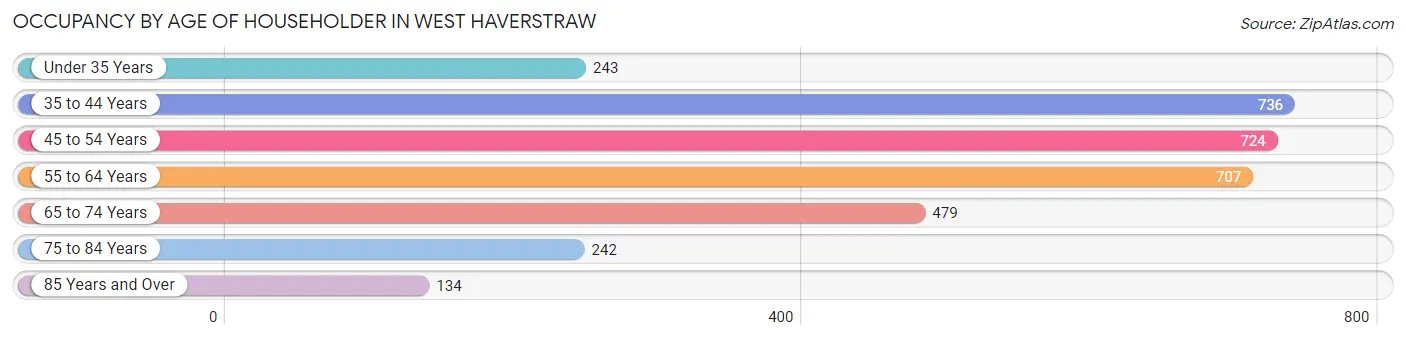
| Age Bracket | # Households | % Households |
| Under 35 Years | 243 | 7.4% |
| 35 to 44 Years | 736 | 22.5% |
| 45 to 54 Years | 724 | 22.2% |
| 55 to 64 Years | 707 | 21.6% |
| 65 to 74 Years | 479 | 14.7% |
| 75 to 84 Years | 242 | 7.4% |
| 85 Years and Over | 134 | 4.1% |
| Total | 3,265 | 100.0% |
Housing Finances in West Haverstraw
Median Income by Occupancy in West Haverstraw
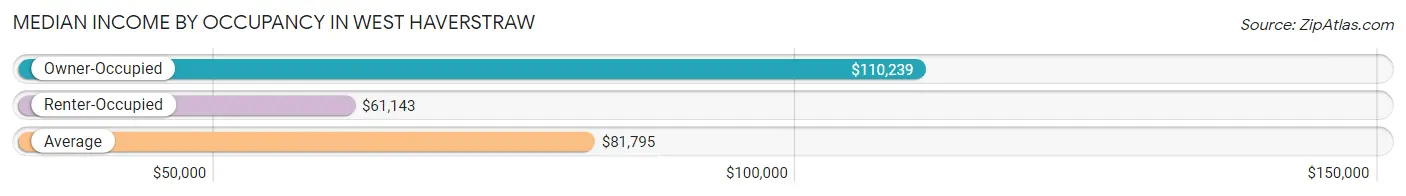
| Occupancy Type | # Households | Median Income |
| Owner-Occupied | 2,037 (62.4%) | $110,239 |
| Renter-Occupied | 1,228 (37.6%) | $61,143 |
| Average | 3,265 (100.0%) | $81,795 |
Occupancy by Householder Income Bracket in West Haverstraw
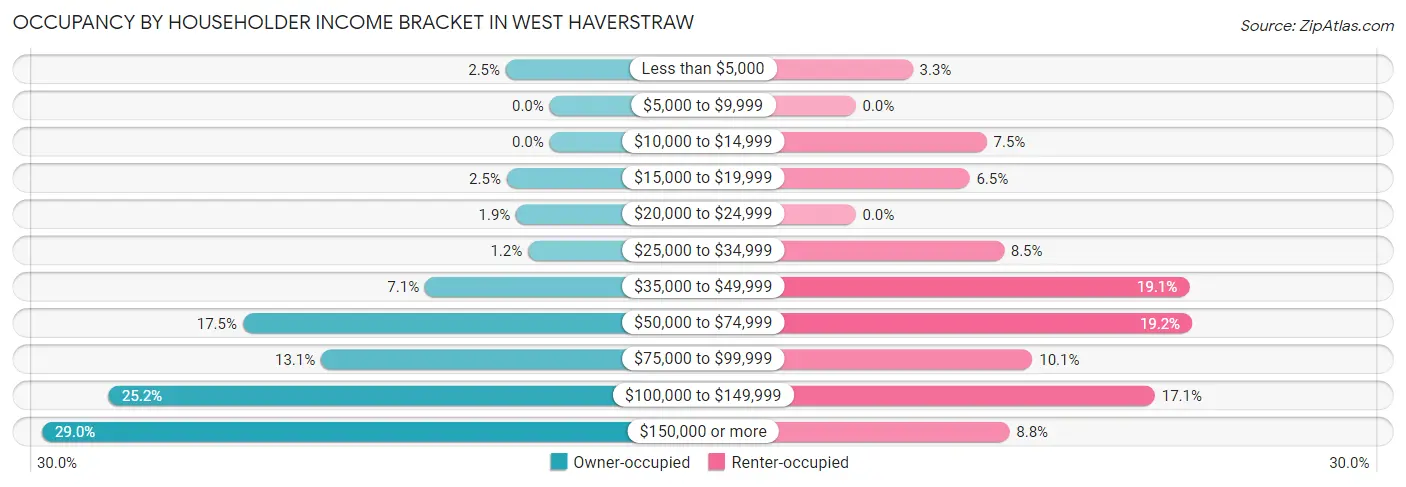
| Income Bracket | Owner-occupied | Renter-occupied |
| Less than $5,000 | 51 (2.5%) | 40 (3.3%) |
| $5,000 to $9,999 | 0 (0.0%) | 0 (0.0%) |
| $10,000 to $14,999 | 0 (0.0%) | 92 (7.5%) |
| $15,000 to $19,999 | 50 (2.5%) | 80 (6.5%) |
| $20,000 to $24,999 | 39 (1.9%) | 0 (0.0%) |
| $25,000 to $34,999 | 25 (1.2%) | 104 (8.5%) |
| $35,000 to $49,999 | 145 (7.1%) | 234 (19.1%) |
| $50,000 to $74,999 | 357 (17.5%) | 236 (19.2%) |
| $75,000 to $99,999 | 266 (13.1%) | 124 (10.1%) |
| $100,000 to $149,999 | 513 (25.2%) | 210 (17.1%) |
| $150,000 or more | 591 (29.0%) | 108 (8.8%) |
| Total | 2,037 (100.0%) | 1,228 (100.0%) |
Monthly Housing Cost Tiers in West Haverstraw
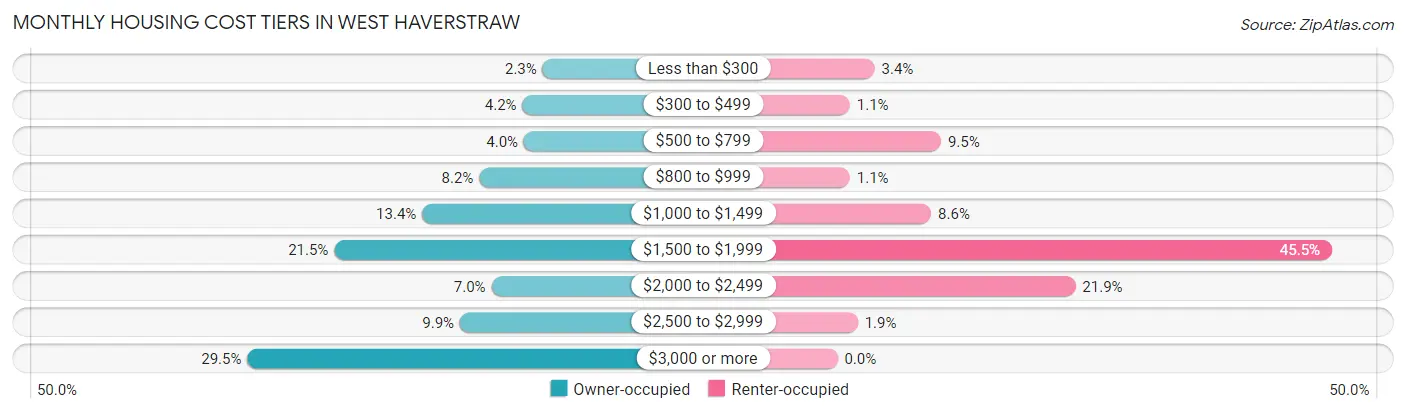
| Monthly Cost | Owner-occupied | Renter-occupied |
| Less than $300 | 47 (2.3%) | 42 (3.4%) |
| $300 to $499 | 85 (4.2%) | 14 (1.1%) |
| $500 to $799 | 82 (4.0%) | 117 (9.5%) |
| $800 to $999 | 166 (8.2%) | 14 (1.1%) |
| $1,000 to $1,499 | 273 (13.4%) | 106 (8.6%) |
| $1,500 to $1,999 | 438 (21.5%) | 559 (45.5%) |
| $2,000 to $2,499 | 143 (7.0%) | 269 (21.9%) |
| $2,500 to $2,999 | 202 (9.9%) | 23 (1.9%) |
| $3,000 or more | 601 (29.5%) | 0 (0.0%) |
| Total | 2,037 (100.0%) | 1,228 (100.0%) |
Physical Housing Characteristics in West Haverstraw
Housing Structures in West Haverstraw
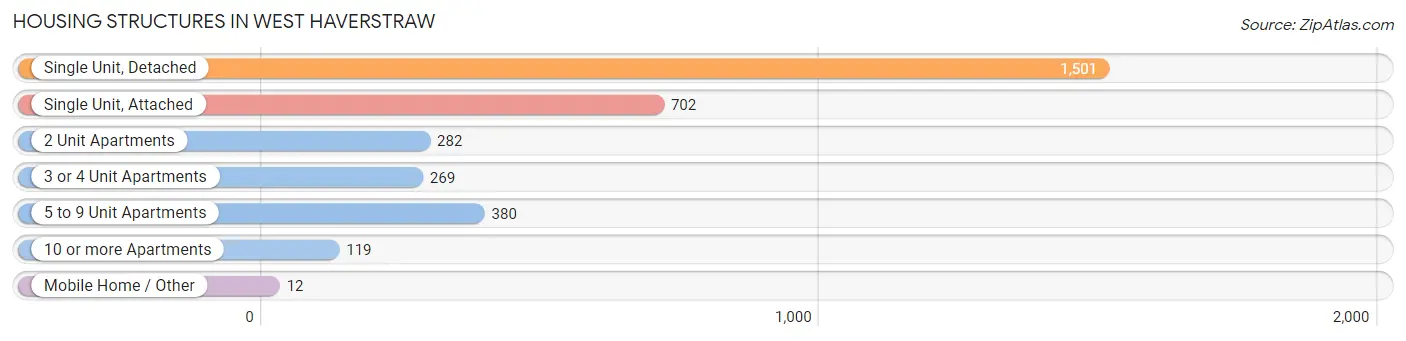
| Structure Type | # Housing Units | % Housing Units |
| Single Unit, Detached | 1,501 | 46.0% |
| Single Unit, Attached | 702 | 21.5% |
| 2 Unit Apartments | 282 | 8.6% |
| 3 or 4 Unit Apartments | 269 | 8.2% |
| 5 to 9 Unit Apartments | 380 | 11.6% |
| 10 or more Apartments | 119 | 3.6% |
| Mobile Home / Other | 12 | 0.4% |
| Total | 3,265 | 100.0% |
Housing Structures by Occupancy in West Haverstraw
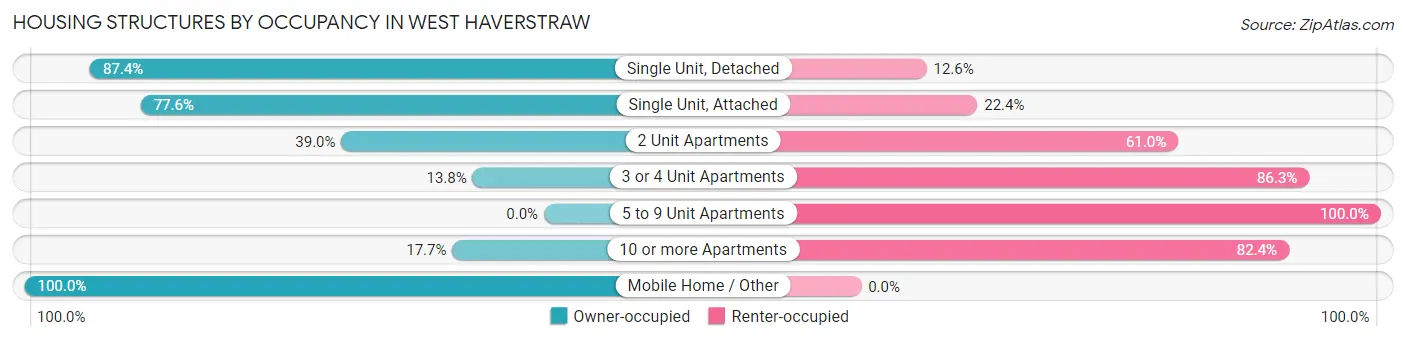
| Structure Type | Owner-occupied | Renter-occupied |
| Single Unit, Detached | 1,312 (87.4%) | 189 (12.6%) |
| Single Unit, Attached | 545 (77.6%) | 157 (22.4%) |
| 2 Unit Apartments | 110 (39.0%) | 172 (61.0%) |
| 3 or 4 Unit Apartments | 37 (13.8%) | 232 (86.3%) |
| 5 to 9 Unit Apartments | 0 (0.0%) | 380 (100.0%) |
| 10 or more Apartments | 21 (17.6%) | 98 (82.4%) |
| Mobile Home / Other | 12 (100.0%) | 0 (0.0%) |
| Total | 2,037 (62.4%) | 1,228 (37.6%) |
Housing Structures by Number of Rooms in West Haverstraw
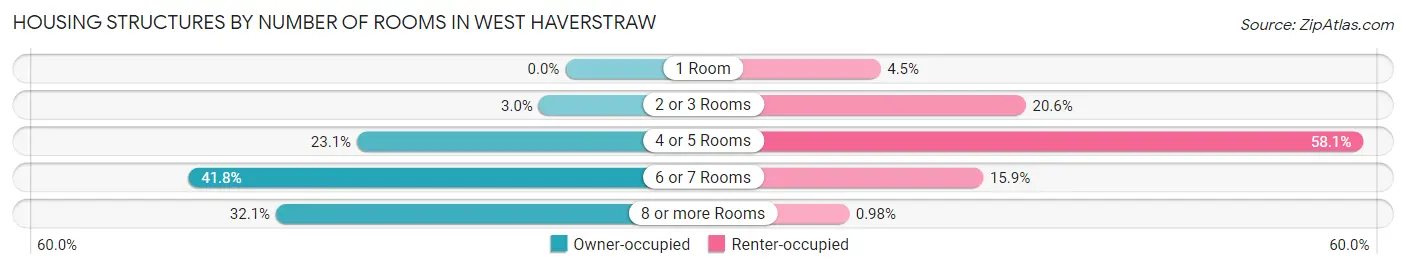
| Number of Rooms | Owner-occupied | Renter-occupied |
| 1 Room | 0 (0.0%) | 55 (4.5%) |
| 2 or 3 Rooms | 60 (2.9%) | 253 (20.6%) |
| 4 or 5 Rooms | 471 (23.1%) | 713 (58.1%) |
| 6 or 7 Rooms | 852 (41.8%) | 195 (15.9%) |
| 8 or more Rooms | 654 (32.1%) | 12 (1.0%) |
| Total | 2,037 (100.0%) | 1,228 (100.0%) |
Housing Structure by Heating Type in West Haverstraw
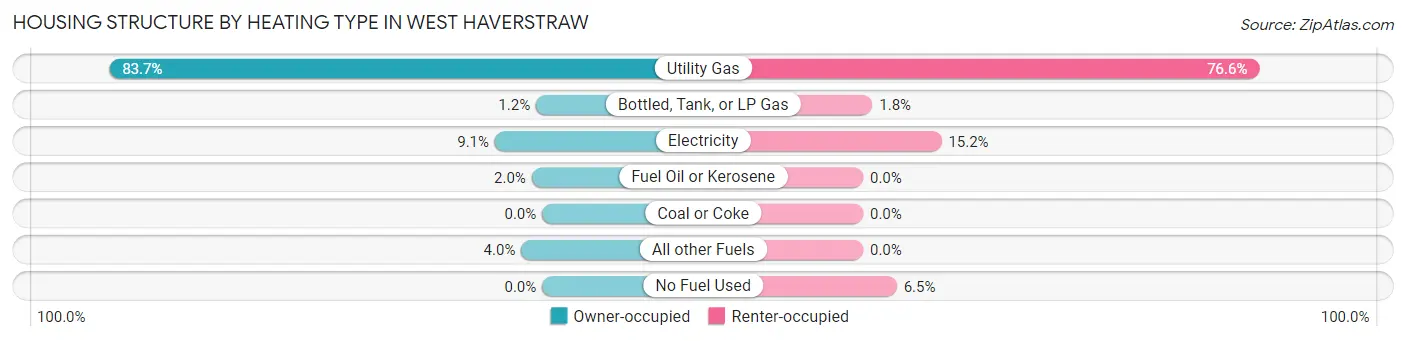
| Heating Type | Owner-occupied | Renter-occupied |
| Utility Gas | 1,704 (83.7%) | 940 (76.5%) |
| Bottled, Tank, or LP Gas | 24 (1.2%) | 22 (1.8%) |
| Electricity | 186 (9.1%) | 186 (15.1%) |
| Fuel Oil or Kerosene | 41 (2.0%) | 0 (0.0%) |
| Coal or Coke | 0 (0.0%) | 0 (0.0%) |
| All other Fuels | 82 (4.0%) | 0 (0.0%) |
| No Fuel Used | 0 (0.0%) | 80 (6.5%) |
| Total | 2,037 (100.0%) | 1,228 (100.0%) |
Household Vehicle Usage in West Haverstraw
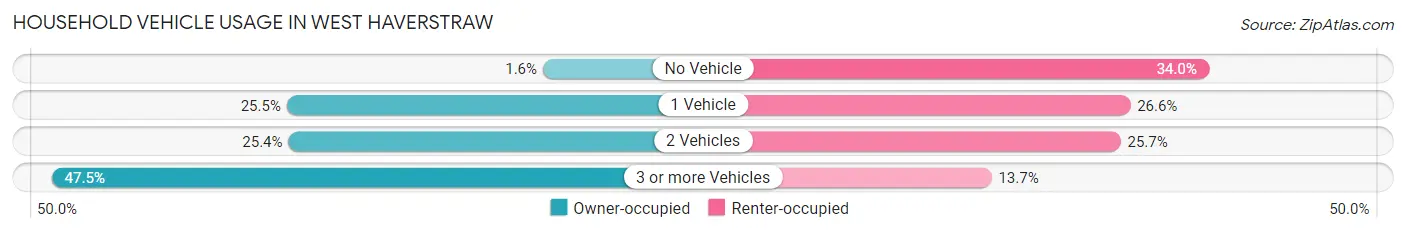
| Vehicles per Household | Owner-occupied | Renter-occupied |
| No Vehicle | 33 (1.6%) | 417 (34.0%) |
| 1 Vehicle | 520 (25.5%) | 327 (26.6%) |
| 2 Vehicles | 517 (25.4%) | 316 (25.7%) |
| 3 or more Vehicles | 967 (47.5%) | 168 (13.7%) |
| Total | 2,037 (100.0%) | 1,228 (100.0%) |
Real Estate & Mortgages in West Haverstraw
Real Estate and Mortgage Overview in West Haverstraw
| Characteristic | Without Mortgage | With Mortgage |
| Housing Units | 733 | 1,304 |
| Median Property Value | $355,800 | $317,300 |
| Median Household Income | $106,806 | $415 |
| Monthly Housing Costs | $1,501 | $601 |
| Real Estate Taxes | $10,001 | $163 |
Property Value by Mortgage Status in West Haverstraw
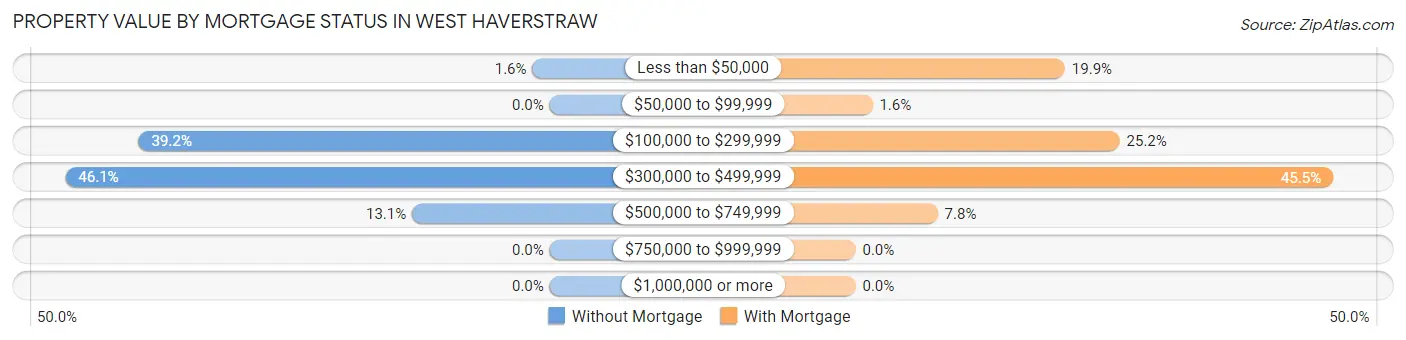
| Property Value | Without Mortgage | With Mortgage |
| Less than $50,000 | 12 (1.6%) | 260 (19.9%) |
| $50,000 to $99,999 | 0 (0.0%) | 21 (1.6%) |
| $100,000 to $299,999 | 287 (39.2%) | 328 (25.2%) |
| $300,000 to $499,999 | 338 (46.1%) | 593 (45.5%) |
| $500,000 to $749,999 | 96 (13.1%) | 102 (7.8%) |
| $750,000 to $999,999 | 0 (0.0%) | 0 (0.0%) |
| $1,000,000 or more | 0 (0.0%) | 0 (0.0%) |
| Total | 733 (100.0%) | 1,304 (100.0%) |
Household Income by Mortgage Status in West Haverstraw
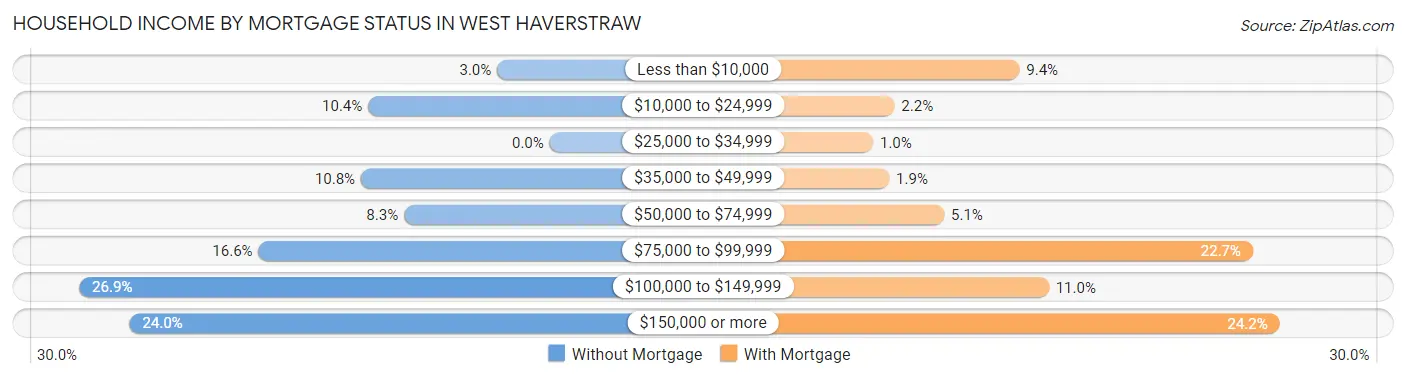
| Household Income | Without Mortgage | With Mortgage |
| Less than $10,000 | 22 (3.0%) | 122 (9.4%) |
| $10,000 to $24,999 | 76 (10.4%) | 29 (2.2%) |
| $25,000 to $34,999 | 0 (0.0%) | 13 (1.0%) |
| $35,000 to $49,999 | 79 (10.8%) | 25 (1.9%) |
| $50,000 to $74,999 | 61 (8.3%) | 66 (5.1%) |
| $75,000 to $99,999 | 122 (16.6%) | 296 (22.7%) |
| $100,000 to $149,999 | 197 (26.9%) | 144 (11.0%) |
| $150,000 or more | 176 (24.0%) | 316 (24.2%) |
| Total | 733 (100.0%) | 1,304 (100.0%) |
Property Value to Household Income Ratio in West Haverstraw
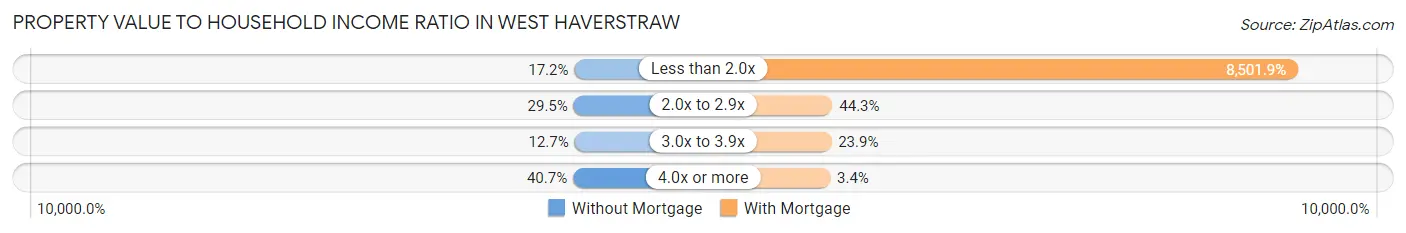
| Value-to-Income Ratio | Without Mortgage | With Mortgage |
| Less than 2.0x | 126 (17.2%) | 110,865 (8,501.9%) |
| 2.0x to 2.9x | 216 (29.5%) | 577 (44.3%) |
| 3.0x to 3.9x | 93 (12.7%) | 312 (23.9%) |
| 4.0x or more | 298 (40.6%) | 44 (3.4%) |
| Total | 733 (100.0%) | 1,304 (100.0%) |
Real Estate Taxes by Mortgage Status in West Haverstraw
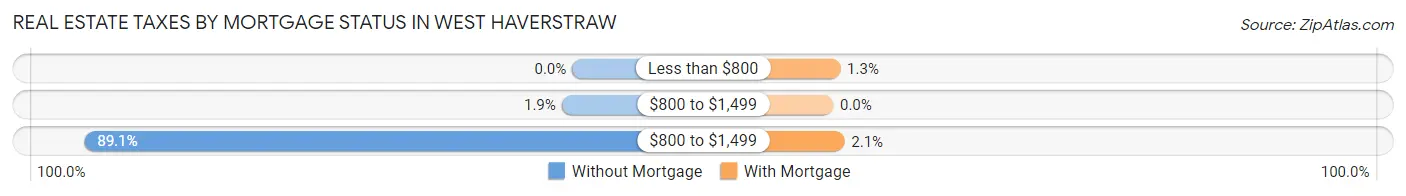
| Property Taxes | Without Mortgage | With Mortgage |
| Less than $800 | 0 (0.0%) | 17 (1.3%) |
| $800 to $1,499 | 14 (1.9%) | 0 (0.0%) |
| $800 to $1,499 | 653 (89.1%) | 27 (2.1%) |
| Total | 733 (100.0%) | 1,304 (100.0%) |
Health & Disability in West Haverstraw
Health Insurance Coverage by Age in West Haverstraw
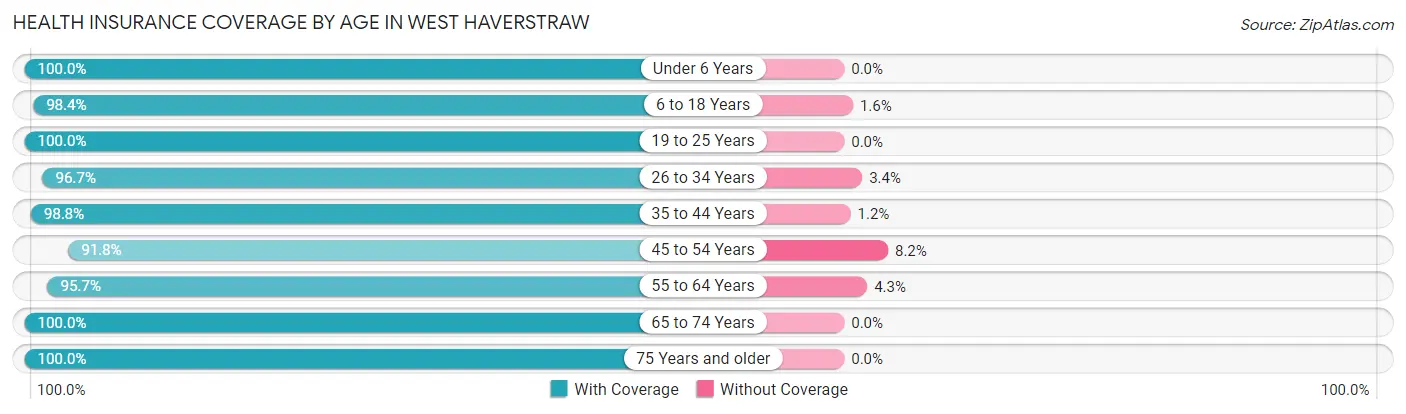
| Age Bracket | With Coverage | Without Coverage |
| Under 6 Years | 1,017 (100.0%) | 0 (0.0%) |
| 6 to 18 Years | 1,638 (98.4%) | 27 (1.6%) |
| 19 to 25 Years | 887 (100.0%) | 0 (0.0%) |
| 26 to 34 Years | 1,069 (96.7%) | 37 (3.4%) |
| 35 to 44 Years | 1,421 (98.8%) | 17 (1.2%) |
| 45 to 54 Years | 1,767 (91.8%) | 157 (8.2%) |
| 55 to 64 Years | 1,051 (95.7%) | 47 (4.3%) |
| 65 to 74 Years | 887 (100.0%) | 0 (0.0%) |
| 75 Years and older | 612 (100.0%) | 0 (0.0%) |
| Total | 10,349 (97.3%) | 285 (2.7%) |
Health Insurance Coverage by Citizenship Status in West Haverstraw
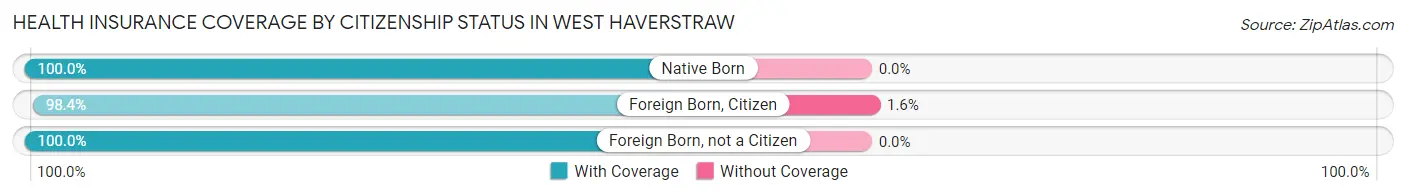
| Citizenship Status | With Coverage | Without Coverage |
| Native Born | 1,017 (100.0%) | 0 (0.0%) |
| Foreign Born, Citizen | 1,638 (98.4%) | 27 (1.6%) |
| Foreign Born, not a Citizen | 887 (100.0%) | 0 (0.0%) |
Health Insurance Coverage by Household Income in West Haverstraw
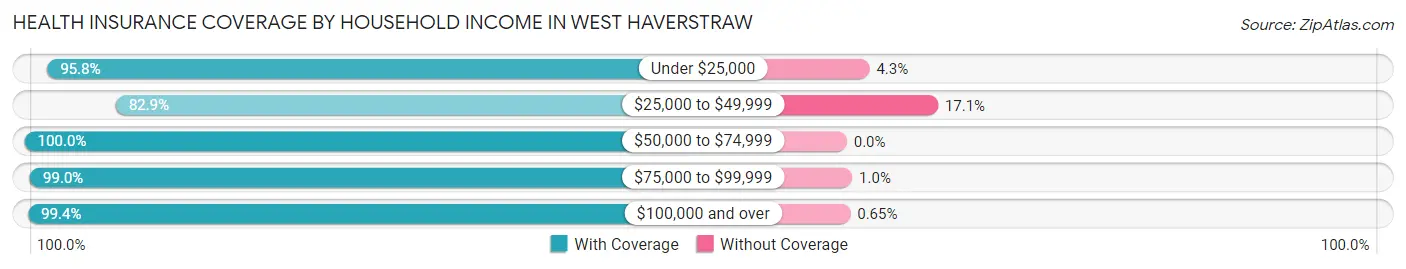
| Household Income | With Coverage | Without Coverage |
| Under $25,000 | 878 (95.8%) | 39 (4.3%) |
| $25,000 to $49,999 | 961 (82.9%) | 198 (17.1%) |
| $50,000 to $74,999 | 1,851 (100.0%) | 0 (0.0%) |
| $75,000 to $99,999 | 1,389 (99.0%) | 14 (1.0%) |
| $100,000 and over | 5,166 (99.4%) | 34 (0.6%) |
Public vs Private Health Insurance Coverage by Age in West Haverstraw
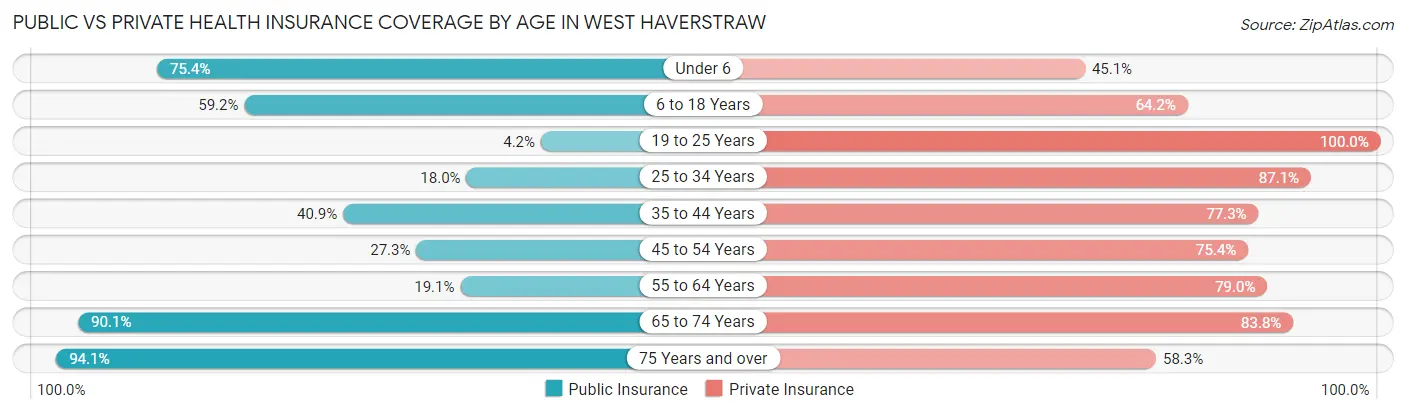
| Age Bracket | Public Insurance | Private Insurance |
| Under 6 | 767 (75.4%) | 459 (45.1%) |
| 6 to 18 Years | 986 (59.2%) | 1,069 (64.2%) |
| 19 to 25 Years | 37 (4.2%) | 887 (100.0%) |
| 25 to 34 Years | 199 (18.0%) | 963 (87.1%) |
| 35 to 44 Years | 588 (40.9%) | 1,112 (77.3%) |
| 45 to 54 Years | 525 (27.3%) | 1,451 (75.4%) |
| 55 to 64 Years | 210 (19.1%) | 867 (79.0%) |
| 65 to 74 Years | 799 (90.1%) | 743 (83.8%) |
| 75 Years and over | 576 (94.1%) | 357 (58.3%) |
| Total | 4,687 (44.1%) | 7,908 (74.4%) |
Disability Status by Sex by Age in West Haverstraw
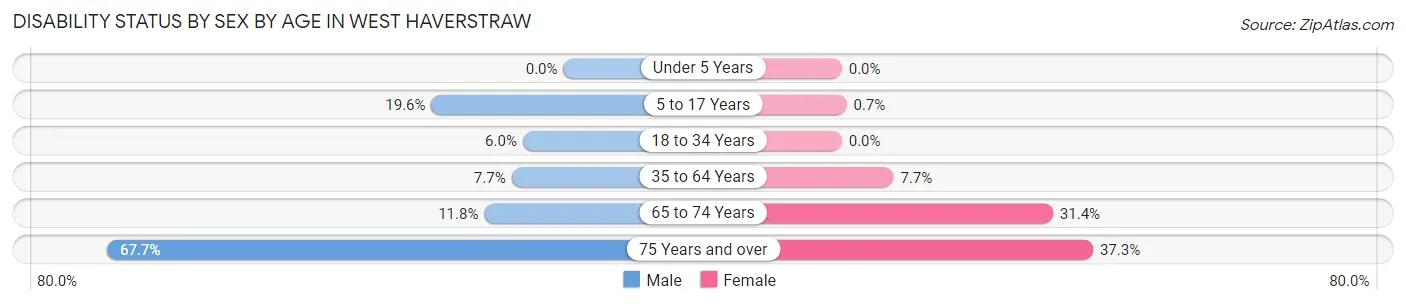
| Age Bracket | Male | Female |
| Under 5 Years | 0 (0.0%) | 0 (0.0%) |
| 5 to 17 Years | 184 (19.6%) | 6 (0.7%) |
| 18 to 34 Years | 88 (6.0%) | 0 (0.0%) |
| 35 to 64 Years | 163 (7.7%) | 180 (7.7%) |
| 65 to 74 Years | 51 (11.7%) | 142 (31.4%) |
| 75 Years and over | 84 (67.7%) | 182 (37.3%) |
Disability Class by Sex by Age in West Haverstraw
Disability Class: Hearing Difficulty
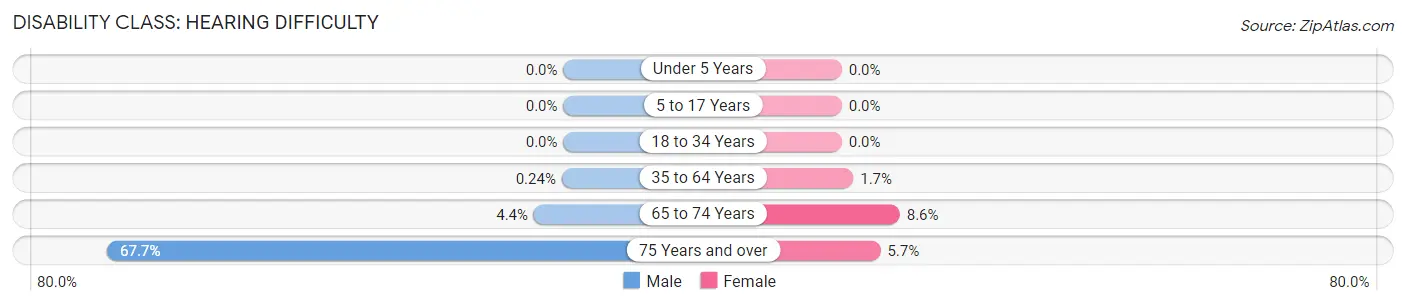
| Age Bracket | Male | Female |
| Under 5 Years | 0 (0.0%) | 0 (0.0%) |
| 5 to 17 Years | 0 (0.0%) | 0 (0.0%) |
| 18 to 34 Years | 0 (0.0%) | 0 (0.0%) |
| 35 to 64 Years | 5 (0.2%) | 40 (1.7%) |
| 65 to 74 Years | 19 (4.4%) | 39 (8.6%) |
| 75 Years and over | 84 (67.7%) | 28 (5.7%) |
Disability Class: Vision Difficulty
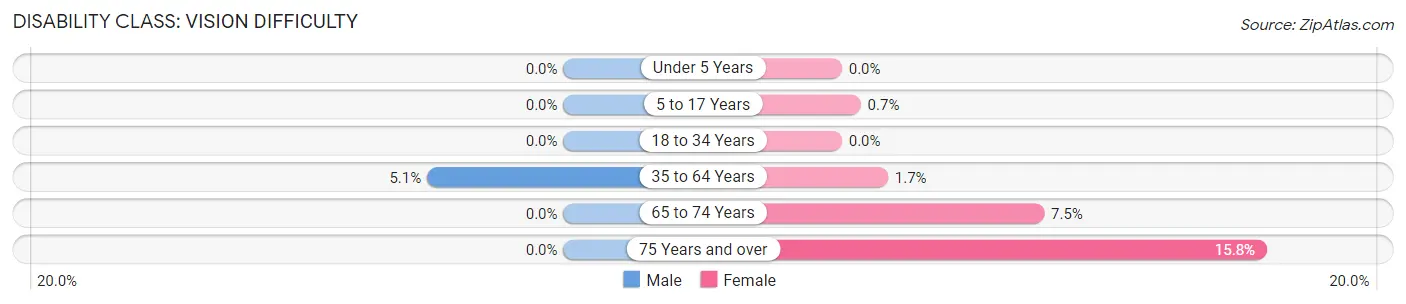
| Age Bracket | Male | Female |
| Under 5 Years | 0 (0.0%) | 0 (0.0%) |
| 5 to 17 Years | 0 (0.0%) | 6 (0.7%) |
| 18 to 34 Years | 0 (0.0%) | 0 (0.0%) |
| 35 to 64 Years | 107 (5.1%) | 40 (1.7%) |
| 65 to 74 Years | 0 (0.0%) | 34 (7.5%) |
| 75 Years and over | 0 (0.0%) | 77 (15.8%) |
Disability Class: Cognitive Difficulty
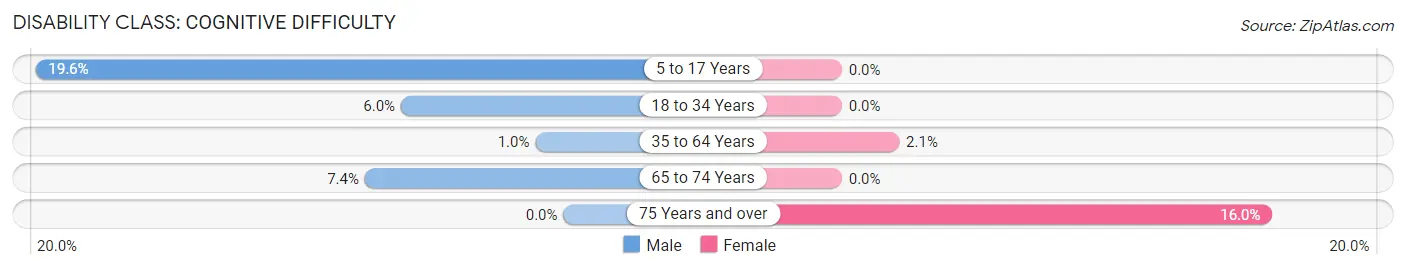
| Age Bracket | Male | Female |
| 5 to 17 Years | 184 (19.6%) | 0 (0.0%) |
| 18 to 34 Years | 88 (6.0%) | 0 (0.0%) |
| 35 to 64 Years | 22 (1.0%) | 50 (2.1%) |
| 65 to 74 Years | 32 (7.4%) | 0 (0.0%) |
| 75 Years and over | 0 (0.0%) | 78 (16.0%) |
Disability Class: Ambulatory Difficulty
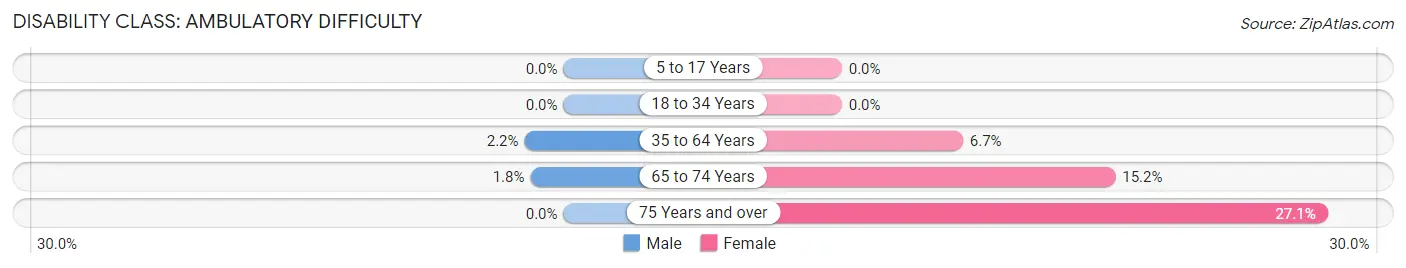
| Age Bracket | Male | Female |
| 5 to 17 Years | 0 (0.0%) | 0 (0.0%) |
| 18 to 34 Years | 0 (0.0%) | 0 (0.0%) |
| 35 to 64 Years | 46 (2.2%) | 158 (6.7%) |
| 65 to 74 Years | 8 (1.8%) | 69 (15.2%) |
| 75 Years and over | 0 (0.0%) | 132 (27.1%) |
Disability Class: Self-Care Difficulty
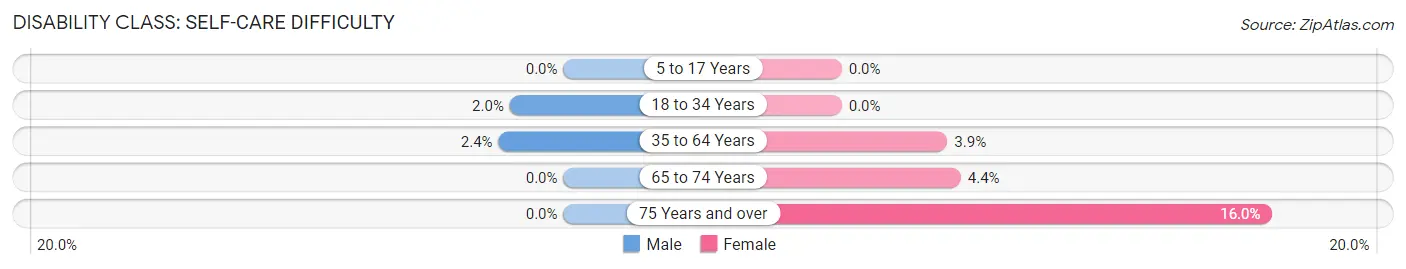
| Age Bracket | Male | Female |
| 5 to 17 Years | 0 (0.0%) | 0 (0.0%) |
| 18 to 34 Years | 29 (2.0%) | 0 (0.0%) |
| 35 to 64 Years | 51 (2.4%) | 92 (3.9%) |
| 65 to 74 Years | 0 (0.0%) | 20 (4.4%) |
| 75 Years and over | 0 (0.0%) | 78 (16.0%) |
Technology Access in West Haverstraw
Computing Device Access in West Haverstraw
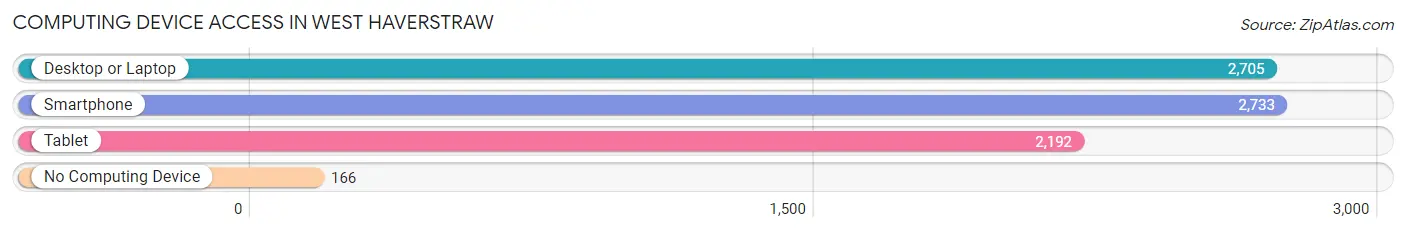
| Device Type | # Households | % Households |
| Desktop or Laptop | 2,705 | 82.9% |
| Smartphone | 2,733 | 83.7% |
| Tablet | 2,192 | 67.1% |
| No Computing Device | 166 | 5.1% |
| Total | 3,265 | 100.0% |
Internet Access in West Haverstraw
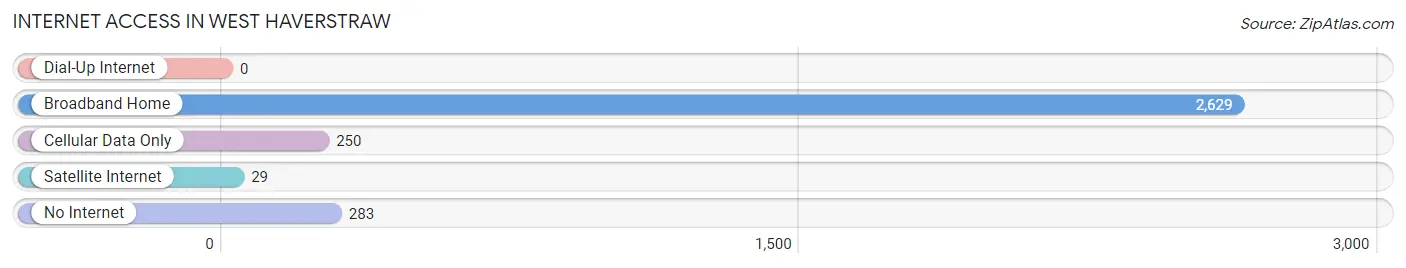
| Internet Type | # Households | % Households |
| Dial-Up Internet | 0 | 0.0% |
| Broadband Home | 2,629 | 80.5% |
| Cellular Data Only | 250 | 7.7% |
| Satellite Internet | 29 | 0.9% |
| No Internet | 283 | 8.7% |
| Total | 3,265 | 100.0% |
West Haverstraw Summary
West Haverstraw is a village located in the town of Haverstraw in Rockland County, New York. It is located on the west bank of the Hudson River, about 30 miles north of New York City. The village has a population of approximately 4,500 people and is part of the larger Haverstraw-Stony Point Central School District.
History
West Haverstraw was originally part of the town of Haverstraw, which was established in 1788. The village was incorporated in 1833 and was originally known as “Haverstraw Landing”. The name was changed to West Haverstraw in 1854.
The village was a major port for the Hudson River steamboats in the 19th century. It was also a major center for the brick-making industry, which was a major source of employment for the village. The brick-making industry declined in the early 20th century, and the village has since become a residential community.
Geography
West Haverstraw is located on the west bank of the Hudson River, about 30 miles north of New York City. The village is bordered by the towns of Stony Point to the north, Haverstraw to the east, and Clarkstown to the south. The village is located in the Hudson Valley region of New York.
The village has a total area of 1.2 square miles, all of which is land. The village is located at an elevation of approximately 200 feet above sea level.
Economy
West Haverstraw’s economy is largely based on the service industry. The village is home to several restaurants, retail stores, and other businesses. The village is also home to a number of small manufacturing companies.
The village is also home to a number of government offices, including the Rockland County Department of Social Services and the Rockland County Department of Health.
Demographics
As of the 2010 census, West Haverstraw had a population of 4,521 people. The racial makeup of the village was 79.3% White, 11.2% African American, 0.3% Native American, 2.2% Asian, 0.1% Pacific Islander, 4.7% from other races, and 2.4% from two or more races. Hispanic or Latino of any race were 11.7% of the population.
The median household income in West Haverstraw was $60,938, and the median family income was $68,958. The per capita income for the village was $27,945. About 8.2% of families and 10.2% of the population were below the poverty line, including 14.2% of those under age 18 and 5.2% of those age 65 or over.
West Haverstraw is a diverse community with a rich history and a vibrant economy. The village is home to a number of businesses, government offices, and other services, and is a great place to live and work.
Common Questions
What is the Total Population of West Haverstraw?
Total Population of West Haverstraw is 10,649.
What is the Total Male Population of West Haverstraw?
Total Male Population of West Haverstraw is 5,533.
What is the Total Female Population of West Haverstraw?
Total Female Population of West Haverstraw is 5,116.
What is the Ratio of Males per 100 Females in West Haverstraw?
There are 108.15 Males per 100 Females in West Haverstraw.
What is the Ratio of Females per 100 Males in West Haverstraw?
There are 92.46 Females per 100 Males in West Haverstraw.
What is the Median Population Age in West Haverstraw?
Median Population Age in West Haverstraw is 40.3 Years.
What is the Average Family Size in West Haverstraw
Average Family Size in West Haverstraw is 3.9 People.
What is the Average Household Size in West Haverstraw
Average Household Size in West Haverstraw is 3.2 People.
What is Per Capita Income in West Haverstraw?
Per Capita income in West Haverstraw is $34,493.
What is the Median Family Income in West Haverstraw?
Median Family Income in West Haverstraw is $94,395.
What is the Median Household income in West Haverstraw?
Median Household Income in West Haverstraw is $81,795.
What is Income or Wage Gap in West Haverstraw?
Income or Wage Gap in West Haverstraw is 17.5%.
Women in West Haverstraw earn 82.5 cents for every dollar earned by a man.
What is Inequality or Gini Index in West Haverstraw?
Inequality or Gini Index in West Haverstraw is 0.41.
How Large is the Labor Force in West Haverstraw?
There are 5,824 People in the Labor Forcein in West Haverstraw.
What is the Percentage of People in the Labor Force in West Haverstraw?
70.6% of People are in the Labor Force in West Haverstraw.
What is the Unemployment Rate in West Haverstraw?
Unemployment Rate in West Haverstraw is 6.4%.