Hemby Bridge, NC
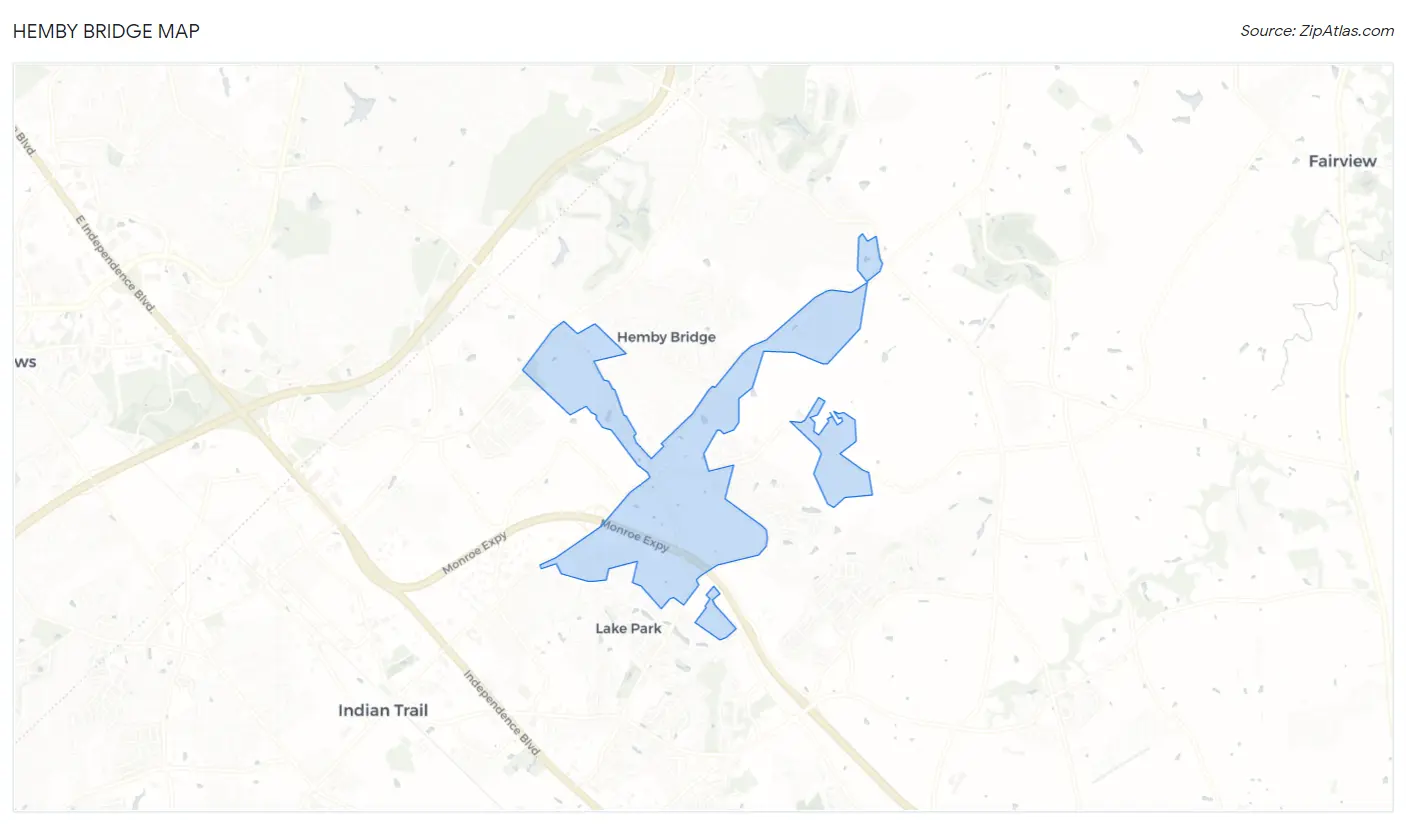
Hemby Bridge Map
Hemby Bridge Overview
1,924
TOTAL POPULATION
958
MALE POPULATION
966
FEMALE POPULATION
99.17
MALES / 100 FEMALES
100.84
FEMALES / 100 MALES
40.2
MEDIAN AGE
3.0
AVG FAMILY SIZE
2.6
AVG HOUSEHOLD SIZE
$29,364
PER CAPITA INCOME
$83,563
AVG FAMILY INCOME
$77,454
AVG HOUSEHOLD INCOME
11.5%
WAGE / INCOME GAP [ % ]
88.5¢/ $1
WAGE / INCOME GAP [ $ ]
0.37
INEQUALITY / GINI INDEX
828
LABOR FORCE [ PEOPLE ]
56.9%
PERCENT IN LABOR FORCE
Race in Hemby Bridge
The most populous races in Hemby Bridge are White / Caucasian (1,450 | 75.4%), Hispanic or Latino (222 | 11.5%), and Some other Race (211 | 11.0%).
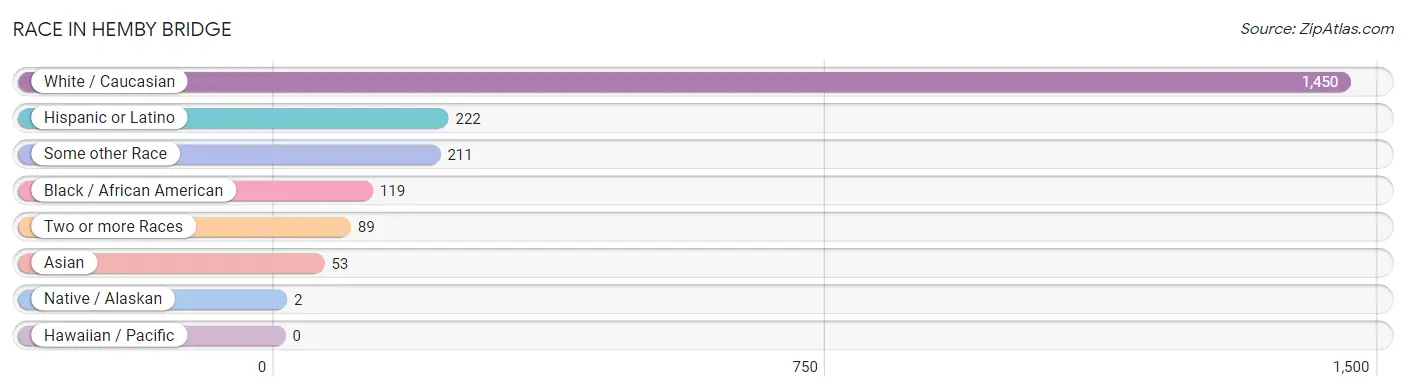
| Race | # Population | % Population |
| Asian | 53 | 2.8% |
| Black / African American | 119 | 6.2% |
| Hawaiian / Pacific | 0 | 0.0% |
| Hispanic or Latino | 222 | 11.5% |
| Native / Alaskan | 2 | 0.1% |
| White / Caucasian | 1,450 | 75.4% |
| Two or more Races | 89 | 4.6% |
| Some other Race | 211 | 11.0% |
| Total | 1,924 | 100.0% |
Ancestry in Hemby Bridge
The most populous ancestries reported in Hemby Bridge are German (247 | 12.8%), Mexican (192 | 10.0%), English (178 | 9.2%), Irish (116 | 6.0%), and American (40 | 2.1%), together accounting for 40.2% of all Hemby Bridge residents.
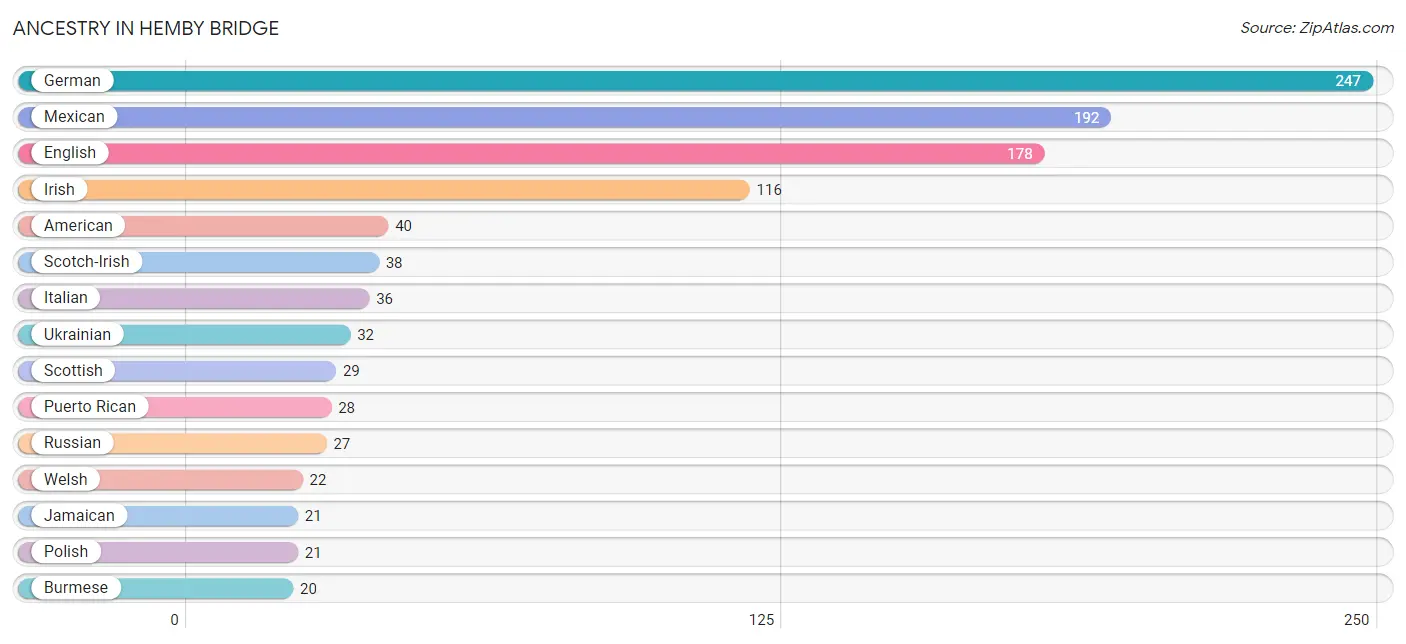
| Ancestry | # Population | % Population |
| American | 40 | 2.1% |
| Armenian | 10 | 0.5% |
| Belgian | 4 | 0.2% |
| Burmese | 20 | 1.0% |
| Canadian | 18 | 0.9% |
| Cherokee | 1 | 0.1% |
| Dutch | 10 | 0.5% |
| English | 178 | 9.2% |
| European | 11 | 0.6% |
| French | 19 | 1.0% |
| German | 247 | 12.8% |
| Hungarian | 11 | 0.6% |
| Indian (Asian) | 4 | 0.2% |
| Indonesian | 8 | 0.4% |
| Irish | 116 | 6.0% |
| Italian | 36 | 1.9% |
| Jamaican | 21 | 1.1% |
| Korean | 7 | 0.4% |
| Lumbee | 2 | 0.1% |
| Mexican | 192 | 10.0% |
| Norwegian | 17 | 0.9% |
| Pakistani | 9 | 0.5% |
| Pennsylvania German | 2 | 0.1% |
| Polish | 21 | 1.1% |
| Puerto Rican | 28 | 1.5% |
| Russian | 27 | 1.4% |
| Scandinavian | 17 | 0.9% |
| Scotch-Irish | 38 | 2.0% |
| Scottish | 29 | 1.5% |
| Sri Lankan | 6 | 0.3% |
| Swedish | 15 | 0.8% |
| Thai | 15 | 0.8% |
| Turkish | 4 | 0.2% |
| Ukrainian | 32 | 1.7% |
| Welsh | 22 | 1.1% | View All 35 Rows |
Immigrants in Hemby Bridge
The most numerous immigrant groups reported in Hemby Bridge came from Latin America (85 | 4.4%), Central America (78 | 4.1%), Mexico (78 | 4.1%), Asia (51 | 2.6%), and Eastern Europe (37 | 1.9%), together accounting for 17.1% of all Hemby Bridge residents.
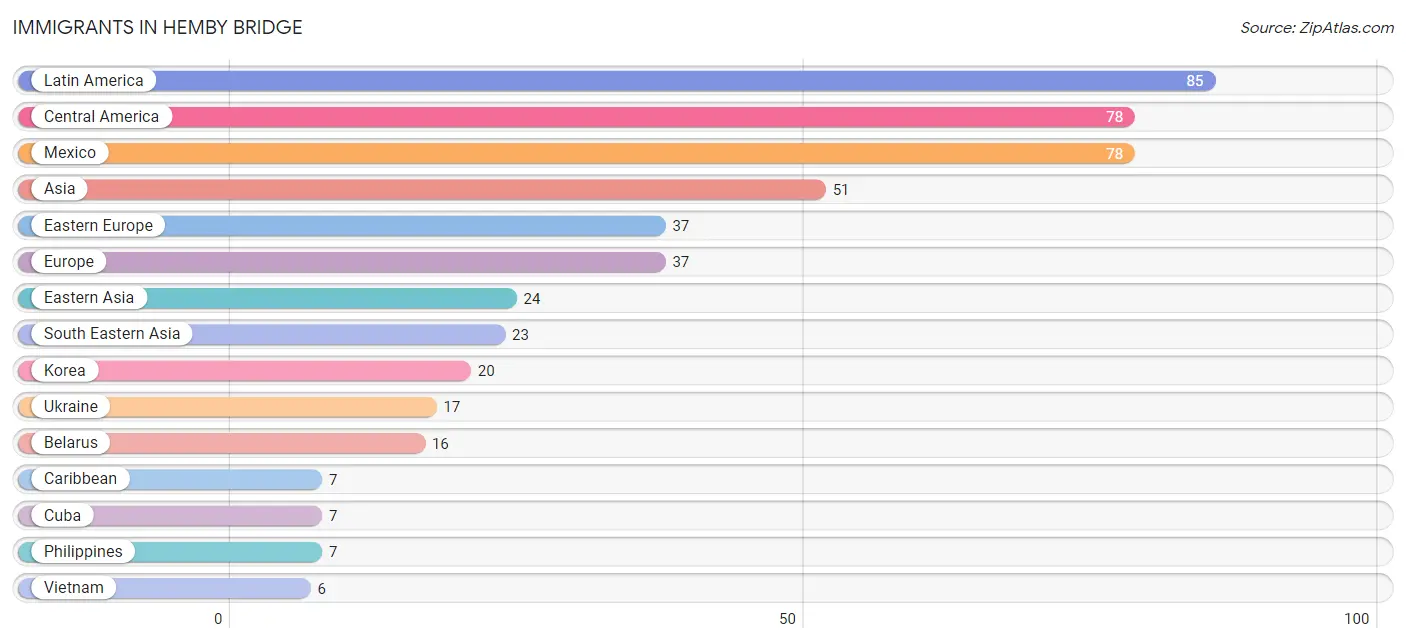
| Immigration Origin | # Population | % Population |
| Asia | 51 | 2.6% |
| Belarus | 16 | 0.8% |
| Caribbean | 7 | 0.4% |
| Central America | 78 | 4.1% |
| China | 4 | 0.2% |
| Cuba | 7 | 0.4% |
| Eastern Asia | 24 | 1.3% |
| Eastern Europe | 37 | 1.9% |
| Europe | 37 | 1.9% |
| India | 4 | 0.2% |
| Korea | 20 | 1.0% |
| Latin America | 85 | 4.4% |
| Malaysia | 2 | 0.1% |
| Mexico | 78 | 4.1% |
| Philippines | 7 | 0.4% |
| Russia | 4 | 0.2% |
| South Central Asia | 4 | 0.2% |
| South Eastern Asia | 23 | 1.2% |
| Thailand | 4 | 0.2% |
| Ukraine | 17 | 0.9% |
| Vietnam | 6 | 0.3% | View All 21 Rows |
Sex and Age in Hemby Bridge
Sex and Age in Hemby Bridge
The most populous age groups in Hemby Bridge are 50 to 54 Years (112 | 11.7%) for men and 10 to 14 Years (124 | 12.8%) for women.
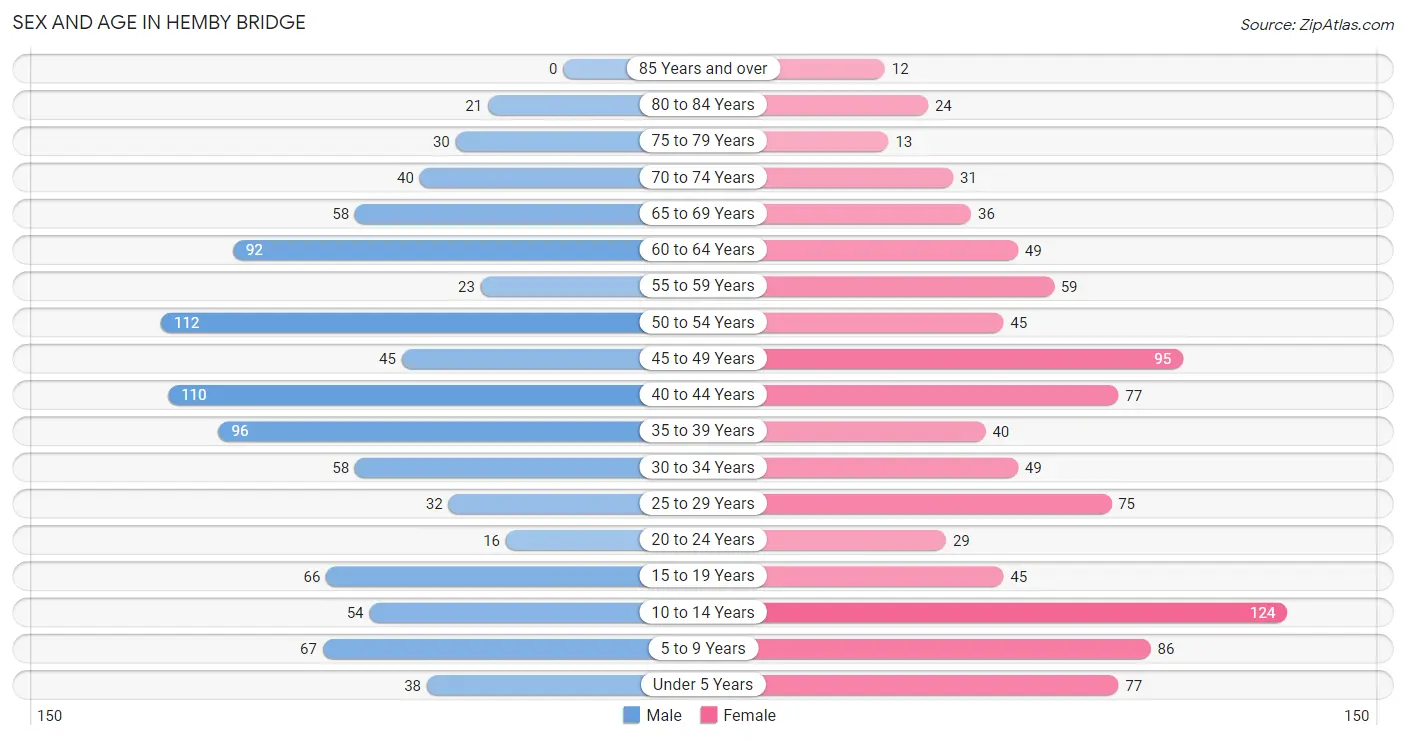
| Age Bracket | Male | Female |
| Under 5 Years | 38 (4.0%) | 77 (8.0%) |
| 5 to 9 Years | 67 (7.0%) | 86 (8.9%) |
| 10 to 14 Years | 54 (5.6%) | 124 (12.8%) |
| 15 to 19 Years | 66 (6.9%) | 45 (4.7%) |
| 20 to 24 Years | 16 (1.7%) | 29 (3.0%) |
| 25 to 29 Years | 32 (3.3%) | 75 (7.8%) |
| 30 to 34 Years | 58 (6.0%) | 49 (5.1%) |
| 35 to 39 Years | 96 (10.0%) | 40 (4.1%) |
| 40 to 44 Years | 110 (11.5%) | 77 (8.0%) |
| 45 to 49 Years | 45 (4.7%) | 95 (9.8%) |
| 50 to 54 Years | 112 (11.7%) | 45 (4.7%) |
| 55 to 59 Years | 23 (2.4%) | 59 (6.1%) |
| 60 to 64 Years | 92 (9.6%) | 49 (5.1%) |
| 65 to 69 Years | 58 (6.0%) | 36 (3.7%) |
| 70 to 74 Years | 40 (4.2%) | 31 (3.2%) |
| 75 to 79 Years | 30 (3.1%) | 13 (1.3%) |
| 80 to 84 Years | 21 (2.2%) | 24 (2.5%) |
| 85 Years and over | 0 (0.0%) | 12 (1.2%) |
| Total | 958 (100.0%) | 966 (100.0%) |
Families and Households in Hemby Bridge
Median Family Size in Hemby Bridge
The median family size in Hemby Bridge is 3.05 persons per family, with married-couple families (420 | 77.9%) accounting for the largest median family size of 3.12 persons per family. On the other hand, single female/mother families (98 | 18.2%) represent the smallest median family size with 2.77 persons per family.
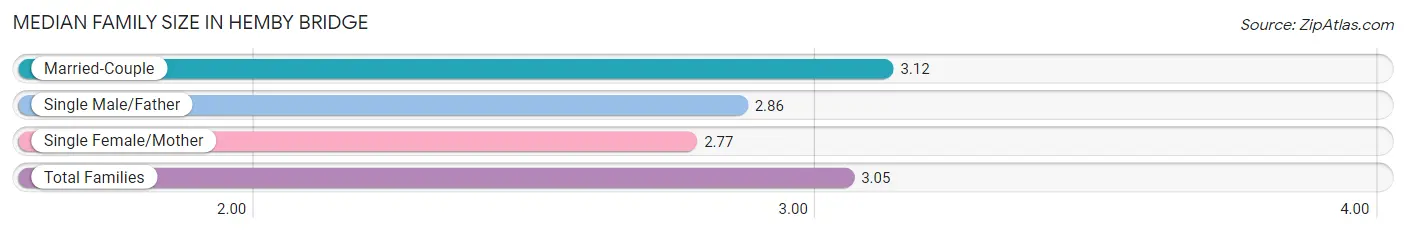
| Family Type | # Families | Family Size |
| Married-Couple | 420 (77.9%) | 3.12 |
| Single Male/Father | 21 (3.9%) | 2.86 |
| Single Female/Mother | 98 (18.2%) | 2.77 |
| Total Families | 539 (100.0%) | 3.05 |
Median Household Size in Hemby Bridge
The median household size in Hemby Bridge is 2.64 persons per household, with single male/father households (21 | 2.9%) accounting for the largest median household size of 4.14 persons per household. non-family households (190 | 26.1%) represent the smallest median household size with 1.14 persons per household.
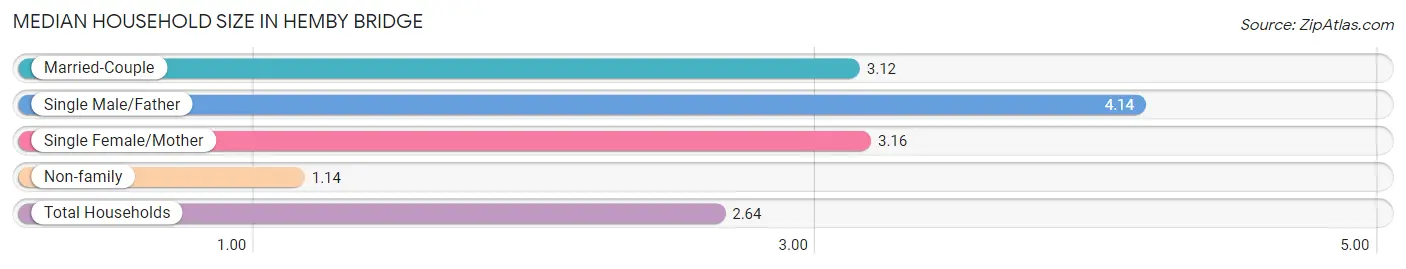
| Household Type | # Households | Household Size |
| Married-Couple | 420 (57.6%) | 3.12 |
| Single Male/Father | 21 (2.9%) | 4.14 |
| Single Female/Mother | 98 (13.4%) | 3.16 |
| Non-family | 190 (26.1%) | 1.14 |
| Total Households | 729 (100.0%) | 2.64 |
Household Size by Marriage Status in Hemby Bridge
Out of a total of 729 households in Hemby Bridge, 539 (73.9%) are family households, while 190 (26.1%) are nonfamily households. The most numerous type of family households are 2-person households, comprising 224, and the most common type of nonfamily households are 1-person households, comprising 162.
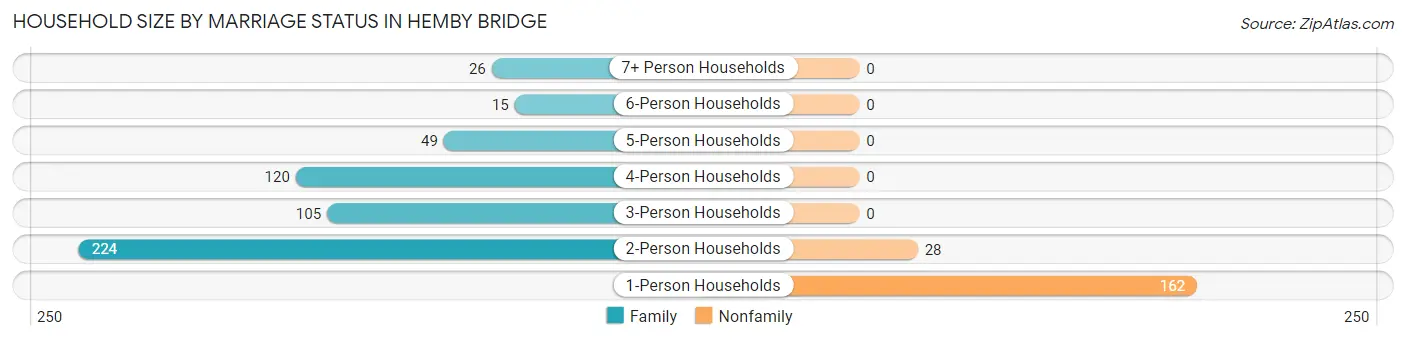
| Household Size | Family Households | Nonfamily Households |
| 1-Person Households | - | 162 (22.2%) |
| 2-Person Households | 224 (30.7%) | 28 (3.8%) |
| 3-Person Households | 105 (14.4%) | 0 (0.0%) |
| 4-Person Households | 120 (16.5%) | 0 (0.0%) |
| 5-Person Households | 49 (6.7%) | 0 (0.0%) |
| 6-Person Households | 15 (2.1%) | 0 (0.0%) |
| 7+ Person Households | 26 (3.6%) | 0 (0.0%) |
| Total | 539 (73.9%) | 190 (26.1%) |
Female Fertility in Hemby Bridge
Fertility by Age in Hemby Bridge
Average fertility rate in Hemby Bridge is 16.0 births per 1,000 women. Women in the age bracket of 35 to 50 years have the highest fertility rate with 30.0 births per 1,000 women. Women in the age bracket of 35 to 50 years acount for 100.0% of all women with births.
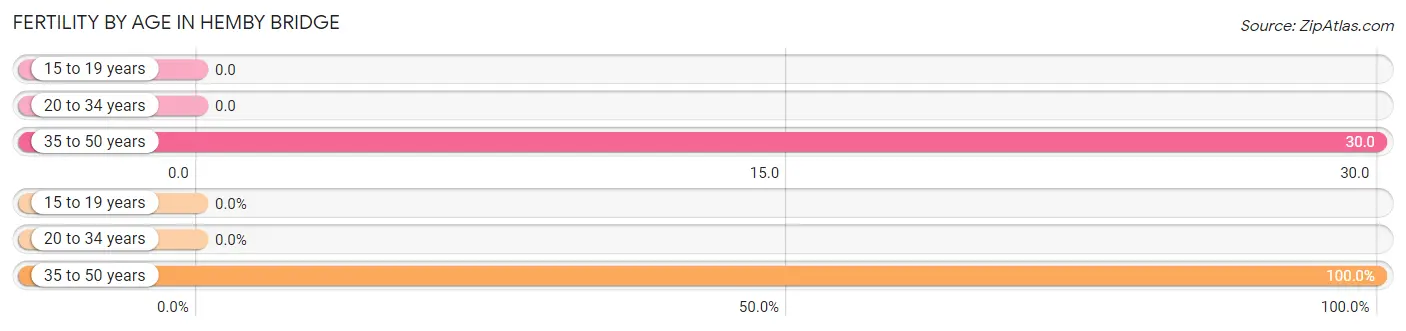
| Age Bracket | Women with Births | Births / 1,000 Women |
| 15 to 19 years | 0 (0.0%) | 0.0 |
| 20 to 34 years | 0 (0.0%) | 0.0 |
| 35 to 50 years | 7 (100.0%) | 30.0 |
| Total | 7 (100.0%) | 16.0 |
Fertility by Age by Marriage Status in Hemby Bridge
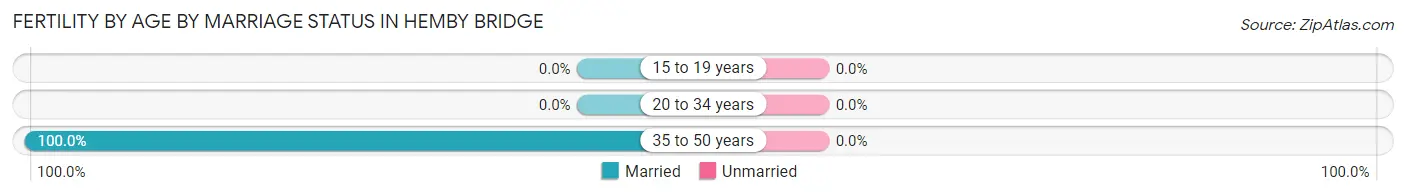
| Age Bracket | Married | Unmarried |
| 15 to 19 years | 0 (0.0%) | 0 (0.0%) |
| 20 to 34 years | 0 (0.0%) | 0 (0.0%) |
| 35 to 50 years | 7 (100.0%) | 0 (0.0%) |
| Total | 7 (100.0%) | 0 (0.0%) |
Fertility by Education in Hemby Bridge
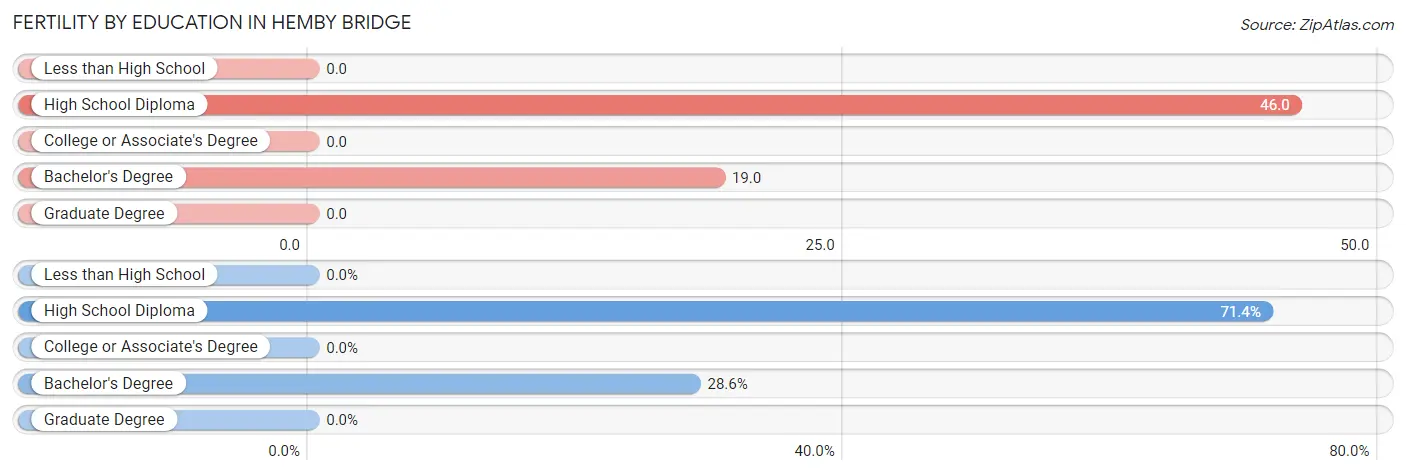
| Educational Attainment | Women with Births | Births / 1,000 Women |
| Less than High School | 0 (0.0%) | 0.0 |
| High School Diploma | 5 (71.4%) | 46.0 |
| College or Associate's Degree | 0 (0.0%) | 0.0 |
| Bachelor's Degree | 2 (28.6%) | 19.0 |
| Graduate Degree | 0 (0.0%) | 0.0 |
| Total | 7 (100.0%) | 16.0 |
Fertility by Education by Marriage Status in Hemby Bridge
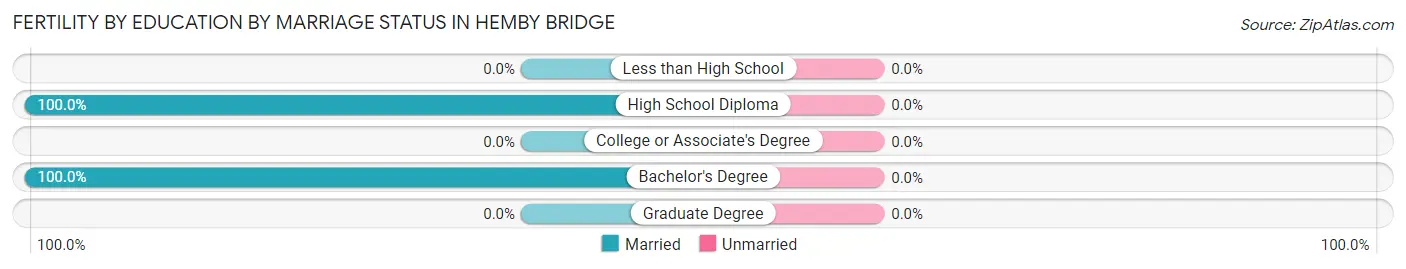
| Educational Attainment | Married | Unmarried |
| Less than High School | 0 (0.0%) | 0 (0.0%) |
| High School Diploma | 5 (100.0%) | 0 (0.0%) |
| College or Associate's Degree | 0 (0.0%) | 0 (0.0%) |
| Bachelor's Degree | 2 (100.0%) | 0 (0.0%) |
| Graduate Degree | 0 (0.0%) | 0 (0.0%) |
| Total | 7 (100.0%) | 0 (0.0%) |
Income in Hemby Bridge
Income Overview in Hemby Bridge
Per Capita Income in Hemby Bridge is $29,364, while median incomes of families and households are $83,563 and $77,454 respectively.
| Characteristic | Number | Measure |
| Per Capita Income | 1,924 | $29,364 |
| Median Family Income | 539 | $83,563 |
| Mean Family Income | 539 | $89,333 |
| Median Household Income | 729 | $77,454 |
| Mean Household Income | 729 | $78,751 |
| Income Deficit | 539 | $0 |
| Wage / Income Gap (%) | 1,924 | 11.49% |
| Wage / Income Gap ($) | 1,924 | 88.51¢ per $1 |
| Gini / Inequality Index | 1,924 | 0.37 |
Earnings by Sex in Hemby Bridge
Average Earnings in Hemby Bridge are $52,202, $54,798 for men and $48,500 for women, a difference of 11.5%.
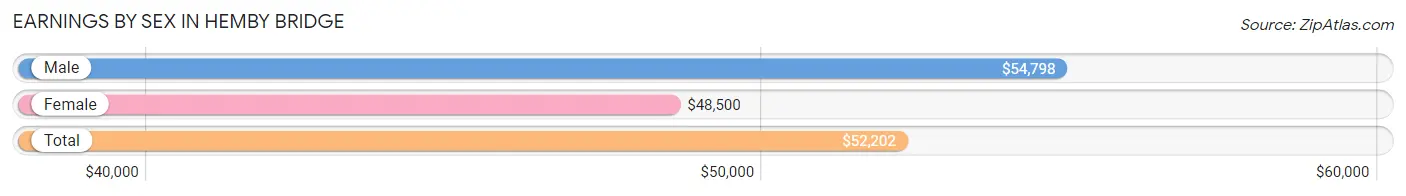
| Sex | Number | Average Earnings |
| Male | 513 (56.1%) | $54,798 |
| Female | 402 (43.9%) | $48,500 |
| Total | 915 (100.0%) | $52,202 |
Earnings by Sex by Income Bracket in Hemby Bridge
The most common earnings brackets in Hemby Bridge are $75,000 to $99,999 for men (73 | 14.2%) and $55,000 to $64,999 for women (62 | 15.4%).
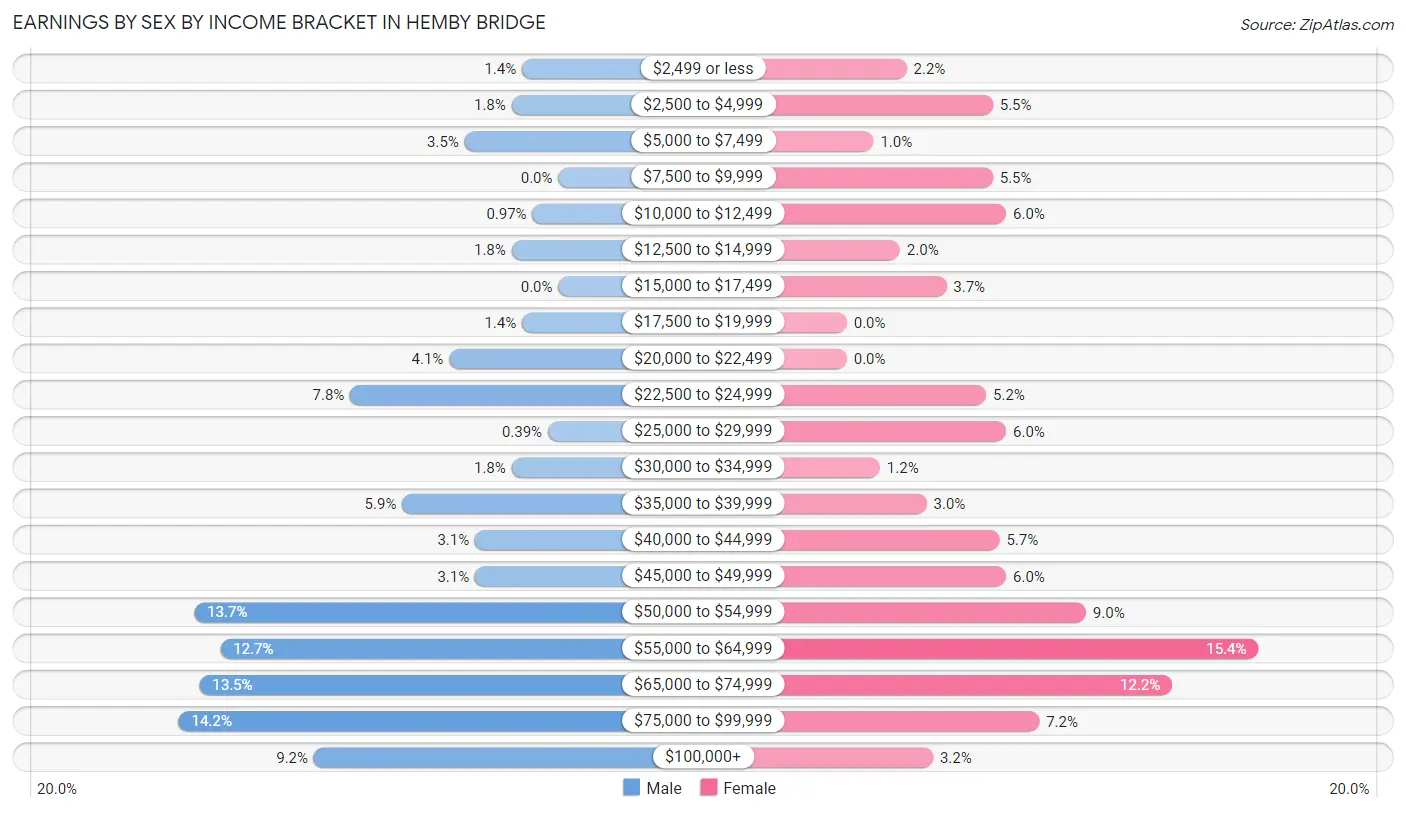
| Income | Male | Female |
| $2,499 or less | 7 (1.4%) | 9 (2.2%) |
| $2,500 to $4,999 | 9 (1.8%) | 22 (5.5%) |
| $5,000 to $7,499 | 18 (3.5%) | 4 (1.0%) |
| $7,500 to $9,999 | 0 (0.0%) | 22 (5.5%) |
| $10,000 to $12,499 | 5 (1.0%) | 24 (6.0%) |
| $12,500 to $14,999 | 9 (1.8%) | 8 (2.0%) |
| $15,000 to $17,499 | 0 (0.0%) | 15 (3.7%) |
| $17,500 to $19,999 | 7 (1.4%) | 0 (0.0%) |
| $20,000 to $22,499 | 21 (4.1%) | 0 (0.0%) |
| $22,500 to $24,999 | 40 (7.8%) | 21 (5.2%) |
| $25,000 to $29,999 | 2 (0.4%) | 24 (6.0%) |
| $30,000 to $34,999 | 9 (1.8%) | 5 (1.2%) |
| $35,000 to $39,999 | 30 (5.9%) | 12 (3.0%) |
| $40,000 to $44,999 | 16 (3.1%) | 23 (5.7%) |
| $45,000 to $49,999 | 16 (3.1%) | 24 (6.0%) |
| $50,000 to $54,999 | 70 (13.7%) | 36 (9.0%) |
| $55,000 to $64,999 | 65 (12.7%) | 62 (15.4%) |
| $65,000 to $74,999 | 69 (13.5%) | 49 (12.2%) |
| $75,000 to $99,999 | 73 (14.2%) | 29 (7.2%) |
| $100,000+ | 47 (9.2%) | 13 (3.2%) |
| Total | 513 (100.0%) | 402 (100.0%) |
Earnings by Sex by Educational Attainment in Hemby Bridge
Average earnings in Hemby Bridge are $57,969 for men and $50,938 for women, a difference of 12.1%. Men with an educational attainment of bachelor's degree enjoy the highest average annual earnings of $73,523, while those with less than high school education earn the least with $36,786. Women with an educational attainment of bachelor's degree earn the most with the average annual earnings of $62,303, while those with high school diploma education have the smallest earnings of $37,250.
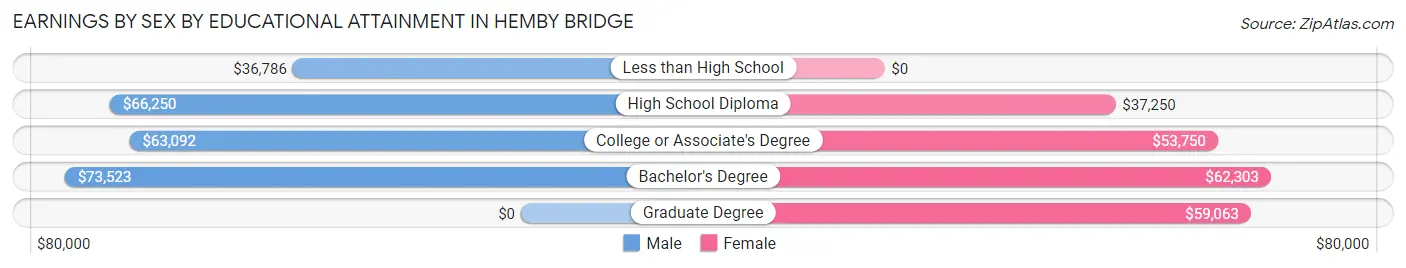
| Educational Attainment | Male Income | Female Income |
| Less than High School | $36,786 | $0 |
| High School Diploma | $66,250 | $37,250 |
| College or Associate's Degree | $63,092 | $53,750 |
| Bachelor's Degree | $73,523 | $62,303 |
| Graduate Degree | - | - |
| Total | $57,969 | $50,938 |
Family Income in Hemby Bridge
Family Income Brackets in Hemby Bridge
According to the Hemby Bridge family income data, there are 164 families falling into the $100,000 to $149,999 income range, which is the most common income bracket and makes up 30.4% of all families. Conversely, the $10,000 to $14,999 income bracket is the least frequent group with only 3 families (0.6%) belonging to this category.
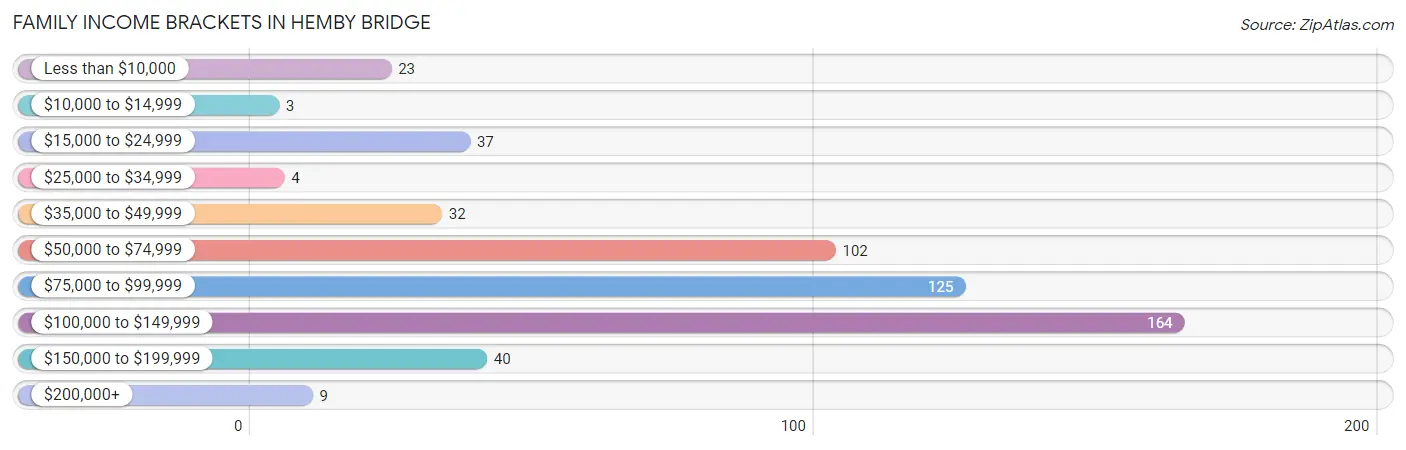
| Income Bracket | # Families | % Families |
| Less than $10,000 | 23 | 4.3% |
| $10,000 to $14,999 | 3 | 0.6% |
| $15,000 to $24,999 | 37 | 6.9% |
| $25,000 to $34,999 | 4 | 0.7% |
| $35,000 to $49,999 | 32 | 5.9% |
| $50,000 to $74,999 | 102 | 18.9% |
| $75,000 to $99,999 | 125 | 23.2% |
| $100,000 to $149,999 | 164 | 30.4% |
| $150,000 to $199,999 | 40 | 7.4% |
| $200,000+ | 9 | 1.7% |
Family Income by Famaliy Size in Hemby Bridge
3-person families (87 | 16.1%) account for the highest median family income in Hemby Bridge with $110,417 per family, while 2-person families (252 | 46.8%) have the highest median income of $40,375 per family member.
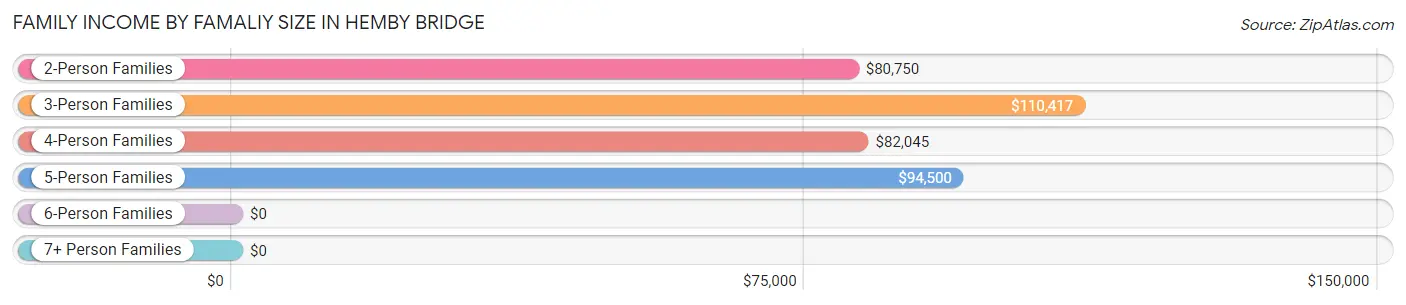
| Income Bracket | # Families | Median Income |
| 2-Person Families | 252 (46.8%) | $80,750 |
| 3-Person Families | 87 (16.1%) | $110,417 |
| 4-Person Families | 110 (20.4%) | $82,045 |
| 5-Person Families | 54 (10.0%) | $94,500 |
| 6-Person Families | 15 (2.8%) | $0 |
| 7+ Person Families | 21 (3.9%) | $0 |
| Total | 539 (100.0%) | $83,563 |
Family Income by Number of Earners in Hemby Bridge
The median family income in Hemby Bridge is $83,563, with families comprising 3+ earners (44) having the highest median family income of $116,111, while families with no earners (83) have the lowest median family income of $36,250, accounting for 8.2% and 15.4% of families, respectively.
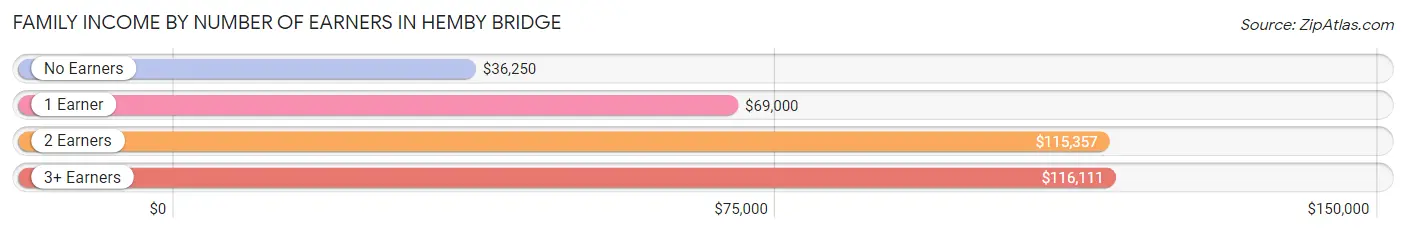
| Number of Earners | # Families | Median Income |
| No Earners | 83 (15.4%) | $36,250 |
| 1 Earner | 210 (39.0%) | $69,000 |
| 2 Earners | 202 (37.5%) | $115,357 |
| 3+ Earners | 44 (8.2%) | $116,111 |
| Total | 539 (100.0%) | $83,563 |
Household Income in Hemby Bridge
Household Income Brackets in Hemby Bridge
With 208 households falling in the category, the $100,000 to $149,999 income range is the most frequent in Hemby Bridge, accounting for 28.5% of all households. In contrast, only 8 households (1.1%) fall into the $10,000 to $14,999 income bracket, making it the least populous group.
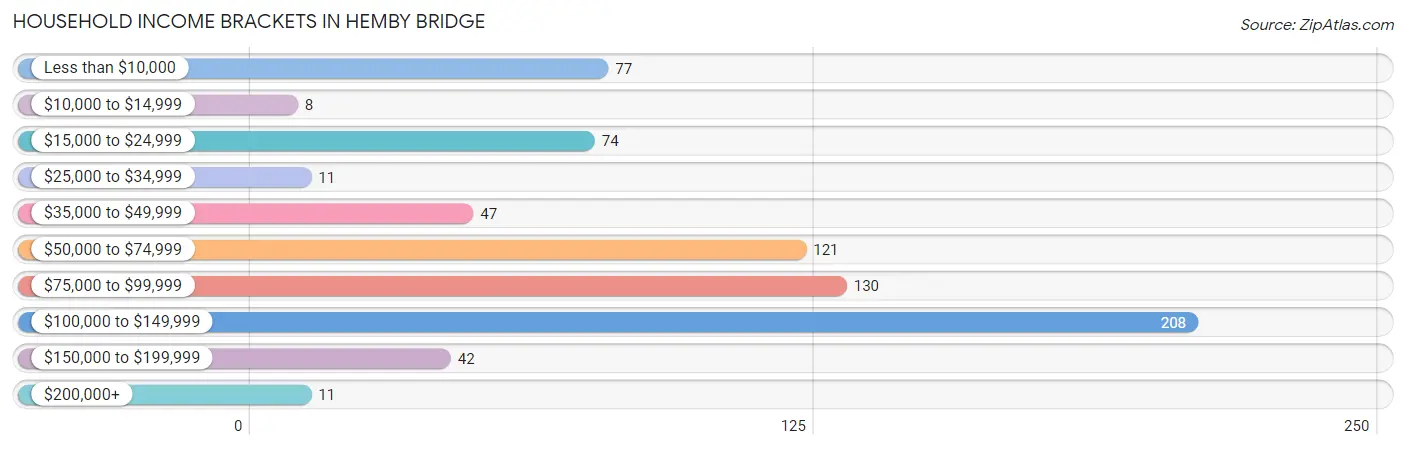
| Income Bracket | # Households | % Households |
| Less than $10,000 | 77 | 10.6% |
| $10,000 to $14,999 | 8 | 1.1% |
| $15,000 to $24,999 | 74 | 10.2% |
| $25,000 to $34,999 | 11 | 1.5% |
| $35,000 to $49,999 | 47 | 6.4% |
| $50,000 to $74,999 | 121 | 16.6% |
| $75,000 to $99,999 | 130 | 17.8% |
| $100,000 to $149,999 | 208 | 28.5% |
| $150,000 to $199,999 | 42 | 5.8% |
| $200,000+ | 11 | 1.5% |
Household Income by Householder Age in Hemby Bridge
The median household income in Hemby Bridge is $77,454, with the highest median household income of $100,000 found in the 45 to 64 years age bracket for the primary householder. A total of 294 households (40.3%) fall into this category.
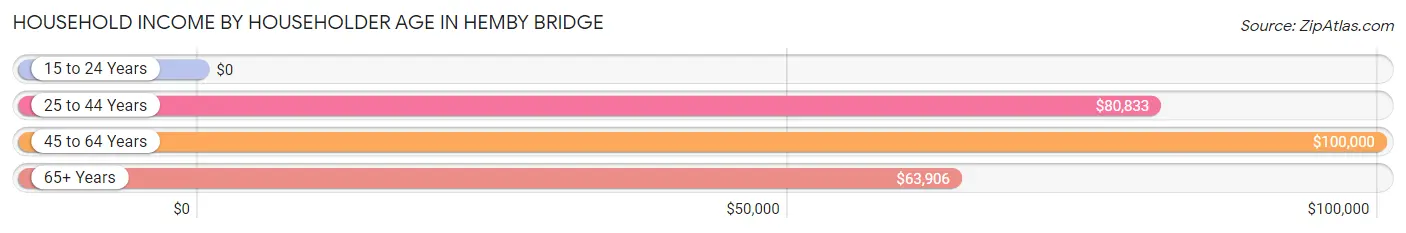
| Income Bracket | # Households | Median Income |
| 15 to 24 Years | 0 (0.0%) | $0 |
| 25 to 44 Years | 288 (39.5%) | $80,833 |
| 45 to 64 Years | 294 (40.3%) | $100,000 |
| 65+ Years | 147 (20.2%) | $63,906 |
| Total | 729 (100.0%) | $77,454 |
Poverty in Hemby Bridge
Income Below Poverty by Sex and Age in Hemby Bridge
With 17.2% poverty level for males and 13.0% for females among the residents of Hemby Bridge, 15 year old males and 6 to 11 year old females are the most vulnerable to poverty, with 11 males (57.9%) and 44 females (36.1%) in their respective age groups living below the poverty level.
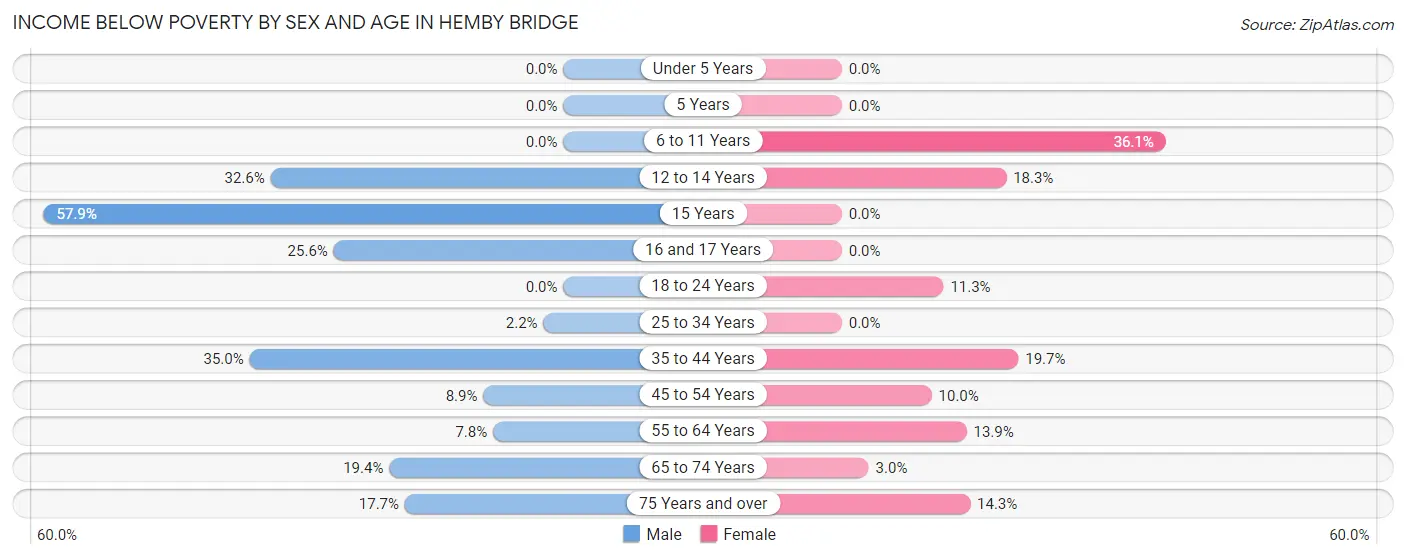
| Age Bracket | Male | Female |
| Under 5 Years | 0 (0.0%) | 0 (0.0%) |
| 5 Years | 0 (0.0%) | 0 (0.0%) |
| 6 to 11 Years | 0 (0.0%) | 44 (36.1%) |
| 12 to 14 Years | 15 (32.6%) | 13 (18.3%) |
| 15 Years | 11 (57.9%) | 0 (0.0%) |
| 16 and 17 Years | 11 (25.6%) | 0 (0.0%) |
| 18 to 24 Years | 0 (0.0%) | 6 (11.3%) |
| 25 to 34 Years | 2 (2.2%) | 0 (0.0%) |
| 35 to 44 Years | 72 (34.9%) | 23 (19.7%) |
| 45 to 54 Years | 14 (8.9%) | 14 (10.0%) |
| 55 to 64 Years | 9 (7.8%) | 15 (13.9%) |
| 65 to 74 Years | 19 (19.4%) | 2 (3.0%) |
| 75 Years and over | 9 (17.6%) | 7 (14.3%) |
| Total | 162 (17.2%) | 124 (13.0%) |
Income Above Poverty by Sex and Age in Hemby Bridge
According to the poverty statistics in Hemby Bridge, males aged under 5 years and females aged under 5 years are the age groups that are most secure financially, with 100.0% of males and 100.0% of females in these age groups living above the poverty line.
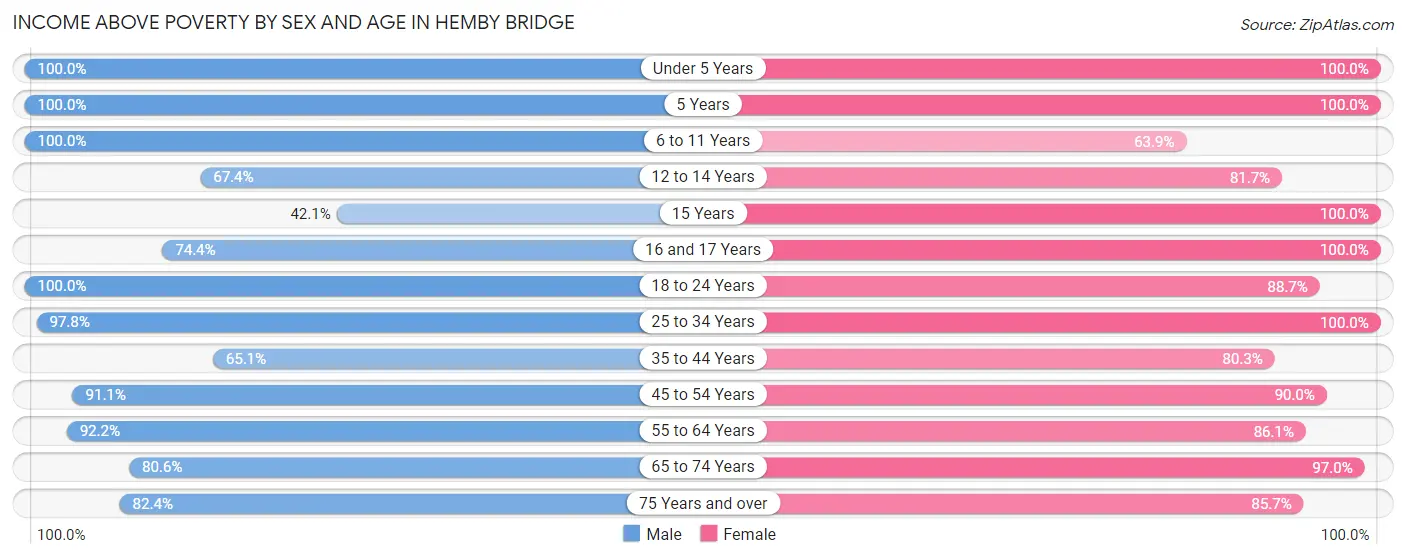
| Age Bracket | Male | Female |
| Under 5 Years | 38 (100.0%) | 77 (100.0%) |
| 5 Years | 5 (100.0%) | 7 (100.0%) |
| 6 to 11 Years | 55 (100.0%) | 78 (63.9%) |
| 12 to 14 Years | 31 (67.4%) | 58 (81.7%) |
| 15 Years | 8 (42.1%) | 3 (100.0%) |
| 16 and 17 Years | 32 (74.4%) | 18 (100.0%) |
| 18 to 24 Years | 20 (100.0%) | 47 (88.7%) |
| 25 to 34 Years | 88 (97.8%) | 124 (100.0%) |
| 35 to 44 Years | 134 (65.0%) | 94 (80.3%) |
| 45 to 54 Years | 143 (91.1%) | 126 (90.0%) |
| 55 to 64 Years | 106 (92.2%) | 93 (86.1%) |
| 65 to 74 Years | 79 (80.6%) | 65 (97.0%) |
| 75 Years and over | 42 (82.4%) | 42 (85.7%) |
| Total | 781 (82.8%) | 832 (87.0%) |
Income Below Poverty Among Married-Couple Families in Hemby Bridge
The poverty statistics for married-couple families in Hemby Bridge show that 9.5% or 40 of the total 420 families live below the poverty line. Families with 1 or 2 children have the highest poverty rate of 16.0%, comprising of 26 families. On the other hand, families with 3 or 4 children have the lowest poverty rate of 0.0%, which includes 0 families.
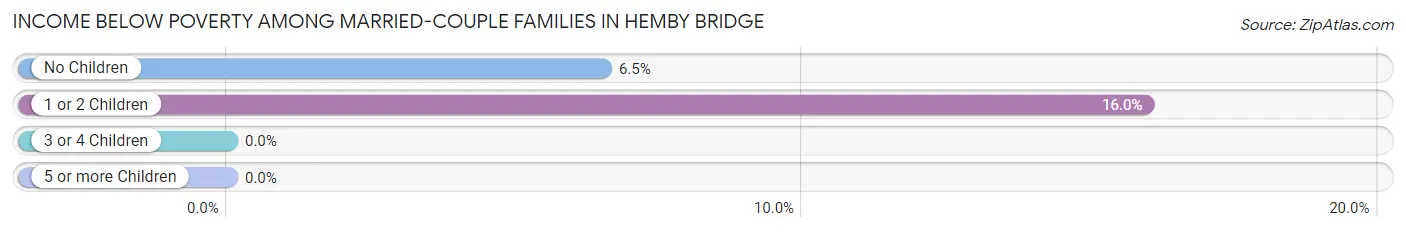
| Children | Above Poverty | Below Poverty |
| No Children | 201 (93.5%) | 14 (6.5%) |
| 1 or 2 Children | 137 (84.1%) | 26 (16.0%) |
| 3 or 4 Children | 42 (100.0%) | 0 (0.0%) |
| 5 or more Children | 0 (0.0%) | 0 (0.0%) |
| Total | 380 (90.5%) | 40 (9.5%) |
Income Below Poverty Among Single-Parent Households in Hemby Bridge
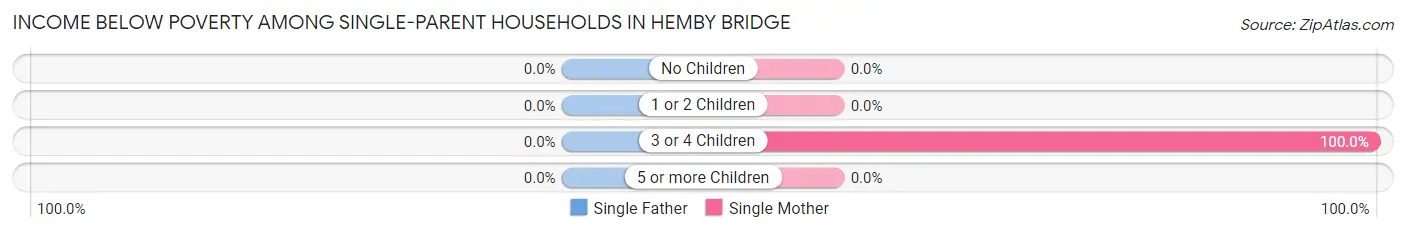
| Children | Single Father | Single Mother |
| No Children | 0 (0.0%) | 0 (0.0%) |
| 1 or 2 Children | 0 (0.0%) | 0 (0.0%) |
| 3 or 4 Children | 0 (0.0%) | 14 (100.0%) |
| 5 or more Children | 0 (0.0%) | 0 (0.0%) |
| Total | 0 (0.0%) | 14 (14.3%) |
Income Below Poverty Among Married-Couple vs Single-Parent Households in Hemby Bridge
The poverty data for Hemby Bridge shows that 40 of the married-couple family households (9.5%) and 14 of the single-parent households (11.8%) are living below the poverty level. Within the married-couple family households, those with 1 or 2 children have the highest poverty rate, with 26 households (16.0%) falling below the poverty line. Among the single-parent households, those with 3 or 4 children have the highest poverty rate, with 14 household (73.7%) living below poverty.
| Children | Married-Couple Families | Single-Parent Households |
| No Children | 14 (6.5%) | 0 (0.0%) |
| 1 or 2 Children | 26 (16.0%) | 0 (0.0%) |
| 3 or 4 Children | 0 (0.0%) | 14 (73.7%) |
| 5 or more Children | 0 (0.0%) | 0 (0.0%) |
| Total | 40 (9.5%) | 14 (11.8%) |
Employment Characteristics in Hemby Bridge
Employment by Class of Employer in Hemby Bridge
Among the 813 employed individuals in Hemby Bridge, private company employees (589 | 72.5%), self-employed (incorporated) (57 | 7.0%), and not-for-profit organizations (53 | 6.5%) make up the most common classes of employment.
| Employer Class | # Employees | % Employees |
| Private Company Employees | 589 | 72.5% |
| Self-Employed (Incorporated) | 57 | 7.0% |
| Self-Employed (Not Incorporated) | 46 | 5.7% |
| Not-for-profit Organizations | 53 | 6.5% |
| Local Government Employees | 36 | 4.4% |
| State Government Employees | 20 | 2.5% |
| Federal Government Employees | 0 | 0.0% |
| Unpaid Family Workers | 12 | 1.5% |
| Total | 813 | 100.0% |
Employment Status by Age in Hemby Bridge
| Age Bracket | In Labor Force | Unemployed |
| 16 to 19 Years | 28 (31.5%) | 0 (0.0%) |
| 20 to 24 Years | 45 (100.0%) | 0 (0.0%) |
| 25 to 29 Years | 63 (58.9%) | 0 (0.0%) |
| 30 to 34 Years | 87 (81.3%) | 0 (0.0%) |
| 35 to 44 Years | 199 (61.6%) | 0 (0.0%) |
| 45 to 54 Years | 253 (85.2%) | 0 (0.0%) |
| 55 to 59 Years | 50 (61.0%) | 0 (0.0%) |
| 60 to 64 Years | 59 (41.8%) | 0 (0.0%) |
| 65 to 74 Years | 27 (16.4%) | 0 (0.0%) |
| 75 Years and over | 18 (18.0%) | 0 (0.0%) |
| Total | 828 (56.9%) | 0 (0.0%) |
Employment Status by Educational Attainment in Hemby Bridge
| Educational Attainment | In Labor Force | Unemployed |
| Less than High School | 94 (54.0%) | 0 (0.0%) |
| High School Diploma | 235 (74.6%) | 0 (0.0%) |
| College / Associate Degree | 178 (56.9%) | 0 (0.0%) |
| Bachelor's Degree or higher | 204 (80.0%) | 0 (0.0%) |
| Total | 711 (67.3%) | 0 (0.0%) |
Employment Occupations by Sex in Hemby Bridge
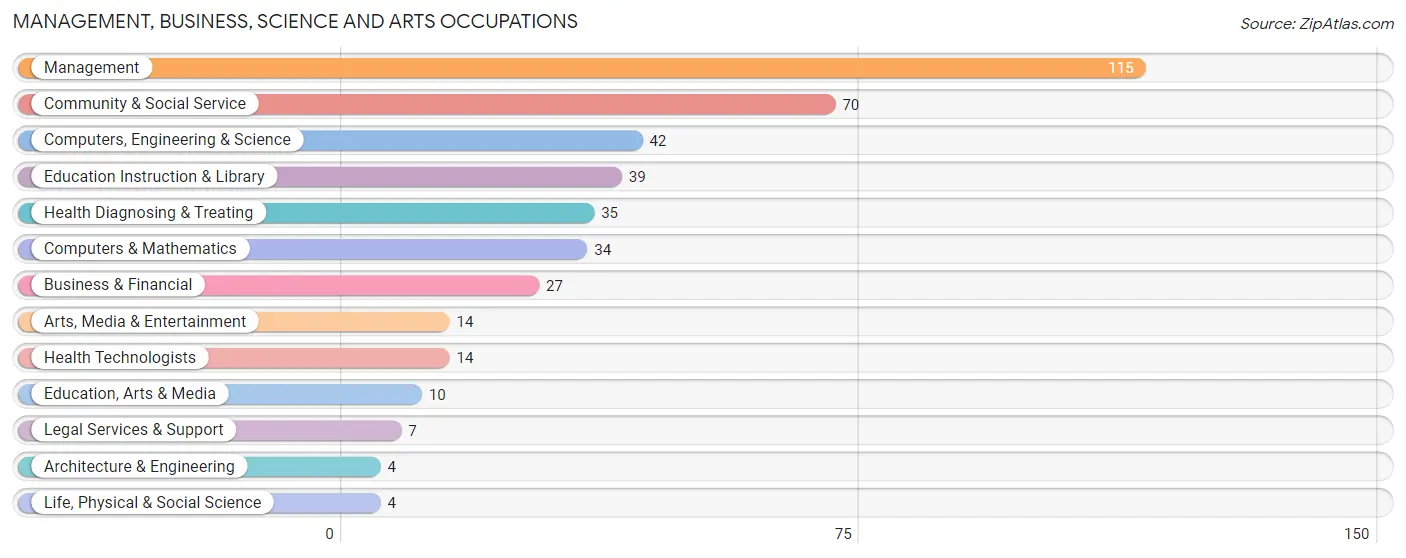
Management, Business, Science and Arts Occupations
The most common Management, Business, Science and Arts occupations in Hemby Bridge are Management (115 | 13.9%), Community & Social Service (70 | 8.4%), Computers, Engineering & Science (42 | 5.1%), Education Instruction & Library (39 | 4.7%), and Health Diagnosing & Treating (35 | 4.2%).
Management, Business, Science and Arts Occupations by Sex
Within the Management, Business, Science and Arts occupations in Hemby Bridge, the most male-oriented occupations are Architecture & Engineering (100.0%), Life, Physical & Social Science (100.0%), and Education, Arts & Media (100.0%), while the most female-oriented occupations are Business & Financial (100.0%), Legal Services & Support (100.0%), and Health Technologists (100.0%).
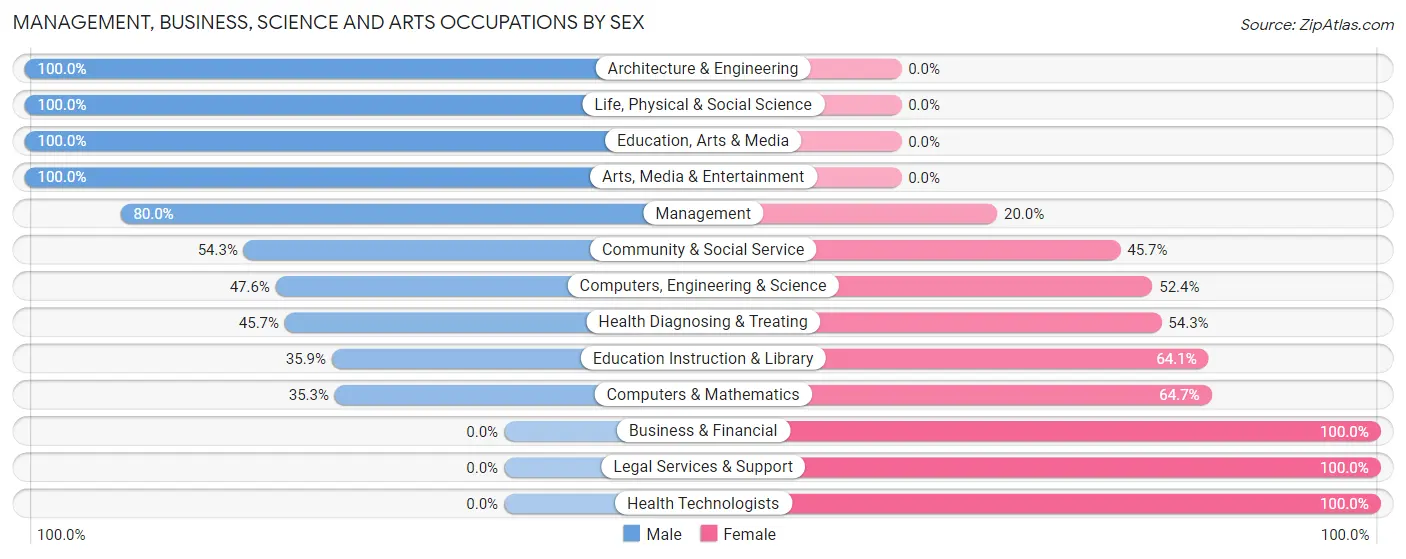
| Occupation | Male | Female |
| Management | 92 (80.0%) | 23 (20.0%) |
| Business & Financial | 0 (0.0%) | 27 (100.0%) |
| Computers, Engineering & Science | 20 (47.6%) | 22 (52.4%) |
| Computers & Mathematics | 12 (35.3%) | 22 (64.7%) |
| Architecture & Engineering | 4 (100.0%) | 0 (0.0%) |
| Life, Physical & Social Science | 4 (100.0%) | 0 (0.0%) |
| Community & Social Service | 38 (54.3%) | 32 (45.7%) |
| Education, Arts & Media | 10 (100.0%) | 0 (0.0%) |
| Legal Services & Support | 0 (0.0%) | 7 (100.0%) |
| Education Instruction & Library | 14 (35.9%) | 25 (64.1%) |
| Arts, Media & Entertainment | 14 (100.0%) | 0 (0.0%) |
| Health Diagnosing & Treating | 16 (45.7%) | 19 (54.3%) |
| Health Technologists | 0 (0.0%) | 14 (100.0%) |
| Total (Category) | 166 (57.4%) | 123 (42.6%) |
| Total (Overall) | 461 (55.6%) | 368 (44.4%) |
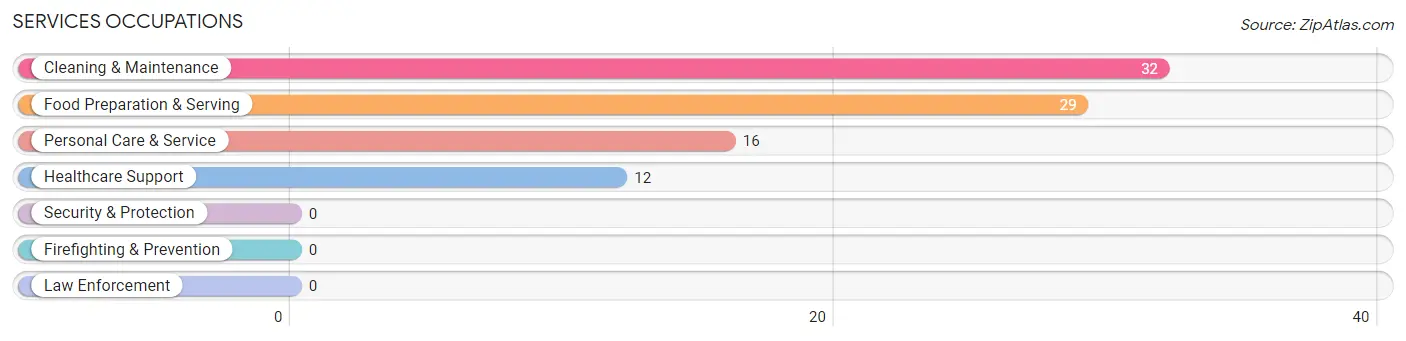
Services Occupations
The most common Services occupations in Hemby Bridge are Cleaning & Maintenance (32 | 3.9%), Food Preparation & Serving (29 | 3.5%), Personal Care & Service (16 | 1.9%), and Healthcare Support (12 | 1.5%).
Services Occupations by Sex
Within the Services occupations in Hemby Bridge, the most male-oriented occupations are Cleaning & Maintenance (40.6%), and Healthcare Support (25.0%), while the most female-oriented occupations are Food Preparation & Serving (100.0%), Personal Care & Service (100.0%), and Healthcare Support (75.0%).
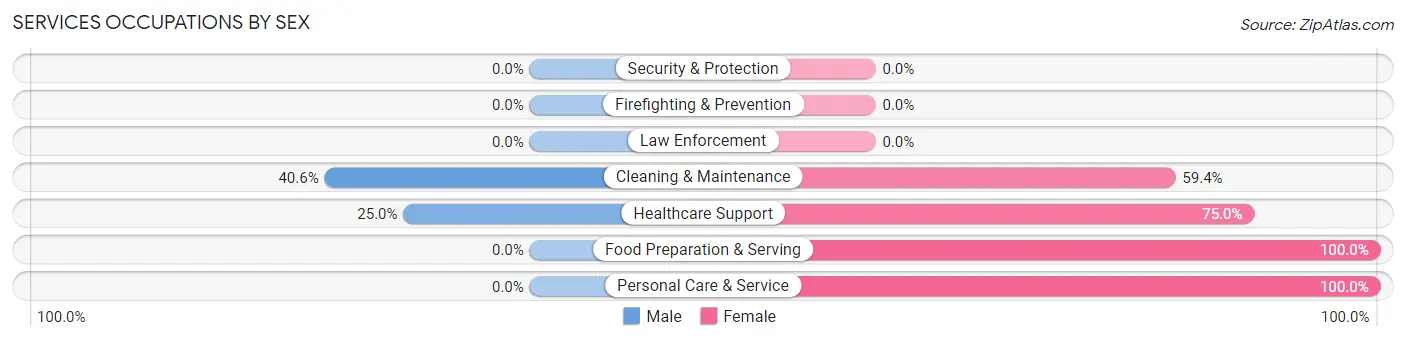
| Occupation | Male | Female |
| Healthcare Support | 3 (25.0%) | 9 (75.0%) |
| Security & Protection | 0 (0.0%) | 0 (0.0%) |
| Firefighting & Prevention | 0 (0.0%) | 0 (0.0%) |
| Law Enforcement | 0 (0.0%) | 0 (0.0%) |
| Food Preparation & Serving | 0 (0.0%) | 29 (100.0%) |
| Cleaning & Maintenance | 13 (40.6%) | 19 (59.4%) |
| Personal Care & Service | 0 (0.0%) | 16 (100.0%) |
| Total (Category) | 16 (18.0%) | 73 (82.0%) |
| Total (Overall) | 461 (55.6%) | 368 (44.4%) |
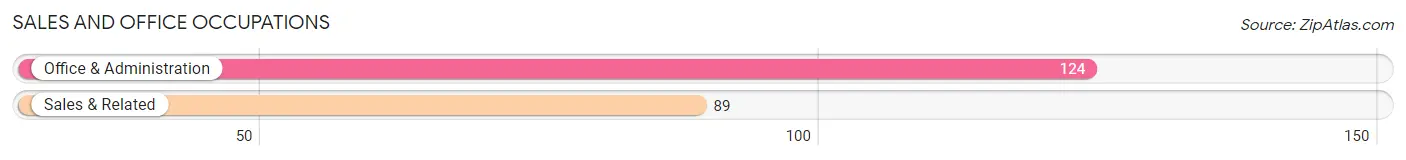
Sales and Office Occupations
The most common Sales and Office occupations in Hemby Bridge are Office & Administration (124 | 15.0%), and Sales & Related (89 | 10.7%).
Sales and Office Occupations by Sex
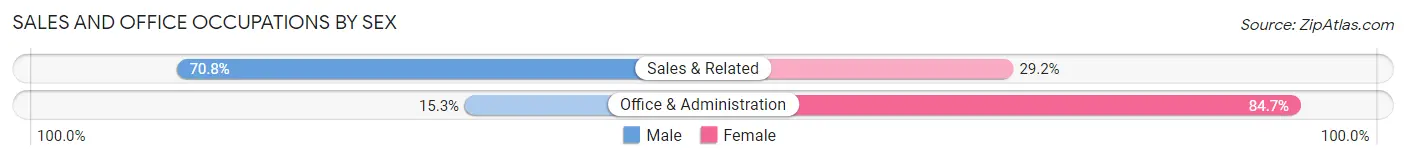
| Occupation | Male | Female |
| Sales & Related | 63 (70.8%) | 26 (29.2%) |
| Office & Administration | 19 (15.3%) | 105 (84.7%) |
| Total (Category) | 82 (38.5%) | 131 (61.5%) |
| Total (Overall) | 461 (55.6%) | 368 (44.4%) |
Natural Resources, Construction and Maintenance Occupations
The most common Natural Resources, Construction and Maintenance occupations in Hemby Bridge are Construction & Extraction (62 | 7.5%), and Installation, Maintenance & Repair (27 | 3.3%).

Natural Resources, Construction and Maintenance Occupations by Sex
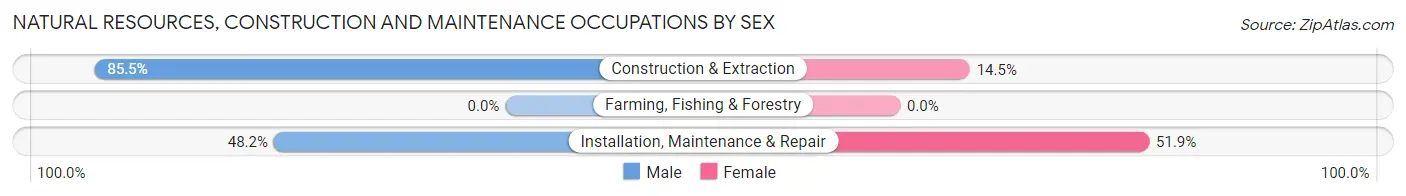
| Occupation | Male | Female |
| Farming, Fishing & Forestry | 0 (0.0%) | 0 (0.0%) |
| Construction & Extraction | 53 (85.5%) | 9 (14.5%) |
| Installation, Maintenance & Repair | 13 (48.1%) | 14 (51.8%) |
| Total (Category) | 66 (74.2%) | 23 (25.8%) |
| Total (Overall) | 461 (55.6%) | 368 (44.4%) |
Production, Transportation and Moving Occupations
The most common Production, Transportation and Moving occupations in Hemby Bridge are Transportation (88 | 10.6%), Production (38 | 4.6%), and Material Moving (23 | 2.8%).
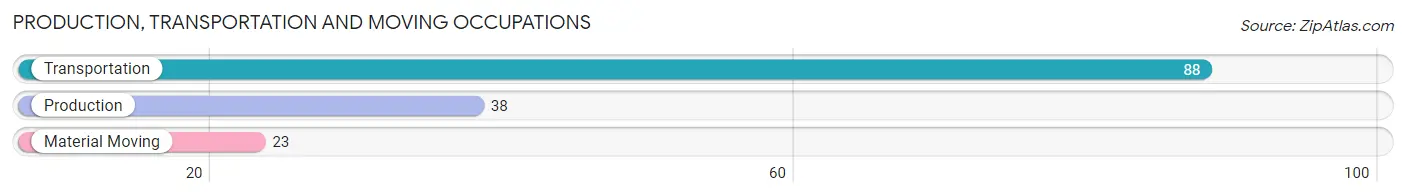
Production, Transportation and Moving Occupations by Sex
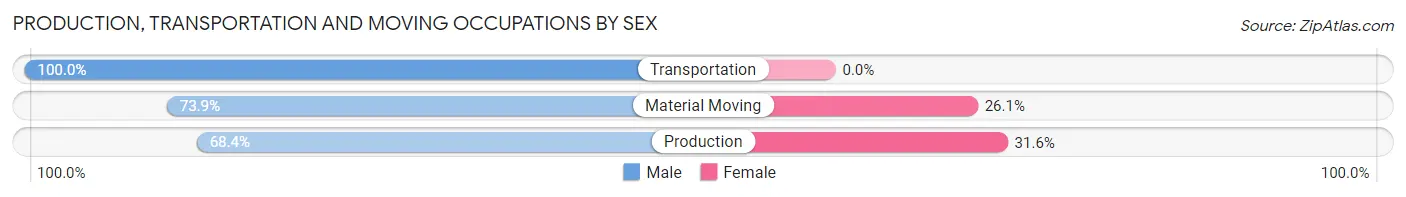
| Occupation | Male | Female |
| Production | 26 (68.4%) | 12 (31.6%) |
| Transportation | 88 (100.0%) | 0 (0.0%) |
| Material Moving | 17 (73.9%) | 6 (26.1%) |
| Total (Category) | 131 (87.9%) | 18 (12.1%) |
| Total (Overall) | 461 (55.6%) | 368 (44.4%) |
Employment Industries by Sex in Hemby Bridge
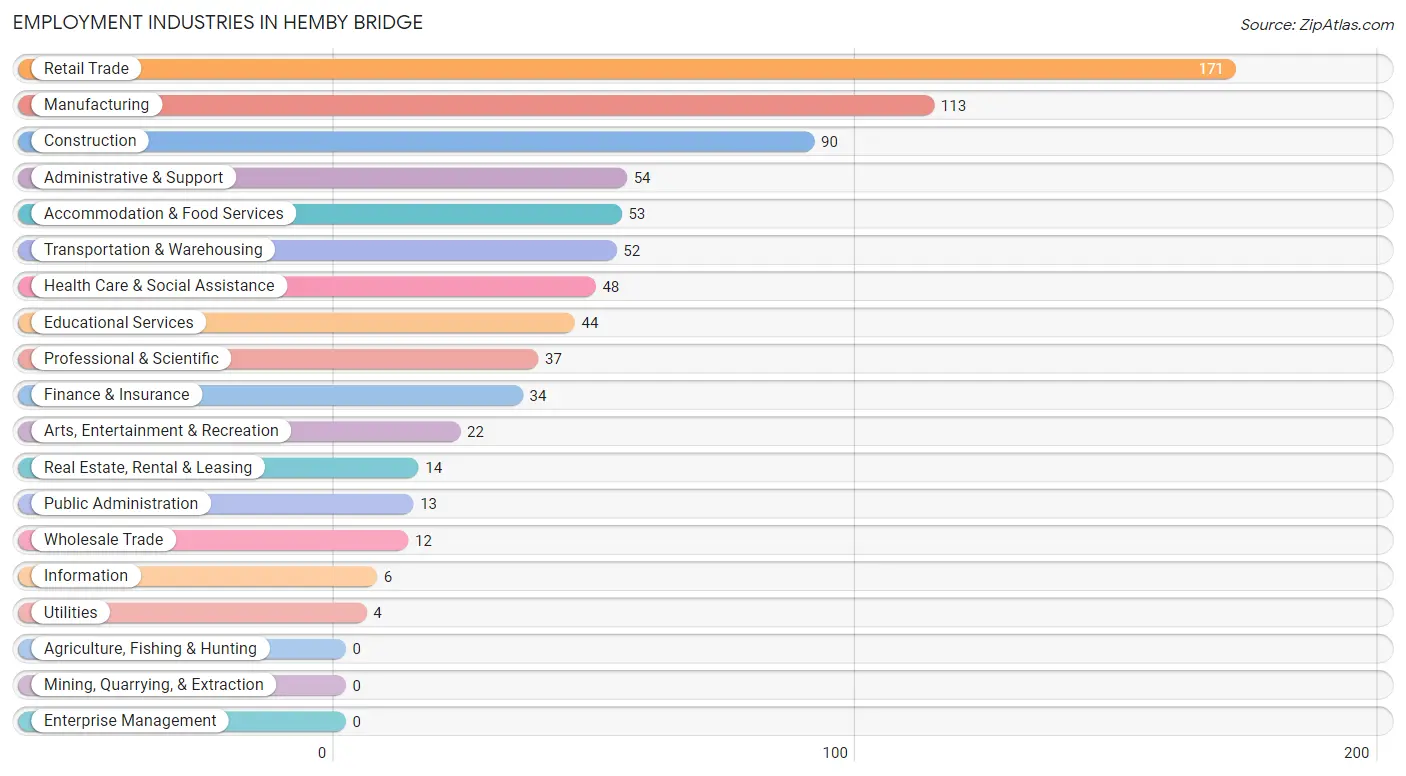
Employment Industries in Hemby Bridge
The major employment industries in Hemby Bridge include Retail Trade (171 | 20.6%), Manufacturing (113 | 13.6%), Construction (90 | 10.9%), Administrative & Support (54 | 6.5%), and Accommodation & Food Services (53 | 6.4%).
Employment Industries by Sex in Hemby Bridge
The Hemby Bridge industries that see more men than women are Transportation & Warehousing (100.0%), Utilities (100.0%), and Information (100.0%), whereas the industries that tend to have a higher number of women are Real Estate, Rental & Leasing (100.0%), Professional & Scientific (94.6%), and Accommodation & Food Services (79.2%).
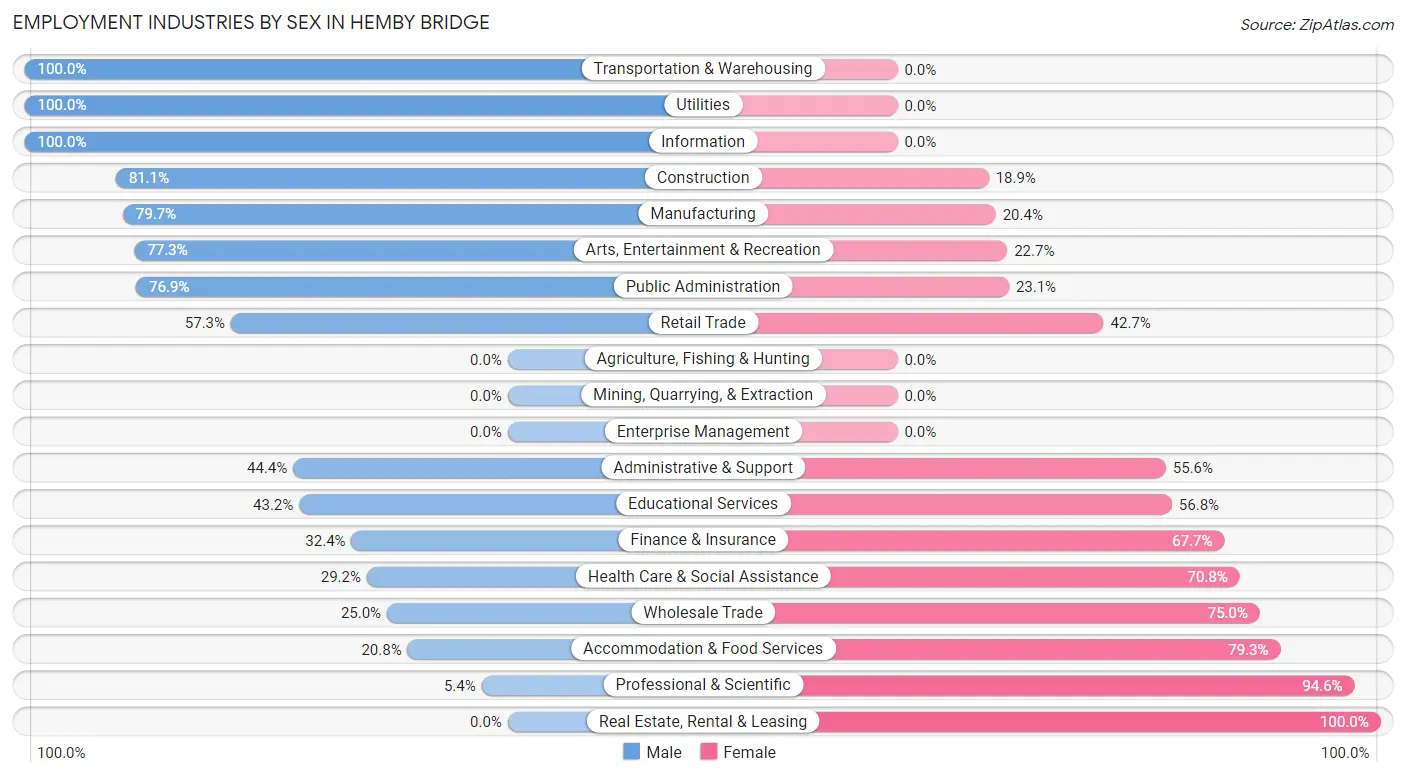
| Industry | Male | Female |
| Agriculture, Fishing & Hunting | 0 (0.0%) | 0 (0.0%) |
| Mining, Quarrying, & Extraction | 0 (0.0%) | 0 (0.0%) |
| Construction | 73 (81.1%) | 17 (18.9%) |
| Manufacturing | 90 (79.6%) | 23 (20.3%) |
| Wholesale Trade | 3 (25.0%) | 9 (75.0%) |
| Retail Trade | 98 (57.3%) | 73 (42.7%) |
| Transportation & Warehousing | 52 (100.0%) | 0 (0.0%) |
| Utilities | 4 (100.0%) | 0 (0.0%) |
| Information | 6 (100.0%) | 0 (0.0%) |
| Finance & Insurance | 11 (32.4%) | 23 (67.6%) |
| Real Estate, Rental & Leasing | 0 (0.0%) | 14 (100.0%) |
| Professional & Scientific | 2 (5.4%) | 35 (94.6%) |
| Enterprise Management | 0 (0.0%) | 0 (0.0%) |
| Administrative & Support | 24 (44.4%) | 30 (55.6%) |
| Educational Services | 19 (43.2%) | 25 (56.8%) |
| Health Care & Social Assistance | 14 (29.2%) | 34 (70.8%) |
| Arts, Entertainment & Recreation | 17 (77.3%) | 5 (22.7%) |
| Accommodation & Food Services | 11 (20.7%) | 42 (79.2%) |
| Public Administration | 10 (76.9%) | 3 (23.1%) |
| Total | 461 (55.6%) | 368 (44.4%) |
Education in Hemby Bridge
School Enrollment in Hemby Bridge
The most common levels of schooling among the 536 students in Hemby Bridge are middle school (144 | 26.9%), high school (132 | 24.6%), and elementary school (109 | 20.3%).
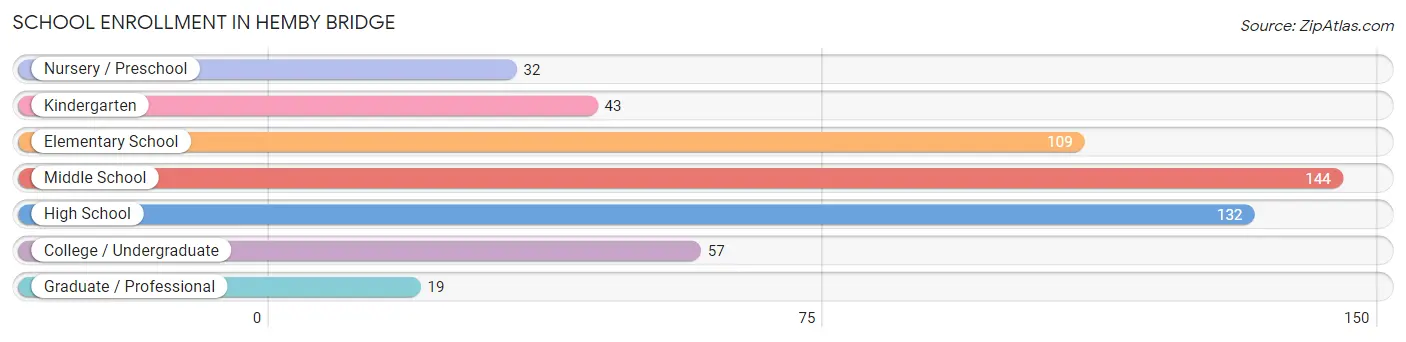
| School Level | # Students | % Students |
| Nursery / Preschool | 32 | 6.0% |
| Kindergarten | 43 | 8.0% |
| Elementary School | 109 | 20.3% |
| Middle School | 144 | 26.9% |
| High School | 132 | 24.6% |
| College / Undergraduate | 57 | 10.6% |
| Graduate / Professional | 19 | 3.5% |
| Total | 536 | 100.0% |
School Enrollment by Age by Funding Source in Hemby Bridge
Out of a total of 536 students who are enrolled in schools in Hemby Bridge, 75 (14.0%) attend a private institution, while the remaining 461 (86.0%) are enrolled in public schools. The age group of 3 to 4 year olds has the highest likelihood of being enrolled in private schools, with 6 (24.0% in the age bracket) enrolled. Conversely, the age group of 18 to 19 year olds has the lowest likelihood of being enrolled in a private school, with 28 (100.0% in the age bracket) attending a public institution.
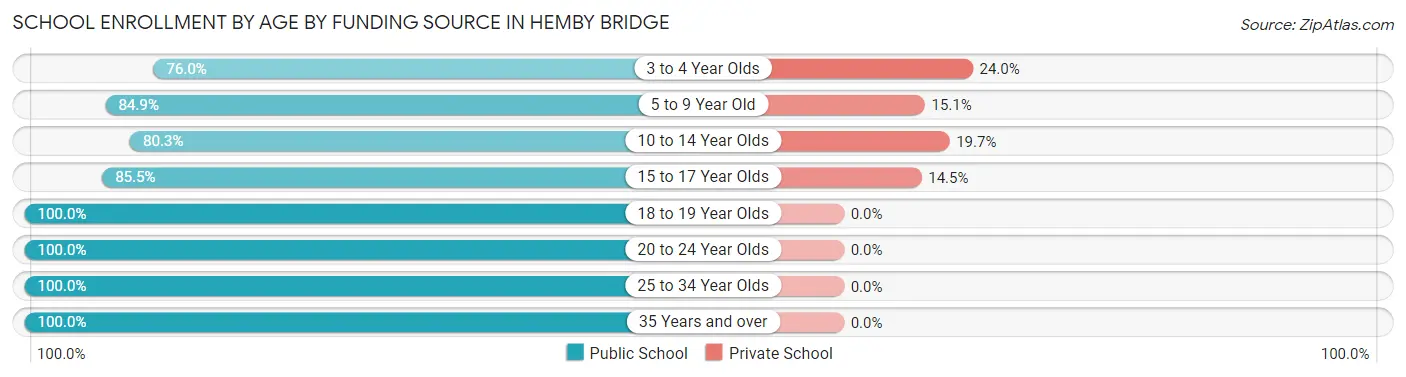
| Age Bracket | Public School | Private School |
| 3 to 4 Year Olds | 19 (76.0%) | 6 (24.0%) |
| 5 to 9 Year Old | 124 (84.9%) | 22 (15.1%) |
| 10 to 14 Year Olds | 143 (80.3%) | 35 (19.7%) |
| 15 to 17 Year Olds | 71 (85.5%) | 12 (14.5%) |
| 18 to 19 Year Olds | 28 (100.0%) | 0 (0.0%) |
| 20 to 24 Year Olds | 17 (100.0%) | 0 (0.0%) |
| 25 to 34 Year Olds | 42 (100.0%) | 0 (0.0%) |
| 35 Years and over | 17 (100.0%) | 0 (0.0%) |
| Total | 461 (86.0%) | 75 (14.0%) |
Educational Attainment by Field of Study in Hemby Bridge
Business (66 | 21.0%), education (58 | 18.5%), science & technology (49 | 15.6%), arts & humanities (48 | 15.3%), and engineering (22 | 7.0%) are the most common fields of study among 314 individuals in Hemby Bridge who have obtained a bachelor's degree or higher.
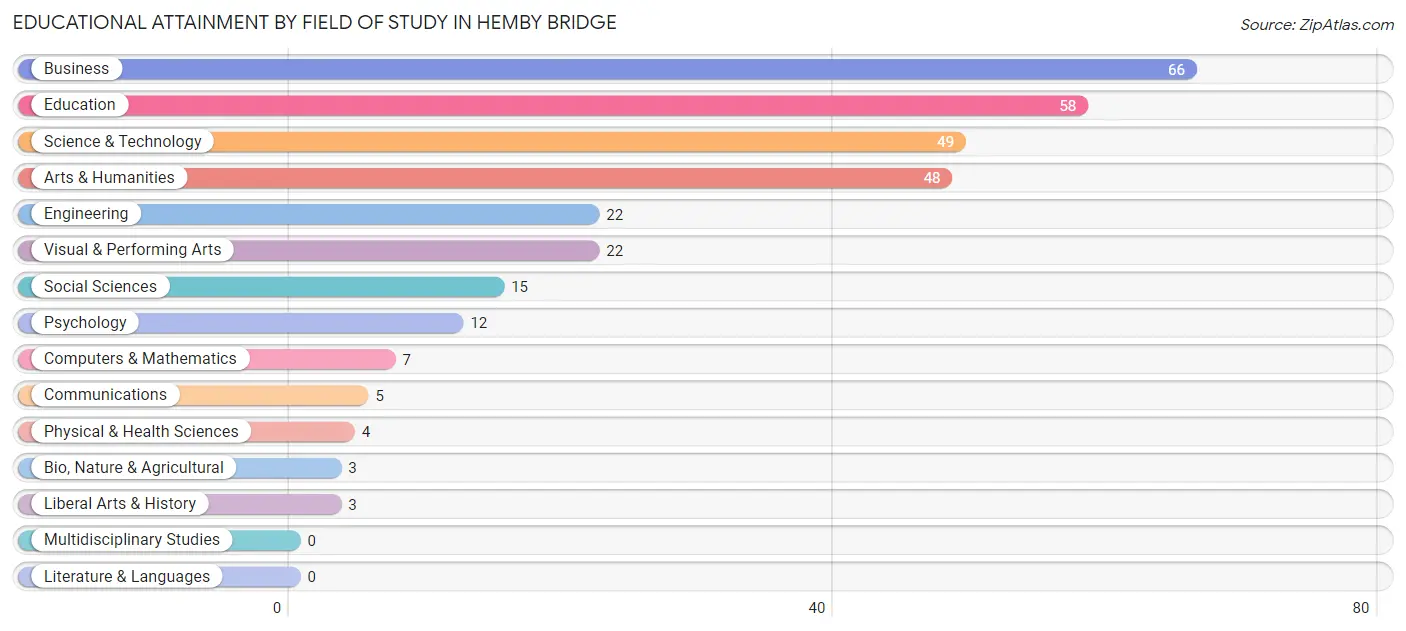
| Field of Study | # Graduates | % Graduates |
| Computers & Mathematics | 7 | 2.2% |
| Bio, Nature & Agricultural | 3 | 1.0% |
| Physical & Health Sciences | 4 | 1.3% |
| Psychology | 12 | 3.8% |
| Social Sciences | 15 | 4.8% |
| Engineering | 22 | 7.0% |
| Multidisciplinary Studies | 0 | 0.0% |
| Science & Technology | 49 | 15.6% |
| Business | 66 | 21.0% |
| Education | 58 | 18.5% |
| Literature & Languages | 0 | 0.0% |
| Liberal Arts & History | 3 | 1.0% |
| Visual & Performing Arts | 22 | 7.0% |
| Communications | 5 | 1.6% |
| Arts & Humanities | 48 | 15.3% |
| Total | 314 | 100.0% |
Transportation & Commute in Hemby Bridge
Vehicle Availability by Sex in Hemby Bridge
The most prevalent vehicle ownership categories in Hemby Bridge are males with 2 vehicles (264, accounting for 58.2%) and females with 2 vehicles (195, making up 73.5%).
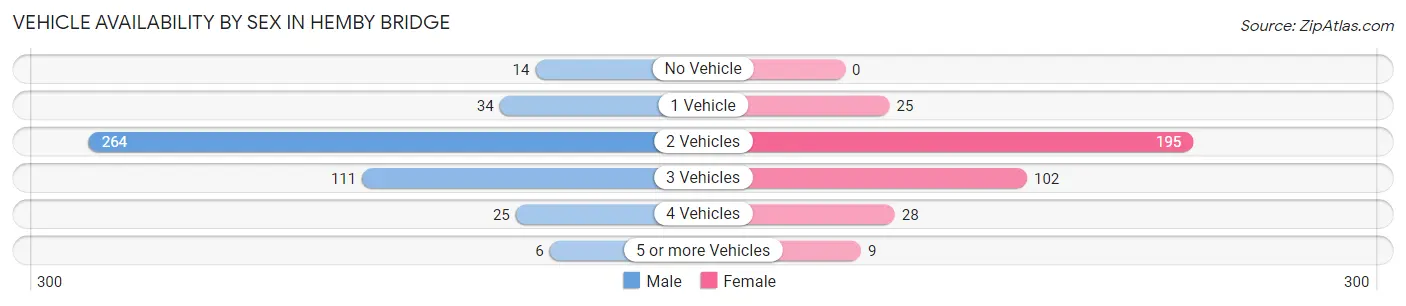
| Vehicles Available | Male | Female |
| No Vehicle | 14 (3.1%) | 0 (0.0%) |
| 1 Vehicle | 34 (7.5%) | 25 (7.0%) |
| 2 Vehicles | 264 (58.2%) | 195 (54.3%) |
| 3 Vehicles | 111 (24.4%) | 102 (28.4%) |
| 4 Vehicles | 25 (5.5%) | 28 (7.8%) |
| 5 or more Vehicles | 6 (1.3%) | 9 (2.5%) |
| Total | 454 (100.0%) | 359 (100.0%) |
Commute Time in Hemby Bridge
The most frequently occuring commute durations in Hemby Bridge are 20 to 24 minutes (134 commuters, 18.6%), 15 to 19 minutes (130 commuters, 18.1%), and 25 to 29 minutes (86 commuters, 11.9%).
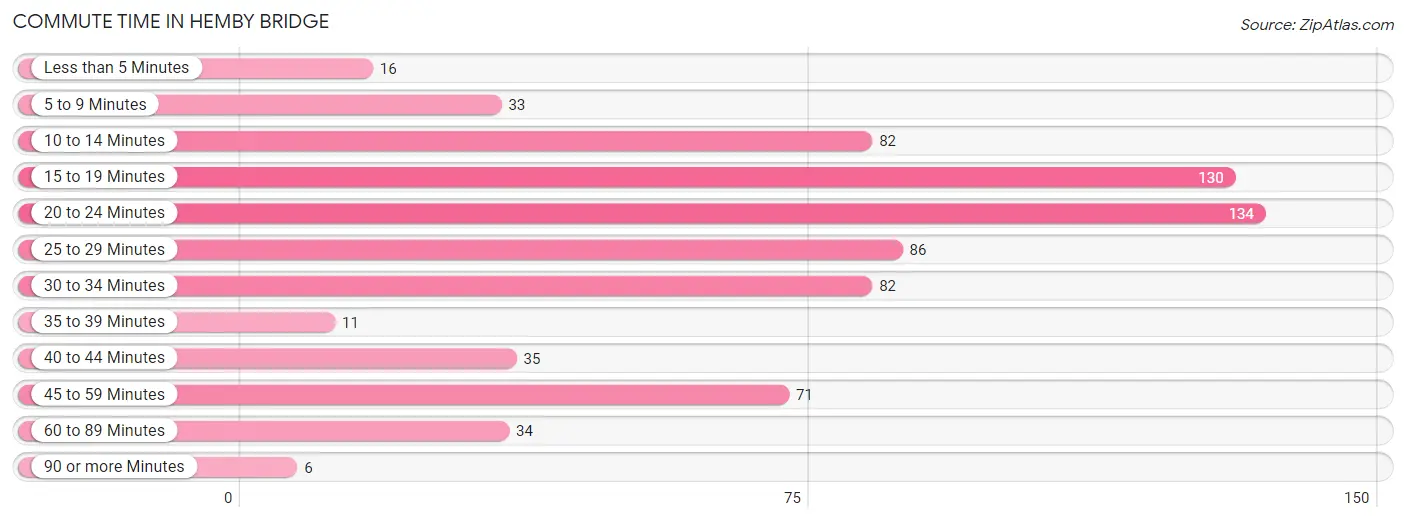
| Commute Time | # Commuters | % Commuters |
| Less than 5 Minutes | 16 | 2.2% |
| 5 to 9 Minutes | 33 | 4.6% |
| 10 to 14 Minutes | 82 | 11.4% |
| 15 to 19 Minutes | 130 | 18.1% |
| 20 to 24 Minutes | 134 | 18.6% |
| 25 to 29 Minutes | 86 | 11.9% |
| 30 to 34 Minutes | 82 | 11.4% |
| 35 to 39 Minutes | 11 | 1.5% |
| 40 to 44 Minutes | 35 | 4.9% |
| 45 to 59 Minutes | 71 | 9.9% |
| 60 to 89 Minutes | 34 | 4.7% |
| 90 or more Minutes | 6 | 0.8% |
Commute Time by Sex in Hemby Bridge
The most common commute times in Hemby Bridge are 20 to 24 minutes (85 commuters, 21.0%) for males and 15 to 19 minutes (56 commuters, 17.7%) for females.
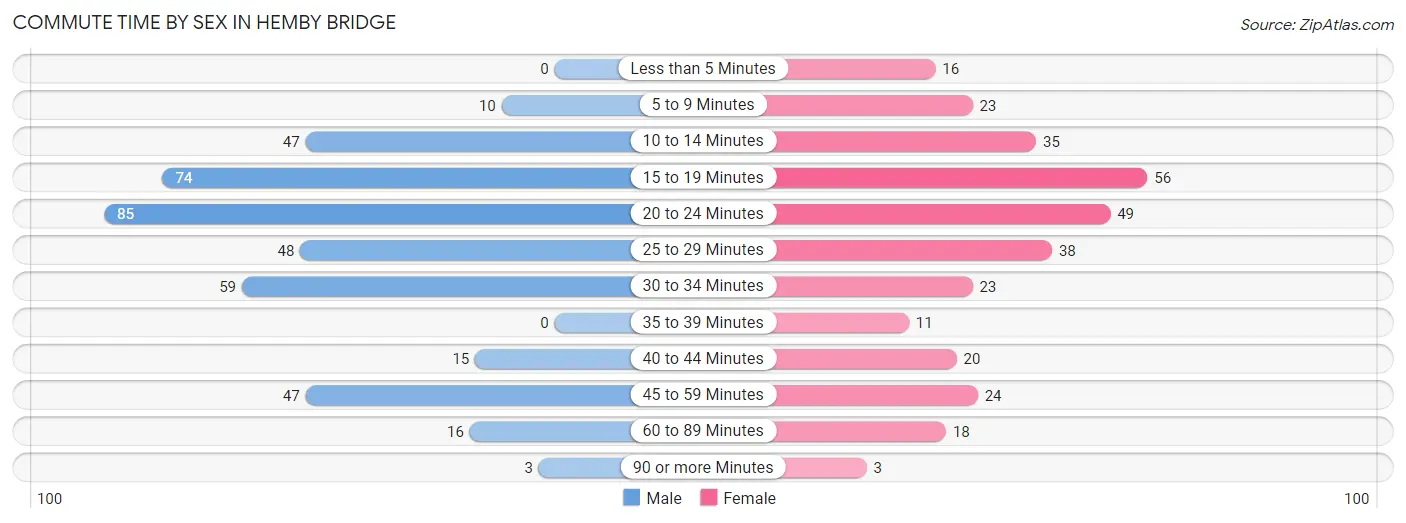
| Commute Time | Male | Female |
| Less than 5 Minutes | 0 (0.0%) | 16 (5.1%) |
| 5 to 9 Minutes | 10 (2.5%) | 23 (7.3%) |
| 10 to 14 Minutes | 47 (11.6%) | 35 (11.1%) |
| 15 to 19 Minutes | 74 (18.3%) | 56 (17.7%) |
| 20 to 24 Minutes | 85 (21.0%) | 49 (15.5%) |
| 25 to 29 Minutes | 48 (11.9%) | 38 (12.0%) |
| 30 to 34 Minutes | 59 (14.6%) | 23 (7.3%) |
| 35 to 39 Minutes | 0 (0.0%) | 11 (3.5%) |
| 40 to 44 Minutes | 15 (3.7%) | 20 (6.3%) |
| 45 to 59 Minutes | 47 (11.6%) | 24 (7.6%) |
| 60 to 89 Minutes | 16 (4.0%) | 18 (5.7%) |
| 90 or more Minutes | 3 (0.7%) | 3 (0.9%) |
Time of Departure to Work by Sex in Hemby Bridge
The most frequent times of departure to work in Hemby Bridge are 12:00 AM to 4:59 AM (52, 12.9%) for males and 7:00 AM to 7:29 AM (74, 23.4%) for females.
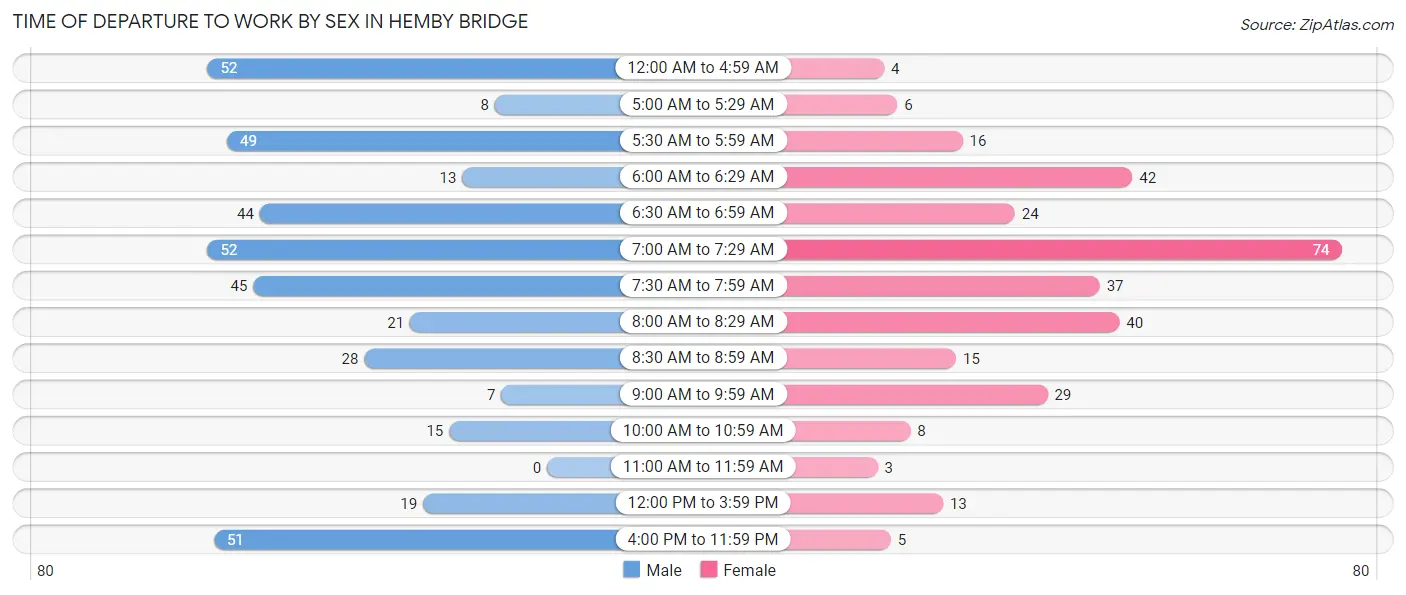
| Time of Departure | Male | Female |
| 12:00 AM to 4:59 AM | 52 (12.9%) | 4 (1.3%) |
| 5:00 AM to 5:29 AM | 8 (2.0%) | 6 (1.9%) |
| 5:30 AM to 5:59 AM | 49 (12.1%) | 16 (5.1%) |
| 6:00 AM to 6:29 AM | 13 (3.2%) | 42 (13.3%) |
| 6:30 AM to 6:59 AM | 44 (10.9%) | 24 (7.6%) |
| 7:00 AM to 7:29 AM | 52 (12.9%) | 74 (23.4%) |
| 7:30 AM to 7:59 AM | 45 (11.1%) | 37 (11.7%) |
| 8:00 AM to 8:29 AM | 21 (5.2%) | 40 (12.7%) |
| 8:30 AM to 8:59 AM | 28 (6.9%) | 15 (4.8%) |
| 9:00 AM to 9:59 AM | 7 (1.7%) | 29 (9.2%) |
| 10:00 AM to 10:59 AM | 15 (3.7%) | 8 (2.5%) |
| 11:00 AM to 11:59 AM | 0 (0.0%) | 3 (0.9%) |
| 12:00 PM to 3:59 PM | 19 (4.7%) | 13 (4.1%) |
| 4:00 PM to 11:59 PM | 51 (12.6%) | 5 (1.6%) |
| Total | 404 (100.0%) | 316 (100.0%) |
Housing Occupancy in Hemby Bridge
Occupancy by Ownership in Hemby Bridge
Of the total 729 dwellings in Hemby Bridge, owner-occupied units account for 584 (80.1%), while renter-occupied units make up 145 (19.9%).
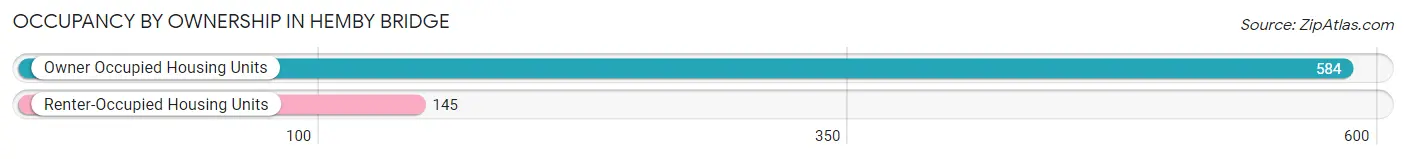
| Occupancy | # Housing Units | % Housing Units |
| Owner Occupied Housing Units | 584 | 80.1% |
| Renter-Occupied Housing Units | 145 | 19.9% |
| Total Occupied Housing Units | 729 | 100.0% |
Occupancy by Household Size in Hemby Bridge
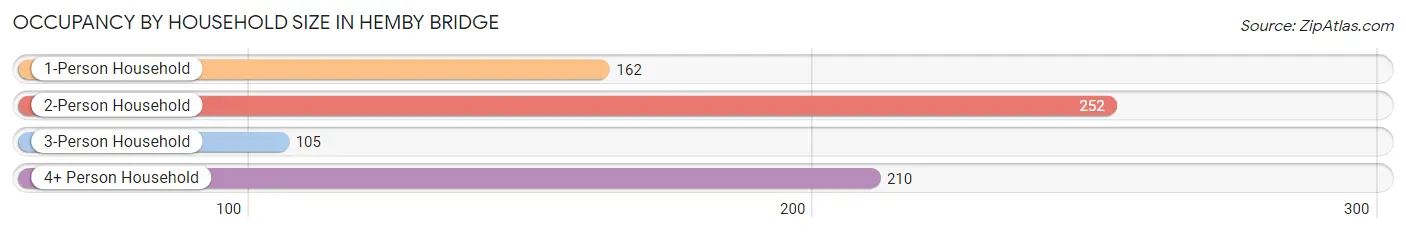
| Household Size | # Housing Units | % Housing Units |
| 1-Person Household | 162 | 22.2% |
| 2-Person Household | 252 | 34.6% |
| 3-Person Household | 105 | 14.4% |
| 4+ Person Household | 210 | 28.8% |
| Total Housing Units | 729 | 100.0% |
Occupancy by Ownership by Household Size in Hemby Bridge
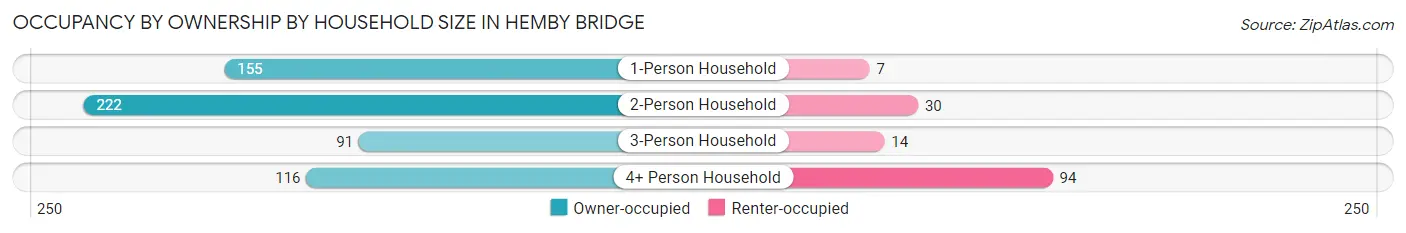
| Household Size | Owner-occupied | Renter-occupied |
| 1-Person Household | 155 (95.7%) | 7 (4.3%) |
| 2-Person Household | 222 (88.1%) | 30 (11.9%) |
| 3-Person Household | 91 (86.7%) | 14 (13.3%) |
| 4+ Person Household | 116 (55.2%) | 94 (44.8%) |
| Total Housing Units | 584 (80.1%) | 145 (19.9%) |
Occupancy by Educational Attainment in Hemby Bridge
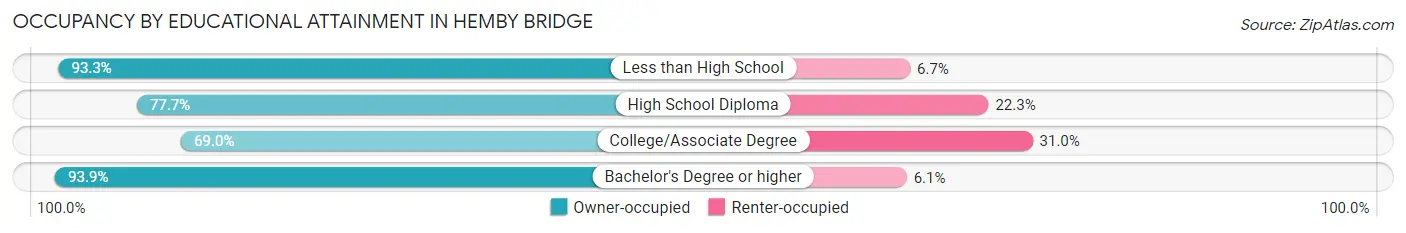
| Household Size | Owner-occupied | Renter-occupied |
| Less than High School | 111 (93.3%) | 8 (6.7%) |
| High School Diploma | 171 (77.7%) | 49 (22.3%) |
| College/Associate Degree | 178 (69.0%) | 80 (31.0%) |
| Bachelor's Degree or higher | 124 (93.9%) | 8 (6.1%) |
Occupancy by Age of Householder in Hemby Bridge
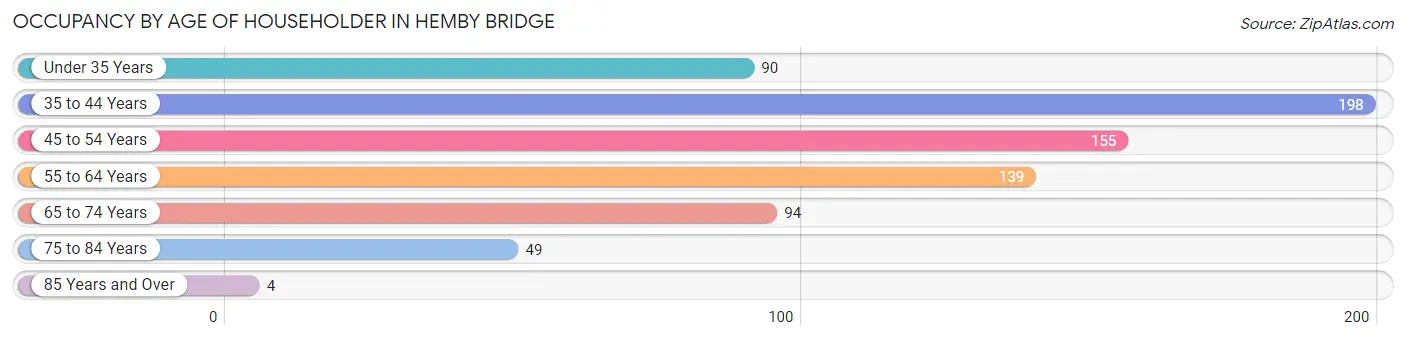
| Age Bracket | # Households | % Households |
| Under 35 Years | 90 | 12.3% |
| 35 to 44 Years | 198 | 27.2% |
| 45 to 54 Years | 155 | 21.3% |
| 55 to 64 Years | 139 | 19.1% |
| 65 to 74 Years | 94 | 12.9% |
| 75 to 84 Years | 49 | 6.7% |
| 85 Years and Over | 4 | 0.5% |
| Total | 729 | 100.0% |
Housing Finances in Hemby Bridge
Median Income by Occupancy in Hemby Bridge
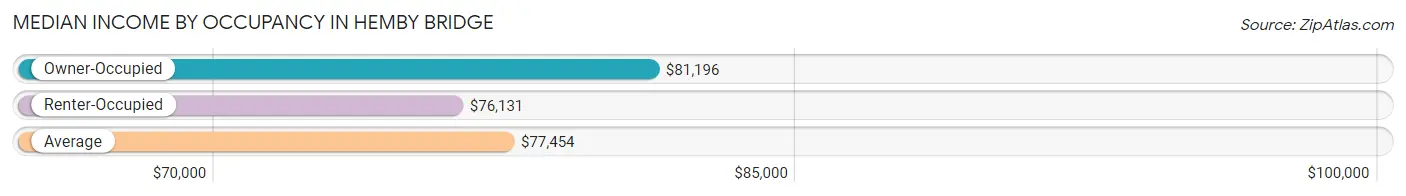
| Occupancy Type | # Households | Median Income |
| Owner-Occupied | 584 (80.1%) | $81,196 |
| Renter-Occupied | 145 (19.9%) | $76,131 |
| Average | 729 (100.0%) | $77,454 |
Occupancy by Householder Income Bracket in Hemby Bridge
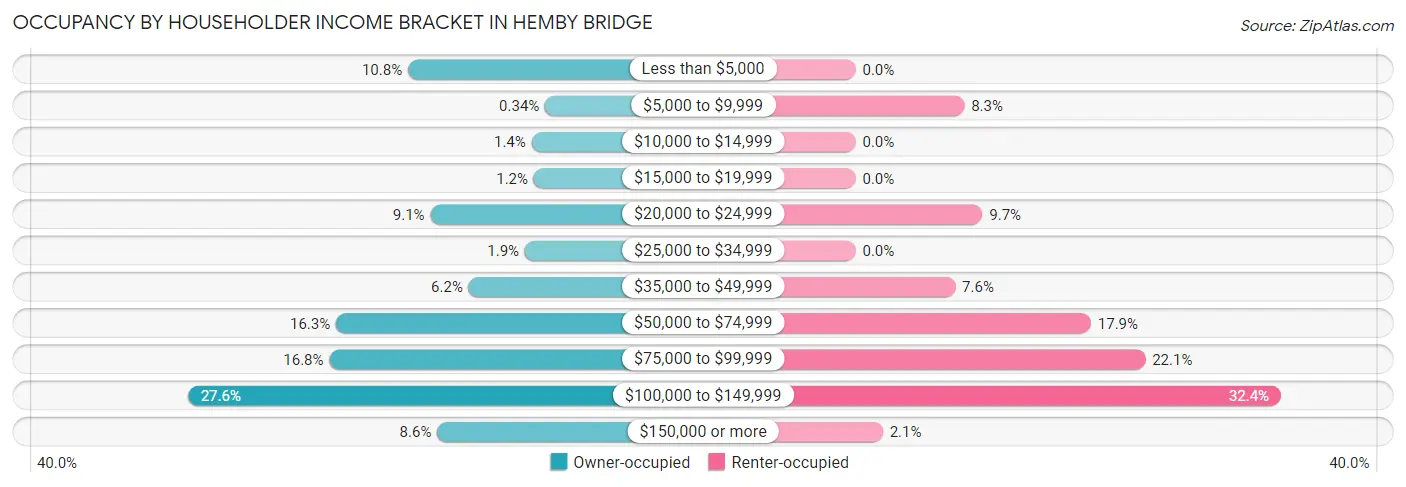
| Income Bracket | Owner-occupied | Renter-occupied |
| Less than $5,000 | 63 (10.8%) | 0 (0.0%) |
| $5,000 to $9,999 | 2 (0.3%) | 12 (8.3%) |
| $10,000 to $14,999 | 8 (1.4%) | 0 (0.0%) |
| $15,000 to $19,999 | 7 (1.2%) | 0 (0.0%) |
| $20,000 to $24,999 | 53 (9.1%) | 14 (9.7%) |
| $25,000 to $34,999 | 11 (1.9%) | 0 (0.0%) |
| $35,000 to $49,999 | 36 (6.2%) | 11 (7.6%) |
| $50,000 to $74,999 | 95 (16.3%) | 26 (17.9%) |
| $75,000 to $99,999 | 98 (16.8%) | 32 (22.1%) |
| $100,000 to $149,999 | 161 (27.6%) | 47 (32.4%) |
| $150,000 or more | 50 (8.6%) | 3 (2.1%) |
| Total | 584 (100.0%) | 145 (100.0%) |
Monthly Housing Cost Tiers in Hemby Bridge
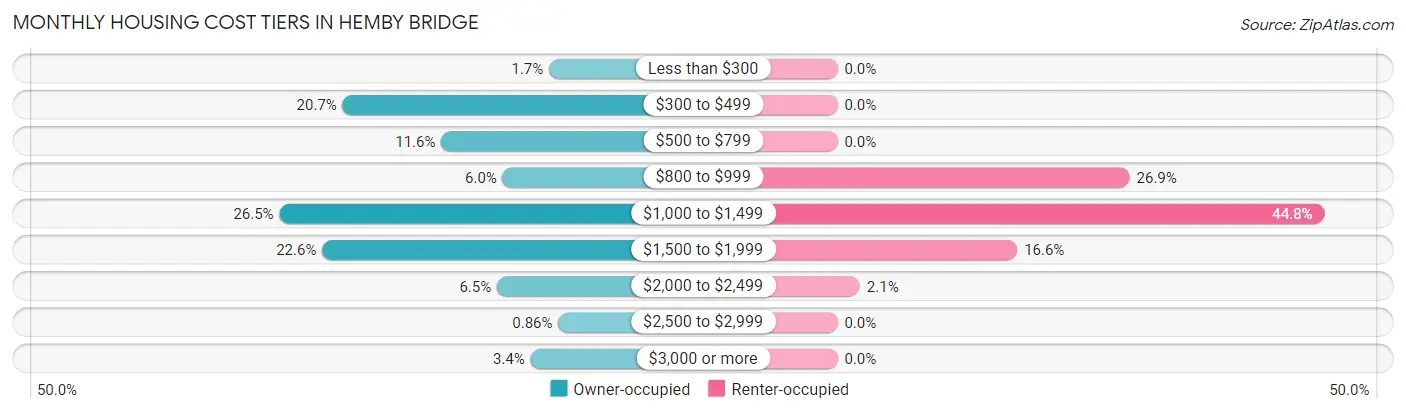
| Monthly Cost | Owner-occupied | Renter-occupied |
| Less than $300 | 10 (1.7%) | 0 (0.0%) |
| $300 to $499 | 121 (20.7%) | 0 (0.0%) |
| $500 to $799 | 68 (11.6%) | 0 (0.0%) |
| $800 to $999 | 35 (6.0%) | 39 (26.9%) |
| $1,000 to $1,499 | 155 (26.5%) | 65 (44.8%) |
| $1,500 to $1,999 | 132 (22.6%) | 24 (16.6%) |
| $2,000 to $2,499 | 38 (6.5%) | 3 (2.1%) |
| $2,500 to $2,999 | 5 (0.9%) | 0 (0.0%) |
| $3,000 or more | 20 (3.4%) | 0 (0.0%) |
| Total | 584 (100.0%) | 145 (100.0%) |
Physical Housing Characteristics in Hemby Bridge
Housing Structures in Hemby Bridge
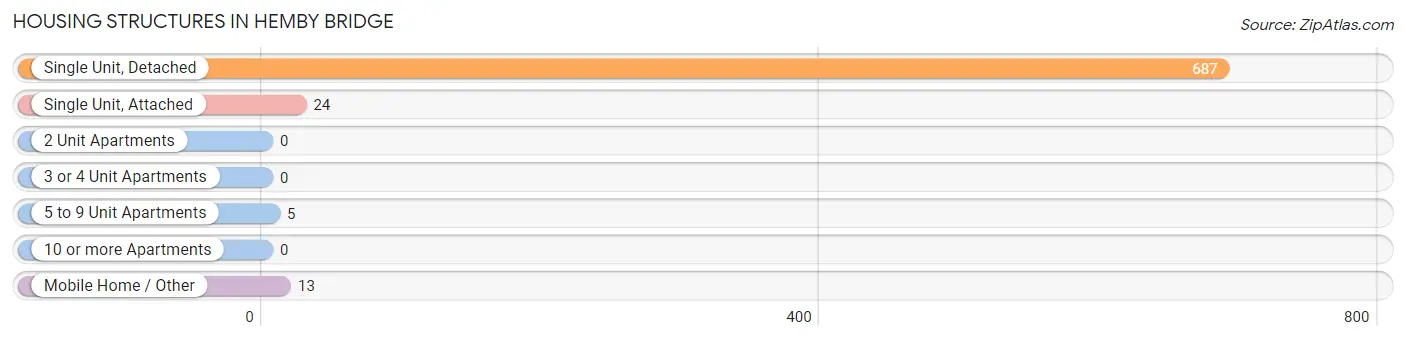
| Structure Type | # Housing Units | % Housing Units |
| Single Unit, Detached | 687 | 94.2% |
| Single Unit, Attached | 24 | 3.3% |
| 2 Unit Apartments | 0 | 0.0% |
| 3 or 4 Unit Apartments | 0 | 0.0% |
| 5 to 9 Unit Apartments | 5 | 0.7% |
| 10 or more Apartments | 0 | 0.0% |
| Mobile Home / Other | 13 | 1.8% |
| Total | 729 | 100.0% |
Housing Structures by Occupancy in Hemby Bridge
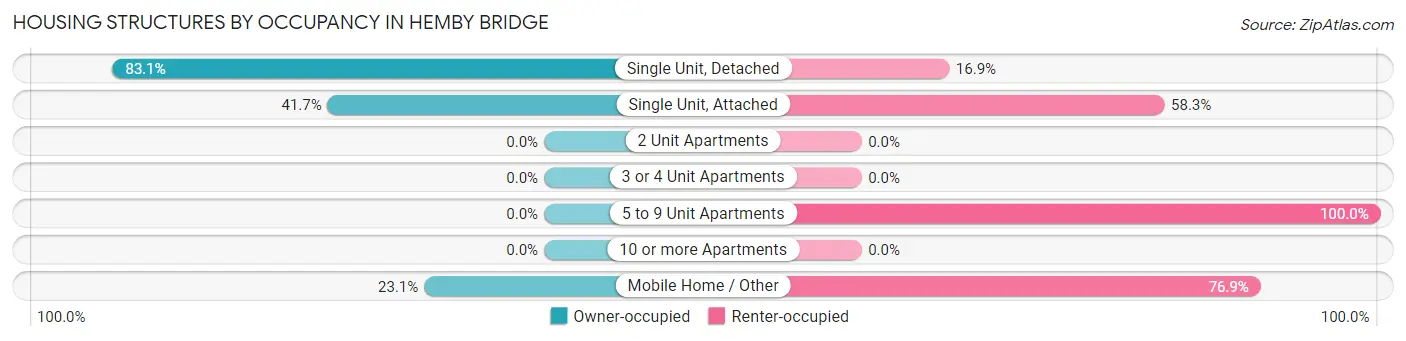
| Structure Type | Owner-occupied | Renter-occupied |
| Single Unit, Detached | 571 (83.1%) | 116 (16.9%) |
| Single Unit, Attached | 10 (41.7%) | 14 (58.3%) |
| 2 Unit Apartments | 0 (0.0%) | 0 (0.0%) |
| 3 or 4 Unit Apartments | 0 (0.0%) | 0 (0.0%) |
| 5 to 9 Unit Apartments | 0 (0.0%) | 5 (100.0%) |
| 10 or more Apartments | 0 (0.0%) | 0 (0.0%) |
| Mobile Home / Other | 3 (23.1%) | 10 (76.9%) |
| Total | 584 (80.1%) | 145 (19.9%) |
Housing Structures by Number of Rooms in Hemby Bridge
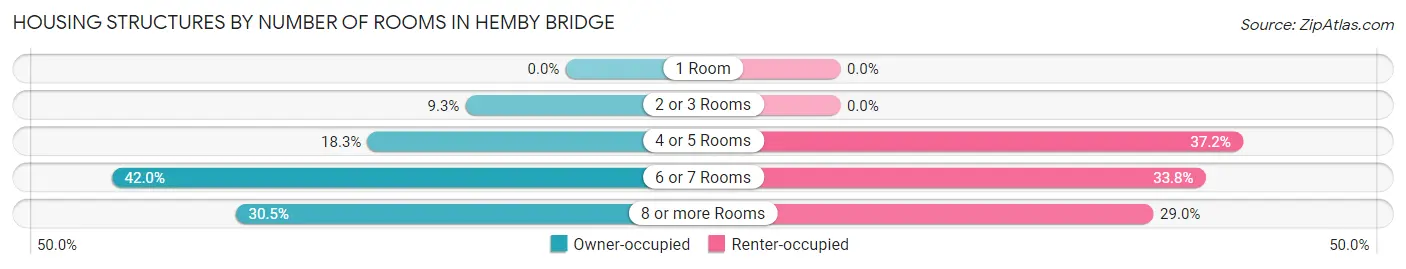
| Number of Rooms | Owner-occupied | Renter-occupied |
| 1 Room | 0 (0.0%) | 0 (0.0%) |
| 2 or 3 Rooms | 54 (9.2%) | 0 (0.0%) |
| 4 or 5 Rooms | 107 (18.3%) | 54 (37.2%) |
| 6 or 7 Rooms | 245 (41.9%) | 49 (33.8%) |
| 8 or more Rooms | 178 (30.5%) | 42 (29.0%) |
| Total | 584 (100.0%) | 145 (100.0%) |
Housing Structure by Heating Type in Hemby Bridge
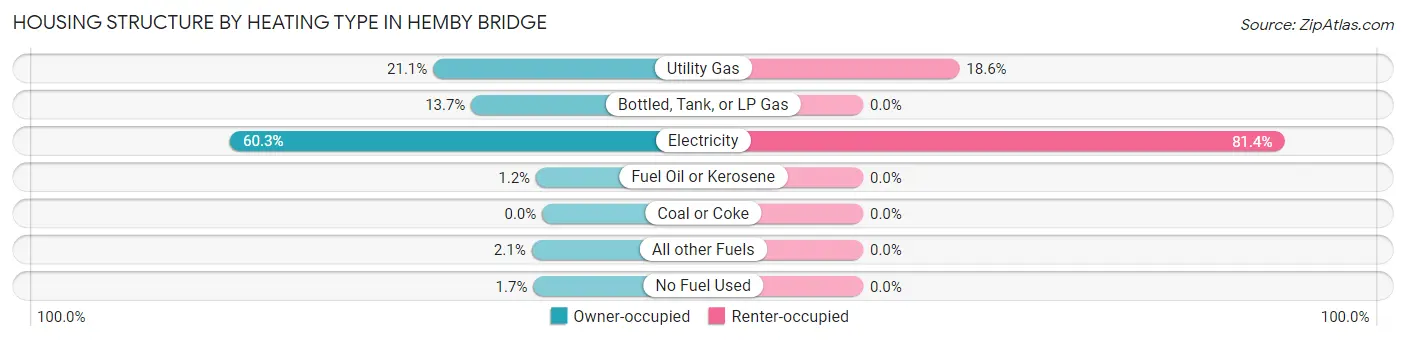
| Heating Type | Owner-occupied | Renter-occupied |
| Utility Gas | 123 (21.1%) | 27 (18.6%) |
| Bottled, Tank, or LP Gas | 80 (13.7%) | 0 (0.0%) |
| Electricity | 352 (60.3%) | 118 (81.4%) |
| Fuel Oil or Kerosene | 7 (1.2%) | 0 (0.0%) |
| Coal or Coke | 0 (0.0%) | 0 (0.0%) |
| All other Fuels | 12 (2.1%) | 0 (0.0%) |
| No Fuel Used | 10 (1.7%) | 0 (0.0%) |
| Total | 584 (100.0%) | 145 (100.0%) |
Household Vehicle Usage in Hemby Bridge
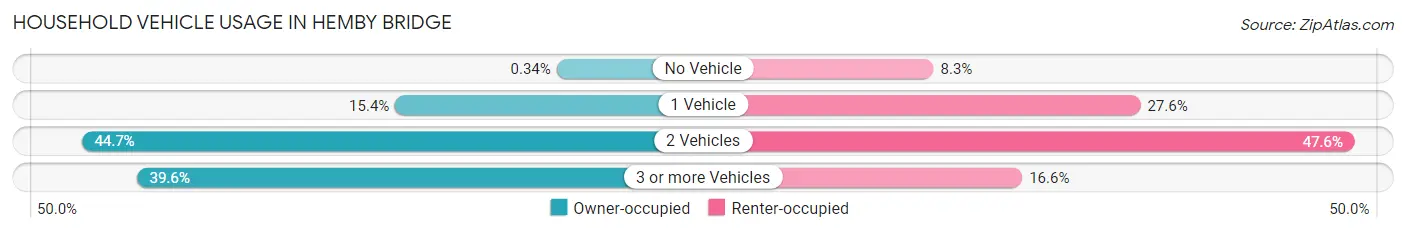
| Vehicles per Household | Owner-occupied | Renter-occupied |
| No Vehicle | 2 (0.3%) | 12 (8.3%) |
| 1 Vehicle | 90 (15.4%) | 40 (27.6%) |
| 2 Vehicles | 261 (44.7%) | 69 (47.6%) |
| 3 or more Vehicles | 231 (39.6%) | 24 (16.6%) |
| Total | 584 (100.0%) | 145 (100.0%) |
Real Estate & Mortgages in Hemby Bridge
Real Estate and Mortgage Overview in Hemby Bridge
| Characteristic | Without Mortgage | With Mortgage |
| Housing Units | 159 | 425 |
| Median Property Value | $204,600 | $227,500 |
| Median Household Income | $53,750 | $30 |
| Monthly Housing Costs | $389 | $20 |
| Real Estate Taxes | $1,089 | $10 |
Property Value by Mortgage Status in Hemby Bridge
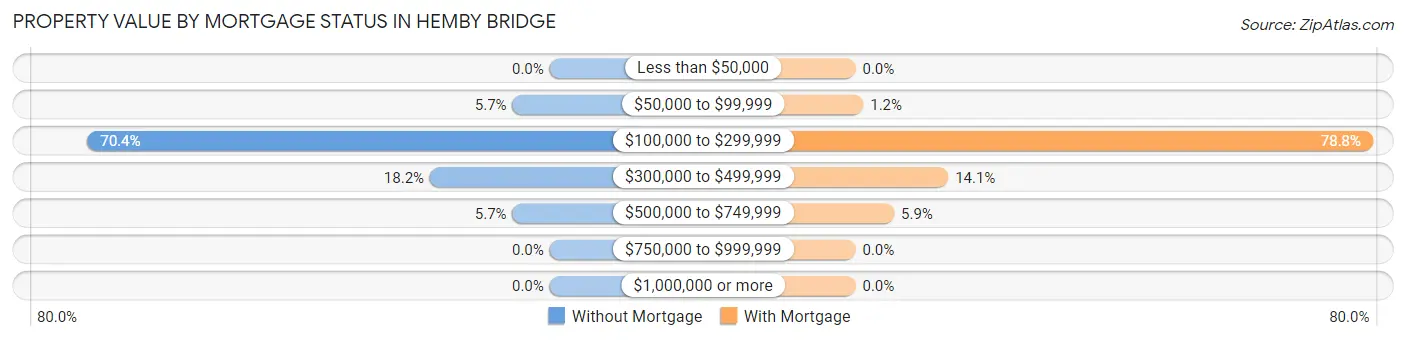
| Property Value | Without Mortgage | With Mortgage |
| Less than $50,000 | 0 (0.0%) | 0 (0.0%) |
| $50,000 to $99,999 | 9 (5.7%) | 5 (1.2%) |
| $100,000 to $299,999 | 112 (70.4%) | 335 (78.8%) |
| $300,000 to $499,999 | 29 (18.2%) | 60 (14.1%) |
| $500,000 to $749,999 | 9 (5.7%) | 25 (5.9%) |
| $750,000 to $999,999 | 0 (0.0%) | 0 (0.0%) |
| $1,000,000 or more | 0 (0.0%) | 0 (0.0%) |
| Total | 159 (100.0%) | 425 (100.0%) |
Household Income by Mortgage Status in Hemby Bridge
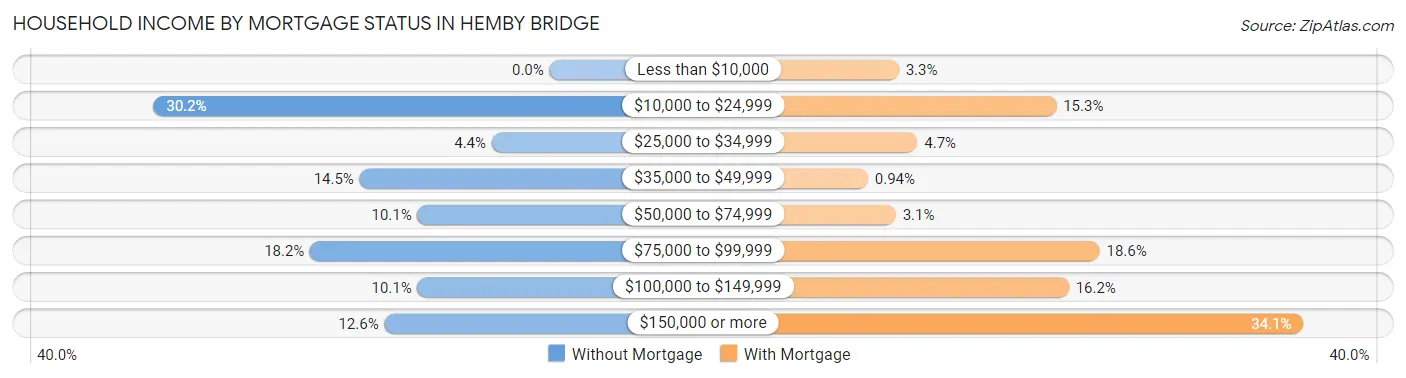
| Household Income | Without Mortgage | With Mortgage |
| Less than $10,000 | 0 (0.0%) | 14 (3.3%) |
| $10,000 to $24,999 | 48 (30.2%) | 65 (15.3%) |
| $25,000 to $34,999 | 7 (4.4%) | 20 (4.7%) |
| $35,000 to $49,999 | 23 (14.5%) | 4 (0.9%) |
| $50,000 to $74,999 | 16 (10.1%) | 13 (3.1%) |
| $75,000 to $99,999 | 29 (18.2%) | 79 (18.6%) |
| $100,000 to $149,999 | 16 (10.1%) | 69 (16.2%) |
| $150,000 or more | 20 (12.6%) | 145 (34.1%) |
| Total | 159 (100.0%) | 425 (100.0%) |
Property Value to Household Income Ratio in Hemby Bridge
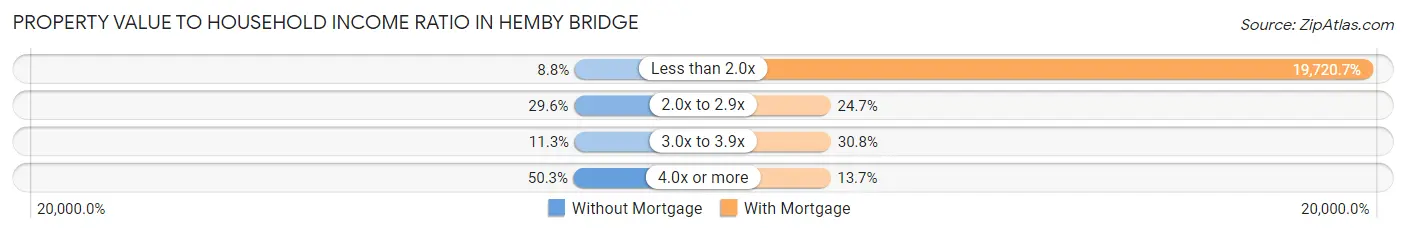
| Value-to-Income Ratio | Without Mortgage | With Mortgage |
| Less than 2.0x | 14 (8.8%) | 83,813 (19,720.7%) |
| 2.0x to 2.9x | 47 (29.6%) | 105 (24.7%) |
| 3.0x to 3.9x | 18 (11.3%) | 131 (30.8%) |
| 4.0x or more | 80 (50.3%) | 58 (13.7%) |
| Total | 159 (100.0%) | 425 (100.0%) |
Real Estate Taxes by Mortgage Status in Hemby Bridge
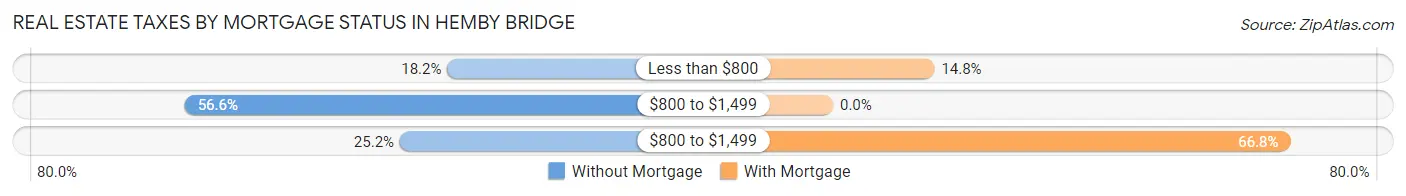
| Property Taxes | Without Mortgage | With Mortgage |
| Less than $800 | 29 (18.2%) | 63 (14.8%) |
| $800 to $1,499 | 90 (56.6%) | 0 (0.0%) |
| $800 to $1,499 | 40 (25.2%) | 284 (66.8%) |
| Total | 159 (100.0%) | 425 (100.0%) |
Health & Disability in Hemby Bridge
Health Insurance Coverage by Age in Hemby Bridge
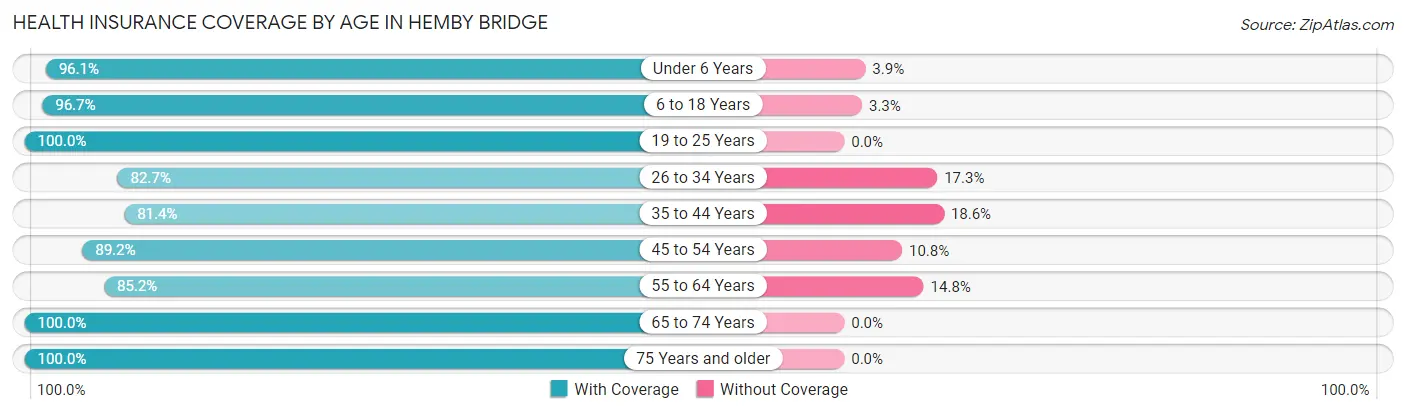
| Age Bracket | With Coverage | Without Coverage |
| Under 6 Years | 122 (96.1%) | 5 (3.9%) |
| 6 to 18 Years | 409 (96.7%) | 14 (3.3%) |
| 19 to 25 Years | 64 (100.0%) | 0 (0.0%) |
| 26 to 34 Years | 167 (82.7%) | 35 (17.3%) |
| 35 to 44 Years | 263 (81.4%) | 60 (18.6%) |
| 45 to 54 Years | 265 (89.2%) | 32 (10.8%) |
| 55 to 64 Years | 190 (85.2%) | 33 (14.8%) |
| 65 to 74 Years | 165 (100.0%) | 0 (0.0%) |
| 75 Years and older | 100 (100.0%) | 0 (0.0%) |
| Total | 1,745 (90.7%) | 179 (9.3%) |
Health Insurance Coverage by Citizenship Status in Hemby Bridge
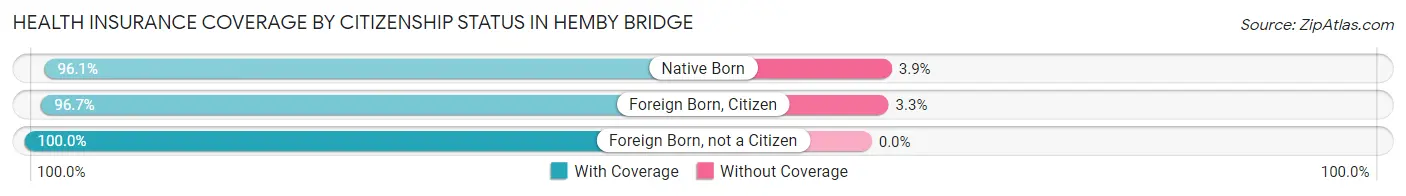
| Citizenship Status | With Coverage | Without Coverage |
| Native Born | 122 (96.1%) | 5 (3.9%) |
| Foreign Born, Citizen | 409 (96.7%) | 14 (3.3%) |
| Foreign Born, not a Citizen | 64 (100.0%) | 0 (0.0%) |
Health Insurance Coverage by Household Income in Hemby Bridge
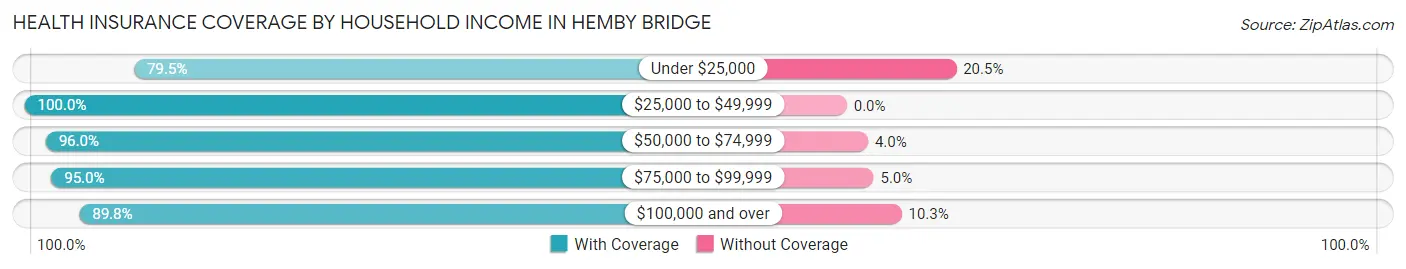
| Household Income | With Coverage | Without Coverage |
| Under $25,000 | 252 (79.5%) | 65 (20.5%) |
| $25,000 to $49,999 | 115 (100.0%) | 0 (0.0%) |
| $50,000 to $74,999 | 291 (96.0%) | 12 (4.0%) |
| $75,000 to $99,999 | 360 (95.0%) | 19 (5.0%) |
| $100,000 and over | 727 (89.7%) | 83 (10.2%) |
Public vs Private Health Insurance Coverage by Age in Hemby Bridge
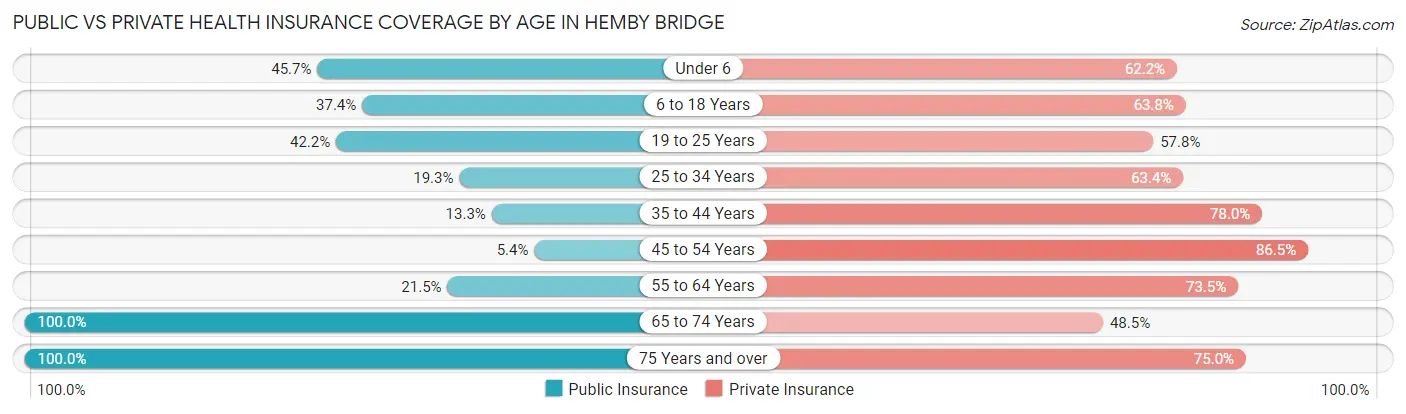
| Age Bracket | Public Insurance | Private Insurance |
| Under 6 | 58 (45.7%) | 79 (62.2%) |
| 6 to 18 Years | 158 (37.3%) | 270 (63.8%) |
| 19 to 25 Years | 27 (42.2%) | 37 (57.8%) |
| 25 to 34 Years | 39 (19.3%) | 128 (63.4%) |
| 35 to 44 Years | 43 (13.3%) | 252 (78.0%) |
| 45 to 54 Years | 16 (5.4%) | 257 (86.5%) |
| 55 to 64 Years | 48 (21.5%) | 164 (73.5%) |
| 65 to 74 Years | 165 (100.0%) | 80 (48.5%) |
| 75 Years and over | 100 (100.0%) | 75 (75.0%) |
| Total | 654 (34.0%) | 1,342 (69.8%) |
Disability Status by Sex by Age in Hemby Bridge
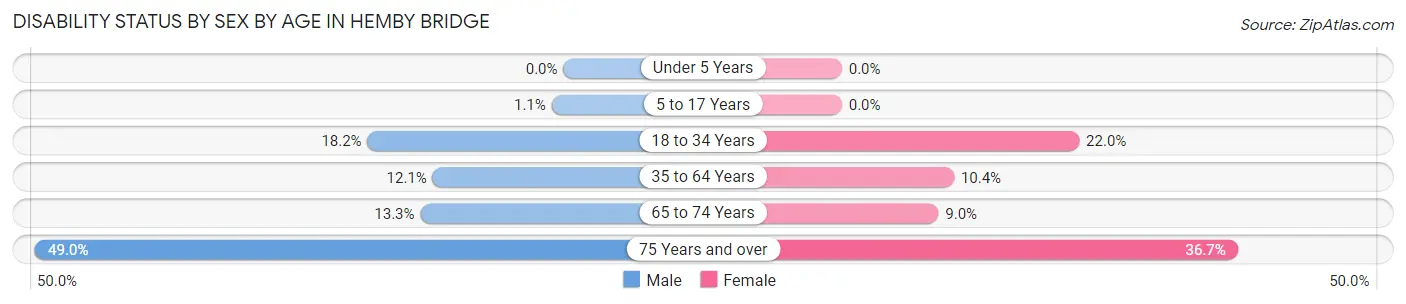
| Age Bracket | Male | Female |
| Under 5 Years | 0 (0.0%) | 0 (0.0%) |
| 5 to 17 Years | 2 (1.1%) | 0 (0.0%) |
| 18 to 34 Years | 20 (18.2%) | 39 (22.0%) |
| 35 to 64 Years | 58 (12.1%) | 38 (10.4%) |
| 65 to 74 Years | 13 (13.3%) | 6 (9.0%) |
| 75 Years and over | 25 (49.0%) | 18 (36.7%) |
Disability Class by Sex by Age in Hemby Bridge
Disability Class: Hearing Difficulty
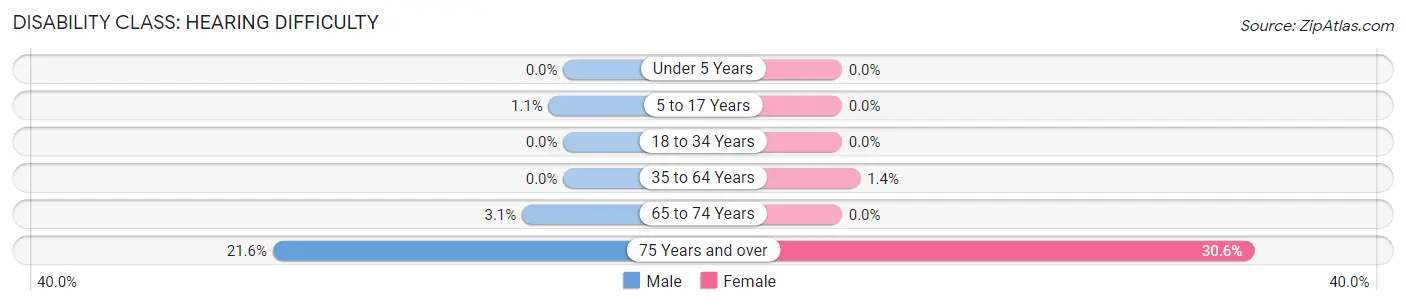
| Age Bracket | Male | Female |
| Under 5 Years | 0 (0.0%) | 0 (0.0%) |
| 5 to 17 Years | 2 (1.1%) | 0 (0.0%) |
| 18 to 34 Years | 0 (0.0%) | 0 (0.0%) |
| 35 to 64 Years | 0 (0.0%) | 5 (1.4%) |
| 65 to 74 Years | 3 (3.1%) | 0 (0.0%) |
| 75 Years and over | 11 (21.6%) | 15 (30.6%) |
Disability Class: Vision Difficulty
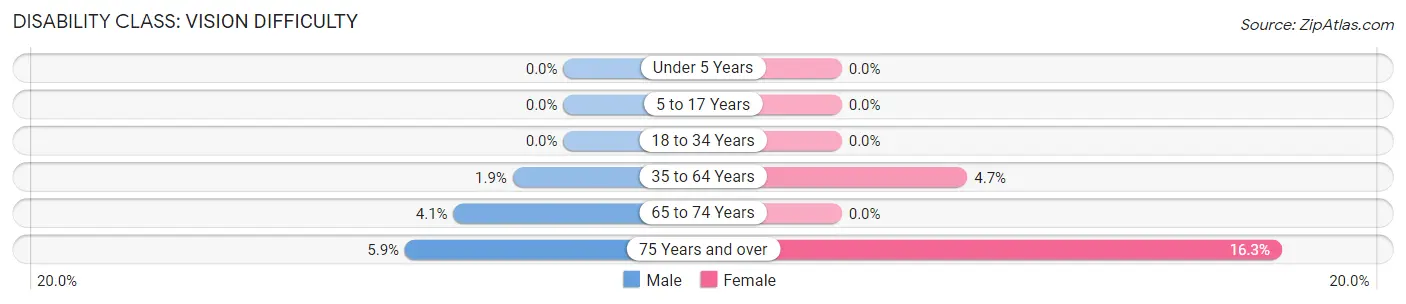
| Age Bracket | Male | Female |
| Under 5 Years | 0 (0.0%) | 0 (0.0%) |
| 5 to 17 Years | 0 (0.0%) | 0 (0.0%) |
| 18 to 34 Years | 0 (0.0%) | 0 (0.0%) |
| 35 to 64 Years | 9 (1.9%) | 17 (4.7%) |
| 65 to 74 Years | 4 (4.1%) | 0 (0.0%) |
| 75 Years and over | 3 (5.9%) | 8 (16.3%) |
Disability Class: Cognitive Difficulty
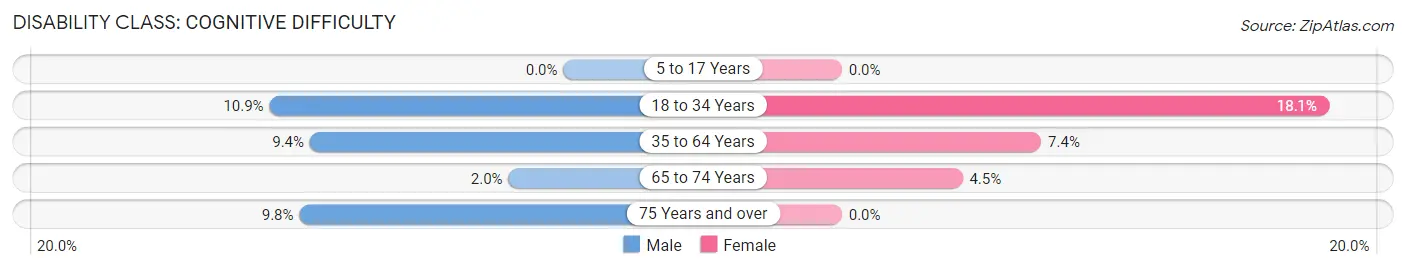
| Age Bracket | Male | Female |
| 5 to 17 Years | 0 (0.0%) | 0 (0.0%) |
| 18 to 34 Years | 12 (10.9%) | 32 (18.1%) |
| 35 to 64 Years | 45 (9.4%) | 27 (7.4%) |
| 65 to 74 Years | 2 (2.0%) | 3 (4.5%) |
| 75 Years and over | 5 (9.8%) | 0 (0.0%) |
Disability Class: Ambulatory Difficulty
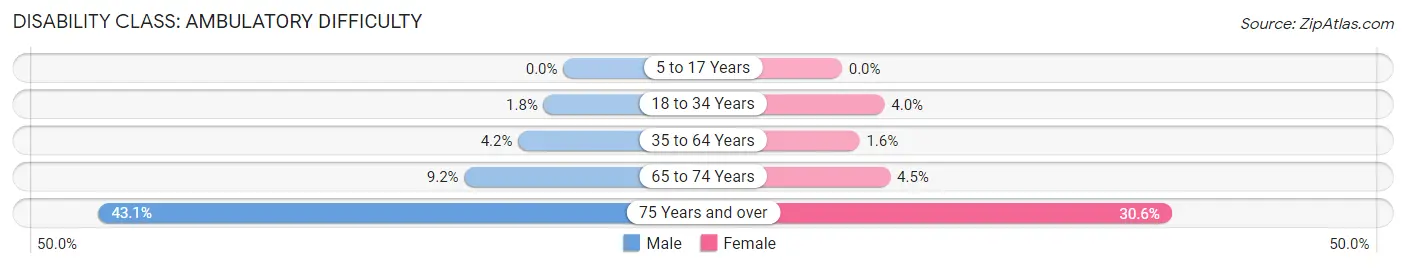
| Age Bracket | Male | Female |
| 5 to 17 Years | 0 (0.0%) | 0 (0.0%) |
| 18 to 34 Years | 2 (1.8%) | 7 (4.0%) |
| 35 to 64 Years | 20 (4.2%) | 6 (1.6%) |
| 65 to 74 Years | 9 (9.2%) | 3 (4.5%) |
| 75 Years and over | 22 (43.1%) | 15 (30.6%) |
Disability Class: Self-Care Difficulty
| Age Bracket | Male | Female |
| 5 to 17 Years | 0 (0.0%) | 0 (0.0%) |
| 18 to 34 Years | 4 (3.6%) | 7 (4.0%) |
| 35 to 64 Years | 10 (2.1%) | 0 (0.0%) |
| 65 to 74 Years | 4 (4.1%) | 0 (0.0%) |
| 75 Years and over | 0 (0.0%) | 7 (14.3%) |
Technology Access in Hemby Bridge
Computing Device Access in Hemby Bridge
| Device Type | # Households | % Households |
| Desktop or Laptop | 527 | 72.3% |
| Smartphone | 707 | 97.0% |
| Tablet | 481 | 66.0% |
| No Computing Device | 14 | 1.9% |
| Total | 729 | 100.0% |
Internet Access in Hemby Bridge
| Internet Type | # Households | % Households |
| Dial-Up Internet | 0 | 0.0% |
| Broadband Home | 550 | 75.4% |
| Cellular Data Only | 102 | 14.0% |
| Satellite Internet | 34 | 4.7% |
| No Internet | 60 | 8.2% |
| Total | 729 | 100.0% |
Hemby Bridge Summary
Hemby Bridge is a small unincorporated community located in Union County, North Carolina. It is situated along the banks of the Rocky River, approximately 15 miles southeast of Charlotte. The community is named after the Hemby Bridge, which was built in the late 19th century and is still in use today.
History
Hemby Bridge was first settled in the late 1700s by a group of German immigrants. The area was originally known as “Hemby’s Bridge” after the bridge that was built across the Rocky River in 1887. The bridge was named after the Hemby family, who owned the land on both sides of the river.
The community grew slowly over the years, and by the early 1900s, it had become a small farming community. The Hemby Bridge post office was established in 1906, and the town was officially incorporated in 1911.
In the early 20th century, Hemby Bridge was a popular destination for tourists, who came to enjoy the area’s natural beauty and the nearby Rocky River. The town also had a thriving business district, with several stores, a hotel, and a movie theater.
In the 1950s, the town began to decline as the nearby cities of Charlotte and Monroe grew in size and popularity. By the 1970s, Hemby Bridge had become a quiet, rural community.
Geography
Hemby Bridge is located in Union County, North Carolina, approximately 15 miles southeast of Charlotte. The town is situated along the banks of the Rocky River, which flows through the area. The town is surrounded by rolling hills and forests, and is home to several small lakes and ponds.
The climate in Hemby Bridge is mild and humid, with hot summers and mild winters. The average annual temperature is around 70 degrees Fahrenheit, and the average annual precipitation is around 45 inches.
Economy
Hemby Bridge is a small, rural community with a limited economy. The town’s main industries are agriculture and tourism. The town is home to several small farms, which produce a variety of crops, including corn, soybeans, and wheat.
The town also has a thriving tourism industry, with several bed and breakfasts, campgrounds, and other attractions. The nearby Rocky River is a popular destination for fishing, canoeing, and other outdoor activities.
Demographics
As of the 2010 census, the population of Hemby Bridge was 1,845. The town is predominantly white, with a small African American population. The median household income is around $45,000, and the median home value is around $150,000.
Conclusion
Hemby Bridge is a small, rural community located in Union County, North Carolina. The town is situated along the banks of the Rocky River, and is home to several small farms and a thriving tourism industry. The town has a population of 1,845, and the median household income is around $45,000. Hemby Bridge is a quiet, peaceful community with a rich history and a bright future.
Common Questions
What is the Total Population of Hemby Bridge?
Total Population of Hemby Bridge is 1,924.
What is the Total Male Population of Hemby Bridge?
Total Male Population of Hemby Bridge is 958.
What is the Total Female Population of Hemby Bridge?
Total Female Population of Hemby Bridge is 966.
What is the Ratio of Males per 100 Females in Hemby Bridge?
There are 99.17 Males per 100 Females in Hemby Bridge.
What is the Ratio of Females per 100 Males in Hemby Bridge?
There are 100.84 Females per 100 Males in Hemby Bridge.
What is the Median Population Age in Hemby Bridge?
Median Population Age in Hemby Bridge is 40.2 Years.
What is the Average Family Size in Hemby Bridge
Average Family Size in Hemby Bridge is 3.0 People.
What is the Average Household Size in Hemby Bridge
Average Household Size in Hemby Bridge is 2.6 People.
What is Per Capita Income in Hemby Bridge?
Per Capita income in Hemby Bridge is $29,364.
What is the Median Family Income in Hemby Bridge?
Median Family Income in Hemby Bridge is $83,563.
What is the Median Household income in Hemby Bridge?
Median Household Income in Hemby Bridge is $77,454.
What is Income or Wage Gap in Hemby Bridge?
Income or Wage Gap in Hemby Bridge is 11.5%.
Women in Hemby Bridge earn 88.5 cents for every dollar earned by a man.
What is Inequality or Gini Index in Hemby Bridge?
Inequality or Gini Index in Hemby Bridge is 0.37.
How Large is the Labor Force in Hemby Bridge?
There are 828 People in the Labor Forcein in Hemby Bridge.
What is the Percentage of People in the Labor Force in Hemby Bridge?
56.9% of People are in the Labor Force in Hemby Bridge.