Durham, NC
Durham Map
Durham Overview
284,094
TOTAL POPULATION
134,492
MALE POPULATION
149,602
FEMALE POPULATION
89.90
MALES / 100 FEMALES
111.23
FEMALES / 100 MALES
34.7
MEDIAN AGE
3.0
AVG FAMILY SIZE
2.3
AVG HOUSEHOLD SIZE
$44,012
PER CAPITA INCOME
$96,231
AVG FAMILY INCOME
$74,710
AVG HOUSEHOLD INCOME
10.9%
WAGE / INCOME GAP [ % ]
89.1¢/ $1
WAGE / INCOME GAP [ $ ]
$11,190
FAMILY INCOME DEFICIT
0.46
INEQUALITY / GINI INDEX
161,647
LABOR FORCE [ PEOPLE ]
69.4%
PERCENT IN LABOR FORCE
4.3%
UNEMPLOYMENT RATE
Durham Area Codes
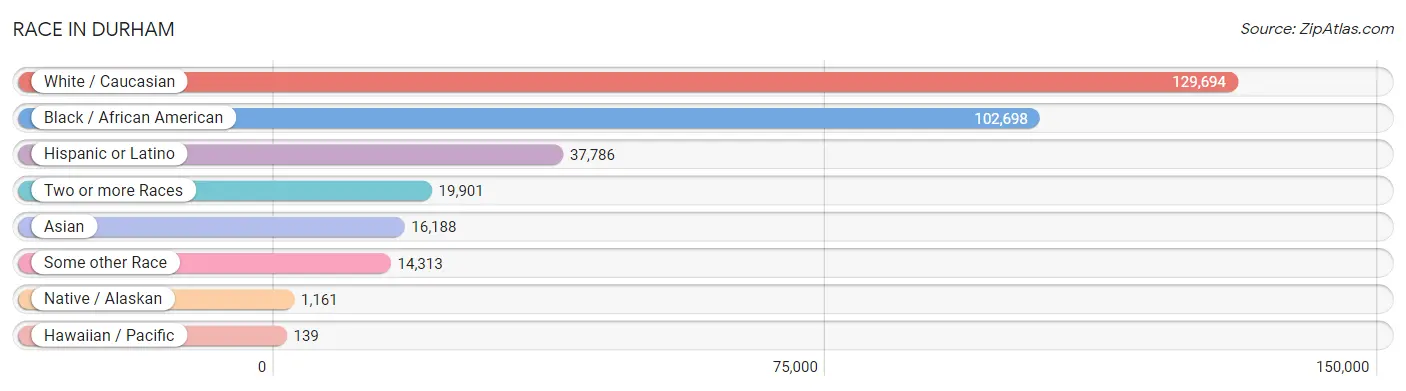
Race in Durham
The most populous races in Durham are White / Caucasian (129,694 | 45.7%), Black / African American (102,698 | 36.1%), and Hispanic or Latino (37,786 | 13.3%).
| Race | # Population | % Population |
| Asian | 16,188 | 5.7% |
| Black / African American | 102,698 | 36.1% |
| Hawaiian / Pacific | 139 | 0.1% |
| Hispanic or Latino | 37,786 | 13.3% |
| Native / Alaskan | 1,161 | 0.4% |
| White / Caucasian | 129,694 | 45.7% |
| Two or more Races | 19,901 | 7.0% |
| Some other Race | 14,313 | 5.0% |
| Total | 284,094 | 100.0% |
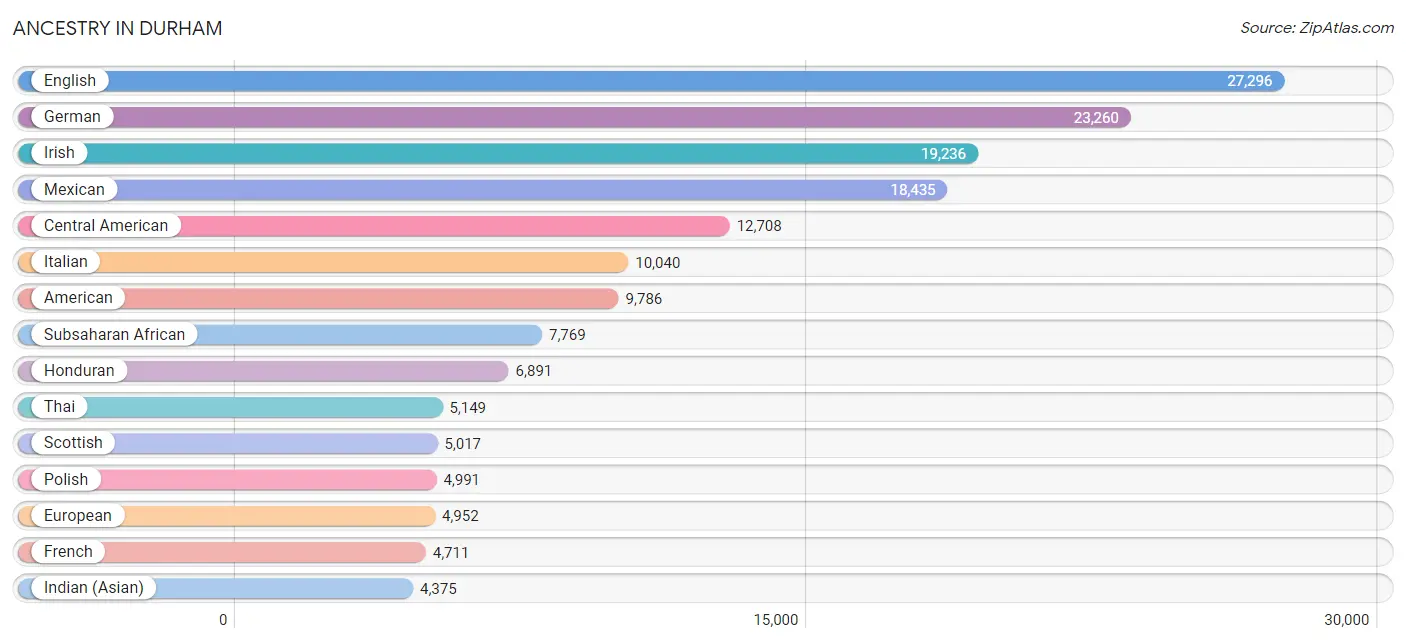
Ancestry in Durham
The most populous ancestries reported in Durham are English (27,296 | 9.6%), German (23,260 | 8.2%), Irish (19,236 | 6.8%), Mexican (18,435 | 6.5%), and Central American (12,708 | 4.5%), together accounting for 35.5% of all Durham residents.
| Ancestry | # Population | % Population |
| Afghan | 105 | 0.0% |
| African | 2,994 | 1.1% |
| Alaskan Athabascan | 2 | 0.0% |
| Albanian | 20 | 0.0% |
| Alsatian | 11 | 0.0% |
| American | 9,786 | 3.4% |
| Apache | 3 | 0.0% |
| Arab | 1,857 | 0.6% |
| Argentinean | 271 | 0.1% |
| Armenian | 504 | 0.2% |
| Assyrian / Chaldean / Syriac | 17 | 0.0% |
| Australian | 51 | 0.0% |
| Austrian | 540 | 0.2% |
| Bahamian | 65 | 0.0% |
| Bangladeshi | 71 | 0.0% |
| Barbadian | 47 | 0.0% |
| Belgian | 219 | 0.1% |
| Belizean | 185 | 0.1% |
| Bhutanese | 975 | 0.3% |
| Blackfeet | 359 | 0.1% |
| Bolivian | 29 | 0.0% |
| Brazilian | 346 | 0.1% |
| British | 2,527 | 0.9% |
| British West Indian | 102 | 0.0% |
| Bulgarian | 17 | 0.0% |
| Burmese | 1,429 | 0.5% |
| Cajun | 33 | 0.0% |
| Cambodian | 24 | 0.0% |
| Canadian | 533 | 0.2% |
| Celtic | 113 | 0.0% |
| Central American | 12,708 | 4.5% |
| Central American Indian | 358 | 0.1% |
| Cherokee | 1,004 | 0.4% |
| Cheyenne | 13 | 0.0% |
| Chickasaw | 18 | 0.0% |
| Chilean | 74 | 0.0% |
| Chinese | 18 | 0.0% |
| Chippewa | 48 | 0.0% |
| Choctaw | 82 | 0.0% |
| Colombian | 926 | 0.3% |
| Colville | 16 | 0.0% |
| Comanche | 28 | 0.0% |
| Costa Rican | 380 | 0.1% |
| Cree | 13 | 0.0% |
| Creek | 167 | 0.1% |
| Croatian | 211 | 0.1% |
| Cuban | 1,150 | 0.4% |
| Cypriot | 13 | 0.0% |
| Czech | 973 | 0.3% |
| Czechoslovakian | 133 | 0.1% |
| Danish | 727 | 0.3% |
| Dominican | 459 | 0.2% |
| Dutch | 1,790 | 0.6% |
| Eastern European | 1,163 | 0.4% |
| Ecuadorian | 211 | 0.1% |
| Egyptian | 206 | 0.1% |
| English | 27,296 | 9.6% |
| Estonian | 67 | 0.0% |
| Ethiopian | 403 | 0.1% |
| European | 4,952 | 1.7% |
| Filipino | 496 | 0.2% |
| Finnish | 338 | 0.1% |
| French | 4,711 | 1.7% |
| French Canadian | 979 | 0.3% |
| German | 23,260 | 8.2% |
| German Russian | 25 | 0.0% |
| Ghanaian | 808 | 0.3% |
| Greek | 1,076 | 0.4% |
| Guatemalan | 900 | 0.3% |
| Guyanese | 36 | 0.0% |
| Haitian | 254 | 0.1% |
| Honduran | 6,891 | 2.4% |
| Hungarian | 774 | 0.3% |
| Icelander | 55 | 0.0% |
| Indian (Asian) | 4,375 | 1.5% |
| Indonesian | 354 | 0.1% |
| Iranian | 228 | 0.1% |
| Iraqi | 22 | 0.0% |
| Irish | 19,236 | 6.8% |
| Iroquois | 52 | 0.0% |
| Israeli | 107 | 0.0% |
| Italian | 10,040 | 3.5% |
| Jamaican | 1,252 | 0.4% |
| Japanese | 48 | 0.0% |
| Jordanian | 4 | 0.0% |
| Kenyan | 443 | 0.2% |
| Kiowa | 5 | 0.0% |
| Korean | 2,226 | 0.8% |
| Laotian | 60 | 0.0% |
| Latvian | 127 | 0.0% |
| Lebanese | 333 | 0.1% |
| Liberian | 878 | 0.3% |
| Lithuanian | 969 | 0.3% |
| Lumbee | 491 | 0.2% |
| Luxembourger | 3 | 0.0% |
| Macedonian | 40 | 0.0% |
| Malaysian | 29 | 0.0% |
| Maltese | 33 | 0.0% |
| Mexican | 18,435 | 6.5% |
| Mexican American Indian | 202 | 0.1% |
| Moroccan | 250 | 0.1% |
| Native Hawaiian | 405 | 0.1% |
| Navajo | 12 | 0.0% |
| New Zealander | 91 | 0.0% |
| Nicaraguan | 266 | 0.1% |
| Nigerian | 1,541 | 0.5% |
| Northern European | 318 | 0.1% |
| Norwegian | 1,591 | 0.6% |
| Pakistani | 431 | 0.2% |
| Palestinian | 308 | 0.1% |
| Panamanian | 19 | 0.0% |
| Pennsylvania German | 17 | 0.0% |
| Peruvian | 163 | 0.1% |
| Polish | 4,991 | 1.8% |
| Portuguese | 569 | 0.2% |
| Pueblo | 19 | 0.0% |
| Puerto Rican | 2,011 | 0.7% |
| Romanian | 242 | 0.1% |
| Russian | 1,538 | 0.5% |
| Salvadoran | 4,222 | 1.5% |
| Scandinavian | 453 | 0.2% |
| Scotch-Irish | 3,897 | 1.4% |
| Scottish | 5,017 | 1.8% |
| Senegalese | 143 | 0.1% |
| Serbian | 112 | 0.0% |
| Sierra Leonean | 119 | 0.0% |
| Sioux | 92 | 0.0% |
| Slavic | 71 | 0.0% |
| Slovak | 355 | 0.1% |
| Slovene | 117 | 0.0% |
| South African | 129 | 0.1% |
| South American | 1,925 | 0.7% |
| South American Indian | 22 | 0.0% |
| Spaniard | 101 | 0.0% |
| Spanish | 158 | 0.1% |
| Sri Lankan | 2,010 | 0.7% |
| Subsaharan African | 7,769 | 2.7% |
| Sudanese | 79 | 0.0% |
| Swedish | 2,490 | 0.9% |
| Swiss | 487 | 0.2% |
| Syrian | 148 | 0.1% |
| Thai | 5,149 | 1.8% |
| Trinidadian and Tobagonian | 159 | 0.1% |
| Turkish | 129 | 0.1% |
| U.S. Virgin Islander | 21 | 0.0% |
| Ugandan | 38 | 0.0% |
| Ukrainian | 599 | 0.2% |
| Uruguayan | 57 | 0.0% |
| Venezuelan | 194 | 0.1% |
| Vietnamese | 69 | 0.0% |
| Welsh | 1,561 | 0.5% |
| West Indian | 435 | 0.2% |
| Yugoslavian | 13 | 0.0% |
| Zimbabwean | 14 | 0.0% | View All 154 Rows |
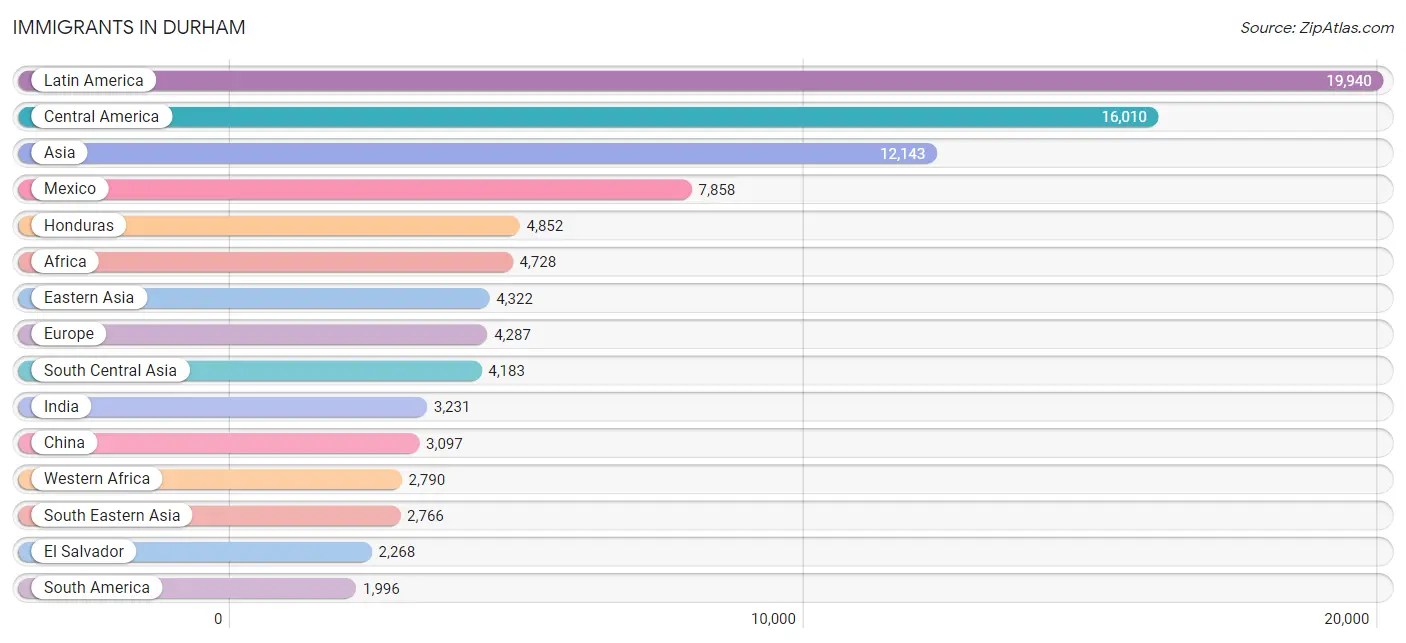
Immigrants in Durham
The most numerous immigrant groups reported in Durham came from Latin America (19,940 | 7.0%), Central America (16,010 | 5.6%), Asia (12,143 | 4.3%), Mexico (7,858 | 2.8%), and Honduras (4,852 | 1.7%), together accounting for 21.4% of all Durham residents.
| Immigration Origin | # Population | % Population |
| Afghanistan | 174 | 0.1% |
| Africa | 4,728 | 1.7% |
| Argentina | 187 | 0.1% |
| Armenia | 11 | 0.0% |
| Asia | 12,143 | 4.3% |
| Australia | 87 | 0.0% |
| Bahamas | 71 | 0.0% |
| Bangladesh | 97 | 0.0% |
| Barbados | 61 | 0.0% |
| Belarus | 24 | 0.0% |
| Belgium | 46 | 0.0% |
| Belize | 26 | 0.0% |
| Bolivia | 17 | 0.0% |
| Brazil | 318 | 0.1% |
| Bulgaria | 17 | 0.0% |
| Cambodia | 79 | 0.0% |
| Cameroon | 47 | 0.0% |
| Canada | 730 | 0.3% |
| Caribbean | 1,934 | 0.7% |
| Central America | 16,010 | 5.6% |
| Chile | 41 | 0.0% |
| China | 3,097 | 1.1% |
| Colombia | 729 | 0.3% |
| Costa Rica | 222 | 0.1% |
| Cuba | 583 | 0.2% |
| Czechoslovakia | 92 | 0.0% |
| Denmark | 17 | 0.0% |
| Dominica | 28 | 0.0% |
| Dominican Republic | 205 | 0.1% |
| Eastern Africa | 984 | 0.4% |
| Eastern Asia | 4,322 | 1.5% |
| Eastern Europe | 811 | 0.3% |
| Ecuador | 236 | 0.1% |
| Egypt | 167 | 0.1% |
| El Salvador | 2,268 | 0.8% |
| England | 620 | 0.2% |
| Eritrea | 58 | 0.0% |
| Ethiopia | 332 | 0.1% |
| Europe | 4,287 | 1.5% |
| France | 181 | 0.1% |
| Germany | 728 | 0.3% |
| Ghana | 541 | 0.2% |
| Greece | 290 | 0.1% |
| Guatemala | 699 | 0.3% |
| Guyana | 19 | 0.0% |
| Haiti | 62 | 0.0% |
| Honduras | 4,852 | 1.7% |
| Hong Kong | 66 | 0.0% |
| Hungary | 81 | 0.0% |
| India | 3,231 | 1.1% |
| Indonesia | 24 | 0.0% |
| Iran | 180 | 0.1% |
| Iraq | 170 | 0.1% |
| Ireland | 189 | 0.1% |
| Israel | 134 | 0.1% |
| Italy | 259 | 0.1% |
| Jamaica | 626 | 0.2% |
| Japan | 285 | 0.1% |
| Jordan | 95 | 0.0% |
| Kenya | 267 | 0.1% |
| Korea | 930 | 0.3% |
| Kuwait | 71 | 0.0% |
| Laos | 21 | 0.0% |
| Latin America | 19,940 | 7.0% |
| Latvia | 3 | 0.0% |
| Lebanon | 15 | 0.0% |
| Liberia | 676 | 0.2% |
| Lithuania | 116 | 0.0% |
| Malaysia | 6 | 0.0% |
| Mexico | 7,858 | 2.8% |
| Micronesia | 20 | 0.0% |
| Middle Africa | 99 | 0.0% |
| Morocco | 202 | 0.1% |
| Nepal | 228 | 0.1% |
| Netherlands | 123 | 0.0% |
| Nicaragua | 80 | 0.0% |
| Nigeria | 1,032 | 0.4% |
| Northern Africa | 538 | 0.2% |
| Northern Europe | 1,656 | 0.6% |
| Oceania | 308 | 0.1% |
| Pakistan | 204 | 0.1% |
| Panama | 5 | 0.0% |
| Peru | 172 | 0.1% |
| Philippines | 1,108 | 0.4% |
| Poland | 136 | 0.1% |
| Portugal | 49 | 0.0% |
| Romania | 52 | 0.0% |
| Russia | 129 | 0.1% |
| Saudi Arabia | 112 | 0.0% |
| Scotland | 26 | 0.0% |
| Senegal | 143 | 0.1% |
| Serbia | 39 | 0.0% |
| Sierra Leone | 295 | 0.1% |
| Singapore | 53 | 0.0% |
| South Africa | 178 | 0.1% |
| South America | 1,996 | 0.7% |
| South Central Asia | 4,183 | 1.5% |
| South Eastern Asia | 2,766 | 1.0% |
| Southern Europe | 661 | 0.2% |
| Spain | 63 | 0.0% |
| Sri Lanka | 58 | 0.0% |
| St. Vincent and the Grenadines | 64 | 0.0% |
| Sudan | 48 | 0.0% |
| Sweden | 128 | 0.1% |
| Switzerland | 48 | 0.0% |
| Syria | 42 | 0.0% |
| Taiwan | 267 | 0.1% |
| Thailand | 392 | 0.1% |
| Trinidad and Tobago | 125 | 0.0% |
| Turkey | 64 | 0.0% |
| Uganda | 77 | 0.0% |
| Ukraine | 86 | 0.0% |
| Uruguay | 39 | 0.0% |
| Uzbekistan | 4 | 0.0% |
| Venezuela | 222 | 0.1% |
| Vietnam | 899 | 0.3% |
| West Indies | 24 | 0.0% |
| Western Africa | 2,790 | 1.0% |
| Western Asia | 872 | 0.3% |
| Western Europe | 1,126 | 0.4% |
| Yemen | 106 | 0.0% |
| Zaire | 52 | 0.0% |
| Zimbabwe | 85 | 0.0% | View All 123 Rows |
Sex and Age in Durham
Sex and Age in Durham
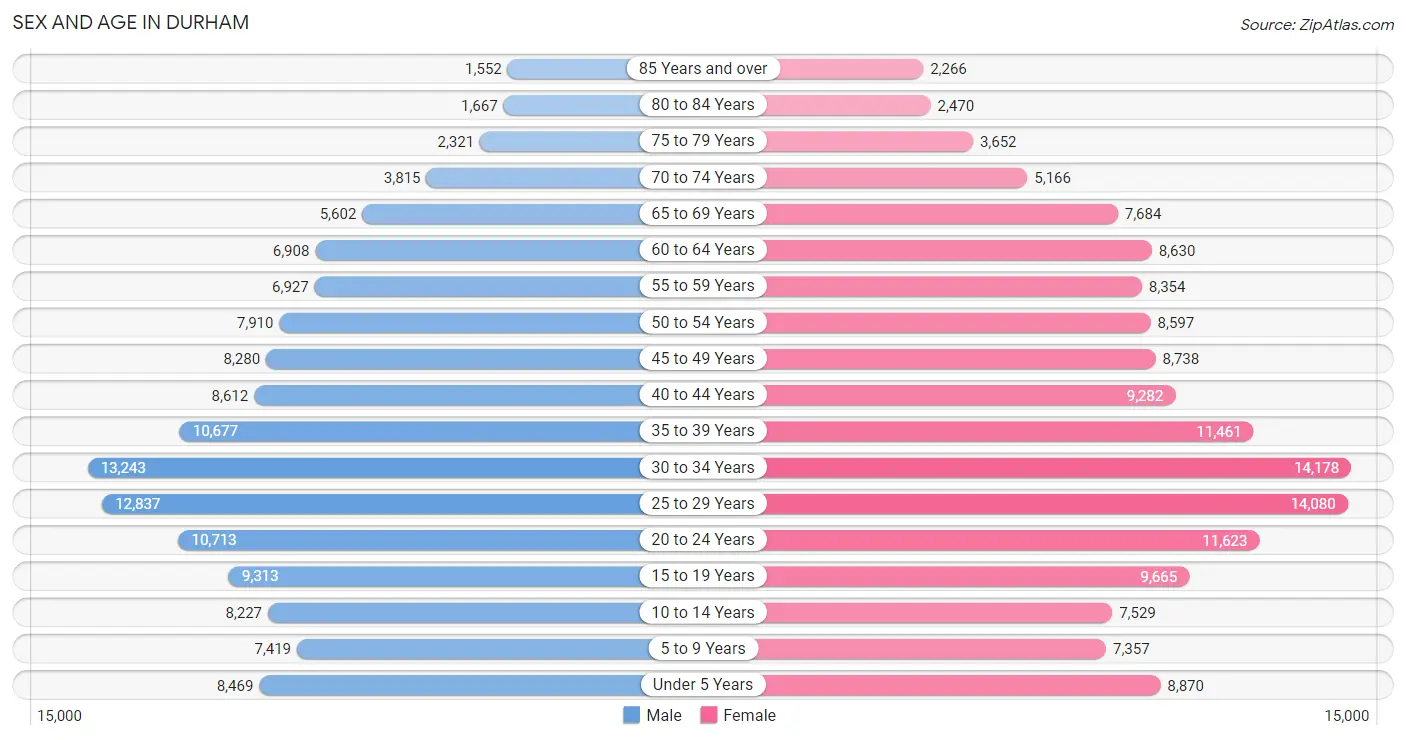
The most populous age groups in Durham are 30 to 34 Years (13,243 | 9.9%) for men and 30 to 34 Years (14,178 | 9.5%) for women.
| Age Bracket | Male | Female |
| Under 5 Years | 8,469 (6.3%) | 8,870 (5.9%) |
| 5 to 9 Years | 7,419 (5.5%) | 7,357 (4.9%) |
| 10 to 14 Years | 8,227 (6.1%) | 7,529 (5.0%) |
| 15 to 19 Years | 9,313 (6.9%) | 9,665 (6.5%) |
| 20 to 24 Years | 10,713 (8.0%) | 11,623 (7.8%) |
| 25 to 29 Years | 12,837 (9.5%) | 14,080 (9.4%) |
| 30 to 34 Years | 13,243 (9.9%) | 14,178 (9.5%) |
| 35 to 39 Years | 10,677 (7.9%) | 11,461 (7.7%) |
| 40 to 44 Years | 8,612 (6.4%) | 9,282 (6.2%) |
| 45 to 49 Years | 8,280 (6.2%) | 8,738 (5.8%) |
| 50 to 54 Years | 7,910 (5.9%) | 8,597 (5.8%) |
| 55 to 59 Years | 6,927 (5.1%) | 8,354 (5.6%) |
| 60 to 64 Years | 6,908 (5.1%) | 8,630 (5.8%) |
| 65 to 69 Years | 5,602 (4.2%) | 7,684 (5.1%) |
| 70 to 74 Years | 3,815 (2.8%) | 5,166 (3.5%) |
| 75 to 79 Years | 2,321 (1.7%) | 3,652 (2.4%) |
| 80 to 84 Years | 1,667 (1.2%) | 2,470 (1.7%) |
| 85 Years and over | 1,552 (1.1%) | 2,266 (1.5%) |
| Total | 134,492 (100.0%) | 149,602 (100.0%) |
Families and Households in Durham
Median Family Size in Durham
The median family size in Durham is 3.01 persons per family, with single female/mother families (16,154 | 24.7%) accounting for the largest median family size of 3.1 persons per family. On the other hand, single male/father families (5,075 | 7.8%) represent the smallest median family size with 2.89 persons per family.
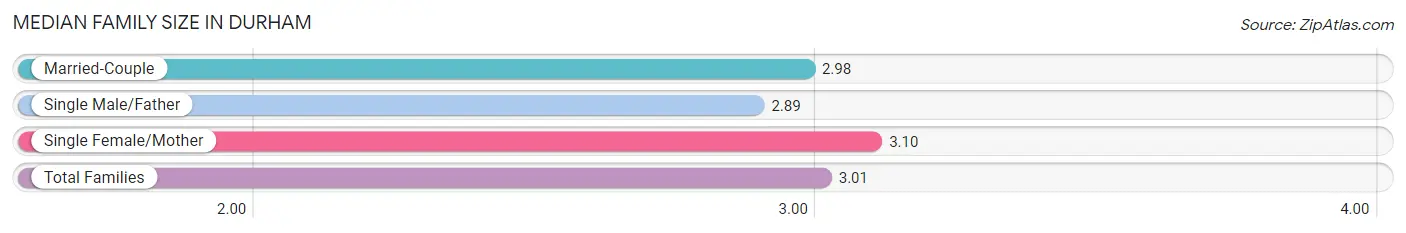
| Family Type | # Families | Family Size |
| Married-Couple | 44,179 (67.5%) | 2.98 |
| Single Male/Father | 5,075 (7.8%) | 2.89 |
| Single Female/Mother | 16,154 (24.7%) | 3.10 |
| Total Families | 65,408 (100.0%) | 3.01 |
Median Household Size in Durham
The median household size in Durham is 2.27 persons per household, with single male/father households (5,075 | 4.2%) accounting for the largest median household size of 3.37 persons per household. non-family households (54,978 | 45.7%) represent the smallest median household size with 1.26 persons per household.
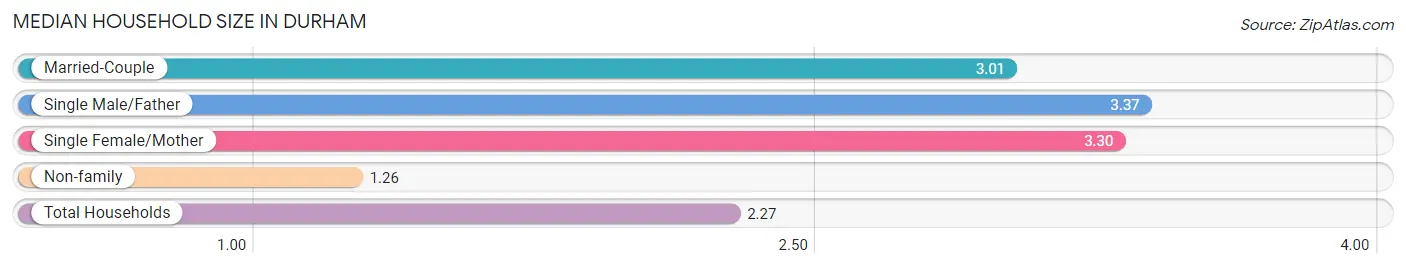
| Household Type | # Households | Household Size |
| Married-Couple | 44,179 (36.7%) | 3.01 |
| Single Male/Father | 5,075 (4.2%) | 3.37 |
| Single Female/Mother | 16,154 (13.4%) | 3.30 |
| Non-family | 54,978 (45.7%) | 1.26 |
| Total Households | 120,386 (100.0%) | 2.27 |
Household Size by Marriage Status in Durham
Out of a total of 120,386 households in Durham, 65,408 (54.3%) are family households, while 54,978 (45.7%) are nonfamily households. The most numerous type of family households are 2-person households, comprising 31,432, and the most common type of nonfamily households are 1-person households, comprising 43,342.
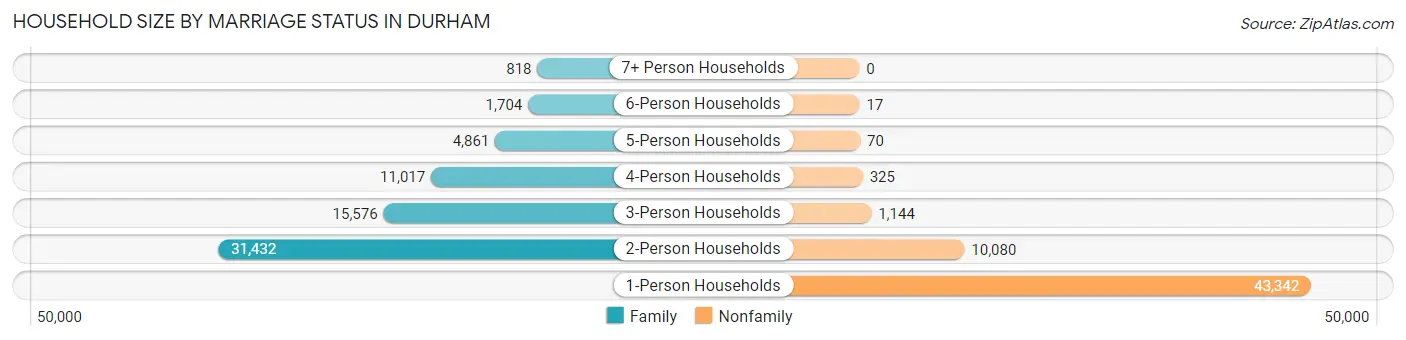
| Household Size | Family Households | Nonfamily Households |
| 1-Person Households | - | 43,342 (36.0%) |
| 2-Person Households | 31,432 (26.1%) | 10,080 (8.4%) |
| 3-Person Households | 15,576 (12.9%) | 1,144 (0.9%) |
| 4-Person Households | 11,017 (9.1%) | 325 (0.3%) |
| 5-Person Households | 4,861 (4.0%) | 70 (0.1%) |
| 6-Person Households | 1,704 (1.4%) | 17 (0.0%) |
| 7+ Person Households | 818 (0.7%) | 0 (0.0%) |
| Total | 65,408 (54.3%) | 54,978 (45.7%) |
Female Fertility in Durham
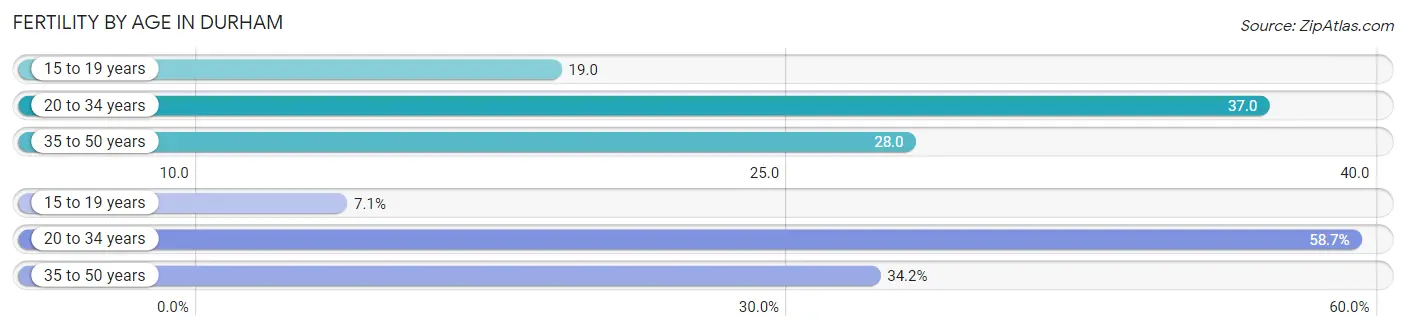
Fertility by Age in Durham
Average fertility rate in Durham is 31.0 births per 1,000 women. Women in the age bracket of 20 to 34 years have the highest fertility rate with 37.0 births per 1,000 women. Women in the age bracket of 20 to 34 years acount for 58.7% of all women with births.
| Age Bracket | Women with Births | Births / 1,000 Women |
| 15 to 19 years | 179 (7.1%) | 19.0 |
| 20 to 34 years | 1,484 (58.7%) | 37.0 |
| 35 to 50 years | 865 (34.2%) | 28.0 |
| Total | 2,528 (100.0%) | 31.0 |
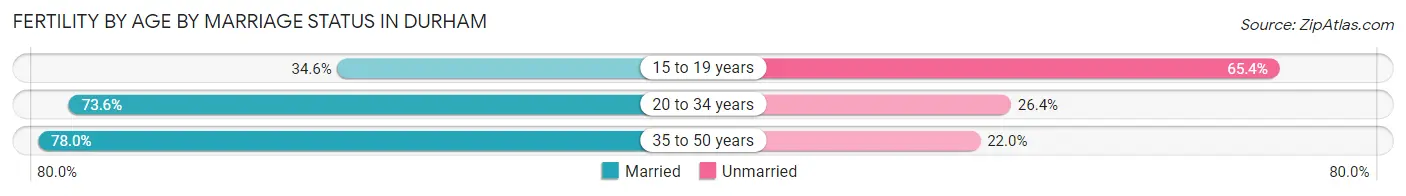
Fertility by Age by Marriage Status in Durham
72.3% of women with births (2,528) in Durham are married. The highest percentage of unmarried women with births falls into 15 to 19 years age bracket with 65.4% of them unmarried at the time of birth, while the lowest percentage of unmarried women with births belong to 35 to 50 years age bracket with 22.0% of them unmarried.
| Age Bracket | Married | Unmarried |
| 15 to 19 years | 62 (34.6%) | 117 (65.4%) |
| 20 to 34 years | 1,092 (73.6%) | 392 (26.4%) |
| 35 to 50 years | 675 (78.0%) | 190 (22.0%) |
| Total | 1,828 (72.3%) | 700 (27.7%) |
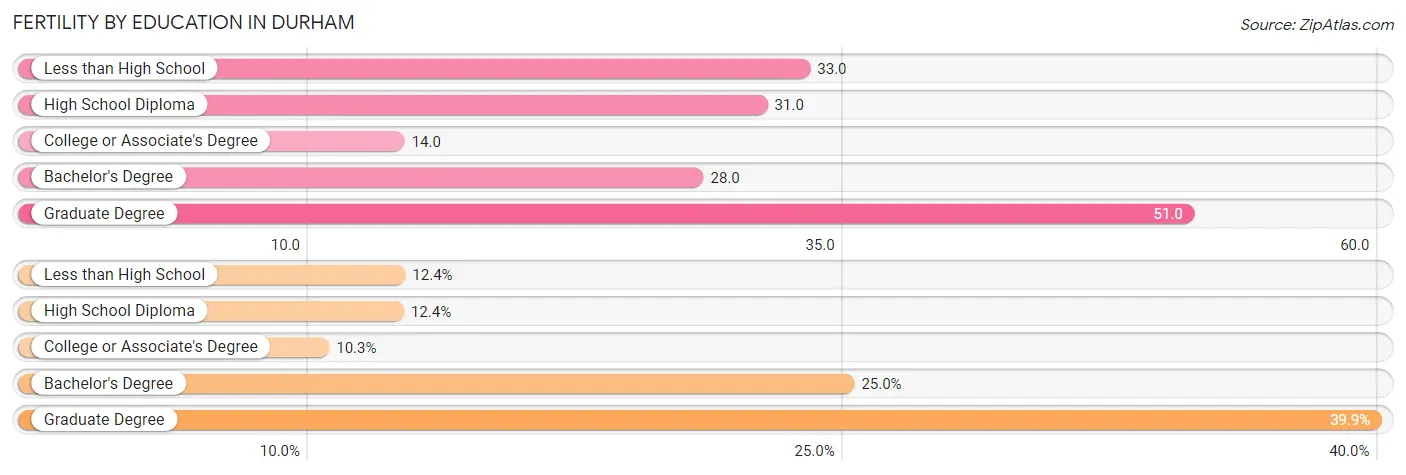
Fertility by Education in Durham
Average fertility rate in Durham is 31.0 births per 1,000 women. Women with the education attainment of graduate degree have the highest fertility rate of 51.0 births per 1,000 women, while women with the education attainment of college or associate's degree have the lowest fertility at 14.0 births per 1,000 women. Women with the education attainment of graduate degree represent 39.9% of all women with births.
| Educational Attainment | Women with Births | Births / 1,000 Women |
| Less than High School | 314 (12.4%) | 33.0 |
| High School Diploma | 313 (12.4%) | 31.0 |
| College or Associate's Degree | 260 (10.3%) | 14.0 |
| Bachelor's Degree | 633 (25.0%) | 28.0 |
| Graduate Degree | 1,008 (39.9%) | 51.0 |
| Total | 2,528 (100.0%) | 31.0 |
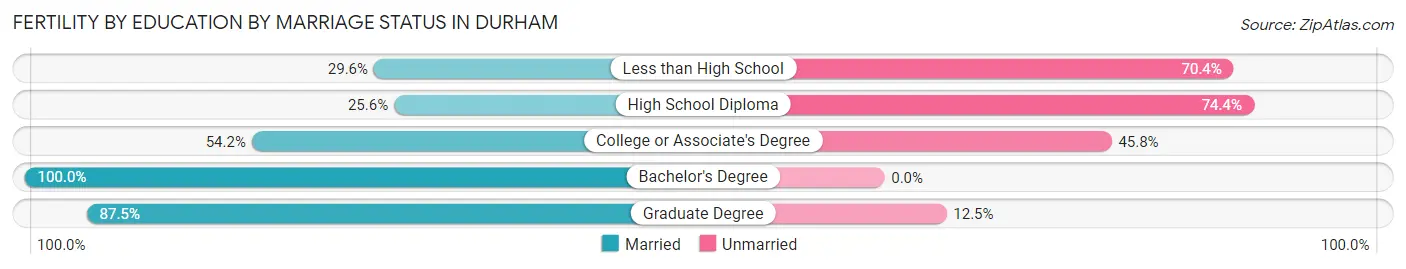
Fertility by Education by Marriage Status in Durham
27.7% of women with births in Durham are unmarried. Women with the educational attainment of bachelor's degree are most likely to be married with 100.0% of them married at childbirth, while women with the educational attainment of high school diploma are least likely to be married with 74.4% of them unmarried at childbirth.
| Educational Attainment | Married | Unmarried |
| Less than High School | 93 (29.6%) | 221 (70.4%) |
| High School Diploma | 80 (25.6%) | 233 (74.4%) |
| College or Associate's Degree | 141 (54.2%) | 119 (45.8%) |
| Bachelor's Degree | 633 (100.0%) | 0 (0.0%) |
| Graduate Degree | 882 (87.5%) | 126 (12.5%) |
| Total | 1,828 (72.3%) | 700 (27.7%) |
Income in Durham
Income Overview in Durham
Per Capita Income in Durham is $44,012, while median incomes of families and households are $96,231 and $74,710 respectively.
| Characteristic | Number | Measure |
| Per Capita Income | 284,094 | $44,012 |
| Median Family Income | 65,408 | $96,231 |
| Mean Family Income | 65,408 | $125,955 |
| Median Household Income | 120,386 | $74,710 |
| Mean Household Income | 120,386 | $101,765 |
| Income Deficit | 65,408 | $11,190 |
| Wage / Income Gap (%) | 284,094 | 10.94% |
| Wage / Income Gap ($) | 284,094 | 89.06¢ per $1 |
| Gini / Inequality Index | 284,094 | 0.46 |
Earnings by Sex in Durham
Average Earnings in Durham are $44,958, $46,990 for men and $41,848 for women, a difference of 10.9%.
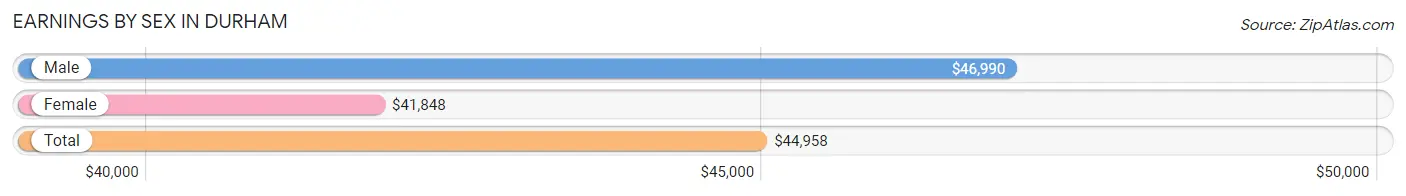
| Sex | Number | Average Earnings |
| Male | 81,377 (48.4%) | $46,990 |
| Female | 86,788 (51.6%) | $41,848 |
| Total | 168,165 (100.0%) | $44,958 |
Earnings by Sex by Income Bracket in Durham
The most common earnings brackets in Durham are $100,000+ for men (17,495 | 21.5%) and $100,000+ for women (11,041 | 12.7%).
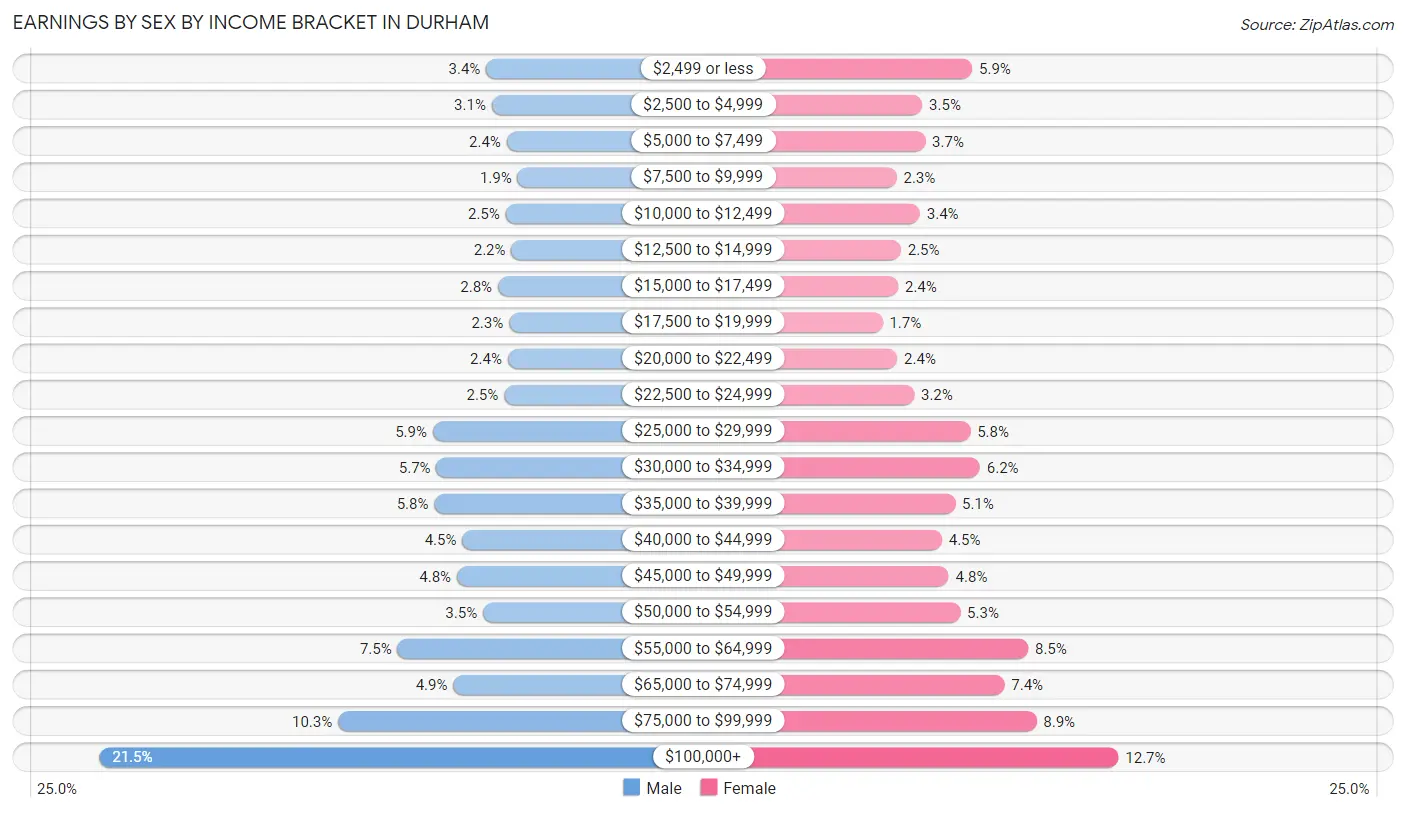
| Income | Male | Female |
| $2,499 or less | 2,751 (3.4%) | 5,091 (5.9%) |
| $2,500 to $4,999 | 2,542 (3.1%) | 3,065 (3.5%) |
| $5,000 to $7,499 | 1,967 (2.4%) | 3,184 (3.7%) |
| $7,500 to $9,999 | 1,552 (1.9%) | 2,020 (2.3%) |
| $10,000 to $12,499 | 2,014 (2.5%) | 2,971 (3.4%) |
| $12,500 to $14,999 | 1,787 (2.2%) | 2,194 (2.5%) |
| $15,000 to $17,499 | 2,305 (2.8%) | 2,083 (2.4%) |
| $17,500 to $19,999 | 1,877 (2.3%) | 1,447 (1.7%) |
| $20,000 to $22,499 | 1,925 (2.4%) | 2,045 (2.4%) |
| $22,500 to $24,999 | 2,064 (2.5%) | 2,738 (3.2%) |
| $25,000 to $29,999 | 4,787 (5.9%) | 5,016 (5.8%) |
| $30,000 to $34,999 | 4,645 (5.7%) | 5,404 (6.2%) |
| $35,000 to $39,999 | 4,731 (5.8%) | 4,398 (5.1%) |
| $40,000 to $44,999 | 3,662 (4.5%) | 3,864 (4.4%) |
| $45,000 to $49,999 | 3,869 (4.8%) | 4,136 (4.8%) |
| $50,000 to $54,999 | 2,870 (3.5%) | 4,607 (5.3%) |
| $55,000 to $64,999 | 6,130 (7.5%) | 7,368 (8.5%) |
| $65,000 to $74,999 | 4,003 (4.9%) | 6,405 (7.4%) |
| $75,000 to $99,999 | 8,401 (10.3%) | 7,711 (8.9%) |
| $100,000+ | 17,495 (21.5%) | 11,041 (12.7%) |
| Total | 81,377 (100.0%) | 86,788 (100.0%) |
Earnings by Sex by Educational Attainment in Durham
Average earnings in Durham are $55,242 for men and $48,521 for women, a difference of 12.2%. Men with an educational attainment of graduate degree enjoy the highest average annual earnings of $87,380, while those with less than high school education earn the least with $31,233. Women with an educational attainment of graduate degree earn the most with the average annual earnings of $68,113, while those with less than high school education have the smallest earnings of $22,076.
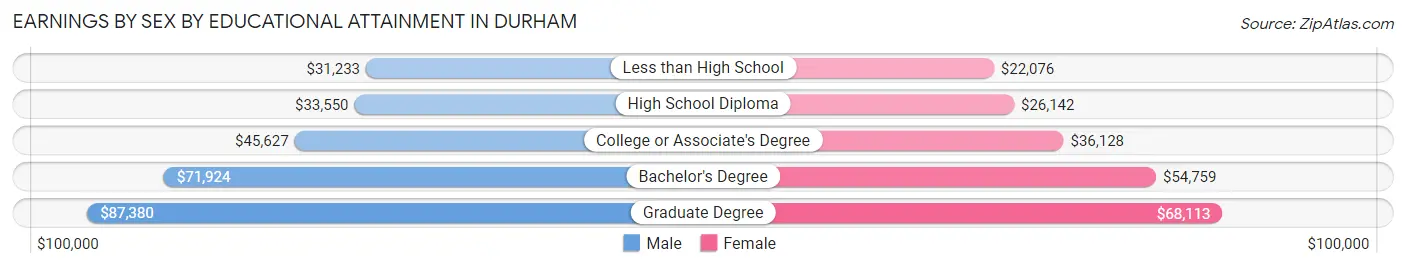
| Educational Attainment | Male Income | Female Income |
| Less than High School | $31,233 | $22,076 |
| High School Diploma | $33,550 | $26,142 |
| College or Associate's Degree | $45,627 | $36,128 |
| Bachelor's Degree | $71,924 | $54,759 |
| Graduate Degree | $87,380 | $68,113 |
| Total | $55,242 | $48,521 |
Family Income in Durham
Family Income Brackets in Durham
According to the Durham family income data, there are 12,755 families falling into the $100,000 to $149,999 income range, which is the most common income bracket and makes up 19.5% of all families. Conversely, the $10,000 to $14,999 income bracket is the least frequent group with only 1,243 families (1.9%) belonging to this category.
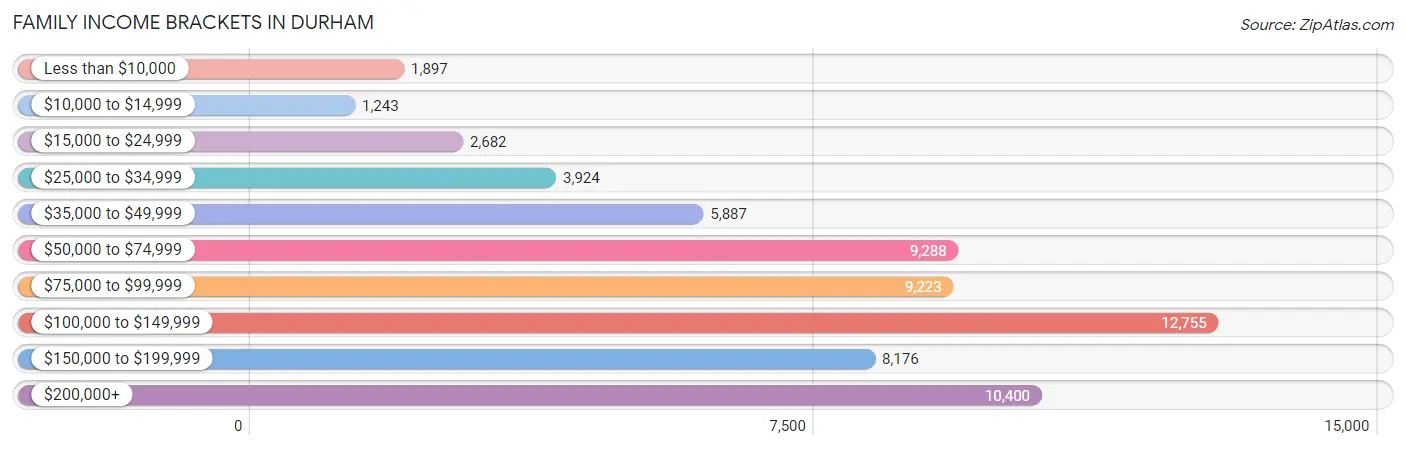
| Income Bracket | # Families | % Families |
| Less than $10,000 | 1,897 | 2.9% |
| $10,000 to $14,999 | 1,243 | 1.9% |
| $15,000 to $24,999 | 2,682 | 4.1% |
| $25,000 to $34,999 | 3,924 | 6.0% |
| $35,000 to $49,999 | 5,887 | 9.0% |
| $50,000 to $74,999 | 9,288 | 14.2% |
| $75,000 to $99,999 | 9,223 | 14.1% |
| $100,000 to $149,999 | 12,755 | 19.5% |
| $150,000 to $199,999 | 8,176 | 12.5% |
| $200,000+ | 10,400 | 15.9% |
Family Income by Famaliy Size in Durham
4-person families (10,446 | 16.0%) account for the highest median family income in Durham with $117,591 per family, while 2-person families (33,923 | 51.9%) have the highest median income of $46,339 per family member.
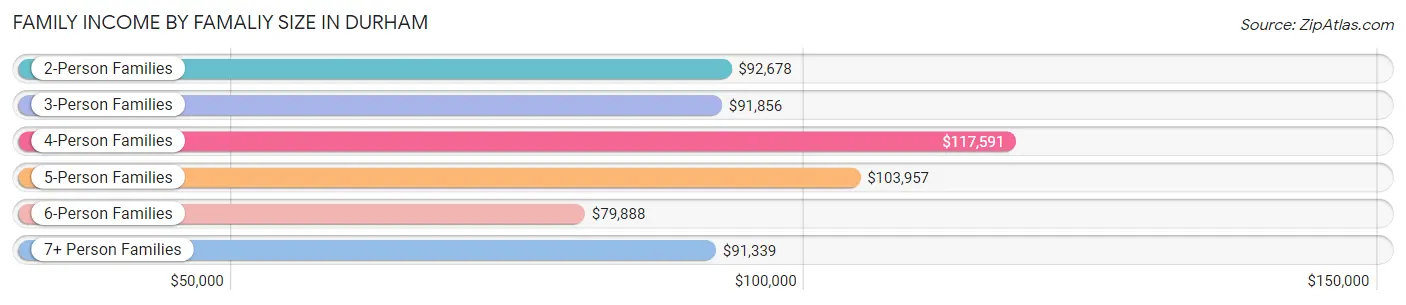
| Income Bracket | # Families | Median Income |
| 2-Person Families | 33,923 (51.9%) | $92,678 |
| 3-Person Families | 14,700 (22.5%) | $91,856 |
| 4-Person Families | 10,446 (16.0%) | $117,591 |
| 5-Person Families | 4,372 (6.7%) | $103,957 |
| 6-Person Families | 1,384 (2.1%) | $79,888 |
| 7+ Person Families | 583 (0.9%) | $91,339 |
| Total | 65,408 (100.0%) | $96,231 |
Family Income by Number of Earners in Durham
The median family income in Durham is $96,231, with families comprising 3+ earners (5,355) having the highest median family income of $136,864, while families with no earners (7,069) have the lowest median family income of $56,306, accounting for 8.2% and 10.8% of families, respectively.
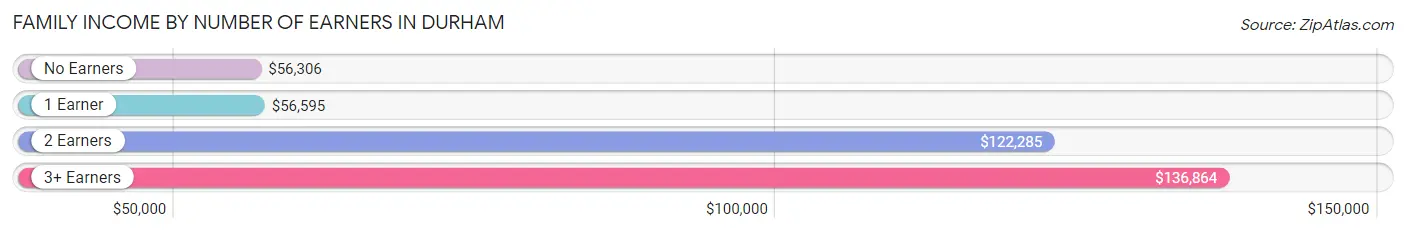
| Number of Earners | # Families | Median Income |
| No Earners | 7,069 (10.8%) | $56,306 |
| 1 Earner | 21,197 (32.4%) | $56,595 |
| 2 Earners | 31,787 (48.6%) | $122,285 |
| 3+ Earners | 5,355 (8.2%) | $136,864 |
| Total | 65,408 (100.0%) | $96,231 |
Household Income in Durham
Household Income Brackets in Durham
With 20,947 households falling in the category, the $100,000 to $149,999 income range is the most frequent in Durham, accounting for 17.4% of all households. In contrast, only 3,371 households (2.8%) fall into the $10,000 to $14,999 income bracket, making it the least populous group.
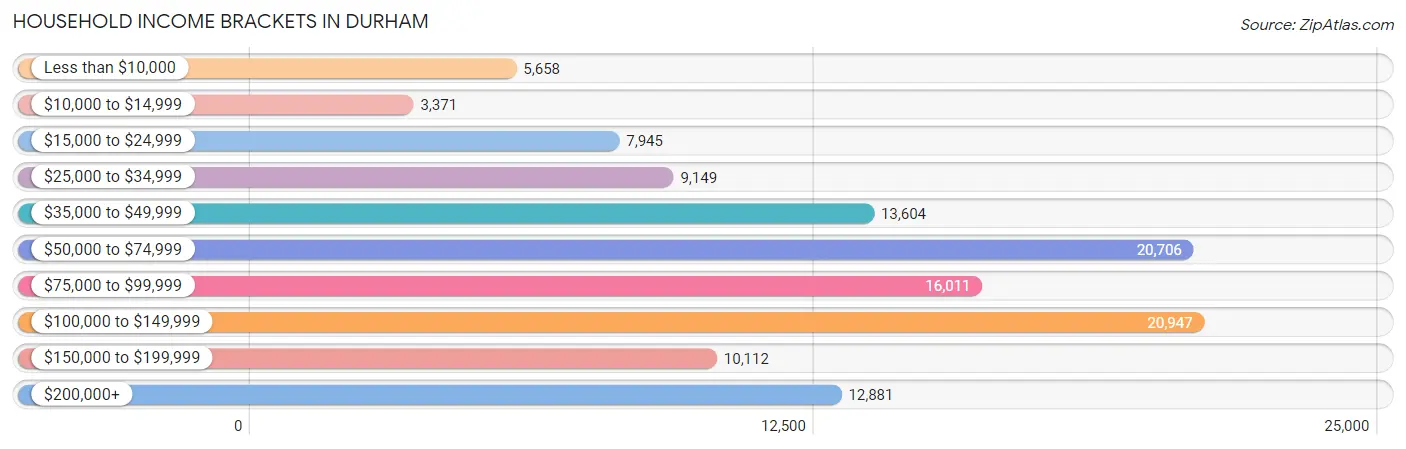
| Income Bracket | # Households | % Households |
| Less than $10,000 | 5,658 | 4.7% |
| $10,000 to $14,999 | 3,371 | 2.8% |
| $15,000 to $24,999 | 7,945 | 6.6% |
| $25,000 to $34,999 | 9,149 | 7.6% |
| $35,000 to $49,999 | 13,604 | 11.3% |
| $50,000 to $74,999 | 20,706 | 17.2% |
| $75,000 to $99,999 | 16,011 | 13.3% |
| $100,000 to $149,999 | 20,947 | 17.4% |
| $150,000 to $199,999 | 10,112 | 8.4% |
| $200,000+ | 12,881 | 10.7% |
Household Income by Householder Age in Durham
The median household income in Durham is $74,710, with the highest median household income of $86,529 found in the 45 to 64 years age bracket for the primary householder. A total of 38,569 households (32.0%) fall into this category. Meanwhile, the 15 to 24 years age bracket for the primary householder has the lowest median household income of $36,661, with 6,486 households (5.4%) in this group.
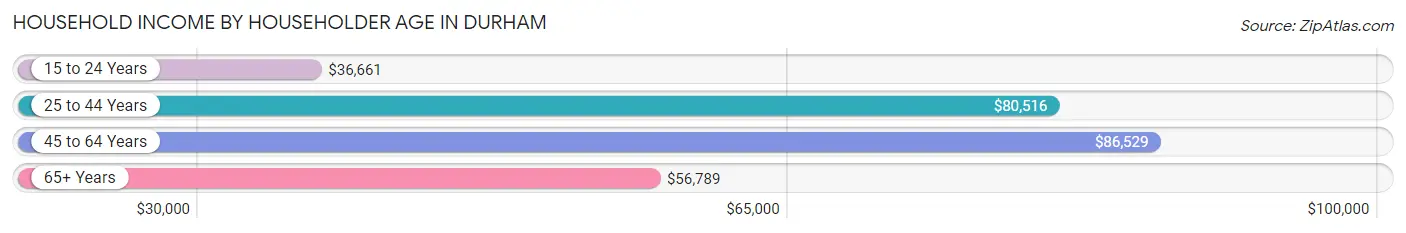
| Income Bracket | # Households | Median Income |
| 15 to 24 Years | 6,486 (5.4%) | $36,661 |
| 25 to 44 Years | 51,751 (43.0%) | $80,516 |
| 45 to 64 Years | 38,569 (32.0%) | $86,529 |
| 65+ Years | 23,580 (19.6%) | $56,789 |
| Total | 120,386 (100.0%) | $74,710 |
Poverty in Durham
Income Below Poverty by Sex and Age in Durham
With 11.5% poverty level for males and 13.6% for females among the residents of Durham, 18 to 24 year old males and 18 to 24 year old females are the most vulnerable to poverty, with 2,661 males (22.8%) and 3,436 females (27.2%) in their respective age groups living below the poverty level.
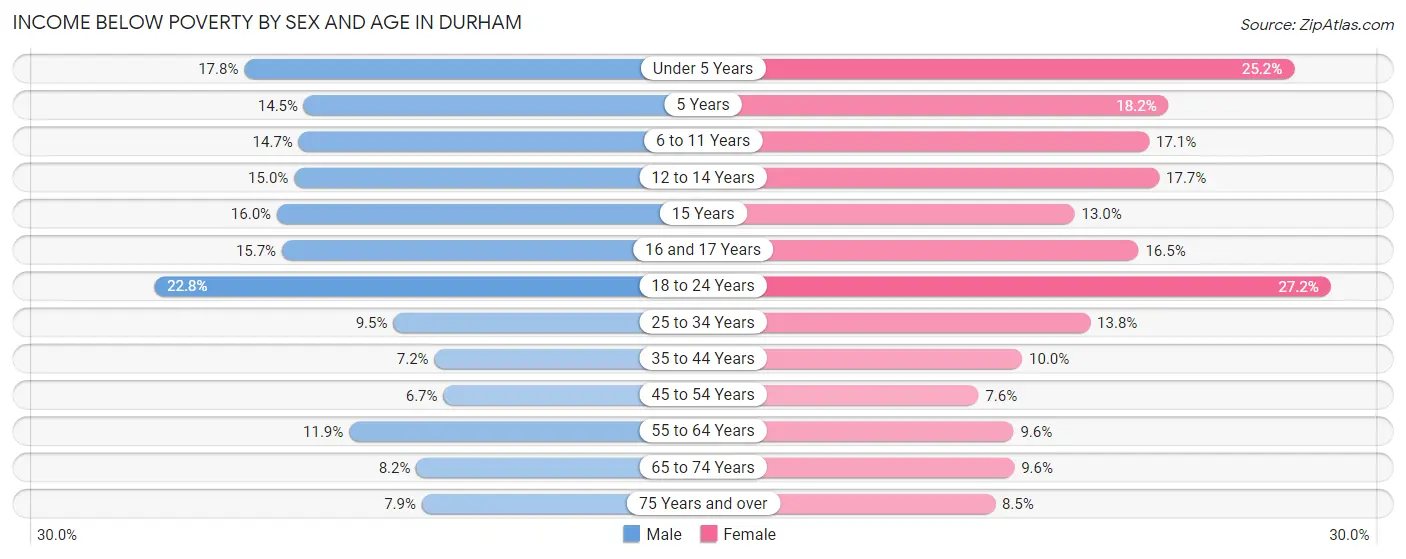
| Age Bracket | Male | Female |
| Under 5 Years | 1,479 (17.8%) | 2,208 (25.2%) |
| 5 Years | 174 (14.4%) | 260 (18.2%) |
| 6 to 11 Years | 1,304 (14.7%) | 1,547 (17.1%) |
| 12 to 14 Years | 815 (15.0%) | 686 (17.7%) |
| 15 Years | 254 (16.0%) | 221 (13.0%) |
| 16 and 17 Years | 455 (15.7%) | 478 (16.5%) |
| 18 to 24 Years | 2,661 (22.8%) | 3,436 (27.2%) |
| 25 to 34 Years | 2,452 (9.5%) | 3,903 (13.8%) |
| 35 to 44 Years | 1,378 (7.2%) | 2,081 (10.0%) |
| 45 to 54 Years | 1,075 (6.7%) | 1,319 (7.6%) |
| 55 to 64 Years | 1,630 (11.9%) | 1,611 (9.6%) |
| 65 to 74 Years | 756 (8.2%) | 1,224 (9.6%) |
| 75 Years and over | 414 (7.9%) | 682 (8.5%) |
| Total | 14,847 (11.5%) | 19,656 (13.6%) |
Income Above Poverty by Sex and Age in Durham
According to the poverty statistics in Durham, males aged 45 to 54 years and females aged 45 to 54 years are the age groups that are most secure financially, with 93.3% of males and 92.4% of females in these age groups living above the poverty line.
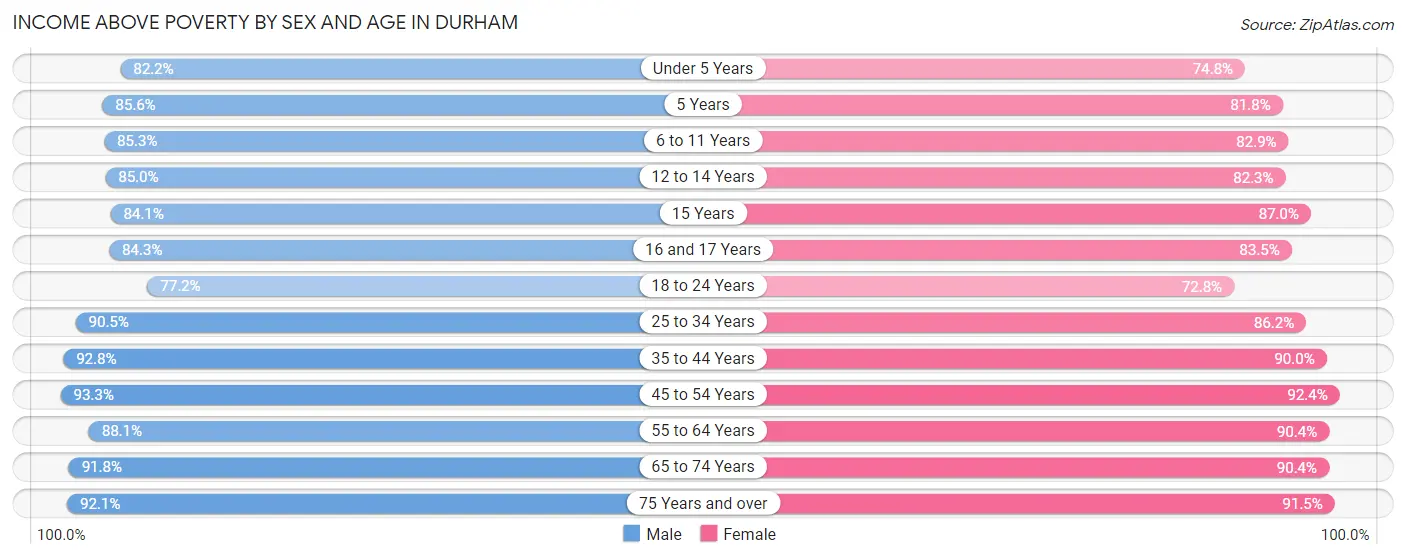
| Age Bracket | Male | Female |
| Under 5 Years | 6,844 (82.2%) | 6,560 (74.8%) |
| 5 Years | 1,030 (85.6%) | 1,169 (81.8%) |
| 6 to 11 Years | 7,541 (85.3%) | 7,497 (82.9%) |
| 12 to 14 Years | 4,621 (85.0%) | 3,196 (82.3%) |
| 15 Years | 1,338 (84.1%) | 1,484 (87.0%) |
| 16 and 17 Years | 2,449 (84.3%) | 2,416 (83.5%) |
| 18 to 24 Years | 9,013 (77.2%) | 9,185 (72.8%) |
| 25 to 34 Years | 23,453 (90.5%) | 24,320 (86.2%) |
| 35 to 44 Years | 17,817 (92.8%) | 18,638 (90.0%) |
| 45 to 54 Years | 15,022 (93.3%) | 16,003 (92.4%) |
| 55 to 64 Years | 12,031 (88.1%) | 15,244 (90.4%) |
| 65 to 74 Years | 8,470 (91.8%) | 11,528 (90.4%) |
| 75 Years and over | 4,838 (92.1%) | 7,313 (91.5%) |
| Total | 114,467 (88.5%) | 124,553 (86.4%) |
Income Below Poverty Among Married-Couple Families in Durham
The poverty statistics for married-couple families in Durham show that 2.7% or 1,197 of the total 44,179 families live below the poverty line. Families with 5 or more children have the highest poverty rate of 10.4%, comprising of 28 families. On the other hand, families with no children have the lowest poverty rate of 1.8%, which includes 466 families.
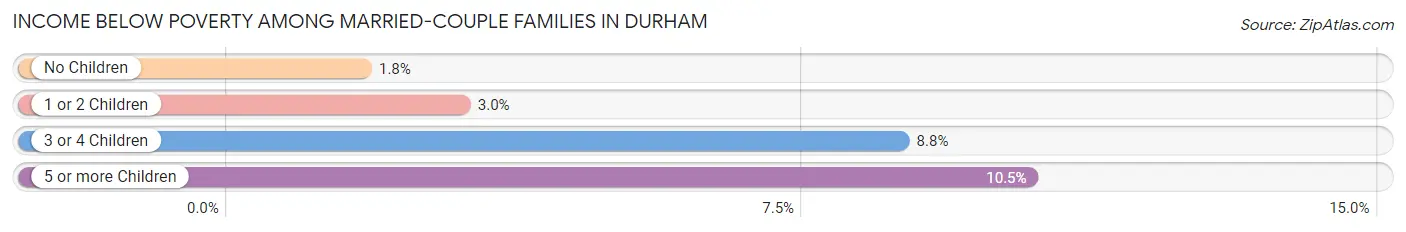
| Children | Above Poverty | Below Poverty |
| No Children | 26,195 (98.3%) | 466 (1.8%) |
| 1 or 2 Children | 13,708 (97.0%) | 430 (3.0%) |
| 3 or 4 Children | 2,839 (91.2%) | 273 (8.8%) |
| 5 or more Children | 240 (89.5%) | 28 (10.4%) |
| Total | 42,982 (97.3%) | 1,197 (2.7%) |
Income Below Poverty Among Single-Parent Households in Durham
According to the poverty data in Durham, 16.7% or 845 single-father households and 20.3% or 3,283 single-mother households are living below the poverty line. Among single-father households, those with 3 or 4 children have the highest poverty rate, with 89 households (38.0%) experiencing poverty. Likewise, among single-mother households, those with 5 or more children have the highest poverty rate, with 157 households (91.3%) falling below the poverty line.
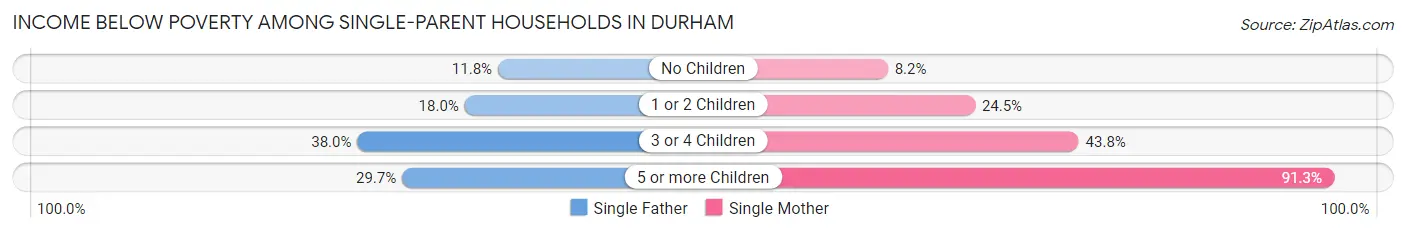
| Children | Single Father | Single Mother |
| No Children | 238 (11.8%) | 519 (8.2%) |
| 1 or 2 Children | 499 (18.0%) | 2,052 (24.4%) |
| 3 or 4 Children | 89 (38.0%) | 555 (43.8%) |
| 5 or more Children | 19 (29.7%) | 157 (91.3%) |
| Total | 845 (16.7%) | 3,283 (20.3%) |
Income Below Poverty Among Married-Couple vs Single-Parent Households in Durham
The poverty data for Durham shows that 1,197 of the married-couple family households (2.7%) and 4,128 of the single-parent households (19.5%) are living below the poverty level. Within the married-couple family households, those with 5 or more children have the highest poverty rate, with 28 households (10.4%) falling below the poverty line. Among the single-parent households, those with 5 or more children have the highest poverty rate, with 176 household (74.6%) living below poverty.
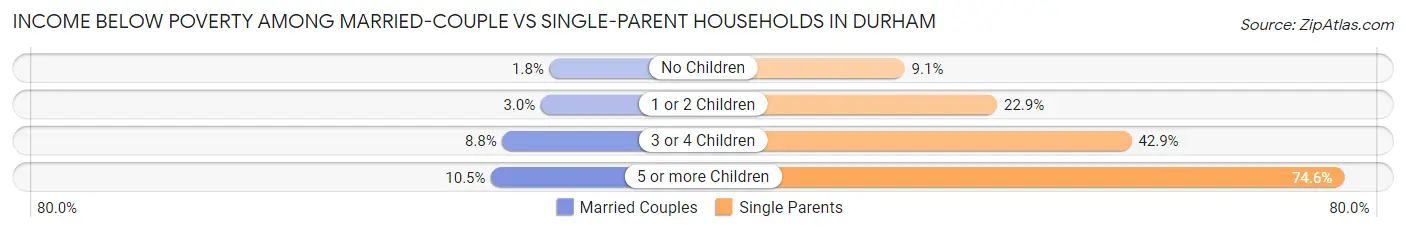
| Children | Married-Couple Families | Single-Parent Households |
| No Children | 466 (1.8%) | 757 (9.1%) |
| 1 or 2 Children | 430 (3.0%) | 2,551 (22.9%) |
| 3 or 4 Children | 273 (8.8%) | 644 (42.9%) |
| 5 or more Children | 28 (10.4%) | 176 (74.6%) |
| Total | 1,197 (2.7%) | 4,128 (19.5%) |
Employment Characteristics in Durham
Employment by Class of Employer in Durham
Among the 151,878 employed individuals in Durham, private company employees (95,378 | 62.8%), not-for-profit organizations (23,023 | 15.2%), and state government employees (12,343 | 8.1%) make up the most common classes of employment.
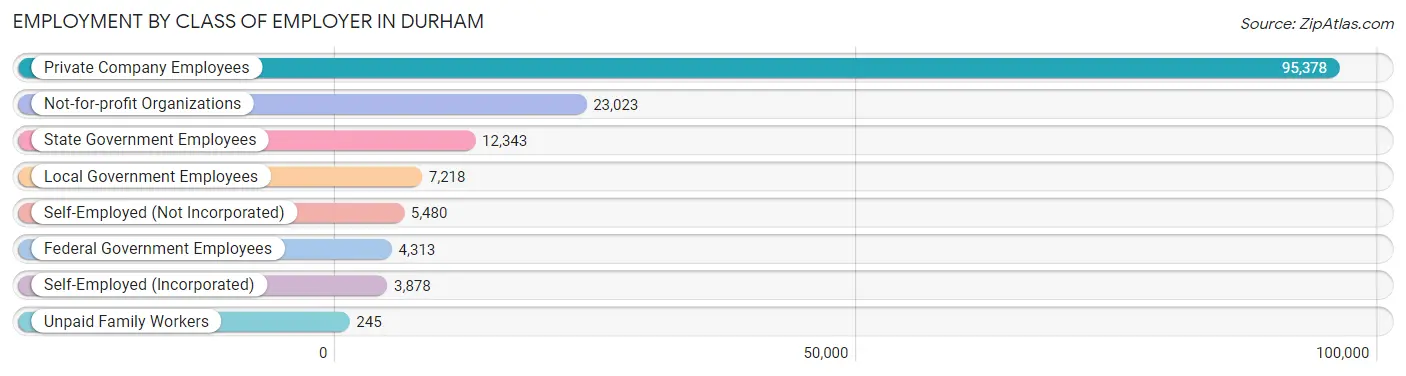
| Employer Class | # Employees | % Employees |
| Private Company Employees | 95,378 | 62.8% |
| Self-Employed (Incorporated) | 3,878 | 2.5% |
| Self-Employed (Not Incorporated) | 5,480 | 3.6% |
| Not-for-profit Organizations | 23,023 | 15.2% |
| Local Government Employees | 7,218 | 4.8% |
| State Government Employees | 12,343 | 8.1% |
| Federal Government Employees | 4,313 | 2.8% |
| Unpaid Family Workers | 245 | 0.2% |
| Total | 151,878 | 100.0% |
Employment Status by Age in Durham
According to the labor force statistics for Durham, out of the total population over 16 years of age (232,921), 69.4% or 161,647 individuals are in the labor force, with 4.3% or 6,951 of them unemployed. The age group with the highest labor force participation rate is 35 to 44 years, with 89.5% or 35,829 individuals in the labor force. Within the labor force, the 16 to 19 years age range has the highest percentage of unemployed individuals, with 17.0% or 962 of them being unemployed.
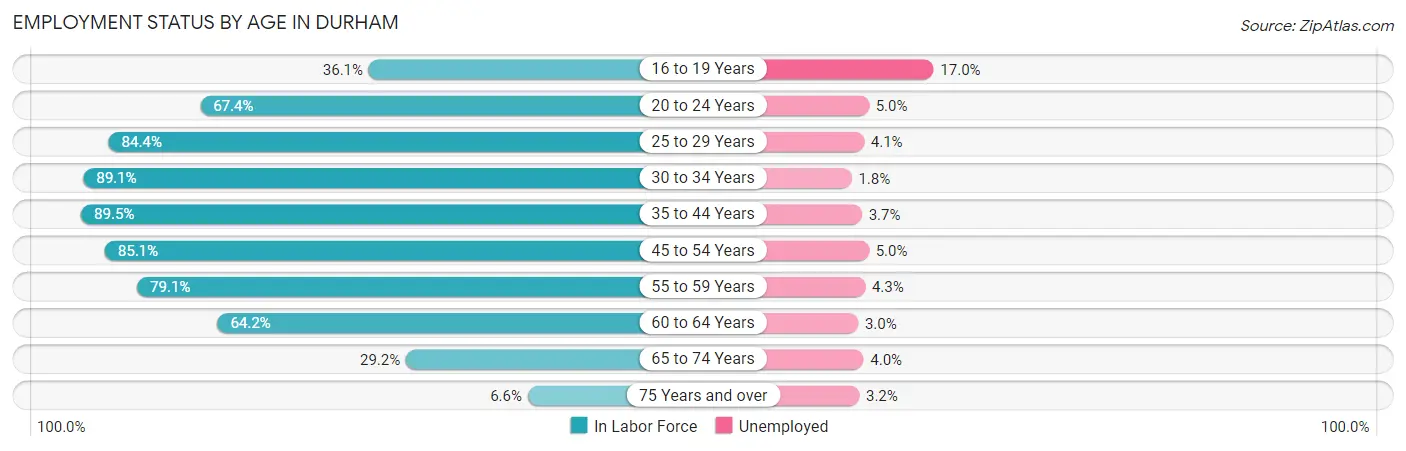
| Age Bracket | In Labor Force | Unemployed |
| 16 to 19 Years | 5,659 (36.1%) | 962 (17.0%) |
| 20 to 24 Years | 15,054 (67.4%) | 753 (5.0%) |
| 25 to 29 Years | 22,718 (84.4%) | 931 (4.1%) |
| 30 to 34 Years | 24,432 (89.1%) | 440 (1.8%) |
| 35 to 44 Years | 35,829 (89.5%) | 1,326 (3.7%) |
| 45 to 54 Years | 28,530 (85.1%) | 1,426 (5.0%) |
| 55 to 59 Years | 12,087 (79.1%) | 520 (4.3%) |
| 60 to 64 Years | 9,975 (64.2%) | 299 (3.0%) |
| 65 to 74 Years | 6,502 (29.2%) | 260 (4.0%) |
| 75 Years and over | 919 (6.6%) | 29 (3.2%) |
| Total | 161,647 (69.4%) | 6,951 (4.3%) |
Employment Status by Educational Attainment in Durham
According to labor force statistics for Durham, 84.2% of individuals (133,637) out of the total population between 25 and 64 years of age (158,714) are in the labor force, with 3.7% or 4,945 of them being unemployed. The group with the highest labor force participation rate are those with the educational attainment of bachelor's degree or higher, with 89.6% or 79,033 individuals in the labor force. Within the labor force, individuals with high school diploma education have the highest percentage of unemployment, with 6.7% or 1,232 of them being unemployed.
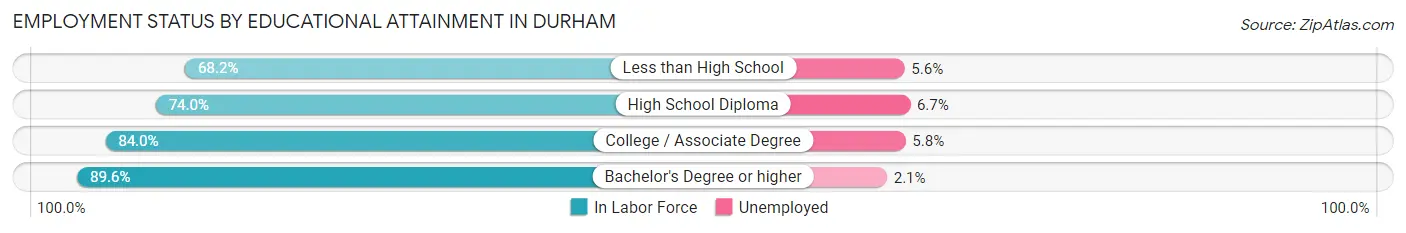
| Educational Attainment | In Labor Force | Unemployed |
| Less than High School | 9,453 (68.2%) | 776 (5.6%) |
| High School Diploma | 18,395 (74.0%) | 1,665 (6.7%) |
| College / Associate Degree | 26,703 (84.0%) | 1,844 (5.8%) |
| Bachelor's Degree or higher | 79,033 (89.6%) | 1,852 (2.1%) |
| Total | 133,637 (84.2%) | 5,872 (3.7%) |
Employment Occupations by Sex in Durham
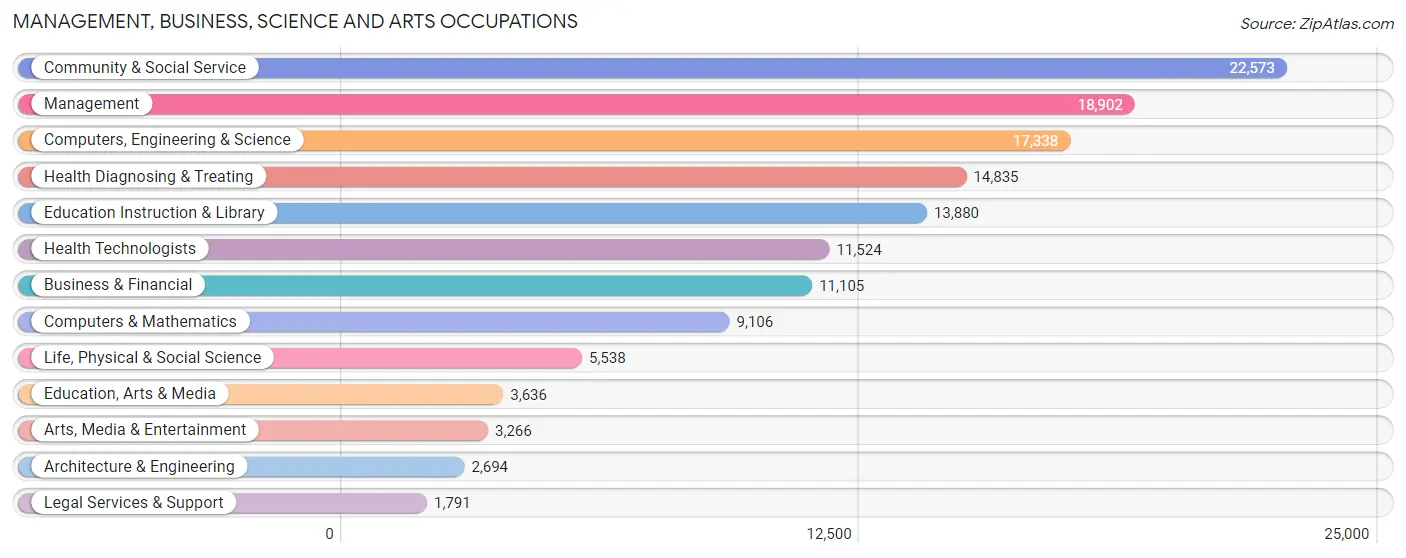
Management, Business, Science and Arts Occupations
The most common Management, Business, Science and Arts occupations in Durham are Community & Social Service (22,573 | 14.6%), Management (18,902 | 12.2%), Computers, Engineering & Science (17,338 | 11.2%), Health Diagnosing & Treating (14,835 | 9.6%), and Education Instruction & Library (13,880 | 9.0%).
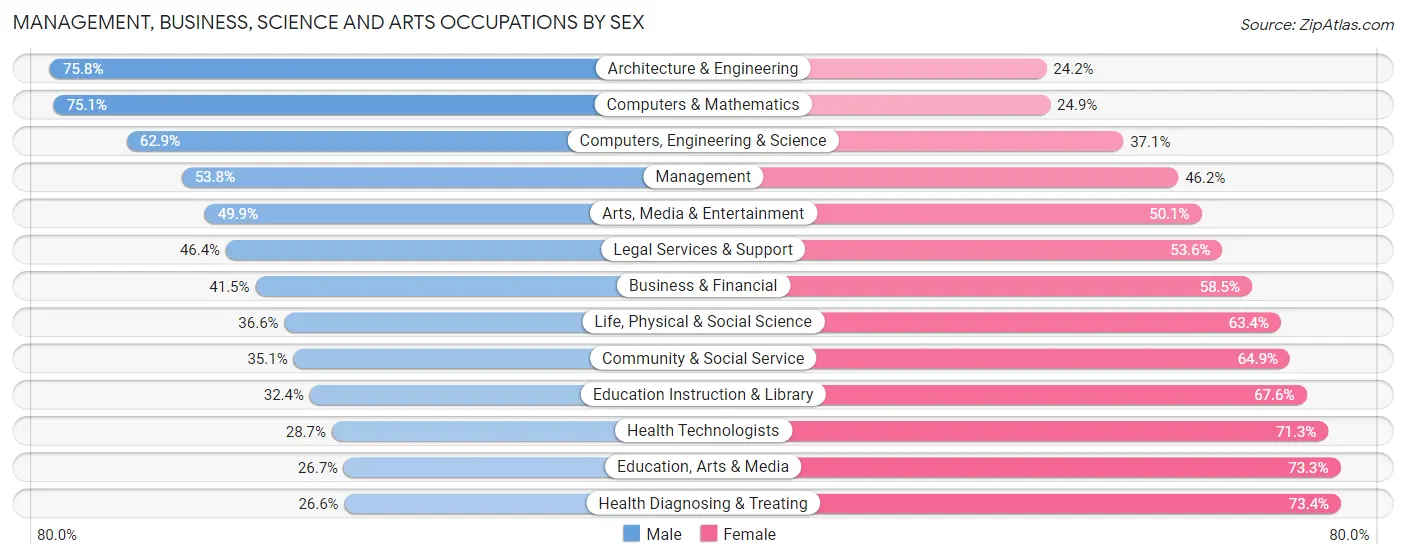
Management, Business, Science and Arts Occupations by Sex
Within the Management, Business, Science and Arts occupations in Durham, the most male-oriented occupations are Architecture & Engineering (75.8%), Computers & Mathematics (75.1%), and Computers, Engineering & Science (62.9%), while the most female-oriented occupations are Health Diagnosing & Treating (73.4%), Education, Arts & Media (73.3%), and Health Technologists (71.3%).
| Occupation | Male | Female |
| Management | 10,163 (53.8%) | 8,739 (46.2%) |
| Business & Financial | 4,607 (41.5%) | 6,498 (58.5%) |
| Computers, Engineering & Science | 10,912 (62.9%) | 6,426 (37.1%) |
| Computers & Mathematics | 6,842 (75.1%) | 2,264 (24.9%) |
| Architecture & Engineering | 2,041 (75.8%) | 653 (24.2%) |
| Life, Physical & Social Science | 2,029 (36.6%) | 3,509 (63.4%) |
| Community & Social Service | 7,931 (35.1%) | 14,642 (64.9%) |
| Education, Arts & Media | 971 (26.7%) | 2,665 (73.3%) |
| Legal Services & Support | 831 (46.4%) | 960 (53.6%) |
| Education Instruction & Library | 4,499 (32.4%) | 9,381 (67.6%) |
| Arts, Media & Entertainment | 1,630 (49.9%) | 1,636 (50.1%) |
| Health Diagnosing & Treating | 3,949 (26.6%) | 10,886 (73.4%) |
| Health Technologists | 3,312 (28.7%) | 8,212 (71.3%) |
| Total (Category) | 37,562 (44.3%) | 47,191 (55.7%) |
| Total (Overall) | 74,594 (48.3%) | 79,804 (51.7%) |
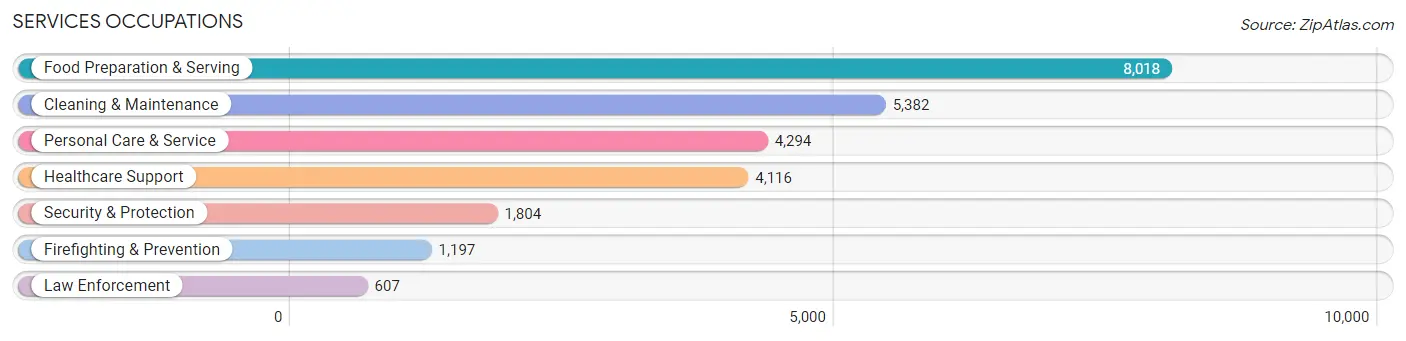
Services Occupations
The most common Services occupations in Durham are Food Preparation & Serving (8,018 | 5.2%), Cleaning & Maintenance (5,382 | 3.5%), Personal Care & Service (4,294 | 2.8%), Healthcare Support (4,116 | 2.7%), and Security & Protection (1,804 | 1.2%).
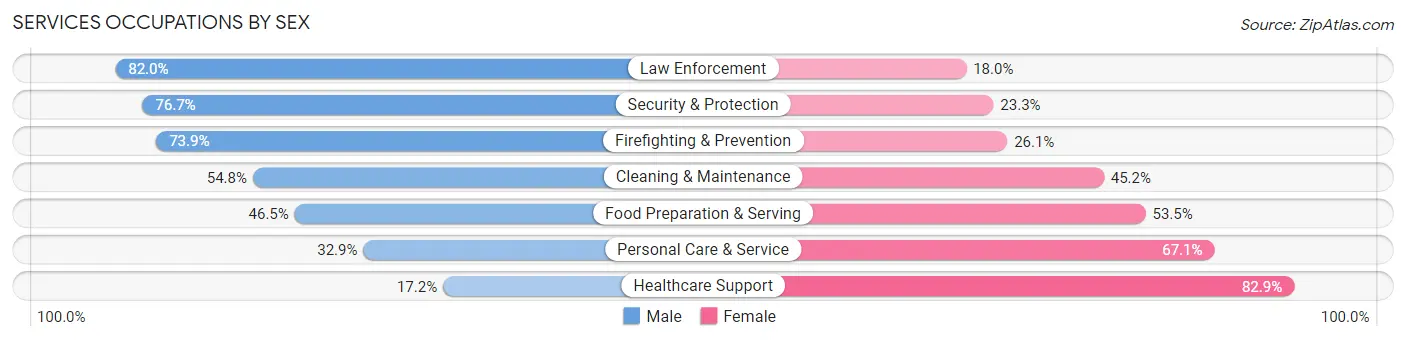
Services Occupations by Sex
Within the Services occupations in Durham, the most male-oriented occupations are Law Enforcement (82.0%), Security & Protection (76.7%), and Firefighting & Prevention (73.9%), while the most female-oriented occupations are Healthcare Support (82.9%), Personal Care & Service (67.1%), and Food Preparation & Serving (53.5%).
| Occupation | Male | Female |
| Healthcare Support | 706 (17.2%) | 3,410 (82.9%) |
| Security & Protection | 1,383 (76.7%) | 421 (23.3%) |
| Firefighting & Prevention | 885 (73.9%) | 312 (26.1%) |
| Law Enforcement | 498 (82.0%) | 109 (18.0%) |
| Food Preparation & Serving | 3,731 (46.5%) | 4,287 (53.5%) |
| Cleaning & Maintenance | 2,950 (54.8%) | 2,432 (45.2%) |
| Personal Care & Service | 1,414 (32.9%) | 2,880 (67.1%) |
| Total (Category) | 10,184 (43.1%) | 13,430 (56.9%) |
| Total (Overall) | 74,594 (48.3%) | 79,804 (51.7%) |
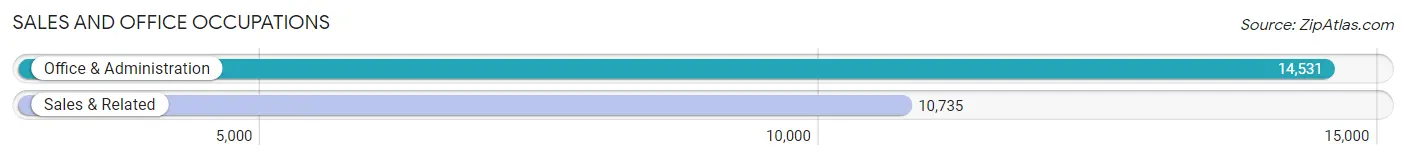
Sales and Office Occupations
The most common Sales and Office occupations in Durham are Office & Administration (14,531 | 9.4%), and Sales & Related (10,735 | 7.0%).
Sales and Office Occupations by Sex
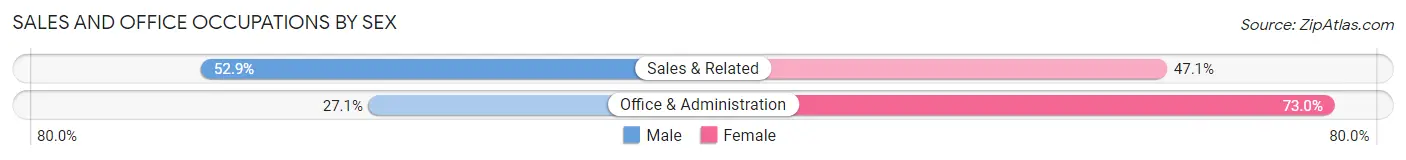
| Occupation | Male | Female |
| Sales & Related | 5,676 (52.9%) | 5,059 (47.1%) |
| Office & Administration | 3,930 (27.1%) | 10,601 (73.0%) |
| Total (Category) | 9,606 (38.0%) | 15,660 (62.0%) |
| Total (Overall) | 74,594 (48.3%) | 79,804 (51.7%) |
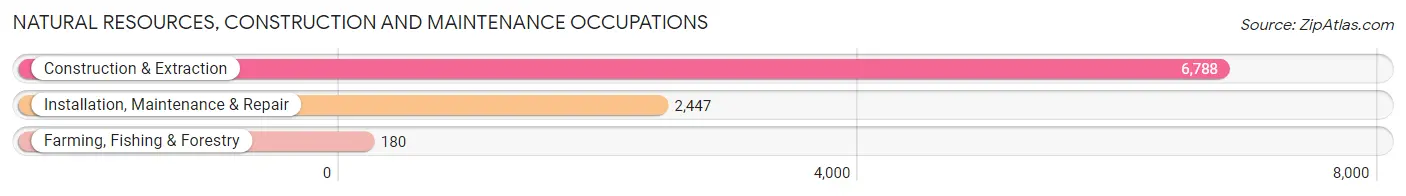
Natural Resources, Construction and Maintenance Occupations
The most common Natural Resources, Construction and Maintenance occupations in Durham are Construction & Extraction (6,788 | 4.4%), Installation, Maintenance & Repair (2,447 | 1.6%), and Farming, Fishing & Forestry (180 | 0.1%).
Natural Resources, Construction and Maintenance Occupations by Sex
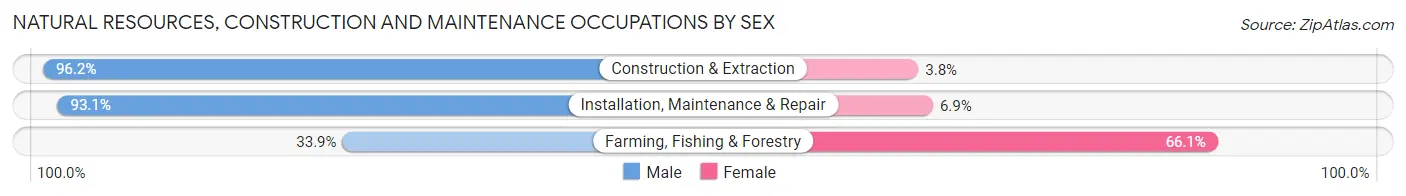
| Occupation | Male | Female |
| Farming, Fishing & Forestry | 61 (33.9%) | 119 (66.1%) |
| Construction & Extraction | 6,528 (96.2%) | 260 (3.8%) |
| Installation, Maintenance & Repair | 2,279 (93.1%) | 168 (6.9%) |
| Total (Category) | 8,868 (94.2%) | 547 (5.8%) |
| Total (Overall) | 74,594 (48.3%) | 79,804 (51.7%) |
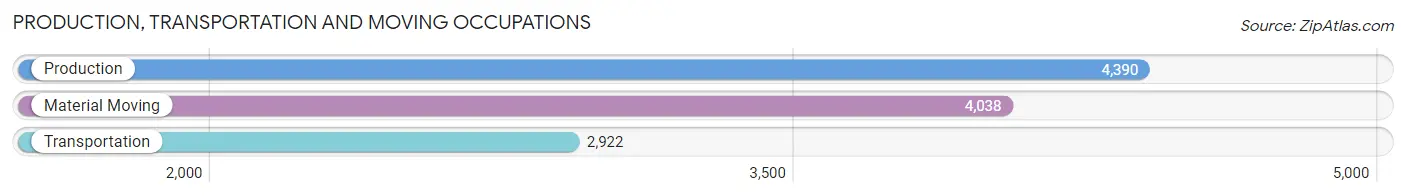
Production, Transportation and Moving Occupations
The most common Production, Transportation and Moving occupations in Durham are Production (4,390 | 2.8%), Material Moving (4,038 | 2.6%), and Transportation (2,922 | 1.9%).
Production, Transportation and Moving Occupations by Sex
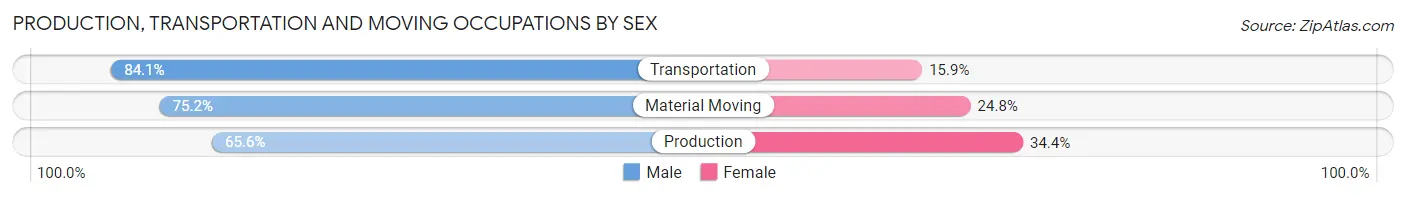
| Occupation | Male | Female |
| Production | 2,880 (65.6%) | 1,510 (34.4%) |
| Transportation | 2,457 (84.1%) | 465 (15.9%) |
| Material Moving | 3,037 (75.2%) | 1,001 (24.8%) |
| Total (Category) | 8,374 (73.8%) | 2,976 (26.2%) |
| Total (Overall) | 74,594 (48.3%) | 79,804 (51.7%) |
Employment Industries by Sex in Durham
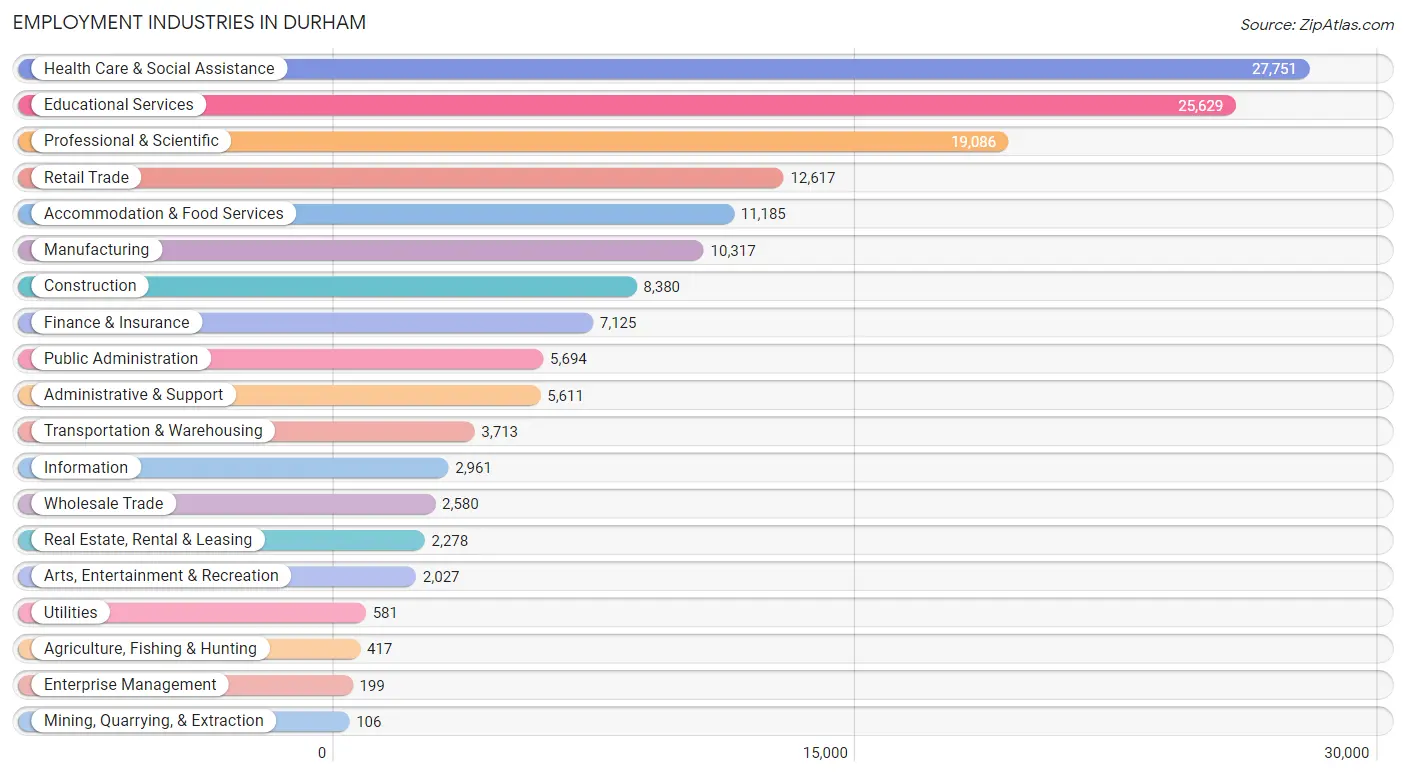
Employment Industries in Durham
The major employment industries in Durham include Health Care & Social Assistance (27,751 | 18.0%), Educational Services (25,629 | 16.6%), Professional & Scientific (19,086 | 12.4%), Retail Trade (12,617 | 8.2%), and Accommodation & Food Services (11,185 | 7.2%).
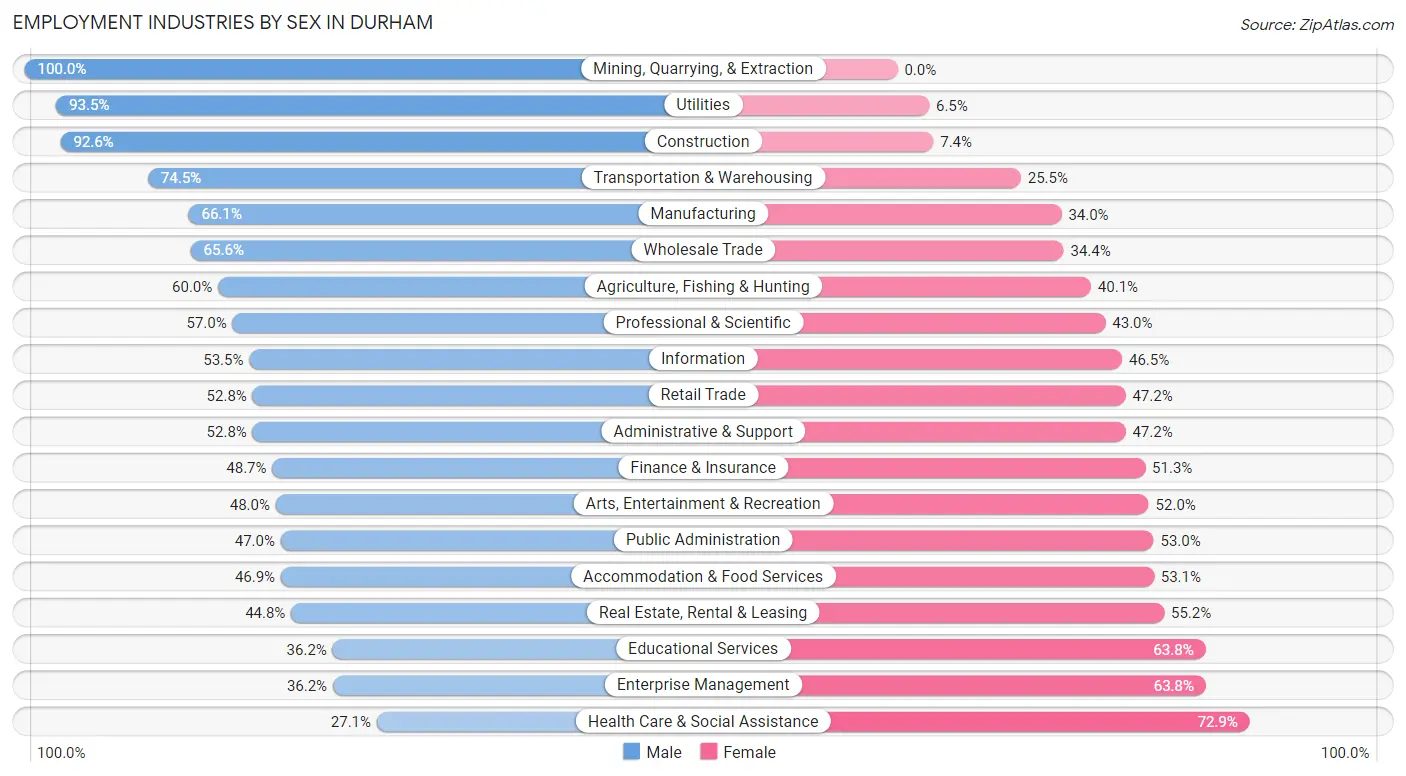
Employment Industries by Sex in Durham
The Durham industries that see more men than women are Mining, Quarrying, & Extraction (100.0%), Utilities (93.5%), and Construction (92.6%), whereas the industries that tend to have a higher number of women are Health Care & Social Assistance (72.9%), Enterprise Management (63.8%), and Educational Services (63.8%).
| Industry | Male | Female |
| Agriculture, Fishing & Hunting | 250 (60.0%) | 167 (40.1%) |
| Mining, Quarrying, & Extraction | 106 (100.0%) | 0 (0.0%) |
| Construction | 7,757 (92.6%) | 623 (7.4%) |
| Manufacturing | 6,814 (66.0%) | 3,503 (34.0%) |
| Wholesale Trade | 1,693 (65.6%) | 887 (34.4%) |
| Retail Trade | 6,660 (52.8%) | 5,957 (47.2%) |
| Transportation & Warehousing | 2,765 (74.5%) | 948 (25.5%) |
| Utilities | 543 (93.5%) | 38 (6.5%) |
| Information | 1,584 (53.5%) | 1,377 (46.5%) |
| Finance & Insurance | 3,471 (48.7%) | 3,654 (51.3%) |
| Real Estate, Rental & Leasing | 1,021 (44.8%) | 1,257 (55.2%) |
| Professional & Scientific | 10,871 (57.0%) | 8,215 (43.0%) |
| Enterprise Management | 72 (36.2%) | 127 (63.8%) |
| Administrative & Support | 2,962 (52.8%) | 2,649 (47.2%) |
| Educational Services | 9,287 (36.2%) | 16,342 (63.8%) |
| Health Care & Social Assistance | 7,519 (27.1%) | 20,232 (72.9%) |
| Arts, Entertainment & Recreation | 973 (48.0%) | 1,054 (52.0%) |
| Accommodation & Food Services | 5,250 (46.9%) | 5,935 (53.1%) |
| Public Administration | 2,675 (47.0%) | 3,019 (53.0%) |
| Total | 74,594 (48.3%) | 79,804 (51.7%) |
Education in Durham
School Enrollment in Durham
The most common levels of schooling among the 73,883 students in Durham are college / undergraduate (18,442 | 25.0%), high school (13,065 | 17.7%), and middle school (12,315 | 16.7%).
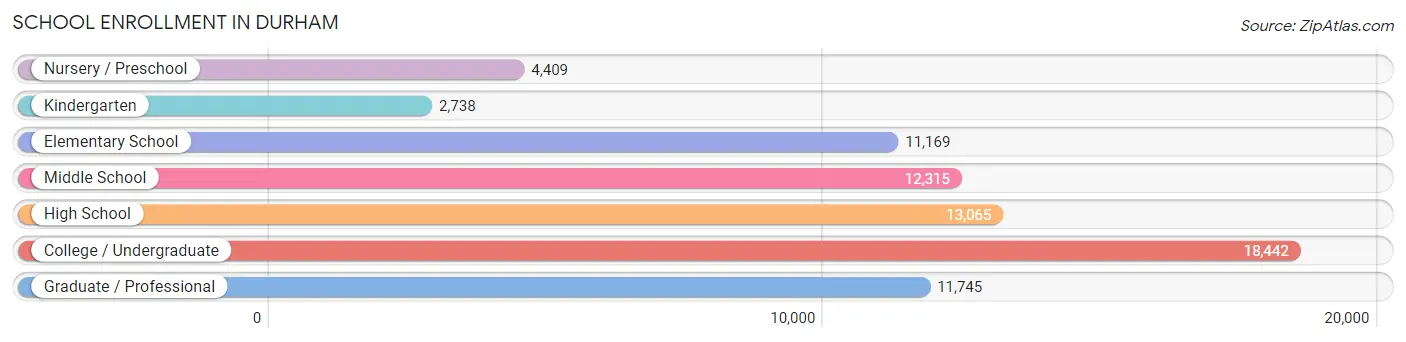
| School Level | # Students | % Students |
| Nursery / Preschool | 4,409 | 6.0% |
| Kindergarten | 2,738 | 3.7% |
| Elementary School | 11,169 | 15.1% |
| Middle School | 12,315 | 16.7% |
| High School | 13,065 | 17.7% |
| College / Undergraduate | 18,442 | 25.0% |
| Graduate / Professional | 11,745 | 15.9% |
| Total | 73,883 | 100.0% |
School Enrollment by Age by Funding Source in Durham
Out of a total of 73,883 students who are enrolled in schools in Durham, 22,830 (30.9%) attend a private institution, while the remaining 51,053 (69.1%) are enrolled in public schools. The age group of 20 to 24 year olds has the highest likelihood of being enrolled in private schools, with 6,366 (56.2% in the age bracket) enrolled. Conversely, the age group of 15 to 17 year olds has the lowest likelihood of being enrolled in a private school, with 7,472 (87.2% in the age bracket) attending a public institution.
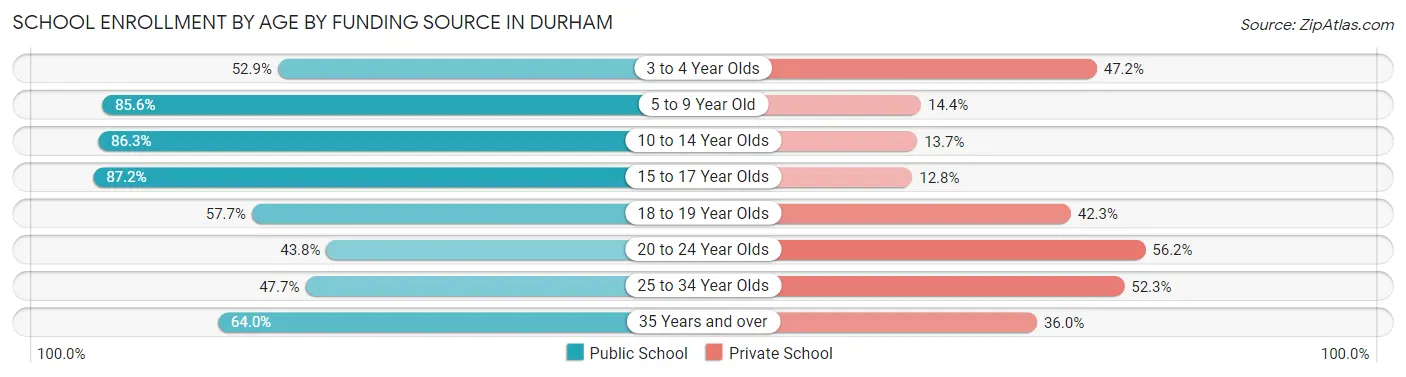
| Age Bracket | Public School | Private School |
| 3 to 4 Year Olds | 1,724 (52.8%) | 1,538 (47.1%) |
| 5 to 9 Year Old | 11,830 (85.6%) | 1,994 (14.4%) |
| 10 to 14 Year Olds | 13,273 (86.3%) | 2,107 (13.7%) |
| 15 to 17 Year Olds | 7,472 (87.2%) | 1,096 (12.8%) |
| 18 to 19 Year Olds | 4,559 (57.7%) | 3,343 (42.3%) |
| 20 to 24 Year Olds | 4,963 (43.8%) | 6,366 (56.2%) |
| 25 to 34 Year Olds | 4,252 (47.7%) | 4,656 (52.3%) |
| 35 Years and over | 3,014 (64.0%) | 1,696 (36.0%) |
| Total | 51,053 (69.1%) | 22,830 (30.9%) |
Educational Attainment by Field of Study in Durham
Business (14,240 | 12.3%), bio, nature & agricultural (12,524 | 10.8%), social sciences (12,414 | 10.7%), science & technology (11,627 | 10.0%), and education (8,728 | 7.5%) are the most common fields of study among 116,195 individuals in Durham who have obtained a bachelor's degree or higher.
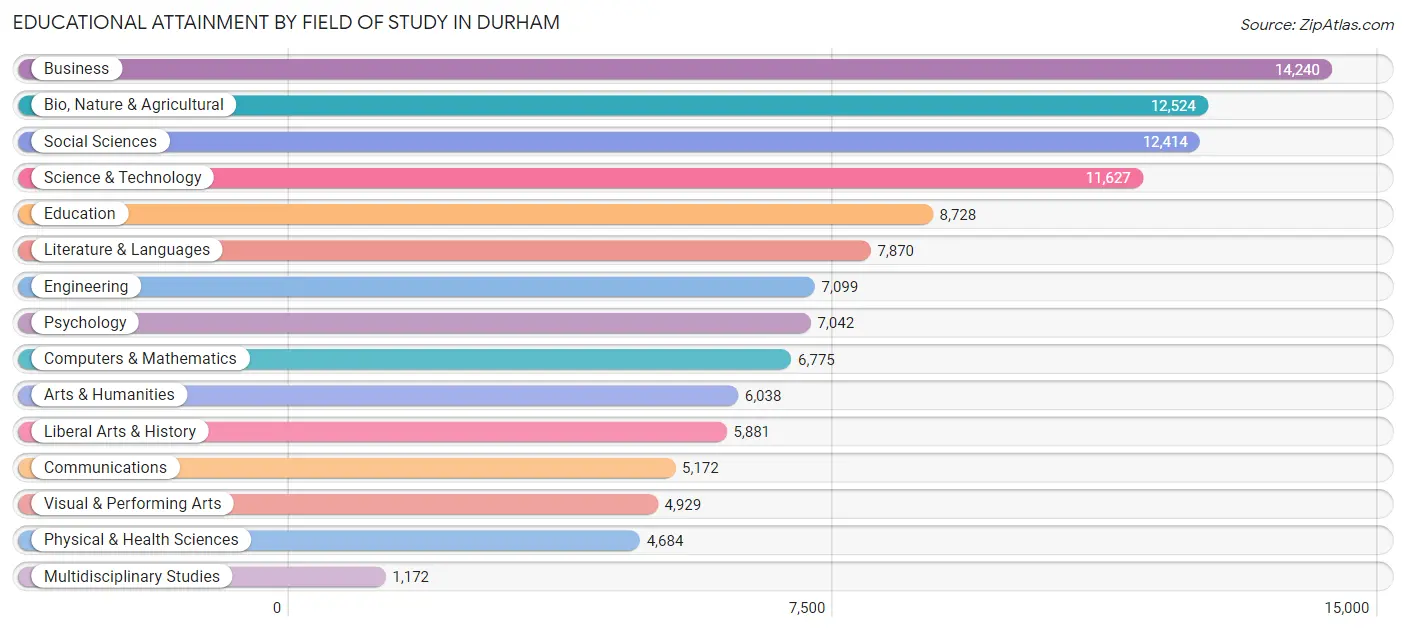
| Field of Study | # Graduates | % Graduates |
| Computers & Mathematics | 6,775 | 5.8% |
| Bio, Nature & Agricultural | 12,524 | 10.8% |
| Physical & Health Sciences | 4,684 | 4.0% |
| Psychology | 7,042 | 6.1% |
| Social Sciences | 12,414 | 10.7% |
| Engineering | 7,099 | 6.1% |
| Multidisciplinary Studies | 1,172 | 1.0% |
| Science & Technology | 11,627 | 10.0% |
| Business | 14,240 | 12.3% |
| Education | 8,728 | 7.5% |
| Literature & Languages | 7,870 | 6.8% |
| Liberal Arts & History | 5,881 | 5.1% |
| Visual & Performing Arts | 4,929 | 4.2% |
| Communications | 5,172 | 4.4% |
| Arts & Humanities | 6,038 | 5.2% |
| Total | 116,195 | 100.0% |
Transportation & Commute in Durham
Vehicle Availability by Sex in Durham
The most prevalent vehicle ownership categories in Durham are males with 2 vehicles (35,436, accounting for 49.3%) and females with 2 vehicles (34,592, making up 46.1%).
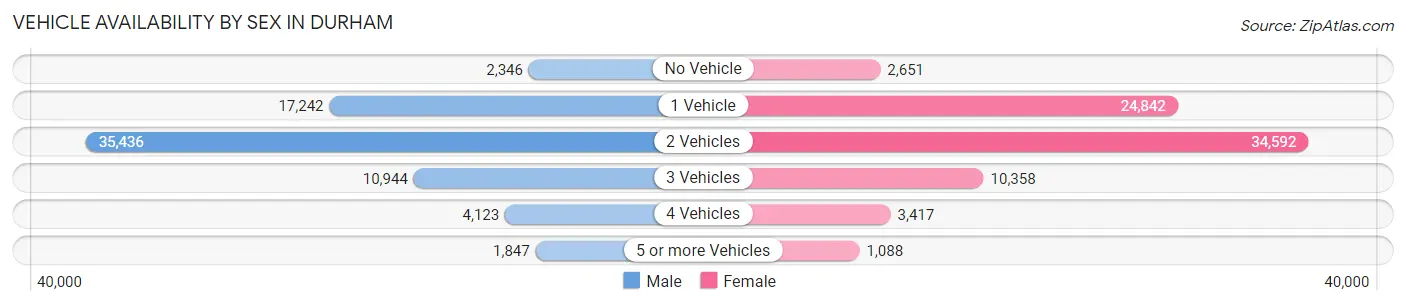
| Vehicles Available | Male | Female |
| No Vehicle | 2,346 (3.3%) | 2,651 (3.5%) |
| 1 Vehicle | 17,242 (24.0%) | 24,842 (32.3%) |
| 2 Vehicles | 35,436 (49.3%) | 34,592 (45.0%) |
| 3 Vehicles | 10,944 (15.2%) | 10,358 (13.5%) |
| 4 Vehicles | 4,123 (5.7%) | 3,417 (4.4%) |
| 5 or more Vehicles | 1,847 (2.6%) | 1,088 (1.4%) |
| Total | 71,938 (100.0%) | 76,948 (100.0%) |
Commute Time in Durham
The most frequently occuring commute durations in Durham are 15 to 19 minutes (26,721 commuters, 21.4%), 20 to 24 minutes (22,123 commuters, 17.7%), and 10 to 14 minutes (21,449 commuters, 17.2%).
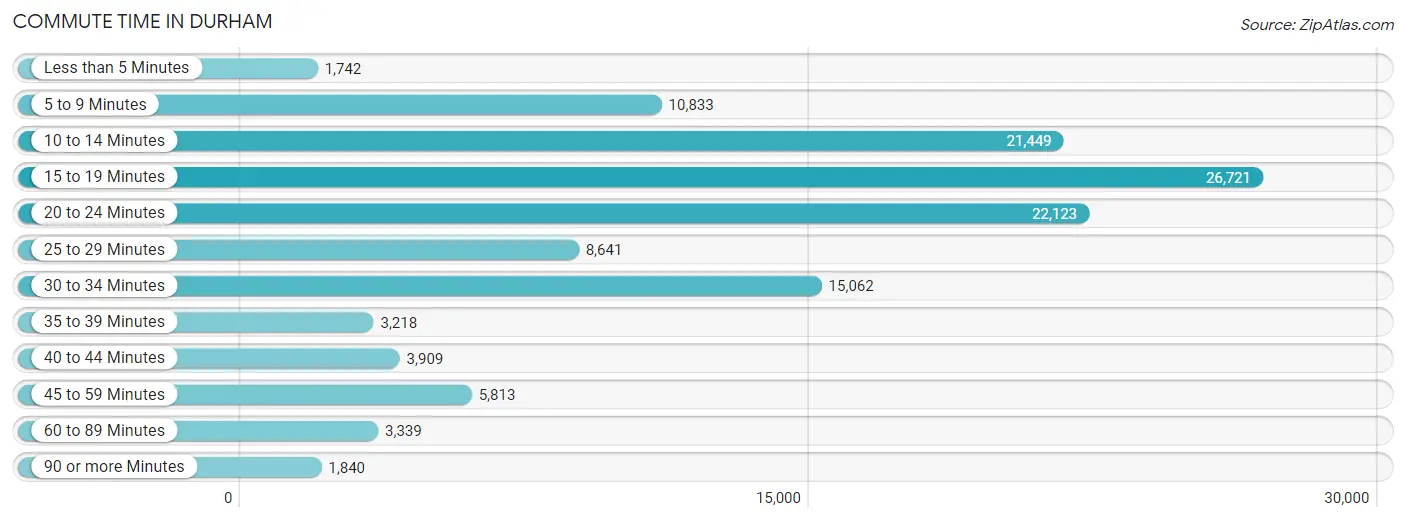
| Commute Time | # Commuters | % Commuters |
| Less than 5 Minutes | 1,742 | 1.4% |
| 5 to 9 Minutes | 10,833 | 8.7% |
| 10 to 14 Minutes | 21,449 | 17.2% |
| 15 to 19 Minutes | 26,721 | 21.4% |
| 20 to 24 Minutes | 22,123 | 17.7% |
| 25 to 29 Minutes | 8,641 | 6.9% |
| 30 to 34 Minutes | 15,062 | 12.1% |
| 35 to 39 Minutes | 3,218 | 2.6% |
| 40 to 44 Minutes | 3,909 | 3.1% |
| 45 to 59 Minutes | 5,813 | 4.7% |
| 60 to 89 Minutes | 3,339 | 2.7% |
| 90 or more Minutes | 1,840 | 1.5% |
Commute Time by Sex in Durham
The most common commute times in Durham are 15 to 19 minutes (12,485 commuters, 20.4%) for males and 15 to 19 minutes (14,236 commuters, 22.4%) for females.
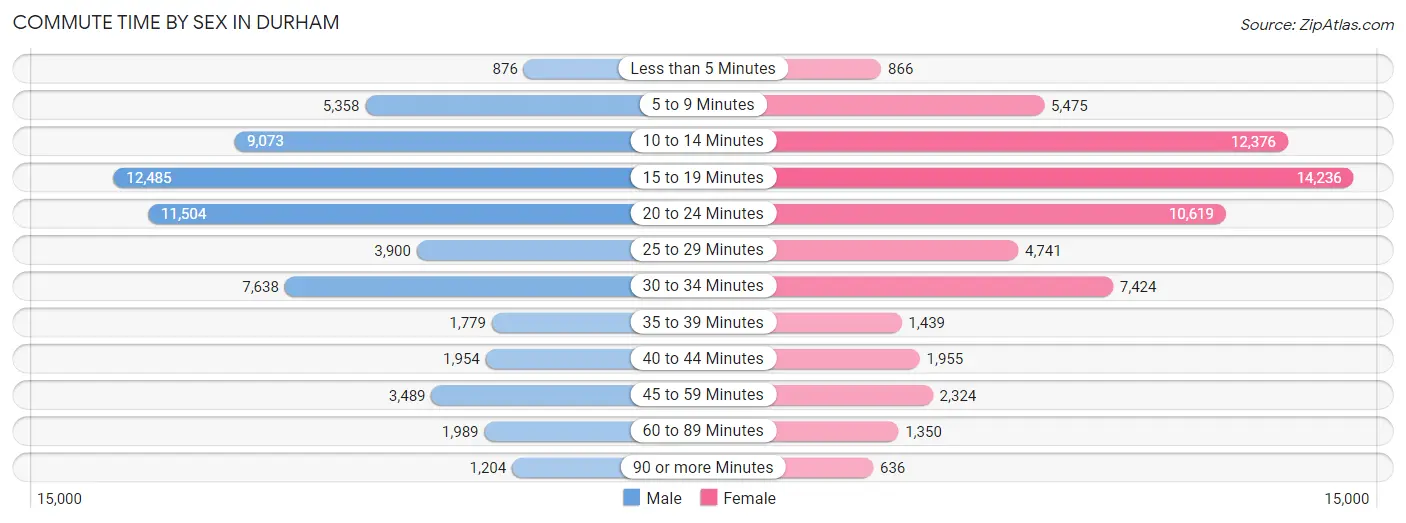
| Commute Time | Male | Female |
| Less than 5 Minutes | 876 (1.4%) | 866 (1.4%) |
| 5 to 9 Minutes | 5,358 (8.7%) | 5,475 (8.6%) |
| 10 to 14 Minutes | 9,073 (14.8%) | 12,376 (19.5%) |
| 15 to 19 Minutes | 12,485 (20.4%) | 14,236 (22.4%) |
| 20 to 24 Minutes | 11,504 (18.8%) | 10,619 (16.7%) |
| 25 to 29 Minutes | 3,900 (6.4%) | 4,741 (7.5%) |
| 30 to 34 Minutes | 7,638 (12.5%) | 7,424 (11.7%) |
| 35 to 39 Minutes | 1,779 (2.9%) | 1,439 (2.3%) |
| 40 to 44 Minutes | 1,954 (3.2%) | 1,955 (3.1%) |
| 45 to 59 Minutes | 3,489 (5.7%) | 2,324 (3.7%) |
| 60 to 89 Minutes | 1,989 (3.3%) | 1,350 (2.1%) |
| 90 or more Minutes | 1,204 (2.0%) | 636 (1.0%) |
Time of Departure to Work by Sex in Durham
The most frequent times of departure to work in Durham are 8:00 AM to 8:29 AM (8,265, 13.5%) for males and 8:00 AM to 8:29 AM (9,611, 15.1%) for females.
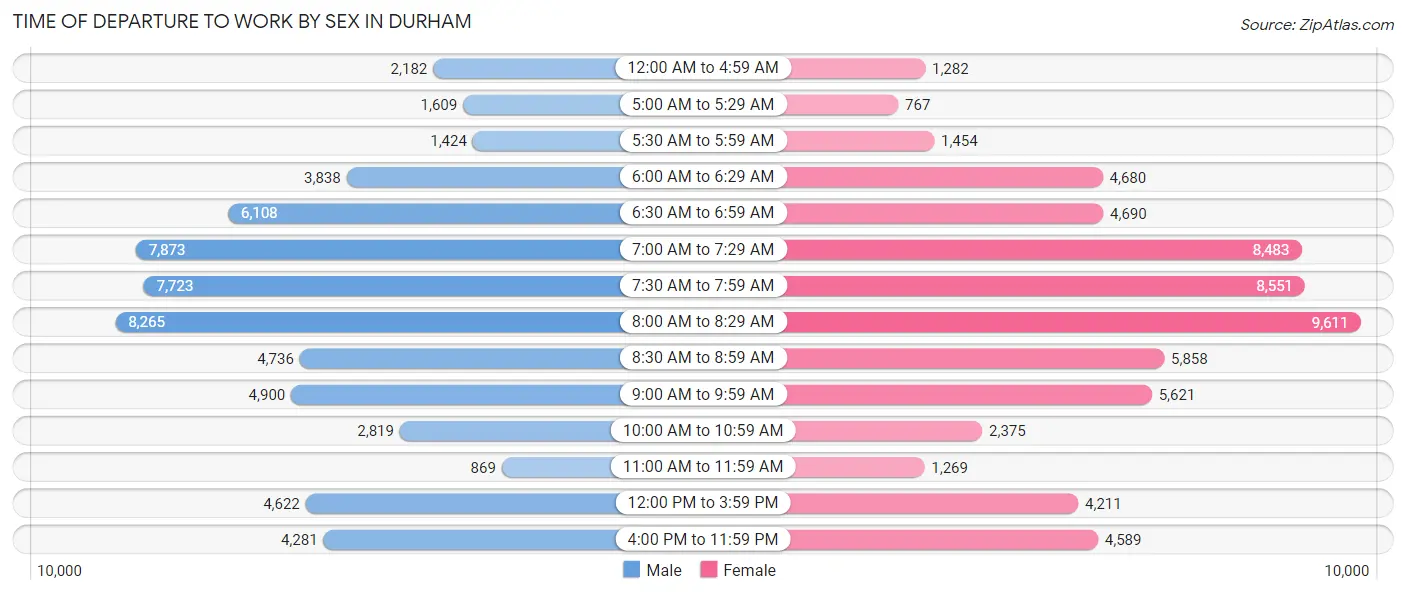
| Time of Departure | Male | Female |
| 12:00 AM to 4:59 AM | 2,182 (3.6%) | 1,282 (2.0%) |
| 5:00 AM to 5:29 AM | 1,609 (2.6%) | 767 (1.2%) |
| 5:30 AM to 5:59 AM | 1,424 (2.3%) | 1,454 (2.3%) |
| 6:00 AM to 6:29 AM | 3,838 (6.3%) | 4,680 (7.4%) |
| 6:30 AM to 6:59 AM | 6,108 (10.0%) | 4,690 (7.4%) |
| 7:00 AM to 7:29 AM | 7,873 (12.9%) | 8,483 (13.4%) |
| 7:30 AM to 7:59 AM | 7,723 (12.6%) | 8,551 (13.5%) |
| 8:00 AM to 8:29 AM | 8,265 (13.5%) | 9,611 (15.1%) |
| 8:30 AM to 8:59 AM | 4,736 (7.7%) | 5,858 (9.2%) |
| 9:00 AM to 9:59 AM | 4,900 (8.0%) | 5,621 (8.9%) |
| 10:00 AM to 10:59 AM | 2,819 (4.6%) | 2,375 (3.7%) |
| 11:00 AM to 11:59 AM | 869 (1.4%) | 1,269 (2.0%) |
| 12:00 PM to 3:59 PM | 4,622 (7.5%) | 4,211 (6.6%) |
| 4:00 PM to 11:59 PM | 4,281 (7.0%) | 4,589 (7.2%) |
| Total | 61,249 (100.0%) | 63,441 (100.0%) |
Housing Occupancy in Durham
Occupancy by Ownership in Durham
Of the total 120,386 dwellings in Durham, owner-occupied units account for 62,613 (52.0%), while renter-occupied units make up 57,773 (48.0%).
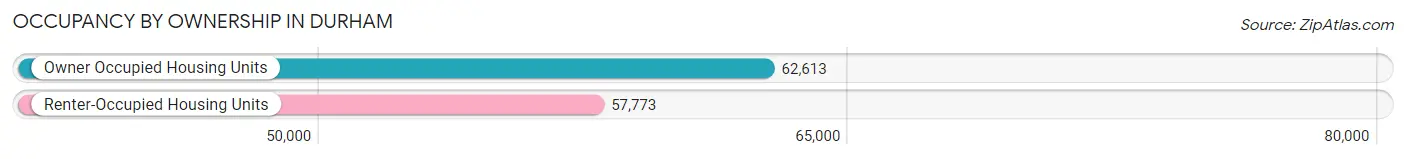
| Occupancy | # Housing Units | % Housing Units |
| Owner Occupied Housing Units | 62,613 | 52.0% |
| Renter-Occupied Housing Units | 57,773 | 48.0% |
| Total Occupied Housing Units | 120,386 | 100.0% |
Occupancy by Household Size in Durham
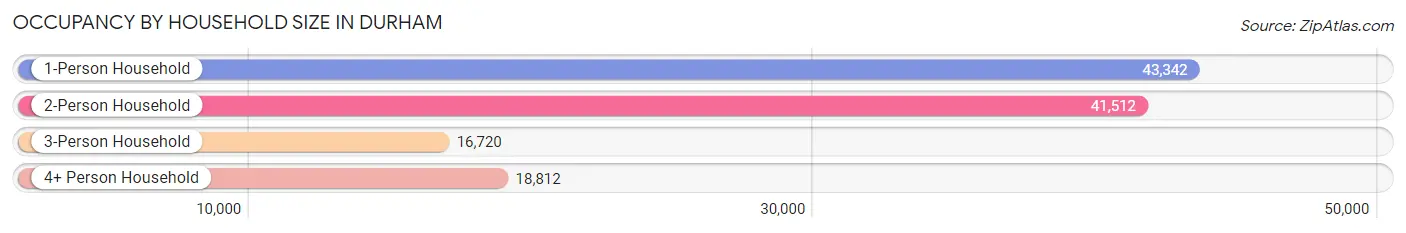
| Household Size | # Housing Units | % Housing Units |
| 1-Person Household | 43,342 | 36.0% |
| 2-Person Household | 41,512 | 34.5% |
| 3-Person Household | 16,720 | 13.9% |
| 4+ Person Household | 18,812 | 15.6% |
| Total Housing Units | 120,386 | 100.0% |
Occupancy by Ownership by Household Size in Durham
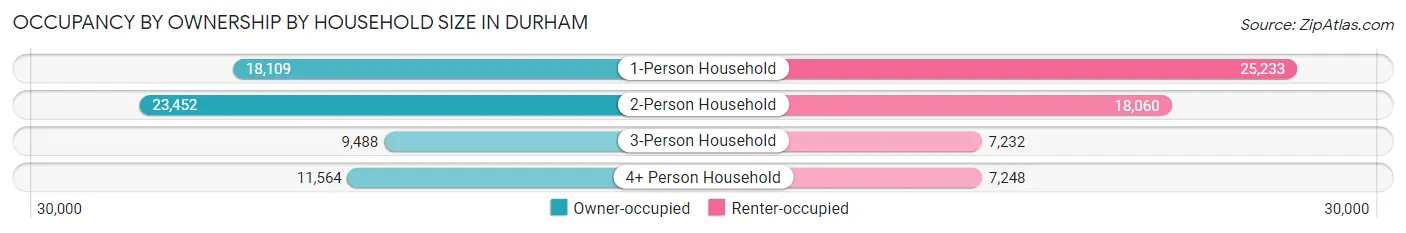
| Household Size | Owner-occupied | Renter-occupied |
| 1-Person Household | 18,109 (41.8%) | 25,233 (58.2%) |
| 2-Person Household | 23,452 (56.5%) | 18,060 (43.5%) |
| 3-Person Household | 9,488 (56.8%) | 7,232 (43.2%) |
| 4+ Person Household | 11,564 (61.5%) | 7,248 (38.5%) |
| Total Housing Units | 62,613 (52.0%) | 57,773 (48.0%) |
Occupancy by Educational Attainment in Durham
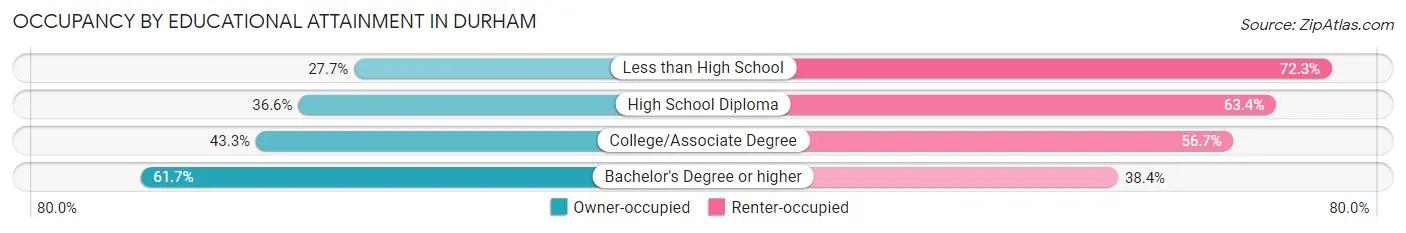
| Household Size | Owner-occupied | Renter-occupied |
| Less than High School | 2,201 (27.7%) | 5,739 (72.3%) |
| High School Diploma | 6,062 (36.6%) | 10,508 (63.4%) |
| College/Associate Degree | 11,243 (43.3%) | 14,716 (56.7%) |
| Bachelor's Degree or higher | 43,107 (61.7%) | 26,810 (38.4%) |
Occupancy by Age of Householder in Durham
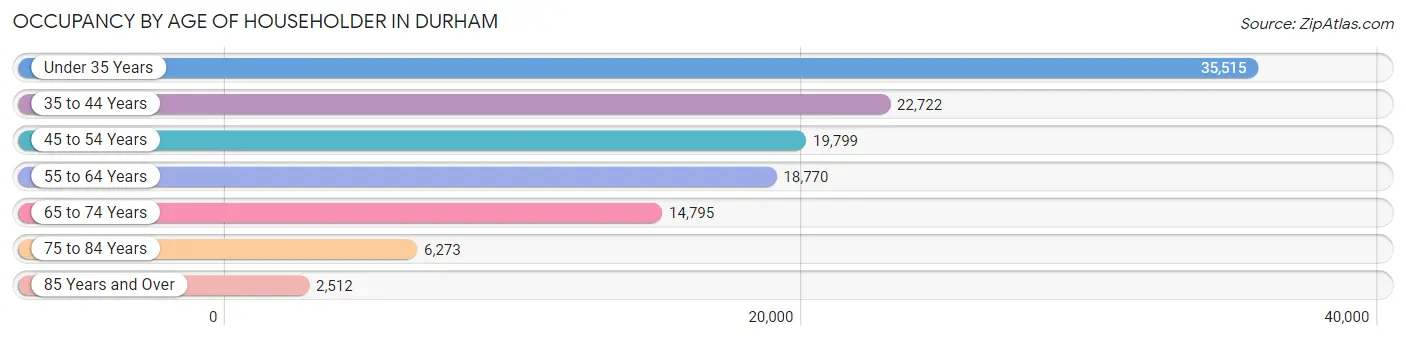
| Age Bracket | # Households | % Households |
| Under 35 Years | 35,515 | 29.5% |
| 35 to 44 Years | 22,722 | 18.9% |
| 45 to 54 Years | 19,799 | 16.5% |
| 55 to 64 Years | 18,770 | 15.6% |
| 65 to 74 Years | 14,795 | 12.3% |
| 75 to 84 Years | 6,273 | 5.2% |
| 85 Years and Over | 2,512 | 2.1% |
| Total | 120,386 | 100.0% |
Housing Finances in Durham
Median Income by Occupancy in Durham
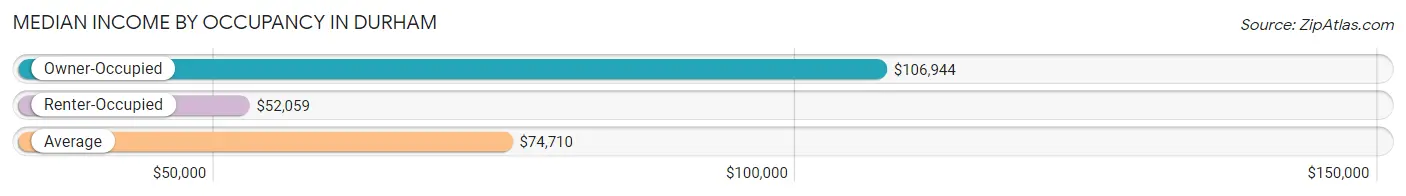
| Occupancy Type | # Households | Median Income |
| Owner-Occupied | 62,613 (52.0%) | $106,944 |
| Renter-Occupied | 57,773 (48.0%) | $52,059 |
| Average | 120,386 (100.0%) | $74,710 |
Occupancy by Householder Income Bracket in Durham
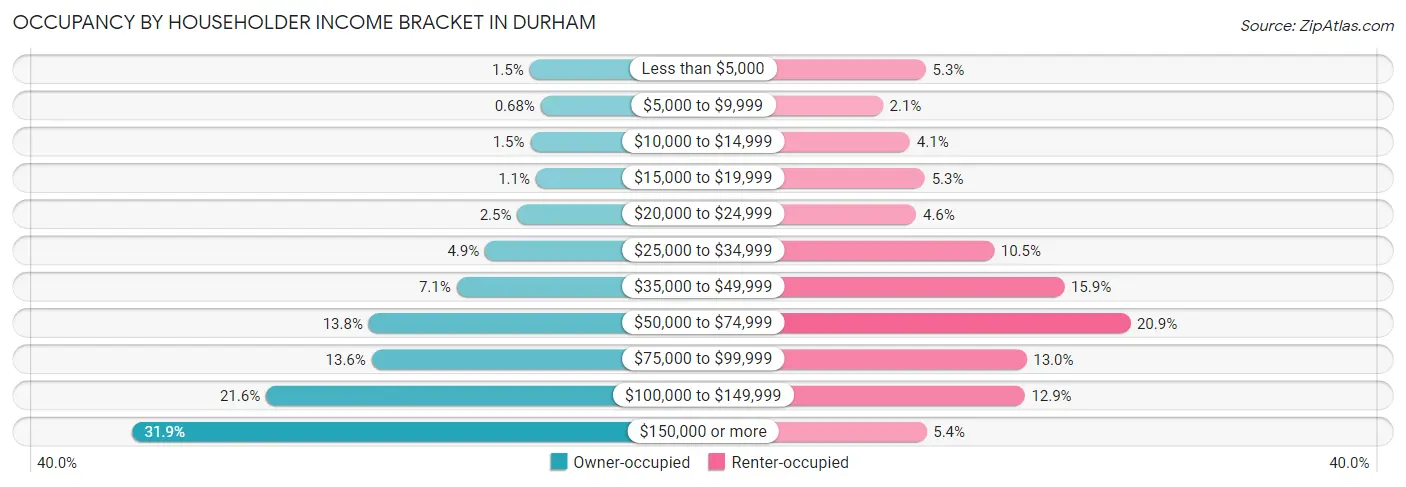
| Income Bracket | Owner-occupied | Renter-occupied |
| Less than $5,000 | 960 (1.5%) | 3,087 (5.3%) |
| $5,000 to $9,999 | 425 (0.7%) | 1,189 (2.1%) |
| $10,000 to $14,999 | 920 (1.5%) | 2,393 (4.1%) |
| $15,000 to $19,999 | 660 (1.1%) | 3,044 (5.3%) |
| $20,000 to $24,999 | 1,541 (2.5%) | 2,662 (4.6%) |
| $25,000 to $34,999 | 3,080 (4.9%) | 6,085 (10.5%) |
| $35,000 to $49,999 | 4,437 (7.1%) | 9,174 (15.9%) |
| $50,000 to $74,999 | 8,625 (13.8%) | 12,079 (20.9%) |
| $75,000 to $99,999 | 8,493 (13.6%) | 7,514 (13.0%) |
| $100,000 to $149,999 | 13,531 (21.6%) | 7,434 (12.9%) |
| $150,000 or more | 19,941 (31.9%) | 3,112 (5.4%) |
| Total | 62,613 (100.0%) | 57,773 (100.0%) |
Monthly Housing Cost Tiers in Durham
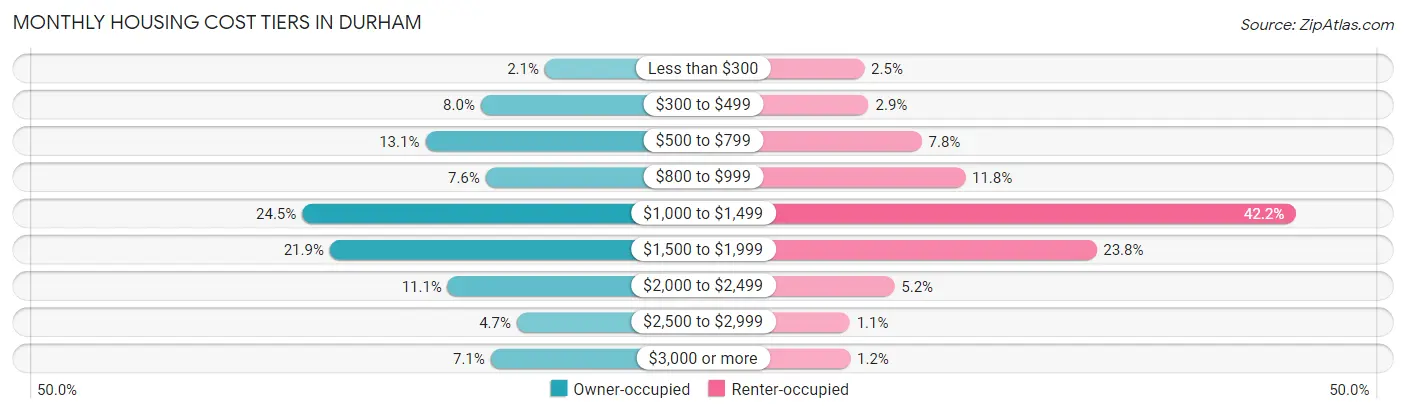
| Monthly Cost | Owner-occupied | Renter-occupied |
| Less than $300 | 1,323 (2.1%) | 1,422 (2.5%) |
| $300 to $499 | 5,013 (8.0%) | 1,659 (2.9%) |
| $500 to $799 | 8,216 (13.1%) | 4,476 (7.7%) |
| $800 to $999 | 4,736 (7.6%) | 6,786 (11.7%) |
| $1,000 to $1,499 | 15,307 (24.4%) | 24,397 (42.2%) |
| $1,500 to $1,999 | 13,720 (21.9%) | 13,765 (23.8%) |
| $2,000 to $2,499 | 6,918 (11.1%) | 3,029 (5.2%) |
| $2,500 to $2,999 | 2,934 (4.7%) | 653 (1.1%) |
| $3,000 or more | 4,446 (7.1%) | 678 (1.2%) |
| Total | 62,613 (100.0%) | 57,773 (100.0%) |
Physical Housing Characteristics in Durham
Housing Structures in Durham
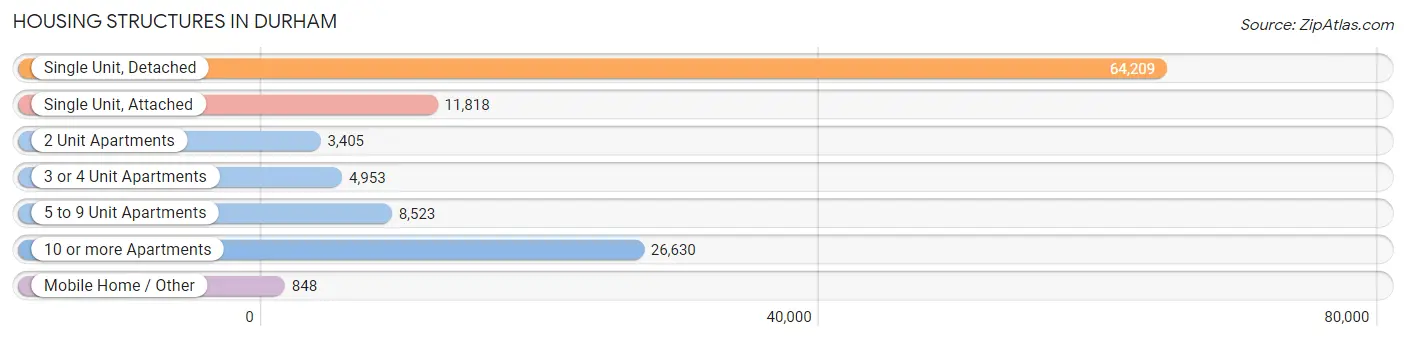
| Structure Type | # Housing Units | % Housing Units |
| Single Unit, Detached | 64,209 | 53.3% |
| Single Unit, Attached | 11,818 | 9.8% |
| 2 Unit Apartments | 3,405 | 2.8% |
| 3 or 4 Unit Apartments | 4,953 | 4.1% |
| 5 to 9 Unit Apartments | 8,523 | 7.1% |
| 10 or more Apartments | 26,630 | 22.1% |
| Mobile Home / Other | 848 | 0.7% |
| Total | 120,386 | 100.0% |
Housing Structures by Occupancy in Durham
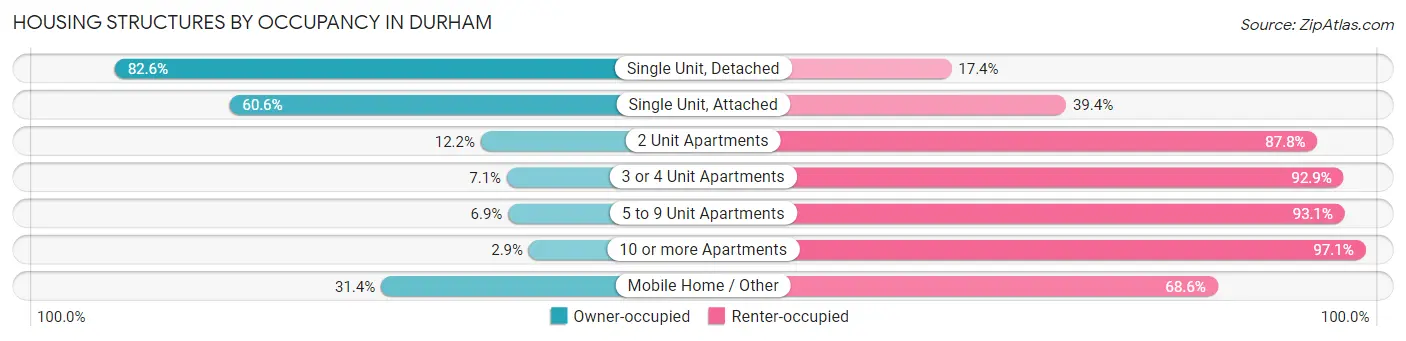
| Structure Type | Owner-occupied | Renter-occupied |
| Single Unit, Detached | 53,061 (82.6%) | 11,148 (17.4%) |
| Single Unit, Attached | 7,158 (60.6%) | 4,660 (39.4%) |
| 2 Unit Apartments | 414 (12.2%) | 2,991 (87.8%) |
| 3 or 4 Unit Apartments | 353 (7.1%) | 4,600 (92.9%) |
| 5 to 9 Unit Apartments | 587 (6.9%) | 7,936 (93.1%) |
| 10 or more Apartments | 774 (2.9%) | 25,856 (97.1%) |
| Mobile Home / Other | 266 (31.4%) | 582 (68.6%) |
| Total | 62,613 (52.0%) | 57,773 (48.0%) |
Housing Structures by Number of Rooms in Durham
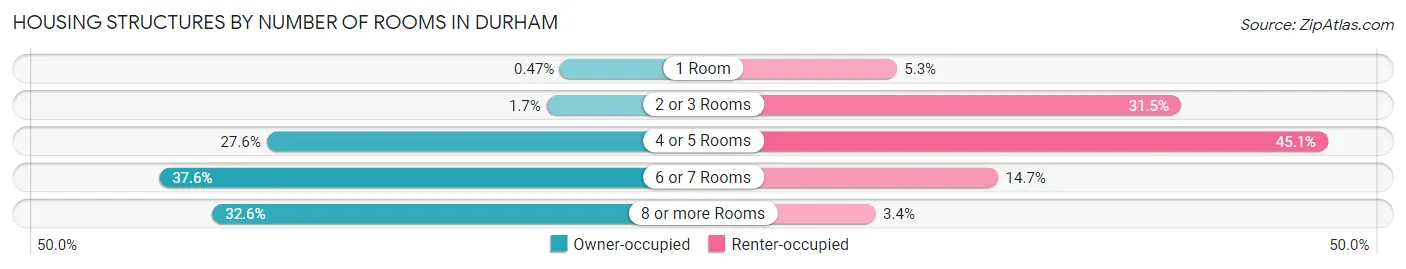
| Number of Rooms | Owner-occupied | Renter-occupied |
| 1 Room | 295 (0.5%) | 3,068 (5.3%) |
| 2 or 3 Rooms | 1,074 (1.7%) | 18,217 (31.5%) |
| 4 or 5 Rooms | 17,297 (27.6%) | 26,075 (45.1%) |
| 6 or 7 Rooms | 23,511 (37.6%) | 8,479 (14.7%) |
| 8 or more Rooms | 20,436 (32.6%) | 1,934 (3.4%) |
| Total | 62,613 (100.0%) | 57,773 (100.0%) |
Housing Structure by Heating Type in Durham
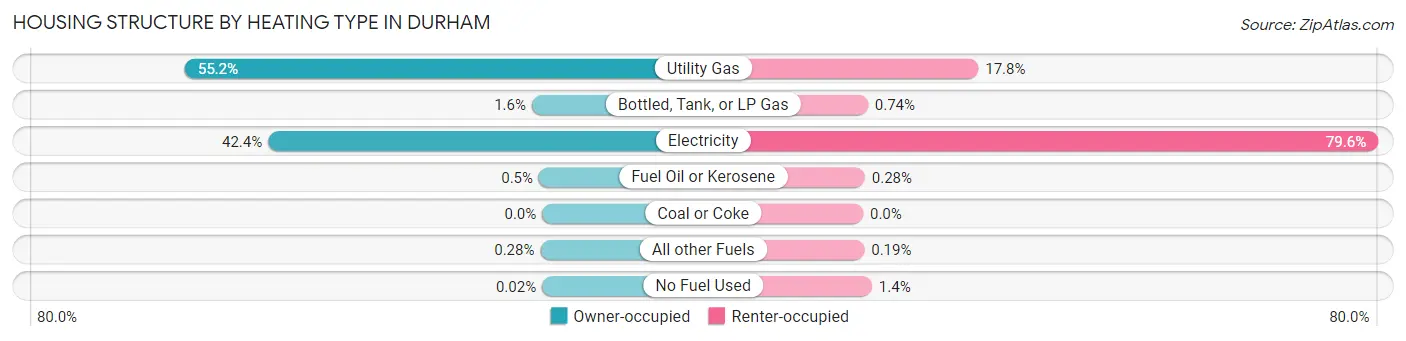
| Heating Type | Owner-occupied | Renter-occupied |
| Utility Gas | 34,581 (55.2%) | 10,296 (17.8%) |
| Bottled, Tank, or LP Gas | 995 (1.6%) | 427 (0.7%) |
| Electricity | 26,531 (42.4%) | 45,986 (79.6%) |
| Fuel Oil or Kerosene | 313 (0.5%) | 164 (0.3%) |
| Coal or Coke | 0 (0.0%) | 0 (0.0%) |
| All other Fuels | 178 (0.3%) | 111 (0.2%) |
| No Fuel Used | 15 (0.0%) | 789 (1.4%) |
| Total | 62,613 (100.0%) | 57,773 (100.0%) |
Household Vehicle Usage in Durham
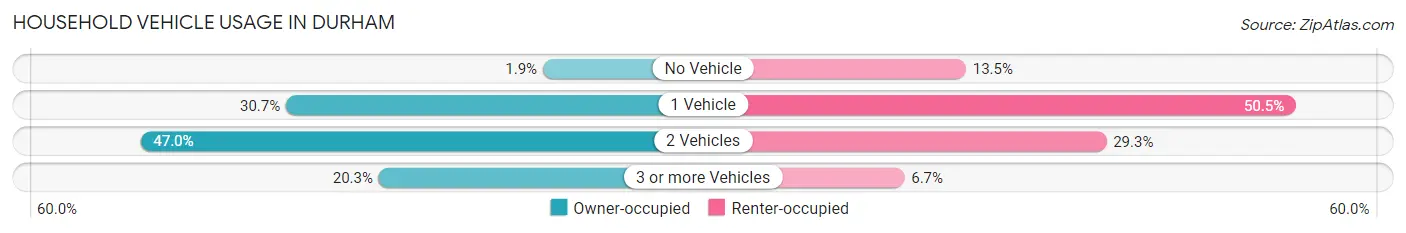
| Vehicles per Household | Owner-occupied | Renter-occupied |
| No Vehicle | 1,215 (1.9%) | 7,825 (13.5%) |
| 1 Vehicle | 19,230 (30.7%) | 29,192 (50.5%) |
| 2 Vehicles | 29,447 (47.0%) | 16,913 (29.3%) |
| 3 or more Vehicles | 12,721 (20.3%) | 3,843 (6.7%) |
| Total | 62,613 (100.0%) | 57,773 (100.0%) |
Real Estate & Mortgages in Durham
Real Estate and Mortgage Overview in Durham
| Characteristic | Without Mortgage | With Mortgage |
| Housing Units | 16,245 | 46,368 |
| Median Property Value | $320,100 | $315,600 |
| Median Household Income | $81,636 | $16,121 |
| Monthly Housing Costs | $584 | $4,396 |
| Real Estate Taxes | $3,138 | $588 |
Property Value by Mortgage Status in Durham
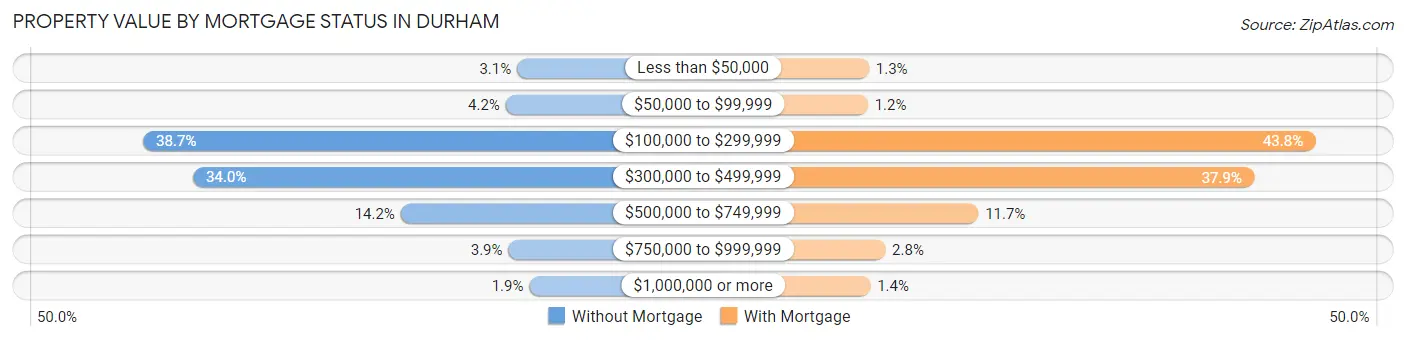
| Property Value | Without Mortgage | With Mortgage |
| Less than $50,000 | 503 (3.1%) | 589 (1.3%) |
| $50,000 to $99,999 | 679 (4.2%) | 537 (1.2%) |
| $100,000 to $299,999 | 6,290 (38.7%) | 20,287 (43.8%) |
| $300,000 to $499,999 | 5,516 (34.0%) | 17,581 (37.9%) |
| $500,000 to $749,999 | 2,304 (14.2%) | 5,418 (11.7%) |
| $750,000 to $999,999 | 639 (3.9%) | 1,308 (2.8%) |
| $1,000,000 or more | 314 (1.9%) | 648 (1.4%) |
| Total | 16,245 (100.0%) | 46,368 (100.0%) |
Household Income by Mortgage Status in Durham
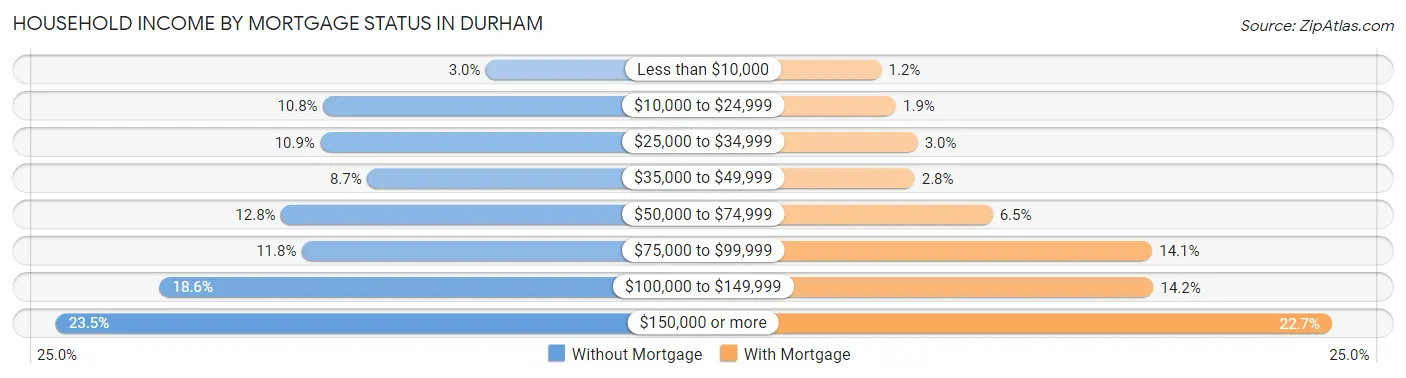
| Household Income | Without Mortgage | With Mortgage |
| Less than $10,000 | 489 (3.0%) | 576 (1.2%) |
| $10,000 to $24,999 | 1,750 (10.8%) | 896 (1.9%) |
| $25,000 to $34,999 | 1,771 (10.9%) | 1,371 (3.0%) |
| $35,000 to $49,999 | 1,409 (8.7%) | 1,309 (2.8%) |
| $50,000 to $74,999 | 2,075 (12.8%) | 3,028 (6.5%) |
| $75,000 to $99,999 | 1,914 (11.8%) | 6,550 (14.1%) |
| $100,000 to $149,999 | 3,017 (18.6%) | 6,579 (14.2%) |
| $150,000 or more | 3,820 (23.5%) | 10,514 (22.7%) |
| Total | 16,245 (100.0%) | 46,368 (100.0%) |
Property Value to Household Income Ratio in Durham
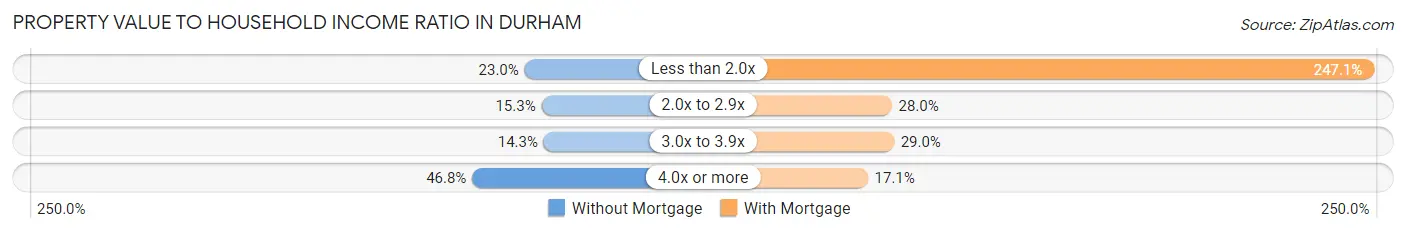
| Value-to-Income Ratio | Without Mortgage | With Mortgage |
| Less than 2.0x | 3,734 (23.0%) | 114,577 (247.1%) |
| 2.0x to 2.9x | 2,489 (15.3%) | 12,973 (28.0%) |
| 3.0x to 3.9x | 2,320 (14.3%) | 13,428 (29.0%) |
| 4.0x or more | 7,597 (46.8%) | 7,929 (17.1%) |
| Total | 16,245 (100.0%) | 46,368 (100.0%) |
Real Estate Taxes by Mortgage Status in Durham
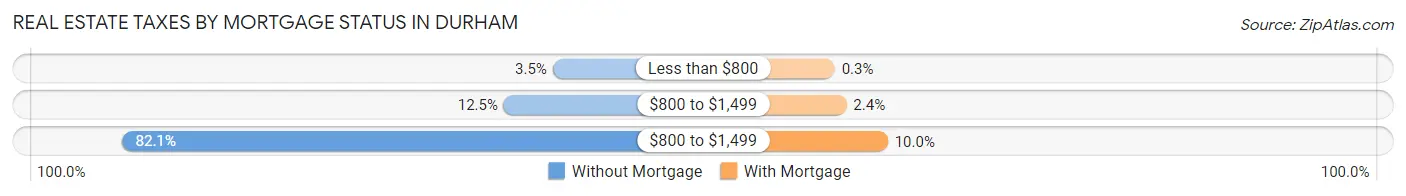
| Property Taxes | Without Mortgage | With Mortgage |
| Less than $800 | 575 (3.5%) | 141 (0.3%) |
| $800 to $1,499 | 2,026 (12.5%) | 1,130 (2.4%) |
| $800 to $1,499 | 13,336 (82.1%) | 4,633 (10.0%) |
| Total | 16,245 (100.0%) | 46,368 (100.0%) |
Health & Disability in Durham
Health Insurance Coverage by Age in Durham
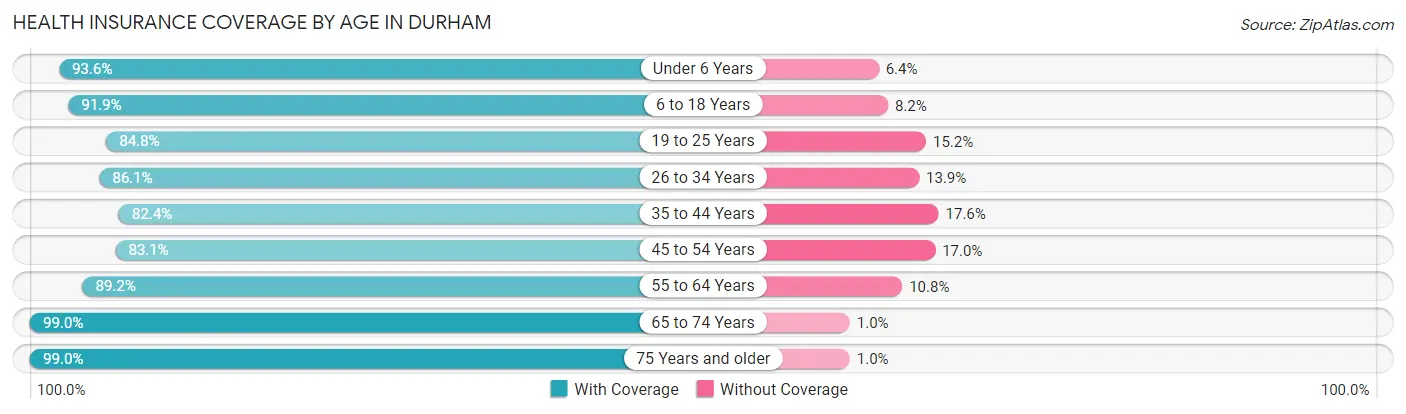
| Age Bracket | With Coverage | Without Coverage |
| Under 6 Years | 18,805 (93.6%) | 1,291 (6.4%) |
| 6 to 18 Years | 37,791 (91.8%) | 3,353 (8.2%) |
| 19 to 25 Years | 28,071 (84.8%) | 5,047 (15.2%) |
| 26 to 34 Years | 41,814 (86.1%) | 6,775 (13.9%) |
| 35 to 44 Years | 32,846 (82.4%) | 7,010 (17.6%) |
| 45 to 54 Years | 27,730 (83.1%) | 5,661 (17.0%) |
| 55 to 64 Years | 27,220 (89.2%) | 3,296 (10.8%) |
| 65 to 74 Years | 21,752 (99.0%) | 226 (1.0%) |
| 75 Years and older | 13,109 (99.0%) | 138 (1.0%) |
| Total | 249,138 (88.4%) | 32,797 (11.6%) |
Health Insurance Coverage by Citizenship Status in Durham
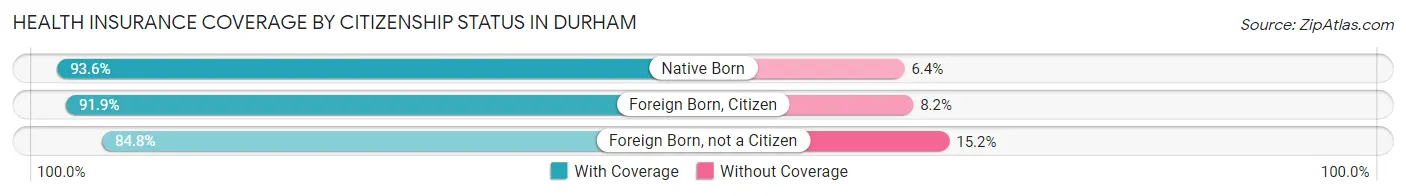
| Citizenship Status | With Coverage | Without Coverage |
| Native Born | 18,805 (93.6%) | 1,291 (6.4%) |
| Foreign Born, Citizen | 37,791 (91.8%) | 3,353 (8.2%) |
| Foreign Born, not a Citizen | 28,071 (84.8%) | 5,047 (15.2%) |
Health Insurance Coverage by Household Income in Durham
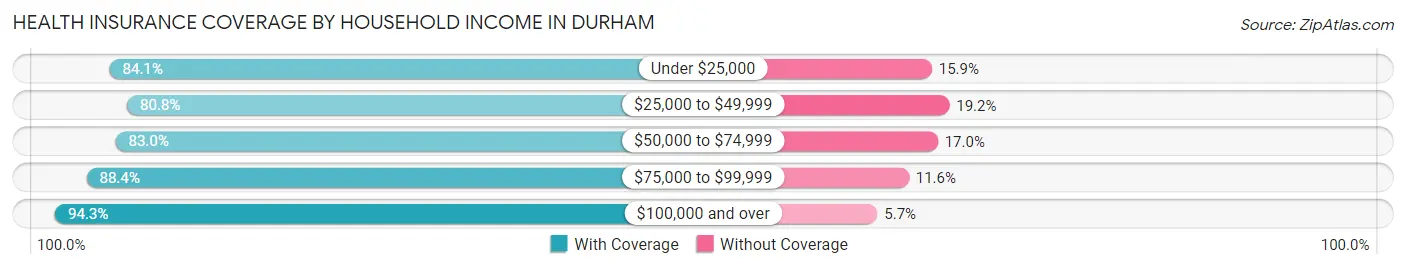
| Household Income | With Coverage | Without Coverage |
| Under $25,000 | 24,485 (84.1%) | 4,641 (15.9%) |
| $25,000 to $49,999 | 35,765 (80.8%) | 8,503 (19.2%) |
| $50,000 to $74,999 | 37,172 (83.0%) | 7,635 (17.0%) |
| $75,000 to $99,999 | 34,372 (88.4%) | 4,515 (11.6%) |
| $100,000 and over | 108,637 (94.3%) | 6,591 (5.7%) |
Public vs Private Health Insurance Coverage by Age in Durham
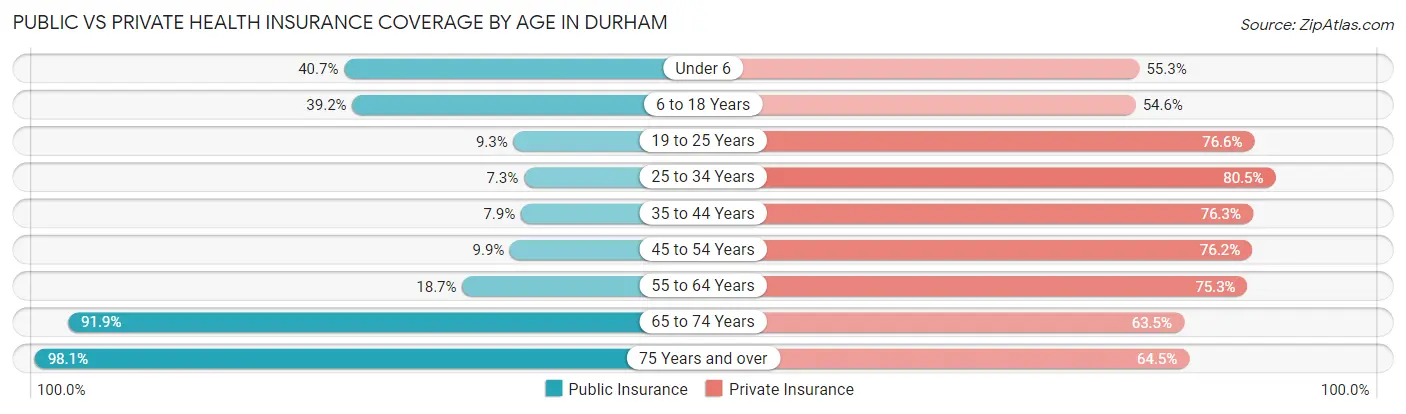
| Age Bracket | Public Insurance | Private Insurance |
| Under 6 | 8,173 (40.7%) | 11,105 (55.3%) |
| 6 to 18 Years | 16,107 (39.2%) | 22,445 (54.5%) |
| 19 to 25 Years | 3,062 (9.2%) | 25,359 (76.6%) |
| 25 to 34 Years | 3,540 (7.3%) | 39,100 (80.5%) |
| 35 to 44 Years | 3,129 (7.9%) | 30,401 (76.3%) |
| 45 to 54 Years | 3,297 (9.9%) | 25,430 (76.2%) |
| 55 to 64 Years | 5,718 (18.7%) | 22,976 (75.3%) |
| 65 to 74 Years | 20,203 (91.9%) | 13,949 (63.5%) |
| 75 Years and over | 12,996 (98.1%) | 8,539 (64.5%) |
| Total | 76,225 (27.0%) | 199,304 (70.7%) |
Disability Status by Sex by Age in Durham
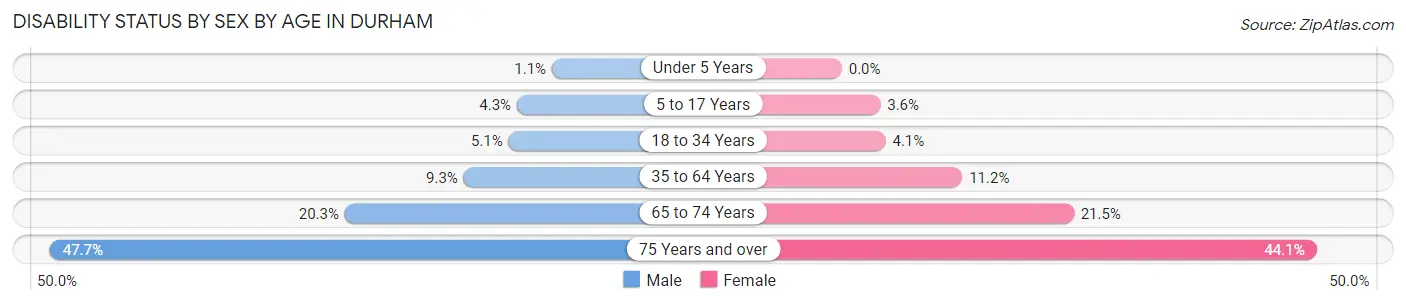
| Age Bracket | Male | Female |
| Under 5 Years | 90 (1.1%) | 0 (0.0%) |
| 5 to 17 Years | 867 (4.3%) | 695 (3.6%) |
| 18 to 34 Years | 2,098 (5.1%) | 1,816 (4.1%) |
| 35 to 64 Years | 4,525 (9.2%) | 6,132 (11.2%) |
| 65 to 74 Years | 1,871 (20.3%) | 2,744 (21.5%) |
| 75 Years and over | 2,503 (47.7%) | 3,522 (44.1%) |
Disability Class by Sex by Age in Durham
Disability Class: Hearing Difficulty
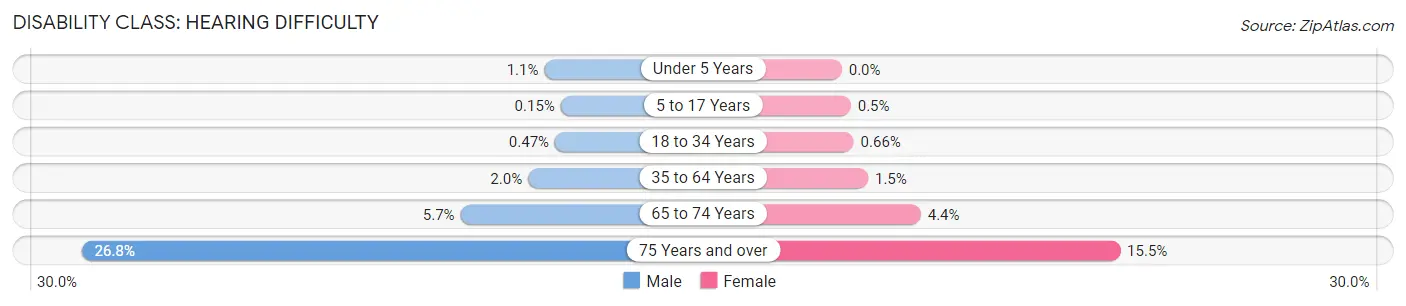
| Age Bracket | Male | Female |
| Under 5 Years | 90 (1.1%) | 0 (0.0%) |
| 5 to 17 Years | 31 (0.2%) | 98 (0.5%) |
| 18 to 34 Years | 194 (0.5%) | 294 (0.7%) |
| 35 to 64 Years | 964 (2.0%) | 801 (1.5%) |
| 65 to 74 Years | 529 (5.7%) | 561 (4.4%) |
| 75 Years and over | 1,409 (26.8%) | 1,239 (15.5%) |
Disability Class: Vision Difficulty
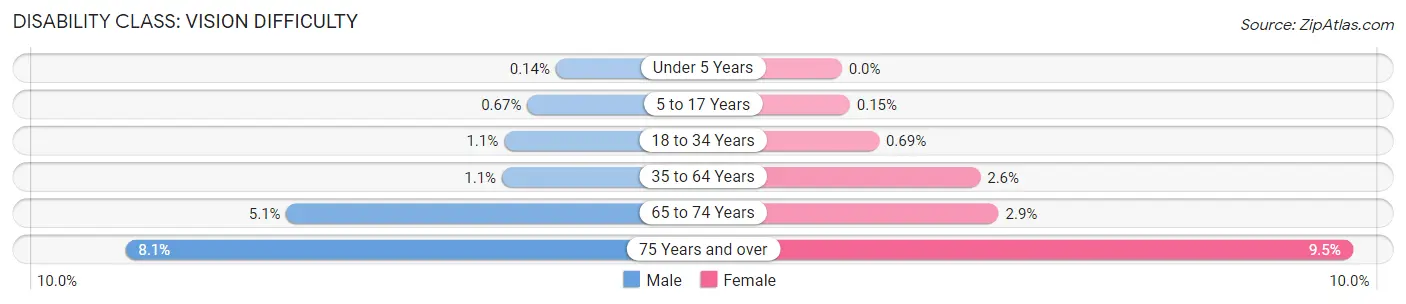
| Age Bracket | Male | Female |
| Under 5 Years | 12 (0.1%) | 0 (0.0%) |
| 5 to 17 Years | 135 (0.7%) | 30 (0.2%) |
| 18 to 34 Years | 455 (1.1%) | 310 (0.7%) |
| 35 to 64 Years | 558 (1.1%) | 1,408 (2.6%) |
| 65 to 74 Years | 474 (5.1%) | 371 (2.9%) |
| 75 Years and over | 427 (8.1%) | 758 (9.5%) |
Disability Class: Cognitive Difficulty
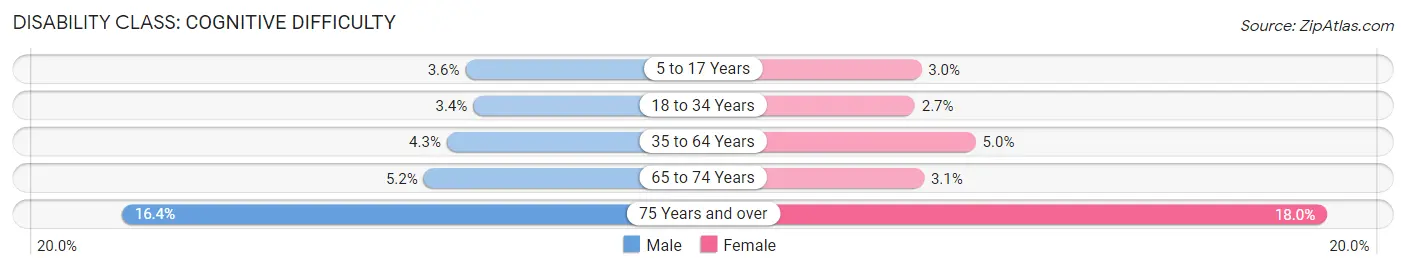
| Age Bracket | Male | Female |
| 5 to 17 Years | 732 (3.6%) | 575 (2.9%) |
| 18 to 34 Years | 1,384 (3.4%) | 1,211 (2.7%) |
| 35 to 64 Years | 2,119 (4.3%) | 2,728 (5.0%) |
| 65 to 74 Years | 479 (5.2%) | 389 (3.0%) |
| 75 Years and over | 861 (16.4%) | 1,440 (18.0%) |
Disability Class: Ambulatory Difficulty
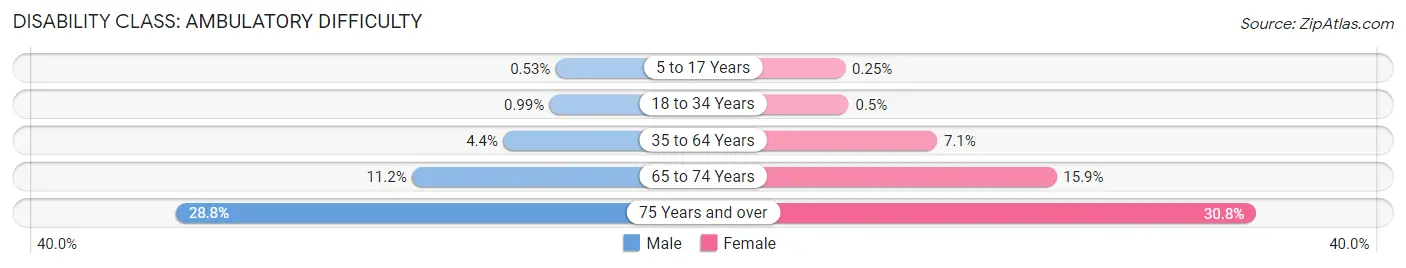
| Age Bracket | Male | Female |
| 5 to 17 Years | 106 (0.5%) | 48 (0.3%) |
| 18 to 34 Years | 409 (1.0%) | 224 (0.5%) |
| 35 to 64 Years | 2,163 (4.4%) | 3,877 (7.1%) |
| 65 to 74 Years | 1,033 (11.2%) | 2,031 (15.9%) |
| 75 Years and over | 1,511 (28.8%) | 2,459 (30.8%) |
Disability Class: Self-Care Difficulty
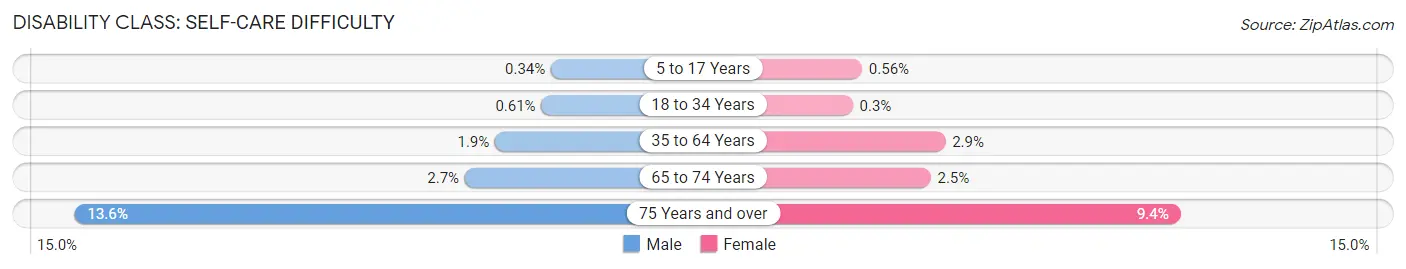
| Age Bracket | Male | Female |
| 5 to 17 Years | 69 (0.3%) | 110 (0.6%) |
| 18 to 34 Years | 252 (0.6%) | 133 (0.3%) |
| 35 to 64 Years | 930 (1.9%) | 1,582 (2.9%) |
| 65 to 74 Years | 253 (2.7%) | 315 (2.5%) |
| 75 Years and over | 715 (13.6%) | 754 (9.4%) |
Technology Access in Durham
Computing Device Access in Durham
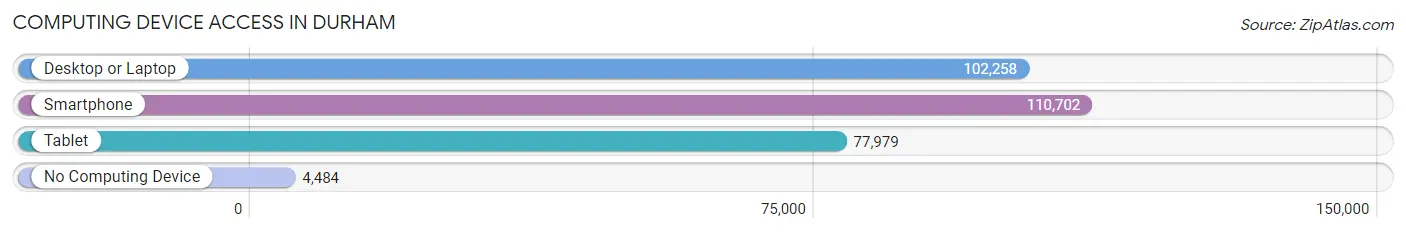
| Device Type | # Households | % Households |
| Desktop or Laptop | 102,258 | 84.9% |
| Smartphone | 110,702 | 92.0% |
| Tablet | 77,979 | 64.8% |
| No Computing Device | 4,484 | 3.7% |
| Total | 120,386 | 100.0% |
Internet Access in Durham
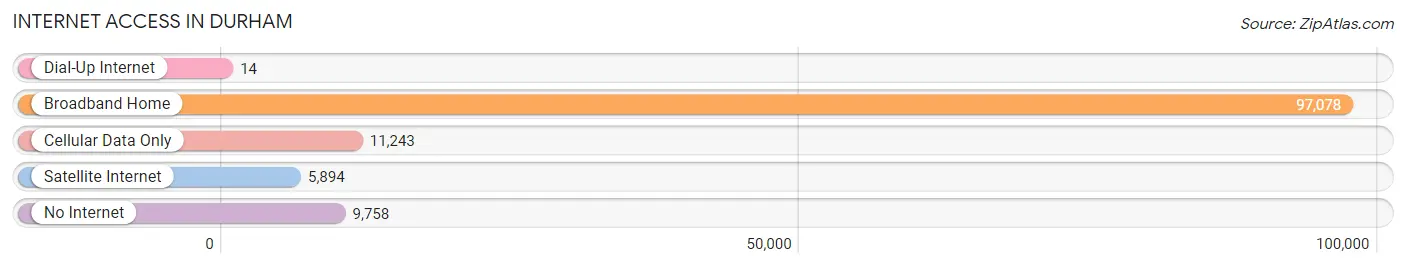
| Internet Type | # Households | % Households |
| Dial-Up Internet | 14 | 0.0% |
| Broadband Home | 97,078 | 80.6% |
| Cellular Data Only | 11,243 | 9.3% |
| Satellite Internet | 5,894 | 4.9% |
| No Internet | 9,758 | 8.1% |
| Total | 120,386 | 100.0% |
Durham Summary
Durham, North Carolina is a city located in the Research Triangle region of North Carolina. It is the county seat of Durham County and the fourth-largest city in the state. Durham is known for its vibrant culture, diverse population, and rich history.
Geography
Durham is located in the Piedmont region of North Carolina, approximately 10 miles northwest of Raleigh. It is situated on the Eno and Flat rivers, which converge to form the Neuse River. The city is surrounded by rolling hills and is located at the foothills of the Blue Ridge Mountains. Durham is located in the humid subtropical climate zone, with hot, humid summers and mild winters.
History
Durham was founded in 1869 as a tobacco manufacturing and trading center. The city was named after Dr. Bartlett Durham, a local physician and philanthropist. The city quickly grew and became a major center for the tobacco industry. In the early 20th century, Durham was a major center for the textile industry. The city was also home to several prominent African-American institutions, including North Carolina Central University and the Hayti district.
In the 1950s and 1960s, Durham experienced a period of rapid growth and development. The city was transformed into a major center for research and technology, with the establishment of Research Triangle Park. The city also experienced a period of racial unrest, culminating in the 1970s with the desegregation of public schools.
Economy
Durham is a major center for research and technology, with a strong focus on biotechnology, pharmaceuticals, and medical research. The city is home to several major employers, including Duke University, Duke Energy, and IBM. The city is also home to several major healthcare providers, including Duke University Health System and UNC Health Care.
Durham is also a major center for the arts and entertainment. The city is home to several major performing arts venues, including the Durham Performing Arts Center and the Carolina Theatre. The city is also home to several major museums, including the Nasher Museum of Art and the North Carolina Museum of Life and Science.
Demographics
As of the 2010 census, Durham had a population of 228,330. The city is racially and ethnically diverse, with a population that is 44.3% White, 40.2% African American, 8.3% Hispanic or Latino, and 6.2% Asian. The median household income is $45,936, and the median home value is $179,400.
Durham is home to several major universities, including Duke University, North Carolina Central University, and Durham Technical Community College. The city is also home to several major healthcare providers, including Duke University Health System and UNC Health Care.
Conclusion
Durham, North Carolina is a vibrant city with a rich history and diverse population. The city is a major center for research and technology, with a strong focus on biotechnology, pharmaceuticals, and medical research. The city is also a major center for the arts and entertainment, with several major performing arts venues and museums. Durham is home to several major universities and healthcare providers, and has a population that is racially and ethnically diverse.
Common Questions
What is the Total Population of Durham?
Total Population of Durham is 284,094.
What is the Total Male Population of Durham?
Total Male Population of Durham is 134,492.
What is the Total Female Population of Durham?
Total Female Population of Durham is 149,602.
What is the Ratio of Males per 100 Females in Durham?
There are 89.90 Males per 100 Females in Durham.
What is the Ratio of Females per 100 Males in Durham?
There are 111.23 Females per 100 Males in Durham.
What is the Median Population Age in Durham?
Median Population Age in Durham is 34.7 Years.
What is the Average Family Size in Durham
Average Family Size in Durham is 3.0 People.
What is the Average Household Size in Durham
Average Household Size in Durham is 2.3 People.
What is Per Capita Income in Durham?
Per Capita income in Durham is $44,012.
What is the Median Family Income in Durham?
Median Family Income in Durham is $96,231.
What is the Median Household income in Durham?
Median Household Income in Durham is $74,710.
What is Income or Wage Gap in Durham?
Income or Wage Gap in Durham is 10.9%.
Women in Durham earn 89.1 cents for every dollar earned by a man.
What is Family Income Deficit in Durham?
Family Income Deficit in Durham is $11,190.
Families that are below poverty line in Durham earn $11,190 less on average than the poverty threshold level.
What is Inequality or Gini Index in Durham?
Inequality or Gini Index in Durham is 0.46.
How Large is the Labor Force in Durham?
There are 161,647 People in the Labor Forcein in Durham.
What is the Percentage of People in the Labor Force in Durham?
69.4% of People are in the Labor Force in Durham.
What is the Unemployment Rate in Durham?
Unemployment Rate in Durham is 4.3%.