Cities with the Highest Percentage of Population with a Degree in Arts and Humanities in North Carolina
RELATED REPORTS & OPTIONS
Arts and Humanities
North Carolina
Compare Cities
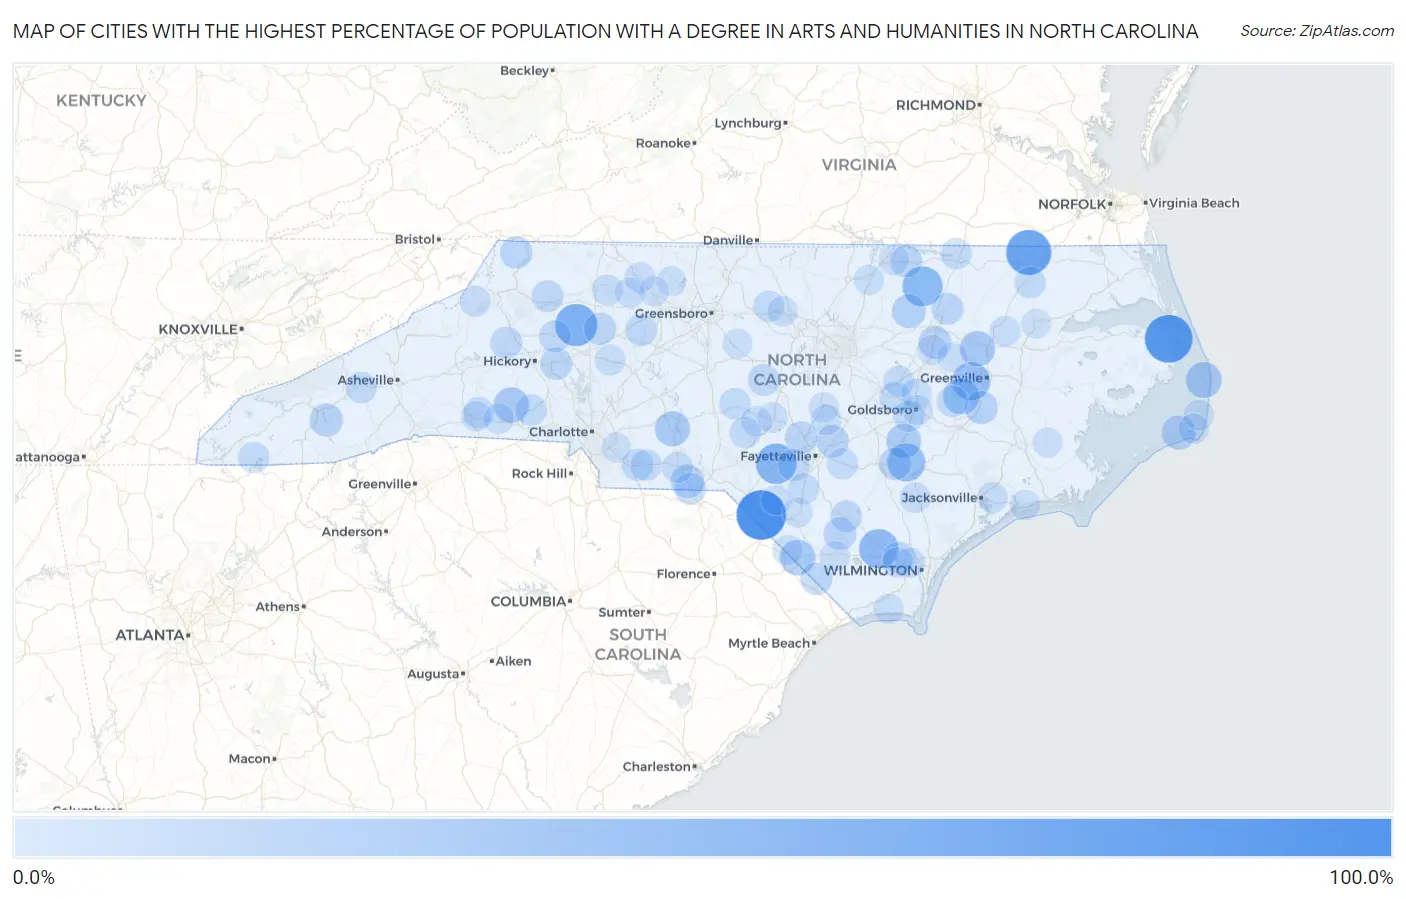
Map of Cities with the Highest Percentage of Population with a Degree in Arts and Humanities in North Carolina
0.0%
100.0%
Cities with the Highest Percentage of Population with a Degree in Arts and Humanities in North Carolina
| City | % Graduates | vs State | vs National | |
| 1. | Raemon | 100.0% | 7.1%(+92.9)#1 | 6.0%(+94.0)#31 |
| 2. | Manns Harbor | 91.8% | 7.1%(+84.7)#2 | 6.0%(+85.8)#132 |
| 3. | Como | 80.0% | 7.1%(+72.9)#3 | 6.0%(+74.0)#159 |
| 4. | Love Valley | 66.7% | 7.1%(+59.5)#4 | 6.0%(+60.7)#220 |
| 5. | Silver City | 60.0% | 7.1%(+52.9)#5 | 6.0%(+54.0)#259 |
| 6. | Hollister | 58.2% | 7.1%(+51.0)#6 | 6.0%(+52.2)#277 |
| 7. | East Arcadia | 54.3% | 7.1%(+47.2)#7 | 6.0%(+48.3)#317 |
| 8. | Warsaw | 49.0% | 7.1%(+41.9)#8 | 6.0%(+43.0)#412 |
| 9. | Bell Arthur | 48.8% | 7.1%(+41.7)#9 | 6.0%(+42.8)#413 |
| 10. | Maury | 40.7% | 7.1%(+33.6)#10 | 6.0%(+34.7)#540 |
| 11. | Rodanthe | 39.3% | 7.1%(+32.2)#11 | 6.0%(+33.3)#604 |
| 12. | Lawndale | 38.1% | 7.1%(+31.0)#12 | 6.0%(+32.1)#638 |
| 13. | Fair Bluff | 37.9% | 7.1%(+30.8)#13 | 6.0%(+31.9)#646 |
| 14. | Conetoe | 37.5% | 7.1%(+30.4)#14 | 6.0%(+31.5)#654 |
| 15. | Norwood | 36.2% | 7.1%(+29.1)#15 | 6.0%(+30.2)#709 |
| 16. | Calypso | 34.5% | 7.1%(+27.4)#16 | 6.0%(+28.5)#774 |
| 17. | Hatteras | 32.4% | 7.1%(+25.3)#17 | 6.0%(+26.4)#898 |
| 18. | Castalia | 30.4% | 7.1%(+23.3)#18 | 6.0%(+24.4)#1,021 |
| 19. | Morven | 29.3% | 7.1%(+22.1)#19 | 6.0%(+23.3)#1,088 |
| 20. | Barnardsville | 28.8% | 7.1%(+21.7)#20 | 6.0%(+22.9)#1,109 |
| 21. | Cullowhee | 28.7% | 7.1%(+21.5)#21 | 6.0%(+22.7)#1,113 |
| 22. | Grifton | 27.9% | 7.1%(+20.8)#22 | 6.0%(+21.9)#1,202 |
| 23. | Sharpsburg | 27.2% | 7.1%(+20.1)#23 | 6.0%(+21.2)#1,273 |
| 24. | Springdale | 26.4% | 7.1%(+19.2)#24 | 6.0%(+20.4)#1,347 |
| 25. | Clarkton | 26.1% | 7.1%(+19.0)#25 | 6.0%(+20.1)#1,361 |
| 26. | Wade | 25.9% | 7.1%(+18.8)#26 | 6.0%(+19.9)#1,374 |
| 27. | Spring Lake | 25.4% | 7.1%(+18.3)#27 | 6.0%(+19.4)#1,408 |
| 28. | Turkey | 25.0% | 7.1%(+17.9)#28 | 6.0%(+19.0)#1,444 |
| 29. | Lansing | 25.0% | 7.1%(+17.9)#29 | 6.0%(+19.0)#1,459 |
| 30. | Harmony | 24.5% | 7.1%(+17.4)#30 | 6.0%(+18.5)#1,534 |
| 31. | Tabor City | 23.8% | 7.1%(+16.7)#31 | 6.0%(+17.8)#1,622 |
| 32. | Claremont | 23.5% | 7.1%(+16.4)#32 | 6.0%(+17.5)#1,656 |
| 33. | Whitakers | 23.2% | 7.1%(+16.1)#33 | 6.0%(+17.2)#1,686 |
| 34. | Macon | 23.1% | 7.1%(+16.0)#34 | 6.0%(+17.1)#1,708 |
| 35. | Rockfish | 23.0% | 7.1%(+15.8)#35 | 6.0%(+17.0)#1,716 |
| 36. | Goldston | 22.7% | 7.1%(+15.6)#36 | 6.0%(+16.7)#1,742 |
| 37. | Taylorsville | 22.6% | 7.1%(+15.5)#37 | 6.0%(+16.6)#1,752 |
| 38. | Advance | 22.6% | 7.1%(+15.5)#38 | 6.0%(+16.6)#1,755 |
| 39. | Gamewell | 22.6% | 7.1%(+15.4)#39 | 6.0%(+16.6)#1,770 |
| 40. | Millers Creek | 22.4% | 7.1%(+15.2)#40 | 6.0%(+16.4)#1,788 |
| 41. | Mcfarlan | 22.2% | 7.1%(+15.1)#41 | 6.0%(+16.2)#1,822 |
| 42. | Wingate | 22.2% | 7.1%(+15.1)#42 | 6.0%(+16.2)#1,828 |
| 43. | Northwest | 21.7% | 7.1%(+14.6)#43 | 6.0%(+15.7)#1,889 |
| 44. | Elizabethtown | 21.6% | 7.1%(+14.5)#44 | 6.0%(+15.6)#1,907 |
| 45. | Princeton | 21.5% | 7.1%(+14.4)#45 | 6.0%(+15.5)#1,927 |
| 46. | Ahoskie | 21.5% | 7.1%(+14.3)#46 | 6.0%(+15.5)#1,930 |
| 47. | Robbins | 21.1% | 7.1%(+13.9)#47 | 6.0%(+15.1)#1,987 |
| 48. | West Canton | 20.7% | 7.1%(+13.6)#48 | 6.0%(+14.7)#2,040 |
| 49. | Snow Hill | 20.5% | 7.1%(+13.4)#49 | 6.0%(+14.5)#2,068 |
| 50. | Mar Mac | 20.5% | 7.1%(+13.4)#50 | 6.0%(+14.5)#2,078 |
| 51. | Cherryville | 20.2% | 7.1%(+13.1)#51 | 6.0%(+14.2)#2,111 |
| 52. | Taylortown | 20.2% | 7.1%(+13.1)#52 | 6.0%(+14.2)#2,115 |
| 53. | Marshville | 20.0% | 7.1%(+12.9)#53 | 6.0%(+14.0)#2,141 |
| 54. | St Pauls | 20.0% | 7.1%(+12.9)#54 | 6.0%(+14.0)#2,142 |
| 55. | Hayesville | 20.0% | 7.1%(+12.9)#55 | 6.0%(+14.0)#2,156 |
| 56. | Autryville | 20.0% | 7.1%(+12.9)#56 | 6.0%(+14.0)#2,205 |
| 57. | Wadesboro | 19.8% | 7.1%(+12.6)#57 | 6.0%(+13.8)#2,254 |
| 58. | Bostic | 19.6% | 7.1%(+12.4)#58 | 6.0%(+13.6)#2,280 |
| 59. | Gaston | 19.3% | 7.1%(+12.2)#59 | 6.0%(+13.3)#2,332 |
| 60. | Kenly | 19.2% | 7.1%(+12.1)#60 | 6.0%(+13.2)#2,360 |
| 61. | Woodlawn | 19.1% | 7.1%(+12.0)#61 | 6.0%(+13.1)#2,374 |
| 62. | Banner Elk | 18.5% | 7.1%(+11.3)#62 | 6.0%(+12.5)#2,514 |
| 63. | Wallace | 18.4% | 7.1%(+11.3)#63 | 6.0%(+12.4)#2,526 |
| 64. | Boonville | 18.3% | 7.1%(+11.2)#64 | 6.0%(+12.3)#2,546 |
| 65. | Hamilton | 18.2% | 7.1%(+11.1)#65 | 6.0%(+12.2)#2,580 |
| 66. | Cleveland | 18.0% | 7.1%(+10.9)#66 | 6.0%(+12.0)#2,616 |
| 67. | Bunnlevel | 17.9% | 7.1%(+10.8)#67 | 6.0%(+11.9)#2,644 |
| 68. | Pikeville | 17.6% | 7.1%(+10.4)#68 | 6.0%(+11.6)#2,735 |
| 69. | Piney Green | 17.6% | 7.1%(+10.4)#69 | 6.0%(+11.6)#2,738 |
| 70. | Avon | 17.2% | 7.1%(+10.1)#70 | 6.0%(+11.2)#2,836 |
| 71. | Pinnacle | 17.1% | 7.1%(+9.95)#71 | 6.0%(+11.1)#2,865 |
| 72. | Buxton | 16.9% | 7.1%(+9.75)#72 | 6.0%(+10.9)#2,908 |
| 73. | Anderson Creek | 16.8% | 7.1%(+9.64)#73 | 6.0%(+10.8)#2,932 |
| 74. | Cameron | 16.7% | 7.1%(+9.54)#74 | 6.0%(+10.7)#2,972 |
| 75. | Sandy Creek | 16.7% | 7.1%(+9.54)#75 | 6.0%(+10.7)#2,991 |
| 76. | Marietta | 16.7% | 7.1%(+9.54)#76 | 6.0%(+10.7)#3,037 |
| 77. | Norlina | 16.5% | 7.1%(+9.42)#77 | 6.0%(+10.6)#3,063 |
| 78. | Carthage | 16.5% | 7.1%(+9.38)#78 | 6.0%(+10.5)#3,071 |
| 79. | Forest City | 16.5% | 7.1%(+9.38)#79 | 6.0%(+10.5)#3,072 |
| 80. | Navassa | 16.4% | 7.1%(+9.32)#80 | 6.0%(+10.4)#3,085 |
| 81. | Prospect | 16.4% | 7.1%(+9.31)#81 | 6.0%(+10.4)#3,087 |
| 82. | East Bend | 16.3% | 7.1%(+9.15)#82 | 6.0%(+10.3)#3,135 |
| 83. | Cherry Branch | 16.1% | 7.1%(+9.02)#83 | 6.0%(+10.1)#3,174 |
| 84. | Efland | 16.1% | 7.1%(+9.00)#84 | 6.0%(+10.1)#3,177 |
| 85. | South Henderson | 16.0% | 7.1%(+8.88)#85 | 6.0%(+10.0)#3,205 |
| 86. | Lattimore | 16.0% | 7.1%(+8.88)#86 | 6.0%(+10.0)#3,211 |
| 87. | Macclesfield | 15.9% | 7.1%(+8.78)#87 | 6.0%(+9.91)#3,246 |
| 88. | Lillington | 15.8% | 7.1%(+8.68)#88 | 6.0%(+9.81)#3,276 |
| 89. | Whiteville | 15.8% | 7.1%(+8.63)#89 | 6.0%(+9.76)#3,305 |
| 90. | Varnamtown | 15.7% | 7.1%(+8.58)#90 | 6.0%(+9.71)#3,319 |
| 91. | Bogue | 15.5% | 7.1%(+8.42)#91 | 6.0%(+9.54)#3,373 |
| 92. | Goldsboro | 15.5% | 7.1%(+8.37)#92 | 6.0%(+9.50)#3,385 |
| 93. | Grantsboro | 15.4% | 7.1%(+8.26)#93 | 6.0%(+9.39)#3,426 |
| 94. | Lumberton | 15.4% | 7.1%(+8.24)#94 | 6.0%(+9.37)#3,459 |
| 95. | Walnut Cove | 15.3% | 7.1%(+8.20)#95 | 6.0%(+9.33)#3,467 |
| 96. | Hemby Bridge | 15.3% | 7.1%(+8.16)#96 | 6.0%(+9.29)#3,481 |
| 97. | Elm City | 15.3% | 7.1%(+8.15)#97 | 6.0%(+9.28)#3,488 |
| 98. | Rural Hall | 15.3% | 7.1%(+8.15)#98 | 6.0%(+9.28)#3,492 |
| 99. | Windsor | 15.3% | 7.1%(+8.13)#99 | 6.0%(+9.26)#3,495 |
| 100. | Liberty | 15.3% | 7.1%(+8.13)#100 | 6.0%(+9.26)#3,496 |
Common Questions
What are the Top 10 Cities with the Highest Percentage of Population with a Degree in Arts and Humanities in North Carolina?
Top 10 Cities with the Highest Percentage of Population with a Degree in Arts and Humanities in North Carolina are:
#1
100.0%
#2
91.8%
#3
80.0%
#4
66.7%
#5
60.0%
#6
58.2%
#7
54.3%
#8
49.0%
#9
48.8%
#10
40.7%
What city has the Highest Percentage of Population with a Degree in Arts and Humanities in North Carolina?
Raemon has the Highest Percentage of Population with a Degree in Arts and Humanities in North Carolina with 100.0%.
What is the Percentage of Population with a Degree in Arts and Humanities in the State of North Carolina?
Percentage of Population with a Degree in Arts and Humanities in North Carolina is 7.1%.
What is the Percentage of Population with a Degree in Arts and Humanities in the United States?
Percentage of Population with a Degree in Arts and Humanities in the United States is 6.0%.