Cities with the Most Immigrants from Northern Africa in North Carolina
RELATED REPORTS & OPTIONS
Northern Africa
North Carolina
Compare Cities
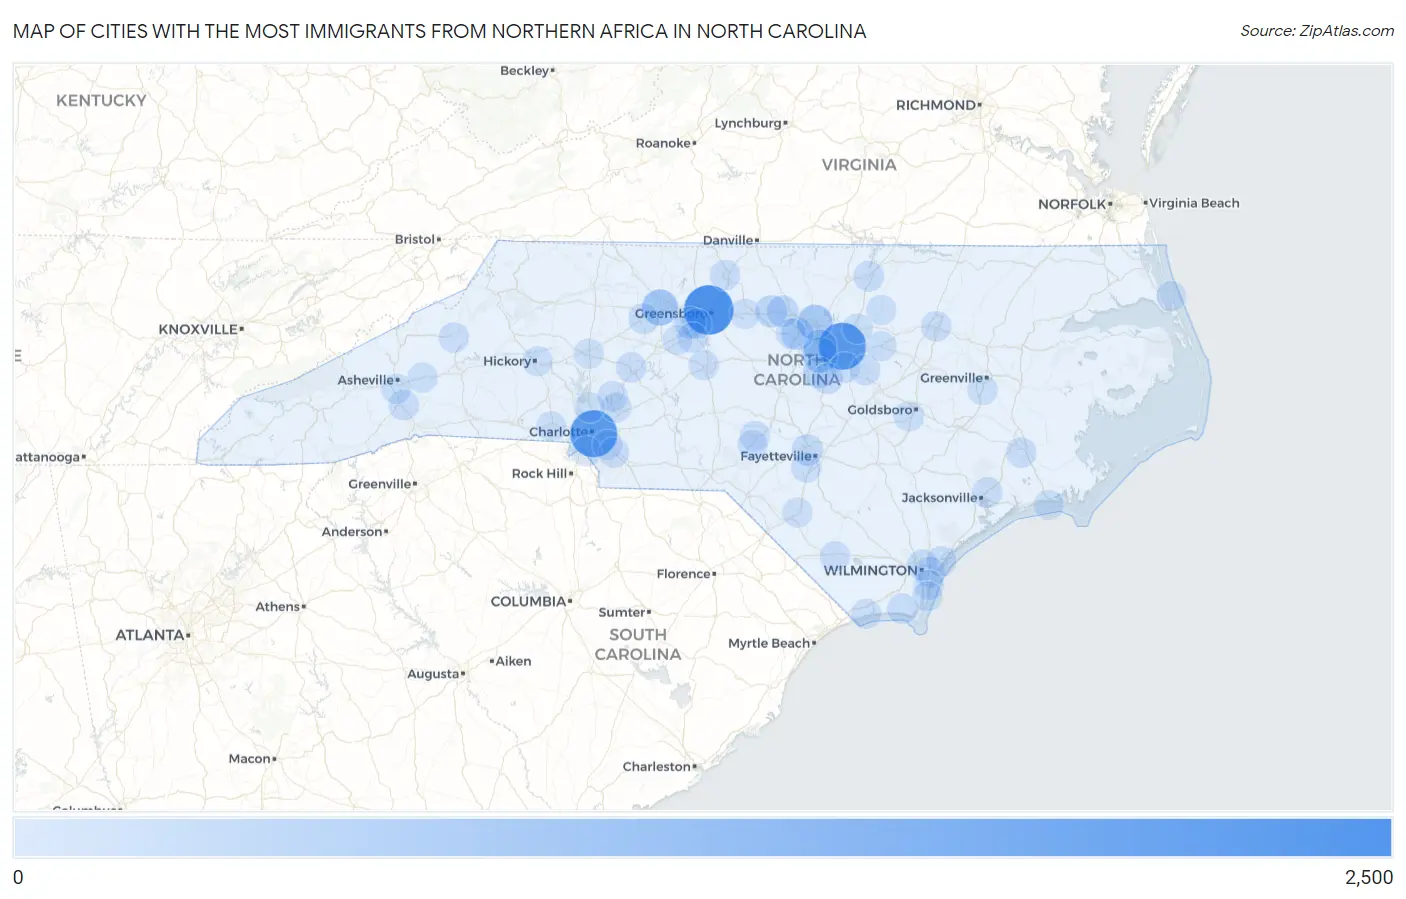
Map of Cities with the Most Immigrants from Northern Africa in North Carolina
0
2,500
Cities with the Most Immigrants from Northern Africa in North Carolina
| City | Northern Africa | vs State | vs National | |
| 1. | Greensboro | 2,027 | 11,401(17.78%)#1 | 421,832(0.48%)#13 |
| 2. | Raleigh | 1,778 | 11,401(15.60%)#2 | 421,832(0.42%)#18 |
| 3. | Charlotte | 1,765 | 11,401(15.48%)#3 | 421,832(0.42%)#19 |
| 4. | Winston Salem | 620 | 11,401(5.44%)#4 | 421,832(0.15%)#88 |
| 5. | Durham | 538 | 11,401(4.72%)#5 | 421,832(0.13%)#108 |
| 6. | Cary | 523 | 11,401(4.59%)#6 | 421,832(0.12%)#111 |
| 7. | Morrisville | 352 | 11,401(3.09%)#7 | 421,832(0.08%)#183 |
| 8. | Chapel Hill | 239 | 11,401(2.10%)#8 | 421,832(0.06%)#293 |
| 9. | Mebane | 218 | 11,401(1.91%)#9 | 421,832(0.05%)#333 |
| 10. | High Point | 192 | 11,401(1.68%)#10 | 421,832(0.05%)#386 |
| 11. | Efland | 166 | 11,401(1.46%)#11 | 421,832(0.04%)#443 |
| 12. | Holly Springs | 156 | 11,401(1.37%)#12 | 421,832(0.04%)#468 |
| 13. | Fayetteville | 145 | 11,401(1.27%)#13 | 421,832(0.03%)#509 |
| 14. | Fuquay Varina | 83 | 11,401(0.73%)#14 | 421,832(0.02%)#788 |
| 15. | Clemmons | 69 | 11,401(0.61%)#15 | 421,832(0.02%)#907 |
| 16. | Hightsville | 63 | 11,401(0.55%)#16 | 421,832(0.01%)#979 |
| 17. | Henderson | 59 | 11,401(0.52%)#17 | 421,832(0.01%)#1,018 |
| 18. | Wilmington | 55 | 11,401(0.48%)#18 | 421,832(0.01%)#1,051 |
| 19. | Carrboro | 50 | 11,401(0.44%)#19 | 421,832(0.01%)#1,128 |
| 20. | St James | 47 | 11,401(0.41%)#20 | 421,832(0.01%)#1,181 |
| 21. | Fletcher | 46 | 11,401(0.40%)#21 | 421,832(0.01%)#1,200 |
| 22. | Jamestown | 42 | 11,401(0.37%)#22 | 421,832(0.01%)#1,275 |
| 23. | Garner | 39 | 11,401(0.34%)#23 | 421,832(0.01%)#1,317 |
| 24. | Kannapolis | 38 | 11,401(0.33%)#24 | 421,832(0.01%)#1,331 |
| 25. | Rocky Mount | 37 | 11,401(0.32%)#25 | 421,832(0.01%)#1,351 |
| 26. | Asheboro | 36 | 11,401(0.32%)#26 | 421,832(0.01%)#1,377 |
| 27. | Hope Mills | 36 | 11,401(0.32%)#27 | 421,832(0.01%)#1,381 |
| 28. | Clayton | 35 | 11,401(0.31%)#28 | 421,832(0.01%)#1,397 |
| 29. | Salisbury | 31 | 11,401(0.27%)#29 | 421,832(0.01%)#1,492 |
| 30. | Reidsville | 31 | 11,401(0.27%)#30 | 421,832(0.01%)#1,499 |
| 31. | Southern Pines | 30 | 11,401(0.26%)#31 | 421,832(0.01%)#1,521 |
| 32. | Pumpkin Center | 29 | 11,401(0.25%)#32 | 421,832(0.01%)#1,560 |
| 33. | Archdale | 28 | 11,401(0.25%)#33 | 421,832(0.01%)#1,586 |
| 34. | Zebulon | 23 | 11,401(0.20%)#34 | 421,832(0.01%)#1,732 |
| 35. | Porters Neck | 23 | 11,401(0.20%)#35 | 421,832(0.01%)#1,733 |
| 36. | Asheville | 21 | 11,401(0.18%)#36 | 421,832(0.00%)#1,774 |
| 37. | Pineville | 21 | 11,401(0.18%)#37 | 421,832(0.00%)#1,791 |
| 38. | New Bern | 20 | 11,401(0.18%)#38 | 421,832(0.00%)#1,812 |
| 39. | Spruce Pine | 20 | 11,401(0.18%)#39 | 421,832(0.00%)#1,832 |
| 40. | Whiteville | 18 | 11,401(0.16%)#40 | 421,832(0.00%)#1,915 |
| 41. | Wake Forest | 17 | 11,401(0.15%)#41 | 421,832(0.00%)#1,926 |
| 42. | Indian Trail | 17 | 11,401(0.15%)#42 | 421,832(0.00%)#1,930 |
| 43. | Myrtle Grove | 17 | 11,401(0.15%)#43 | 421,832(0.00%)#1,951 |
| 44. | Burlington | 16 | 11,401(0.14%)#44 | 421,832(0.00%)#1,986 |
| 45. | Mar Mac | 15 | 11,401(0.13%)#45 | 421,832(0.00%)#2,095 |
| 46. | Black Mountain | 14 | 11,401(0.12%)#46 | 421,832(0.00%)#2,131 |
| 47. | Matthews | 13 | 11,401(0.11%)#47 | 421,832(0.00%)#2,156 |
| 48. | Concord | 12 | 11,401(0.11%)#48 | 421,832(0.00%)#2,207 |
| 49. | Lumberton | 11 | 11,401(0.10%)#49 | 421,832(0.00%)#2,281 |
| 50. | Huntersville | 9 | 11,401(0.08%)#50 | 421,832(0.00%)#2,391 |
| 51. | Hickory | 9 | 11,401(0.08%)#51 | 421,832(0.00%)#2,395 |
| 52. | Winterville | 9 | 11,401(0.08%)#52 | 421,832(0.00%)#2,422 |
| 53. | Gastonia | 8 | 11,401(0.07%)#53 | 421,832(0.00%)#2,450 |
| 54. | Statesville | 8 | 11,401(0.07%)#54 | 421,832(0.00%)#2,465 |
| 55. | Thomasville | 7 | 11,401(0.06%)#55 | 421,832(0.00%)#2,528 |
| 56. | Carolina Beach | 7 | 11,401(0.06%)#56 | 421,832(0.00%)#2,558 |
| 57. | Aberdeen | 4 | 11,401(0.04%)#57 | 421,832(0.00%)#2,744 |
| 58. | Louisburg | 4 | 11,401(0.04%)#58 | 421,832(0.00%)#2,753 |
| 59. | Pine Knoll Shores | 3 | 11,401(0.03%)#59 | 421,832(0.00%)#2,813 |
| 60. | Ocean Isle Beach | 2 | 11,401(0.02%)#60 | 421,832(0.00%)#2,870 |
| 61. | Duck | 1 | 11,401(0.01%)#61 | 421,832(0.00%)#2,922 |
Common Questions
What are the Top 10 Cities with the Most Immigrants from Northern Africa in North Carolina?
Top 10 Cities with the Most Immigrants from Northern Africa in North Carolina are:
#1
2,027
#2
1,778
#3
1,765
#4
620
#5
538
#6
523
#7
352
#8
239
#9
218
#10
192
What city has the Most Immigrants from Northern Africa in North Carolina?
Greensboro has the Most Immigrants from Northern Africa in North Carolina with 2,027.
What is the Total Immigrants from Northern Africa in the State of North Carolina?
Total Immigrants from Northern Africa in North Carolina is 11,401.
What is the Total Immigrants from Northern Africa in the United States?
Total Immigrants from Northern Africa in the United States is 421,832.