Stallings, NC
Stallings Map
Stallings Overview
16,193
TOTAL POPULATION
7,703
MALE POPULATION
8,490
FEMALE POPULATION
90.73
MALES / 100 FEMALES
110.22
FEMALES / 100 MALES
39.8
MEDIAN AGE
3.1
AVG FAMILY SIZE
2.8
AVG HOUSEHOLD SIZE
$46,846
PER CAPITA INCOME
$110,694
AVG FAMILY INCOME
$99,451
AVG HOUSEHOLD INCOME
28.2%
WAGE / INCOME GAP [ % ]
71.8¢/ $1
WAGE / INCOME GAP [ $ ]
$5,581
FAMILY INCOME DEFICIT
0.41
INEQUALITY / GINI INDEX
9,067
LABOR FORCE [ PEOPLE ]
70.9%
PERCENT IN LABOR FORCE
4.8%
UNEMPLOYMENT RATE
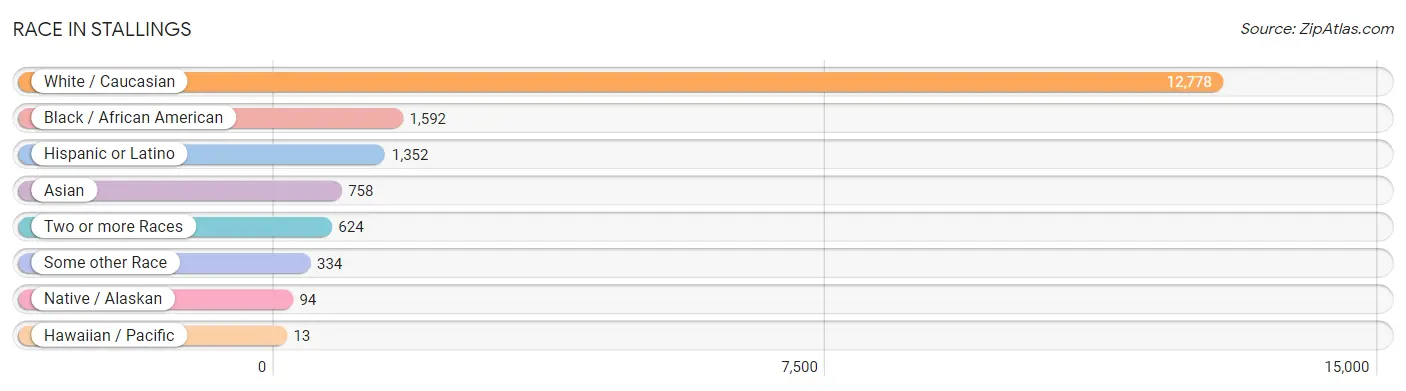
Race in Stallings
The most populous races in Stallings are White / Caucasian (12,778 | 78.9%), Black / African American (1,592 | 9.8%), and Hispanic or Latino (1,352 | 8.4%).
| Race | # Population | % Population |
| Asian | 758 | 4.7% |
| Black / African American | 1,592 | 9.8% |
| Hawaiian / Pacific | 13 | 0.1% |
| Hispanic or Latino | 1,352 | 8.4% |
| Native / Alaskan | 94 | 0.6% |
| White / Caucasian | 12,778 | 78.9% |
| Two or more Races | 624 | 3.8% |
| Some other Race | 334 | 2.1% |
| Total | 16,193 | 100.0% |
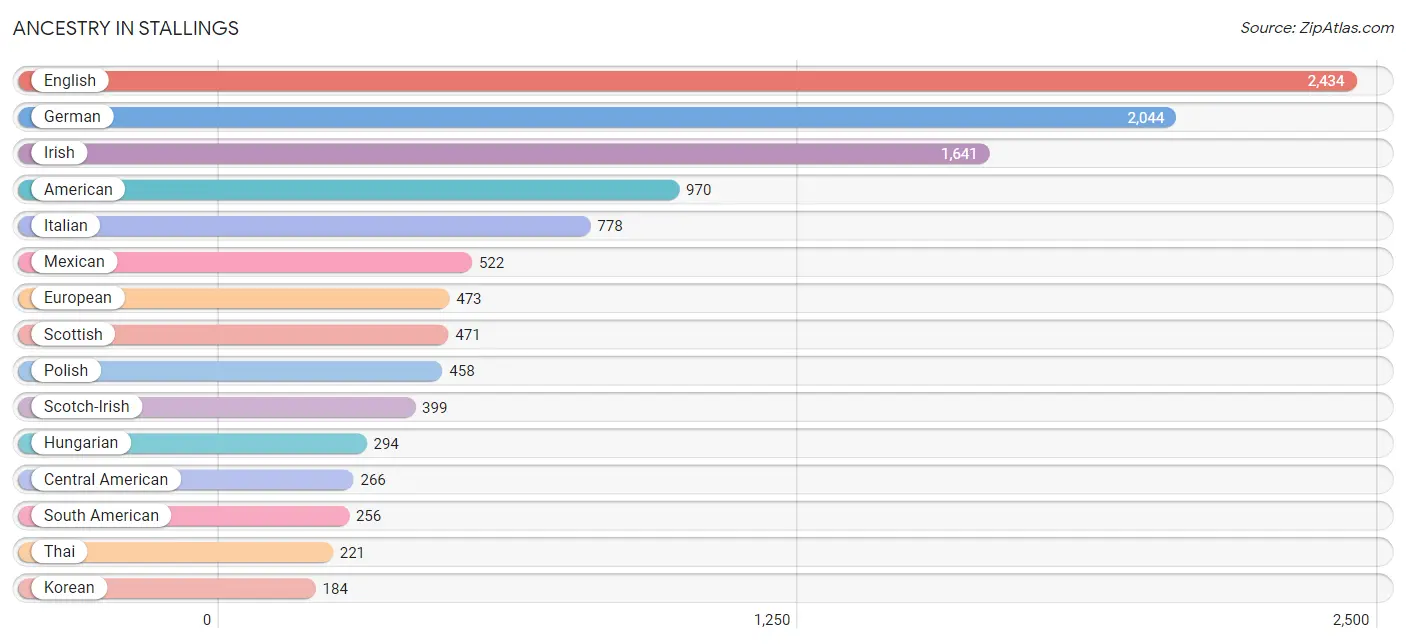
Ancestry in Stallings
The most populous ancestries reported in Stallings are English (2,434 | 15.0%), German (2,044 | 12.6%), Irish (1,641 | 10.1%), American (970 | 6.0%), and Italian (778 | 4.8%), together accounting for 48.6% of all Stallings residents.
| Ancestry | # Population | % Population |
| African | 141 | 0.9% |
| American | 970 | 6.0% |
| Arab | 110 | 0.7% |
| Argentinean | 13 | 0.1% |
| Armenian | 5 | 0.0% |
| Australian | 15 | 0.1% |
| Austrian | 17 | 0.1% |
| Belgian | 4 | 0.0% |
| Bolivian | 10 | 0.1% |
| Brazilian | 45 | 0.3% |
| British | 169 | 1.0% |
| Burmese | 58 | 0.4% |
| Canadian | 22 | 0.1% |
| Central American | 266 | 1.6% |
| Cherokee | 12 | 0.1% |
| Colombian | 41 | 0.3% |
| Croatian | 7 | 0.0% |
| Cuban | 42 | 0.3% |
| Czech | 132 | 0.8% |
| Danish | 39 | 0.2% |
| Dominican | 15 | 0.1% |
| Dutch | 125 | 0.8% |
| Eastern European | 34 | 0.2% |
| Ecuadorian | 81 | 0.5% |
| Egyptian | 23 | 0.1% |
| English | 2,434 | 15.0% |
| Ethiopian | 36 | 0.2% |
| European | 473 | 2.9% |
| French | 170 | 1.1% |
| French Canadian | 32 | 0.2% |
| German | 2,044 | 12.6% |
| Greek | 130 | 0.8% |
| Guamanian / Chamorro | 10 | 0.1% |
| Guatemalan | 105 | 0.6% |
| Hungarian | 294 | 1.8% |
| Indian (Asian) | 142 | 0.9% |
| Indonesian | 148 | 0.9% |
| Iranian | 4 | 0.0% |
| Irish | 1,641 | 10.1% |
| Italian | 778 | 4.8% |
| Jamaican | 9 | 0.1% |
| Jordanian | 37 | 0.2% |
| Korean | 184 | 1.1% |
| Latvian | 85 | 0.5% |
| Lebanese | 87 | 0.5% |
| Lumbee | 13 | 0.1% |
| Mexican | 522 | 3.2% |
| Native Hawaiian | 33 | 0.2% |
| Nigerian | 11 | 0.1% |
| Northern European | 36 | 0.2% |
| Norwegian | 109 | 0.7% |
| Panamanian | 1 | 0.0% |
| Pennsylvania German | 4 | 0.0% |
| Peruvian | 93 | 0.6% |
| Polish | 458 | 2.8% |
| Puerto Rican | 181 | 1.1% |
| Russian | 66 | 0.4% |
| Salvadoran | 160 | 1.0% |
| Scandinavian | 45 | 0.3% |
| Scotch-Irish | 399 | 2.5% |
| Scottish | 471 | 2.9% |
| Serbian | 3 | 0.0% |
| Slavic | 11 | 0.1% |
| Slovak | 42 | 0.3% |
| South American | 256 | 1.6% |
| Spaniard | 35 | 0.2% |
| Spanish | 8 | 0.1% |
| Sri Lankan | 46 | 0.3% |
| Subsaharan African | 152 | 0.9% |
| Swedish | 48 | 0.3% |
| Swiss | 121 | 0.7% |
| Thai | 221 | 1.4% |
| Turkish | 44 | 0.3% |
| Ukrainian | 8 | 0.1% |
| Venezuelan | 2 | 0.0% |
| Welsh | 77 | 0.5% | View All 76 Rows |
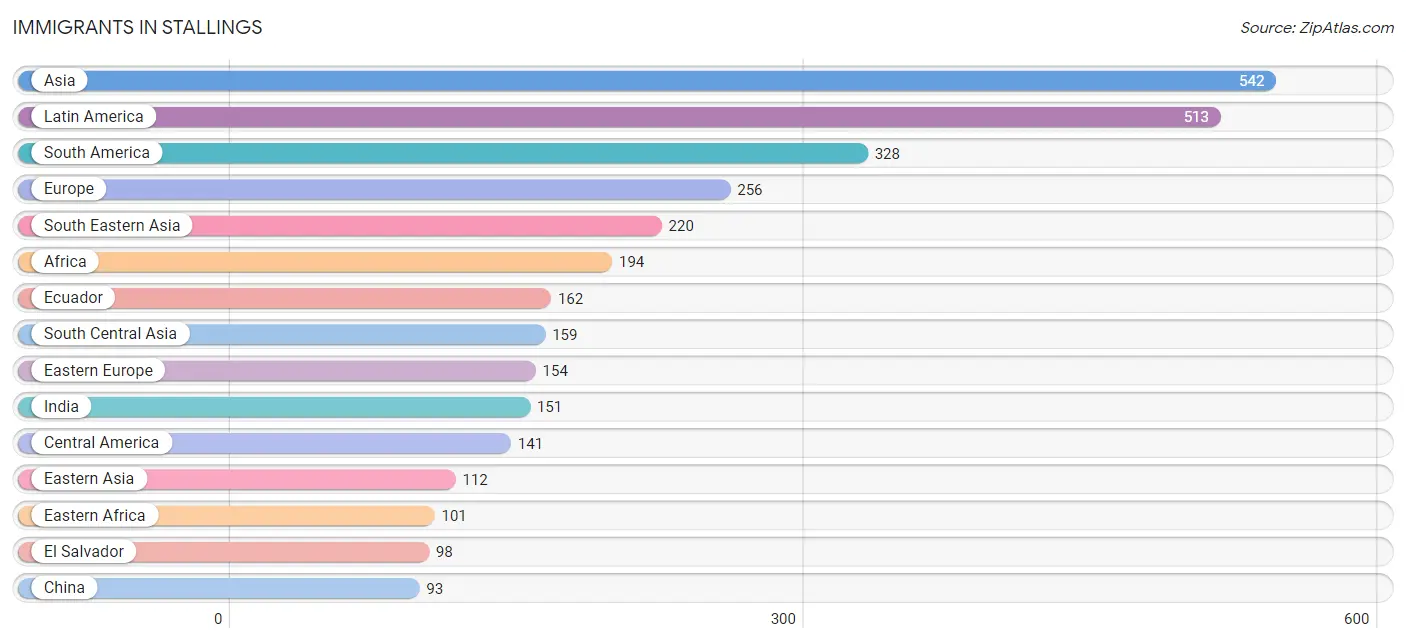
Immigrants in Stallings
The most numerous immigrant groups reported in Stallings came from Asia (542 | 3.4%), Latin America (513 | 3.2%), South America (328 | 2.0%), Europe (256 | 1.6%), and South Eastern Asia (220 | 1.4%), together accounting for 11.5% of all Stallings residents.
| Immigration Origin | # Population | % Population |
| Africa | 194 | 1.2% |
| Argentina | 13 | 0.1% |
| Armenia | 5 | 0.0% |
| Asia | 542 | 3.4% |
| Australia | 6 | 0.0% |
| Barbados | 23 | 0.1% |
| Bolivia | 10 | 0.1% |
| Brazil | 55 | 0.3% |
| Canada | 37 | 0.2% |
| Caribbean | 44 | 0.3% |
| Central America | 141 | 0.9% |
| China | 93 | 0.6% |
| Croatia | 7 | 0.0% |
| Cuba | 5 | 0.0% |
| Czechoslovakia | 5 | 0.0% |
| Dominican Republic | 5 | 0.0% |
| Eastern Africa | 101 | 0.6% |
| Eastern Asia | 112 | 0.7% |
| Eastern Europe | 154 | 0.9% |
| Ecuador | 162 | 1.0% |
| El Salvador | 98 | 0.6% |
| England | 20 | 0.1% |
| Ethiopia | 36 | 0.2% |
| Europe | 256 | 1.6% |
| Germany | 41 | 0.3% |
| Guatemala | 10 | 0.1% |
| India | 151 | 0.9% |
| Indonesia | 11 | 0.1% |
| Jamaica | 11 | 0.1% |
| Korea | 19 | 0.1% |
| Latin America | 513 | 3.2% |
| Latvia | 65 | 0.4% |
| Lebanon | 6 | 0.0% |
| Malaysia | 51 | 0.3% |
| Mexico | 32 | 0.2% |
| Nigeria | 11 | 0.1% |
| Northern Europe | 61 | 0.4% |
| Oceania | 6 | 0.0% |
| Pakistan | 8 | 0.1% |
| Panama | 1 | 0.0% |
| Peru | 86 | 0.5% |
| Poland | 49 | 0.3% |
| Romania | 9 | 0.1% |
| Russia | 19 | 0.1% |
| Scotland | 37 | 0.2% |
| South Africa | 41 | 0.3% |
| South America | 328 | 2.0% |
| South Central Asia | 159 | 1.0% |
| South Eastern Asia | 220 | 1.4% |
| Turkey | 23 | 0.1% |
| Venezuela | 2 | 0.0% |
| Vietnam | 90 | 0.6% |
| Western Africa | 52 | 0.3% |
| Western Asia | 51 | 0.3% |
| Western Europe | 41 | 0.3% |
| Yemen | 3 | 0.0% | View All 56 Rows |
Sex and Age in Stallings
Sex and Age in Stallings
The most populous age groups in Stallings are 10 to 14 Years (818 | 10.6%) for men and 50 to 54 Years (730 | 8.6%) for women.
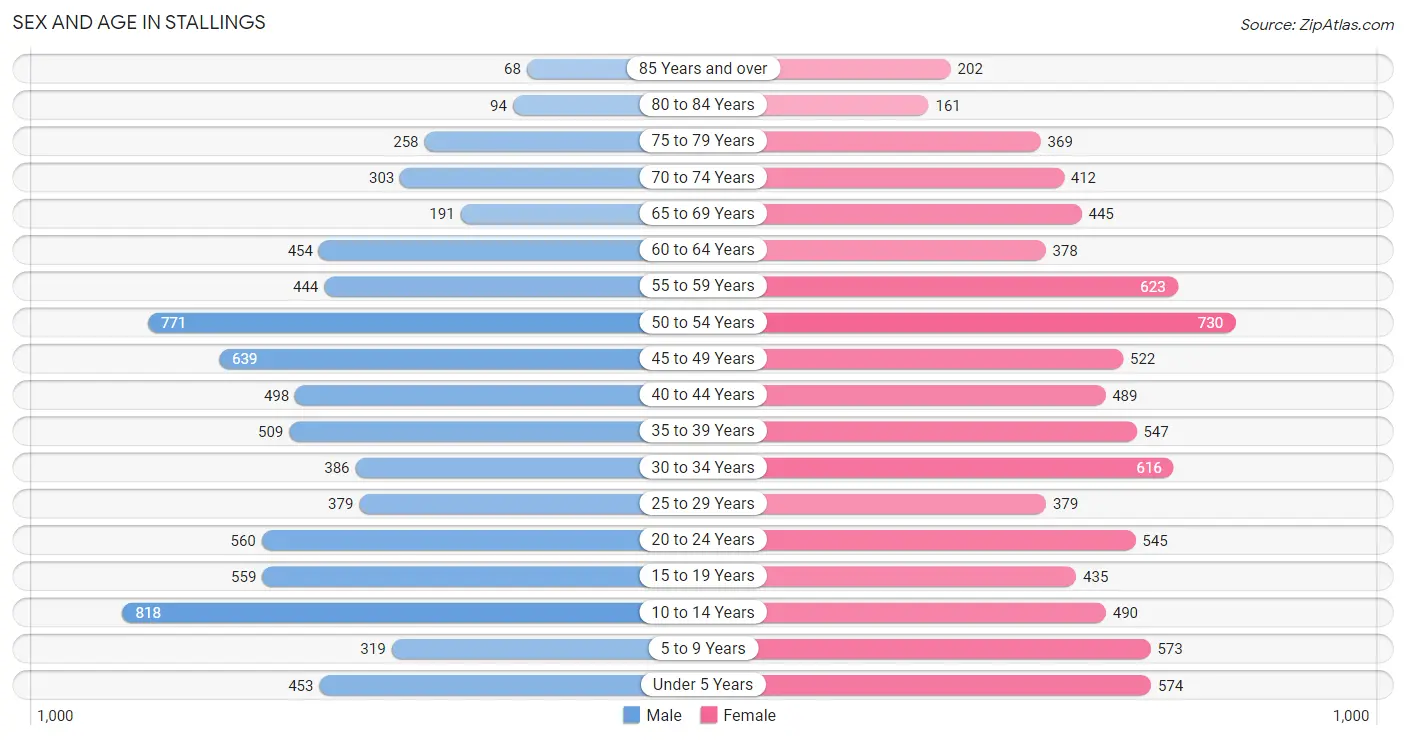
| Age Bracket | Male | Female |
| Under 5 Years | 453 (5.9%) | 574 (6.8%) |
| 5 to 9 Years | 319 (4.1%) | 573 (6.8%) |
| 10 to 14 Years | 818 (10.6%) | 490 (5.8%) |
| 15 to 19 Years | 559 (7.3%) | 435 (5.1%) |
| 20 to 24 Years | 560 (7.3%) | 545 (6.4%) |
| 25 to 29 Years | 379 (4.9%) | 379 (4.5%) |
| 30 to 34 Years | 386 (5.0%) | 616 (7.3%) |
| 35 to 39 Years | 509 (6.6%) | 547 (6.4%) |
| 40 to 44 Years | 498 (6.5%) | 489 (5.8%) |
| 45 to 49 Years | 639 (8.3%) | 522 (6.1%) |
| 50 to 54 Years | 771 (10.0%) | 730 (8.6%) |
| 55 to 59 Years | 444 (5.8%) | 623 (7.3%) |
| 60 to 64 Years | 454 (5.9%) | 378 (4.4%) |
| 65 to 69 Years | 191 (2.5%) | 445 (5.2%) |
| 70 to 74 Years | 303 (3.9%) | 412 (4.9%) |
| 75 to 79 Years | 258 (3.4%) | 369 (4.3%) |
| 80 to 84 Years | 94 (1.2%) | 161 (1.9%) |
| 85 Years and over | 68 (0.9%) | 202 (2.4%) |
| Total | 7,703 (100.0%) | 8,490 (100.0%) |
Families and Households in Stallings
Median Family Size in Stallings
The median family size in Stallings is 3.10 persons per family, with married-couple families (3,810 | 83.5%) accounting for the largest median family size of 3.15 persons per family. On the other hand, single male/father families (146 | 3.2%) represent the smallest median family size with 2.25 persons per family.
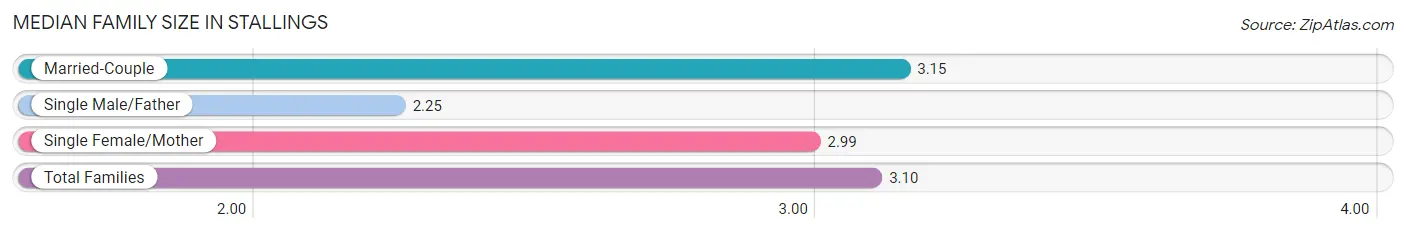
| Family Type | # Families | Family Size |
| Married-Couple | 3,810 (83.5%) | 3.15 |
| Single Male/Father | 146 (3.2%) | 2.25 |
| Single Female/Mother | 607 (13.3%) | 2.99 |
| Total Families | 4,563 (100.0%) | 3.10 |
Median Household Size in Stallings
The median household size in Stallings is 2.76 persons per household, with single female/mother households (607 | 10.4%) accounting for the largest median household size of 3.22 persons per household. non-family households (1,298 | 22.2%) represent the smallest median household size with 1.42 persons per household.
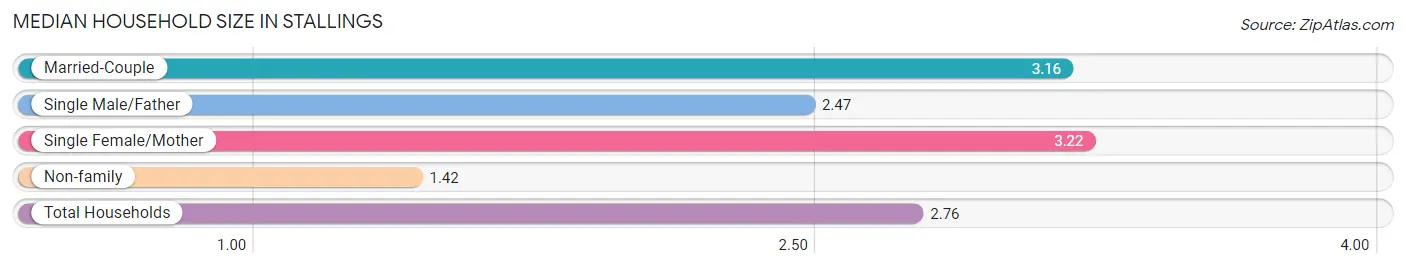
| Household Type | # Households | Household Size |
| Married-Couple | 3,810 (65.0%) | 3.16 |
| Single Male/Father | 146 (2.5%) | 2.47 |
| Single Female/Mother | 607 (10.4%) | 3.22 |
| Non-family | 1,298 (22.2%) | 1.42 |
| Total Households | 5,861 (100.0%) | 2.76 |
Household Size by Marriage Status in Stallings
Out of a total of 5,861 households in Stallings, 4,563 (77.8%) are family households, while 1,298 (22.2%) are nonfamily households. The most numerous type of family households are 2-person households, comprising 1,857, and the most common type of nonfamily households are 1-person households, comprising 936.
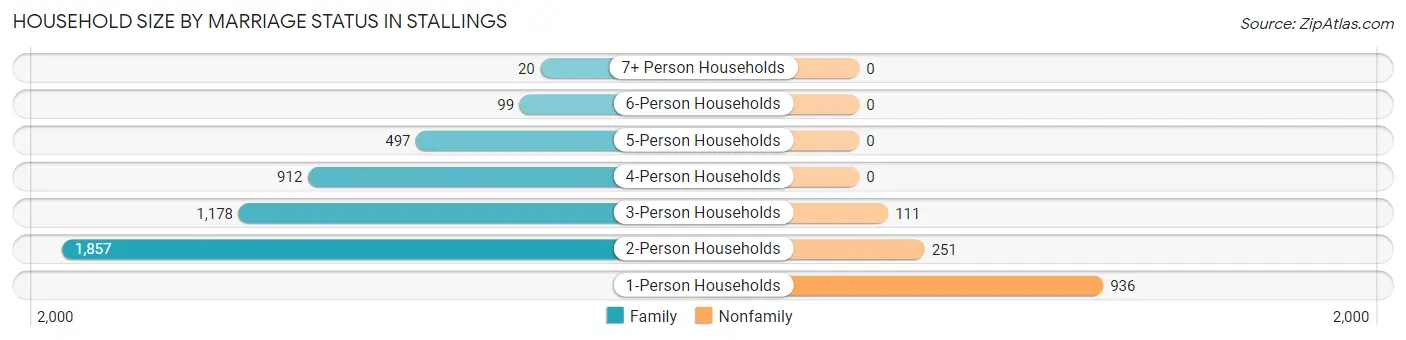
| Household Size | Family Households | Nonfamily Households |
| 1-Person Households | - | 936 (16.0%) |
| 2-Person Households | 1,857 (31.7%) | 251 (4.3%) |
| 3-Person Households | 1,178 (20.1%) | 111 (1.9%) |
| 4-Person Households | 912 (15.6%) | 0 (0.0%) |
| 5-Person Households | 497 (8.5%) | 0 (0.0%) |
| 6-Person Households | 99 (1.7%) | 0 (0.0%) |
| 7+ Person Households | 20 (0.3%) | 0 (0.0%) |
| Total | 4,563 (77.8%) | 1,298 (22.2%) |
Female Fertility in Stallings
Fertility by Age in Stallings
Average fertility rate in Stallings is 63.0 births per 1,000 women. Women in the age bracket of 20 to 34 years have the highest fertility rate with 106.0 births per 1,000 women. Women in the age bracket of 20 to 34 years acount for 70.1% of all women with births.
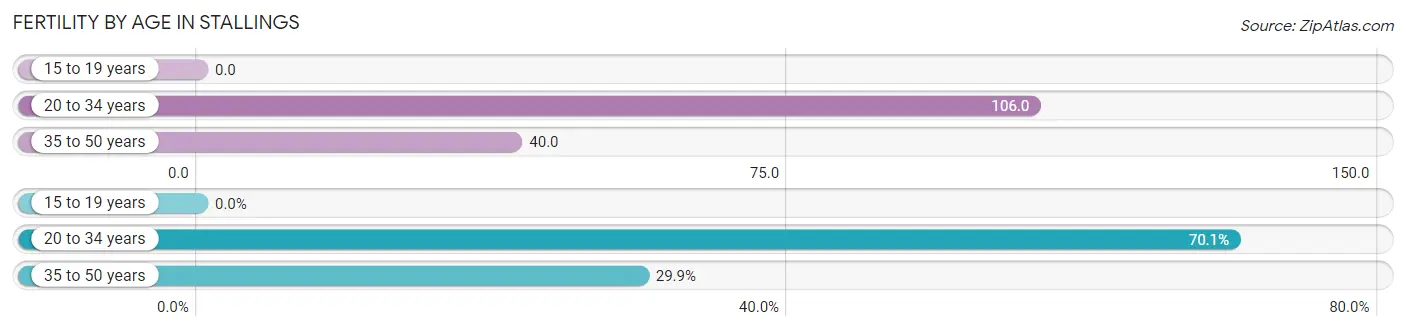
| Age Bracket | Women with Births | Births / 1,000 Women |
| 15 to 19 years | 0 (0.0%) | 0.0 |
| 20 to 34 years | 164 (70.1%) | 106.0 |
| 35 to 50 years | 70 (29.9%) | 40.0 |
| Total | 234 (100.0%) | 63.0 |
Fertility by Age by Marriage Status in Stallings
92.3% of women with births (234) in Stallings are married. The highest percentage of unmarried women with births falls into 20 to 34 years age bracket with 11.0% of them unmarried at the time of birth, while the lowest percentage of unmarried women with births belong to 35 to 50 years age bracket with 0.0% of them unmarried.
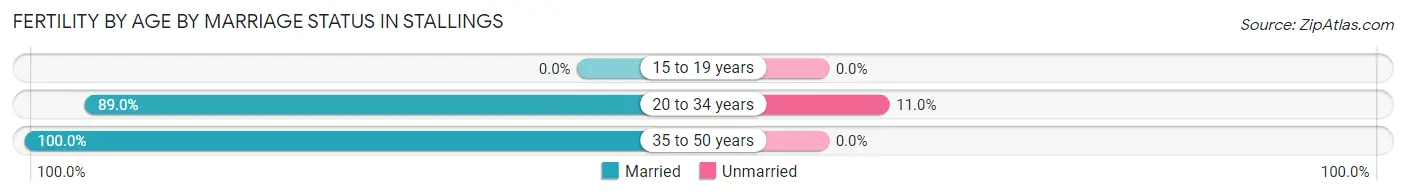
| Age Bracket | Married | Unmarried |
| 15 to 19 years | 0 (0.0%) | 0 (0.0%) |
| 20 to 34 years | 146 (89.0%) | 18 (11.0%) |
| 35 to 50 years | 70 (100.0%) | 0 (0.0%) |
| Total | 216 (92.3%) | 18 (7.7%) |
Fertility by Education in Stallings
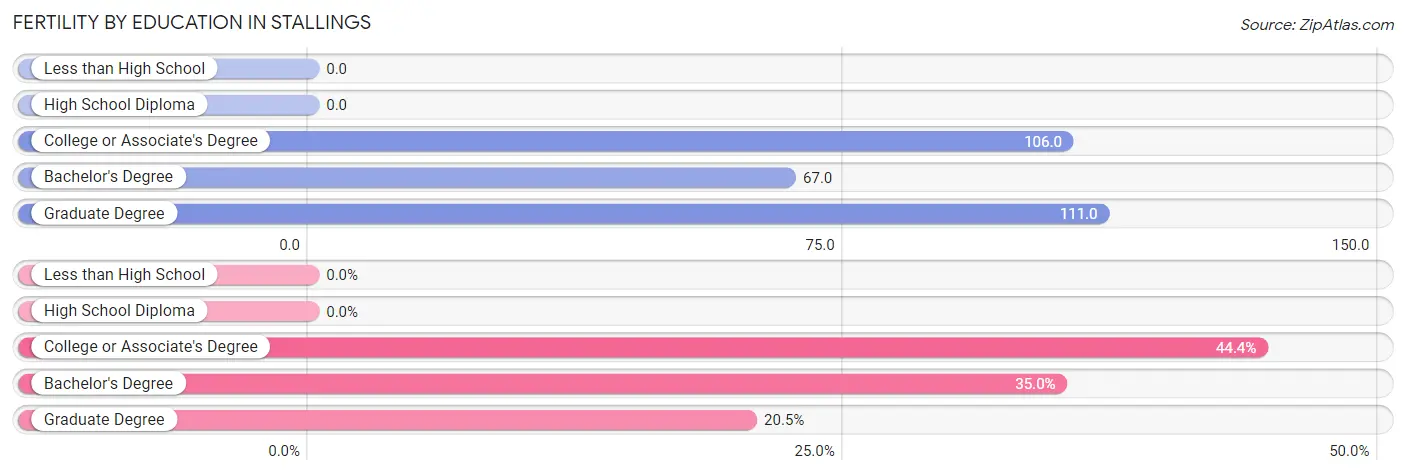
| Educational Attainment | Women with Births | Births / 1,000 Women |
| Less than High School | 0 (0.0%) | 0.0 |
| High School Diploma | 0 (0.0%) | 0.0 |
| College or Associate's Degree | 104 (44.4%) | 106.0 |
| Bachelor's Degree | 82 (35.0%) | 67.0 |
| Graduate Degree | 48 (20.5%) | 111.0 |
| Total | 234 (100.0%) | 63.0 |
Fertility by Education by Marriage Status in Stallings
7.7% of women with births in Stallings are unmarried. Women with the educational attainment of graduate degree are most likely to be married with 100.0% of them married at childbirth, while women with the educational attainment of bachelor's degree are least likely to be married with 13.4% of them unmarried at childbirth.
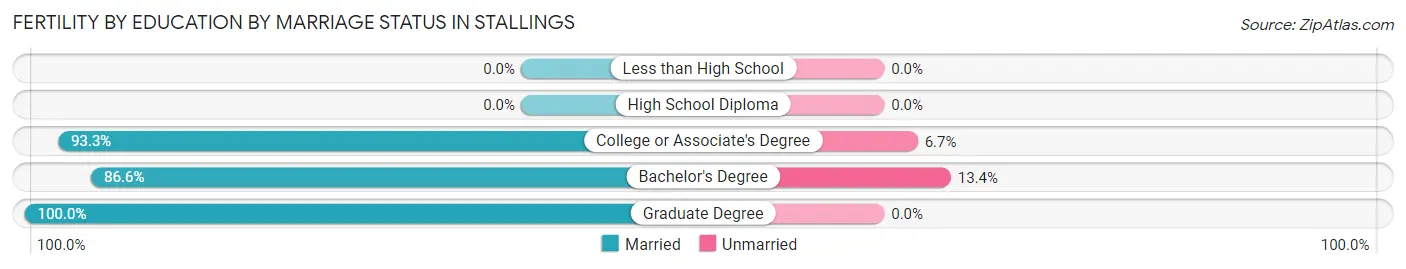
| Educational Attainment | Married | Unmarried |
| Less than High School | 0 (0.0%) | 0 (0.0%) |
| High School Diploma | 0 (0.0%) | 0 (0.0%) |
| College or Associate's Degree | 97 (93.3%) | 7 (6.7%) |
| Bachelor's Degree | 71 (86.6%) | 11 (13.4%) |
| Graduate Degree | 48 (100.0%) | 0 (0.0%) |
| Total | 216 (92.3%) | 18 (7.7%) |
Income in Stallings
Income Overview in Stallings
Per Capita Income in Stallings is $46,846, while median incomes of families and households are $110,694 and $99,451 respectively.
| Characteristic | Number | Measure |
| Per Capita Income | 16,193 | $46,846 |
| Median Family Income | 4,563 | $110,694 |
| Mean Family Income | 4,563 | $138,948 |
| Median Household Income | 5,861 | $99,451 |
| Mean Household Income | 5,861 | $128,344 |
| Income Deficit | 4,563 | $5,581 |
| Wage / Income Gap (%) | 16,193 | 28.15% |
| Wage / Income Gap ($) | 16,193 | 71.85¢ per $1 |
| Gini / Inequality Index | 16,193 | 0.41 |
Earnings by Sex in Stallings
Average Earnings in Stallings are $47,961, $53,903 for men and $38,727 for women, a difference of 28.1%.
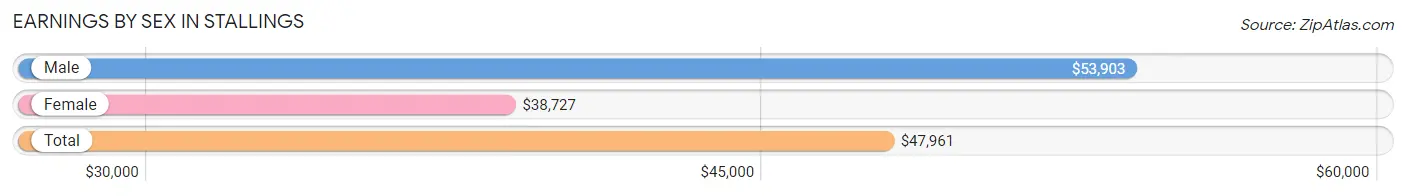
| Sex | Number | Average Earnings |
| Male | 4,775 (51.7%) | $53,903 |
| Female | 4,464 (48.3%) | $38,727 |
| Total | 9,239 (100.0%) | $47,961 |
Earnings by Sex by Income Bracket in Stallings
The most common earnings brackets in Stallings are $100,000+ for men (1,197 | 25.1%) and $100,000+ for women (623 | 14.0%).
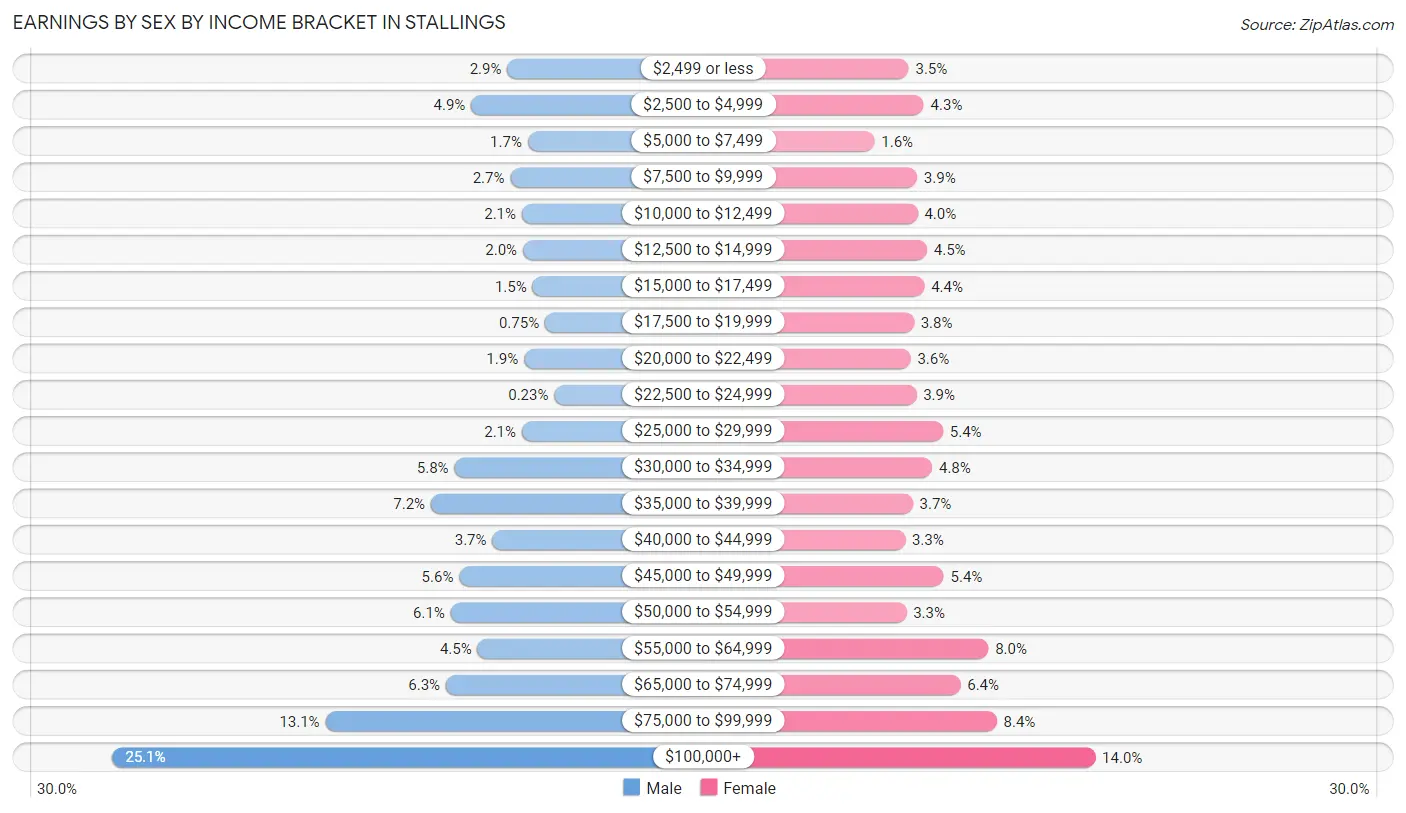
| Income | Male | Female |
| $2,499 or less | 137 (2.9%) | 155 (3.5%) |
| $2,500 to $4,999 | 234 (4.9%) | 193 (4.3%) |
| $5,000 to $7,499 | 82 (1.7%) | 69 (1.5%) |
| $7,500 to $9,999 | 129 (2.7%) | 176 (3.9%) |
| $10,000 to $12,499 | 98 (2.1%) | 177 (4.0%) |
| $12,500 to $14,999 | 95 (2.0%) | 201 (4.5%) |
| $15,000 to $17,499 | 69 (1.5%) | 194 (4.3%) |
| $17,500 to $19,999 | 36 (0.7%) | 168 (3.8%) |
| $20,000 to $22,499 | 92 (1.9%) | 160 (3.6%) |
| $22,500 to $24,999 | 11 (0.2%) | 174 (3.9%) |
| $25,000 to $29,999 | 98 (2.1%) | 241 (5.4%) |
| $30,000 to $34,999 | 279 (5.8%) | 214 (4.8%) |
| $35,000 to $39,999 | 342 (7.2%) | 165 (3.7%) |
| $40,000 to $44,999 | 177 (3.7%) | 146 (3.3%) |
| $45,000 to $49,999 | 266 (5.6%) | 243 (5.4%) |
| $50,000 to $54,999 | 289 (6.0%) | 149 (3.3%) |
| $55,000 to $64,999 | 217 (4.5%) | 355 (8.0%) |
| $65,000 to $74,999 | 302 (6.3%) | 285 (6.4%) |
| $75,000 to $99,999 | 625 (13.1%) | 376 (8.4%) |
| $100,000+ | 1,197 (25.1%) | 623 (14.0%) |
| Total | 4,775 (100.0%) | 4,464 (100.0%) |
Earnings by Sex by Educational Attainment in Stallings
Average earnings in Stallings are $67,300 for men and $47,776 for women, a difference of 29.0%. Men with an educational attainment of graduate degree enjoy the highest average annual earnings of $126,023, while those with high school diploma education earn the least with $35,870. Women with an educational attainment of graduate degree earn the most with the average annual earnings of $78,152, while those with high school diploma education have the smallest earnings of $29,625.
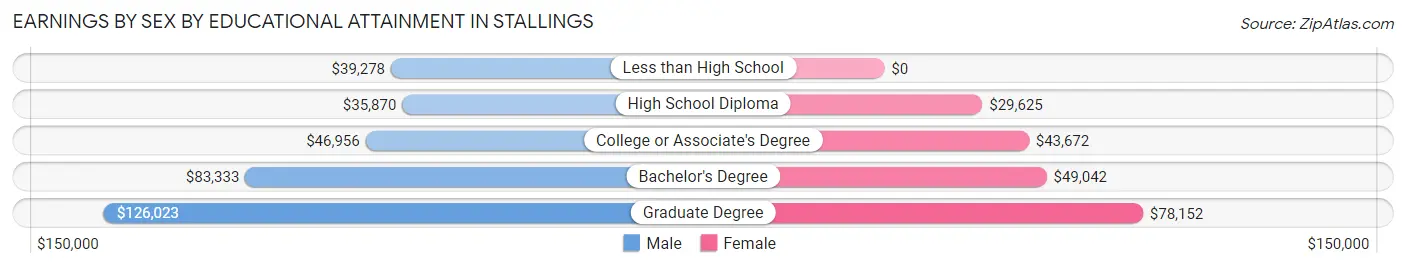
| Educational Attainment | Male Income | Female Income |
| Less than High School | $39,278 | $0 |
| High School Diploma | $35,870 | $29,625 |
| College or Associate's Degree | $46,956 | $43,672 |
| Bachelor's Degree | $83,333 | $49,042 |
| Graduate Degree | $126,023 | $78,152 |
| Total | $67,300 | $47,776 |
Family Income in Stallings
Family Income Brackets in Stallings
According to the Stallings family income data, there are 976 families falling into the $100,000 to $149,999 income range, which is the most common income bracket and makes up 21.4% of all families. Conversely, the less than $10,000 income bracket is the least frequent group with only 23 families (0.5%) belonging to this category.
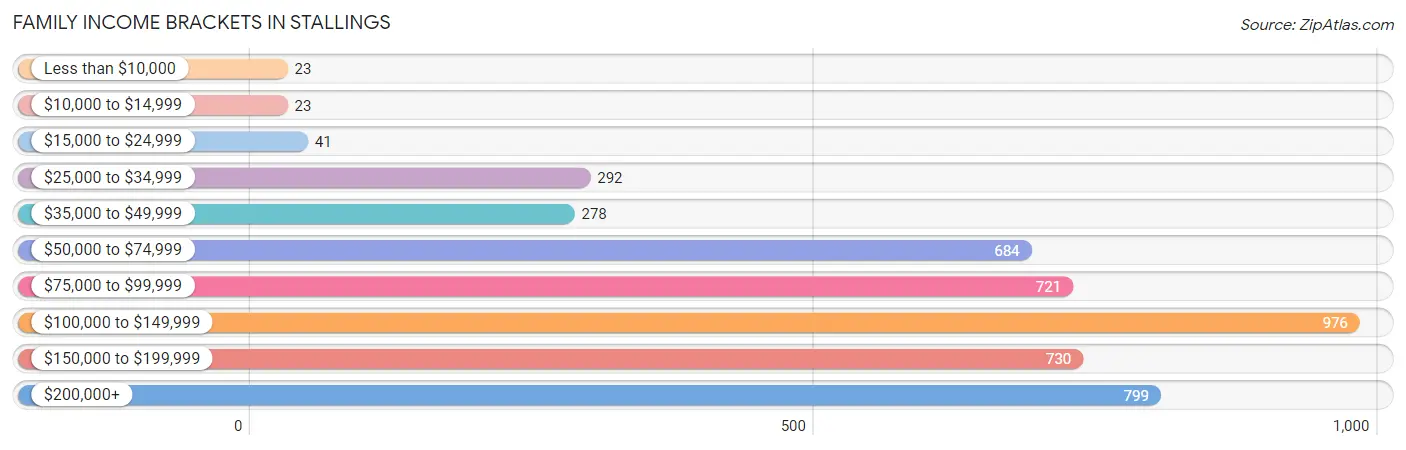
| Income Bracket | # Families | % Families |
| Less than $10,000 | 23 | 0.5% |
| $10,000 to $14,999 | 23 | 0.5% |
| $15,000 to $24,999 | 41 | 0.9% |
| $25,000 to $34,999 | 292 | 6.4% |
| $35,000 to $49,999 | 278 | 6.1% |
| $50,000 to $74,999 | 684 | 15.0% |
| $75,000 to $99,999 | 721 | 15.8% |
| $100,000 to $149,999 | 976 | 21.4% |
| $150,000 to $199,999 | 730 | 16.0% |
| $200,000+ | 799 | 17.5% |
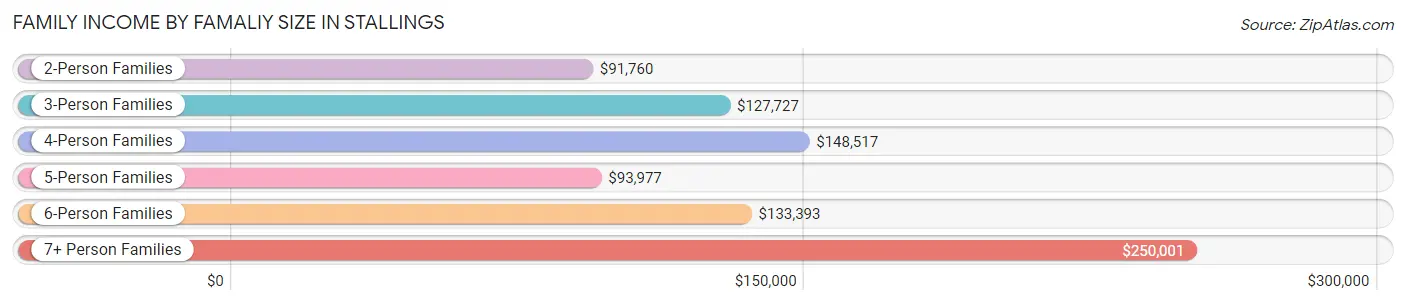
Family Income by Famaliy Size in Stallings
7+ person families (20 | 0.4%) account for the highest median family income in Stallings with $250,001 per family, while 2-person families (1,951 | 42.8%) have the highest median income of $45,880 per family member.
| Income Bracket | # Families | Median Income |
| 2-Person Families | 1,951 (42.8%) | $91,760 |
| 3-Person Families | 1,136 (24.9%) | $127,727 |
| 4-Person Families | 867 (19.0%) | $148,517 |
| 5-Person Families | 505 (11.1%) | $93,977 |
| 6-Person Families | 84 (1.8%) | $133,393 |
| 7+ Person Families | 20 (0.4%) | $250,001 |
| Total | 4,563 (100.0%) | $110,694 |
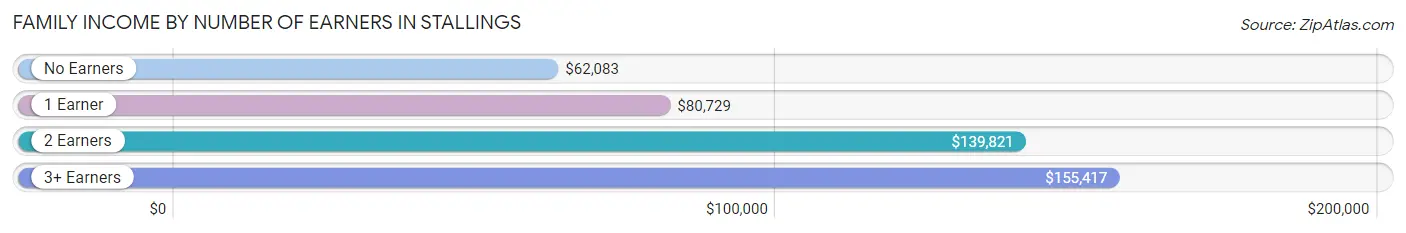
Family Income by Number of Earners in Stallings
The median family income in Stallings is $110,694, with families comprising 3+ earners (547) having the highest median family income of $155,417, while families with no earners (563) have the lowest median family income of $62,083, accounting for 12.0% and 12.3% of families, respectively.
| Number of Earners | # Families | Median Income |
| No Earners | 563 (12.3%) | $62,083 |
| 1 Earner | 1,268 (27.8%) | $80,729 |
| 2 Earners | 2,185 (47.9%) | $139,821 |
| 3+ Earners | 547 (12.0%) | $155,417 |
| Total | 4,563 (100.0%) | $110,694 |
Household Income in Stallings
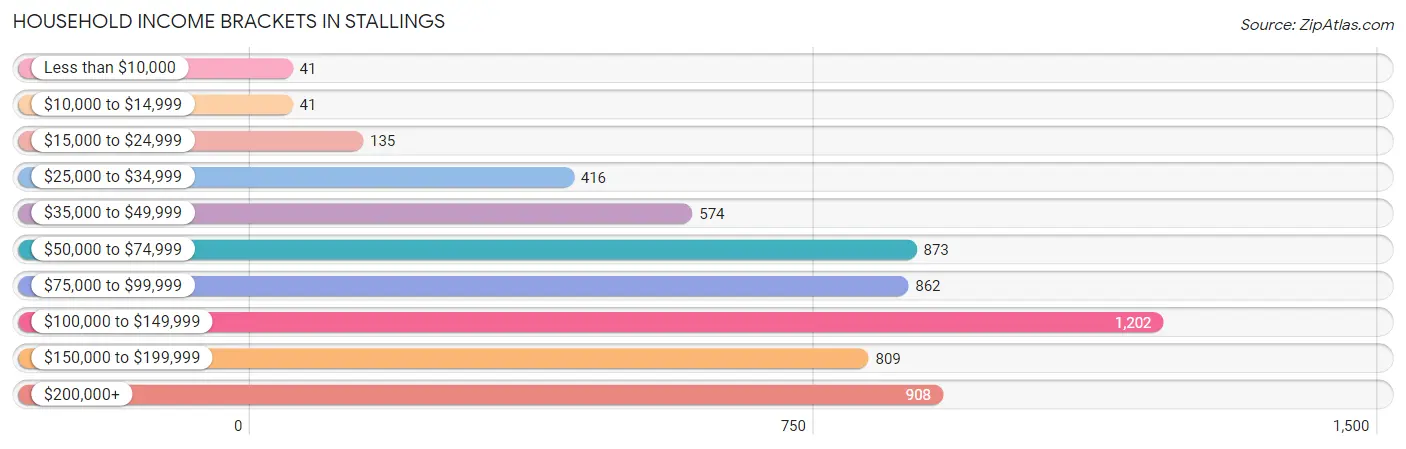
Household Income Brackets in Stallings
With 1,202 households falling in the category, the $100,000 to $149,999 income range is the most frequent in Stallings, accounting for 20.5% of all households. In contrast, only 41 households (0.7%) fall into the less than $10,000 income bracket, making it the least populous group.
| Income Bracket | # Households | % Households |
| Less than $10,000 | 41 | 0.7% |
| $10,000 to $14,999 | 41 | 0.7% |
| $15,000 to $24,999 | 135 | 2.3% |
| $25,000 to $34,999 | 416 | 7.1% |
| $35,000 to $49,999 | 574 | 9.8% |
| $50,000 to $74,999 | 873 | 14.9% |
| $75,000 to $99,999 | 862 | 14.7% |
| $100,000 to $149,999 | 1,202 | 20.5% |
| $150,000 to $199,999 | 809 | 13.8% |
| $200,000+ | 908 | 15.5% |
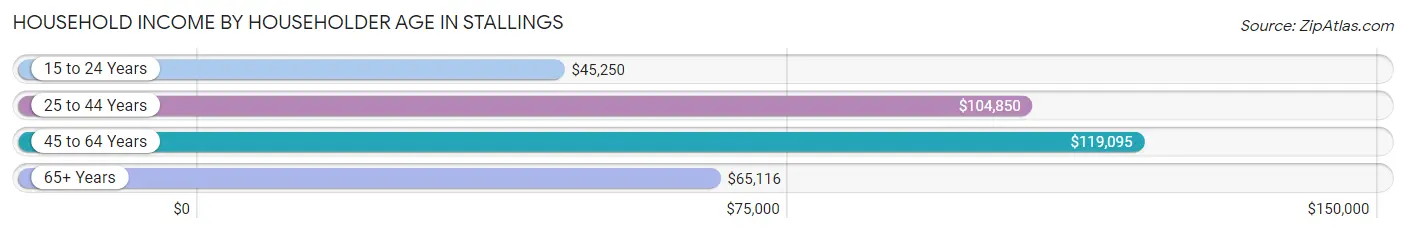
Household Income by Householder Age in Stallings
The median household income in Stallings is $99,451, with the highest median household income of $119,095 found in the 45 to 64 years age bracket for the primary householder. A total of 2,453 households (41.8%) fall into this category. Meanwhile, the 15 to 24 years age bracket for the primary householder has the lowest median household income of $45,250, with 72 households (1.2%) in this group.
| Income Bracket | # Households | Median Income |
| 15 to 24 Years | 72 (1.2%) | $45,250 |
| 25 to 44 Years | 1,783 (30.4%) | $104,850 |
| 45 to 64 Years | 2,453 (41.8%) | $119,095 |
| 65+ Years | 1,553 (26.5%) | $65,116 |
| Total | 5,861 (100.0%) | $99,451 |
Poverty in Stallings
Income Below Poverty by Sex and Age in Stallings
With 4.9% poverty level for males and 4.4% for females among the residents of Stallings, 16 and 17 year old males and 6 to 11 year old females are the most vulnerable to poverty, with 34 males (12.8%) and 83 females (11.6%) in their respective age groups living below the poverty level.
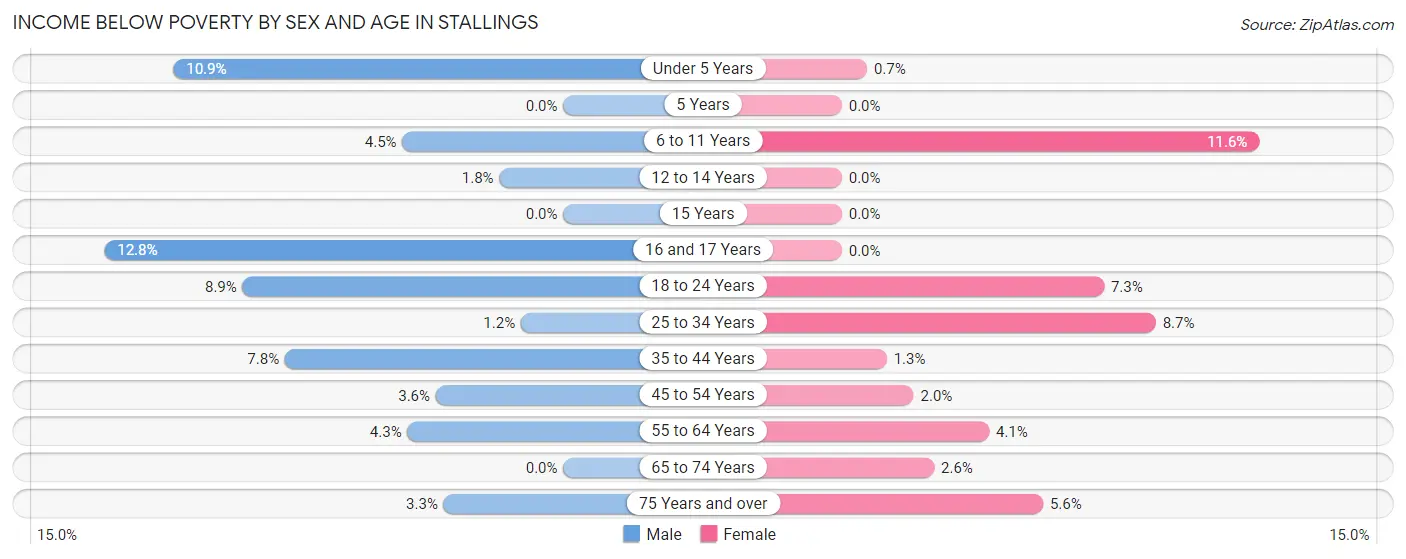
| Age Bracket | Male | Female |
| Under 5 Years | 49 (10.9%) | 4 (0.7%) |
| 5 Years | 0 (0.0%) | 0 (0.0%) |
| 6 to 11 Years | 23 (4.5%) | 83 (11.6%) |
| 12 to 14 Years | 9 (1.8%) | 0 (0.0%) |
| 15 Years | 0 (0.0%) | 0 (0.0%) |
| 16 and 17 Years | 34 (12.8%) | 0 (0.0%) |
| 18 to 24 Years | 69 (8.9%) | 54 (7.3%) |
| 25 to 34 Years | 9 (1.2%) | 87 (8.7%) |
| 35 to 44 Years | 78 (7.7%) | 13 (1.3%) |
| 45 to 54 Years | 50 (3.5%) | 25 (2.0%) |
| 55 to 64 Years | 39 (4.3%) | 41 (4.1%) |
| 65 to 74 Years | 0 (0.0%) | 22 (2.6%) |
| 75 Years and over | 14 (3.3%) | 41 (5.6%) |
| Total | 374 (4.9%) | 370 (4.4%) |
Income Above Poverty by Sex and Age in Stallings
According to the poverty statistics in Stallings, males aged 5 years and females aged 5 years are the age groups that are most secure financially, with 100.0% of males and 100.0% of females in these age groups living above the poverty line.
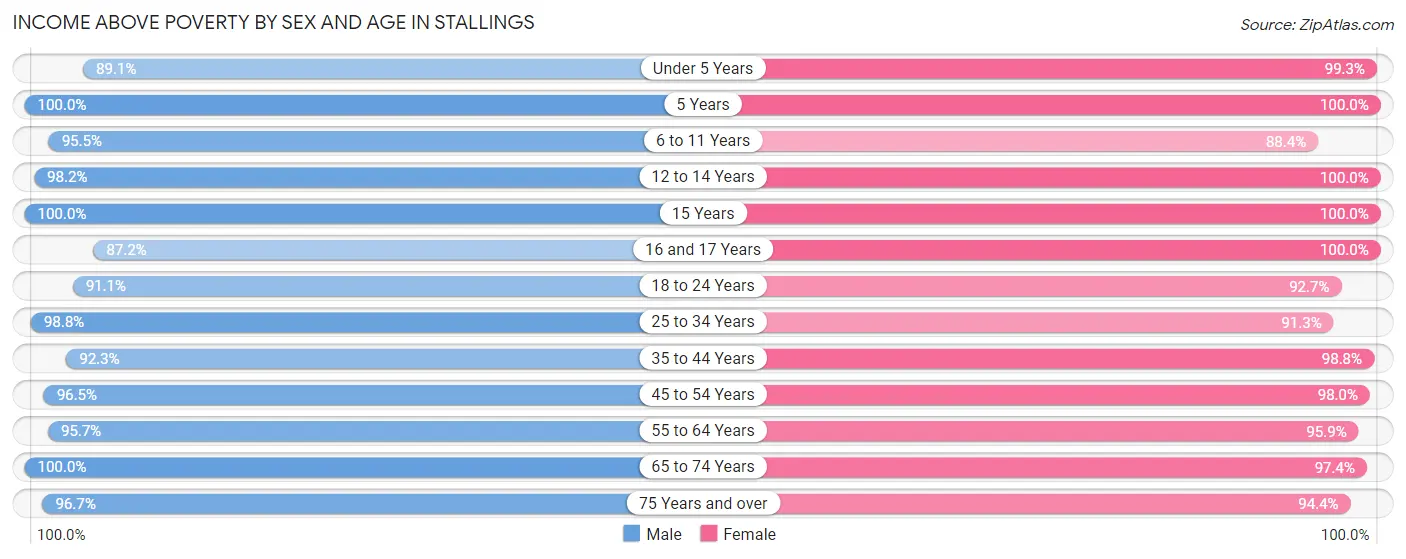
| Age Bracket | Male | Female |
| Under 5 Years | 402 (89.1%) | 570 (99.3%) |
| 5 Years | 111 (100.0%) | 107 (100.0%) |
| 6 to 11 Years | 490 (95.5%) | 631 (88.4%) |
| 12 to 14 Years | 498 (98.2%) | 242 (100.0%) |
| 15 Years | 80 (100.0%) | 97 (100.0%) |
| 16 and 17 Years | 232 (87.2%) | 143 (100.0%) |
| 18 to 24 Years | 704 (91.1%) | 686 (92.7%) |
| 25 to 34 Years | 756 (98.8%) | 908 (91.3%) |
| 35 to 44 Years | 929 (92.2%) | 1,023 (98.8%) |
| 45 to 54 Years | 1,360 (96.5%) | 1,227 (98.0%) |
| 55 to 64 Years | 859 (95.7%) | 960 (95.9%) |
| 65 to 74 Years | 494 (100.0%) | 835 (97.4%) |
| 75 Years and over | 406 (96.7%) | 691 (94.4%) |
| Total | 7,321 (95.1%) | 8,120 (95.6%) |
Income Below Poverty Among Married-Couple Families in Stallings
The poverty statistics for married-couple families in Stallings show that 3.4% or 131 of the total 3,810 families live below the poverty line. Families with 3 or 4 children have the highest poverty rate of 12.3%, comprising of 39 families. On the other hand, families with 5 or more children have the lowest poverty rate of 0.0%, which includes 0 families.
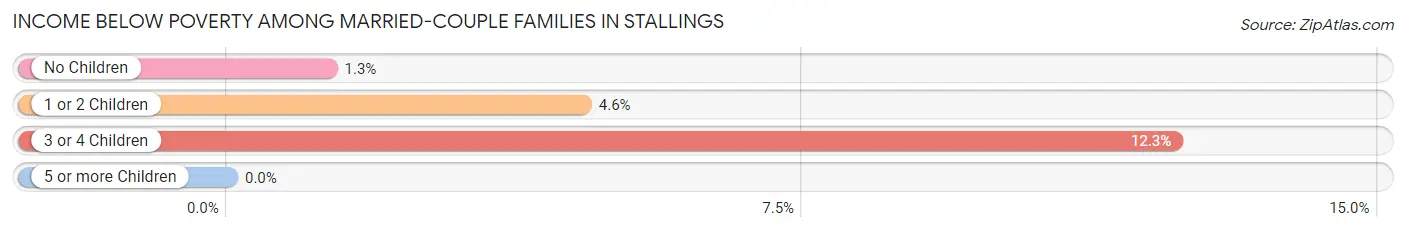
| Children | Above Poverty | Below Poverty |
| No Children | 2,050 (98.7%) | 27 (1.3%) |
| 1 or 2 Children | 1,341 (95.4%) | 65 (4.6%) |
| 3 or 4 Children | 277 (87.7%) | 39 (12.3%) |
| 5 or more Children | 11 (100.0%) | 0 (0.0%) |
| Total | 3,679 (96.6%) | 131 (3.4%) |
Income Below Poverty Among Single-Parent Households in Stallings
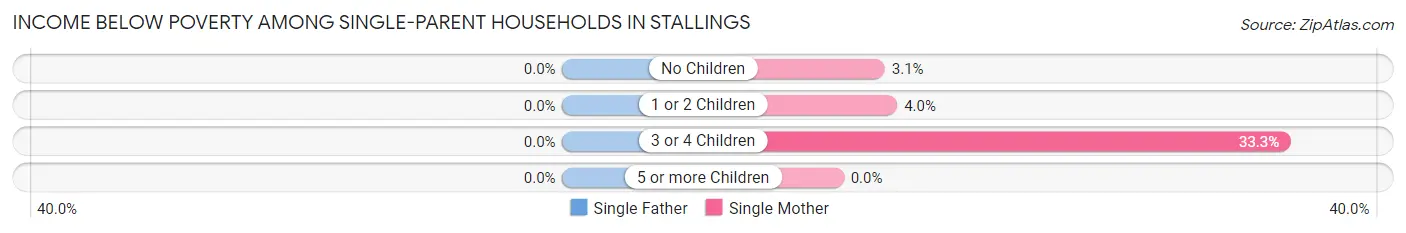
| Children | Single Father | Single Mother |
| No Children | 0 (0.0%) | 8 (3.1%) |
| 1 or 2 Children | 0 (0.0%) | 12 (4.0%) |
| 3 or 4 Children | 0 (0.0%) | 15 (33.3%) |
| 5 or more Children | 0 (0.0%) | 0 (0.0%) |
| Total | 0 (0.0%) | 35 (5.8%) |
Income Below Poverty Among Married-Couple vs Single-Parent Households in Stallings
The poverty data for Stallings shows that 131 of the married-couple family households (3.4%) and 35 of the single-parent households (4.6%) are living below the poverty level. Within the married-couple family households, those with 3 or 4 children have the highest poverty rate, with 39 households (12.3%) falling below the poverty line. Among the single-parent households, those with 3 or 4 children have the highest poverty rate, with 15 household (33.3%) living below poverty.
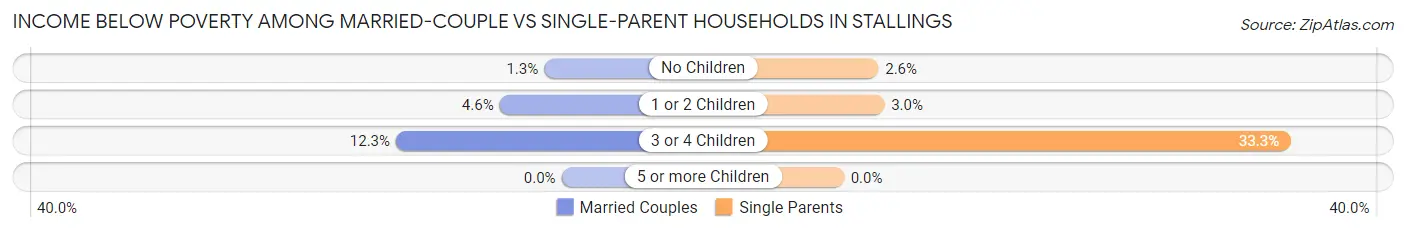
| Children | Married-Couple Families | Single-Parent Households |
| No Children | 27 (1.3%) | 8 (2.6%) |
| 1 or 2 Children | 65 (4.6%) | 12 (3.0%) |
| 3 or 4 Children | 39 (12.3%) | 15 (33.3%) |
| 5 or more Children | 0 (0.0%) | 0 (0.0%) |
| Total | 131 (3.4%) | 35 (4.6%) |
Employment Characteristics in Stallings
Employment by Class of Employer in Stallings
Among the 8,471 employed individuals in Stallings, private company employees (5,748 | 67.9%), not-for-profit organizations (833 | 9.8%), and local government employees (636 | 7.5%) make up the most common classes of employment.
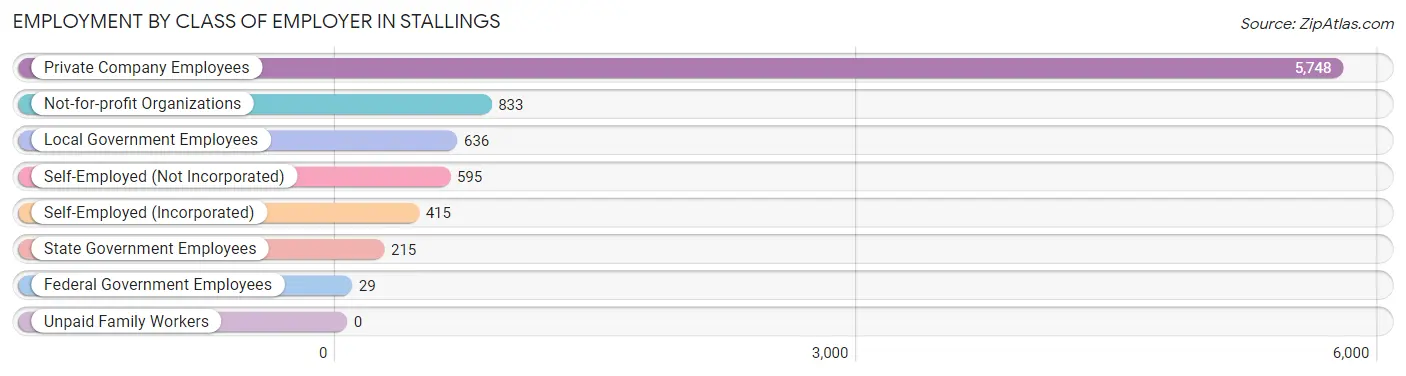
| Employer Class | # Employees | % Employees |
| Private Company Employees | 5,748 | 67.9% |
| Self-Employed (Incorporated) | 415 | 4.9% |
| Self-Employed (Not Incorporated) | 595 | 7.0% |
| Not-for-profit Organizations | 833 | 9.8% |
| Local Government Employees | 636 | 7.5% |
| State Government Employees | 215 | 2.5% |
| Federal Government Employees | 29 | 0.3% |
| Unpaid Family Workers | 0 | 0.0% |
| Total | 8,471 | 100.0% |
Employment Status by Age in Stallings
According to the labor force statistics for Stallings, out of the total population over 16 years of age (12,789), 70.9% or 9,067 individuals are in the labor force, with 4.8% or 435 of them unemployed. The age group with the highest labor force participation rate is 35 to 44 years, with 92.8% or 1,896 individuals in the labor force. Within the labor force, the 16 to 19 years age range has the highest percentage of unemployed individuals, with 34.0% or 155 of them being unemployed.
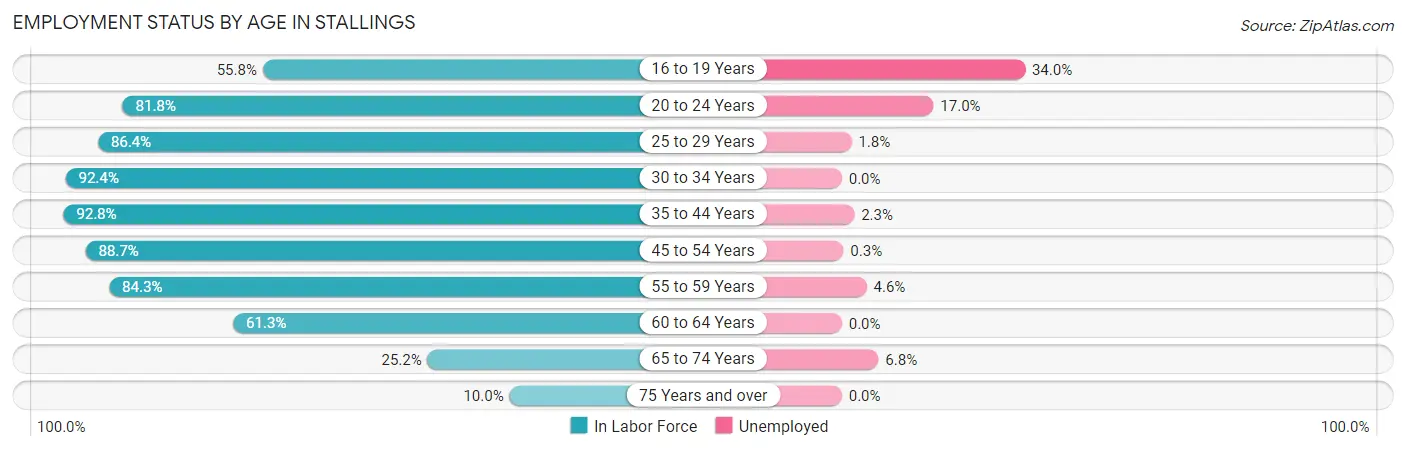
| Age Bracket | In Labor Force | Unemployed |
| 16 to 19 Years | 456 (55.8%) | 155 (34.0%) |
| 20 to 24 Years | 904 (81.8%) | 154 (17.0%) |
| 25 to 29 Years | 655 (86.4%) | 12 (1.8%) |
| 30 to 34 Years | 926 (92.4%) | 0 (0.0%) |
| 35 to 44 Years | 1,896 (92.8%) | 44 (2.3%) |
| 45 to 54 Years | 2,361 (88.7%) | 7 (0.3%) |
| 55 to 59 Years | 899 (84.3%) | 41 (4.6%) |
| 60 to 64 Years | 510 (61.3%) | 0 (0.0%) |
| 65 to 74 Years | 340 (25.2%) | 23 (6.8%) |
| 75 Years and over | 115 (10.0%) | 0 (0.0%) |
| Total | 9,067 (70.9%) | 435 (4.8%) |
Employment Status by Educational Attainment in Stallings
According to labor force statistics for Stallings, 86.6% of individuals (7,243) out of the total population between 25 and 64 years of age (8,364) are in the labor force, with 1.4% or 101 of them being unemployed. The group with the highest labor force participation rate are those with the educational attainment of bachelor's degree or higher, with 91.0% or 4,026 individuals in the labor force. Within the labor force, individuals with high school diploma education have the highest percentage of unemployment, with 4.0% or 28 of them being unemployed.
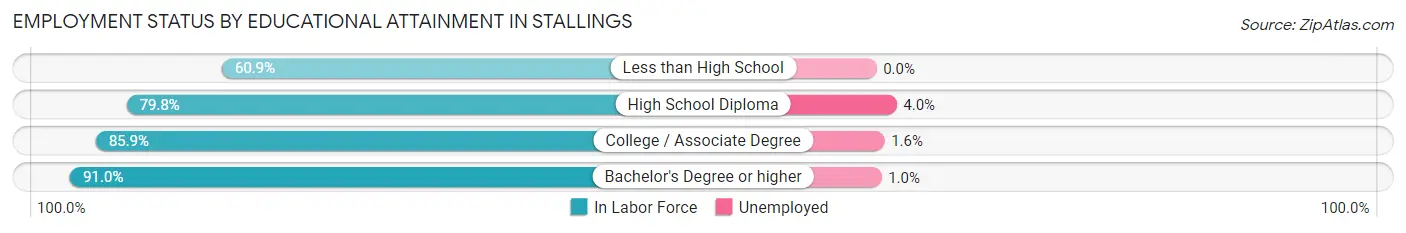
| Educational Attainment | In Labor Force | Unemployed |
| Less than High School | 273 (60.9%) | 0 (0.0%) |
| High School Diploma | 692 (79.8%) | 35 (4.0%) |
| College / Associate Degree | 2,255 (85.9%) | 42 (1.6%) |
| Bachelor's Degree or higher | 4,026 (91.0%) | 44 (1.0%) |
| Total | 7,243 (86.6%) | 117 (1.4%) |
Employment Occupations by Sex in Stallings
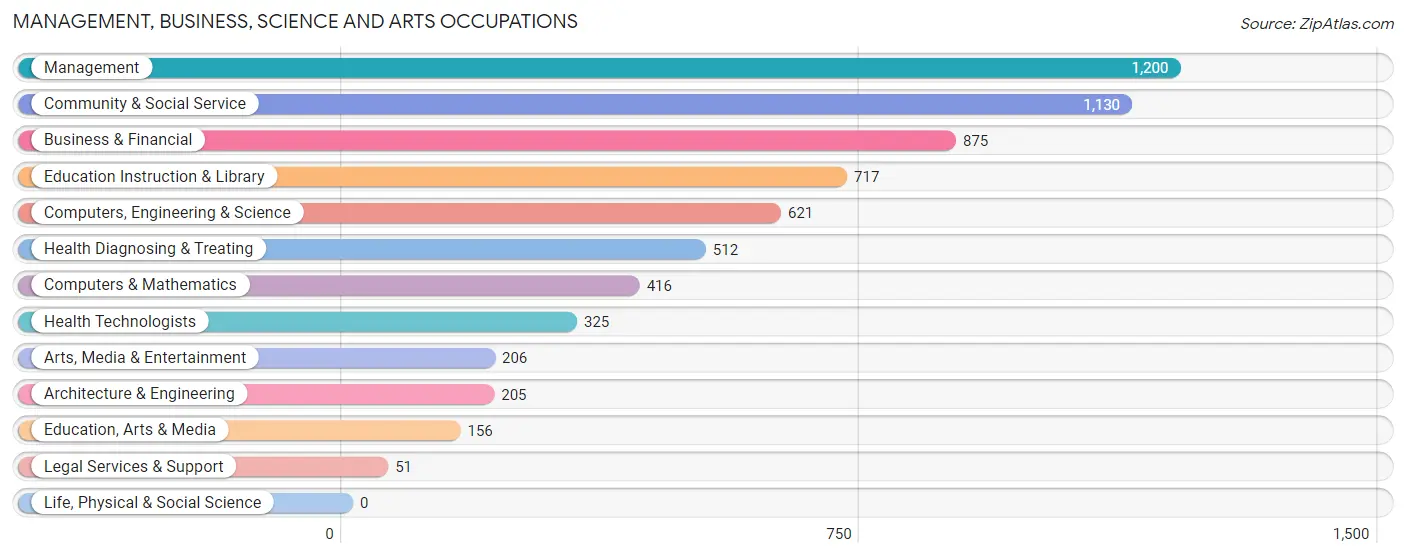
Management, Business, Science and Arts Occupations
The most common Management, Business, Science and Arts occupations in Stallings are Management (1,200 | 13.9%), Community & Social Service (1,130 | 13.1%), Business & Financial (875 | 10.1%), Education Instruction & Library (717 | 8.3%), and Computers, Engineering & Science (621 | 7.2%).
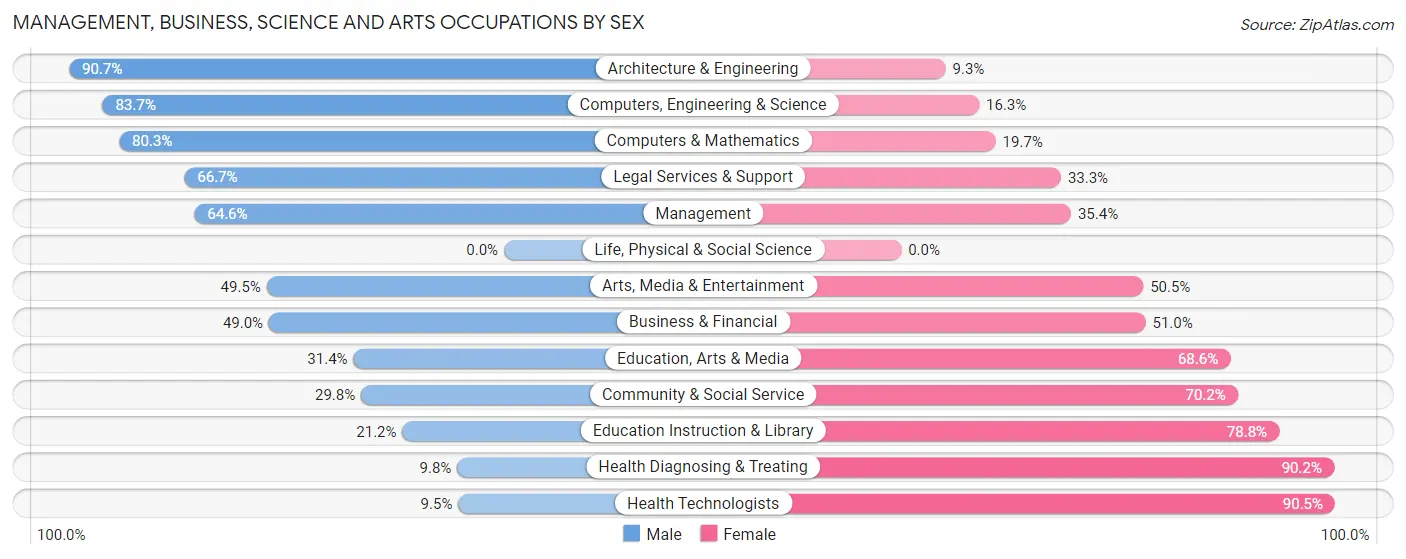
Management, Business, Science and Arts Occupations by Sex
Within the Management, Business, Science and Arts occupations in Stallings, the most male-oriented occupations are Architecture & Engineering (90.7%), Computers, Engineering & Science (83.7%), and Computers & Mathematics (80.3%), while the most female-oriented occupations are Health Technologists (90.5%), Health Diagnosing & Treating (90.2%), and Education Instruction & Library (78.8%).
| Occupation | Male | Female |
| Management | 775 (64.6%) | 425 (35.4%) |
| Business & Financial | 429 (49.0%) | 446 (51.0%) |
| Computers, Engineering & Science | 520 (83.7%) | 101 (16.3%) |
| Computers & Mathematics | 334 (80.3%) | 82 (19.7%) |
| Architecture & Engineering | 186 (90.7%) | 19 (9.3%) |
| Life, Physical & Social Science | 0 (0.0%) | 0 (0.0%) |
| Community & Social Service | 337 (29.8%) | 793 (70.2%) |
| Education, Arts & Media | 49 (31.4%) | 107 (68.6%) |
| Legal Services & Support | 34 (66.7%) | 17 (33.3%) |
| Education Instruction & Library | 152 (21.2%) | 565 (78.8%) |
| Arts, Media & Entertainment | 102 (49.5%) | 104 (50.5%) |
| Health Diagnosing & Treating | 50 (9.8%) | 462 (90.2%) |
| Health Technologists | 31 (9.5%) | 294 (90.5%) |
| Total (Category) | 2,111 (48.7%) | 2,227 (51.3%) |
| Total (Overall) | 4,380 (50.8%) | 4,245 (49.2%) |
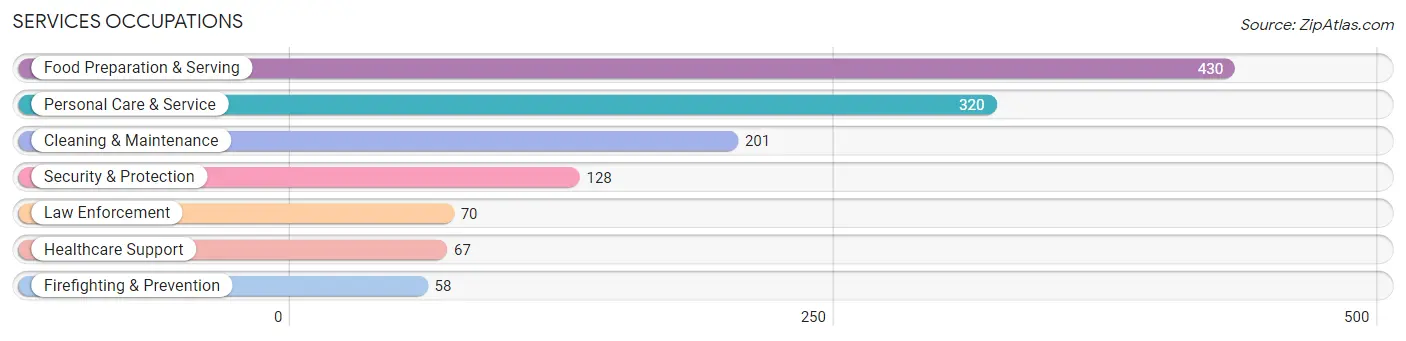
Services Occupations
The most common Services occupations in Stallings are Food Preparation & Serving (430 | 5.0%), Personal Care & Service (320 | 3.7%), Cleaning & Maintenance (201 | 2.3%), Security & Protection (128 | 1.5%), and Law Enforcement (70 | 0.8%).
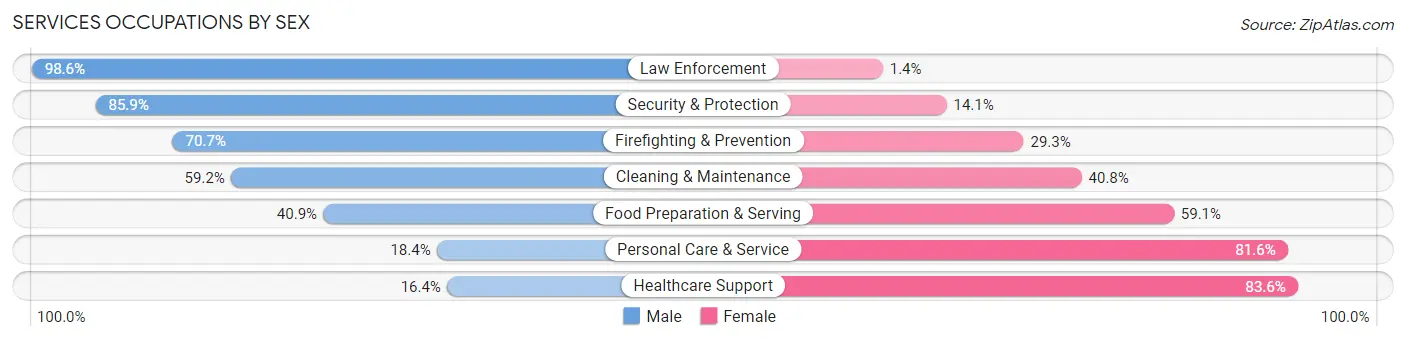
Services Occupations by Sex
Within the Services occupations in Stallings, the most male-oriented occupations are Law Enforcement (98.6%), Security & Protection (85.9%), and Firefighting & Prevention (70.7%), while the most female-oriented occupations are Healthcare Support (83.6%), Personal Care & Service (81.6%), and Food Preparation & Serving (59.1%).
| Occupation | Male | Female |
| Healthcare Support | 11 (16.4%) | 56 (83.6%) |
| Security & Protection | 110 (85.9%) | 18 (14.1%) |
| Firefighting & Prevention | 41 (70.7%) | 17 (29.3%) |
| Law Enforcement | 69 (98.6%) | 1 (1.4%) |
| Food Preparation & Serving | 176 (40.9%) | 254 (59.1%) |
| Cleaning & Maintenance | 119 (59.2%) | 82 (40.8%) |
| Personal Care & Service | 59 (18.4%) | 261 (81.6%) |
| Total (Category) | 475 (41.4%) | 671 (58.6%) |
| Total (Overall) | 4,380 (50.8%) | 4,245 (49.2%) |
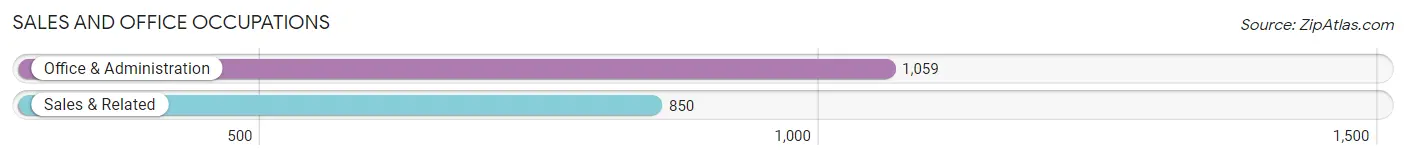
Sales and Office Occupations
The most common Sales and Office occupations in Stallings are Office & Administration (1,059 | 12.3%), and Sales & Related (850 | 9.9%).
Sales and Office Occupations by Sex
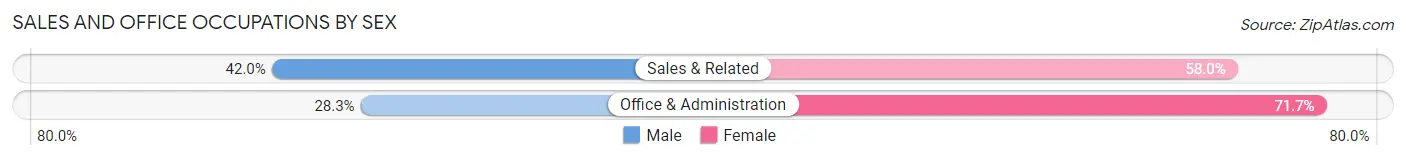
| Occupation | Male | Female |
| Sales & Related | 357 (42.0%) | 493 (58.0%) |
| Office & Administration | 300 (28.3%) | 759 (71.7%) |
| Total (Category) | 657 (34.4%) | 1,252 (65.6%) |
| Total (Overall) | 4,380 (50.8%) | 4,245 (49.2%) |
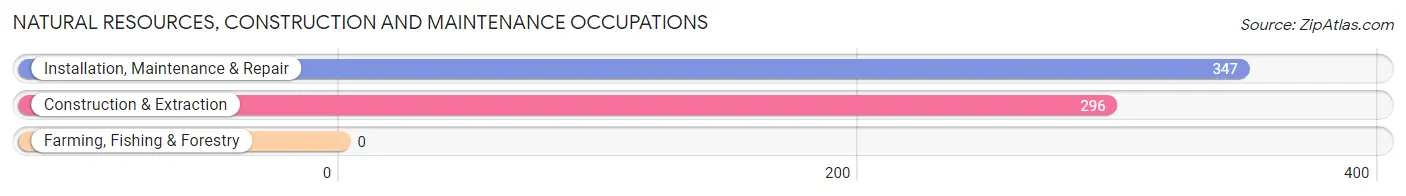
Natural Resources, Construction and Maintenance Occupations
The most common Natural Resources, Construction and Maintenance occupations in Stallings are Installation, Maintenance & Repair (347 | 4.0%), and Construction & Extraction (296 | 3.4%).
Natural Resources, Construction and Maintenance Occupations by Sex
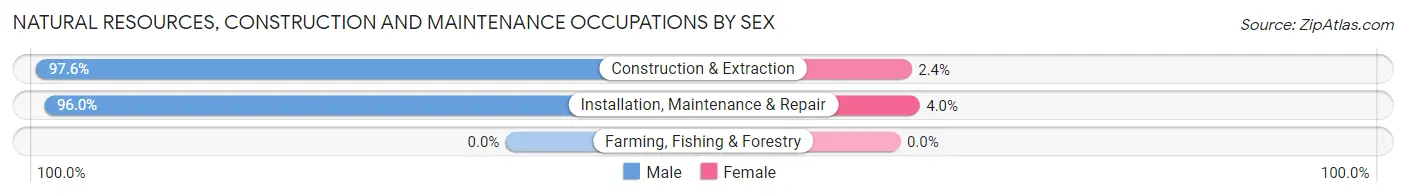
| Occupation | Male | Female |
| Farming, Fishing & Forestry | 0 (0.0%) | 0 (0.0%) |
| Construction & Extraction | 289 (97.6%) | 7 (2.4%) |
| Installation, Maintenance & Repair | 333 (96.0%) | 14 (4.0%) |
| Total (Category) | 622 (96.7%) | 21 (3.3%) |
| Total (Overall) | 4,380 (50.8%) | 4,245 (49.2%) |
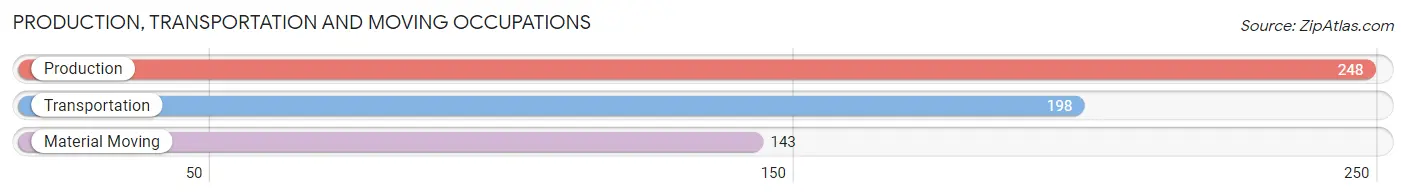
Production, Transportation and Moving Occupations
The most common Production, Transportation and Moving occupations in Stallings are Production (248 | 2.9%), Transportation (198 | 2.3%), and Material Moving (143 | 1.7%).
Production, Transportation and Moving Occupations by Sex
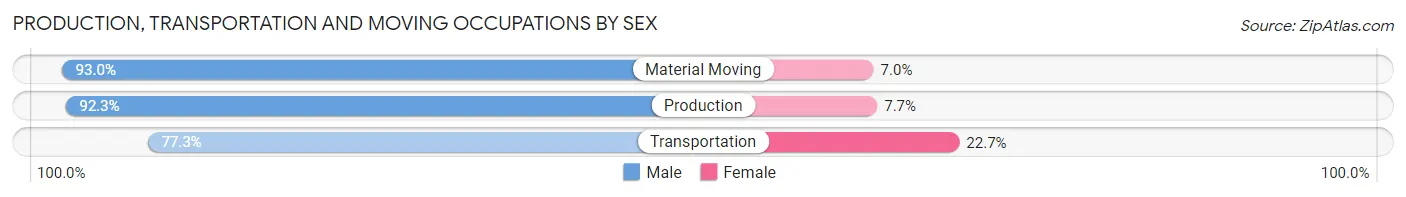
| Occupation | Male | Female |
| Production | 229 (92.3%) | 19 (7.7%) |
| Transportation | 153 (77.3%) | 45 (22.7%) |
| Material Moving | 133 (93.0%) | 10 (7.0%) |
| Total (Category) | 515 (87.4%) | 74 (12.6%) |
| Total (Overall) | 4,380 (50.8%) | 4,245 (49.2%) |
Employment Industries by Sex in Stallings
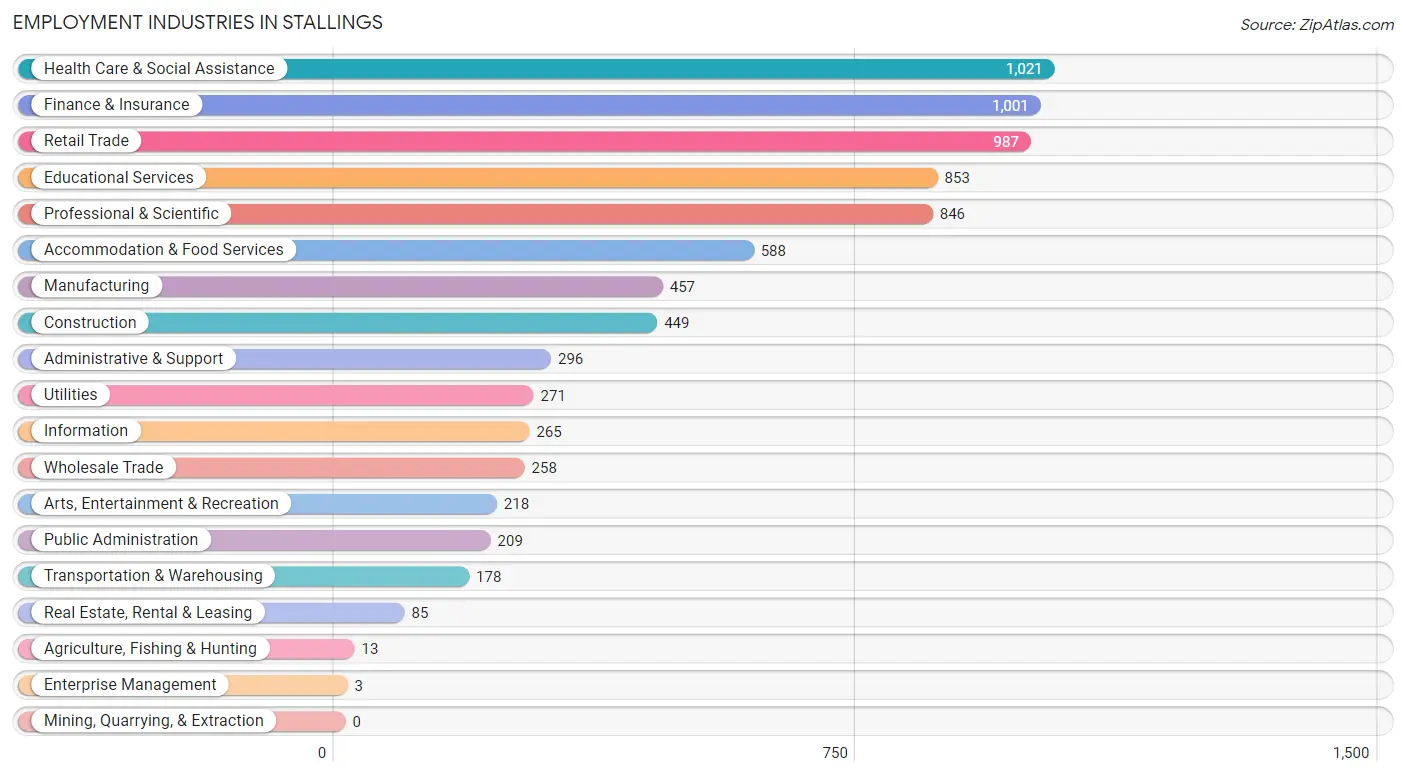
Employment Industries in Stallings
The major employment industries in Stallings include Health Care & Social Assistance (1,021 | 11.8%), Finance & Insurance (1,001 | 11.6%), Retail Trade (987 | 11.4%), Educational Services (853 | 9.9%), and Professional & Scientific (846 | 9.8%).
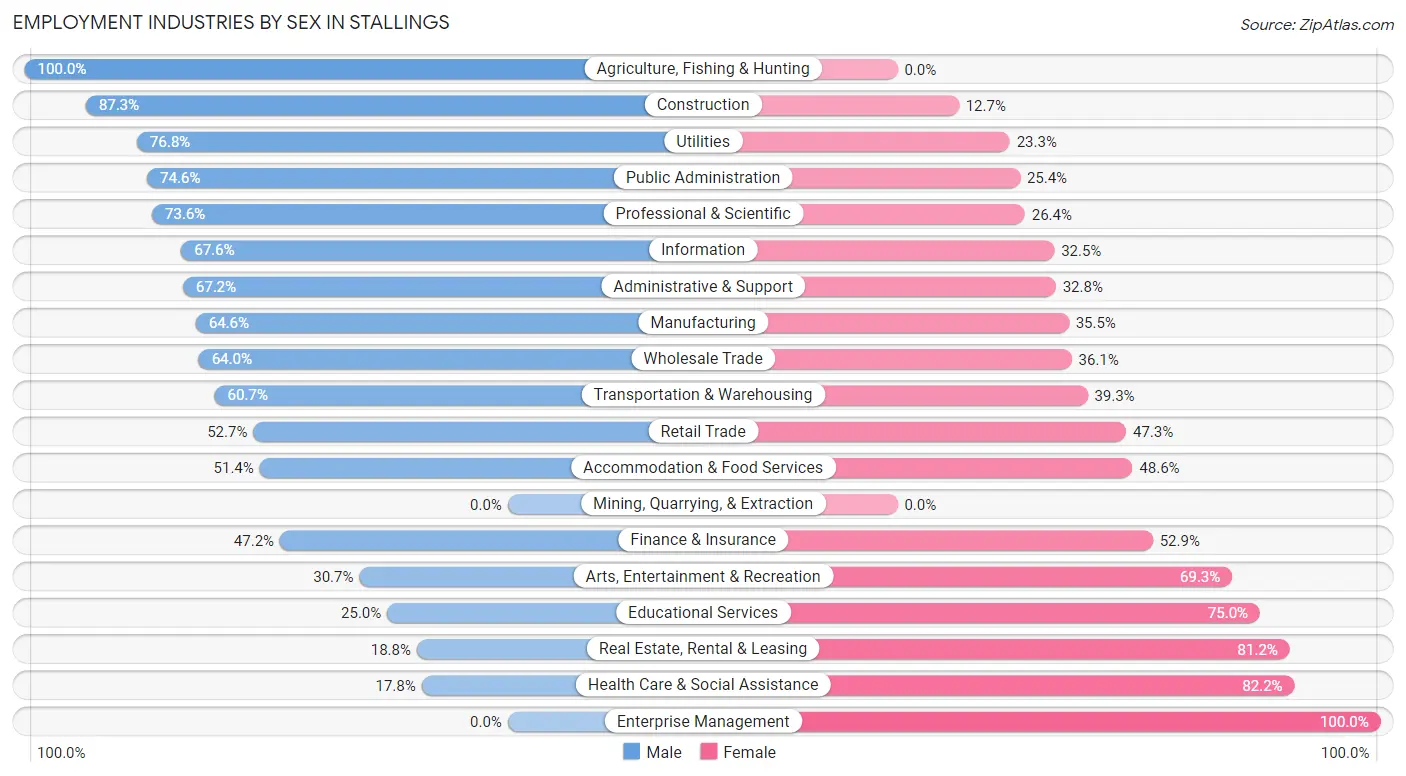
Employment Industries by Sex in Stallings
The Stallings industries that see more men than women are Agriculture, Fishing & Hunting (100.0%), Construction (87.3%), and Utilities (76.7%), whereas the industries that tend to have a higher number of women are Enterprise Management (100.0%), Health Care & Social Assistance (82.2%), and Real Estate, Rental & Leasing (81.2%).
| Industry | Male | Female |
| Agriculture, Fishing & Hunting | 13 (100.0%) | 0 (0.0%) |
| Mining, Quarrying, & Extraction | 0 (0.0%) | 0 (0.0%) |
| Construction | 392 (87.3%) | 57 (12.7%) |
| Manufacturing | 295 (64.5%) | 162 (35.4%) |
| Wholesale Trade | 165 (63.9%) | 93 (36.0%) |
| Retail Trade | 520 (52.7%) | 467 (47.3%) |
| Transportation & Warehousing | 108 (60.7%) | 70 (39.3%) |
| Utilities | 208 (76.7%) | 63 (23.3%) |
| Information | 179 (67.5%) | 86 (32.5%) |
| Finance & Insurance | 472 (47.1%) | 529 (52.8%) |
| Real Estate, Rental & Leasing | 16 (18.8%) | 69 (81.2%) |
| Professional & Scientific | 623 (73.6%) | 223 (26.4%) |
| Enterprise Management | 0 (0.0%) | 3 (100.0%) |
| Administrative & Support | 199 (67.2%) | 97 (32.8%) |
| Educational Services | 213 (25.0%) | 640 (75.0%) |
| Health Care & Social Assistance | 182 (17.8%) | 839 (82.2%) |
| Arts, Entertainment & Recreation | 67 (30.7%) | 151 (69.3%) |
| Accommodation & Food Services | 302 (51.4%) | 286 (48.6%) |
| Public Administration | 156 (74.6%) | 53 (25.4%) |
| Total | 4,380 (50.8%) | 4,245 (49.2%) |
Education in Stallings
School Enrollment in Stallings
The most common levels of schooling among the 3,984 students in Stallings are middle school (1,108 | 27.8%), high school (924 | 23.2%), and college / undergraduate (685 | 17.2%).
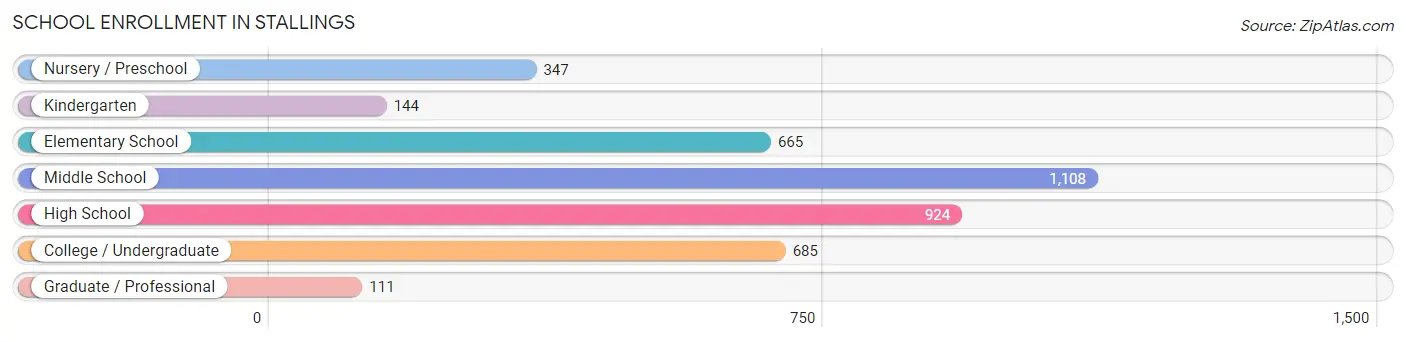
| School Level | # Students | % Students |
| Nursery / Preschool | 347 | 8.7% |
| Kindergarten | 144 | 3.6% |
| Elementary School | 665 | 16.7% |
| Middle School | 1,108 | 27.8% |
| High School | 924 | 23.2% |
| College / Undergraduate | 685 | 17.2% |
| Graduate / Professional | 111 | 2.8% |
| Total | 3,984 | 100.0% |
School Enrollment by Age by Funding Source in Stallings
Out of a total of 3,984 students who are enrolled in schools in Stallings, 1,076 (27.0%) attend a private institution, while the remaining 2,908 (73.0%) are enrolled in public schools. The age group of 3 to 4 year olds has the highest likelihood of being enrolled in private schools, with 187 (74.5% in the age bracket) enrolled. Conversely, the age group of 25 to 34 year olds has the lowest likelihood of being enrolled in a private school, with 59 (92.2% in the age bracket) attending a public institution.
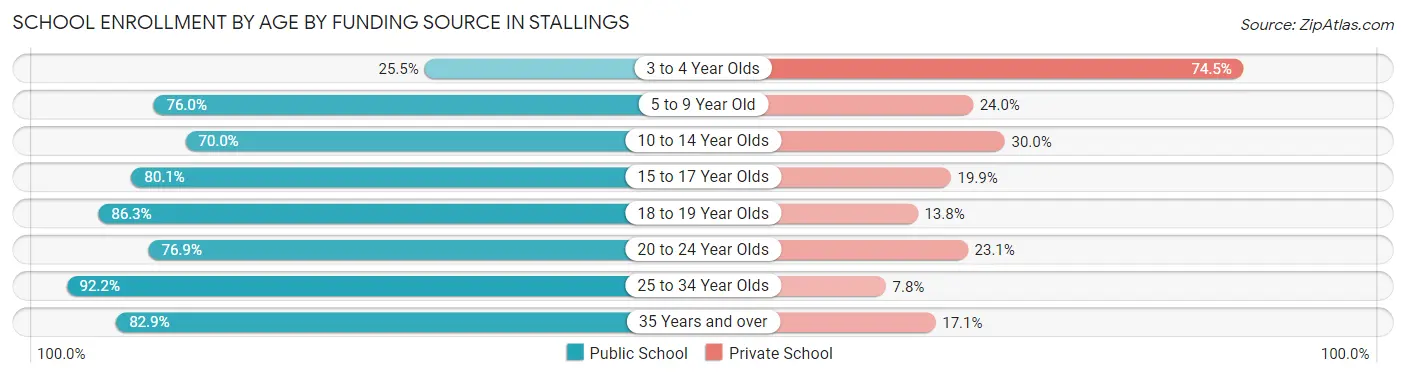
| Age Bracket | Public School | Private School |
| 3 to 4 Year Olds | 64 (25.5%) | 187 (74.5%) |
| 5 to 9 Year Old | 648 (76.0%) | 205 (24.0%) |
| 10 to 14 Year Olds | 900 (70.0%) | 385 (30.0%) |
| 15 to 17 Year Olds | 459 (80.1%) | 114 (19.9%) |
| 18 to 19 Year Olds | 276 (86.3%) | 44 (13.8%) |
| 20 to 24 Year Olds | 333 (76.9%) | 100 (23.1%) |
| 25 to 34 Year Olds | 59 (92.2%) | 5 (7.8%) |
| 35 Years and over | 170 (82.9%) | 35 (17.1%) |
| Total | 2,908 (73.0%) | 1,076 (27.0%) |
Educational Attainment by Field of Study in Stallings
Business (1,372 | 23.9%), education (807 | 14.1%), engineering (502 | 8.8%), social sciences (425 | 7.4%), and communications (404 | 7.0%) are the most common fields of study among 5,730 individuals in Stallings who have obtained a bachelor's degree or higher.
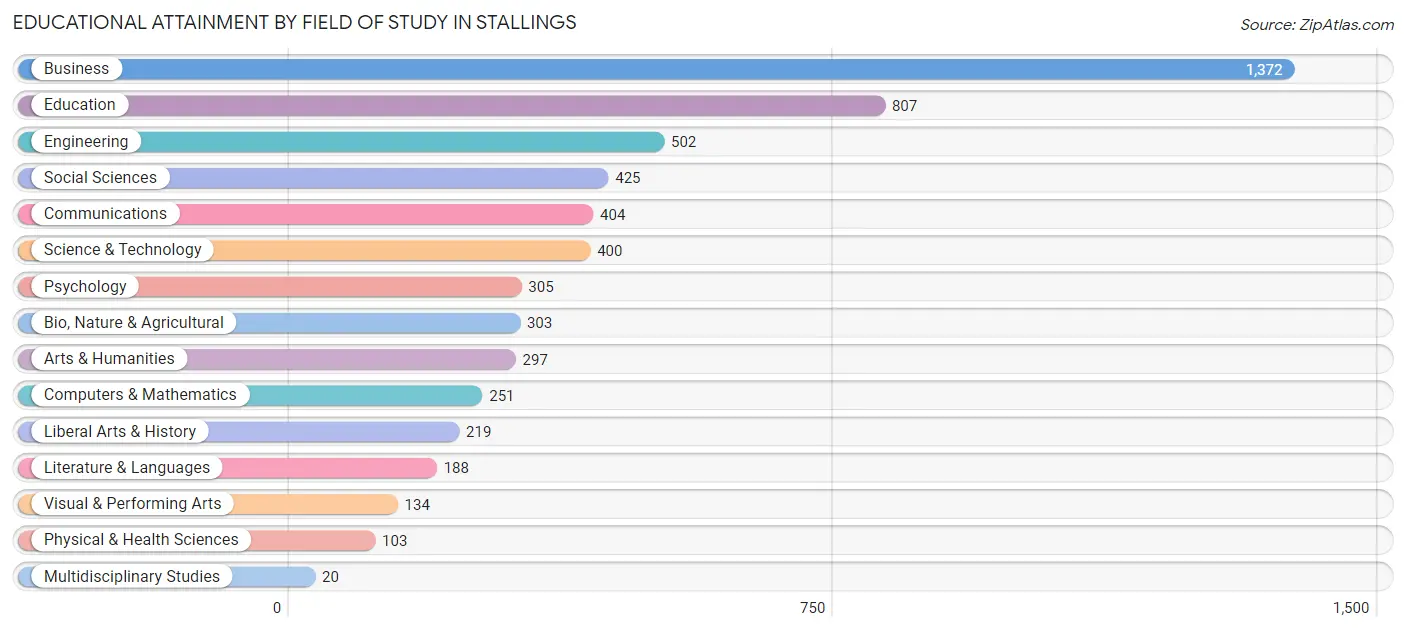
| Field of Study | # Graduates | % Graduates |
| Computers & Mathematics | 251 | 4.4% |
| Bio, Nature & Agricultural | 303 | 5.3% |
| Physical & Health Sciences | 103 | 1.8% |
| Psychology | 305 | 5.3% |
| Social Sciences | 425 | 7.4% |
| Engineering | 502 | 8.8% |
| Multidisciplinary Studies | 20 | 0.4% |
| Science & Technology | 400 | 7.0% |
| Business | 1,372 | 23.9% |
| Education | 807 | 14.1% |
| Literature & Languages | 188 | 3.3% |
| Liberal Arts & History | 219 | 3.8% |
| Visual & Performing Arts | 134 | 2.3% |
| Communications | 404 | 7.0% |
| Arts & Humanities | 297 | 5.2% |
| Total | 5,730 | 100.0% |
Transportation & Commute in Stallings
Vehicle Availability by Sex in Stallings
The most prevalent vehicle ownership categories in Stallings are males with 2 vehicles (2,259, accounting for 52.5%) and females with 2 vehicles (2,082, making up 54.2%).
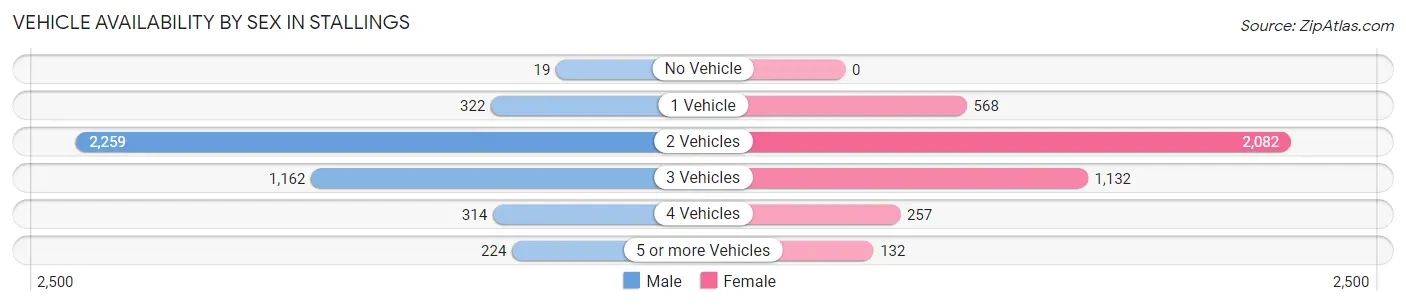
| Vehicles Available | Male | Female |
| No Vehicle | 19 (0.4%) | 0 (0.0%) |
| 1 Vehicle | 322 (7.5%) | 568 (13.6%) |
| 2 Vehicles | 2,259 (52.5%) | 2,082 (49.9%) |
| 3 Vehicles | 1,162 (27.0%) | 1,132 (27.1%) |
| 4 Vehicles | 314 (7.3%) | 257 (6.2%) |
| 5 or more Vehicles | 224 (5.2%) | 132 (3.2%) |
| Total | 4,300 (100.0%) | 4,171 (100.0%) |
Commute Time in Stallings
The most frequently occuring commute durations in Stallings are 30 to 34 minutes (1,600 commuters, 24.2%), 15 to 19 minutes (811 commuters, 12.3%), and 20 to 24 minutes (790 commuters, 11.9%).
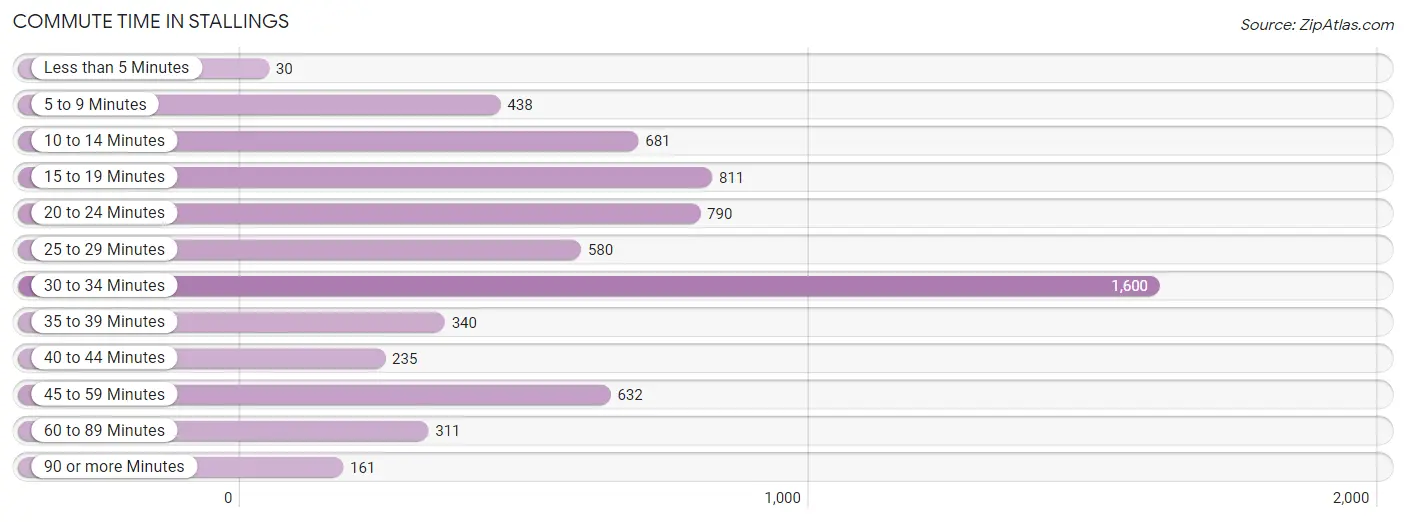
| Commute Time | # Commuters | % Commuters |
| Less than 5 Minutes | 30 | 0.4% |
| 5 to 9 Minutes | 438 | 6.6% |
| 10 to 14 Minutes | 681 | 10.3% |
| 15 to 19 Minutes | 811 | 12.3% |
| 20 to 24 Minutes | 790 | 11.9% |
| 25 to 29 Minutes | 580 | 8.8% |
| 30 to 34 Minutes | 1,600 | 24.2% |
| 35 to 39 Minutes | 340 | 5.1% |
| 40 to 44 Minutes | 235 | 3.6% |
| 45 to 59 Minutes | 632 | 9.6% |
| 60 to 89 Minutes | 311 | 4.7% |
| 90 or more Minutes | 161 | 2.4% |
Commute Time by Sex in Stallings
The most common commute times in Stallings are 30 to 34 minutes (977 commuters, 29.0%) for males and 30 to 34 minutes (623 commuters, 19.2%) for females.
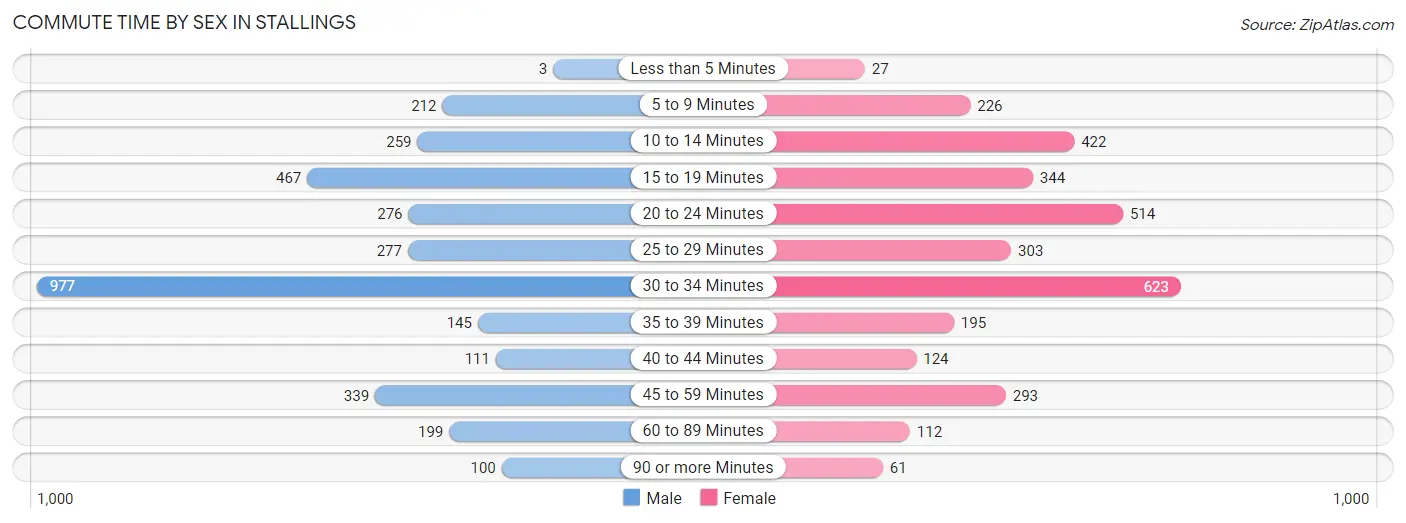
| Commute Time | Male | Female |
| Less than 5 Minutes | 3 (0.1%) | 27 (0.8%) |
| 5 to 9 Minutes | 212 (6.3%) | 226 (7.0%) |
| 10 to 14 Minutes | 259 (7.7%) | 422 (13.0%) |
| 15 to 19 Minutes | 467 (13.9%) | 344 (10.6%) |
| 20 to 24 Minutes | 276 (8.2%) | 514 (15.8%) |
| 25 to 29 Minutes | 277 (8.2%) | 303 (9.3%) |
| 30 to 34 Minutes | 977 (29.0%) | 623 (19.2%) |
| 35 to 39 Minutes | 145 (4.3%) | 195 (6.0%) |
| 40 to 44 Minutes | 111 (3.3%) | 124 (3.8%) |
| 45 to 59 Minutes | 339 (10.1%) | 293 (9.0%) |
| 60 to 89 Minutes | 199 (5.9%) | 112 (3.5%) |
| 90 or more Minutes | 100 (3.0%) | 61 (1.9%) |
Time of Departure to Work by Sex in Stallings
The most frequent times of departure to work in Stallings are 7:00 AM to 7:29 AM (455, 13.5%) for males and 7:00 AM to 7:29 AM (745, 23.0%) for females.
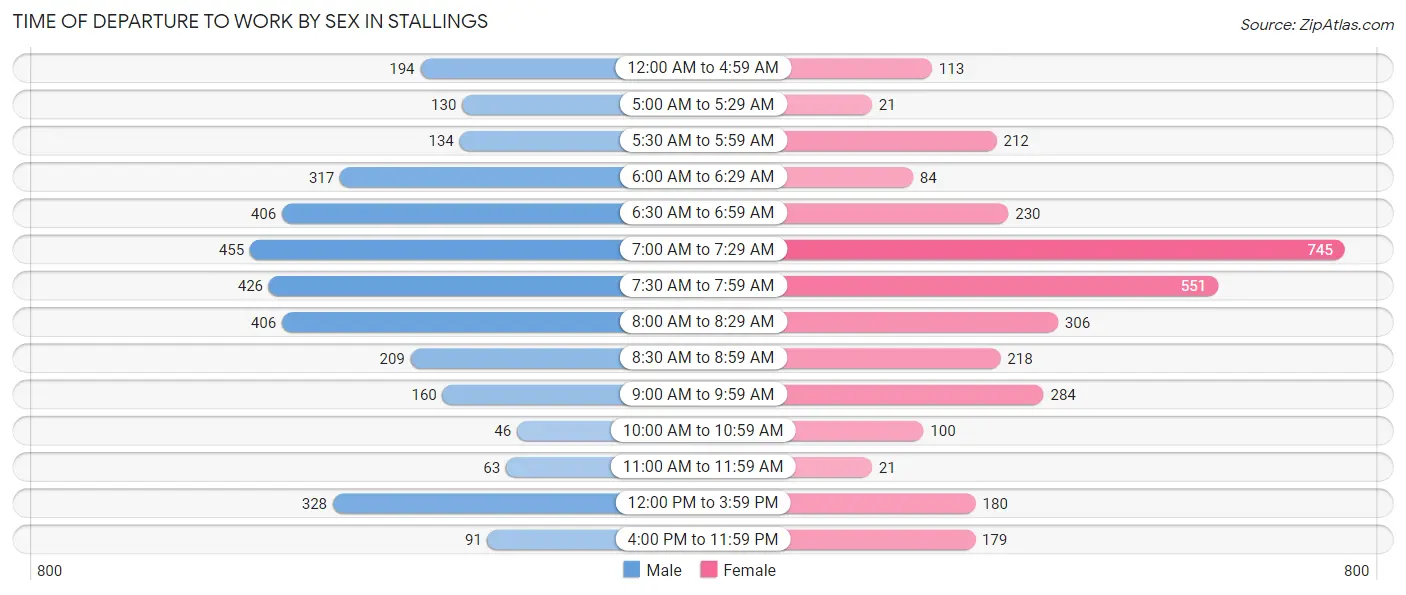
| Time of Departure | Male | Female |
| 12:00 AM to 4:59 AM | 194 (5.8%) | 113 (3.5%) |
| 5:00 AM to 5:29 AM | 130 (3.9%) | 21 (0.6%) |
| 5:30 AM to 5:59 AM | 134 (4.0%) | 212 (6.5%) |
| 6:00 AM to 6:29 AM | 317 (9.4%) | 84 (2.6%) |
| 6:30 AM to 6:59 AM | 406 (12.1%) | 230 (7.1%) |
| 7:00 AM to 7:29 AM | 455 (13.5%) | 745 (23.0%) |
| 7:30 AM to 7:59 AM | 426 (12.7%) | 551 (17.0%) |
| 8:00 AM to 8:29 AM | 406 (12.1%) | 306 (9.4%) |
| 8:30 AM to 8:59 AM | 209 (6.2%) | 218 (6.7%) |
| 9:00 AM to 9:59 AM | 160 (4.8%) | 284 (8.7%) |
| 10:00 AM to 10:59 AM | 46 (1.4%) | 100 (3.1%) |
| 11:00 AM to 11:59 AM | 63 (1.9%) | 21 (0.6%) |
| 12:00 PM to 3:59 PM | 328 (9.8%) | 180 (5.6%) |
| 4:00 PM to 11:59 PM | 91 (2.7%) | 179 (5.5%) |
| Total | 3,365 (100.0%) | 3,244 (100.0%) |
Housing Occupancy in Stallings
Occupancy by Ownership in Stallings
Of the total 5,861 dwellings in Stallings, owner-occupied units account for 5,332 (91.0%), while renter-occupied units make up 529 (9.0%).
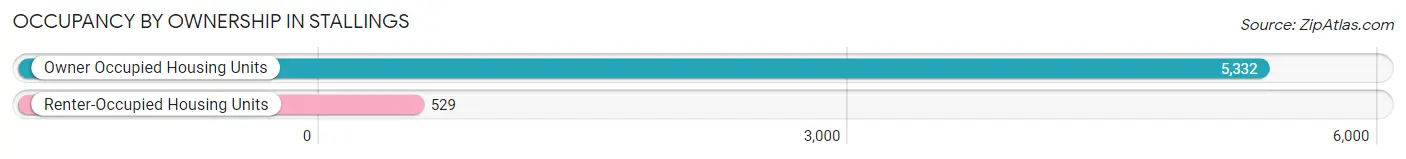
| Occupancy | # Housing Units | % Housing Units |
| Owner Occupied Housing Units | 5,332 | 91.0% |
| Renter-Occupied Housing Units | 529 | 9.0% |
| Total Occupied Housing Units | 5,861 | 100.0% |
Occupancy by Household Size in Stallings
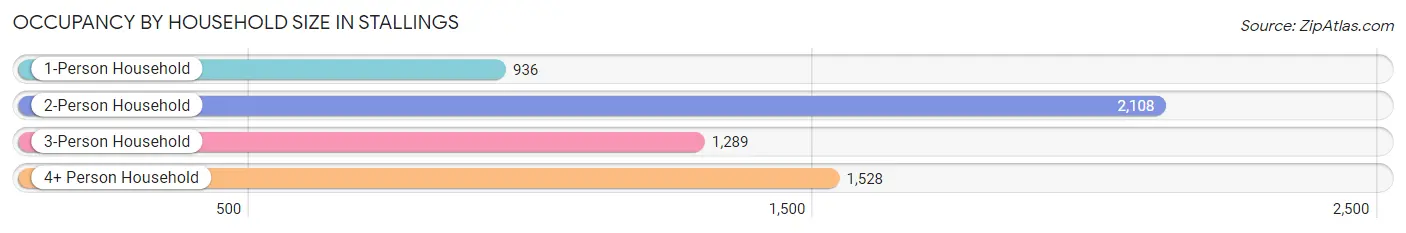
| Household Size | # Housing Units | % Housing Units |
| 1-Person Household | 936 | 16.0% |
| 2-Person Household | 2,108 | 36.0% |
| 3-Person Household | 1,289 | 22.0% |
| 4+ Person Household | 1,528 | 26.1% |
| Total Housing Units | 5,861 | 100.0% |
Occupancy by Ownership by Household Size in Stallings
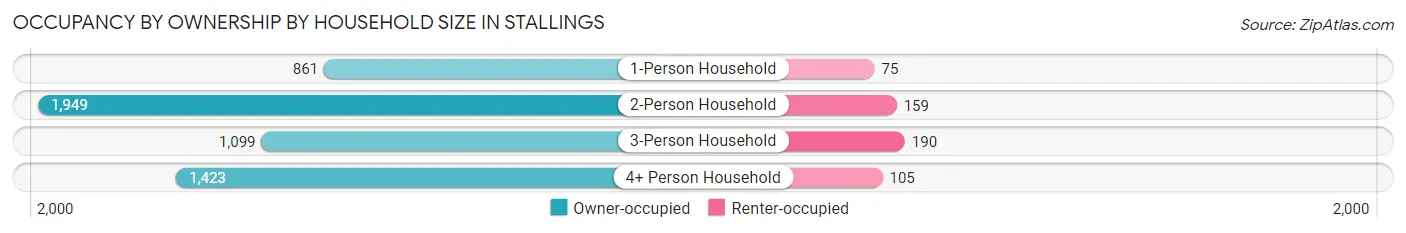
| Household Size | Owner-occupied | Renter-occupied |
| 1-Person Household | 861 (92.0%) | 75 (8.0%) |
| 2-Person Household | 1,949 (92.5%) | 159 (7.5%) |
| 3-Person Household | 1,099 (85.3%) | 190 (14.7%) |
| 4+ Person Household | 1,423 (93.1%) | 105 (6.9%) |
| Total Housing Units | 5,332 (91.0%) | 529 (9.0%) |
Occupancy by Educational Attainment in Stallings
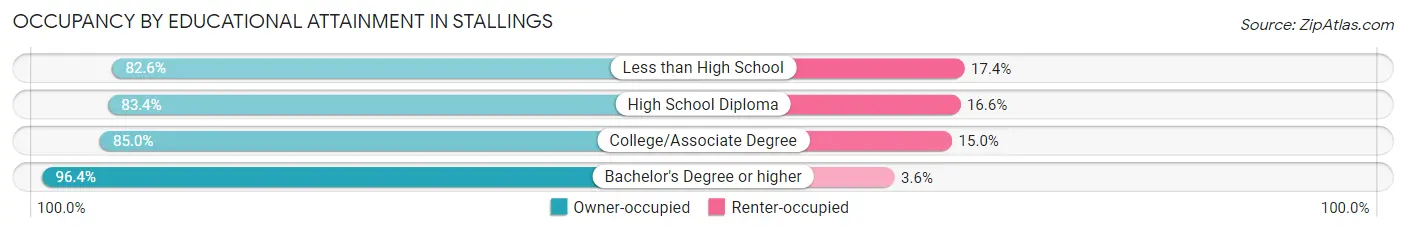
| Household Size | Owner-occupied | Renter-occupied |
| Less than High School | 199 (82.6%) | 42 (17.4%) |
| High School Diploma | 632 (83.4%) | 126 (16.6%) |
| College/Associate Degree | 1,397 (85.0%) | 246 (15.0%) |
| Bachelor's Degree or higher | 3,104 (96.4%) | 115 (3.6%) |
Occupancy by Age of Householder in Stallings
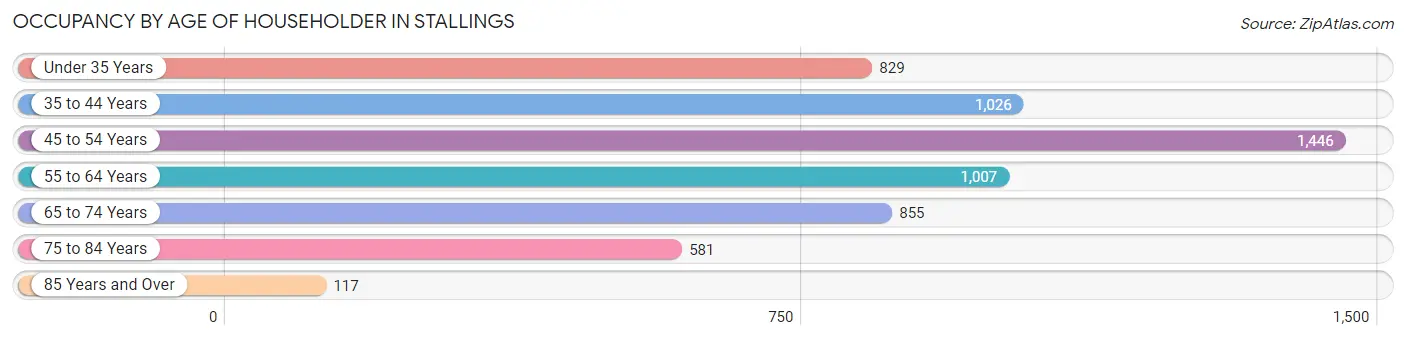
| Age Bracket | # Households | % Households |
| Under 35 Years | 829 | 14.1% |
| 35 to 44 Years | 1,026 | 17.5% |
| 45 to 54 Years | 1,446 | 24.7% |
| 55 to 64 Years | 1,007 | 17.2% |
| 65 to 74 Years | 855 | 14.6% |
| 75 to 84 Years | 581 | 9.9% |
| 85 Years and Over | 117 | 2.0% |
| Total | 5,861 | 100.0% |
Housing Finances in Stallings
Median Income by Occupancy in Stallings
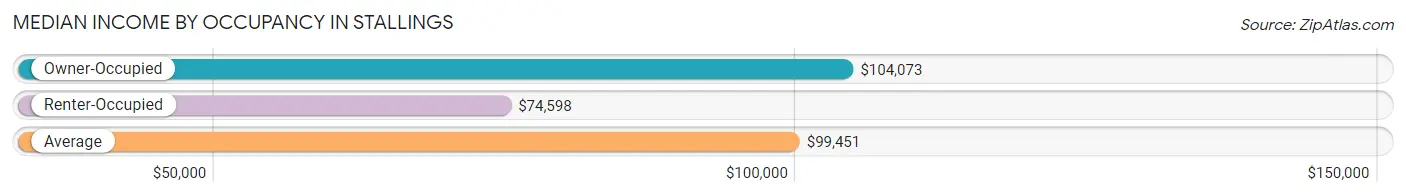
| Occupancy Type | # Households | Median Income |
| Owner-Occupied | 5,332 (91.0%) | $104,073 |
| Renter-Occupied | 529 (9.0%) | $74,598 |
| Average | 5,861 (100.0%) | $99,451 |
Occupancy by Householder Income Bracket in Stallings
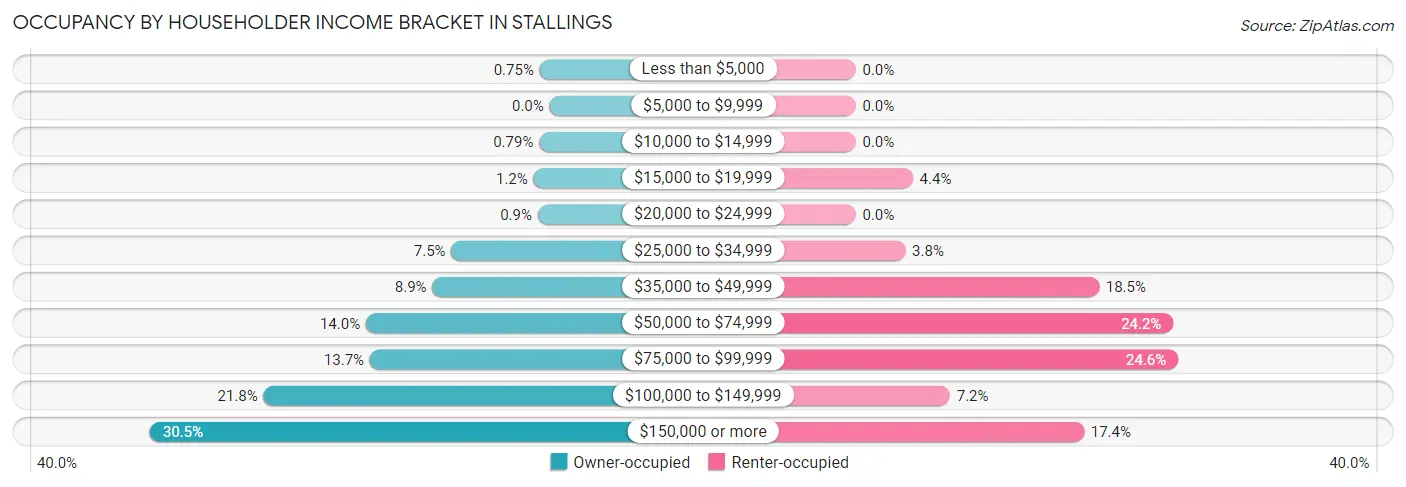
| Income Bracket | Owner-occupied | Renter-occupied |
| Less than $5,000 | 40 (0.7%) | 0 (0.0%) |
| $5,000 to $9,999 | 0 (0.0%) | 0 (0.0%) |
| $10,000 to $14,999 | 42 (0.8%) | 0 (0.0%) |
| $15,000 to $19,999 | 65 (1.2%) | 23 (4.3%) |
| $20,000 to $24,999 | 48 (0.9%) | 0 (0.0%) |
| $25,000 to $34,999 | 399 (7.5%) | 20 (3.8%) |
| $35,000 to $49,999 | 476 (8.9%) | 98 (18.5%) |
| $50,000 to $74,999 | 746 (14.0%) | 128 (24.2%) |
| $75,000 to $99,999 | 730 (13.7%) | 130 (24.6%) |
| $100,000 to $149,999 | 1,162 (21.8%) | 38 (7.2%) |
| $150,000 or more | 1,624 (30.5%) | 92 (17.4%) |
| Total | 5,332 (100.0%) | 529 (100.0%) |
Monthly Housing Cost Tiers in Stallings
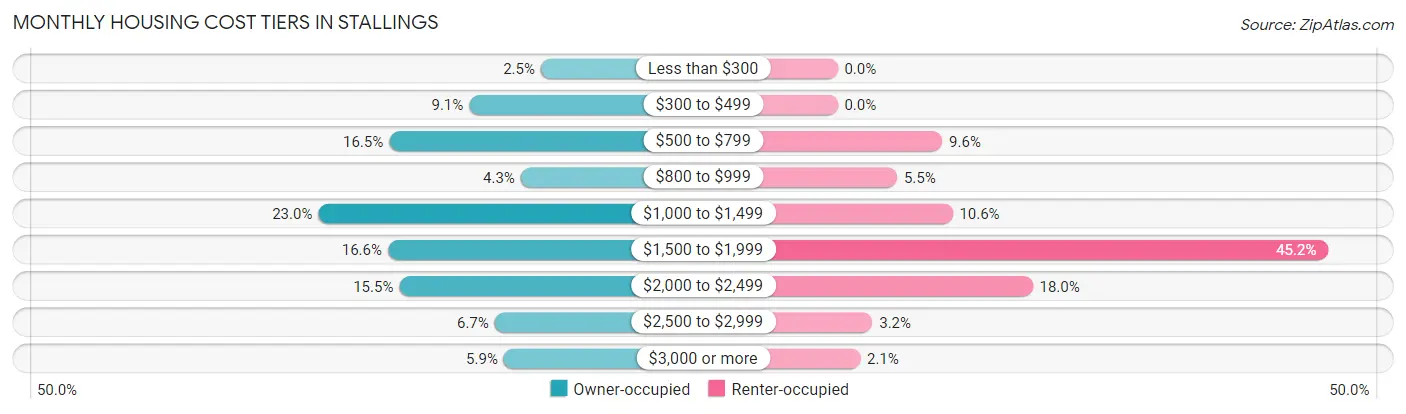
| Monthly Cost | Owner-occupied | Renter-occupied |
| Less than $300 | 132 (2.5%) | 0 (0.0%) |
| $300 to $499 | 484 (9.1%) | 0 (0.0%) |
| $500 to $799 | 877 (16.5%) | 51 (9.6%) |
| $800 to $999 | 231 (4.3%) | 29 (5.5%) |
| $1,000 to $1,499 | 1,225 (23.0%) | 56 (10.6%) |
| $1,500 to $1,999 | 883 (16.6%) | 239 (45.2%) |
| $2,000 to $2,499 | 827 (15.5%) | 95 (18.0%) |
| $2,500 to $2,999 | 359 (6.7%) | 17 (3.2%) |
| $3,000 or more | 314 (5.9%) | 11 (2.1%) |
| Total | 5,332 (100.0%) | 529 (100.0%) |
Physical Housing Characteristics in Stallings
Housing Structures in Stallings
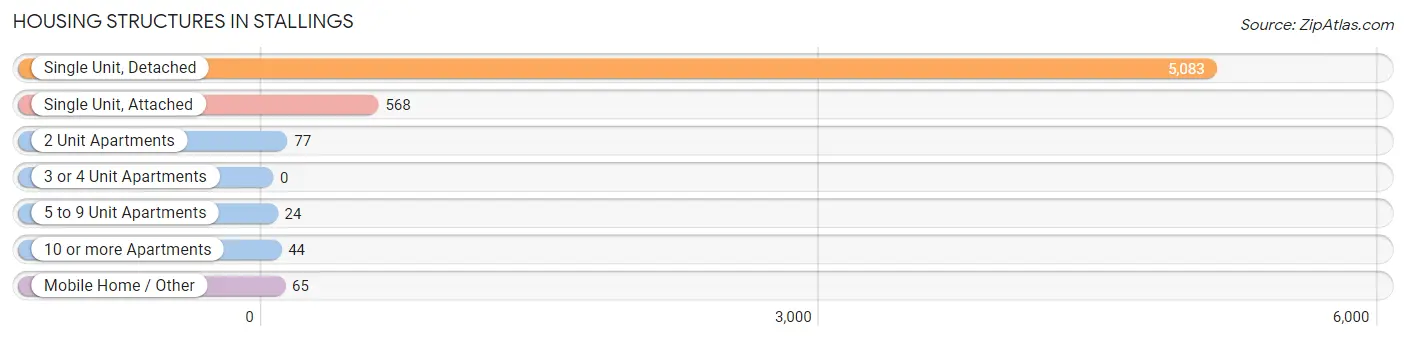
| Structure Type | # Housing Units | % Housing Units |
| Single Unit, Detached | 5,083 | 86.7% |
| Single Unit, Attached | 568 | 9.7% |
| 2 Unit Apartments | 77 | 1.3% |
| 3 or 4 Unit Apartments | 0 | 0.0% |
| 5 to 9 Unit Apartments | 24 | 0.4% |
| 10 or more Apartments | 44 | 0.7% |
| Mobile Home / Other | 65 | 1.1% |
| Total | 5,861 | 100.0% |
Housing Structures by Occupancy in Stallings
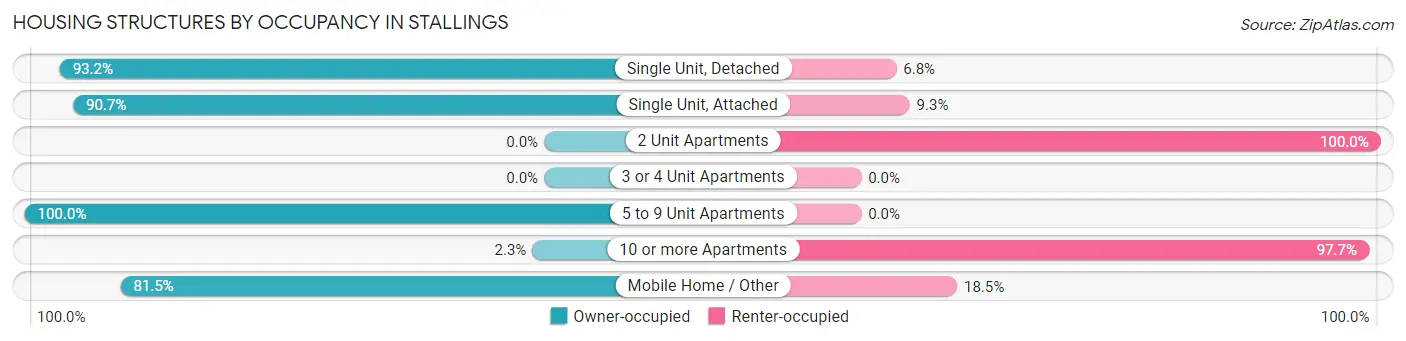
| Structure Type | Owner-occupied | Renter-occupied |
| Single Unit, Detached | 4,739 (93.2%) | 344 (6.8%) |
| Single Unit, Attached | 515 (90.7%) | 53 (9.3%) |
| 2 Unit Apartments | 0 (0.0%) | 77 (100.0%) |
| 3 or 4 Unit Apartments | 0 (0.0%) | 0 (0.0%) |
| 5 to 9 Unit Apartments | 24 (100.0%) | 0 (0.0%) |
| 10 or more Apartments | 1 (2.3%) | 43 (97.7%) |
| Mobile Home / Other | 53 (81.5%) | 12 (18.5%) |
| Total | 5,332 (91.0%) | 529 (9.0%) |
Housing Structures by Number of Rooms in Stallings
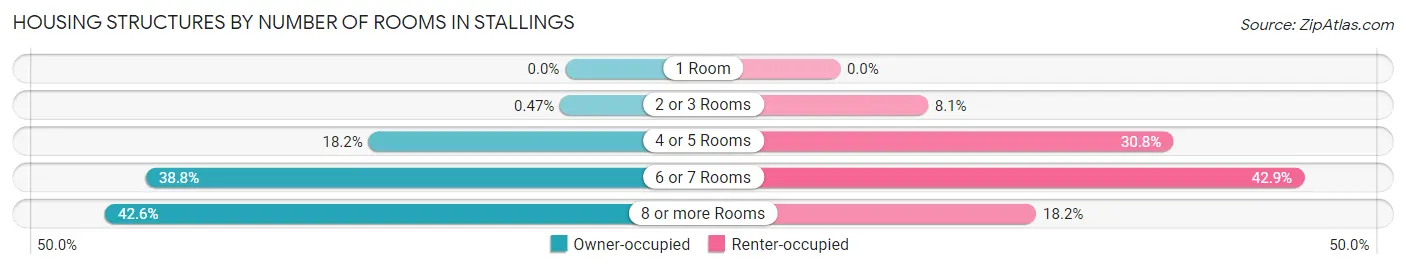
| Number of Rooms | Owner-occupied | Renter-occupied |
| 1 Room | 0 (0.0%) | 0 (0.0%) |
| 2 or 3 Rooms | 25 (0.5%) | 43 (8.1%) |
| 4 or 5 Rooms | 970 (18.2%) | 163 (30.8%) |
| 6 or 7 Rooms | 2,068 (38.8%) | 227 (42.9%) |
| 8 or more Rooms | 2,269 (42.5%) | 96 (18.1%) |
| Total | 5,332 (100.0%) | 529 (100.0%) |
Housing Structure by Heating Type in Stallings
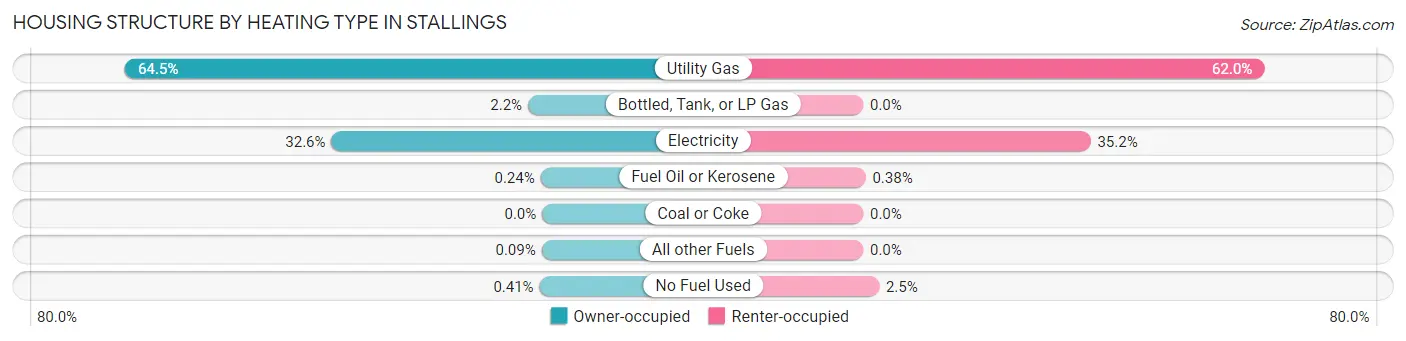
| Heating Type | Owner-occupied | Renter-occupied |
| Utility Gas | 3,438 (64.5%) | 328 (62.0%) |
| Bottled, Tank, or LP Gas | 117 (2.2%) | 0 (0.0%) |
| Electricity | 1,737 (32.6%) | 186 (35.2%) |
| Fuel Oil or Kerosene | 13 (0.2%) | 2 (0.4%) |
| Coal or Coke | 0 (0.0%) | 0 (0.0%) |
| All other Fuels | 5 (0.1%) | 0 (0.0%) |
| No Fuel Used | 22 (0.4%) | 13 (2.5%) |
| Total | 5,332 (100.0%) | 529 (100.0%) |
Household Vehicle Usage in Stallings
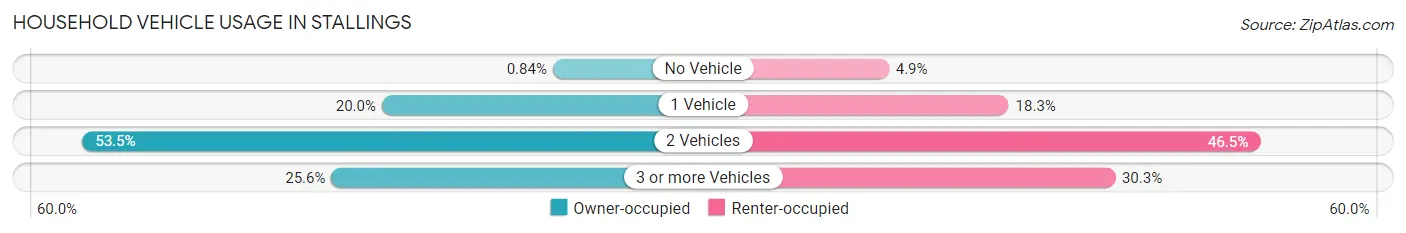
| Vehicles per Household | Owner-occupied | Renter-occupied |
| No Vehicle | 45 (0.8%) | 26 (4.9%) |
| 1 Vehicle | 1,066 (20.0%) | 97 (18.3%) |
| 2 Vehicles | 2,854 (53.5%) | 246 (46.5%) |
| 3 or more Vehicles | 1,367 (25.6%) | 160 (30.2%) |
| Total | 5,332 (100.0%) | 529 (100.0%) |
Real Estate & Mortgages in Stallings
Real Estate and Mortgage Overview in Stallings
| Characteristic | Without Mortgage | With Mortgage |
| Housing Units | 1,541 | 3,791 |
| Median Property Value | $354,700 | $342,500 |
| Median Household Income | $85,725 | $1,226 |
| Monthly Housing Costs | $542 | $314 |
| Real Estate Taxes | $2,728 | $51 |
Property Value by Mortgage Status in Stallings
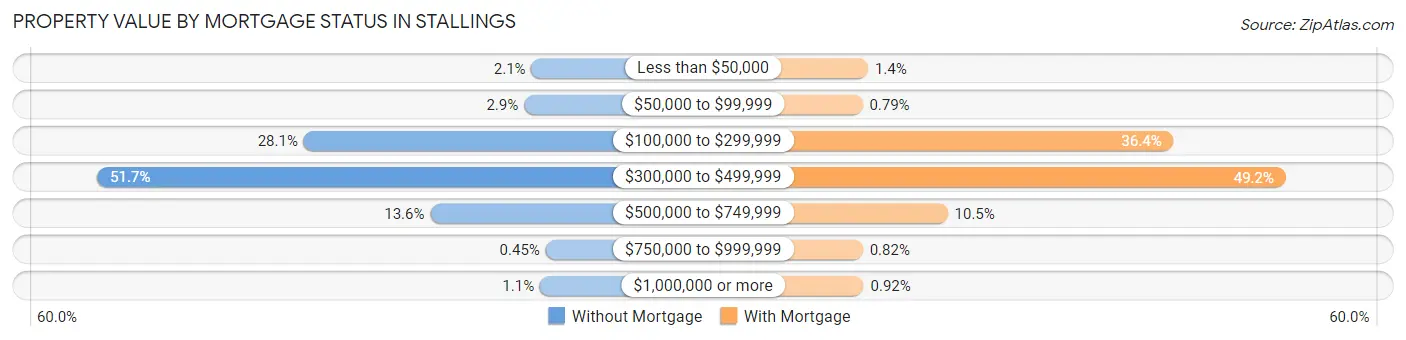
| Property Value | Without Mortgage | With Mortgage |
| Less than $50,000 | 32 (2.1%) | 54 (1.4%) |
| $50,000 to $99,999 | 45 (2.9%) | 30 (0.8%) |
| $100,000 to $299,999 | 433 (28.1%) | 1,378 (36.3%) |
| $300,000 to $499,999 | 797 (51.7%) | 1,864 (49.2%) |
| $500,000 to $749,999 | 210 (13.6%) | 399 (10.5%) |
| $750,000 to $999,999 | 7 (0.4%) | 31 (0.8%) |
| $1,000,000 or more | 17 (1.1%) | 35 (0.9%) |
| Total | 1,541 (100.0%) | 3,791 (100.0%) |
Household Income by Mortgage Status in Stallings
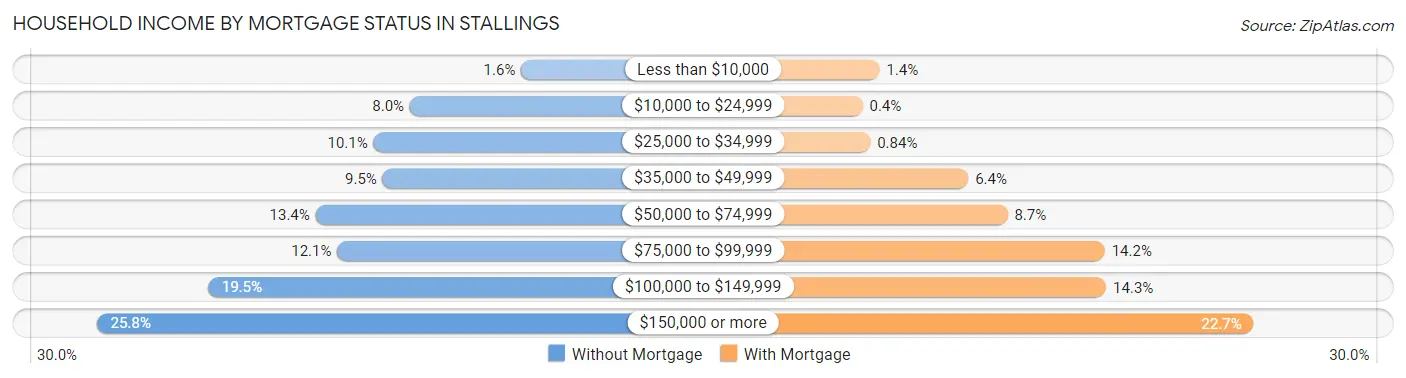
| Household Income | Without Mortgage | With Mortgage |
| Less than $10,000 | 25 (1.6%) | 52 (1.4%) |
| $10,000 to $24,999 | 123 (8.0%) | 15 (0.4%) |
| $25,000 to $34,999 | 155 (10.1%) | 32 (0.8%) |
| $35,000 to $49,999 | 147 (9.5%) | 244 (6.4%) |
| $50,000 to $74,999 | 206 (13.4%) | 329 (8.7%) |
| $75,000 to $99,999 | 187 (12.1%) | 540 (14.2%) |
| $100,000 to $149,999 | 300 (19.5%) | 543 (14.3%) |
| $150,000 or more | 398 (25.8%) | 862 (22.7%) |
| Total | 1,541 (100.0%) | 3,791 (100.0%) |
Property Value to Household Income Ratio in Stallings
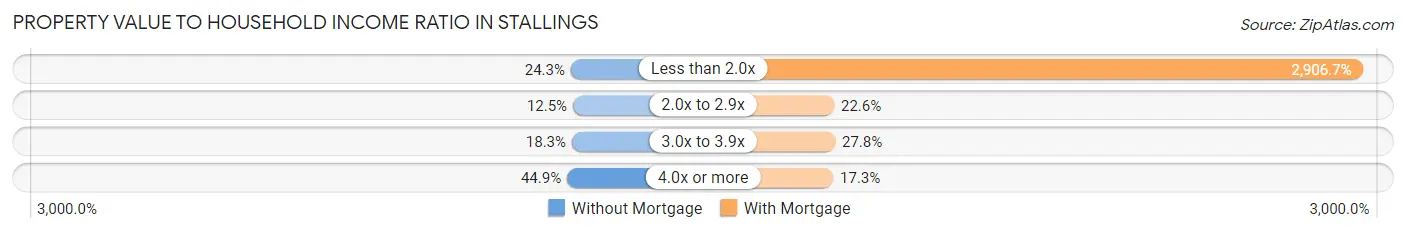
| Value-to-Income Ratio | Without Mortgage | With Mortgage |
| Less than 2.0x | 374 (24.3%) | 110,194 (2,906.7%) |
| 2.0x to 2.9x | 193 (12.5%) | 856 (22.6%) |
| 3.0x to 3.9x | 282 (18.3%) | 1,052 (27.8%) |
| 4.0x or more | 692 (44.9%) | 655 (17.3%) |
| Total | 1,541 (100.0%) | 3,791 (100.0%) |
Real Estate Taxes by Mortgage Status in Stallings
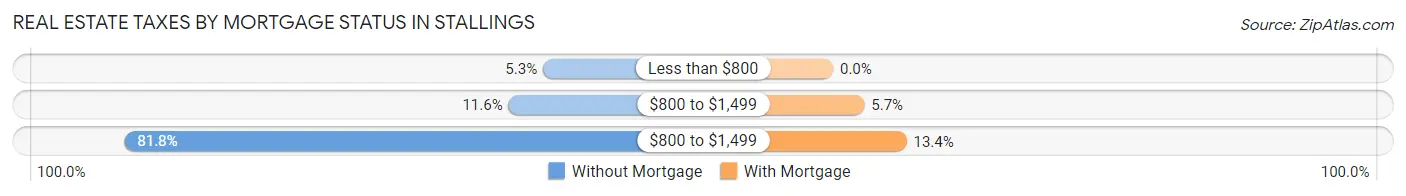
| Property Taxes | Without Mortgage | With Mortgage |
| Less than $800 | 82 (5.3%) | 0 (0.0%) |
| $800 to $1,499 | 179 (11.6%) | 217 (5.7%) |
| $800 to $1,499 | 1,260 (81.8%) | 509 (13.4%) |
| Total | 1,541 (100.0%) | 3,791 (100.0%) |
Health & Disability in Stallings
Health Insurance Coverage by Age in Stallings
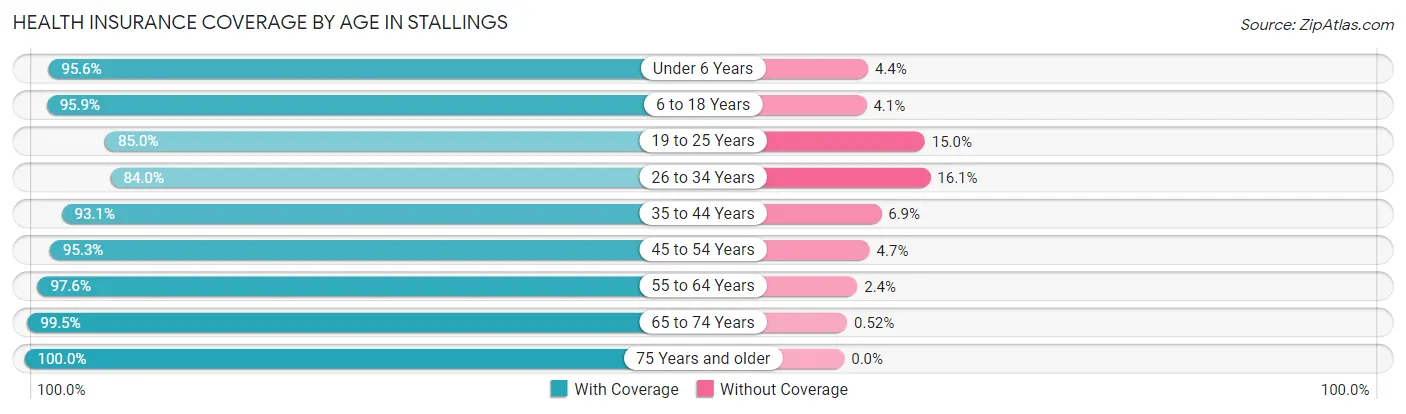
| Age Bracket | With Coverage | Without Coverage |
| Under 6 Years | 1,190 (95.6%) | 55 (4.4%) |
| 6 to 18 Years | 2,742 (95.9%) | 118 (4.1%) |
| 19 to 25 Years | 1,093 (85.0%) | 193 (15.0%) |
| 26 to 34 Years | 1,423 (84.0%) | 272 (16.1%) |
| 35 to 44 Years | 1,902 (93.1%) | 141 (6.9%) |
| 45 to 54 Years | 2,536 (95.3%) | 126 (4.7%) |
| 55 to 64 Years | 1,853 (97.6%) | 46 (2.4%) |
| 65 to 74 Years | 1,344 (99.5%) | 7 (0.5%) |
| 75 Years and older | 1,152 (100.0%) | 0 (0.0%) |
| Total | 15,235 (94.1%) | 958 (5.9%) |
Health Insurance Coverage by Citizenship Status in Stallings
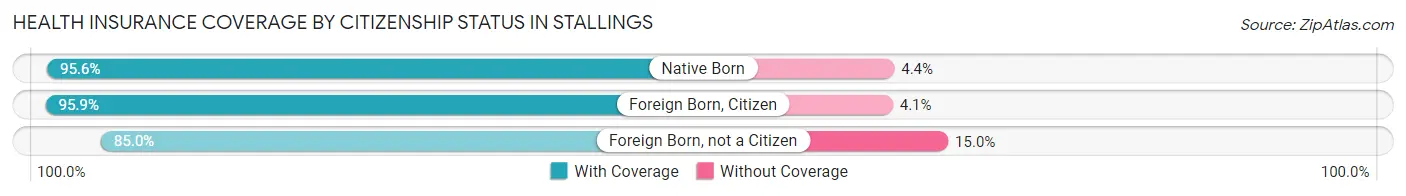
| Citizenship Status | With Coverage | Without Coverage |
| Native Born | 1,190 (95.6%) | 55 (4.4%) |
| Foreign Born, Citizen | 2,742 (95.9%) | 118 (4.1%) |
| Foreign Born, not a Citizen | 1,093 (85.0%) | 193 (15.0%) |
Health Insurance Coverage by Household Income in Stallings
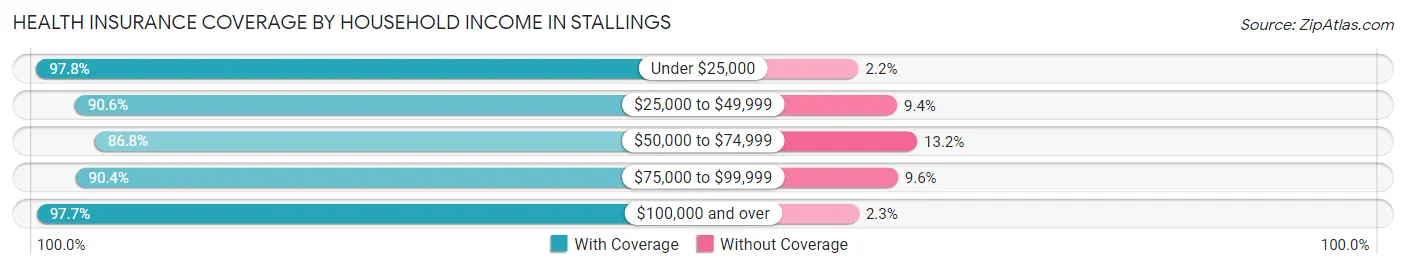
| Household Income | With Coverage | Without Coverage |
| Under $25,000 | 352 (97.8%) | 8 (2.2%) |
| $25,000 to $49,999 | 1,866 (90.6%) | 194 (9.4%) |
| $50,000 to $74,999 | 2,064 (86.8%) | 313 (13.2%) |
| $75,000 to $99,999 | 2,270 (90.4%) | 240 (9.6%) |
| $100,000 and over | 8,683 (97.7%) | 203 (2.3%) |
Public vs Private Health Insurance Coverage by Age in Stallings
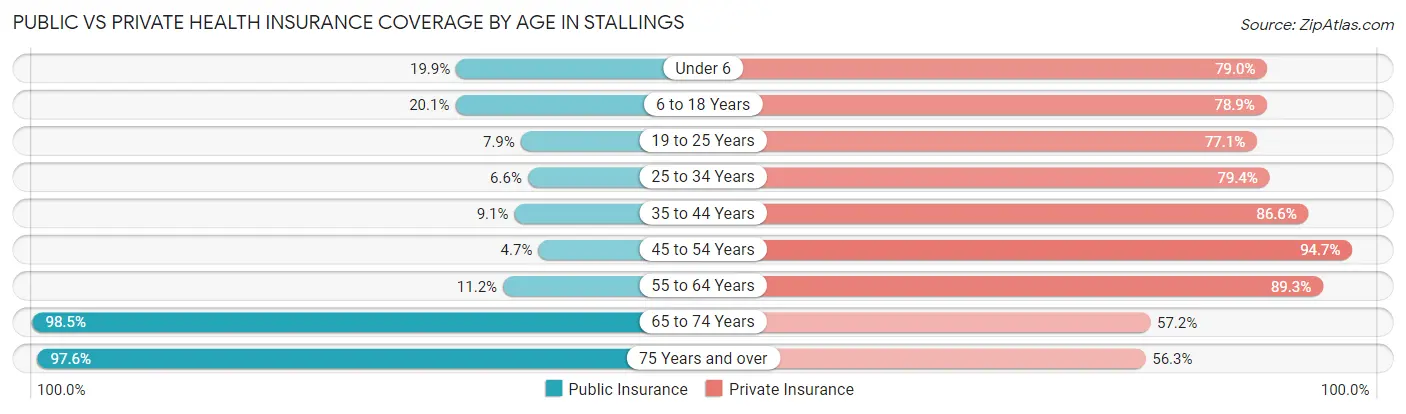
| Age Bracket | Public Insurance | Private Insurance |
| Under 6 | 248 (19.9%) | 983 (79.0%) |
| 6 to 18 Years | 574 (20.1%) | 2,255 (78.8%) |
| 19 to 25 Years | 102 (7.9%) | 991 (77.1%) |
| 25 to 34 Years | 112 (6.6%) | 1,346 (79.4%) |
| 35 to 44 Years | 186 (9.1%) | 1,770 (86.6%) |
| 45 to 54 Years | 124 (4.7%) | 2,522 (94.7%) |
| 55 to 64 Years | 213 (11.2%) | 1,696 (89.3%) |
| 65 to 74 Years | 1,331 (98.5%) | 773 (57.2%) |
| 75 Years and over | 1,124 (97.6%) | 649 (56.3%) |
| Total | 4,014 (24.8%) | 12,985 (80.2%) |
Disability Status by Sex by Age in Stallings
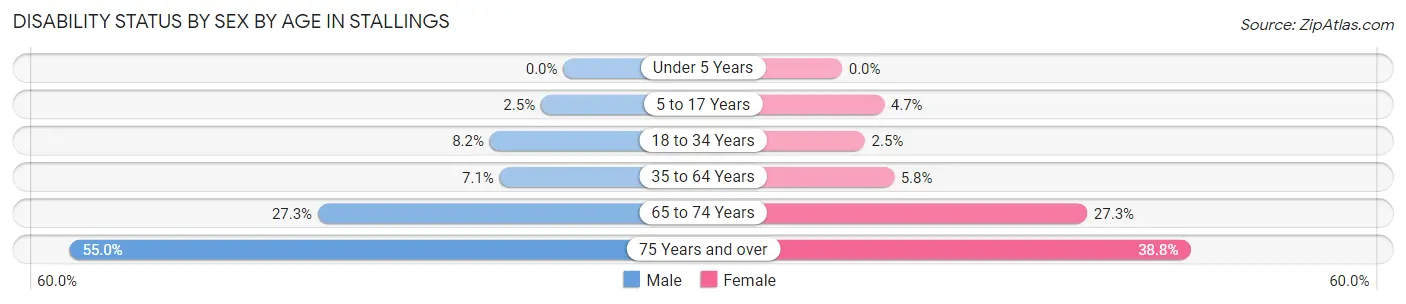
| Age Bracket | Male | Female |
| Under 5 Years | 0 (0.0%) | 0 (0.0%) |
| 5 to 17 Years | 37 (2.5%) | 61 (4.7%) |
| 18 to 34 Years | 126 (8.2%) | 44 (2.5%) |
| 35 to 64 Years | 235 (7.1%) | 190 (5.8%) |
| 65 to 74 Years | 135 (27.3%) | 234 (27.3%) |
| 75 Years and over | 231 (55.0%) | 284 (38.8%) |
Disability Class by Sex by Age in Stallings
Disability Class: Hearing Difficulty
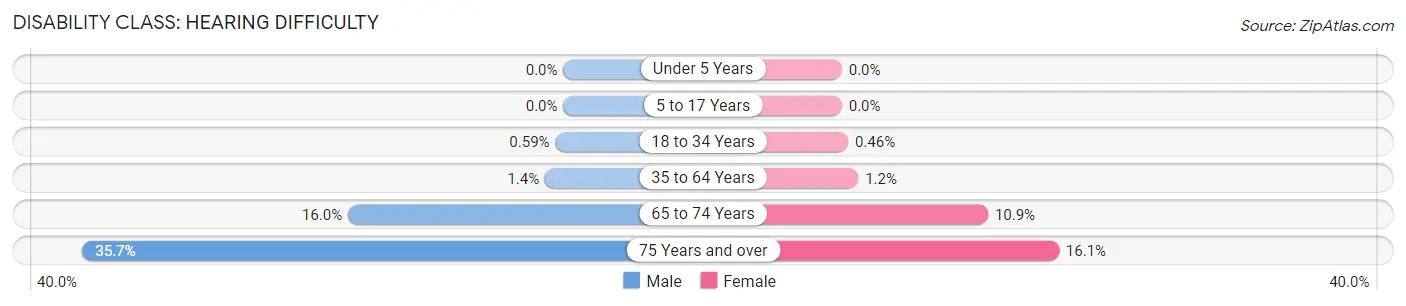
| Age Bracket | Male | Female |
| Under 5 Years | 0 (0.0%) | 0 (0.0%) |
| 5 to 17 Years | 0 (0.0%) | 0 (0.0%) |
| 18 to 34 Years | 9 (0.6%) | 8 (0.5%) |
| 35 to 64 Years | 45 (1.4%) | 40 (1.2%) |
| 65 to 74 Years | 79 (16.0%) | 93 (10.8%) |
| 75 Years and over | 150 (35.7%) | 118 (16.1%) |
Disability Class: Vision Difficulty
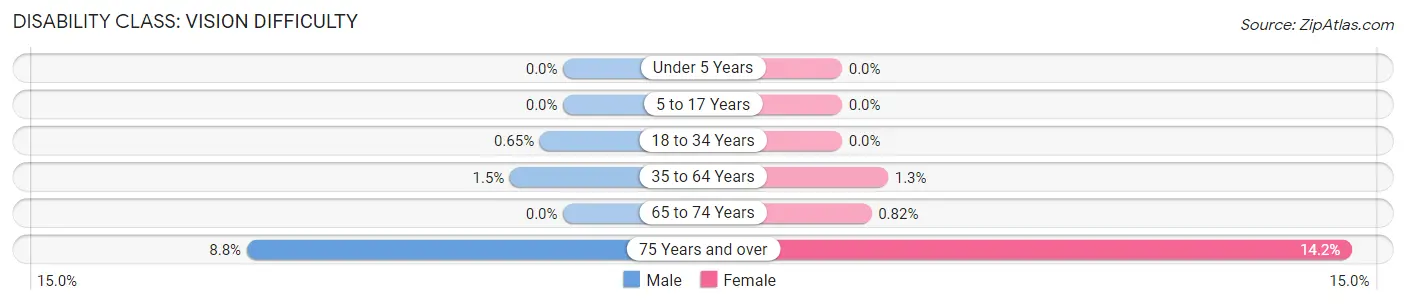
| Age Bracket | Male | Female |
| Under 5 Years | 0 (0.0%) | 0 (0.0%) |
| 5 to 17 Years | 0 (0.0%) | 0 (0.0%) |
| 18 to 34 Years | 10 (0.6%) | 0 (0.0%) |
| 35 to 64 Years | 49 (1.5%) | 42 (1.3%) |
| 65 to 74 Years | 0 (0.0%) | 7 (0.8%) |
| 75 Years and over | 37 (8.8%) | 104 (14.2%) |
Disability Class: Cognitive Difficulty
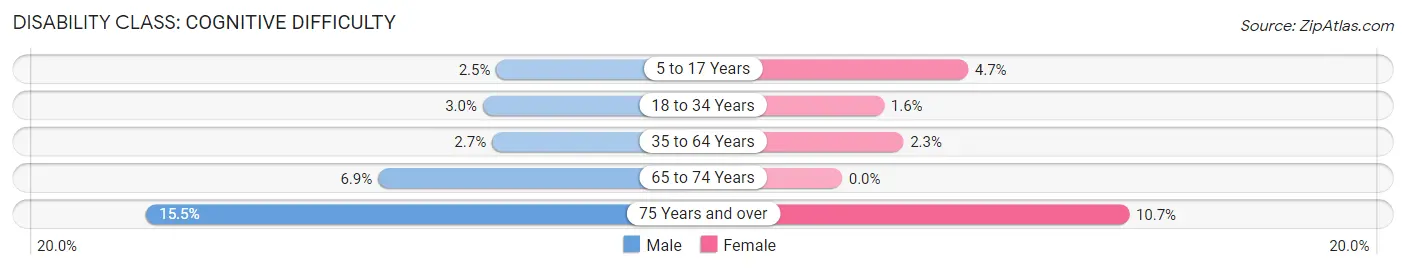
| Age Bracket | Male | Female |
| 5 to 17 Years | 37 (2.5%) | 61 (4.7%) |
| 18 to 34 Years | 46 (3.0%) | 27 (1.6%) |
| 35 to 64 Years | 88 (2.6%) | 75 (2.3%) |
| 65 to 74 Years | 34 (6.9%) | 0 (0.0%) |
| 75 Years and over | 65 (15.5%) | 78 (10.7%) |
Disability Class: Ambulatory Difficulty
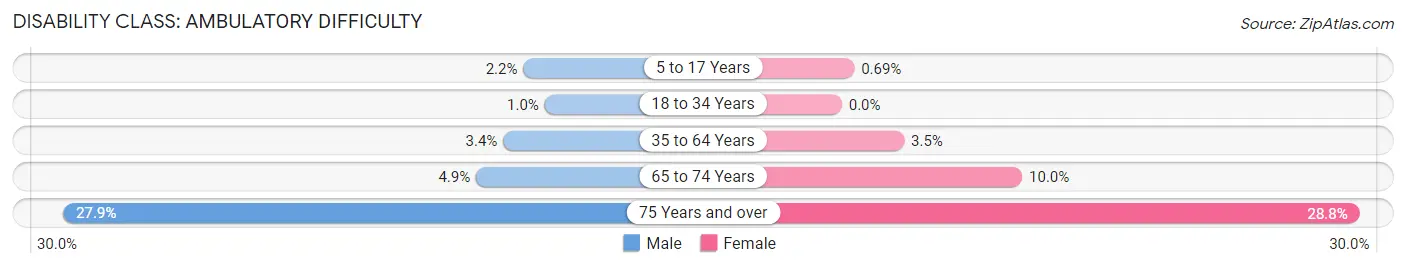
| Age Bracket | Male | Female |
| 5 to 17 Years | 33 (2.2%) | 9 (0.7%) |
| 18 to 34 Years | 16 (1.0%) | 0 (0.0%) |
| 35 to 64 Years | 111 (3.4%) | 114 (3.5%) |
| 65 to 74 Years | 24 (4.9%) | 86 (10.0%) |
| 75 Years and over | 117 (27.9%) | 211 (28.8%) |
Disability Class: Self-Care Difficulty
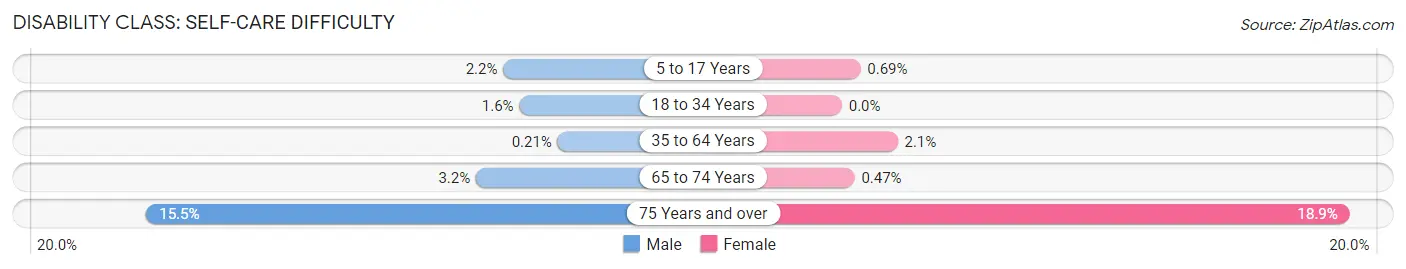
| Age Bracket | Male | Female |
| 5 to 17 Years | 33 (2.2%) | 9 (0.7%) |
| 18 to 34 Years | 25 (1.6%) | 0 (0.0%) |
| 35 to 64 Years | 7 (0.2%) | 68 (2.1%) |
| 65 to 74 Years | 16 (3.2%) | 4 (0.5%) |
| 75 Years and over | 65 (15.5%) | 138 (18.9%) |
Technology Access in Stallings
Computing Device Access in Stallings
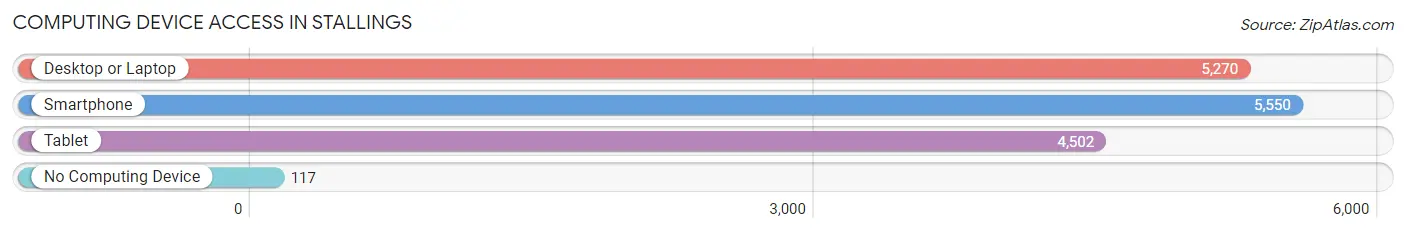
| Device Type | # Households | % Households |
| Desktop or Laptop | 5,270 | 89.9% |
| Smartphone | 5,550 | 94.7% |
| Tablet | 4,502 | 76.8% |
| No Computing Device | 117 | 2.0% |
| Total | 5,861 | 100.0% |
Internet Access in Stallings
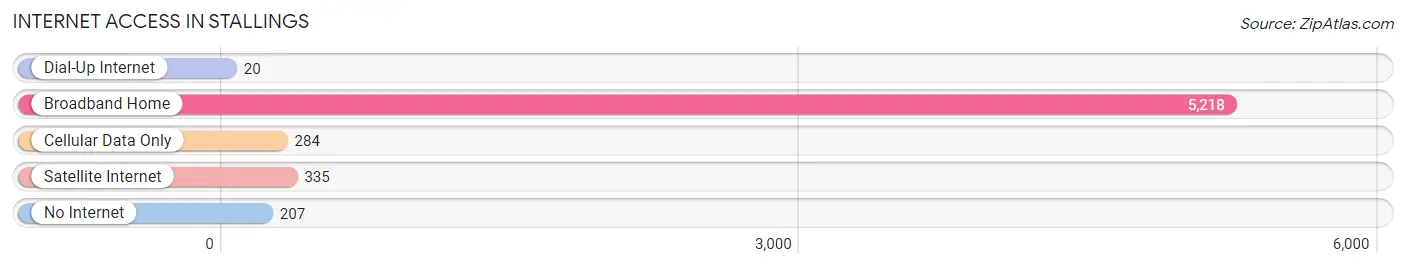
| Internet Type | # Households | % Households |
| Dial-Up Internet | 20 | 0.3% |
| Broadband Home | 5,218 | 89.0% |
| Cellular Data Only | 284 | 4.9% |
| Satellite Internet | 335 | 5.7% |
| No Internet | 207 | 3.5% |
| Total | 5,861 | 100.0% |
Stallings Summary
Stallings is a small town located in Union County, North Carolina. It is situated approximately 15 miles southeast of Charlotte and is part of the Charlotte metropolitan area. The town was founded in 1891 and was named after the Stallings family, who were early settlers in the area.
Geography
Stallings is located in the Piedmont region of North Carolina, which is characterized by rolling hills and flat plains. The town is situated on the banks of the Rocky River, which flows through the town and provides a source of recreation for the residents. The town is located at an elevation of 690 feet above sea level. The climate in Stallings is humid subtropical, with hot, humid summers and mild winters.
Economy
Stallings is primarily a residential community, with most of its residents commuting to nearby Charlotte for work. The town is home to several small businesses, including a grocery store, a hardware store, and a few restaurants. The town also has a few industrial parks, which provide employment opportunities for local residents.
Demographics
As of the 2010 census, Stallings had a population of 8,359. The racial makeup of the town was 79.3% White, 11.2% African American, 0.3% Native American, 4.2% Asian, and 4.9% from other races. The median household income in Stallings was $63,945, and the median family income was $76,945.
Education
Stallings is served by the Union County Public Schools system. The town is home to two elementary schools, one middle school, and one high school. The town also has a few private schools, including a Catholic school and a Montessori school.
Conclusion
Stallings is a small town located in Union County, North Carolina. It is situated approximately 15 miles southeast of Charlotte and is part of the Charlotte metropolitan area. The town was founded in 1891 and was named after the Stallings family, who were early settlers in the area. Stallings is primarily a residential community, with most of its residents commuting to nearby Charlotte for work. As of the 2010 census, Stallings had a population of 8,359. The town is served by the Union County Public Schools system and is home to several small businesses.
Common Questions
What is the Total Population of Stallings?
Total Population of Stallings is 16,193.
What is the Total Male Population of Stallings?
Total Male Population of Stallings is 7,703.
What is the Total Female Population of Stallings?
Total Female Population of Stallings is 8,490.
What is the Ratio of Males per 100 Females in Stallings?
There are 90.73 Males per 100 Females in Stallings.
What is the Ratio of Females per 100 Males in Stallings?
There are 110.22 Females per 100 Males in Stallings.
What is the Median Population Age in Stallings?
Median Population Age in Stallings is 39.8 Years.
What is the Average Family Size in Stallings
Average Family Size in Stallings is 3.1 People.
What is the Average Household Size in Stallings
Average Household Size in Stallings is 2.8 People.
What is Per Capita Income in Stallings?
Per Capita income in Stallings is $46,846.
What is the Median Family Income in Stallings?
Median Family Income in Stallings is $110,694.
What is the Median Household income in Stallings?
Median Household Income in Stallings is $99,451.
What is Income or Wage Gap in Stallings?
Income or Wage Gap in Stallings is 28.2%.
Women in Stallings earn 71.8 cents for every dollar earned by a man.
What is Family Income Deficit in Stallings?
Family Income Deficit in Stallings is $5,581.
Families that are below poverty line in Stallings earn $5,581 less on average than the poverty threshold level.
What is Inequality or Gini Index in Stallings?
Inequality or Gini Index in Stallings is 0.41.
How Large is the Labor Force in Stallings?
There are 9,067 People in the Labor Forcein in Stallings.
What is the Percentage of People in the Labor Force in Stallings?
70.9% of People are in the Labor Force in Stallings.
What is the Unemployment Rate in Stallings?
Unemployment Rate in Stallings is 4.8%.