Cities with the Most Immigrants from Eastern Europe in North Carolina
RELATED REPORTS & OPTIONS
Eastern Europe
North Carolina
Compare Cities
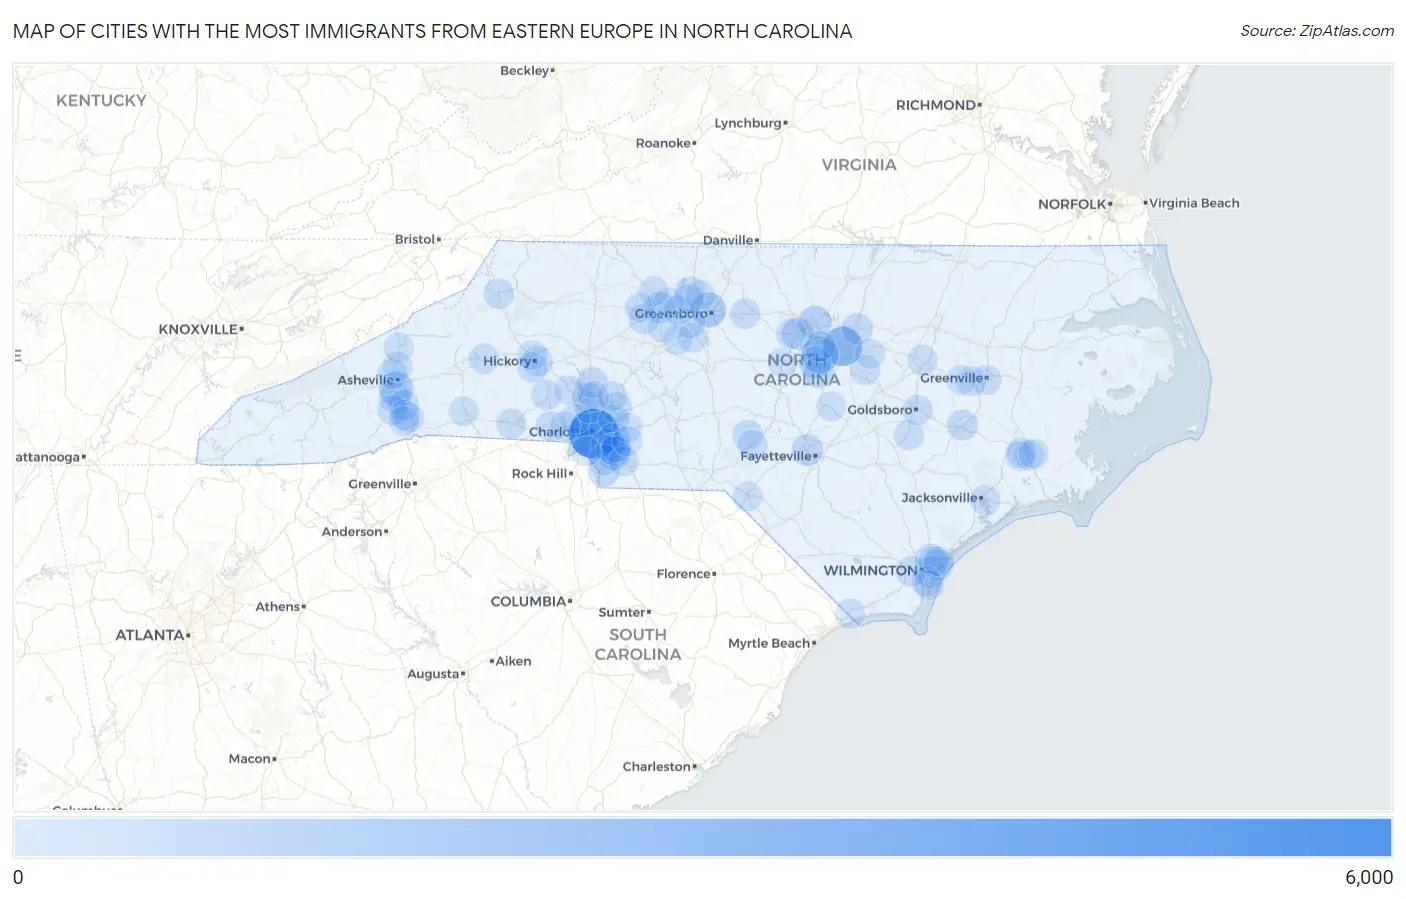
Map of Cities with the Most Immigrants from Eastern Europe in North Carolina
0
6,000
Cities with the Most Immigrants from Eastern Europe in North Carolina
| City | Eastern Europe | vs State | vs National | |
| 1. | Charlotte | 5,421 | 34,793(15.58%)#1 | 2,208,794(0.25%)#19 |
| 2. | Raleigh | 2,535 | 34,793(7.29%)#2 | 2,208,794(0.11%)#80 |
| 3. | Cary | 1,829 | 34,793(5.26%)#3 | 2,208,794(0.08%)#142 |
| 4. | Greensboro | 1,258 | 34,793(3.62%)#4 | 2,208,794(0.06%)#224 |
| 5. | Asheville | 1,196 | 34,793(3.44%)#5 | 2,208,794(0.05%)#242 |
| 6. | Indian Trail | 1,124 | 34,793(3.23%)#6 | 2,208,794(0.05%)#258 |
| 7. | Matthews | 844 | 34,793(2.43%)#7 | 2,208,794(0.04%)#375 |
| 8. | Durham | 811 | 34,793(2.33%)#8 | 2,208,794(0.04%)#390 |
| 9. | Chapel Hill | 536 | 34,793(1.54%)#9 | 2,208,794(0.02%)#580 |
| 10. | Apex | 519 | 34,793(1.49%)#10 | 2,208,794(0.02%)#598 |
| 11. | Mint Hill | 484 | 34,793(1.39%)#11 | 2,208,794(0.02%)#642 |
| 12. | Fayetteville | 467 | 34,793(1.34%)#12 | 2,208,794(0.02%)#663 |
| 13. | Winston Salem | 450 | 34,793(1.29%)#13 | 2,208,794(0.02%)#684 |
| 14. | Holly Springs | 392 | 34,793(1.13%)#14 | 2,208,794(0.02%)#772 |
| 15. | Waxhaw | 380 | 34,793(1.09%)#15 | 2,208,794(0.02%)#794 |
| 16. | Avery Creek | 377 | 34,793(1.08%)#16 | 2,208,794(0.02%)#802 |
| 17. | Wilmington | 324 | 34,793(0.93%)#17 | 2,208,794(0.01%)#934 |
| 18. | High Point | 315 | 34,793(0.91%)#18 | 2,208,794(0.01%)#966 |
| 19. | Concord | 300 | 34,793(0.86%)#19 | 2,208,794(0.01%)#1,014 |
| 20. | Huntersville | 285 | 34,793(0.82%)#20 | 2,208,794(0.01%)#1,056 |
| 21. | Wake Forest | 285 | 34,793(0.82%)#21 | 2,208,794(0.01%)#1,058 |
| 22. | Kinston | 246 | 34,793(0.71%)#22 | 2,208,794(0.01%)#1,196 |
| 23. | Weddington | 235 | 34,793(0.68%)#23 | 2,208,794(0.01%)#1,245 |
| 24. | Cornelius | 226 | 34,793(0.65%)#24 | 2,208,794(0.01%)#1,287 |
| 25. | Mooresville | 220 | 34,793(0.63%)#25 | 2,208,794(0.01%)#1,314 |
| 26. | Gastonia | 182 | 34,793(0.52%)#26 | 2,208,794(0.01%)#1,512 |
| 27. | Leland | 161 | 34,793(0.46%)#27 | 2,208,794(0.01%)#1,654 |
| 28. | Harrisburg | 157 | 34,793(0.45%)#28 | 2,208,794(0.01%)#1,690 |
| 29. | Clemmons | 156 | 34,793(0.45%)#29 | 2,208,794(0.01%)#1,700 |
| 30. | Hickory | 154 | 34,793(0.44%)#30 | 2,208,794(0.01%)#1,715 |
| 31. | Stallings | 154 | 34,793(0.44%)#31 | 2,208,794(0.01%)#1,717 |
| 32. | Pinehurst | 151 | 34,793(0.43%)#32 | 2,208,794(0.01%)#1,741 |
| 33. | Boone | 145 | 34,793(0.42%)#33 | 2,208,794(0.01%)#1,800 |
| 34. | Morrisville | 140 | 34,793(0.40%)#34 | 2,208,794(0.01%)#1,851 |
| 35. | Burlington | 139 | 34,793(0.40%)#35 | 2,208,794(0.01%)#1,867 |
| 36. | Fletcher | 137 | 34,793(0.39%)#36 | 2,208,794(0.01%)#1,889 |
| 37. | Carrboro | 127 | 34,793(0.37%)#37 | 2,208,794(0.01%)#1,968 |
| 38. | Greenville | 118 | 34,793(0.34%)#38 | 2,208,794(0.01%)#2,063 |
| 39. | Clayton | 118 | 34,793(0.34%)#39 | 2,208,794(0.01%)#2,066 |
| 40. | Jacksonville | 109 | 34,793(0.31%)#40 | 2,208,794(0.00%)#2,178 |
| 41. | Mills River | 97 | 34,793(0.28%)#41 | 2,208,794(0.00%)#2,345 |
| 42. | Lake Park | 91 | 34,793(0.26%)#42 | 2,208,794(0.00%)#2,442 |
| 43. | Hendersonville | 90 | 34,793(0.26%)#43 | 2,208,794(0.00%)#2,449 |
| 44. | Woodfin | 85 | 34,793(0.24%)#44 | 2,208,794(0.00%)#2,542 |
| 45. | Shelby | 83 | 34,793(0.24%)#45 | 2,208,794(0.00%)#2,578 |
| 46. | Bell Arthur | 81 | 34,793(0.23%)#46 | 2,208,794(0.00%)#2,626 |
| 47. | Lewisville | 80 | 34,793(0.23%)#47 | 2,208,794(0.00%)#2,640 |
| 48. | Stokesdale | 73 | 34,793(0.21%)#48 | 2,208,794(0.00%)#2,788 |
| 49. | Governors | 73 | 34,793(0.21%)#49 | 2,208,794(0.00%)#2,796 |
| 50. | Mount Olive | 72 | 34,793(0.21%)#50 | 2,208,794(0.00%)#2,814 |
| 51. | Davidson | 71 | 34,793(0.20%)#51 | 2,208,794(0.00%)#2,825 |
| 52. | Ogden | 70 | 34,793(0.20%)#52 | 2,208,794(0.00%)#2,857 |
| 53. | Lincolnton | 65 | 34,793(0.19%)#53 | 2,208,794(0.00%)#2,954 |
| 54. | Kannapolis | 64 | 34,793(0.18%)#54 | 2,208,794(0.00%)#2,961 |
| 55. | Kernersville | 62 | 34,793(0.18%)#55 | 2,208,794(0.00%)#3,005 |
| 56. | Glen Alpine | 62 | 34,793(0.18%)#56 | 2,208,794(0.00%)#3,020 |
| 57. | Goldsboro | 60 | 34,793(0.17%)#57 | 2,208,794(0.00%)#3,050 |
| 58. | Northchase | 60 | 34,793(0.17%)#58 | 2,208,794(0.00%)#3,066 |
| 59. | Aberdeen | 59 | 34,793(0.17%)#59 | 2,208,794(0.00%)#3,092 |
| 60. | Monroe | 57 | 34,793(0.16%)#60 | 2,208,794(0.00%)#3,130 |
| 61. | Linville | 54 | 34,793(0.16%)#61 | 2,208,794(0.00%)#3,243 |
| 62. | Murraysville | 52 | 34,793(0.15%)#62 | 2,208,794(0.00%)#3,288 |
| 63. | Balfour | 52 | 34,793(0.15%)#63 | 2,208,794(0.00%)#3,306 |
| 64. | Mountain View | 46 | 34,793(0.13%)#64 | 2,208,794(0.00%)#3,522 |
| 65. | Silver Lake | 45 | 34,793(0.13%)#65 | 2,208,794(0.00%)#3,544 |
| 66. | Walkertown | 45 | 34,793(0.13%)#66 | 2,208,794(0.00%)#3,545 |
| 67. | Briar Chapel | 44 | 34,793(0.13%)#67 | 2,208,794(0.00%)#3,579 |
| 68. | Summerfield | 42 | 34,793(0.12%)#68 | 2,208,794(0.00%)#3,660 |
| 69. | Myrtle Grove | 41 | 34,793(0.12%)#69 | 2,208,794(0.00%)#3,700 |
| 70. | Archdale | 41 | 34,793(0.12%)#70 | 2,208,794(0.00%)#3,702 |
| 71. | Mars Hill | 41 | 34,793(0.12%)#71 | 2,208,794(0.00%)#3,729 |
| 72. | Denver | 41 | 34,793(0.12%)#72 | 2,208,794(0.00%)#3,730 |
| 73. | Pineville | 39 | 34,793(0.11%)#73 | 2,208,794(0.00%)#3,796 |
| 74. | Valley Hill | 39 | 34,793(0.11%)#74 | 2,208,794(0.00%)#3,816 |
| 75. | Hemby Bridge | 37 | 34,793(0.11%)#75 | 2,208,794(0.00%)#3,906 |
| 76. | Thomasville | 36 | 34,793(0.10%)#76 | 2,208,794(0.00%)#3,913 |
| 77. | Laurinburg | 35 | 34,793(0.10%)#77 | 2,208,794(0.00%)#3,954 |
| 78. | Anderson Creek | 35 | 34,793(0.10%)#78 | 2,208,794(0.00%)#3,955 |
| 79. | Spout Springs | 34 | 34,793(0.10%)#79 | 2,208,794(0.00%)#4,010 |
| 80. | Farmville | 32 | 34,793(0.09%)#80 | 2,208,794(0.00%)#4,134 |
| 81. | Brices Creek | 32 | 34,793(0.09%)#81 | 2,208,794(0.00%)#4,136 |
| 82. | Wilson | 31 | 34,793(0.09%)#82 | 2,208,794(0.00%)#4,149 |
| 83. | James City | 31 | 34,793(0.09%)#83 | 2,208,794(0.00%)#4,181 |
| 84. | New Bern | 30 | 34,793(0.09%)#84 | 2,208,794(0.00%)#4,210 |
| 85. | Mount Holly | 30 | 34,793(0.09%)#85 | 2,208,794(0.00%)#4,219 |
| 86. | Pittsboro | 29 | 34,793(0.08%)#86 | 2,208,794(0.00%)#4,294 |
| 87. | Mcadenville | 29 | 34,793(0.08%)#87 | 2,208,794(0.00%)#4,312 |
| 88. | Rutherfordton | 28 | 34,793(0.08%)#88 | 2,208,794(0.00%)#4,353 |
| 89. | Carolina Shores | 26 | 34,793(0.07%)#89 | 2,208,794(0.00%)#4,469 |
| 90. | Bayshore | 25 | 34,793(0.07%)#90 | 2,208,794(0.00%)#4,544 |
| 91. | Oak Ridge | 23 | 34,793(0.07%)#91 | 2,208,794(0.00%)#4,670 |
| 92. | Northlakes | 23 | 34,793(0.07%)#92 | 2,208,794(0.00%)#4,712 |
| 93. | Weaverville | 21 | 34,793(0.06%)#93 | 2,208,794(0.00%)#4,842 |
| 94. | Rural Hall | 21 | 34,793(0.06%)#94 | 2,208,794(0.00%)#4,848 |
| 95. | Fairfield Harbour | 21 | 34,793(0.06%)#95 | 2,208,794(0.00%)#4,855 |
| 96. | Midland | 20 | 34,793(0.06%)#96 | 2,208,794(0.00%)#4,917 |
| 97. | Wendell | 19 | 34,793(0.05%)#97 | 2,208,794(0.00%)#4,979 |
| 98. | Midway | 18 | 34,793(0.05%)#98 | 2,208,794(0.00%)#5,113 |
| 99. | Buies Creek | 18 | 34,793(0.05%)#99 | 2,208,794(0.00%)#5,129 |
| 100. | Fairview | 18 | 34,793(0.05%)#100 | 2,208,794(0.00%)#5,130 |
Common Questions
What are the Top 10 Cities with the Most Immigrants from Eastern Europe in North Carolina?
Top 10 Cities with the Most Immigrants from Eastern Europe in North Carolina are:
#1
5,421
#2
2,535
#3
1,829
#4
1,258
#5
1,196
#6
1,124
#7
844
#8
811
#9
536
#10
519
What city has the Most Immigrants from Eastern Europe in North Carolina?
Charlotte has the Most Immigrants from Eastern Europe in North Carolina with 5,421.
What is the Total Immigrants from Eastern Europe in the State of North Carolina?
Total Immigrants from Eastern Europe in North Carolina is 34,793.
What is the Total Immigrants from Eastern Europe in the United States?
Total Immigrants from Eastern Europe in the United States is 2,208,794.