Wilson, NC
Wilson Map
Wilson Overview
47,767
TOTAL POPULATION
22,154
MALE POPULATION
25,613
FEMALE POPULATION
86.50
MALES / 100 FEMALES
115.61
FEMALES / 100 MALES
38.8
MEDIAN AGE
3.1
AVG FAMILY SIZE
2.4
AVG HOUSEHOLD SIZE
$28,185
PER CAPITA INCOME
$66,118
AVG FAMILY INCOME
$46,891
AVG HOUSEHOLD INCOME
33.2%
WAGE / INCOME GAP [ % ]
66.8¢/ $1
WAGE / INCOME GAP [ $ ]
$12,714
FAMILY INCOME DEFICIT
0.50
INEQUALITY / GINI INDEX
22,754
LABOR FORCE [ PEOPLE ]
60.1%
PERCENT IN LABOR FORCE
8.4%
UNEMPLOYMENT RATE
Wilson Area Codes
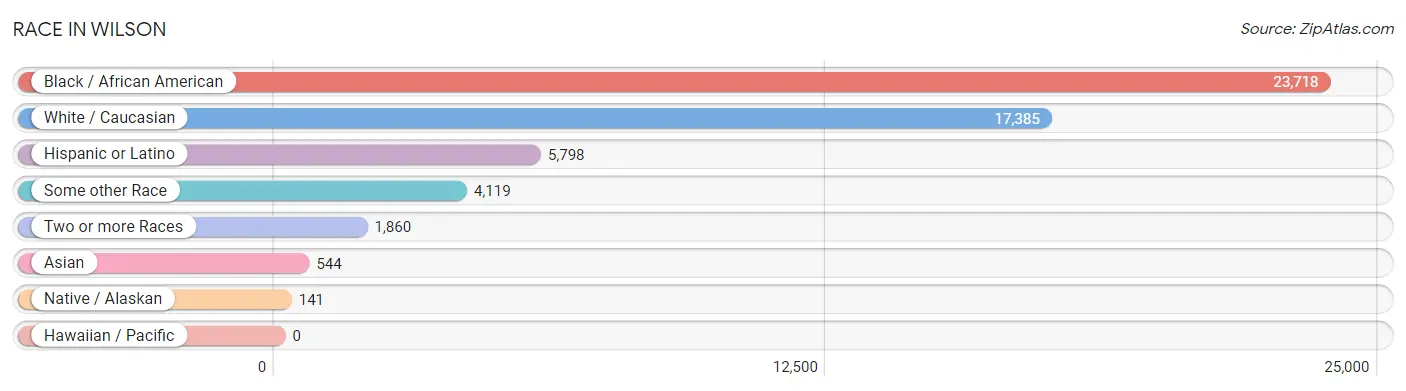
Race in Wilson
The most populous races in Wilson are Black / African American (23,718 | 49.6%), White / Caucasian (17,385 | 36.4%), and Hispanic or Latino (5,798 | 12.1%).
| Race | # Population | % Population |
| Asian | 544 | 1.1% |
| Black / African American | 23,718 | 49.6% |
| Hawaiian / Pacific | 0 | 0.0% |
| Hispanic or Latino | 5,798 | 12.1% |
| Native / Alaskan | 141 | 0.3% |
| White / Caucasian | 17,385 | 36.4% |
| Two or more Races | 1,860 | 3.9% |
| Some other Race | 4,119 | 8.6% |
| Total | 47,767 | 100.0% |
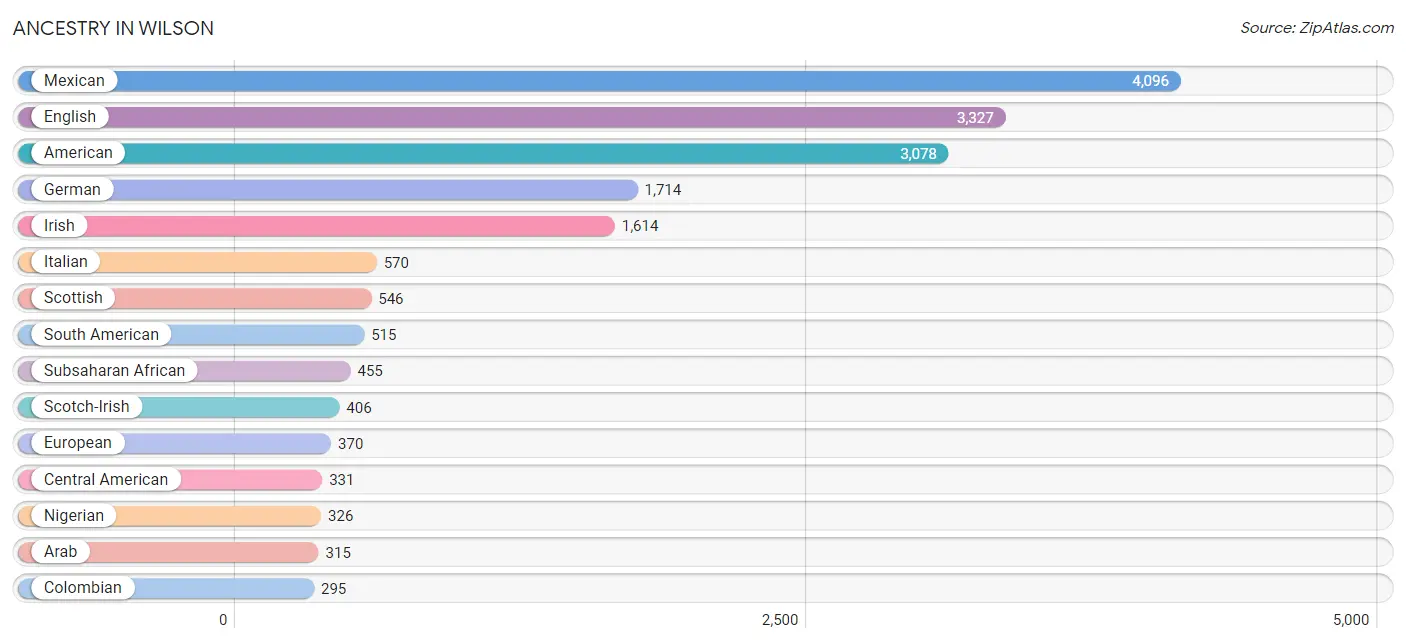
Ancestry in Wilson
The most populous ancestries reported in Wilson are Mexican (4,096 | 8.6%), English (3,327 | 7.0%), American (3,078 | 6.4%), German (1,714 | 3.6%), and Irish (1,614 | 3.4%), together accounting for 28.9% of all Wilson residents.
| Ancestry | # Population | % Population |
| African | 128 | 0.3% |
| American | 3,078 | 6.4% |
| Apache | 10 | 0.0% |
| Arab | 315 | 0.7% |
| Armenian | 5 | 0.0% |
| Australian | 14 | 0.0% |
| Barbadian | 32 | 0.1% |
| Bhutanese | 162 | 0.3% |
| Blackfeet | 7 | 0.0% |
| Brazilian | 34 | 0.1% |
| British | 109 | 0.2% |
| Burmese | 68 | 0.1% |
| Canadian | 1 | 0.0% |
| Central American | 331 | 0.7% |
| Central American Indian | 29 | 0.1% |
| Cherokee | 62 | 0.1% |
| Choctaw | 1 | 0.0% |
| Colombian | 295 | 0.6% |
| Cuban | 202 | 0.4% |
| Czech | 45 | 0.1% |
| Czechoslovakian | 14 | 0.0% |
| Danish | 42 | 0.1% |
| Dominican | 244 | 0.5% |
| Dutch | 148 | 0.3% |
| Eastern European | 28 | 0.1% |
| Ecuadorian | 198 | 0.4% |
| English | 3,327 | 7.0% |
| European | 370 | 0.8% |
| Finnish | 9 | 0.0% |
| French | 276 | 0.6% |
| French Canadian | 103 | 0.2% |
| German | 1,714 | 3.6% |
| Ghanaian | 1 | 0.0% |
| Greek | 80 | 0.2% |
| Guatemalan | 58 | 0.1% |
| Haitian | 60 | 0.1% |
| Honduran | 266 | 0.6% |
| Hungarian | 8 | 0.0% |
| Indian (Asian) | 66 | 0.1% |
| Inupiat | 77 | 0.2% |
| Irish | 1,614 | 3.4% |
| Italian | 570 | 1.2% |
| Jamaican | 25 | 0.1% |
| Korean | 24 | 0.1% |
| Lebanese | 11 | 0.0% |
| Mexican | 4,096 | 8.6% |
| Mexican American Indian | 16 | 0.0% |
| Native Hawaiian | 12 | 0.0% |
| Nicaraguan | 6 | 0.0% |
| Nigerian | 326 | 0.7% |
| Northern European | 16 | 0.0% |
| Norwegian | 91 | 0.2% |
| Peruvian | 4 | 0.0% |
| Polish | 154 | 0.3% |
| Puerto Rican | 110 | 0.2% |
| Russian | 61 | 0.1% |
| Salvadoran | 1 | 0.0% |
| Scandinavian | 22 | 0.1% |
| Scotch-Irish | 406 | 0.9% |
| Scottish | 546 | 1.1% |
| Sioux | 13 | 0.0% |
| Slavic | 23 | 0.1% |
| Slovak | 26 | 0.1% |
| South American | 515 | 1.1% |
| Sri Lankan | 232 | 0.5% |
| Subsaharan African | 455 | 0.9% |
| Swedish | 130 | 0.3% |
| Swiss | 5 | 0.0% |
| Syrian | 10 | 0.0% |
| Thai | 45 | 0.1% |
| Turkish | 46 | 0.1% |
| Ukrainian | 9 | 0.0% |
| Welsh | 100 | 0.2% |
| West Indian | 13 | 0.0% | View All 74 Rows |
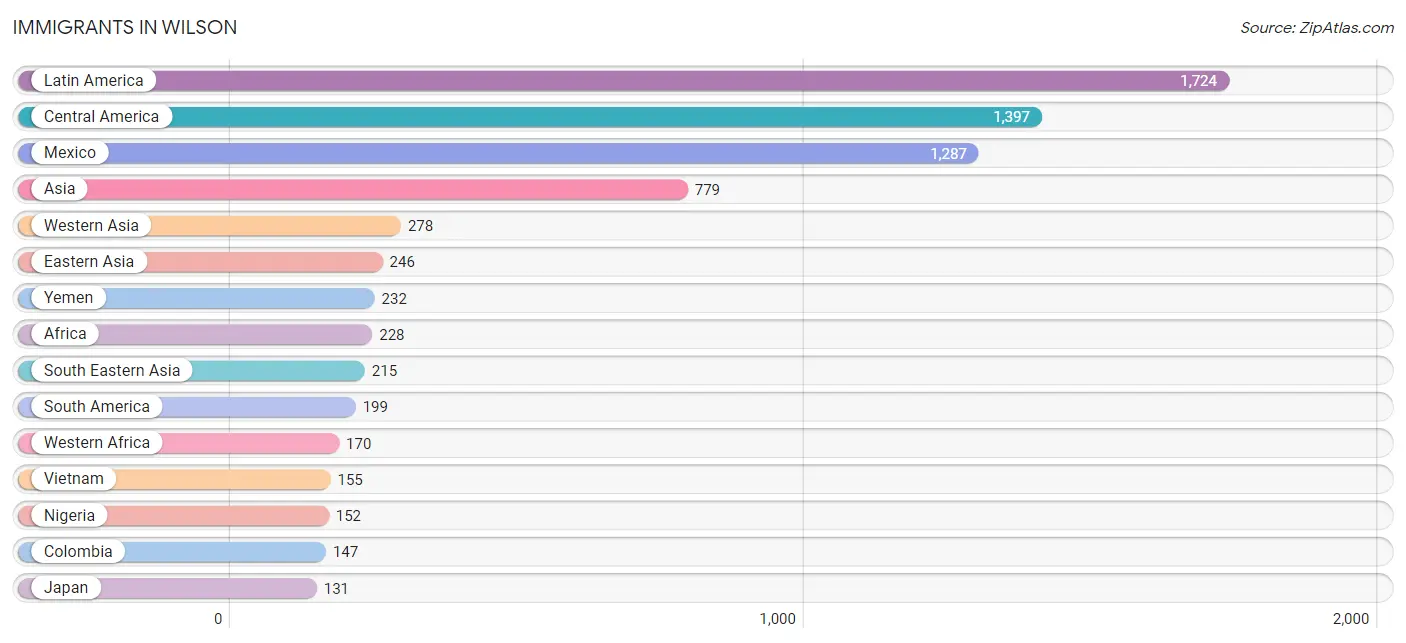
Immigrants in Wilson
The most numerous immigrant groups reported in Wilson came from Latin America (1,724 | 3.6%), Central America (1,397 | 2.9%), Mexico (1,287 | 2.7%), Asia (779 | 1.6%), and Western Asia (278 | 0.6%), together accounting for 11.4% of all Wilson residents.
| Immigration Origin | # Population | % Population |
| Africa | 228 | 0.5% |
| Asia | 779 | 1.6% |
| Brazil | 15 | 0.0% |
| Canada | 47 | 0.1% |
| Caribbean | 128 | 0.3% |
| Central America | 1,397 | 2.9% |
| China | 28 | 0.1% |
| Colombia | 147 | 0.3% |
| Cuba | 36 | 0.1% |
| Czechoslovakia | 31 | 0.1% |
| Denmark | 28 | 0.1% |
| Dominican Republic | 70 | 0.2% |
| Eastern Africa | 34 | 0.1% |
| Eastern Asia | 246 | 0.5% |
| Eastern Europe | 31 | 0.1% |
| Ecuador | 33 | 0.1% |
| El Salvador | 3 | 0.0% |
| Europe | 106 | 0.2% |
| Germany | 23 | 0.1% |
| Ghana | 9 | 0.0% |
| Haiti | 22 | 0.1% |
| Honduras | 101 | 0.2% |
| India | 28 | 0.1% |
| Japan | 131 | 0.3% |
| Korea | 87 | 0.2% |
| Latin America | 1,724 | 3.6% |
| Mexico | 1,287 | 2.7% |
| Netherlands | 7 | 0.0% |
| Nicaragua | 6 | 0.0% |
| Nigeria | 152 | 0.3% |
| Northern Europe | 33 | 0.1% |
| Pakistan | 12 | 0.0% |
| Peru | 4 | 0.0% |
| Philippines | 8 | 0.0% |
| Sierra Leone | 9 | 0.0% |
| South America | 199 | 0.4% |
| South Central Asia | 40 | 0.1% |
| South Eastern Asia | 215 | 0.4% |
| Southern Europe | 12 | 0.0% |
| Turkey | 46 | 0.1% |
| Vietnam | 155 | 0.3% |
| Western Africa | 170 | 0.4% |
| Western Asia | 278 | 0.6% |
| Western Europe | 30 | 0.1% |
| Yemen | 232 | 0.5% |
| Zimbabwe | 34 | 0.1% | View All 46 Rows |
Sex and Age in Wilson
Sex and Age in Wilson
The most populous age groups in Wilson are 10 to 14 Years (1,770 | 8.0%) for men and 10 to 14 Years (1,942 | 7.6%) for women.
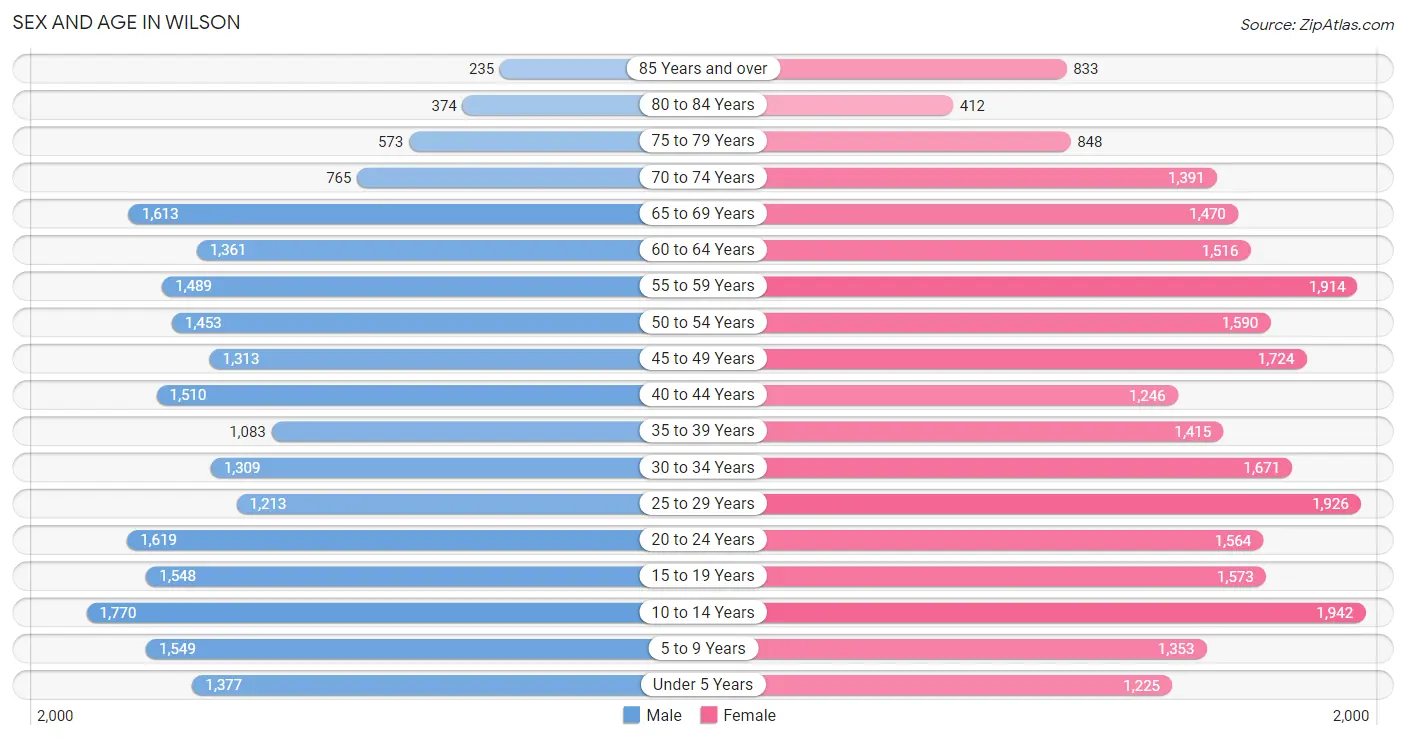
| Age Bracket | Male | Female |
| Under 5 Years | 1,377 (6.2%) | 1,225 (4.8%) |
| 5 to 9 Years | 1,549 (7.0%) | 1,353 (5.3%) |
| 10 to 14 Years | 1,770 (8.0%) | 1,942 (7.6%) |
| 15 to 19 Years | 1,548 (7.0%) | 1,573 (6.1%) |
| 20 to 24 Years | 1,619 (7.3%) | 1,564 (6.1%) |
| 25 to 29 Years | 1,213 (5.5%) | 1,926 (7.5%) |
| 30 to 34 Years | 1,309 (5.9%) | 1,671 (6.5%) |
| 35 to 39 Years | 1,083 (4.9%) | 1,415 (5.5%) |
| 40 to 44 Years | 1,510 (6.8%) | 1,246 (4.9%) |
| 45 to 49 Years | 1,313 (5.9%) | 1,724 (6.7%) |
| 50 to 54 Years | 1,453 (6.6%) | 1,590 (6.2%) |
| 55 to 59 Years | 1,489 (6.7%) | 1,914 (7.5%) |
| 60 to 64 Years | 1,361 (6.1%) | 1,516 (5.9%) |
| 65 to 69 Years | 1,613 (7.3%) | 1,470 (5.7%) |
| 70 to 74 Years | 765 (3.5%) | 1,391 (5.4%) |
| 75 to 79 Years | 573 (2.6%) | 848 (3.3%) |
| 80 to 84 Years | 374 (1.7%) | 412 (1.6%) |
| 85 Years and over | 235 (1.1%) | 833 (3.3%) |
| Total | 22,154 (100.0%) | 25,613 (100.0%) |
Families and Households in Wilson
Median Family Size in Wilson
The median family size in Wilson is 3.09 persons per family, with married-couple families (7,348 | 64.4%) accounting for the largest median family size of 3.18 persons per family. On the other hand, single female/mother families (3,100 | 27.2%) represent the smallest median family size with 2.93 persons per family.
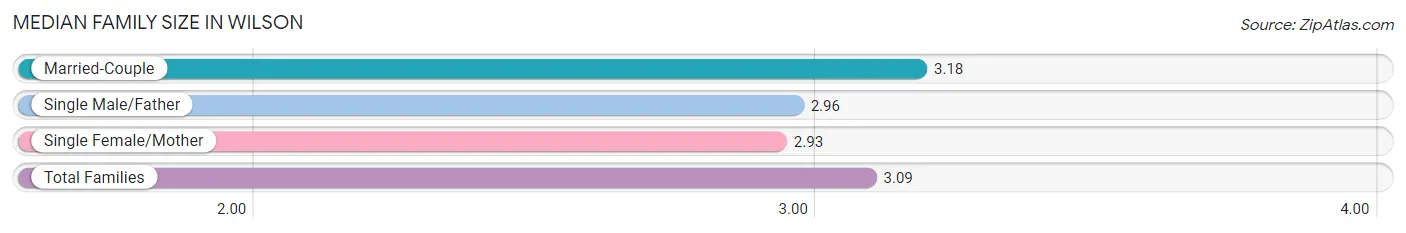
| Family Type | # Families | Family Size |
| Married-Couple | 7,348 (64.4%) | 3.18 |
| Single Male/Father | 964 (8.5%) | 2.96 |
| Single Female/Mother | 3,100 (27.2%) | 2.93 |
| Total Families | 11,412 (100.0%) | 3.09 |
Median Household Size in Wilson
The median household size in Wilson is 2.36 persons per household, with single male/father households (964 | 4.9%) accounting for the largest median household size of 3.39 persons per household. non-family households (8,246 | 41.9%) represent the smallest median household size with 1.24 persons per household.
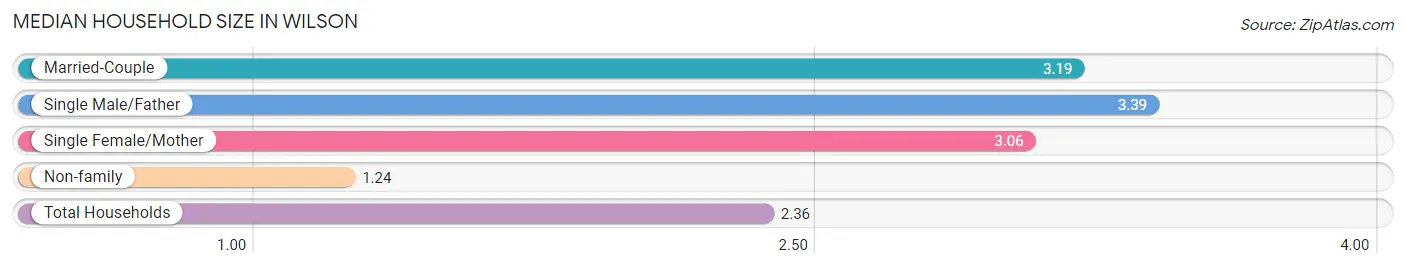
| Household Type | # Households | Household Size |
| Married-Couple | 7,348 (37.4%) | 3.19 |
| Single Male/Father | 964 (4.9%) | 3.39 |
| Single Female/Mother | 3,100 (15.8%) | 3.06 |
| Non-family | 8,246 (41.9%) | 1.24 |
| Total Households | 19,658 (100.0%) | 2.36 |
Household Size by Marriage Status in Wilson
Out of a total of 19,658 households in Wilson, 11,412 (58.1%) are family households, while 8,246 (41.9%) are nonfamily households. The most numerous type of family households are 2-person households, comprising 5,085, and the most common type of nonfamily households are 1-person households, comprising 7,127.
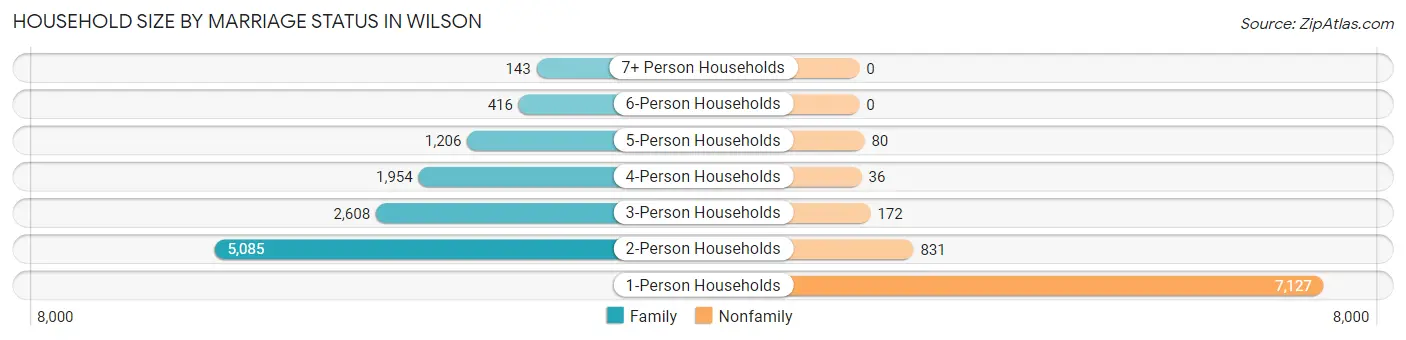
| Household Size | Family Households | Nonfamily Households |
| 1-Person Households | - | 7,127 (36.2%) |
| 2-Person Households | 5,085 (25.9%) | 831 (4.2%) |
| 3-Person Households | 2,608 (13.3%) | 172 (0.9%) |
| 4-Person Households | 1,954 (9.9%) | 36 (0.2%) |
| 5-Person Households | 1,206 (6.1%) | 80 (0.4%) |
| 6-Person Households | 416 (2.1%) | 0 (0.0%) |
| 7+ Person Households | 143 (0.7%) | 0 (0.0%) |
| Total | 11,412 (58.1%) | 8,246 (41.9%) |
Female Fertility in Wilson
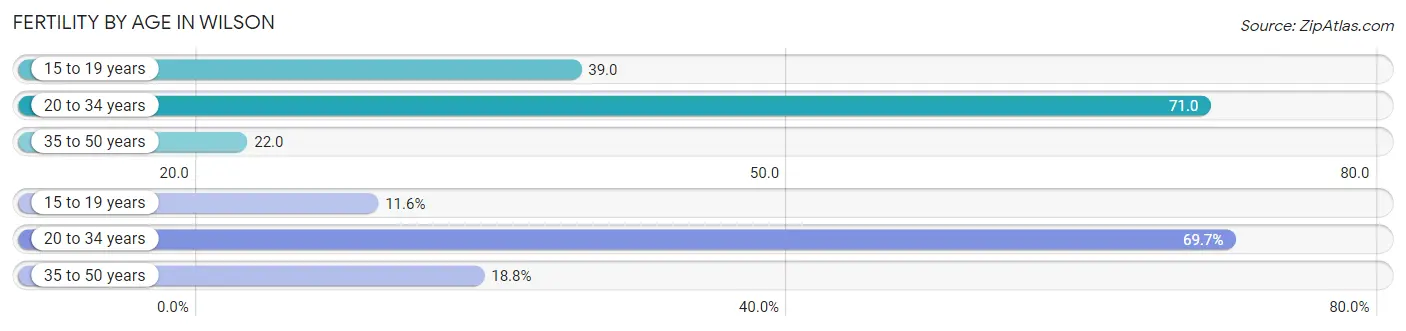
Fertility by Age in Wilson
Average fertility rate in Wilson is 47.0 births per 1,000 women. Women in the age bracket of 20 to 34 years have the highest fertility rate with 71.0 births per 1,000 women. Women in the age bracket of 20 to 34 years acount for 69.7% of all women with births.
| Age Bracket | Women with Births | Births / 1,000 Women |
| 15 to 19 years | 61 (11.6%) | 39.0 |
| 20 to 34 years | 368 (69.7%) | 71.0 |
| 35 to 50 years | 99 (18.8%) | 22.0 |
| Total | 528 (100.0%) | 47.0 |
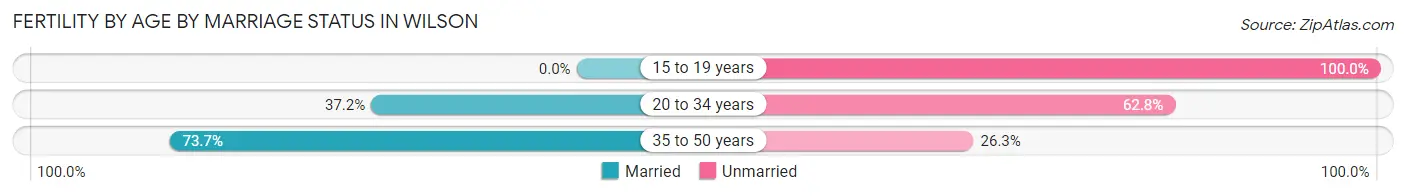
Fertility by Age by Marriage Status in Wilson
39.8% of women with births (528) in Wilson are married. The highest percentage of unmarried women with births falls into 15 to 19 years age bracket with 100.0% of them unmarried at the time of birth, while the lowest percentage of unmarried women with births belong to 35 to 50 years age bracket with 26.3% of them unmarried.
| Age Bracket | Married | Unmarried |
| 15 to 19 years | 0 (0.0%) | 61 (100.0%) |
| 20 to 34 years | 137 (37.2%) | 231 (62.8%) |
| 35 to 50 years | 73 (73.7%) | 26 (26.3%) |
| Total | 210 (39.8%) | 318 (60.2%) |
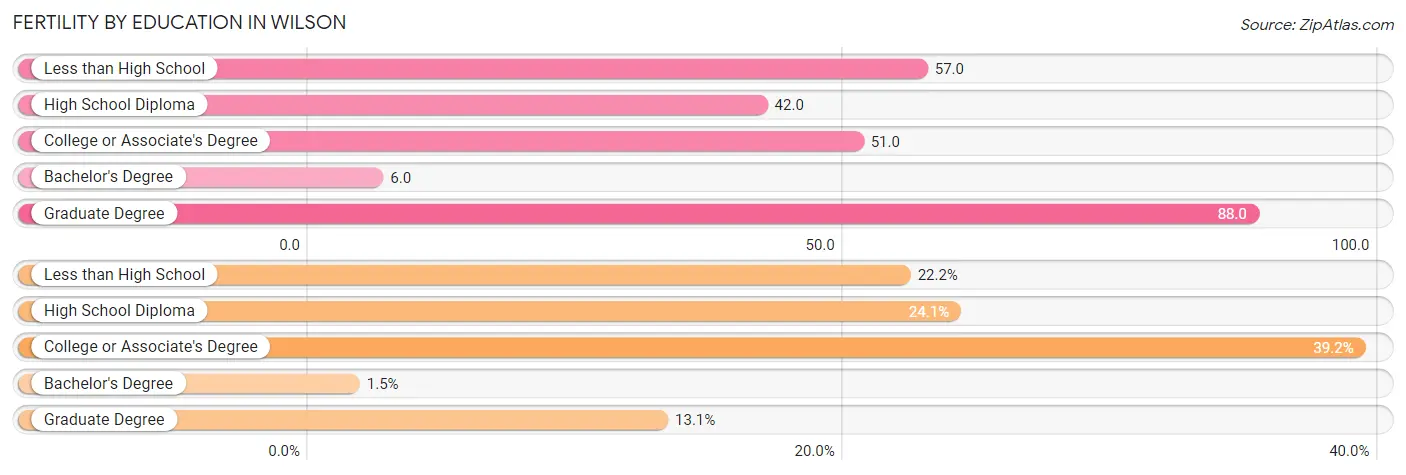
Fertility by Education in Wilson
Average fertility rate in Wilson is 47.0 births per 1,000 women. Women with the education attainment of graduate degree have the highest fertility rate of 88.0 births per 1,000 women, while women with the education attainment of bachelor's degree have the lowest fertility at 6.0 births per 1,000 women. Women with the education attainment of college or associate's degree represent 39.2% of all women with births.
| Educational Attainment | Women with Births | Births / 1,000 Women |
| Less than High School | 117 (22.2%) | 57.0 |
| High School Diploma | 127 (24.0%) | 42.0 |
| College or Associate's Degree | 207 (39.2%) | 51.0 |
| Bachelor's Degree | 8 (1.5%) | 6.0 |
| Graduate Degree | 69 (13.1%) | 88.0 |
| Total | 528 (100.0%) | 47.0 |
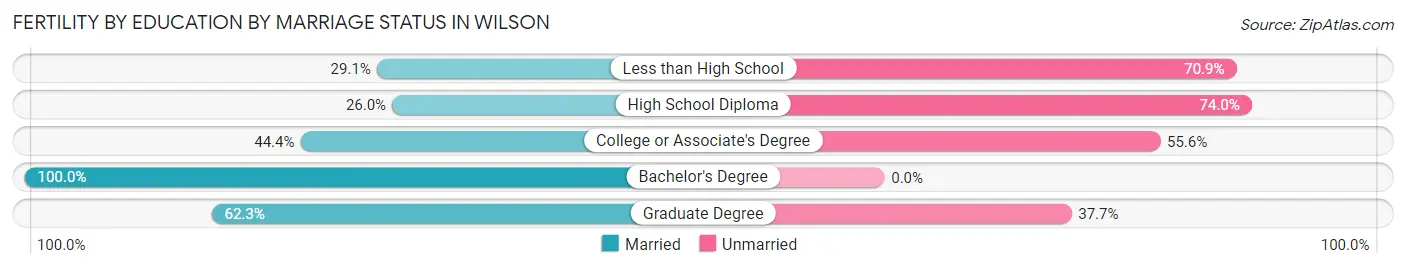
Fertility by Education by Marriage Status in Wilson
60.2% of women with births in Wilson are unmarried. Women with the educational attainment of bachelor's degree are most likely to be married with 100.0% of them married at childbirth, while women with the educational attainment of high school diploma are least likely to be married with 74.0% of them unmarried at childbirth.
| Educational Attainment | Married | Unmarried |
| Less than High School | 34 (29.1%) | 83 (70.9%) |
| High School Diploma | 33 (26.0%) | 94 (74.0%) |
| College or Associate's Degree | 92 (44.4%) | 115 (55.6%) |
| Bachelor's Degree | 8 (100.0%) | 0 (0.0%) |
| Graduate Degree | 43 (62.3%) | 26 (37.7%) |
| Total | 210 (39.8%) | 318 (60.2%) |
Income in Wilson
Income Overview in Wilson
Per Capita Income in Wilson is $28,185, while median incomes of families and households are $66,118 and $46,891 respectively.
| Characteristic | Number | Measure |
| Per Capita Income | 47,767 | $28,185 |
| Median Family Income | 11,412 | $66,118 |
| Mean Family Income | 11,412 | $86,548 |
| Median Household Income | 19,658 | $46,891 |
| Mean Household Income | 19,658 | $66,879 |
| Income Deficit | 11,412 | $12,714 |
| Wage / Income Gap (%) | 47,767 | 33.16% |
| Wage / Income Gap ($) | 47,767 | 66.84¢ per $1 |
| Gini / Inequality Index | 47,767 | 0.50 |
Earnings by Sex in Wilson
Average Earnings in Wilson are $32,969, $40,884 for men and $27,327 for women, a difference of 33.2%.
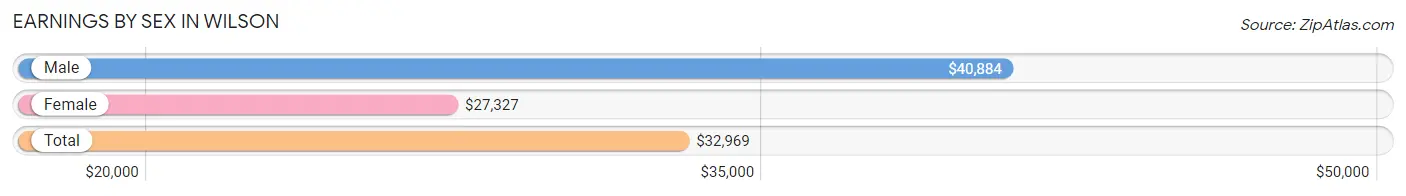
| Sex | Number | Average Earnings |
| Male | 10,760 (46.7%) | $40,884 |
| Female | 12,302 (53.3%) | $27,327 |
| Total | 23,062 (100.0%) | $32,969 |
Earnings by Sex by Income Bracket in Wilson
The most common earnings brackets in Wilson are $100,000+ for men (1,276 | 11.9%) and $25,000 to $29,999 for women (1,321 | 10.7%).
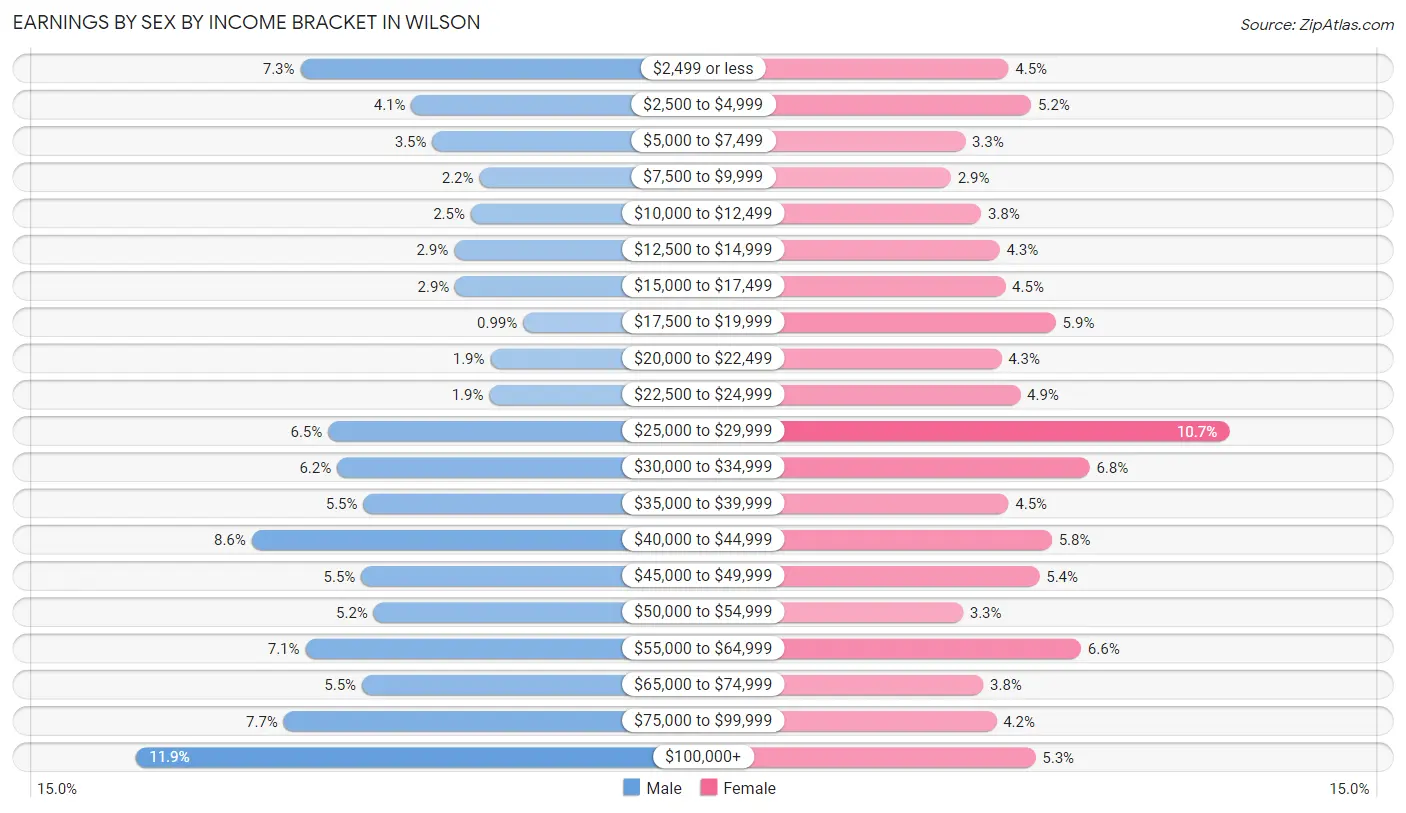
| Income | Male | Female |
| $2,499 or less | 780 (7.2%) | 559 (4.5%) |
| $2,500 to $4,999 | 444 (4.1%) | 637 (5.2%) |
| $5,000 to $7,499 | 381 (3.5%) | 409 (3.3%) |
| $7,500 to $9,999 | 239 (2.2%) | 359 (2.9%) |
| $10,000 to $12,499 | 265 (2.5%) | 464 (3.8%) |
| $12,500 to $14,999 | 315 (2.9%) | 528 (4.3%) |
| $15,000 to $17,499 | 312 (2.9%) | 548 (4.4%) |
| $17,500 to $19,999 | 107 (1.0%) | 722 (5.9%) |
| $20,000 to $22,499 | 205 (1.9%) | 534 (4.3%) |
| $22,500 to $24,999 | 209 (1.9%) | 599 (4.9%) |
| $25,000 to $29,999 | 696 (6.5%) | 1,321 (10.7%) |
| $30,000 to $34,999 | 669 (6.2%) | 839 (6.8%) |
| $35,000 to $39,999 | 590 (5.5%) | 559 (4.5%) |
| $40,000 to $44,999 | 928 (8.6%) | 709 (5.8%) |
| $45,000 to $49,999 | 596 (5.5%) | 665 (5.4%) |
| $50,000 to $54,999 | 558 (5.2%) | 401 (3.3%) |
| $55,000 to $64,999 | 765 (7.1%) | 809 (6.6%) |
| $65,000 to $74,999 | 594 (5.5%) | 471 (3.8%) |
| $75,000 to $99,999 | 831 (7.7%) | 517 (4.2%) |
| $100,000+ | 1,276 (11.9%) | 652 (5.3%) |
| Total | 10,760 (100.0%) | 12,302 (100.0%) |
Earnings by Sex by Educational Attainment in Wilson
Average earnings in Wilson are $45,448 for men and $29,465 for women, a difference of 35.2%. Men with an educational attainment of graduate degree enjoy the highest average annual earnings of $92,206, while those with less than high school education earn the least with $26,903. Women with an educational attainment of graduate degree earn the most with the average annual earnings of $61,030, while those with less than high school education have the smallest earnings of $18,971.
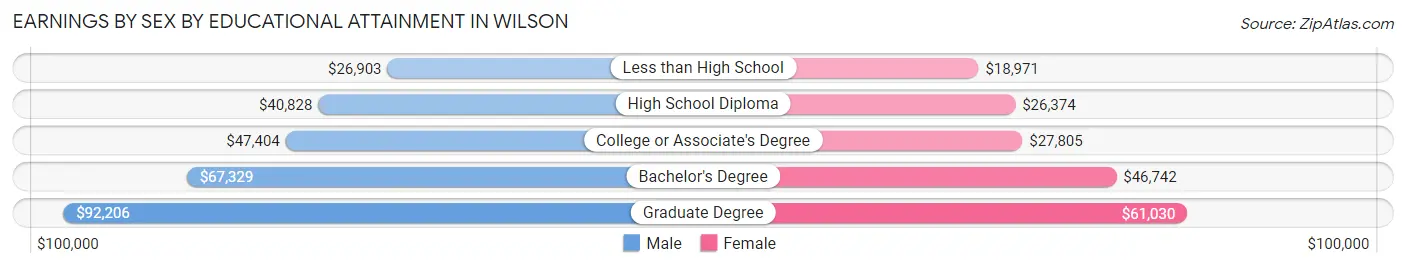
| Educational Attainment | Male Income | Female Income |
| Less than High School | $26,903 | $18,971 |
| High School Diploma | $40,828 | $26,374 |
| College or Associate's Degree | $47,404 | $27,805 |
| Bachelor's Degree | $67,329 | $46,742 |
| Graduate Degree | $92,206 | $61,030 |
| Total | $45,448 | $29,465 |
Family Income in Wilson
Family Income Brackets in Wilson
According to the Wilson family income data, there are 1,837 families falling into the $75,000 to $99,999 income range, which is the most common income bracket and makes up 16.1% of all families. Conversely, the $10,000 to $14,999 income bracket is the least frequent group with only 377 families (3.3%) belonging to this category.
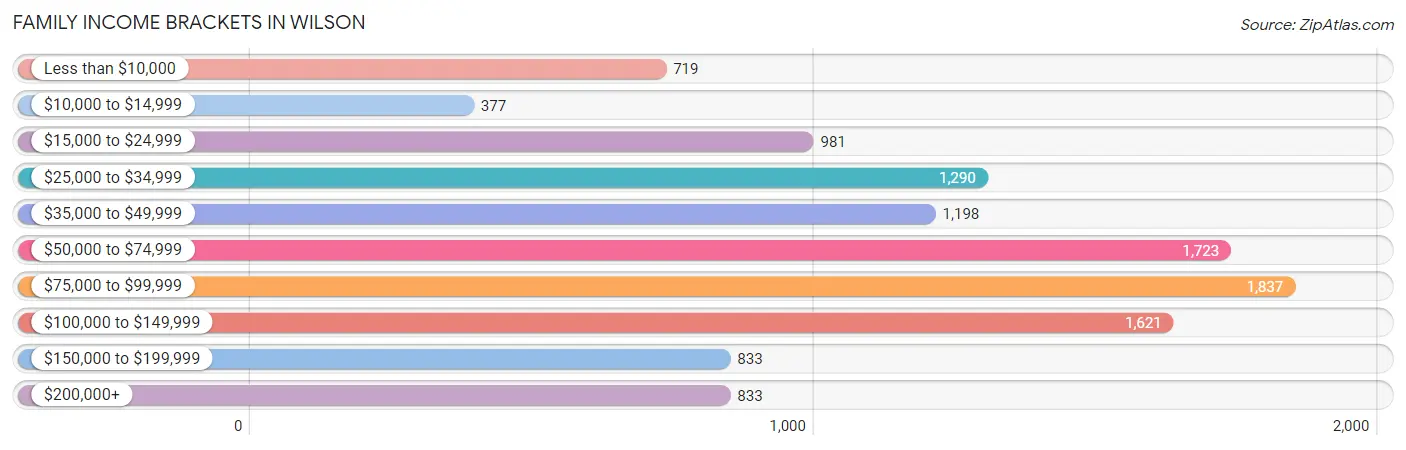
| Income Bracket | # Families | % Families |
| Less than $10,000 | 719 | 6.3% |
| $10,000 to $14,999 | 377 | 3.3% |
| $15,000 to $24,999 | 981 | 8.6% |
| $25,000 to $34,999 | 1,290 | 11.3% |
| $35,000 to $49,999 | 1,198 | 10.5% |
| $50,000 to $74,999 | 1,723 | 15.1% |
| $75,000 to $99,999 | 1,837 | 16.1% |
| $100,000 to $149,999 | 1,621 | 14.2% |
| $150,000 to $199,999 | 833 | 7.3% |
| $200,000+ | 833 | 7.3% |
Family Income by Famaliy Size in Wilson
4-person families (1,955 | 17.1%) account for the highest median family income in Wilson with $89,028 per family, while 2-person families (5,287 | 46.3%) have the highest median income of $27,842 per family member.
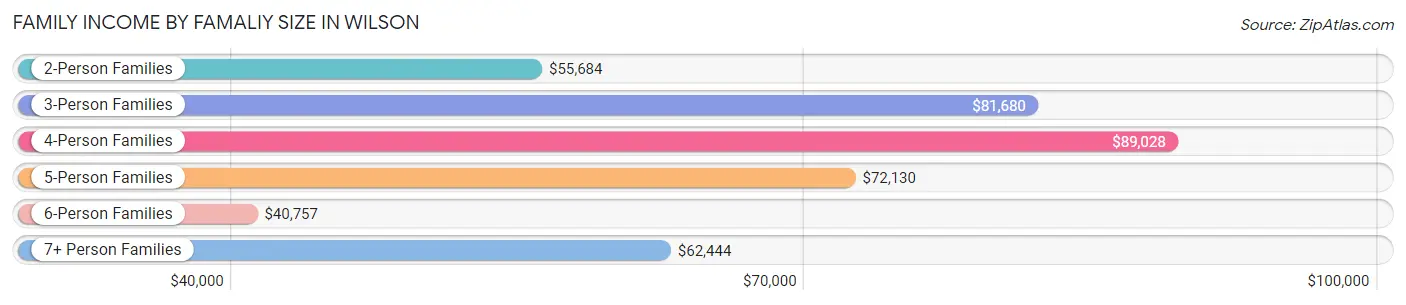
| Income Bracket | # Families | Median Income |
| 2-Person Families | 5,287 (46.3%) | $55,684 |
| 3-Person Families | 2,668 (23.4%) | $81,680 |
| 4-Person Families | 1,955 (17.1%) | $89,028 |
| 5-Person Families | 1,026 (9.0%) | $72,130 |
| 6-Person Families | 372 (3.3%) | $40,757 |
| 7+ Person Families | 104 (0.9%) | $62,444 |
| Total | 11,412 (100.0%) | $66,118 |
Family Income by Number of Earners in Wilson
The median family income in Wilson is $66,118, with families comprising 3+ earners (1,533) having the highest median family income of $111,966, while families with no earners (1,936) have the lowest median family income of $22,797, accounting for 13.4% and 17.0% of families, respectively.
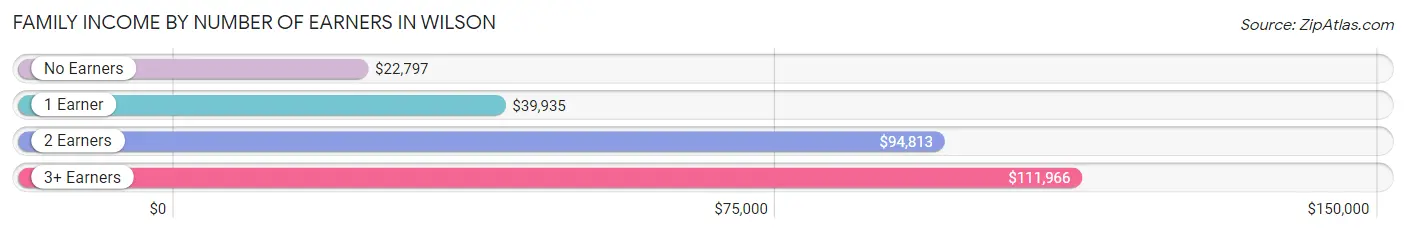
| Number of Earners | # Families | Median Income |
| No Earners | 1,936 (17.0%) | $22,797 |
| 1 Earner | 4,409 (38.6%) | $39,935 |
| 2 Earners | 3,534 (31.0%) | $94,813 |
| 3+ Earners | 1,533 (13.4%) | $111,966 |
| Total | 11,412 (100.0%) | $66,118 |
Household Income in Wilson
Household Income Brackets in Wilson
With 3,086 households falling in the category, the $50,000 to $74,999 income range is the most frequent in Wilson, accounting for 15.7% of all households. In contrast, only 845 households (4.3%) fall into the $150,000 to $199,999 income bracket, making it the least populous group.
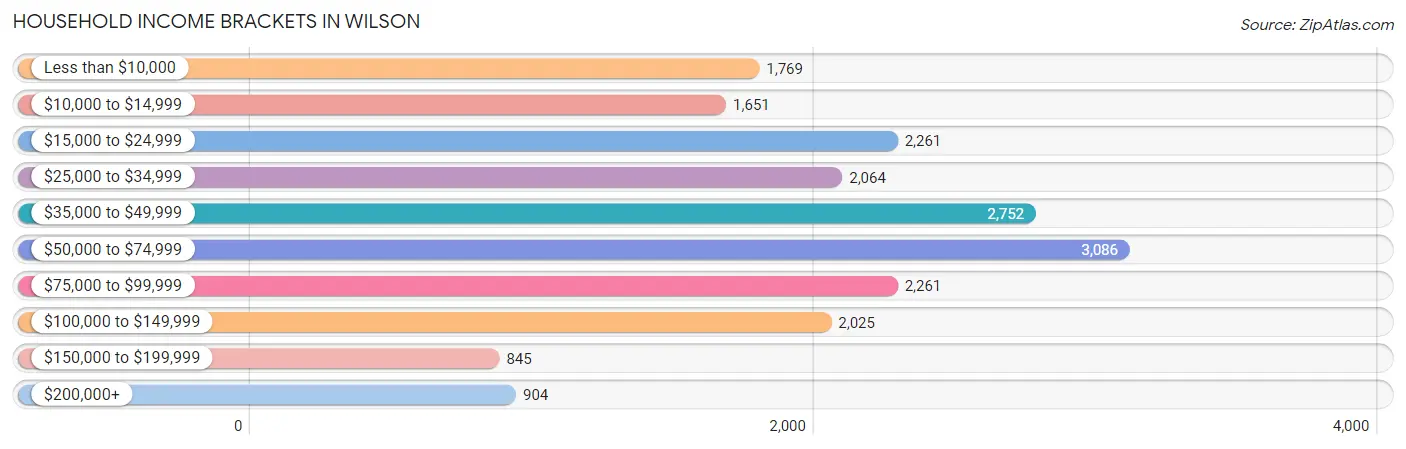
| Income Bracket | # Households | % Households |
| Less than $10,000 | 1,769 | 9.0% |
| $10,000 to $14,999 | 1,651 | 8.4% |
| $15,000 to $24,999 | 2,261 | 11.5% |
| $25,000 to $34,999 | 2,064 | 10.5% |
| $35,000 to $49,999 | 2,752 | 14.0% |
| $50,000 to $74,999 | 3,086 | 15.7% |
| $75,000 to $99,999 | 2,261 | 11.5% |
| $100,000 to $149,999 | 2,025 | 10.3% |
| $150,000 to $199,999 | 845 | 4.3% |
| $200,000+ | 904 | 4.6% |
Household Income by Householder Age in Wilson
The median household income in Wilson is $46,891, with the highest median household income of $55,555 found in the 45 to 64 years age bracket for the primary householder. A total of 7,937 households (40.4%) fall into this category. Meanwhile, the 65+ years age bracket for the primary householder has the lowest median household income of $36,571, with 5,525 households (28.1%) in this group.
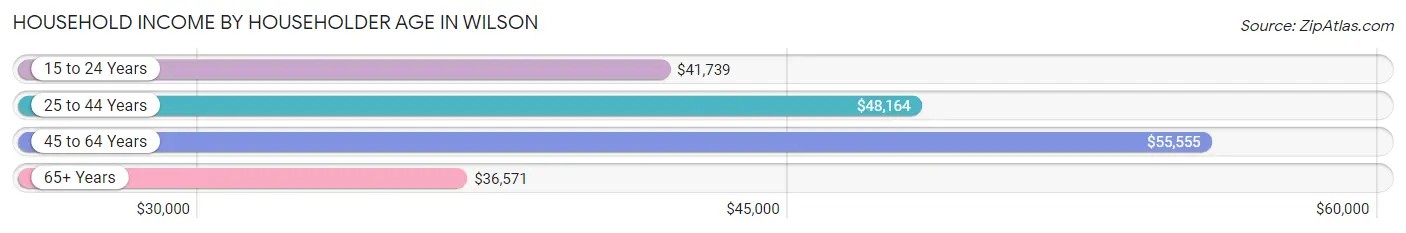
| Income Bracket | # Households | Median Income |
| 15 to 24 Years | 570 (2.9%) | $41,739 |
| 25 to 44 Years | 5,626 (28.6%) | $48,164 |
| 45 to 64 Years | 7,937 (40.4%) | $55,555 |
| 65+ Years | 5,525 (28.1%) | $36,571 |
| Total | 19,658 (100.0%) | $46,891 |
Poverty in Wilson
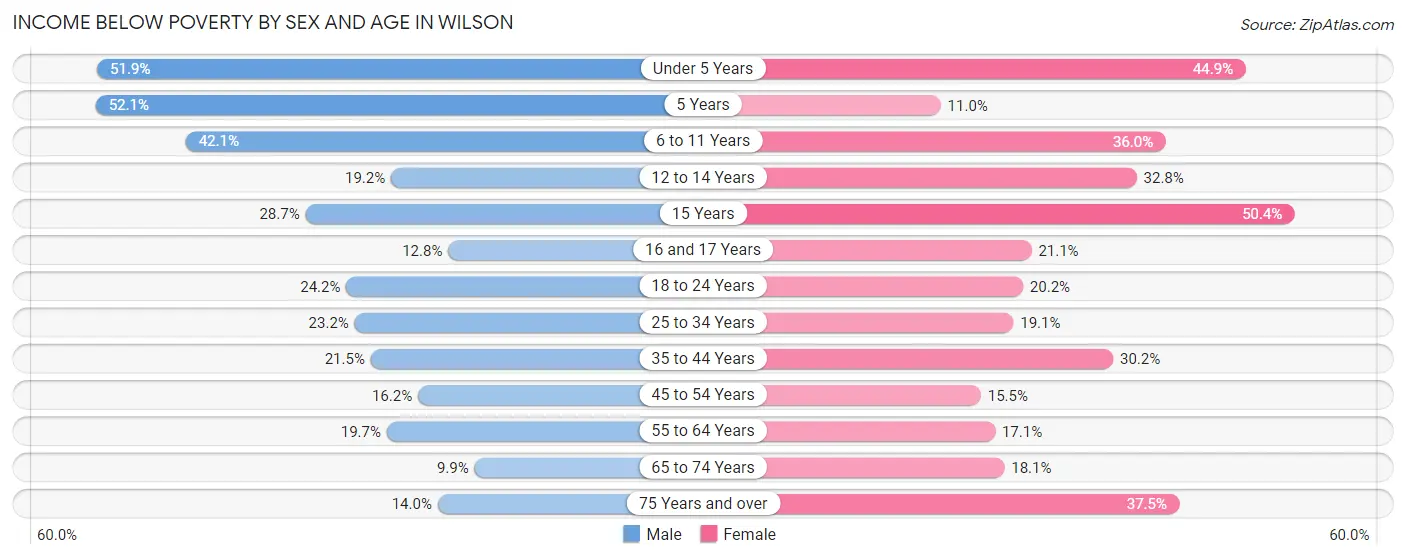
Income Below Poverty by Sex and Age in Wilson
With 23.4% poverty level for males and 24.4% for females among the residents of Wilson, 5 year old males and 15 year old females are the most vulnerable to poverty, with 213 males (52.1%) and 198 females (50.4%) in their respective age groups living below the poverty level.
| Age Bracket | Male | Female |
| Under 5 Years | 715 (51.9%) | 550 (44.9%) |
| 5 Years | 213 (52.1%) | 25 (11.0%) |
| 6 to 11 Years | 704 (42.0%) | 684 (36.0%) |
| 12 to 14 Years | 217 (19.2%) | 369 (32.8%) |
| 15 Years | 85 (28.7%) | 198 (50.4%) |
| 16 and 17 Years | 55 (12.8%) | 117 (21.1%) |
| 18 to 24 Years | 520 (24.2%) | 400 (20.2%) |
| 25 to 34 Years | 567 (23.2%) | 687 (19.1%) |
| 35 to 44 Years | 547 (21.4%) | 804 (30.2%) |
| 45 to 54 Years | 433 (16.2%) | 513 (15.5%) |
| 55 to 64 Years | 551 (19.7%) | 581 (17.1%) |
| 65 to 74 Years | 232 (9.9%) | 507 (18.1%) |
| 75 Years and over | 154 (14.0%) | 673 (37.5%) |
| Total | 4,993 (23.4%) | 6,108 (24.4%) |
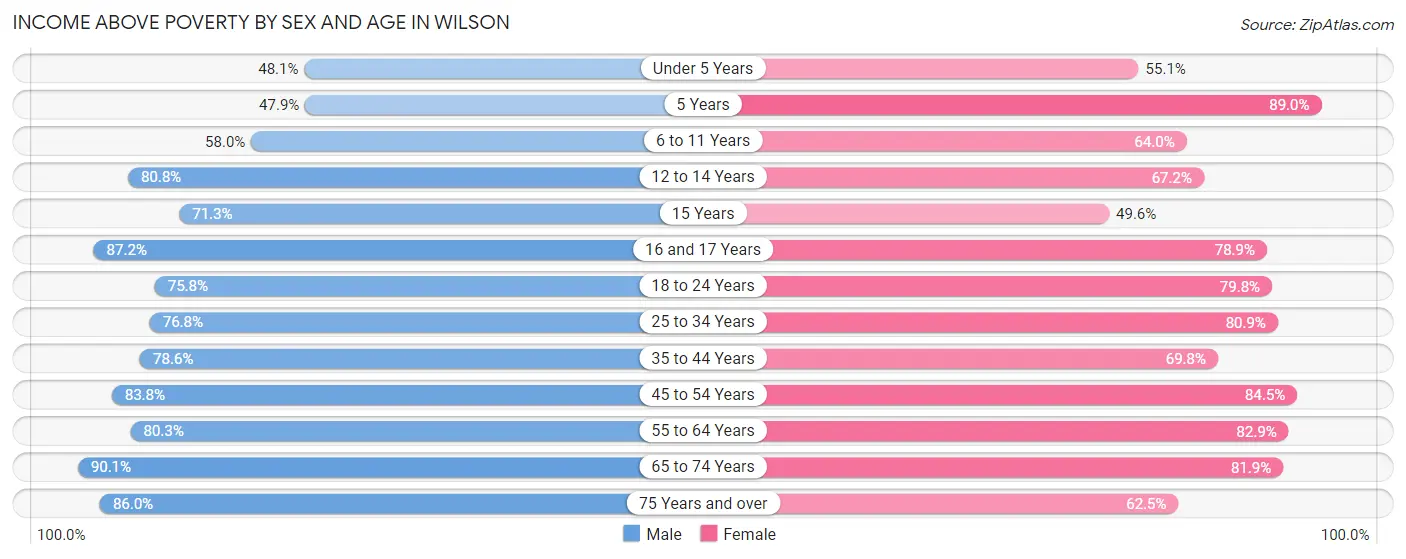
Income Above Poverty by Sex and Age in Wilson
According to the poverty statistics in Wilson, males aged 65 to 74 years and females aged 5 years are the age groups that are most secure financially, with 90.1% of males and 89.0% of females in these age groups living above the poverty line.
| Age Bracket | Male | Female |
| Under 5 Years | 662 (48.1%) | 675 (55.1%) |
| 5 Years | 196 (47.9%) | 202 (89.0%) |
| 6 to 11 Years | 970 (58.0%) | 1,216 (64.0%) |
| 12 to 14 Years | 914 (80.8%) | 755 (67.2%) |
| 15 Years | 211 (71.3%) | 195 (49.6%) |
| 16 and 17 Years | 374 (87.2%) | 437 (78.9%) |
| 18 to 24 Years | 1,631 (75.8%) | 1,583 (79.8%) |
| 25 to 34 Years | 1,873 (76.8%) | 2,910 (80.9%) |
| 35 to 44 Years | 2,003 (78.5%) | 1,857 (69.8%) |
| 45 to 54 Years | 2,241 (83.8%) | 2,801 (84.5%) |
| 55 to 64 Years | 2,252 (80.3%) | 2,824 (82.9%) |
| 65 to 74 Years | 2,114 (90.1%) | 2,294 (81.9%) |
| 75 Years and over | 947 (86.0%) | 1,120 (62.5%) |
| Total | 16,388 (76.6%) | 18,869 (75.5%) |
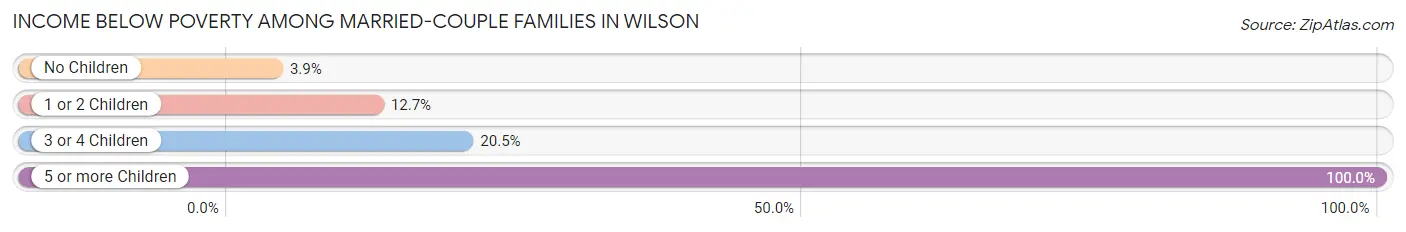
Income Below Poverty Among Married-Couple Families in Wilson
The poverty statistics for married-couple families in Wilson show that 8.3% or 608 of the total 7,348 families live below the poverty line. Families with 5 or more children have the highest poverty rate of 100.0%, comprising of 8 families. On the other hand, families with no children have the lowest poverty rate of 3.9%, which includes 169 families.
| Children | Above Poverty | Below Poverty |
| No Children | 4,152 (96.1%) | 169 (3.9%) |
| 1 or 2 Children | 2,103 (87.3%) | 306 (12.7%) |
| 3 or 4 Children | 485 (79.5%) | 125 (20.5%) |
| 5 or more Children | 0 (0.0%) | 8 (100.0%) |
| Total | 6,740 (91.7%) | 608 (8.3%) |
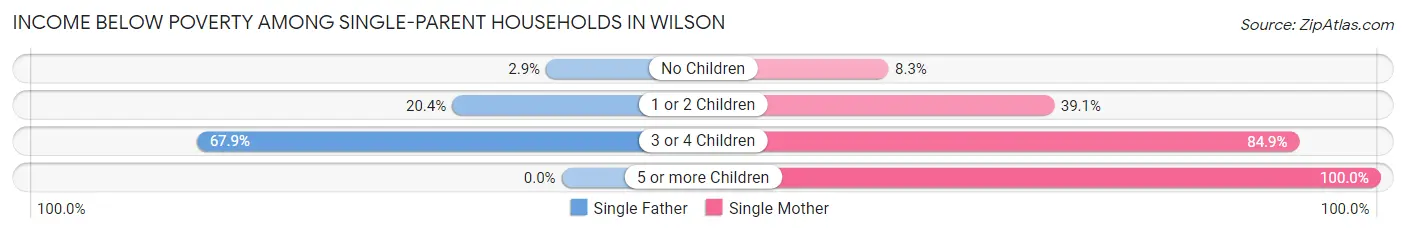
Income Below Poverty Among Single-Parent Households in Wilson
According to the poverty data in Wilson, 17.4% or 168 single-father households and 36.7% or 1,139 single-mother households are living below the poverty line. Among single-father households, those with 3 or 4 children have the highest poverty rate, with 89 households (67.9%) experiencing poverty. Likewise, among single-mother households, those with 5 or more children have the highest poverty rate, with 93 households (100.0%) falling below the poverty line.
| Children | Single Father | Single Mother |
| No Children | 15 (2.9%) | 74 (8.3%) |
| 1 or 2 Children | 64 (20.4%) | 703 (39.1%) |
| 3 or 4 Children | 89 (67.9%) | 269 (84.9%) |
| 5 or more Children | 0 (0.0%) | 93 (100.0%) |
| Total | 168 (17.4%) | 1,139 (36.7%) |
Income Below Poverty Among Married-Couple vs Single-Parent Households in Wilson
The poverty data for Wilson shows that 608 of the married-couple family households (8.3%) and 1,307 of the single-parent households (32.2%) are living below the poverty level. Within the married-couple family households, those with 5 or more children have the highest poverty rate, with 8 households (100.0%) falling below the poverty line. Among the single-parent households, those with 5 or more children have the highest poverty rate, with 93 household (100.0%) living below poverty.
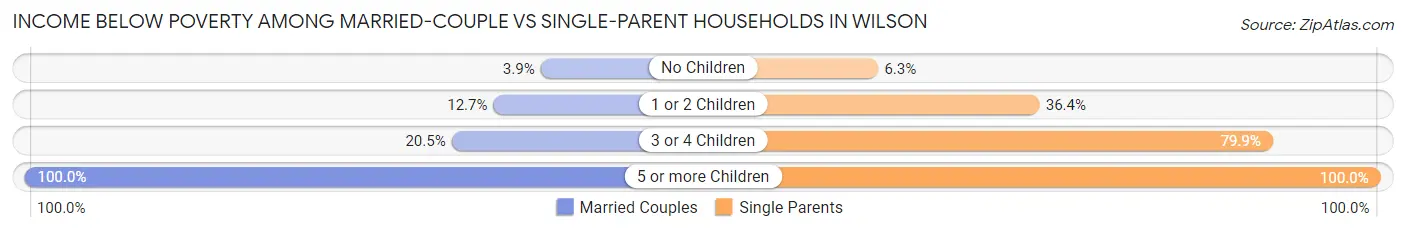
| Children | Married-Couple Families | Single-Parent Households |
| No Children | 169 (3.9%) | 89 (6.3%) |
| 1 or 2 Children | 306 (12.7%) | 767 (36.3%) |
| 3 or 4 Children | 125 (20.5%) | 358 (79.9%) |
| 5 or more Children | 8 (100.0%) | 93 (100.0%) |
| Total | 608 (8.3%) | 1,307 (32.2%) |
Employment Characteristics in Wilson
Employment by Class of Employer in Wilson
Among the 20,605 employed individuals in Wilson, private company employees (15,052 | 73.1%), not-for-profit organizations (1,618 | 7.9%), and state government employees (1,088 | 5.3%) make up the most common classes of employment.
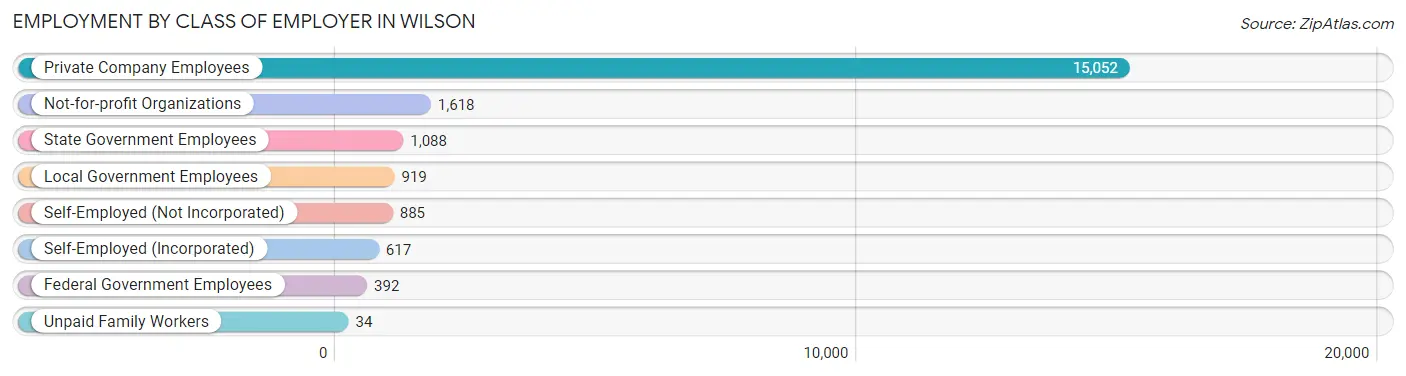
| Employer Class | # Employees | % Employees |
| Private Company Employees | 15,052 | 73.1% |
| Self-Employed (Incorporated) | 617 | 3.0% |
| Self-Employed (Not Incorporated) | 885 | 4.3% |
| Not-for-profit Organizations | 1,618 | 7.9% |
| Local Government Employees | 919 | 4.5% |
| State Government Employees | 1,088 | 5.3% |
| Federal Government Employees | 392 | 1.9% |
| Unpaid Family Workers | 34 | 0.2% |
| Total | 20,605 | 100.0% |
Employment Status by Age in Wilson
According to the labor force statistics for Wilson, out of the total population over 16 years of age (37,861), 60.1% or 22,754 individuals are in the labor force, with 8.4% or 1,911 of them unemployed. The age group with the highest labor force participation rate is 20 to 24 years, with 81.6% or 2,597 individuals in the labor force. Within the labor force, the 16 to 19 years age range has the highest percentage of unemployed individuals, with 19.0% or 193 of them being unemployed.
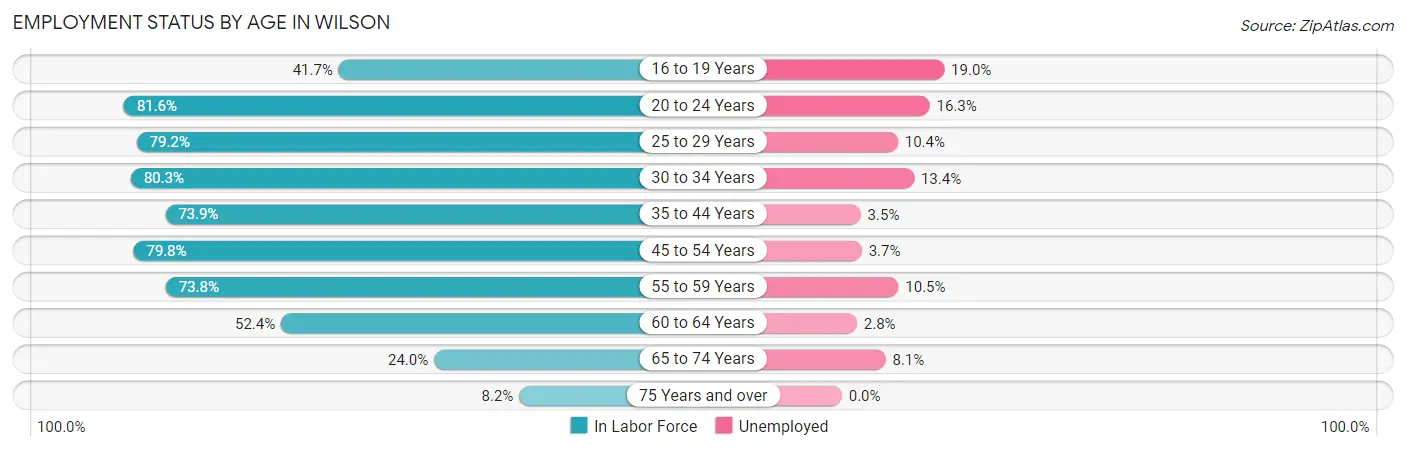
| Age Bracket | In Labor Force | Unemployed |
| 16 to 19 Years | 1,014 (41.7%) | 193 (19.0%) |
| 20 to 24 Years | 2,597 (81.6%) | 423 (16.3%) |
| 25 to 29 Years | 2,486 (79.2%) | 259 (10.4%) |
| 30 to 34 Years | 2,393 (80.3%) | 321 (13.4%) |
| 35 to 44 Years | 3,883 (73.9%) | 136 (3.5%) |
| 45 to 54 Years | 4,852 (79.8%) | 180 (3.7%) |
| 55 to 59 Years | 2,511 (73.8%) | 264 (10.5%) |
| 60 to 64 Years | 1,508 (52.4%) | 42 (2.8%) |
| 65 to 74 Years | 1,257 (24.0%) | 102 (8.1%) |
| 75 Years and over | 269 (8.2%) | 0 (0.0%) |
| Total | 22,754 (60.1%) | 1,911 (8.4%) |
Employment Status by Educational Attainment in Wilson
According to labor force statistics for Wilson, 74.3% of individuals (17,634) out of the total population between 25 and 64 years of age (23,733) are in the labor force, with 6.8% or 1,199 of them being unemployed. The group with the highest labor force participation rate are those with the educational attainment of bachelor's degree or higher, with 85.0% or 4,542 individuals in the labor force. Within the labor force, individuals with high school diploma education have the highest percentage of unemployment, with 14.9% or 736 of them being unemployed.
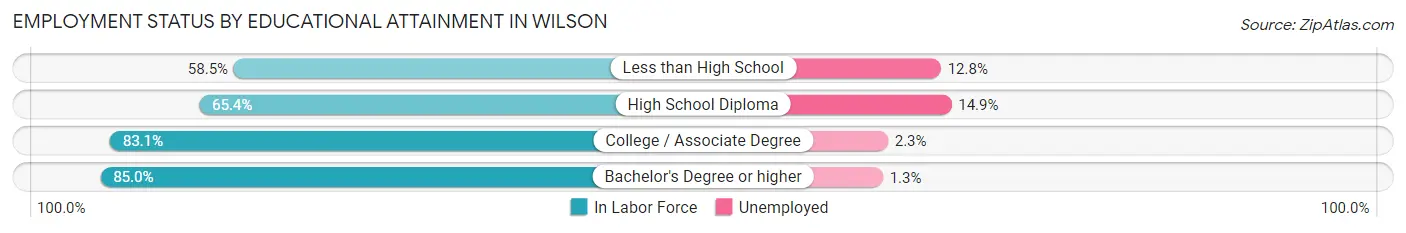
| Educational Attainment | In Labor Force | Unemployed |
| Less than High School | 2,033 (58.5%) | 445 (12.8%) |
| High School Diploma | 4,938 (65.4%) | 1,125 (14.9%) |
| College / Associate Degree | 6,119 (83.1%) | 169 (2.3%) |
| Bachelor's Degree or higher | 4,542 (85.0%) | 69 (1.3%) |
| Total | 17,634 (74.3%) | 1,614 (6.8%) |
Employment Occupations by Sex in Wilson
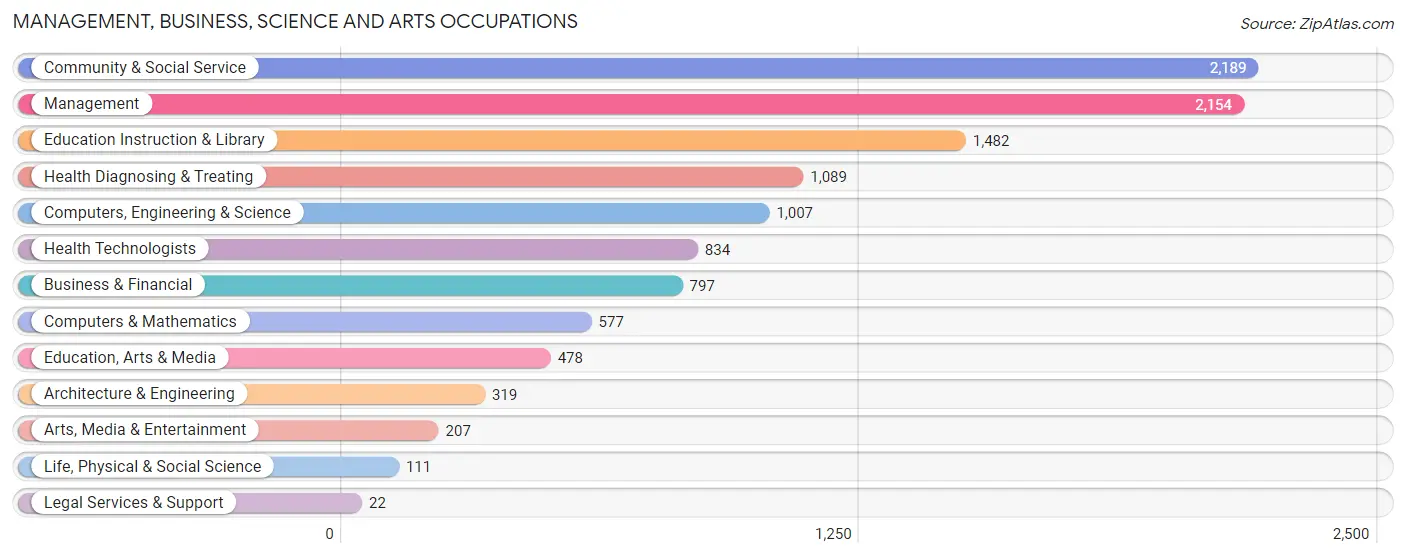
Management, Business, Science and Arts Occupations
The most common Management, Business, Science and Arts occupations in Wilson are Community & Social Service (2,189 | 10.5%), Management (2,154 | 10.4%), Education Instruction & Library (1,482 | 7.1%), Health Diagnosing & Treating (1,089 | 5.2%), and Computers, Engineering & Science (1,007 | 4.9%).
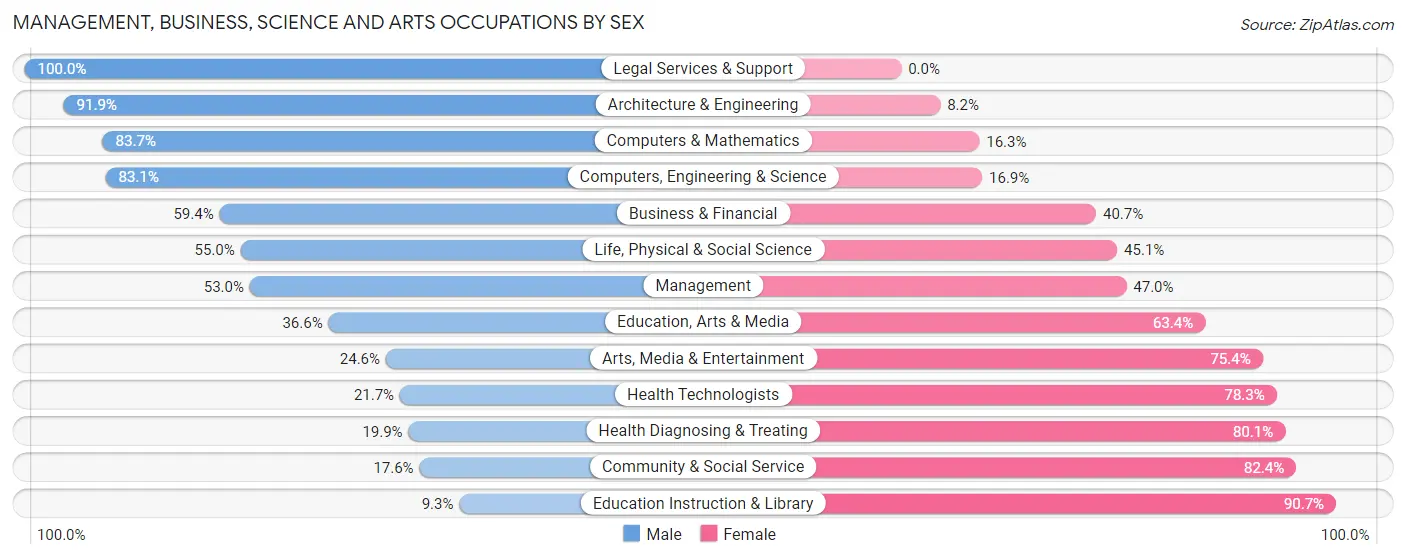
Management, Business, Science and Arts Occupations by Sex
Within the Management, Business, Science and Arts occupations in Wilson, the most male-oriented occupations are Legal Services & Support (100.0%), Architecture & Engineering (91.8%), and Computers & Mathematics (83.7%), while the most female-oriented occupations are Education Instruction & Library (90.7%), Community & Social Service (82.4%), and Health Diagnosing & Treating (80.1%).
| Occupation | Male | Female |
| Management | 1,142 (53.0%) | 1,012 (47.0%) |
| Business & Financial | 473 (59.4%) | 324 (40.6%) |
| Computers, Engineering & Science | 837 (83.1%) | 170 (16.9%) |
| Computers & Mathematics | 483 (83.7%) | 94 (16.3%) |
| Architecture & Engineering | 293 (91.8%) | 26 (8.2%) |
| Life, Physical & Social Science | 61 (54.9%) | 50 (45.1%) |
| Community & Social Service | 386 (17.6%) | 1,803 (82.4%) |
| Education, Arts & Media | 175 (36.6%) | 303 (63.4%) |
| Legal Services & Support | 22 (100.0%) | 0 (0.0%) |
| Education Instruction & Library | 138 (9.3%) | 1,344 (90.7%) |
| Arts, Media & Entertainment | 51 (24.6%) | 156 (75.4%) |
| Health Diagnosing & Treating | 217 (19.9%) | 872 (80.1%) |
| Health Technologists | 181 (21.7%) | 653 (78.3%) |
| Total (Category) | 3,055 (42.2%) | 4,181 (57.8%) |
| Total (Overall) | 9,895 (47.7%) | 10,846 (52.3%) |
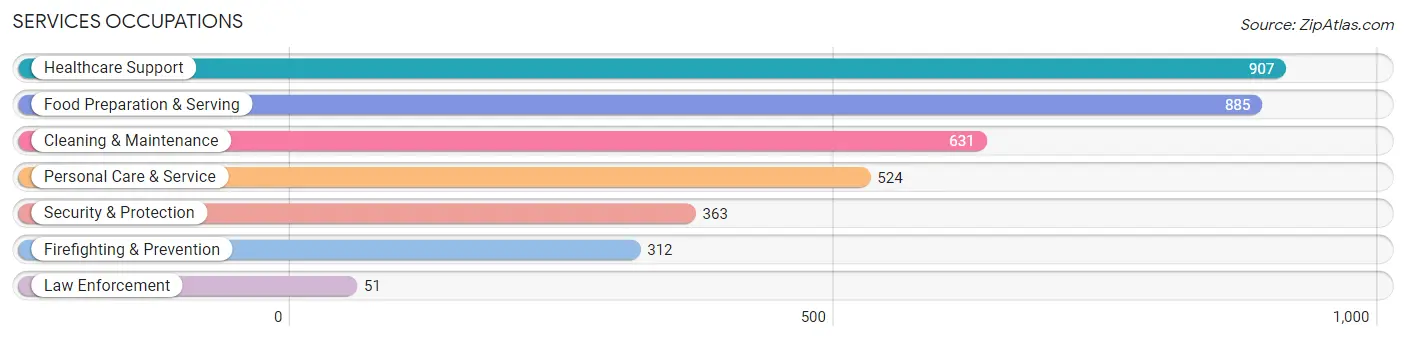
Services Occupations
The most common Services occupations in Wilson are Healthcare Support (907 | 4.4%), Food Preparation & Serving (885 | 4.3%), Cleaning & Maintenance (631 | 3.0%), Personal Care & Service (524 | 2.5%), and Security & Protection (363 | 1.8%).
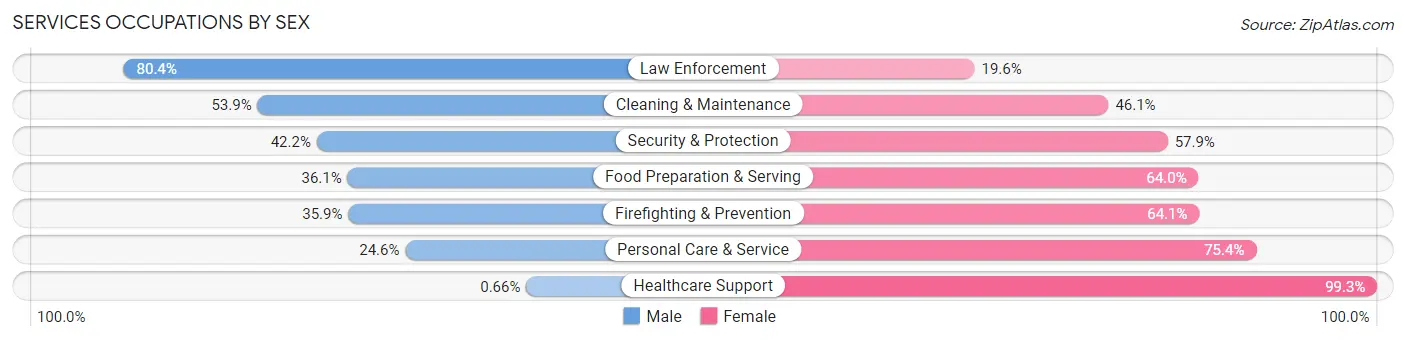
Services Occupations by Sex
Within the Services occupations in Wilson, the most male-oriented occupations are Law Enforcement (80.4%), Cleaning & Maintenance (53.9%), and Security & Protection (42.1%), while the most female-oriented occupations are Healthcare Support (99.3%), Personal Care & Service (75.4%), and Firefighting & Prevention (64.1%).
| Occupation | Male | Female |
| Healthcare Support | 6 (0.7%) | 901 (99.3%) |
| Security & Protection | 153 (42.1%) | 210 (57.9%) |
| Firefighting & Prevention | 112 (35.9%) | 200 (64.1%) |
| Law Enforcement | 41 (80.4%) | 10 (19.6%) |
| Food Preparation & Serving | 319 (36.0%) | 566 (63.9%) |
| Cleaning & Maintenance | 340 (53.9%) | 291 (46.1%) |
| Personal Care & Service | 129 (24.6%) | 395 (75.4%) |
| Total (Category) | 947 (28.6%) | 2,363 (71.4%) |
| Total (Overall) | 9,895 (47.7%) | 10,846 (52.3%) |
Sales and Office Occupations
The most common Sales and Office occupations in Wilson are Sales & Related (2,141 | 10.3%), and Office & Administration (1,813 | 8.7%).
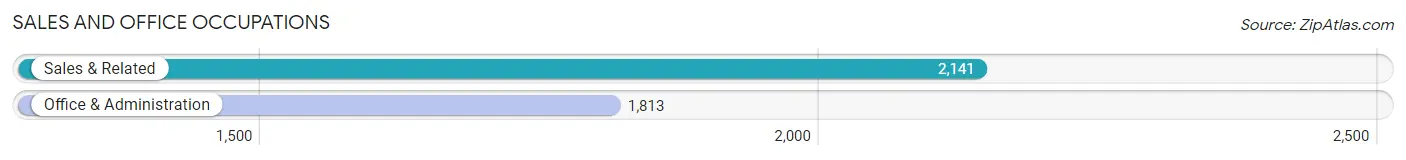
Sales and Office Occupations by Sex
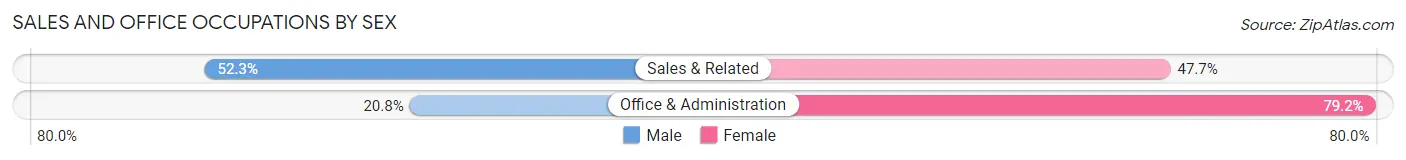
| Occupation | Male | Female |
| Sales & Related | 1,120 (52.3%) | 1,021 (47.7%) |
| Office & Administration | 377 (20.8%) | 1,436 (79.2%) |
| Total (Category) | 1,497 (37.9%) | 2,457 (62.1%) |
| Total (Overall) | 9,895 (47.7%) | 10,846 (52.3%) |
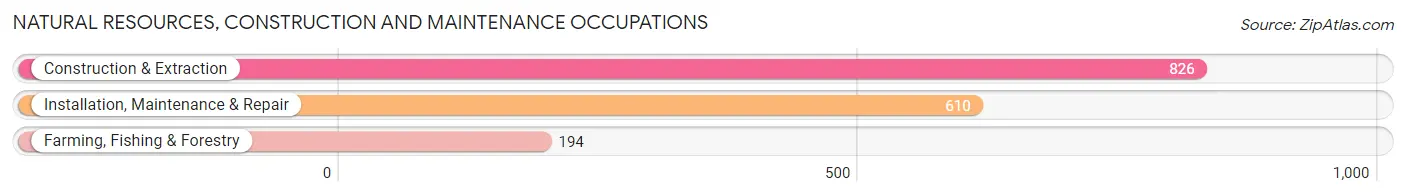
Natural Resources, Construction and Maintenance Occupations
The most common Natural Resources, Construction and Maintenance occupations in Wilson are Construction & Extraction (826 | 4.0%), Installation, Maintenance & Repair (610 | 2.9%), and Farming, Fishing & Forestry (194 | 0.9%).
Natural Resources, Construction and Maintenance Occupations by Sex
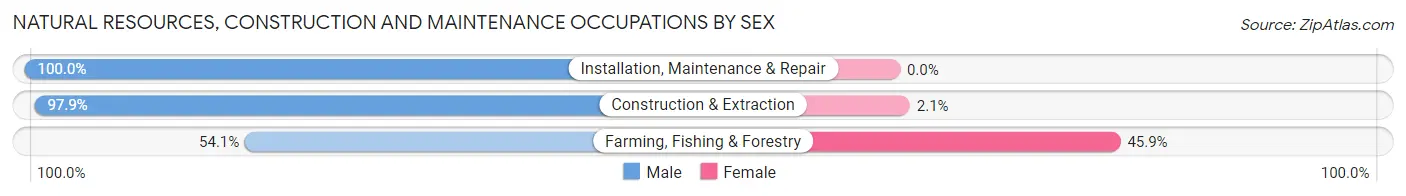
| Occupation | Male | Female |
| Farming, Fishing & Forestry | 105 (54.1%) | 89 (45.9%) |
| Construction & Extraction | 809 (97.9%) | 17 (2.1%) |
| Installation, Maintenance & Repair | 610 (100.0%) | 0 (0.0%) |
| Total (Category) | 1,524 (93.5%) | 106 (6.5%) |
| Total (Overall) | 9,895 (47.7%) | 10,846 (52.3%) |
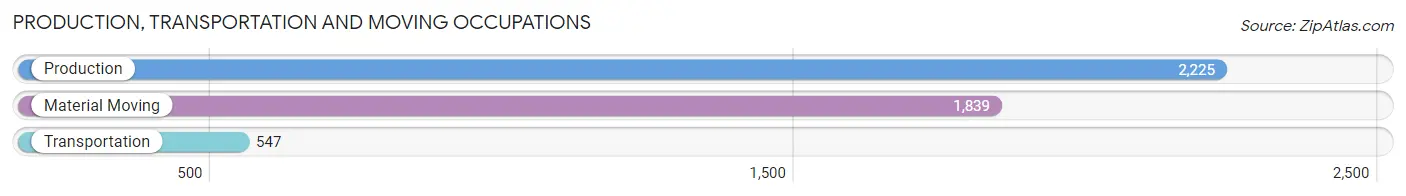
Production, Transportation and Moving Occupations
The most common Production, Transportation and Moving occupations in Wilson are Production (2,225 | 10.7%), Material Moving (1,839 | 8.9%), and Transportation (547 | 2.6%).
Production, Transportation and Moving Occupations by Sex
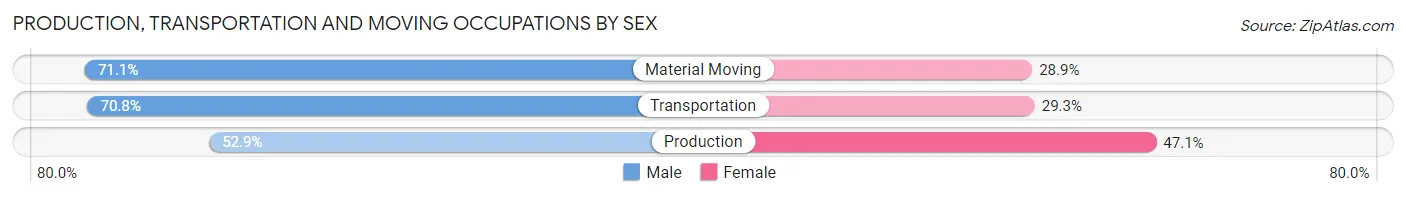
| Occupation | Male | Female |
| Production | 1,177 (52.9%) | 1,048 (47.1%) |
| Transportation | 387 (70.8%) | 160 (29.2%) |
| Material Moving | 1,308 (71.1%) | 531 (28.9%) |
| Total (Category) | 2,872 (62.3%) | 1,739 (37.7%) |
| Total (Overall) | 9,895 (47.7%) | 10,846 (52.3%) |
Employment Industries by Sex in Wilson
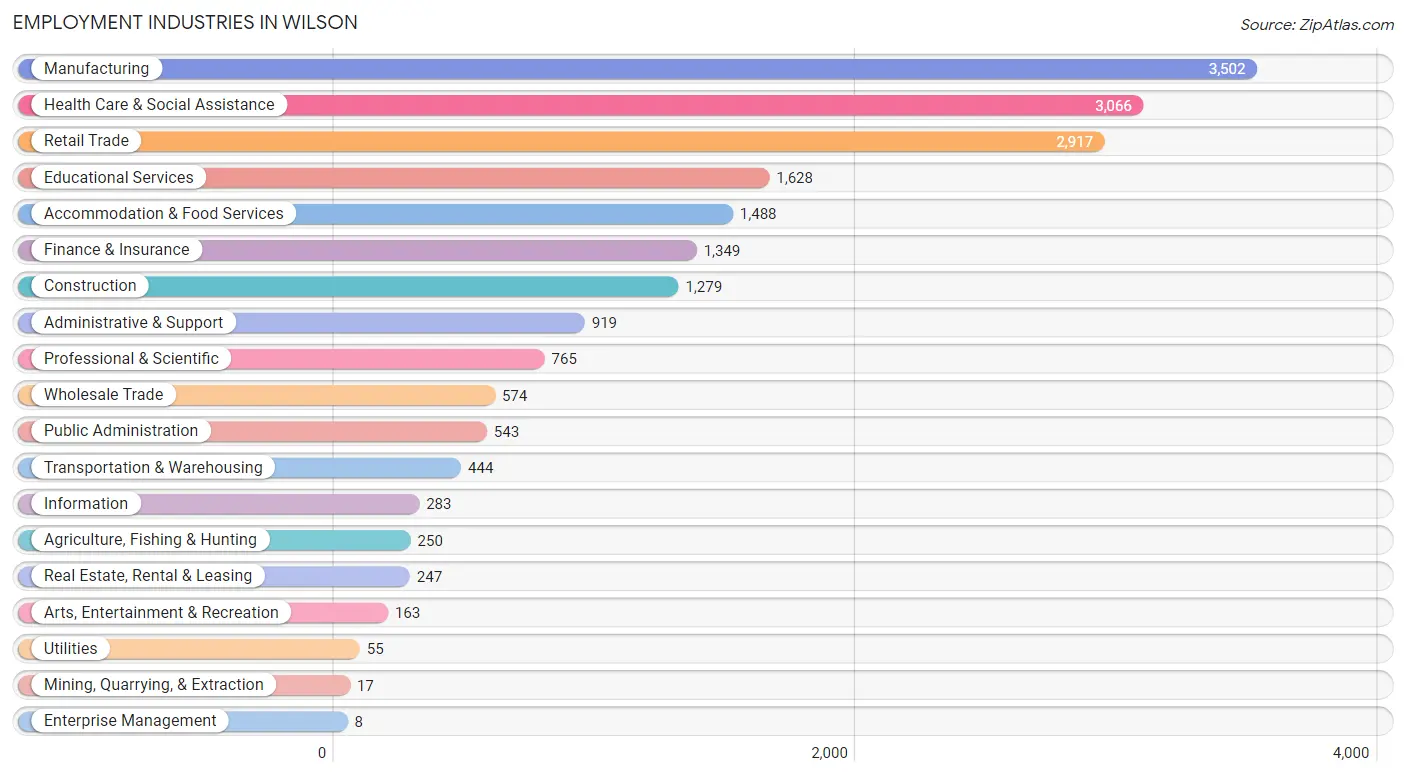
Employment Industries in Wilson
The major employment industries in Wilson include Manufacturing (3,502 | 16.9%), Health Care & Social Assistance (3,066 | 14.8%), Retail Trade (2,917 | 14.1%), Educational Services (1,628 | 7.9%), and Accommodation & Food Services (1,488 | 7.2%).
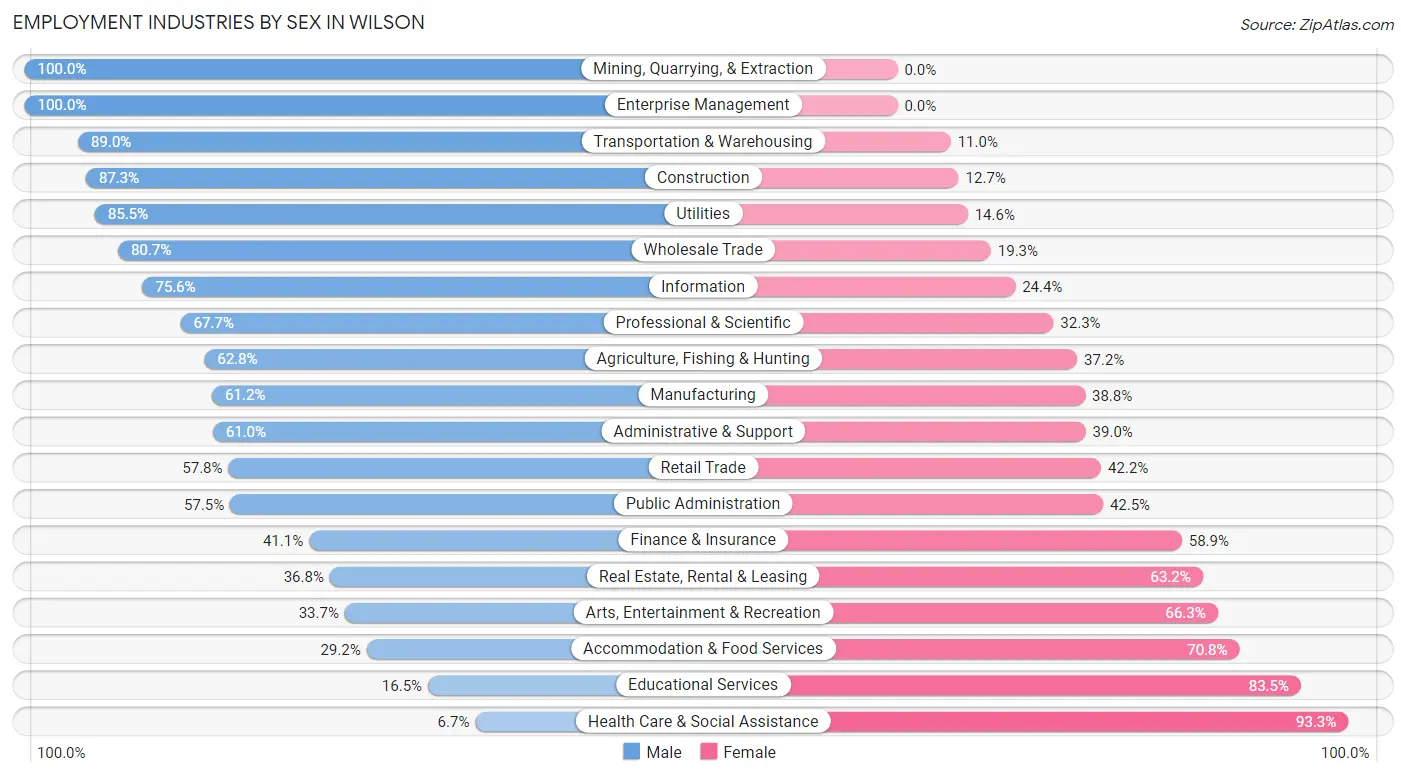
Employment Industries by Sex in Wilson
The Wilson industries that see more men than women are Mining, Quarrying, & Extraction (100.0%), Enterprise Management (100.0%), and Transportation & Warehousing (89.0%), whereas the industries that tend to have a higher number of women are Health Care & Social Assistance (93.3%), Educational Services (83.5%), and Accommodation & Food Services (70.8%).
| Industry | Male | Female |
| Agriculture, Fishing & Hunting | 157 (62.8%) | 93 (37.2%) |
| Mining, Quarrying, & Extraction | 17 (100.0%) | 0 (0.0%) |
| Construction | 1,117 (87.3%) | 162 (12.7%) |
| Manufacturing | 2,142 (61.2%) | 1,360 (38.8%) |
| Wholesale Trade | 463 (80.7%) | 111 (19.3%) |
| Retail Trade | 1,687 (57.8%) | 1,230 (42.2%) |
| Transportation & Warehousing | 395 (89.0%) | 49 (11.0%) |
| Utilities | 47 (85.5%) | 8 (14.5%) |
| Information | 214 (75.6%) | 69 (24.4%) |
| Finance & Insurance | 555 (41.1%) | 794 (58.9%) |
| Real Estate, Rental & Leasing | 91 (36.8%) | 156 (63.2%) |
| Professional & Scientific | 518 (67.7%) | 247 (32.3%) |
| Enterprise Management | 8 (100.0%) | 0 (0.0%) |
| Administrative & Support | 561 (61.0%) | 358 (39.0%) |
| Educational Services | 269 (16.5%) | 1,359 (83.5%) |
| Health Care & Social Assistance | 206 (6.7%) | 2,860 (93.3%) |
| Arts, Entertainment & Recreation | 55 (33.7%) | 108 (66.3%) |
| Accommodation & Food Services | 435 (29.2%) | 1,053 (70.8%) |
| Public Administration | 312 (57.5%) | 231 (42.5%) |
| Total | 9,895 (47.7%) | 10,846 (52.3%) |
Education in Wilson
School Enrollment in Wilson
The most common levels of schooling among the 11,275 students in Wilson are middle school (2,955 | 26.2%), elementary school (2,422 | 21.5%), and college / undergraduate (2,350 | 20.8%).
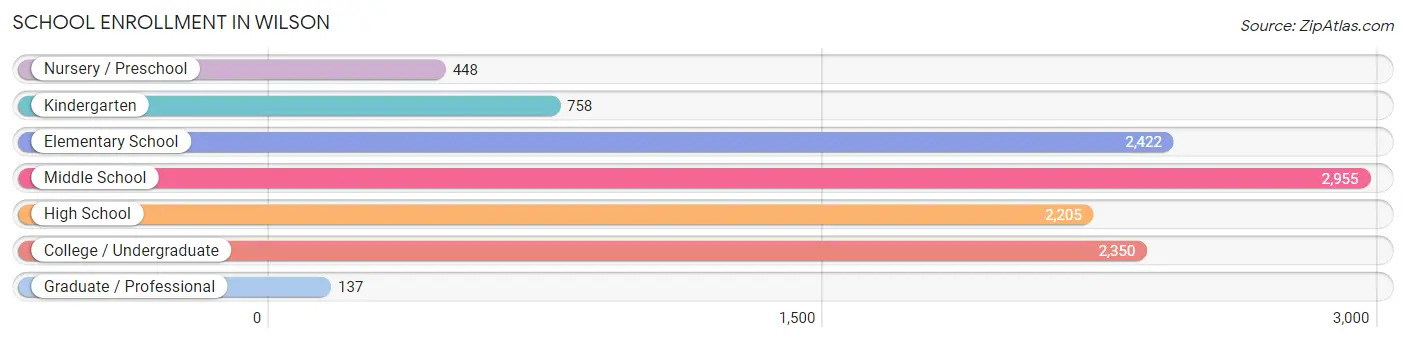
| School Level | # Students | % Students |
| Nursery / Preschool | 448 | 4.0% |
| Kindergarten | 758 | 6.7% |
| Elementary School | 2,422 | 21.5% |
| Middle School | 2,955 | 26.2% |
| High School | 2,205 | 19.6% |
| College / Undergraduate | 2,350 | 20.8% |
| Graduate / Professional | 137 | 1.2% |
| Total | 11,275 | 100.0% |
School Enrollment by Age by Funding Source in Wilson
Out of a total of 11,275 students who are enrolled in schools in Wilson, 2,063 (18.3%) attend a private institution, while the remaining 9,212 (81.7%) are enrolled in public schools. The age group of 20 to 24 year olds has the highest likelihood of being enrolled in private schools, with 471 (56.8% in the age bracket) enrolled. Conversely, the age group of 25 to 34 year olds has the lowest likelihood of being enrolled in a private school, with 665 (96.8% in the age bracket) attending a public institution.
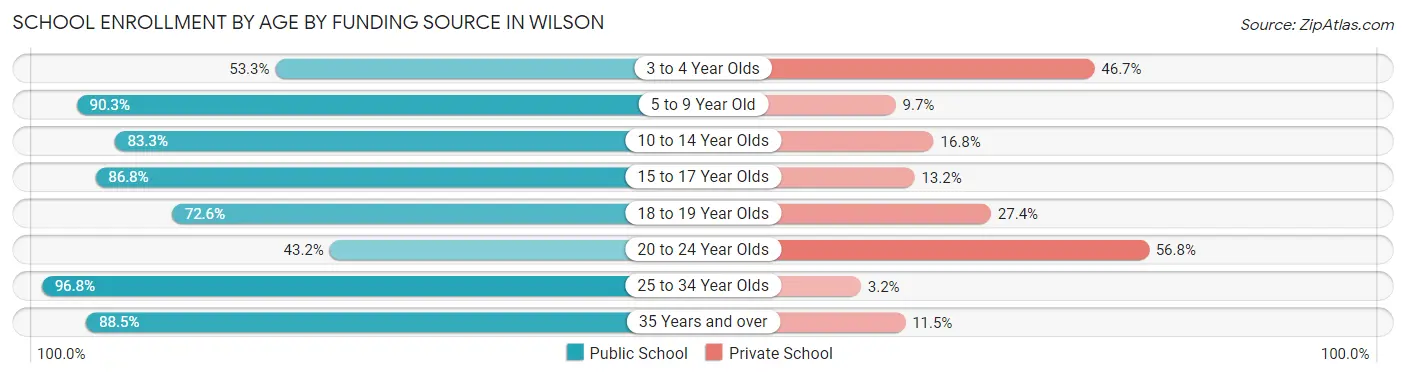
| Age Bracket | Public School | Private School |
| 3 to 4 Year Olds | 194 (53.3%) | 170 (46.7%) |
| 5 to 9 Year Old | 2,546 (90.3%) | 273 (9.7%) |
| 10 to 14 Year Olds | 2,972 (83.3%) | 598 (16.8%) |
| 15 to 17 Year Olds | 1,415 (86.8%) | 215 (13.2%) |
| 18 to 19 Year Olds | 701 (72.6%) | 265 (27.4%) |
| 20 to 24 Year Olds | 358 (43.2%) | 471 (56.8%) |
| 25 to 34 Year Olds | 665 (96.8%) | 22 (3.2%) |
| 35 Years and over | 363 (88.5%) | 47 (11.5%) |
| Total | 9,212 (81.7%) | 2,063 (18.3%) |
Educational Attainment by Field of Study in Wilson
Business (1,596 | 20.2%), education (1,207 | 15.3%), science & technology (648 | 8.2%), arts & humanities (623 | 7.9%), and social sciences (558 | 7.1%) are the most common fields of study among 7,897 individuals in Wilson who have obtained a bachelor's degree or higher.
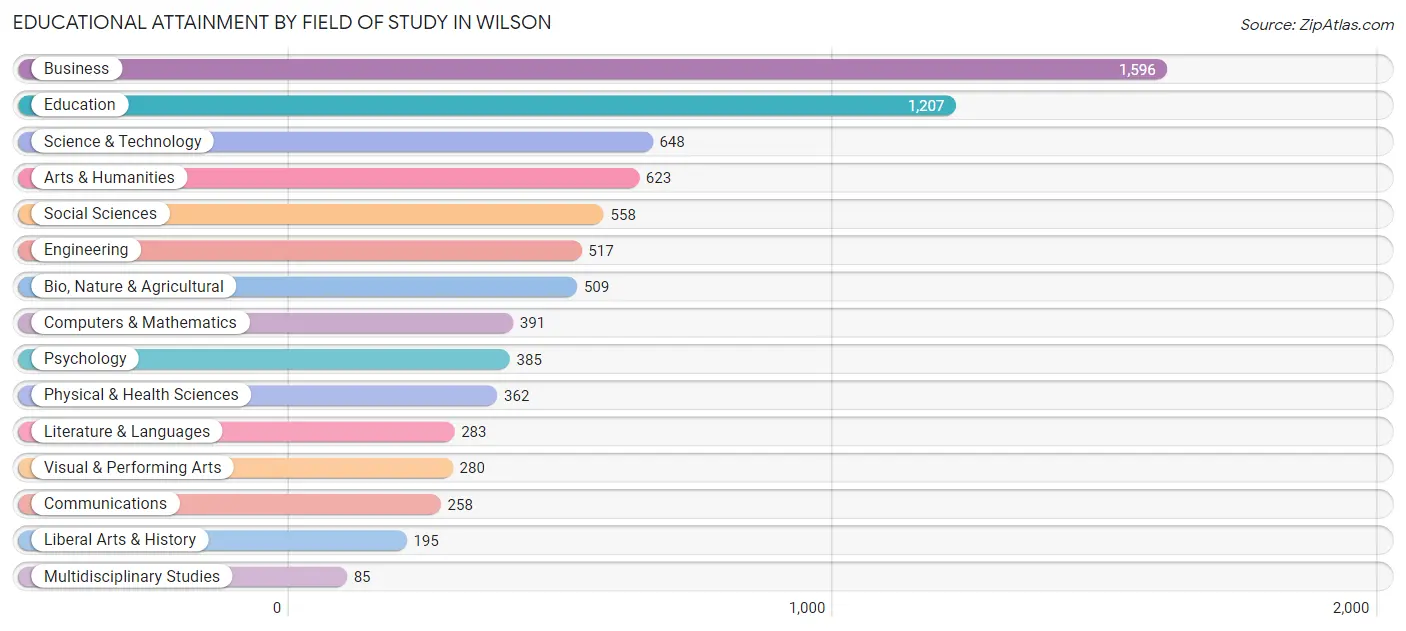
| Field of Study | # Graduates | % Graduates |
| Computers & Mathematics | 391 | 5.0% |
| Bio, Nature & Agricultural | 509 | 6.5% |
| Physical & Health Sciences | 362 | 4.6% |
| Psychology | 385 | 4.9% |
| Social Sciences | 558 | 7.1% |
| Engineering | 517 | 6.6% |
| Multidisciplinary Studies | 85 | 1.1% |
| Science & Technology | 648 | 8.2% |
| Business | 1,596 | 20.2% |
| Education | 1,207 | 15.3% |
| Literature & Languages | 283 | 3.6% |
| Liberal Arts & History | 195 | 2.5% |
| Visual & Performing Arts | 280 | 3.5% |
| Communications | 258 | 3.3% |
| Arts & Humanities | 623 | 7.9% |
| Total | 7,897 | 100.0% |
Transportation & Commute in Wilson
Vehicle Availability by Sex in Wilson
The most prevalent vehicle ownership categories in Wilson are males with 2 vehicles (3,778, accounting for 38.1%) and females with 2 vehicles (3,417, making up 35.7%).
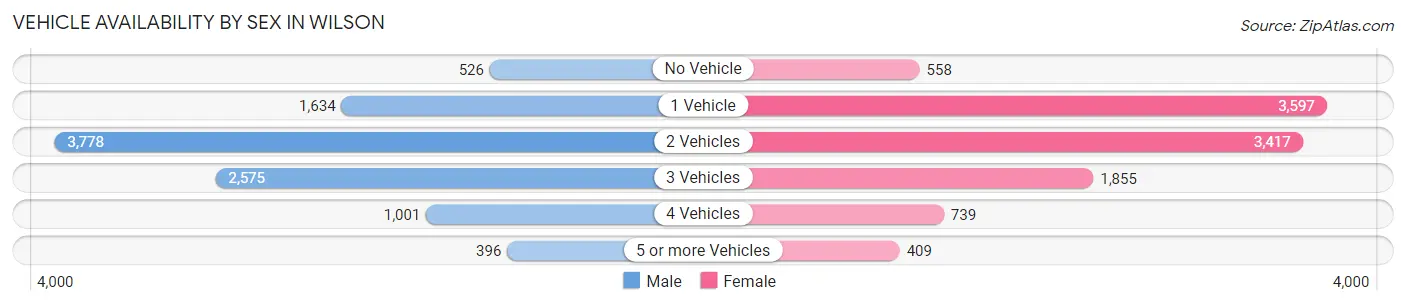
| Vehicles Available | Male | Female |
| No Vehicle | 526 (5.3%) | 558 (5.3%) |
| 1 Vehicle | 1,634 (16.5%) | 3,597 (34.0%) |
| 2 Vehicles | 3,778 (38.1%) | 3,417 (32.3%) |
| 3 Vehicles | 2,575 (26.0%) | 1,855 (17.5%) |
| 4 Vehicles | 1,001 (10.1%) | 739 (7.0%) |
| 5 or more Vehicles | 396 (4.0%) | 409 (3.9%) |
| Total | 9,910 (100.0%) | 10,575 (100.0%) |
Commute Time in Wilson
The most frequently occuring commute durations in Wilson are 10 to 14 minutes (4,801 commuters, 24.5%), 15 to 19 minutes (3,560 commuters, 18.2%), and 5 to 9 minutes (3,250 commuters, 16.6%).
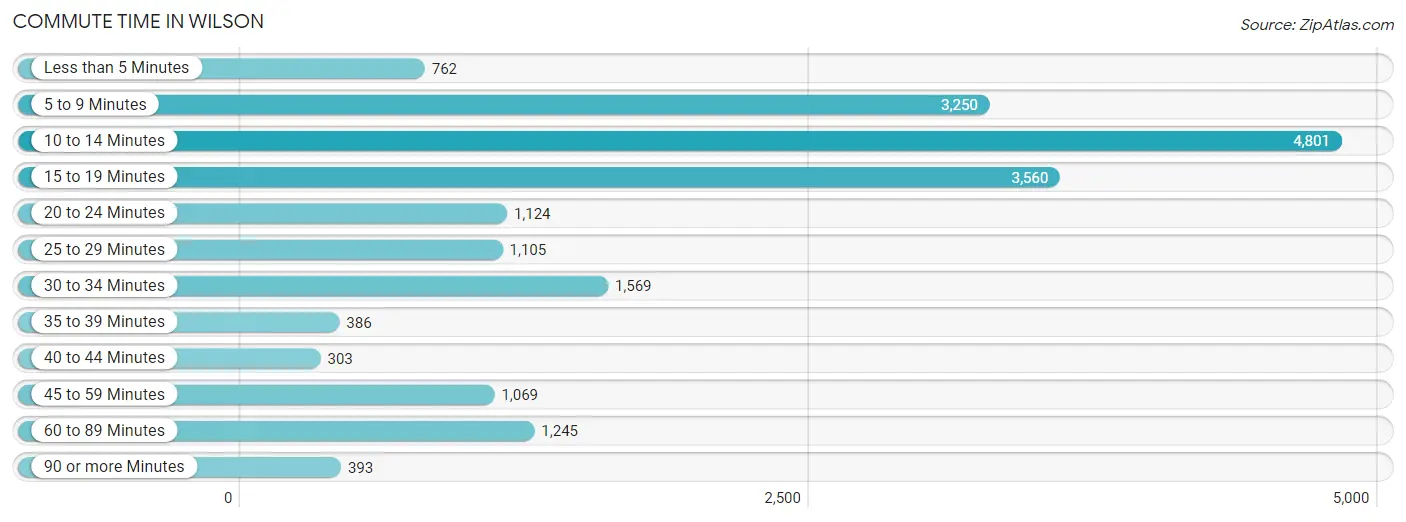
| Commute Time | # Commuters | % Commuters |
| Less than 5 Minutes | 762 | 3.9% |
| 5 to 9 Minutes | 3,250 | 16.6% |
| 10 to 14 Minutes | 4,801 | 24.5% |
| 15 to 19 Minutes | 3,560 | 18.2% |
| 20 to 24 Minutes | 1,124 | 5.7% |
| 25 to 29 Minutes | 1,105 | 5.7% |
| 30 to 34 Minutes | 1,569 | 8.0% |
| 35 to 39 Minutes | 386 | 2.0% |
| 40 to 44 Minutes | 303 | 1.5% |
| 45 to 59 Minutes | 1,069 | 5.5% |
| 60 to 89 Minutes | 1,245 | 6.4% |
| 90 or more Minutes | 393 | 2.0% |
Commute Time by Sex in Wilson
The most common commute times in Wilson are 15 to 19 minutes (1,871 commuters, 19.8%) for males and 10 to 14 minutes (2,933 commuters, 29.0%) for females.
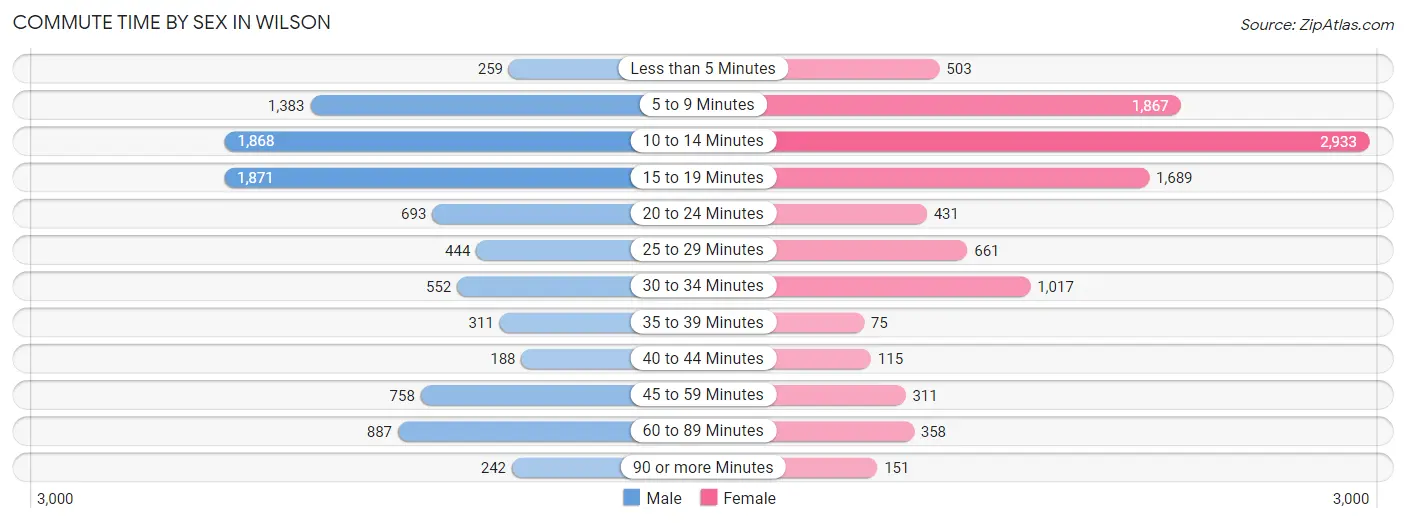
| Commute Time | Male | Female |
| Less than 5 Minutes | 259 (2.7%) | 503 (5.0%) |
| 5 to 9 Minutes | 1,383 (14.6%) | 1,867 (18.5%) |
| 10 to 14 Minutes | 1,868 (19.8%) | 2,933 (29.0%) |
| 15 to 19 Minutes | 1,871 (19.8%) | 1,689 (16.7%) |
| 20 to 24 Minutes | 693 (7.3%) | 431 (4.3%) |
| 25 to 29 Minutes | 444 (4.7%) | 661 (6.5%) |
| 30 to 34 Minutes | 552 (5.8%) | 1,017 (10.1%) |
| 35 to 39 Minutes | 311 (3.3%) | 75 (0.7%) |
| 40 to 44 Minutes | 188 (2.0%) | 115 (1.1%) |
| 45 to 59 Minutes | 758 (8.0%) | 311 (3.1%) |
| 60 to 89 Minutes | 887 (9.4%) | 358 (3.5%) |
| 90 or more Minutes | 242 (2.6%) | 151 (1.5%) |
Time of Departure to Work by Sex in Wilson
The most frequent times of departure to work in Wilson are 8:00 AM to 8:29 AM (1,393, 14.7%) for males and 7:30 AM to 7:59 AM (1,504, 14.9%) for females.
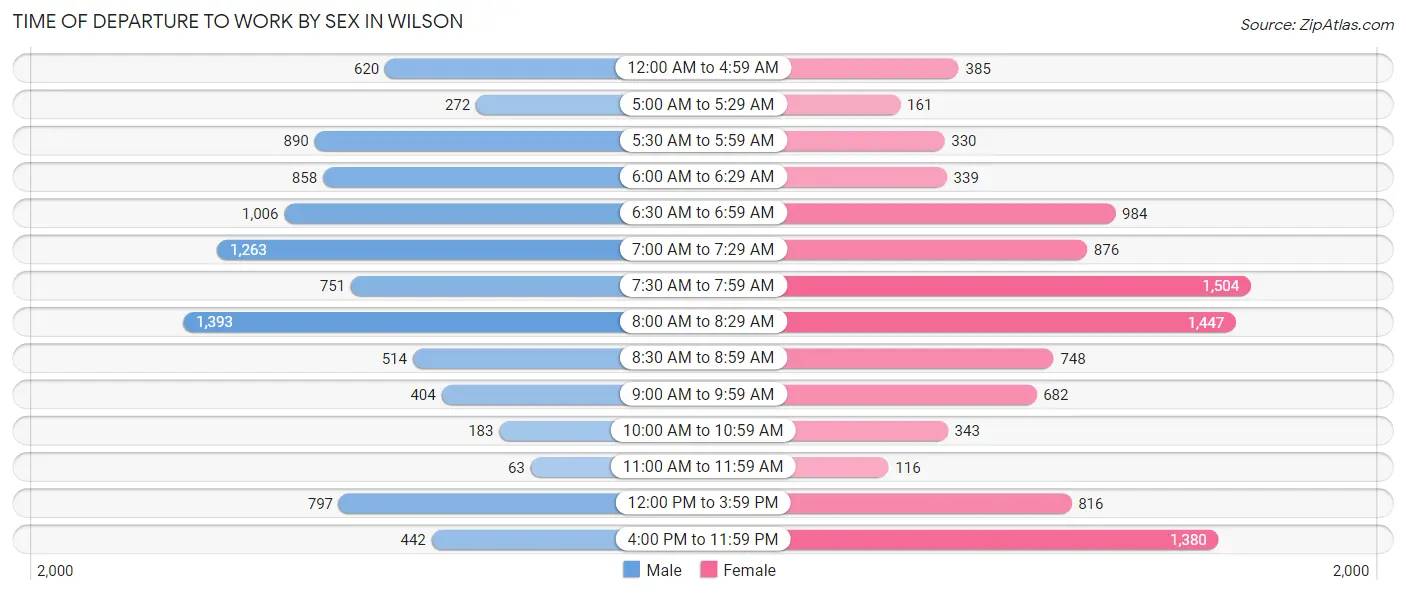
| Time of Departure | Male | Female |
| 12:00 AM to 4:59 AM | 620 (6.6%) | 385 (3.8%) |
| 5:00 AM to 5:29 AM | 272 (2.9%) | 161 (1.6%) |
| 5:30 AM to 5:59 AM | 890 (9.4%) | 330 (3.3%) |
| 6:00 AM to 6:29 AM | 858 (9.1%) | 339 (3.4%) |
| 6:30 AM to 6:59 AM | 1,006 (10.6%) | 984 (9.7%) |
| 7:00 AM to 7:29 AM | 1,263 (13.4%) | 876 (8.7%) |
| 7:30 AM to 7:59 AM | 751 (7.9%) | 1,504 (14.9%) |
| 8:00 AM to 8:29 AM | 1,393 (14.7%) | 1,447 (14.3%) |
| 8:30 AM to 8:59 AM | 514 (5.4%) | 748 (7.4%) |
| 9:00 AM to 9:59 AM | 404 (4.3%) | 682 (6.8%) |
| 10:00 AM to 10:59 AM | 183 (1.9%) | 343 (3.4%) |
| 11:00 AM to 11:59 AM | 63 (0.7%) | 116 (1.1%) |
| 12:00 PM to 3:59 PM | 797 (8.4%) | 816 (8.1%) |
| 4:00 PM to 11:59 PM | 442 (4.7%) | 1,380 (13.7%) |
| Total | 9,456 (100.0%) | 10,111 (100.0%) |
Housing Occupancy in Wilson
Occupancy by Ownership in Wilson
Of the total 19,658 dwellings in Wilson, owner-occupied units account for 9,812 (49.9%), while renter-occupied units make up 9,846 (50.1%).
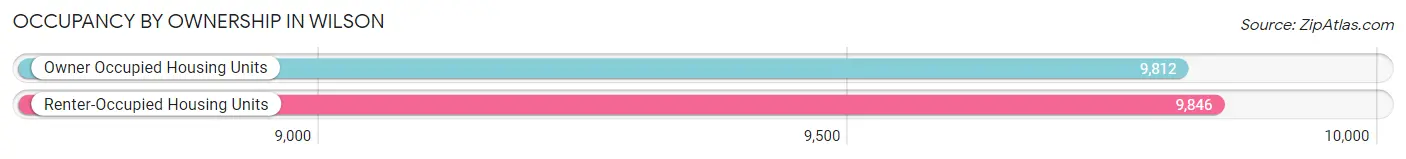
| Occupancy | # Housing Units | % Housing Units |
| Owner Occupied Housing Units | 9,812 | 49.9% |
| Renter-Occupied Housing Units | 9,846 | 50.1% |
| Total Occupied Housing Units | 19,658 | 100.0% |
Occupancy by Household Size in Wilson
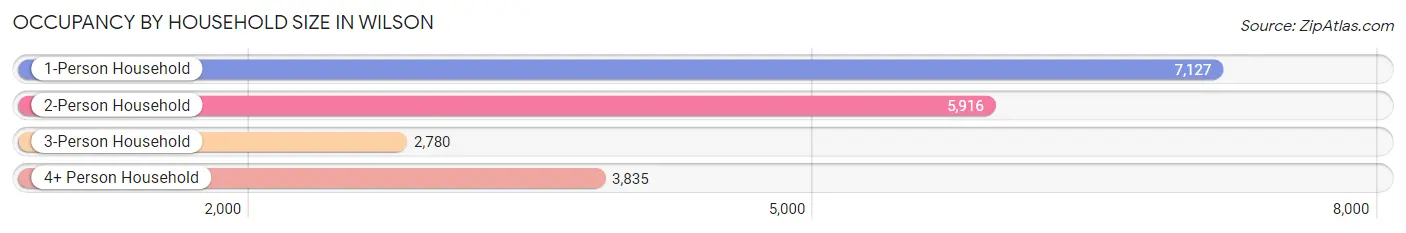
| Household Size | # Housing Units | % Housing Units |
| 1-Person Household | 7,127 | 36.2% |
| 2-Person Household | 5,916 | 30.1% |
| 3-Person Household | 2,780 | 14.1% |
| 4+ Person Household | 3,835 | 19.5% |
| Total Housing Units | 19,658 | 100.0% |
Occupancy by Ownership by Household Size in Wilson
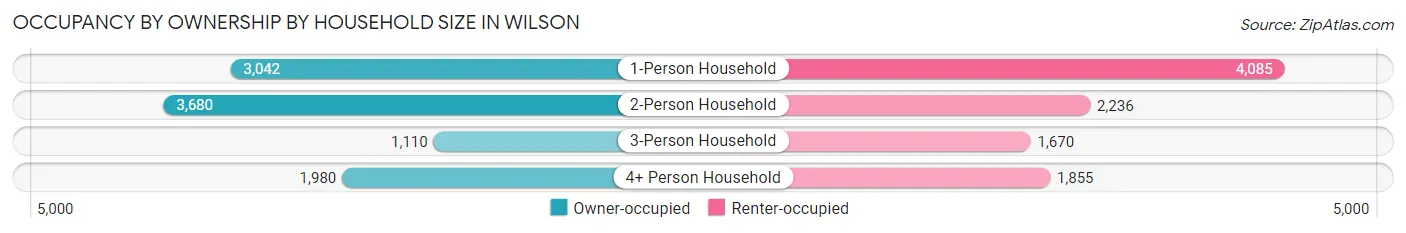
| Household Size | Owner-occupied | Renter-occupied |
| 1-Person Household | 3,042 (42.7%) | 4,085 (57.3%) |
| 2-Person Household | 3,680 (62.2%) | 2,236 (37.8%) |
| 3-Person Household | 1,110 (39.9%) | 1,670 (60.1%) |
| 4+ Person Household | 1,980 (51.6%) | 1,855 (48.4%) |
| Total Housing Units | 9,812 (49.9%) | 9,846 (50.1%) |
Occupancy by Educational Attainment in Wilson
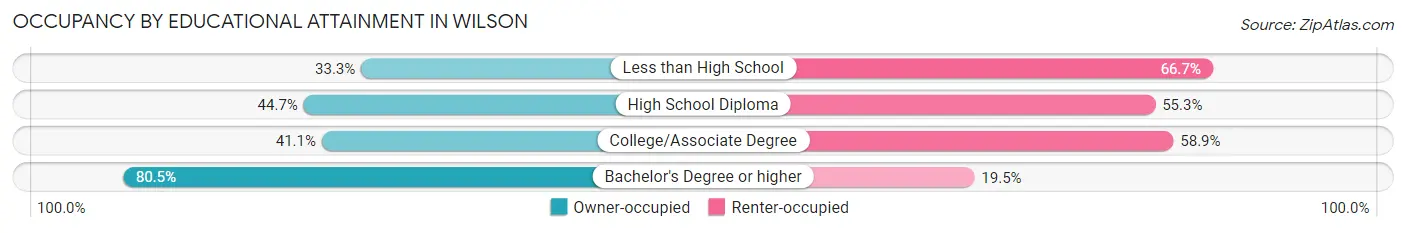
| Household Size | Owner-occupied | Renter-occupied |
| Less than High School | 1,087 (33.3%) | 2,179 (66.7%) |
| High School Diploma | 2,500 (44.7%) | 3,097 (55.3%) |
| College/Associate Degree | 2,570 (41.1%) | 3,686 (58.9%) |
| Bachelor's Degree or higher | 3,655 (80.5%) | 884 (19.5%) |
Occupancy by Age of Householder in Wilson
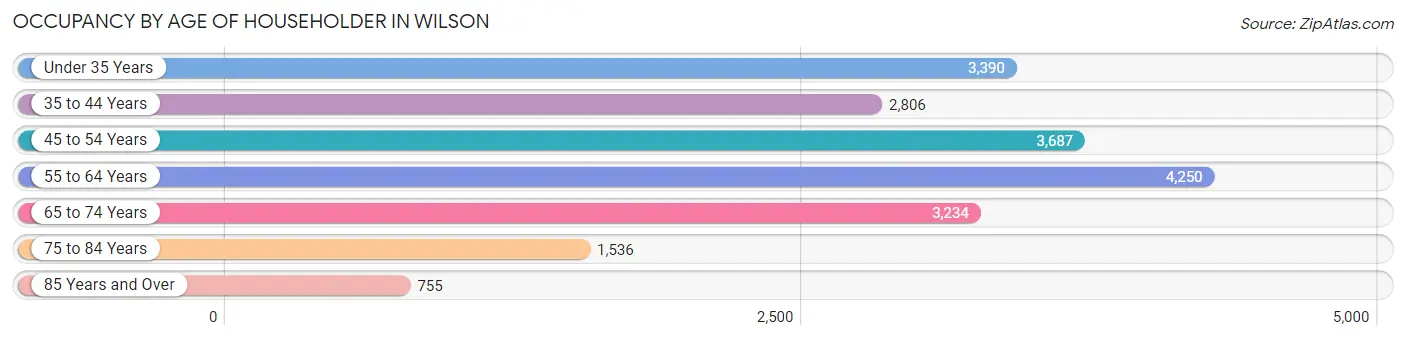
| Age Bracket | # Households | % Households |
| Under 35 Years | 3,390 | 17.2% |
| 35 to 44 Years | 2,806 | 14.3% |
| 45 to 54 Years | 3,687 | 18.8% |
| 55 to 64 Years | 4,250 | 21.6% |
| 65 to 74 Years | 3,234 | 16.5% |
| 75 to 84 Years | 1,536 | 7.8% |
| 85 Years and Over | 755 | 3.8% |
| Total | 19,658 | 100.0% |
Housing Finances in Wilson
Median Income by Occupancy in Wilson
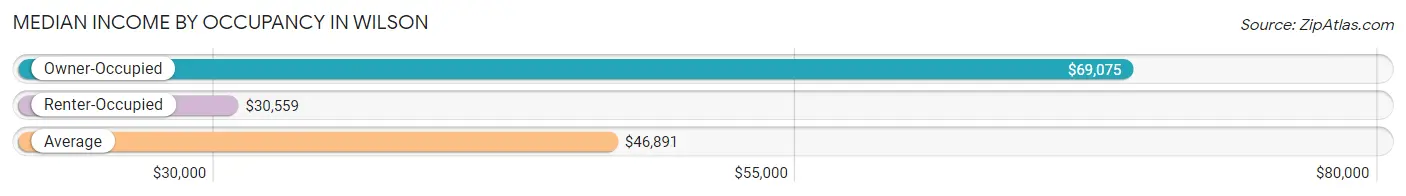
| Occupancy Type | # Households | Median Income |
| Owner-Occupied | 9,812 (49.9%) | $69,075 |
| Renter-Occupied | 9,846 (50.1%) | $30,559 |
| Average | 19,658 (100.0%) | $46,891 |
Occupancy by Householder Income Bracket in Wilson
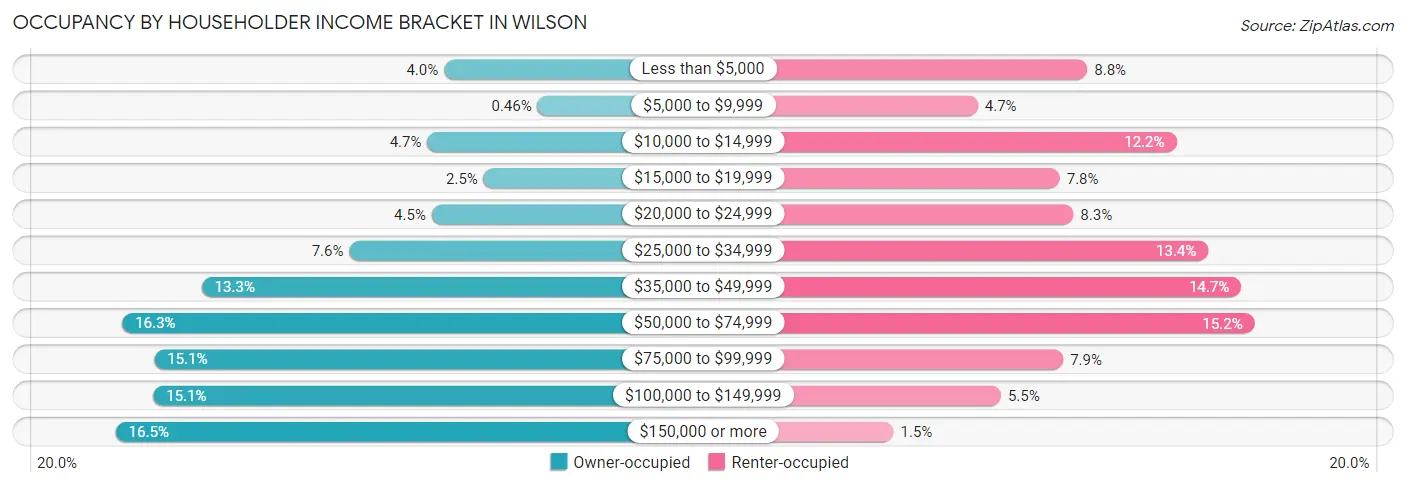
| Income Bracket | Owner-occupied | Renter-occupied |
| Less than $5,000 | 394 (4.0%) | 869 (8.8%) |
| $5,000 to $9,999 | 45 (0.5%) | 459 (4.7%) |
| $10,000 to $14,999 | 457 (4.7%) | 1,203 (12.2%) |
| $15,000 to $19,999 | 246 (2.5%) | 766 (7.8%) |
| $20,000 to $24,999 | 441 (4.5%) | 817 (8.3%) |
| $25,000 to $34,999 | 749 (7.6%) | 1,322 (13.4%) |
| $35,000 to $49,999 | 1,301 (13.3%) | 1,446 (14.7%) |
| $50,000 to $74,999 | 1,597 (16.3%) | 1,497 (15.2%) |
| $75,000 to $99,999 | 1,478 (15.1%) | 779 (7.9%) |
| $100,000 to $149,999 | 1,482 (15.1%) | 545 (5.5%) |
| $150,000 or more | 1,622 (16.5%) | 143 (1.5%) |
| Total | 9,812 (100.0%) | 9,846 (100.0%) |
Monthly Housing Cost Tiers in Wilson
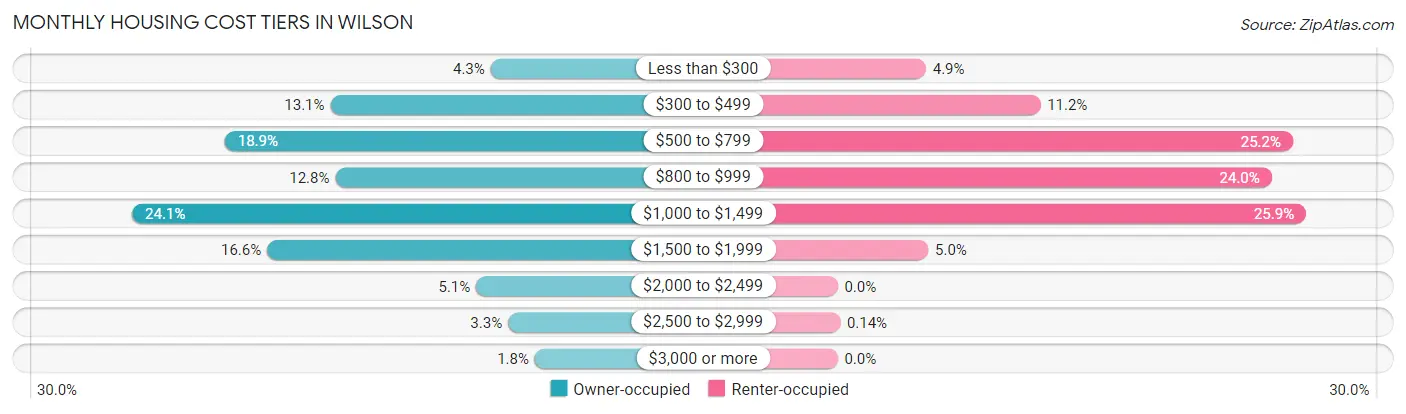
| Monthly Cost | Owner-occupied | Renter-occupied |
| Less than $300 | 418 (4.3%) | 480 (4.9%) |
| $300 to $499 | 1,286 (13.1%) | 1,103 (11.2%) |
| $500 to $799 | 1,858 (18.9%) | 2,476 (25.2%) |
| $800 to $999 | 1,260 (12.8%) | 2,361 (24.0%) |
| $1,000 to $1,499 | 2,361 (24.1%) | 2,548 (25.9%) |
| $1,500 to $1,999 | 1,630 (16.6%) | 493 (5.0%) |
| $2,000 to $2,499 | 496 (5.1%) | 0 (0.0%) |
| $2,500 to $2,999 | 324 (3.3%) | 14 (0.1%) |
| $3,000 or more | 179 (1.8%) | 0 (0.0%) |
| Total | 9,812 (100.0%) | 9,846 (100.0%) |
Physical Housing Characteristics in Wilson
Housing Structures in Wilson
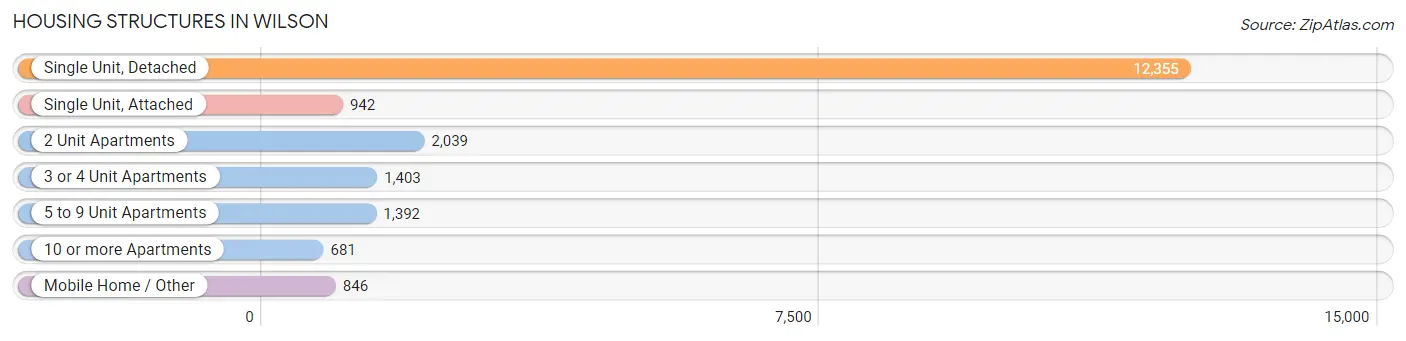
| Structure Type | # Housing Units | % Housing Units |
| Single Unit, Detached | 12,355 | 62.8% |
| Single Unit, Attached | 942 | 4.8% |
| 2 Unit Apartments | 2,039 | 10.4% |
| 3 or 4 Unit Apartments | 1,403 | 7.1% |
| 5 to 9 Unit Apartments | 1,392 | 7.1% |
| 10 or more Apartments | 681 | 3.5% |
| Mobile Home / Other | 846 | 4.3% |
| Total | 19,658 | 100.0% |
Housing Structures by Occupancy in Wilson
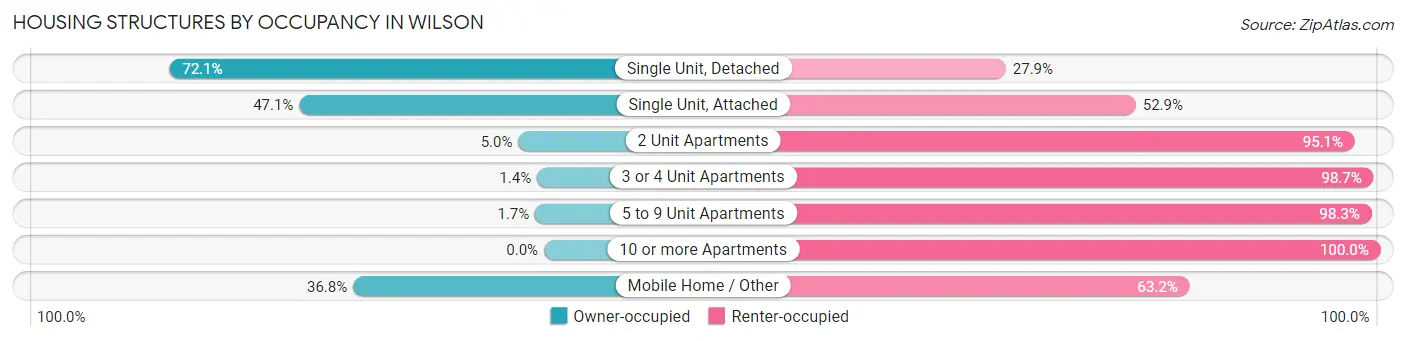
| Structure Type | Owner-occupied | Renter-occupied |
| Single Unit, Detached | 8,913 (72.1%) | 3,442 (27.9%) |
| Single Unit, Attached | 444 (47.1%) | 498 (52.9%) |
| 2 Unit Apartments | 101 (5.0%) | 1,938 (95.1%) |
| 3 or 4 Unit Apartments | 19 (1.3%) | 1,384 (98.7%) |
| 5 to 9 Unit Apartments | 24 (1.7%) | 1,368 (98.3%) |
| 10 or more Apartments | 0 (0.0%) | 681 (100.0%) |
| Mobile Home / Other | 311 (36.8%) | 535 (63.2%) |
| Total | 9,812 (49.9%) | 9,846 (50.1%) |
Housing Structures by Number of Rooms in Wilson
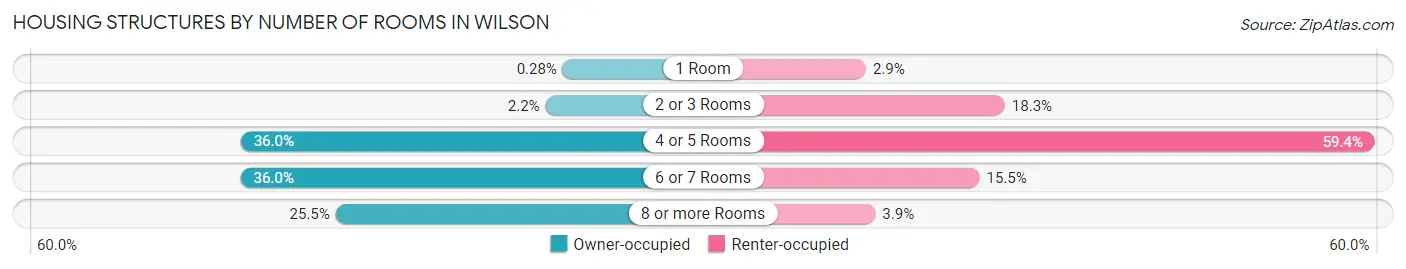
| Number of Rooms | Owner-occupied | Renter-occupied |
| 1 Room | 27 (0.3%) | 285 (2.9%) |
| 2 or 3 Rooms | 216 (2.2%) | 1,803 (18.3%) |
| 4 or 5 Rooms | 3,533 (36.0%) | 5,844 (59.4%) |
| 6 or 7 Rooms | 3,535 (36.0%) | 1,526 (15.5%) |
| 8 or more Rooms | 2,501 (25.5%) | 388 (3.9%) |
| Total | 9,812 (100.0%) | 9,846 (100.0%) |
Housing Structure by Heating Type in Wilson
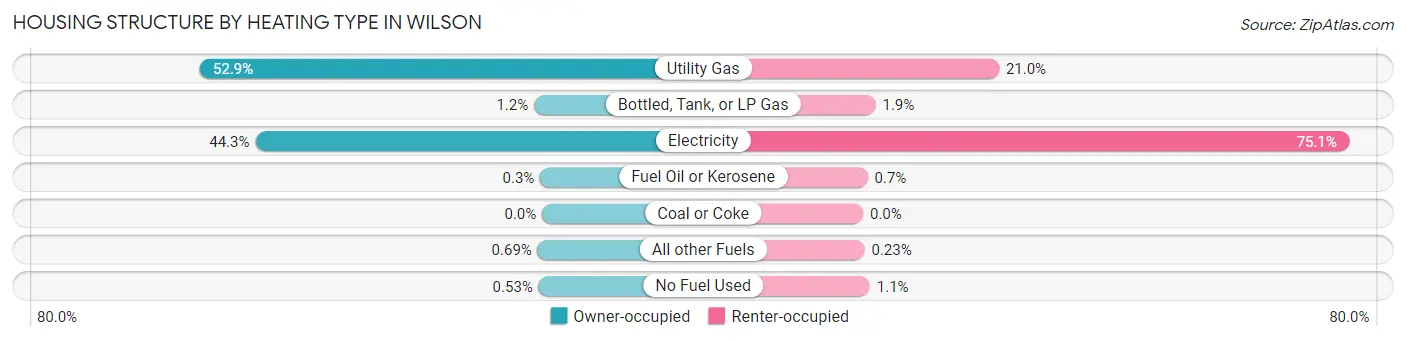
| Heating Type | Owner-occupied | Renter-occupied |
| Utility Gas | 5,191 (52.9%) | 2,069 (21.0%) |
| Bottled, Tank, or LP Gas | 122 (1.2%) | 190 (1.9%) |
| Electricity | 4,350 (44.3%) | 7,392 (75.1%) |
| Fuel Oil or Kerosene | 29 (0.3%) | 69 (0.7%) |
| Coal or Coke | 0 (0.0%) | 0 (0.0%) |
| All other Fuels | 68 (0.7%) | 23 (0.2%) |
| No Fuel Used | 52 (0.5%) | 103 (1.1%) |
| Total | 9,812 (100.0%) | 9,846 (100.0%) |
Household Vehicle Usage in Wilson
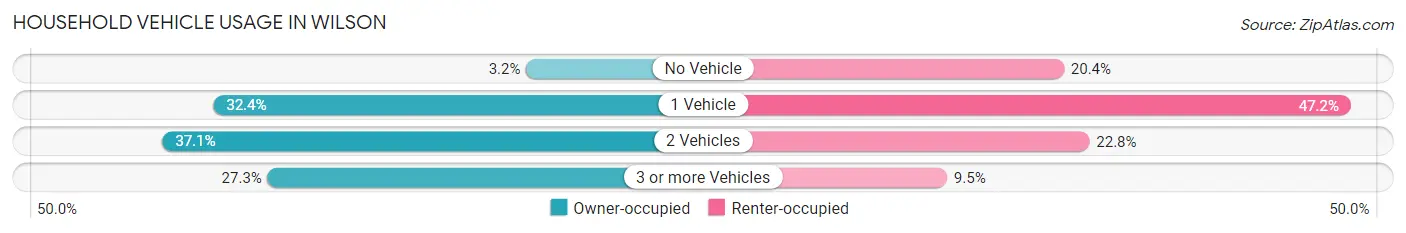
| Vehicles per Household | Owner-occupied | Renter-occupied |
| No Vehicle | 311 (3.2%) | 2,013 (20.4%) |
| 1 Vehicle | 3,177 (32.4%) | 4,649 (47.2%) |
| 2 Vehicles | 3,644 (37.1%) | 2,247 (22.8%) |
| 3 or more Vehicles | 2,680 (27.3%) | 937 (9.5%) |
| Total | 9,812 (100.0%) | 9,846 (100.0%) |
Real Estate & Mortgages in Wilson
Real Estate and Mortgage Overview in Wilson
| Characteristic | Without Mortgage | With Mortgage |
| Housing Units | 3,516 | 6,296 |
| Median Property Value | $150,700 | $181,500 |
| Median Household Income | $44,702 | $1,315 |
| Monthly Housing Costs | $516 | $179 |
| Real Estate Taxes | $1,548 | $349 |
Property Value by Mortgage Status in Wilson
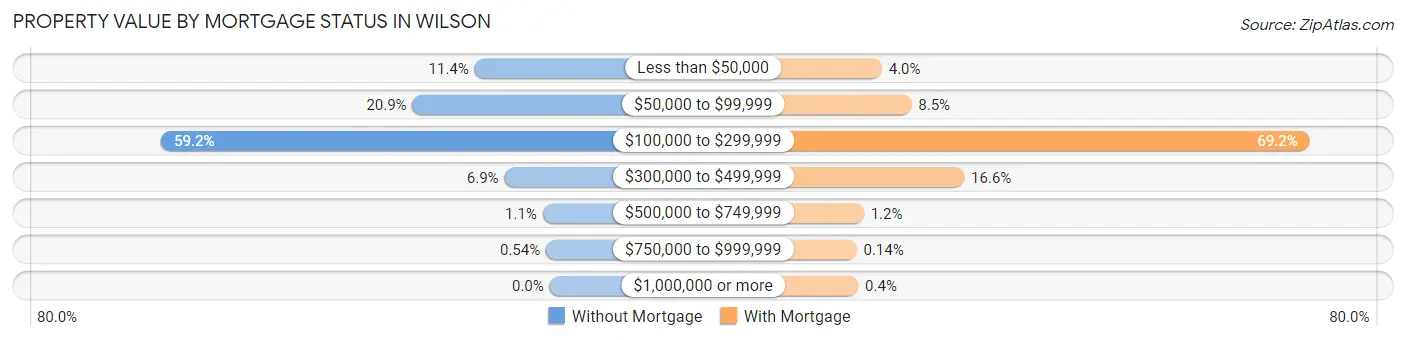
| Property Value | Without Mortgage | With Mortgage |
| Less than $50,000 | 402 (11.4%) | 252 (4.0%) |
| $50,000 to $99,999 | 735 (20.9%) | 535 (8.5%) |
| $100,000 to $299,999 | 2,081 (59.2%) | 4,355 (69.2%) |
| $300,000 to $499,999 | 242 (6.9%) | 1,042 (16.6%) |
| $500,000 to $749,999 | 37 (1.1%) | 78 (1.2%) |
| $750,000 to $999,999 | 19 (0.5%) | 9 (0.1%) |
| $1,000,000 or more | 0 (0.0%) | 25 (0.4%) |
| Total | 3,516 (100.0%) | 6,296 (100.0%) |
Household Income by Mortgage Status in Wilson
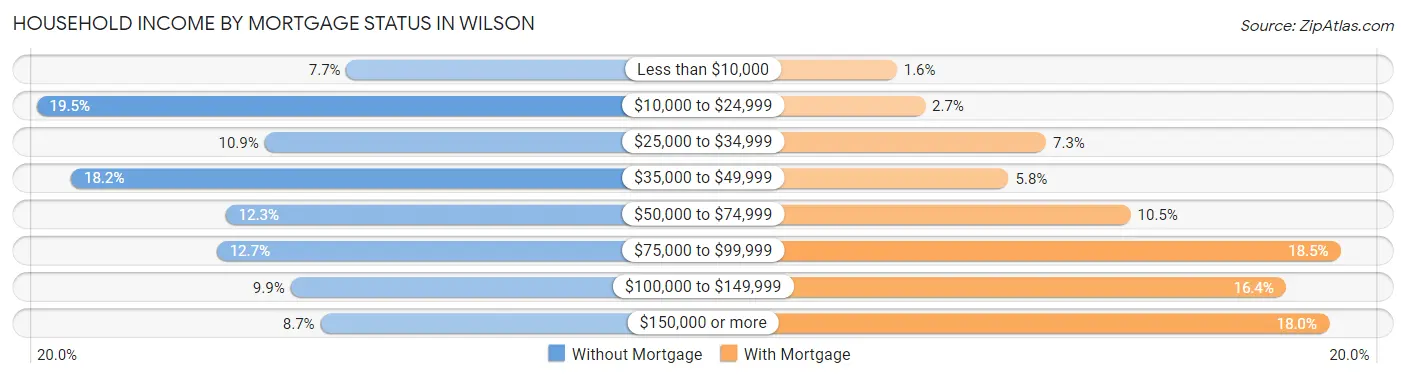
| Household Income | Without Mortgage | With Mortgage |
| Less than $10,000 | 272 (7.7%) | 99 (1.6%) |
| $10,000 to $24,999 | 687 (19.5%) | 167 (2.6%) |
| $25,000 to $34,999 | 382 (10.9%) | 457 (7.3%) |
| $35,000 to $49,999 | 641 (18.2%) | 367 (5.8%) |
| $50,000 to $74,999 | 434 (12.3%) | 660 (10.5%) |
| $75,000 to $99,999 | 446 (12.7%) | 1,163 (18.5%) |
| $100,000 to $149,999 | 347 (9.9%) | 1,032 (16.4%) |
| $150,000 or more | 307 (8.7%) | 1,135 (18.0%) |
| Total | 3,516 (100.0%) | 6,296 (100.0%) |
Property Value to Household Income Ratio in Wilson
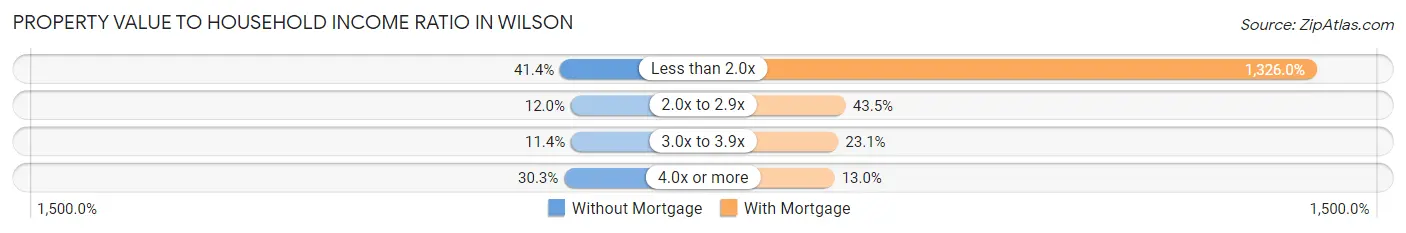
| Value-to-Income Ratio | Without Mortgage | With Mortgage |
| Less than 2.0x | 1,457 (41.4%) | 83,487 (1,326.0%) |
| 2.0x to 2.9x | 423 (12.0%) | 2,740 (43.5%) |
| 3.0x to 3.9x | 399 (11.4%) | 1,451 (23.1%) |
| 4.0x or more | 1,065 (30.3%) | 819 (13.0%) |
| Total | 3,516 (100.0%) | 6,296 (100.0%) |
Real Estate Taxes by Mortgage Status in Wilson
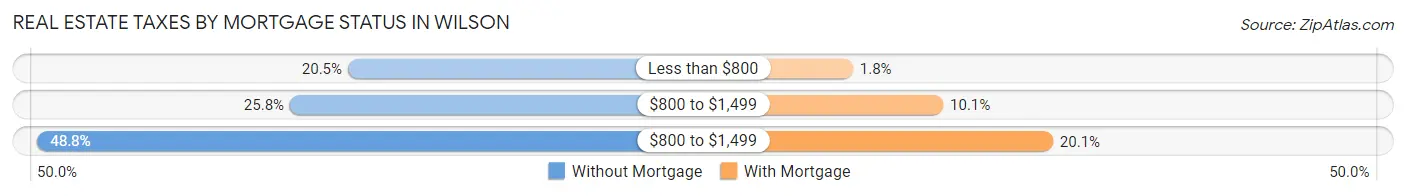
| Property Taxes | Without Mortgage | With Mortgage |
| Less than $800 | 720 (20.5%) | 114 (1.8%) |
| $800 to $1,499 | 906 (25.8%) | 633 (10.1%) |
| $800 to $1,499 | 1,717 (48.8%) | 1,264 (20.1%) |
| Total | 3,516 (100.0%) | 6,296 (100.0%) |
Health & Disability in Wilson
Health Insurance Coverage by Age in Wilson
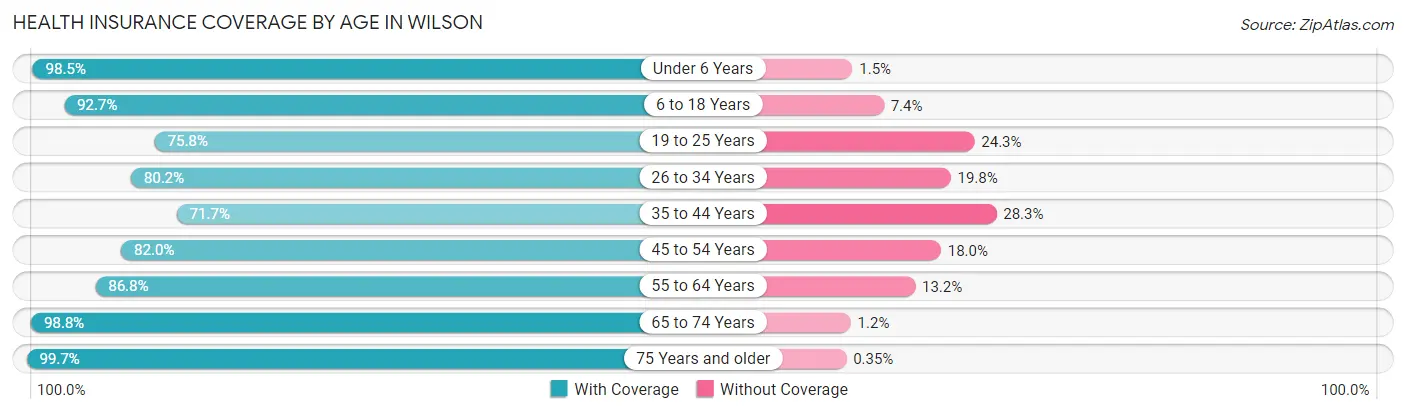
| Age Bracket | With Coverage | Without Coverage |
| Under 6 Years | 3,208 (98.5%) | 49 (1.5%) |
| 6 to 18 Years | 7,737 (92.6%) | 614 (7.3%) |
| 19 to 25 Years | 3,361 (75.7%) | 1,076 (24.2%) |
| 26 to 34 Years | 4,247 (80.2%) | 1,050 (19.8%) |
| 35 to 44 Years | 3,734 (71.7%) | 1,477 (28.3%) |
| 45 to 54 Years | 4,894 (82.0%) | 1,074 (18.0%) |
| 55 to 64 Years | 5,389 (86.8%) | 819 (13.2%) |
| 65 to 74 Years | 5,086 (98.8%) | 61 (1.2%) |
| 75 Years and older | 2,884 (99.7%) | 10 (0.4%) |
| Total | 40,540 (86.7%) | 6,230 (13.3%) |
Health Insurance Coverage by Citizenship Status in Wilson
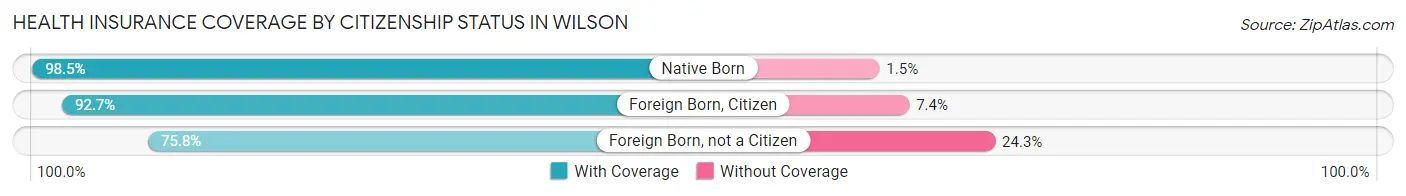
| Citizenship Status | With Coverage | Without Coverage |
| Native Born | 3,208 (98.5%) | 49 (1.5%) |
| Foreign Born, Citizen | 7,737 (92.6%) | 614 (7.3%) |
| Foreign Born, not a Citizen | 3,361 (75.7%) | 1,076 (24.2%) |
Health Insurance Coverage by Household Income in Wilson
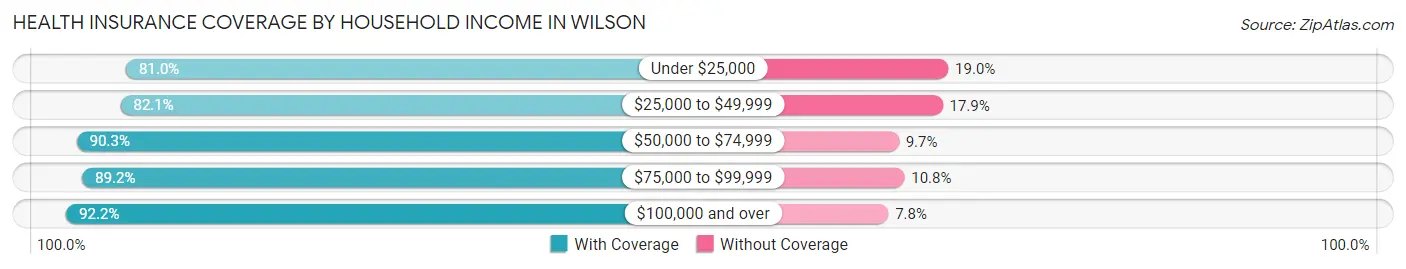
| Household Income | With Coverage | Without Coverage |
| Under $25,000 | 8,454 (81.0%) | 1,982 (19.0%) |
| $25,000 to $49,999 | 8,938 (82.1%) | 1,954 (17.9%) |
| $50,000 to $74,999 | 6,278 (90.3%) | 677 (9.7%) |
| $75,000 to $99,999 | 5,601 (89.2%) | 677 (10.8%) |
| $100,000 and over | 10,835 (92.2%) | 912 (7.8%) |
Public vs Private Health Insurance Coverage by Age in Wilson
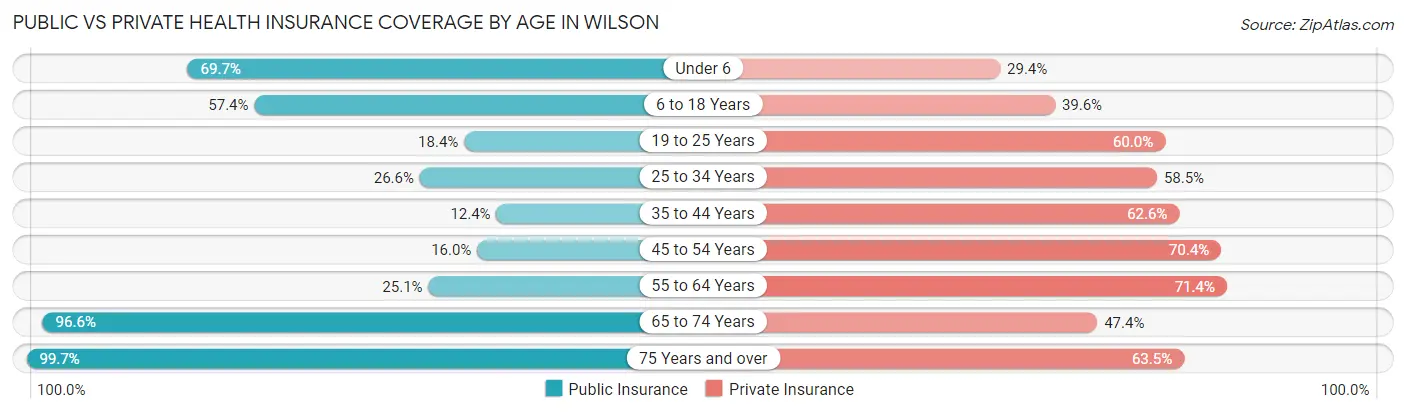
| Age Bracket | Public Insurance | Private Insurance |
| Under 6 | 2,271 (69.7%) | 957 (29.4%) |
| 6 to 18 Years | 4,789 (57.4%) | 3,304 (39.6%) |
| 19 to 25 Years | 817 (18.4%) | 2,662 (60.0%) |
| 25 to 34 Years | 1,411 (26.6%) | 3,099 (58.5%) |
| 35 to 44 Years | 647 (12.4%) | 3,263 (62.6%) |
| 45 to 54 Years | 954 (16.0%) | 4,202 (70.4%) |
| 55 to 64 Years | 1,555 (25.1%) | 4,435 (71.4%) |
| 65 to 74 Years | 4,974 (96.6%) | 2,440 (47.4%) |
| 75 Years and over | 2,884 (99.7%) | 1,838 (63.5%) |
| Total | 20,302 (43.4%) | 26,200 (56.0%) |
Disability Status by Sex by Age in Wilson
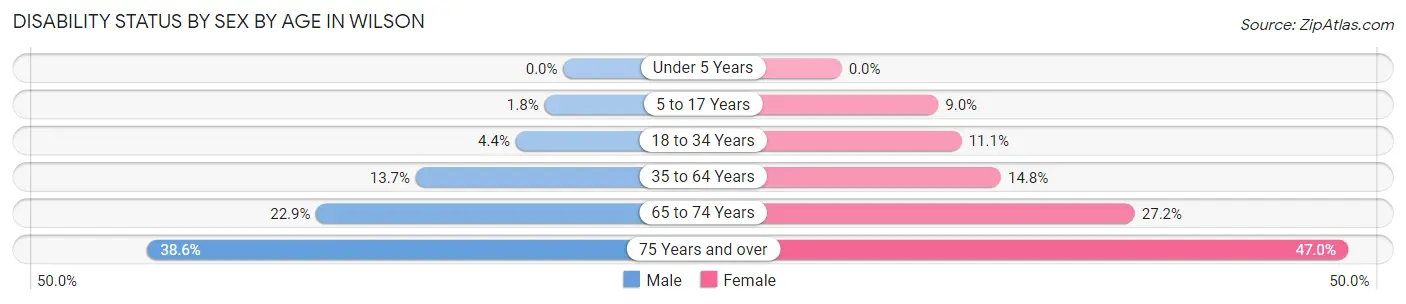
| Age Bracket | Male | Female |
| Under 5 Years | 0 (0.0%) | 0 (0.0%) |
| 5 to 17 Years | 71 (1.8%) | 380 (9.0%) |
| 18 to 34 Years | 207 (4.4%) | 642 (11.1%) |
| 35 to 64 Years | 1,099 (13.7%) | 1,383 (14.8%) |
| 65 to 74 Years | 538 (22.9%) | 762 (27.2%) |
| 75 Years and over | 425 (38.6%) | 842 (47.0%) |
Disability Class by Sex by Age in Wilson
Disability Class: Hearing Difficulty
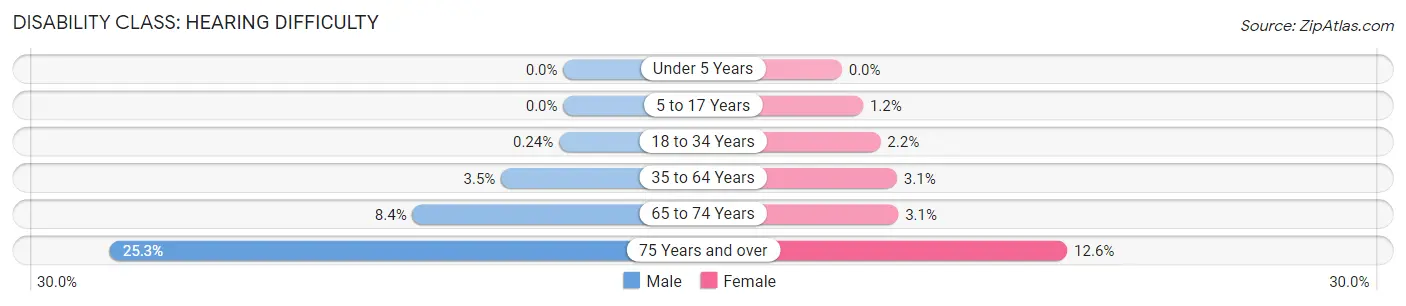
| Age Bracket | Male | Female |
| Under 5 Years | 0 (0.0%) | 0 (0.0%) |
| 5 to 17 Years | 0 (0.0%) | 50 (1.2%) |
| 18 to 34 Years | 11 (0.2%) | 124 (2.1%) |
| 35 to 64 Years | 278 (3.5%) | 287 (3.1%) |
| 65 to 74 Years | 197 (8.4%) | 88 (3.1%) |
| 75 Years and over | 278 (25.3%) | 225 (12.6%) |
Disability Class: Vision Difficulty
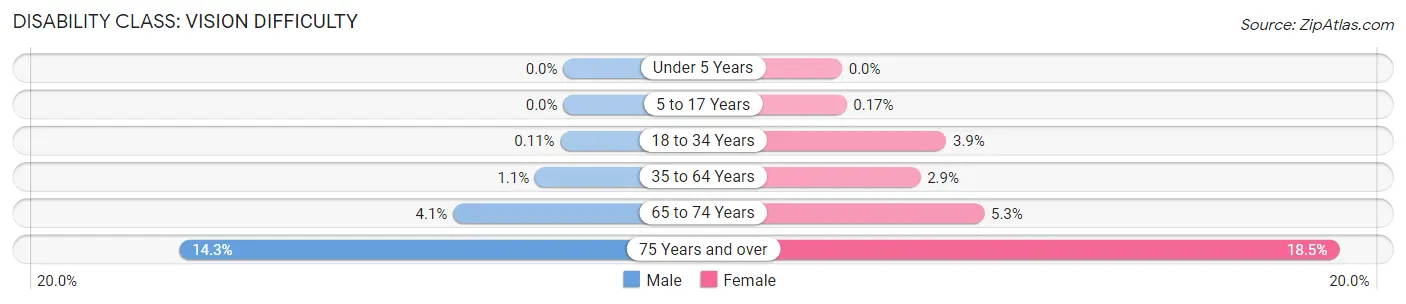
| Age Bracket | Male | Female |
| Under 5 Years | 0 (0.0%) | 0 (0.0%) |
| 5 to 17 Years | 0 (0.0%) | 7 (0.2%) |
| 18 to 34 Years | 5 (0.1%) | 223 (3.9%) |
| 35 to 64 Years | 84 (1.1%) | 272 (2.9%) |
| 65 to 74 Years | 96 (4.1%) | 148 (5.3%) |
| 75 Years and over | 157 (14.3%) | 331 (18.5%) |
Disability Class: Cognitive Difficulty
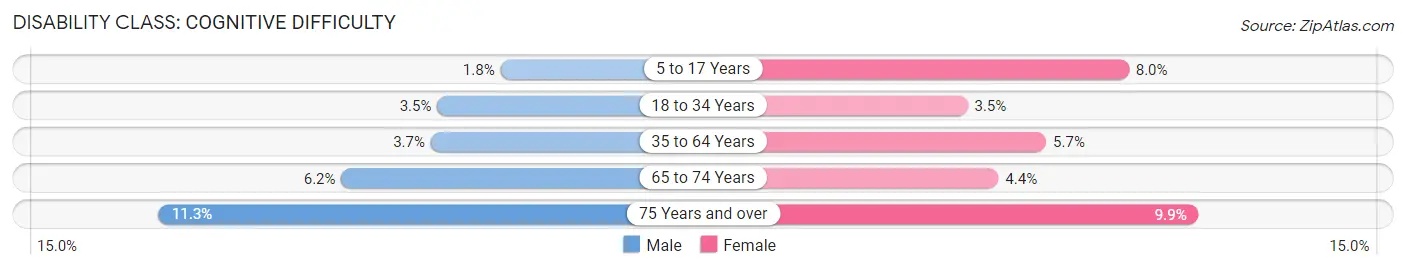
| Age Bracket | Male | Female |
| 5 to 17 Years | 71 (1.8%) | 339 (8.0%) |
| 18 to 34 Years | 164 (3.5%) | 202 (3.5%) |
| 35 to 64 Years | 296 (3.7%) | 533 (5.7%) |
| 65 to 74 Years | 145 (6.2%) | 122 (4.4%) |
| 75 Years and over | 124 (11.3%) | 178 (9.9%) |
Disability Class: Ambulatory Difficulty
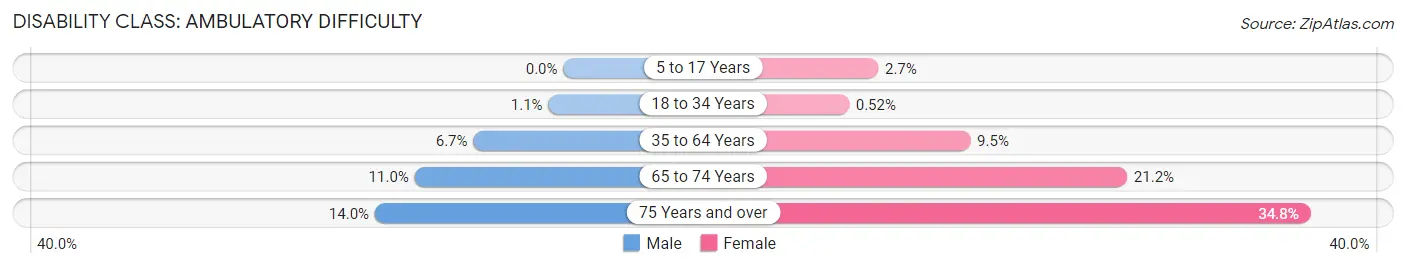
| Age Bracket | Male | Female |
| 5 to 17 Years | 0 (0.0%) | 114 (2.7%) |
| 18 to 34 Years | 52 (1.1%) | 30 (0.5%) |
| 35 to 64 Years | 536 (6.7%) | 892 (9.5%) |
| 65 to 74 Years | 259 (11.0%) | 593 (21.2%) |
| 75 Years and over | 154 (14.0%) | 624 (34.8%) |
Disability Class: Self-Care Difficulty
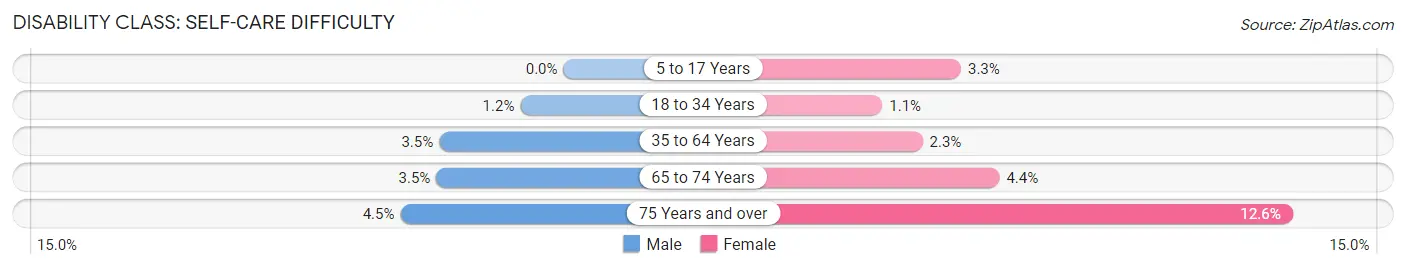
| Age Bracket | Male | Female |
| 5 to 17 Years | 0 (0.0%) | 141 (3.3%) |
| 18 to 34 Years | 56 (1.2%) | 65 (1.1%) |
| 35 to 64 Years | 278 (3.5%) | 211 (2.2%) |
| 65 to 74 Years | 83 (3.5%) | 123 (4.4%) |
| 75 Years and over | 50 (4.5%) | 225 (12.6%) |
Technology Access in Wilson
Computing Device Access in Wilson
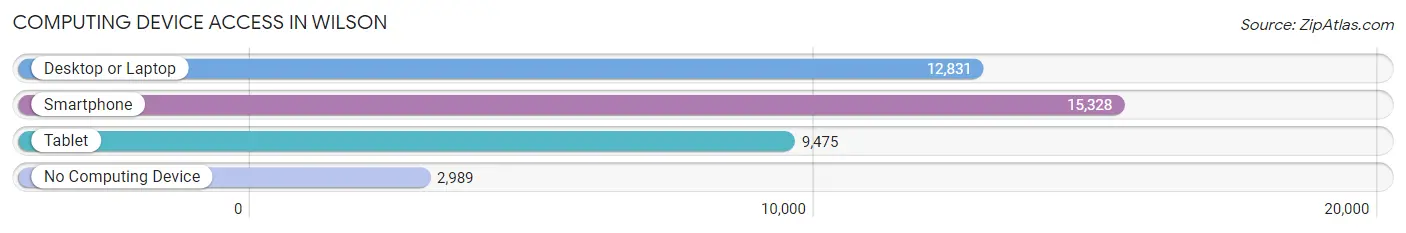
| Device Type | # Households | % Households |
| Desktop or Laptop | 12,831 | 65.3% |
| Smartphone | 15,328 | 78.0% |
| Tablet | 9,475 | 48.2% |
| No Computing Device | 2,989 | 15.2% |
| Total | 19,658 | 100.0% |
Internet Access in Wilson
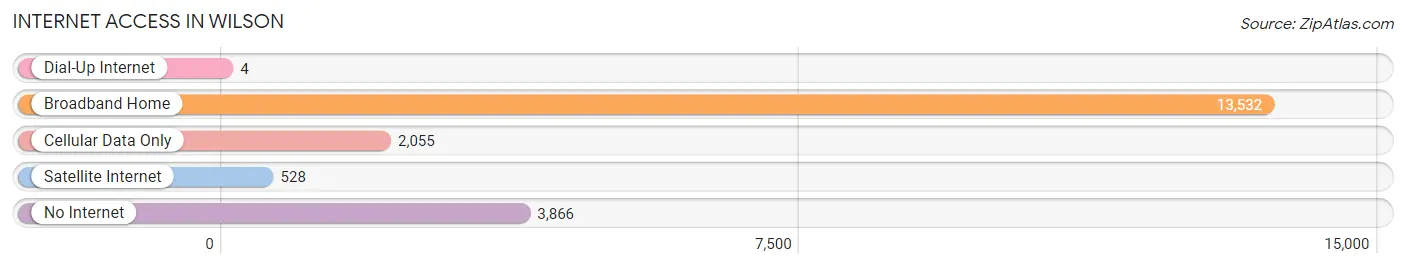
| Internet Type | # Households | % Households |
| Dial-Up Internet | 4 | 0.0% |
| Broadband Home | 13,532 | 68.8% |
| Cellular Data Only | 2,055 | 10.4% |
| Satellite Internet | 528 | 2.7% |
| No Internet | 3,866 | 19.7% |
| Total | 19,658 | 100.0% |
Wilson Summary
Wilson, North Carolina is a city located in the eastern part of the state, in Wilson County. It is the county seat and the largest city in the county. The city is located approximately 45 miles east of Raleigh, the state capital.
History
Wilson was founded in 1849 and named after Colonel Louis D. Wilson, a prominent local figure. The city was incorporated in 1851 and quickly became a major center for the tobacco industry. The city was also home to several large cotton mills, which provided employment for many of the city’s residents.
In the early 20th century, Wilson was a major center for the textile industry. The city was home to several large mills, including the Wilson Cotton Mill, which was the largest cotton mill in the world at the time. The city also had a thriving furniture industry, with several large factories producing furniture for the entire region.
In the late 20th century, Wilson began to experience a decline in its manufacturing base. Many of the city’s factories closed, and the city’s population began to decline. In recent years, the city has experienced a resurgence, with new businesses and industries moving into the area.
Geography
Wilson is located in the eastern part of North Carolina, in Wilson County. The city is situated on the banks of the Tar River, which flows through the city. The city is located approximately 45 miles east of Raleigh, the state capital.
The city has a total area of 24.3 square miles, of which 24.2 square miles is land and 0.1 square miles is water. The city is located in the Coastal Plain region of the state, and the terrain is mostly flat.
Economy
Wilson’s economy is largely based on manufacturing and agriculture. The city is home to several large manufacturing plants, including a Tyson Foods plant and a Pepsi bottling plant. The city is also home to several large agricultural operations, including hog farms and tobacco farms.
The city is also home to several large retail stores, including Walmart, Target, and Lowe’s. The city is also home to several large medical facilities, including Wilson Medical Center and Wilson Memorial Hospital.
Demographics
As of the 2010 census, the population of Wilson was 49,167. The racial makeup of the city was 57.3% White, 37.2% African American, 0.4% Native American, 1.2% Asian, 0.1% Pacific Islander, 1.7% from other races, and 2.1% from two or more races. Hispanic or Latino of any race were 4.2% of the population.
The median income for a household in the city was $35,945, and the median income for a family was $43,945. The per capita income for the city was $19,945. About 17.2% of families and 20.7% of the population were below the poverty line, including 28.2% of those under age 18 and 16.2% of those age 65 or over.
Common Questions
What is the Total Population of Wilson?
Total Population of Wilson is 47,767.
What is the Total Male Population of Wilson?
Total Male Population of Wilson is 22,154.
What is the Total Female Population of Wilson?
Total Female Population of Wilson is 25,613.
What is the Ratio of Males per 100 Females in Wilson?
There are 86.50 Males per 100 Females in Wilson.
What is the Ratio of Females per 100 Males in Wilson?
There are 115.61 Females per 100 Males in Wilson.
What is the Median Population Age in Wilson?
Median Population Age in Wilson is 38.8 Years.
What is the Average Family Size in Wilson
Average Family Size in Wilson is 3.1 People.
What is the Average Household Size in Wilson
Average Household Size in Wilson is 2.4 People.
What is Per Capita Income in Wilson?
Per Capita income in Wilson is $28,185.
What is the Median Family Income in Wilson?
Median Family Income in Wilson is $66,118.
What is the Median Household income in Wilson?
Median Household Income in Wilson is $46,891.
What is Income or Wage Gap in Wilson?
Income or Wage Gap in Wilson is 33.2%.
Women in Wilson earn 66.8 cents for every dollar earned by a man.
What is Family Income Deficit in Wilson?
Family Income Deficit in Wilson is $12,714.
Families that are below poverty line in Wilson earn $12,714 less on average than the poverty threshold level.
What is Inequality or Gini Index in Wilson?
Inequality or Gini Index in Wilson is 0.50.
How Large is the Labor Force in Wilson?
There are 22,754 People in the Labor Forcein in Wilson.
What is the Percentage of People in the Labor Force in Wilson?
60.1% of People are in the Labor Force in Wilson.
What is the Unemployment Rate in Wilson?
Unemployment Rate in Wilson is 8.4%.